Article

Spark Ignition (SI) Engine Energy and Ecological Performance Using Natural Gas and Late Intake Valve Close (LIVC)

by
Tadas Vipartas
1,2,*,
Alfredas Rimkus
1,2,
Saulius Stravinskas
2,
Aurelijus Pitrėnas
2 and
Audrius Matulis
2
1
Department of Automobile Engineering, Faculty of Transport Engineering, Vilnius Gediminas Technical University, Plytinės Str. 25, 10105 Vilnius, Lithuania
2
Department of Transport Engineering, Technical Faculty, Vilniaus Kolegija/Higher Education Institution, Olandų Str. 16, 01100 Vilnius, Lithuania
*
Author to whom correspondence should be addressed.
Appl. Sci. 2025, 15(11), 6185; https://doi.org/10.3390/app15116185
Submission received: 16 April 2025 / Revised: 27 May 2025 / Accepted: 28 May 2025 / Published: 30 May 2025
(This article belongs to the Special Issue Modern Internal Combustion Engines: Design, Testing, and Application)

Abstract

Natural gas stands out as a promising alternative fuel, and utilizing late intake valve close (LIVC) can further enhance its potential by improving internal combustion engine performance. The present study investigated the effect of LIVC on the performance of a Nissan Qashqai J10 four-cylinder internal combustion ignition engine (ICE) operating on gasoline (G) and natural gas (NG), with a focus on both energy and ecological aspects at stoichiometric points. Experimental tests were performed under the usual engine operating conditions, with engine speeds of 2000 and 3000 rpm and brake mean effective pressures (BMEPs) of 0.31, 0.55, and 0.79 MPa, while the intake valve closing moment was delayed at 24°, 31°, 38°, 45°, 52°, and 59° after bottom dead center (aBDC). The software AVL BOOST™ (version R2021.2) and its utility BURN were used to calculate the rate of heat release (ROHR), mass fraction burned (MFB), in-cylinder temperature, and the rate of temperature rise. The substitution of natural gas for gasoline substantially decreases CO2 and NOx emissions while enhancing the engine’s energy efficiency. Implementing a LIVC strategy can further boost brake thermal efficiency and reduce CO2, though it negatively impacts CO, HC, and NOx emissions. Optimal performance necessitates balancing efficiency improvements and CO2 reduction against the control of other pollutants, potentially through combining LIVC with alternative engine control methodologies.

1. Introduction

The transport sector contributed the second-highest amount to global carbon dioxide (CO2) emissions in 2023, representing slightly more than 21% [1]. About 15% of total carbon is CO2 from passenger cars and vans in the European Union (EU), which significantly contributes to climate change [2,3]. The transport sector is the only one that emits more greenhouse gases than in 1990, but with the application of additional measures, the amount of transport emissions could be 5% lower in 2030 [4]. Within the EU, vehicular traffic continues to be the primary contributor to emissions originating from the transport sector. In 2022, it represented 73.2% of all EU greenhouse gas emissions from domestic and international transport. The average CO2 emissions from new passenger cars and vans registered in the EU has also continued to decrease in 2023 by 1.4% for cars and 1.6% for vans compared to 2022 levels. In general terms, preliminary estimates point to a small reduction of 0.8% in total EU transport greenhouse gas emissions from 2022 to 2023 [5,6]. In order to meet the EU’s goals for reducing greenhouse gas emissions, intermediate emissions reduction targets have been set until 2030: 55% less pollution for cars and 50% for vans compared to 2021, and from 2035, all new passenger cars and vans in the EU would emit zero carbon dioxide [7]. Transportation is regarded as a highly promising field where the amount of harmful emissions can be significantly reduced [8,9], especially related to internal combustion engine emissions using alternative liquid and gaseous fuels: ethanol, methanol, butanol, methane, biomethane, biogas, or natural gas [10,11,12]. Also, the rapidly growing popularity of hybrid, fuel cell, and electric cars is making a significant contribution to reducing greenhouse gas emissions [13].
Modern internal combustion engines (ICEs) are equipped with variable valve timing (VVT) systems to improve their environmental and energy performance [14,15]. This enables the precise control of the intake and exhaust valves, adjusting to various engine operating conditions. In VVT systems, the intake valve closing (IVC) time is one of the main parameters that indicates the exact point, defined as degrees after bottom dead center (aBDC) at which the intake valve closes [16]. Moreover, IVC adjustment is predicted to reduce harmful emissions, enhance fuel efficiency, and increase power output [17]. Delaying IVC results in a substantial decrease in particle number (PN), approximately 95.4% and 98.2% for 5 nm and 23 nm particles, respectively [18]. Furthermore, conducted real-world driving emissions tests show that compressed natural gas (CNG) vehicles exhibited significantly lower particle number emissions compared to gasoline counterparts, even without the use of a particulate filter [19]. The LIVC strategy enhances both brake-specific fuel consumption (BSFC) and brake thermal efficiency (BTE) due to the increased expansion ratio, which facilitates the more efficient extraction of work from the piston [20]. There is a reduction in BSFC by 6.7% under minimum fuel usage conditions, coupled with a ~10–11% decrease under high loads when utilizing the Miller cycle with LIVC, compared to the original Otto cycle [21]. However, delaying IVC can also have adverse effects on engine performance, especially under low-load conditions. Applying delayed LIVC in an SI engine fueled by a combination of producer gas, biogas, and hydrogen resulted in slightly higher BSFC due to due to lower cylinder charge volume as well as a diminished amount of combustible air–fuel (A/F) charge. This suggests that delaying IVC might negatively impact BSFC in natural gas engines, at least under certain conditions [22]. LIVC can also improve combustion stability, especially in engines operating with NG at low load. This improvement was attributed to the increased turbulence and better mixing of the air–fuel mixture resulting from LIVC [23]. In gasoline engines, LIVC can help mitigate knock, which can limit engine performance and efficiency [24]. This effectively suppressed knock occurrence under high-load conditions due to the reduced effective compression ratio and lower peak in-cylinder temperature associated with LIVC [25].
As an alternative fuel, methane has environmental advantages because of its lower carbon content and higher hydrogen-to-carbon (H/C) ratio [26], leading to less harmful pollutants, including hydrocarbons and carbon monoxide [27]. CO emissions can be reduced by approximately 39.4%, even at wide-open throttle, and up to 93% for part-throttle conditions when raw biogas (a methane-rich fuel) is used in the spark ignition engine [28]. Regarding energy efficiency, natural gas also demonstrates promising potential. While methane might result in a minor reduction in indicated thermal efficiency (ITE), it offers advantages regarding lower BSFC and reduced heat losses [29].
The Atkinson cycle’s unique thermodynamic process confers several advantages to gasoline engines, making it an attractive option for improving fuel economy and reducing environmental impact. The higher expansion ratio in the Atkinson cycle allows for greater energy extraction from the combustion gases before they are expelled, resulting in improved thermal efficiency, better fuel economy, and reduced CO2 emissions [30,31,32,33]. The delayed IVC also reduces pumping losses, further contributing to improved fuel economy [34]. The Atkinson cycle’s lower peak combustion temperatures can lead to reduced nitrogen oxide (NOx) emissions, a major pollutant contributing to smog and acid rain [35], especially at higher engine loads [36]. The overall impact on emissions is generally positive, including with reductions in particulate matter [37]. In addition to the primary benefits, the Atkinson cycle combined with VVT can improve low-speed torque by altering the timing of intake valves to increase the compression ratio at lower speeds [38,39]. The dynamic adjustment of the valves helps in achieving optimal valve overlap, which is crucial for improving volumetric efficiency (VE) and reducing pumping losses [40]. VVT can also enable cylinder deactivation strategies at light loads [41] and increase the efficiency of dual-fuel engines, operating on liquid fuel and natural gas [42,43].
This paper evaluates the LIVC’s effect on energy and ecological performance for an ICE operating on natural gas, utilizing numerical analysis and experimental tests. Section 2 outlines the methodology applied in the numerical modeling and experimental phases. Section 3 presents the results, including a relative assessment using energy efficiency and environmental impact criteria. The study’s conclusions, together with recommendations for subsequent investigations, are outlined in Section 4.

2. Materials and Methods

The experimental tests and numerical modeling, which investigated the influence of the LIVC on engine performance, were performed using a naturally aspirated spark ignition (SI) engine Nissan HR16DE (Nissan Motor Co., Ltd., Yokohama, Japan) operating on both gasoline (G) and compressed natural gas (NG). For the numerical simulation, the software AVL BOOST™ and its utility BURN were used for combustion process analysis.

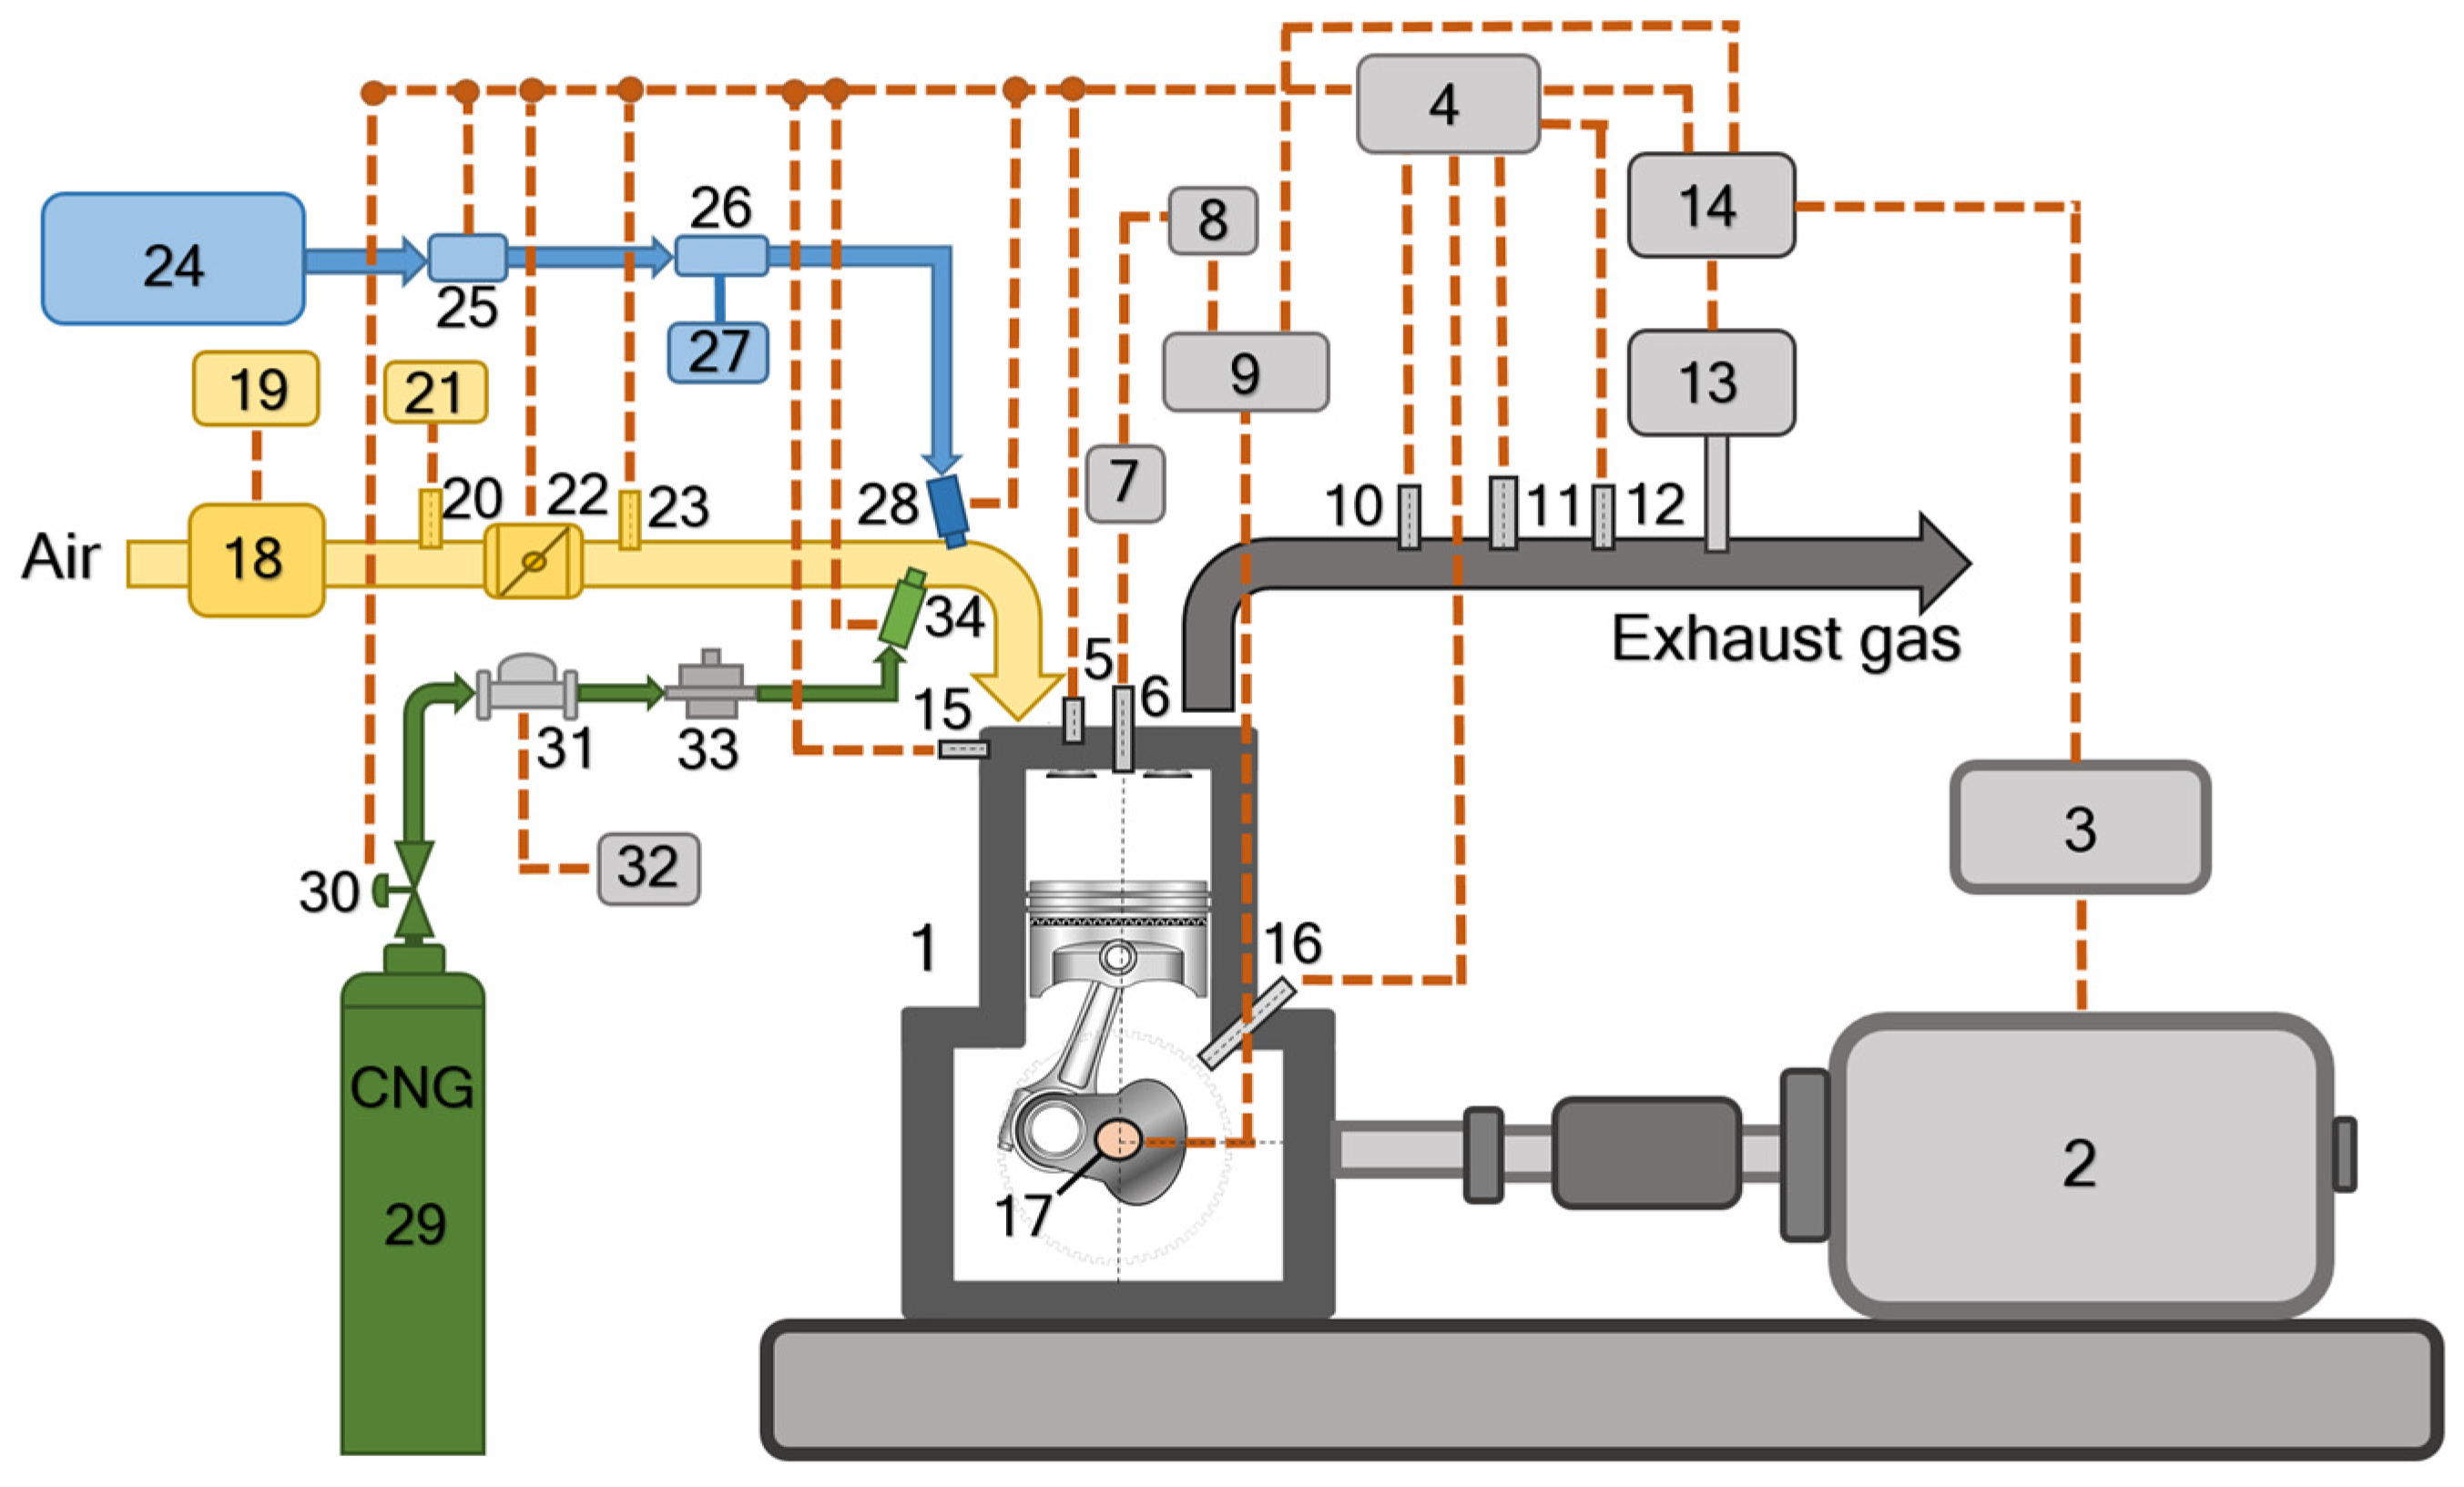
2.1. The Engine Test Bench, Equipment, and Specifications

The SI engine was connected directly through the shaft to the Eddy-current brake dynamometer AMX200/100 (Automex Group sp. z o.o., Gdańsk, Poland) and controlled by the MOTEC M800 (MoTeC, Melbourne, Australia) electronic control unit (ECU). For experimental tests, gas injectors were installed in the intake manifold and adapted for using CNG. The in-cylinder pressure was measured by a piezoelectric sensor AVL ZI31_Y7S (AVL, Graz, Austria) (sensitivity 11.62 pC/bar), which is integrated into the spark plug. Pressure signal amplifier with dynamic pressure measurement system AVL DiTEST DPM 800 (AVL DiTEST GmbH, Graz, Austria) was used for data acquisition. The position of the crankshaft was determined with a built-in angle encoder A58M-F on the crankshaft, which transmits the signal to the LabVIEW Real Time module every 0.1758 crankshaft angle degree (CAD), synchronously with the signal from the in-cylinder pressure sensor. After collecting data from 100 engine operation cycles, they were saved and visualized in LabVIEW software (version 14.0.1f3). The amount of airflow and fuel mixture into the engine required for the intended load and engine speed was regulated by the throttle. The amount of NG consumed was fixed using a Coriolis flow meter RHEONIK RHM 015 (Rheonik Messtechnik GmbH, Odelzhausen, Germany) (accuracy ± 0.10%), and a fuel mass meter was used to measure gasoline consumption. The layout of the engine test setup is shown in Figure 1, while specifications of the engine are presented in Table 1.
Ensuring a stable engine temperature during all tests, a liquid-cooled plate heat exchanger was installed instead of a cooling radiator. The factory oxygen sensor in the exhaust manifold was changed to the Bosch LSU 4.9 (Robert Bosch GmbH, Gerlingen, Germany) oxygen sensor, which provides the ability to observe and tune the A/F ratio via ECU.
The intake air mass was quantified using a Bosch HFM 5 (Robert Bosch GmbH, Gerlingen, Germany) hot-film sensor (measurement error ±2%), while pressure in the intake manifold was monitored with the manifold absolute pressure sensor Bosch DSS3TF (Robert Bosch GmbH, Gerlingen, Germany). The temperature of intake air and exhaust gas were fixed with a K-type thermosensor (precise to ± 0.5%). The composition of the gas was analyzed before the catalyst converter using emission measurement system MRU MGAprime (MRU Messgeräte für Rauchgase und Umweltschutz GmbH, Neckarsulm-Obereisesheim, Germany). The engine was warmed up to operating temperature before each test to ensure data stability and repeatability. Exhaust gas concentrations were measured at 3 s intervals over a 1 min period. The characteristics of exhaust gas measurement system are presented (Table 2).

2.2. Testing Conditions and Fuel Properties

A dynamometer employing eddy currents, which can produce a maximum braking torque of 480 Nm (accuracy ± 0.9 Nm), was used to apply a load to the engine. To evaluate changes in energy and ecological indicators, testing was performed at different engine speeds (n = 2000; n = 3000 rpm), and various loads (MB = 40 Nm, MB = 70 Nm, and MB = 100 Nm) were chosen, equivalent to BMEP: 0.31 MPa, 0.55 MPa, and 0.79 MPa. The same excess air coefficient (λ = 1) was fixed during all tests. The experimental investigation involved adjusting the IVC timing to six positions: 24°, 31°, 38°, 45°, 52°, and 59° crankshaft angle degrees after bottom dead center (CAD aBDC).
The spark ignition engine (SIE), initially operated on gasoline but was subsequently switched to NG for the experimental tests. A low-pressure pump delivered gasoline from the fuel tank, while NG was supplied to the intake manifold from a high-pressure tank via an electromagnetic valve and pressure reducer.
The properties of gasoline and natural gas are shown (Table 3). The information on the properties of G and NG is based on information from the fuel supplier. Unleaded gasoline (~90%) and ethanol (~10%) mixture with a research octane number (RON) of 95 and oxygen content up to 3.7% by mass was used in the tests.

2.3. The Methodology of the Combustion Process

The analysis of the combustion process and energy transformations were performed using the thermodynamic engine cycle and gas exchange simulation software AVL BOOSTTM and its utility BURN. When simulating the combustion process, the first law of thermodynamics is applied for calculations to determine the thermodynamic state of the cylinder [44]:
d m c · u d α = p c · d V d α + d Q F d α d Q w d α h B B · d m B B d α
where d m c · u d α —the total energy change in the cylinder; p c d V d α —the work by the piston; d Q F d α —the amount of heat in the fuel; d Q w d α —heat loss to the cylinder walls; h B B · d m B B d α —blowing due to piston rings.
The mass inside the cylinder varies over time due to the continuous inflow and outflow of mass. This variation can be calculated by summing the mass entering and subtracting the mass leaving the cylinder:
d m c d α = d m i d α d m e d α d m B B d α ;
where d m c d α —the total mass inside the cylinder; d m i d α —the mass entering the cylinder; d m e d α —the mass going out from the cylinder.
The single-zone Vibe function is used to approximate MFB, which is used to calculate ROHR with the subsequent equation:
d Q B d α = Q B T a α c · ( m + 1 ) · y m · e a · y ( m + 1 ) ;
y = α α 0 α c ;
where d Q B d α —ROHR per crankshaft angle; Q B T —total heat released during combustion; α—Vibe function parameter related to the burn rate; α c —the combustion duration (CD) in terms of crank angle; m—Vibe function parameter influencing the shape of the burn curve, y—combustion progress, e—Euler’s number.
A numerical model of an SIE was implemented in AVL BOOST™ software (Figure 2), and the necessary input parameters were sourced from the manufacturer’s specifications (Table 1) and fuel properties (Table 3).
Combustion analysis, the reverse process of the combustion calculations performed in AVL BOOST™, is conducted using the BURN utility. This analysis leverages measured cylinder pressure data to derive the ROHR, a key indicator of combustion characteristics. To perform this, BURN requires input parameters encompassing engine and fuel specifications, cylinder geometry, and operating conditions (Table 4).
After analyzing and calculating the input data, the BURN program provides the following results: start of combustion (SOC), combustion duration (CD), shape parameter (m), energy balance, ROHR, MFB: 5%, 10%, 50%, and 90%, in-cylinder pressure and in-cylinder pressure rise, and temperature and temperature rise. The validation procedure was performed in the software, which calculated the in-cylinder pressure using data determined during the experimental analysis. The shape and values of the calculated pressure curve were carefully compared with the measured in-cylinder pressure curves, which allowed for the assessment of the accuracy of the model in reflecting real combustion processes in the engine.

2.4. Methodology for Calculating Energy and Environmental Performance

By taking into account the effective work done by the engine and the energy output of the fuel, the engine’s brake thermal efficiency is calculated:
B T E = P B · 3.6 B f · L H V ;
where P B —brake power of the internal combustion engine, kW; B f —fuel consumption, kg/h; L H V —lower heating value of fuels, MJ/kg.
Brake power of internal combustion engine:
P B = M B · n · 2 · π 1000 · 60 ,   k W ;
where M B —effective torque of ICE, Nm; n—engine speed, rpm.
The lower heating value of a fuel mixture is determined by considering the mass fraction and lower heating value of the individual components of the mixture:
L H V = i = 1 n x m _ i · L H V i , M J / k g ;
where x m _ i —mass fraction of the fuel mixture component; L H V i —the lower heating value of a fuel mixture component, MJ/kg.
The brake-specific fuel consumption is calculated by taking into account the engine’s hourly fuel consumption and the brake power developed:
B S F C = B f · 1000 P B ,   g / k W h ;  
The specific emissions of individual pollutants shall be calculated by taking into account the volumetric concentration and molar mass of the pollutants, the total mass emissions of the exhaust gas, and its molar mass:
X p o l l . = C p o l l . · M p o l l . · m e x M e x · P B · 1000 ,   g / k W h ;  
where C p o l l . —the concentration of the pollutant measured by the gas analyzer, ppm; M p o l l . —the molar mass of the pollutant, g/mol; m e x —the mass flow rate of the engine’s exhaust gases, kg/h; M e x —the molar mass of the engine exhaust gases, g/mol.
The mass of the engine’s exhaust gases:
m e x = B f + B a i r , k g / h ;
where B a i r —air consumption, kg/h.
The molar mass of the engine exhaust gases:
M e x = i = 1 n C n · M n 100 , g / m o l ;
where C n —the concentration of the n component of the engine exhaust gas, %; M n —the molar mass of the n component of the engine exhaust gas, g/mol.

3. Results

The experimental tests and combustion process analysis performed focused on continuing previously conducted research by extending the valve phases and selecting different engine loads instead of a fixed throttle position. In the prior study, a constant throttle angle for all valve phases was used [45], while this research focused on changing the intake valve closing time at various loads.
In the experimental tests, IVC timings were chosen from 24° to 59° aBDC in 7° increments. Three engine loads (BMEP = 0.31, 0.55 and 0.79 MPa) were tested using both liquid and gaseous fuels, which better represent real-world driving and allow for a more accurate assessment of engine performance at a fixed engine load than throttle position.
The throttle position is consistently higher when operating on natural gas (NG) compared to gasoline (G) at all BMEP levels (Figure 3). Natural gas contains more hydrogen, and in order to keep a constant excess air ratio (λ = 1) during experimental tests, the complete combustion of NG requires more air (AFR 17.1:1) compared to gasoline (14.24:1). This difference results in a larger throttle opening to ensure sufficient VE and cylinder filling with fuel-delivered energy. It is observed that at low and medium engine loads, a slight increase in the throttle valve (up to ~0.8%) is visible after replacing G with NG, but at maximum load (BMEP = 0.79 MPa), the throttle valve opens ~1.8% and 2.4% more when comparing 2000 and 3000 rpm. A stoichiometric mixture of natural gas and air has a lower energy density than the gasoline–air case; therefore, to produce a comparable power output, a larger volume flow rate of NG is required. The lower density of the natural gas–air mixture also influences the larger throttle opening, which reduces the inertia of the gas flow and the VE.
This observation is consistent with findings, where reported throttle openings in a spark-ignited (SI) engine were even up to 15% higher in NG compared to gasoline operation over a wide range of operating conditions [46]. The relationship between throttle position and BMEP shows a positive correlation for gasoline and NG, most prominently at low engine speeds. A higher BMEP means a heavier load on the engine, and therefore a higher air and fuel quantity (volume flow), meaning a larger throttle opening. However, at increased engine speeds, the relationship between throttle position and BMEP becomes less linear as a result of the combined effects of improved VE, altered gas flow dynamics, changes in combustion phasing and engine control strategies. This aligns with the results of other authors from an engine experiment, which reported a linear relationship between BMEP and throttle position at low speeds, but nonlinearities as the speed increased [16,47].

3.1. Analysis of the Combustion Process

In the combustion process analysis, IVC timings were chosen at 24°, 38°, 52°, and 59° aBDC and two engine loads (BMEP = 0.31 MPa, BMEP = 0.79 MPa) using both liquid and gaseous fuels. The pressure in the cylinder was evaluated during the experimental tests using a piezoelectric sensor installed in the spark plug, and the resulting values were used as one of the input data in the AVL BOOST™ software to calculate ROHR, MFB, temperature in the cylinder, and temperature rise.
The in-cylinder pressure variation trends using different fuels are presented (Figure 4). It is noteworthy that the pressure at the end of the compression stroke before the combustion starts is higher when the intake valve is closed earlier (at 24° IVC) at different engine operating modes. The effective compression ratio approaches the geometric compression ratio, and this means the charge is compressed to a greater extent, leading to increased pressure and temperature upon the completion of compression. The pressure at the end of compression increases additionally, as the gaseous fuel displaces a portion of the in-cylinder volume when using NG. The air displaced by the gas is compensated for by opening the throttle more. When ensuring a stoichiometric mixture, natural gas requires even more air due to the higher H/C ratio in the gas (Table 3), which in turn determines a higher compression pressure.
When IVC is being delayed, the pressure maximum in the cylinder increases and approaches TDC, although the effective compression ratio decreases. The highest pressure peak in the power stroke is seen when IVC is maximally delayed (to 59° IVC) when using gasoline, while the lowest pressure noticed for NG. An exceptional pressure trace behavior observed at 3000 rpm and 0.31 MPa engine load likely results from a complex interplay of factors. The combination of the high engine speed with the low manifold absolute pressure resulting from significant throttling required for this low load creates conditions where key engine phenomena become highly coupled and exceptionally sensitive. Consequently, the influence of intake and exhaust wave dynamics, combustion stability, and in-cylinder flow patterns becomes particularly reactive to variations in IVC timing and fuel type, leading to the observed deviations from broader trends.
The coefficient of variation of indicated mean effective pressure (COVIMEP) under the considered load (BMEP = 0.31 MPa) is lower when the engine is operating on natural gas (COVIMEP = 0.0215), and when the load increases (BMEP = 0.79 MPa), the COVIMEP reaches a lower value when using gasoline (COVIMEP = 0.0143) (Figure 5). This indicates that NG ignites and burns more stably at lower loads, pressures, and temperatures, and gasoline burns more stably as the engine load increases. With the delay of IVC, the combustion stability decreases, likely due to the less stable turbulence of the compressed combustible mixture at a lower actual compression ratio, and in the case of low loads, when IVC = 59° aBDC, the COVIMEP increases most significantly (up to 0.035) when the engine is operating on gasoline. Other researchers noticed that engines running on NG tend to have higher variations in in-cylinder pressure compared to gasoline, especially at low loads and high engine speeds, which they attributed to increased turbulence and unstable combustion [48,49].
Generally, maximally delayed IVC timing (to 59°) tends to result in a more concentrated and higher ROHR peak, suggesting faster and more intense combustion (Figure 6). However, this trend can vary depending on engine speed and load. Earlier IVC timing (24°) often leads to a lower ROHR peak, indicating that while a lower effective compression ratio is achieved, the combustion intensity can be influenced by in-cylinder flow and A/F mixing. Earlier IVC timings, while not exhibiting the highest ROHR peaks, lead to a quicker rise in the MFB curve, suggesting a faster initial burn rate. In contrast, maximally delayed IVC timings, which often show higher ROHR peaks, also demonstrate a rapid rise in MFB, indicating efficient overall combustion. Comparing fuels, gasoline tends to show a slightly faster rise in the MFB curves compared to natural gas, suggesting a faster burn rate. Increased engine load and speed also result in a quicker rise in the MFB curves, reflecting the more rapid and complete combustion under these conditions.
Evaluating ignition delay (ID), it is noticeable that in all test conditions, the ignition delay (ID) is shorter when using natural gas, which at lower engine speeds (n = 2000 rpm) and at different loads lasts from 1.3% to 7.3% less (Table 5). This difference may be due to the different physical and chemical properties of gasoline and natural gas, as well as the peculiarities of the combustion process. Natural gas, being gaseous, can distribute earlier and more evenly in the cylinder than liquid gasoline, which advances the start of combustion. In addition, natural gas generally burns later than gasoline, but this later combustion can be compensated for by increased turbulence in the cylinder.
When the engine is operating at higher speeds, at the lowest load, and with the earliest intake valve closing (IVC = 24°), there is an approximately 33% reduction in ID when comparing natural gas to gasoline. This large difference can be explained by several factors. At 3000 rpm, the turbulence of the air–fuel mixture increases, and natural gas, distributing earlier in the cylinder, can burn earlier. At low loads, when the amount of fuel is small, even mixing is especially important, and the earlier distribution of natural gas can advance combustion.
Also, ECU may optimize combustion differently for gasoline and natural gas under these conditions. Finally, natural gas, due to its properties, may be less prone to incomplete combustion than gasoline, which also contributes to earlier combustion.
The mass fraction burned values presented in (Table 5) show that under different engine operating conditions, natural gas burns later, except for the case when, due to the shorter ID phase, gaseous fuel burns earlier when the engine is operating at increased speeds and the lowest load (n = 3000 rpm, BMEP = 0.31 MPa). This earlier combustion of natural gas in this mode may be related to increased turbulence and earlier mixing, as mentioned earlier. The 50% of the mass fraction burned (MFB50) in this engine mode burns earlier using natural gas and differs from 1.8% to 7.5% compared to gasoline throughout the entire IVC range, while 90% of the mass fraction burned (MFB90) differs, respectively, from 0.5% up to 3.2%.
The peak temperatures attained within the cylinder are notably influenced by the IVC timing. Earlier closure of the intake valve generally promotes higher peak temperatures, a consequence of the enhanced effective compression that precedes combustion. However, the rapidity with which the temperature escalates, quantified as the temperature rise, displays a contrasting behavior. Maximally delayed IVC timings (59° aBDC) correlate with a more accelerated temperature increase. This implies that while earlier IVC favors higher initial temperatures, delaying IVC cultivates conditions for a more vigorous energy release during the combustion event. Fuel composition also exerts an influence: gasoline combustion tends to yield slightly elevated peak temperatures and a swifter temperature rise when contrasted with NG. Furthermore, the thermal intensity of the combustion process, reflected in both peak temperature and temperature rise, is amplified by heightened engine loads. Finally, the temperature curves shift, and the peak values are sustained or augmented as engine speed increases.

3.2. Analysis of Energy Indicators

The reduction in exhaust temperature with delayed IVC suggests a shift in the combustion process and heat distribution. This is confirmed by the ROHR intensity, temperature rise, and temperature in the cylinder determined during the combustion process analysis. When applying delayed IVC, combustion occurs earlier, more intensively, and in a smaller volume, and the peak combustion temperatures inside the cylinder are higher (Figure 7) and sufficient to drive nitrous oxide formation. The subsequent expansion and cooling of the gases lower the exhaust temperature (Figure 8), but the NOx formed during the high-temperature combustion phase remains present. Through delayed IVC, the Atkinson cycle is imitated, and this leads to a more complete expansion of combustion gases within the cylinder, extracting more work and reducing the energy (and thus temperature) of the exhaust gases.
The BSFC is consistently lower for natural gas compared to gasoline (Figure 9) due to the ~17.8% higher LHV of NG (Table 3). This is also influenced by the higher BTE of NG compared to G. Although the intake valve closing time does not have a significant impact on these indicators, it is worth noting that when evaluating the average of the data across the entire IVC range under different engine loads, BSFC decreases by ~18% at 2000 rpm when using NG. At the increased engine speed of 3000 rpm, the BSFC change is even more significant at ~20%. Other studies showed a ~16% and ~15% reduction in BSFC at different throttle positions and a decrease by ~22% in BSFC when using CNG compared to G, explaining that natural gas has a higher LHV and burns more slowly than G [50,51]. Due to the lower combustion temperature of NG compared to G, the heat energy losses through the cylinder head and liner to the cooling system are reduced. The lower exhaust gas temperature of NG also indicates lower energy losses through the exhaust system. All of this complexly increases BTE and decreases BSFC.
BTE is higher by ~3.2% at 0.39 MPa engine load, ~3.5% at 0.55 MPa, and ~3.3% at 0.79 MPa when using NG compared to G; meanwhile, at 3000 rpm, it increases by 6.3%, 5.2%, and 5.7%, respectively (Figure 10). Comparing IVC timings of 24° and 59° at 2000 rpm and 0.31 MPa load, running on NG, BTE increased from 0.281 to 0.290 (3.02%). At 0.55 MPa load, BTE increased from 0.335 to 0.347 (1.05%) and 0.359 to 0.371 (0.46%) at 0.79 MPa. In the case of gasoline, the positive influence of LIVC on increasing BTE is less noticeable at the increased engine speed of 3000 rpm.
The ITE can be increased by ~2% at different operation conditions with the optimization of LIVC [52]. Other authors found that increasing the compression ratio and delaying the intake valve closing can also enhance efficiency by 2.04% under high-load conditions. These changes demonstrate that the LIVC strategy helps in improving thermal efficiency by reducing the effective compression ratio, thus reducing the compression temperature and mitigating knocking. Therefore, the Atkinson cycle can significantly improve fuel consumption and efficiency [23,53].

3.3. Analysis of Ecological Indicators

It is noticeable that CO2 emissions (Figure 11) are significantly lower when switching from G to NG in the entire range of IVC, engine speed, and load, with reductions ranging from ~19.8% to ~25.5%. When evaluating the impact of IVC on CO2 emissions, it can be seen that there is no significant change in the range from 24° to 52°. However, for gasoline operation at 2000 rpm, delaying IVC to 59° results in a CO2 reduction ranging from ~3.7% at 0.31 MPa to ~5.7% at 0.79 MPa, while a CO2 reduction is noticed from ~4.4% to ~5.0% across the BMEP range at 3000 rpm. For NG operation at 59° IVC, the CO2 decreases are more pronounced, respectively, from ~5.6% to ~6.3% and ~3.9% to ~7.1%.
Such a change can be explained due to different fuel properties and the port injection system in the intake manifold. The ~2.1 times higher H/C ratio (Table 3) of NG compared to G, reduced fuel mass consumption, and increased BTE (Figure 10) results in less carbon dioxide formation during combustion. Additionally, partial air space is occupied by compressed natural gas, thus reducing cylinder filling with air, which is compensated for by opening the throttle more and maintaining a stoichiometric mixture throughout the entire IVC range. However, LIVC lowers the effective compression ratio while preserving the expansion ratio and improving thermal efficiency, which can be evaluated as lower fuel consumption and CO2 emissions. Other researchers reported similar results with a delayed IVC in a turbocharged SI engine while demonstrating that natural gas exhibits higher efficiency compared to gasoline, indicating better energy utilization and lower CO2 emissions as well [54,55].
Carbon monoxide (CO) emissions (Figure 12) are lower when using natural gas. The change in CO pollutants has a correlation relationship with CO2 emissions with different IVC timings between 24° and 52°. Although CO is not as stable in this range as CO2, it is worth emphasizing the more significant formation of CO when IVC is maximally delayed. Comparing the change in emissions when IVC is 24° and 59°, it is observed that the increase in CO is up to ~31.9% when using G at 2000 rpm and different BMEP levels, while it increases up to ~33.2% with NG. After increasing the engine speed to 3000 rpm, the change remains close enough, up to ~27.1% with G and ~27.7% with NG, respectively.
The NG used in the experimental research consists of ~94.3% methane and generally tends to burn cleanly compared to gasoline. The simpler hydrocarbon structure promotes more complete combustion and results in fewer CO emissions. When IVC is delayed to 59°, CO emissions increase due to uneven mixing at a lower effective compression ratio. LIVC disrupts the air and fuel mixture homogeneity, creating localized rich zones with insufficient oxygen for complete combustion. The complex interaction between IVC and the in-cylinder flow patterns can lead to variations in the cylinder’s A/F distribution. It was observed that CO formation was favored, leading to higher overall CO emissions despite the earlier SOC, indicating the general improvement in combustion efficiency due to more intense heat release and higher combustion temperature (Figure 6) in the presence of LIVC.
Lower CO emissions are observed in a similar study when operating a bi-fuel engine (natural gas and gasoline) and attributed to the cleaner combustion characteristics of NG [50], while a substantial decrease in CO emissions is reported when using NG as an alternative fuel in an SI engine [56]. Gasoline- and methane-fueled engines show that methane operation results in lower CO pollutants, particularly at increased loads. This reduction is due to its higher H/C ratio and improved combustion efficiency [29]. Other authors’ findings on the effect of LIVC on emissions highlight the complex interplay between IVC timing, combustion efficiency, and emissions, emphasizing the need for the careful optimization of IVC to achieve the desired emissions reduction targets [18,57].
Regarding the change in methane (CH4) emissions, it is observed that more methane compounds are emitted throughout the IVC range at different engine loads when the engine is running on natural gas (Figure 13). This increase can be explained by the presence of methane in NG, which is the main component of this gaseous fuel. Gasoline has a longer hydrocarbon chain, undergoes a more complex combustion process, and wider range of hydrocarbons can break down or be partially oxidized, leading to increased propane (C3H8) emissions. Both hydrocarbon emissions at different engine loads were higher when using gasoline and resulted in a ~75.8% increase in emissions compared to NG at 2000 rpm, while the difference in emissions showed a ~45.3% increase at 3000 rpm.
The emissions of hydrocarbons remain relatively stable within the IVC range of 24° to 52°, but a more significant increase is observed at 59°, similar to the trend seen for CO emissions. Comparing the IVC timings of 24° and 59° at the lowest engine speed (2000 rpm) and load (BMEP = 0.31 MPa), CH4 emissions increase from 0.15 g/kWh to 0.22 g/kWh (~46%) on gasoline and from 1.14 g/kWh to 1.31 g/kWh (~18%) on natural gas. C3H8 emissions rise from 2.48 g/kWh to 2.57 g/kWh (~3.7%) on G, while on NG the difference was between 0.3 g/kWh and 0.4 g/kWh (~34%). By increasing the BMEP to 0.79 MPa and delaying IVC, CH4 increased from 0.10 g/kWh to 0.18 g/kWh (~80%) on G and from 0.90 g/kWh to 0.99 g/kWh (~10%) on NG. C3H8 emissions also increased from 1.73 g/kWh to 1.86 g/kWh (~8%) and from 0.11 g/kWh to 0.28 g/kWh (~2.5 times), respectively. Delaying IVC at 3000 rpm and BMEP = 0.31 MPa, CH4 increased by 16.4% on gasoline and 19.9% on natural gas, while C3H8 increased by 5.4% and 63.4%. When the BMEP = 0.79 MPa, CH4 rose by 19.6% on G and 30.5% on NG, while C3H8 increased by 20.3% and 69.3%, respectively.
The earlier SOC and shorter CD (Figure 6) at the IVC of 59° leads to incomplete combustion and increases the amount of unburned hydrocarbons (CH4 and C3H8), as shown in Figure 13. While LIVC may lead to earlier and more intense initial combustion, it is important to optimize IVC to balance effective combustible mixture mixing with combustion duration to reduce emissions.
A reduction in nitric oxide (NO) and nitrogen dioxide (NO2) emissions is observed when gasoline is replaced with natural gas at all engine loads (Figure 14). The largest share of nitrogen oxide emissions is NO, while NO2 accounts for only a small proportion in the exhaust system. It is noticed that when gasoline is replaced with natural gas, the average (both NO and NO2) reduction within the IVC range of 24°–59° after BDC is ~38% at the 0.31 MPa engine load, ~31% at 0.55 MPa, and ~29% at 0.79 MPa at 2000 rpm. At the increased engine speed of 3000 rpm, the reductions are ~29%, ~23%, and ~22% for the same load conditions, respectively. In the case of NG, nitrogen oxide emissions decreased due to lower combustion intensity and temperature (Figure 7) and due to a larger amount of air (more cooling of the mixture during intake) required for NG combustion (Table 3) compared to G.
In general, the tendency for NO emissions formation increases with delayed intake valve closing from 24° to 59°, which is especially noticeable when the engine is operating at lower speeds. At 0.31 MPa and using gasoline at 2000 rpm, with the maximum retardation of IVC, a ~97% increase in nitric oxide emissions is observed, while at 0.55 MPa and 0.79 MPa engine load, there is an emissions increase of ~77% and ~42%. When replacing gasoline with natural gas, this change is significantly greater: 2.4 times more at 0.31 MPa, 1.4 times at 0.55 MPa, and 1.5 times at 0.79 MPa engine load. When delaying IVC from 24° aBDC to 59° aBDC in the engine speed range of 2000–3000 rpm and the load range of 0.31–0.79 MPa, nitrogen oxide emissions increase due to the increase in ROHR and temperature rise intensity (Figure 6 and Figure 7). However, in the case of NG, NO emissions remain 20–30% lower in all engine operating modes compared to gasoline due to the lower combustion temperature. The primary factors influencing nitrogen oxide formation are the temperature, intensity, and oxygen content during hydrocarbon combustion.

4. Conclusions

An experimental investigation and combustion process analysis were conducted using a Nissan HR16DE 1.6 L internal combustion engine operating on gasoline and natural gas, employing late intake valve close ranging from 24° to 59° crank angle degrees after bottom dead center, at engine speeds of 2000 and 3000 rpm, and break mean effective pressures of 0.31, 0.55, and 0.79 MPa. Data obtained during experimental tests (in-cylinder pressure, fuel consumption, pollutant emissions) and the AVL BOOST™ software’s BURN utility were used to evaluate the combustion process. The following conclusions can be drawn based on the results obtained:
Natural gas consistently demonstrates a shorter ignition delay than gasoline, particularly at lower engine speeds (n = 2000 rpm), and decreases by 1.3% to 7.3%, likely due to improved mixing. At 3000 rpm and low load, ignition delay reduces by ~33%, highlighting turbulence effects. While natural gas generally burns later, it burns earlier at 3000 rpm and low load, correlating with the shorter ignition delay. In this condition, 50% mass fraction burned occurs 1.8% to 7.5% earlier with natural gas, and 90% mass fraction burned is observed 0.5% to 3.2% earlier.
The engine operating on natural gas demonstrated better energy efficiency: the average brake-specific fuel consumption decreased by ~18–20%, and the average brake thermal efficiency increased by ~3–6% compared to gasoline. This was attributed to the higher lower heating value of natural gas and a more efficient combustion process. Using natural gas resulted in an average reduction of ~20–25% in carbon dioxide emissions. Lower carbon monoxide and nitrogen oxide emissions (~22–38% lower, depending on load and speed) were also observed. However, methane hydrocarbon emissions were higher, while propane hydrocarbon emissions were lower than when using gasoline.
Delaying the intake valve closing to 59° after bottom dead center, especially when using natural gas, resulted in a slight increase in break thermal efficiency (up to ~3%), consistent with Atkinson cycle principles. This also led to reduce carbon dioxide (~4–7%) compared to the earliest intake valve close (24° after bottom dead center). Late intake valve close (59° after bottom dead center) resulted in a more intense combustion process (higher rate of heat release peak, faster in-cylinder temperature rise), although the peak in-cylinder temperatures were slightly lower than with earlier intake valve close due to the reduced effective compression ratio.
Delaying the intake valve close from 24° to 59° after bottom dead center caused a significant increase in carbon monoxide (up to ~33%), methane hydrocarbons (up to ~80% with gasoline, up to ~30% with natural gas), propane hydrocarbons (up to ~8%, up to ~2.5 times, respectively), and nitrogen oxide emissions (up to ~97% and up to ~2.4 times, respectively). This is associated with poorer air–fuel mixture homogeneity at a lower effective compression ratio, incomplete combustion, and higher localized temperatures during the more intense combustion phase.
Utilizing natural gas instead of gasoline significantly reduces carbon dioxide emissions and nitrogen oxide pollutants while improving the engine’s energy efficiency. The late intake valve closing strategy can further enhance brake thermal efficiency and reduce carbon dioxide, but it adversely affects carbon monoxide, hydrocarbon, and nitrogen oxide emissions. Achieving optimal results requires a trade-off between increasing efficiency, reducing carbon dioxide, and controlling other pollutants, possibly by combining late intake valve close with other engine control strategies.
To ensure compliance with European Union emissions standards, future research will investigate the combined supply of gasoline, natural gas, and hydrogen within internal combustion engines.

Author Contributions

Conceptualization, T.V. and A.R.; methodology, T.V. and A.R.; software, T.V. and A.R.; validation, T.V., A.R. and A.M.; formal analysis, S.S. and A.P.; investigation, T.V., A.R. and S.S.; resources, A.P. and A.M.; data curation, T.V. and S.S.; writing—original draft preparation, T.V. and S.S.; writing—review and editing, A.R., A.P. and A.M.; visualization, T.V. and S.S. All authors have read and agreed to the published version of the manuscript.

Funding

This research received no external funding.

Institutional Review Board Statement

Not applicable.

Informed Consent Statement

Not applicable.

Data Availability Statement

The data presented in this study are available on request from the corresponding author. The data are not publicly available due to privacy.

Acknowledgments

The combustion process analysis presented in this study was performed using AVL BOOST™ (version R2021.2) with the BURN utility. Access to the software was provided through participation in the University Partnership Program (UPP) between Vilnius Gediminas Technical University and AVL Advanced Simulation Technologies (AVL AST).

Conflicts of Interest

The authors declare no conflicts of interest.

Abbreviations

aBDCafter bottom dead center
AFRair fuel mass ratio
A/Fair fuel
Bairair mass flow
Bf_ggasoline mass flow
Bf_ngnatural gas mass flow
BMEPbreak mean effective pressure
BSFCbrake-specific fuel consumption
BTEbrake thermal efficiency
bTDCbefore top dead center
BDCbottom dead center
CA crankshaft angle
CAD crankshaft angle degrees
CDcombustion duration
CH4methane
C2H6ethane
C3H8propane
C4H10butane
C5H12pentane
CNGcompressed natural gas
COcarbon monoxide
COVIMEPcoefficient of variation of indicated mean effective pressure
CO2carbon dioxide
DOHCdouble overhead camshaft
ECUelectronic control unit
ESelectrochemical sensor
EUEuropean Union
Ggasoline
ICEinternal combustion engine
IDignition delay
IMEPindicated mean effective pressure
ITignition timing
IVC intake valve closing
LHVlower heating value
LIVClate intake valve closing
NDIRnon-dispersive infrared technology
nengine speed
NGnatural gas
NOnitric oxide
NO2nitrogen dioxide
NOxnitrogen oxides
N2nitrogen
mshape parameter
MFBmass fraction burned
MFB5050% of the mass fraction burned
MFB9090% of the mass fraction burned
MNmethane number
MONmotor octane number
O2oxygen
pcylin-cylinder pressure
pexexhaust pressure
pinintake pressure
PNparticle number
ROHRrate of heat release
RONresearch octane number
SIspark ignition
SIEspark ignition engine
SOCstart of combustion
TDCtop dead center
Texexhaust gas temperature
Tinintake air temperature
VEvolumetric efficiency
VVTvariable valve timing
λexcess air coefficient

References

  1. Share of Global CO2 Emissions by Sector. 2023. Available online: https://www.statista.com/statistics/1129656/global-share-of-co2-emissions-from-fossil-fuel-and-cement/ (accessed on 2 February 2025).
  2. Dimaratos, A.; Kontses, D.; Kontses, A.; Saltas, E.; Raptopoulos-Chatzistefanou, A.; Andersson, J.; Aakko-Saksa, P.; Samaras, Z. Emissions of currently non-regulated gaseous pollutants from modern passenger cars. Transp. Res. Procedia 2023, 72, 3078–3085. [Google Scholar] [CrossRef]
  3. Fontaras, G.; Zacharof, N.-G.; Ciuffo, B. Fuel consumption and CO2 emissions from passenger cars in Europe—Laboratory versus real-world emissions. Prog. Energy Combust. Sci. 2017, 60, 97–131. [Google Scholar] [CrossRef]
  4. Greenhouse Gas Emissions from Transport in Europe. Available online: https://www.eea.europa.eu/en/analysis/indicators/greenhouse-gas-emissions-from-transport (accessed on 9 March 2025).
  5. European Commission. CO2 Emissions from New Cars and Vans Continued to Decrease in 2023 as Zero-Emission Vehicles Registrations Continued to Grow. Available online: https://climate.ec.europa.eu/news-your-voice/news/co2-emissions-new-cars-and-vans-continued-decrease-2023-zero-emission-vehicles-registrations-2024-06-10_en (accessed on 9 March 2025).
  6. Deal Confirms Zero-Emissions Target for New Cars and Vans in 2035 | News| European Parliament. Available online: https://www.europarl.europa.eu/news/lt/press-room/20221024IPR45734/deal-confirms-zero-emissions-target-for-new-cars-and-vans-in-2035 (accessed on 12 March 2025).
  7. European Commission. CO2 Emission Performance Standards for Cars and Vans. Available online: https://climate.ec.europa.eu/eu-action/transport/road-transport-reducing-co2-emissions-vehicles/co2-emission-performance-standards-cars-and-vans_en (accessed on 7 March 2025).
  8. Fan, F.; Dai, S.; Yang, B.; Ke, H. Urban density, directed technological change, and carbon intensity: An empirical study based on Chinese cities. Technol. Soc. 2023, 72, 102151. [Google Scholar] [CrossRef]
  9. Fan, J.; Meng, X.; Tian, J.; Xing, C.; Wang, C.; Wood, J. A review of transportation carbon emissions research using bibliometric analyses. J. Traffic Transp. Eng. (Engl. Ed.) 2023, 10, 878–899. [Google Scholar] [CrossRef]
  10. Abrar, I.; Arora, T.; Khandelwal, R. Bioalcohols as an alternative fuel for transportation: Cradle to grave analysis. Fuel Process. Technol. 2023, 242, 107646. [Google Scholar] [CrossRef]
  11. Tian, Z.; Zhen, X.; Wang, Y.; Liu, D.; Li, X. Comparative study on combustion and emission characteristics of methanol, ethanol and butanol fuel in TISI engine. Fuel 2020, 259, 116199. [Google Scholar] [CrossRef]
  12. Liu, Z.; Yu, X.; Sun, P.; Xu, S. Experimental investigation of the performance and emissions of a dual-injection SI engine with natural gas direct injection plus gasoline port injection under lean-burn conditions. Fuel 2021, 300, 120952. [Google Scholar] [CrossRef]
  13. Waseem, M.; Amir, M.; Lakshmi, G.S.; Harivardhagini, S.; Ahmad, M. Fuel cell-based hybrid electric vehicles: An integrated review of current status, key challenges, recommended policies, and future prospects. Green Energy Intell. Transp. 2023, 2, 100121. [Google Scholar] [CrossRef]
  14. Ghersi, D.E.; Loubar, K.; Amoura, M.; Tazerout, M. Multi-objective optimization of micro co-generation spark-ignition engine fueled by biogas with various CH4/CO2 content based on GA-ANN and decision-making approaches. J. Clean. Prod. 2021, 329, 129739. [Google Scholar] [CrossRef]
  15. Meng, X.; Xie, F.; Li, X.; Han, L.; Duan, J.; Gong, Y.; Zhou, Y. Study on the effects of intake valve timing and lift on the combustion and emission performance of ethanol, N-butanol, and gasoline engine under stoichiometric combustion and lean burn conditions. Energy 2024, 300, 131385. [Google Scholar] [CrossRef]
  16. Shi, H.; Jiang, W.; Shen, T. Lyapunov Function based Nonlinear Control of EGR-VVT Dual Loop in IC Engines. In Proceedings of the 2019 IEEE International Conference on Cybernetics and Intelligent Systems (CIS) and IEEE Conference on Robotics, Automation and Mechatronics (RAM), Bangkok, Thailand, 18–20 November 2019; pp. 239–244. [Google Scholar]
  17. Li, J.; Yu, X.; Xie, J.; Yang, W. Mitigation of high pressure rise rate by varying IVC timing and EGR rate in an RCCI engine with high premixed fuel ratio. Energy 2020, 192, 116659. [Google Scholar] [CrossRef]
  18. Shin, J.Y.; Lee, S.; Bae, C.; Jung, J.; Son, Y.; Heo, H.; Lee, J. Effect of late intake valve closing on the particle number emissions of a turbocharged gasoline direct injection engine. Fuel Process. Technol. 2022, 230, 107209. [Google Scholar] [CrossRef]
  19. Kontses, A.; Ntziachristos, L.; Zardini, A.A.; Papadopoulos, G.; Giechaskiel, B. Particulate emissions from L-Category vehicles towards Euro 5. Environ. Res. 2020, 182, 109071. [Google Scholar] [CrossRef]
  20. Kim, S.; Park, C.; Jang, H.; Kim, C.; Kim, Y. Effect of boosting on a performance and emissions in a port fuel injection natural gas engine with variable intake and exhaust valve timing. Energy Rep. 2021, 7, 4941–4950. [Google Scholar] [CrossRef]
  21. Wang, R.; Qiao, J.; Jia, D.; Shen, D.; Duan, X.; Liu, J. Effects of asynchronous late intake valve closing combined with high geometric compression ratio and exhaust gas recirculation on combustion and fuel consumption in a turbocharged SI engine:An experimental study. Energy 2024, 290, 130058. [Google Scholar] [CrossRef]
  22. Prajapati, L.K.; Tirkey, J.V.; Jena, P.; Giri, A. Parametric performance evaluation of SI engine using producer gas-biogas-hydrogen blend as a fuel: A thermodynamic modeling and optimization approach. Int. J. Hydrogen Energy 2024, 72, 268–287. [Google Scholar] [CrossRef]
  23. Zhu, K.; Lou, D.; Zhang, Y.; Ren, Y.; Fan, L. Effect of Atkinson cycle coupling compression ratio on the combustion characteristics of natural gas engines. Energy 2024, 309, 133111. [Google Scholar] [CrossRef]
  24. Jia, D.; Qiao, J.; Wang, S.; Guan, J.; Liu, J.; Fu, J.; Li, Y.; Wang, R. Influence of variable enhanced LIVC miller cycle coupled with high compression ratio on the performance and combustion of a supercharged spark ignition engine. Energy 2024, 309, 133214. [Google Scholar] [CrossRef]
  25. Gong, Z.; Feng, L.; Wang, Z. Experimental and numerical study of the effect of injection strategy and intake valve lift on super-knock and engine performance in a boosted GDI engine. Fuel 2019, 249, 309–325. [Google Scholar] [CrossRef]
  26. Sirna, A.; Hassan, A.; Ristow Hadlich, R.; Loprete, J.; Trelles, J.P.; Van Dam, N.; Mack, J.H.; Assanis, D. Understanding Diesel-Pilot Assisted Methane Combustion in a Compression Ignition Engine. In Proceedings of the ASME 2023 ICE Forward Conference, Pittsburgh, PA, USA, 8–11 October 2023; American Society of Mechanical Engineers: Pittsburgh, PA, USA, 2023; p. V001T02A003. [Google Scholar]
  27. Pamminger, M.; Sevik, J.; Scarcelli, R.; Wallner, T.; Hall, C. Influence of Compression Ratio on High Load Performance and Knock Behavior for Gasoline Port-Fuel Injection, Natural Gas Direct Injection and Blended Operation in a Spark Ignition Engine. In Proceedings of the WCXTM 17: SAE World Congress Experience, Detroit, MI, USA, 4–6 April 2017. SAE Technical Paper 2017-01-0661. [Google Scholar] [CrossRef]
  28. Li, X.; Zhen, X.; Wang, Y.; Tian, Z. Numerical comparative study on performance and emissions characteristics fueled with methanol, ethanol and methane in high compression spark ignition engine. Energy 2022, 254, 124374. [Google Scholar] [CrossRef]
  29. Karagöz, Y.; Balcı, Ö.; Gezer, O.; Köten, H.; Işın, Ö. Performance and emissions of spark-ignition engines fuelled with petrol and methane. Proc. Inst. Civ. Eng. Energy 2021, 174, 156–169. [Google Scholar] [CrossRef]
  30. Oh, J.; Noh, K.; Lee, C. A Theoretical Study on the Thermodynamic Cycle of Concept Engine with Miller Cycle. Processes 2021, 9, 1051. [Google Scholar] [CrossRef]
  31. Murtaza, G.; Bhatti, A.I.; Ahmed, Q. Design, Development, and Evaluation of a Control Framework for an Atkinson Cycle Engine. J. Dyn. Syst. Meas. Control 2018, 140, 051005. [Google Scholar] [CrossRef]
  32. Shojaeefard, M.H.; Keshavarz, M. Mathematical modeling of the complete thermodynamic cycle of a new Atkinson cycle gas engine. Appl. Therm. Eng. 2015, 91, 866–874. [Google Scholar] [CrossRef]
  33. Murtaza, G.; Bhatti, A.I.; Ahmed, Q. Control-Oriented Model of Atkinson Cycle Engine With Variable Intake Valve Actuation. J. Dyn. Syst. Meas. Control 2016, 138, 061001. [Google Scholar] [CrossRef]
  34. Niu, Q.; Sun, B.; Zhang, D.; Luo, Q. Research on performance optimization and fuel-saving mechanism of an Atkinson cycle gasoline engine at low speed and part load. Fuel 2020, 265, 117010. [Google Scholar] [CrossRef]
  35. Sun, X.; Fu, J.; Zhou, F.; Luo, B.; Liu, J. Performance prediction and multi-objective optimization for the Atkinson cycle engine using eXtreme Gradient Boosting. Therm. Sci. Eng. Prog. 2024, 48, 102402. [Google Scholar] [CrossRef]
  36. Kurien, C.; Varma, P.S.; Mittal, M. Effect of ammonia energy fractions on combustion stability and engine characteristics of gaseous (ammonia/methane) fuelled spark ignition engine. Int. J. Hydrogen Energy 2023, 48, 1391–1400. [Google Scholar] [CrossRef]
  37. Yang, S.; Yang, X.; Liu, H.; Feng, Z.; Li, X. Simulation Analysis of Early and Late Miller Cycle Strategies Influence on Diesel Engine Combustion and Emissions. In Proceedings of the WCX SAE World Congress Experience, Detroit, MI, USA, 21–23 April 2020. SAE Technical Paper 2020-01-0662. [Google Scholar] [CrossRef]
  38. Hanipah, M.R.; Rosli, M.H.A.; Razali, A.R. Flexible valve timing strategies for boosting a small four-stroke spark ignition engine performance. In Proceedings of the Small Engine Technology Conference & Exposition, Hiroshima, Japan, 19–21 November 2019. SAE Technical Paper 2019-32-0591. [Google Scholar] [CrossRef]
  39. Allawi, M.K.; Mejbel, M.K.; Oudah, M.H. Variable Valve Timing (VVT) Modelling by Lotus Engine Simulation Software. Int. J. Automot. Mech. Eng. 2021, 17, 8397–8410. [Google Scholar] [CrossRef]
  40. Zibani, I.; Marumo, R.; Chuma, J.; Ngebani, I.; Tsamaase, K. Variable Valve Timing for a Camless Stepping Valve Engine. Procedia Manuf. 2020, 43, 590–597. [Google Scholar] [CrossRef]
  41. Millo, F.; Mirzaeian, M.; Luisi, S.; Doria, V.; Stroppiana, A. Engine displacement modularity for enhancing automotive s.i. engines efficiency at part load. Fuel 2016, 180, 645–652. [Google Scholar] [CrossRef]
  42. Dev, S.; Guo, H.; Lafrance, S.; Liko, B. An Experimental Study on the Effect of Exhaust Gas Recirculation on a Natural Gas-Diesel Dual-Fuel Engine. In Proceedings of the WCX SAE World Congress Experience, Detroit, MI, USA, 21–23 April 2020. SAE Technical Paper 2020-01-0310. [Google Scholar] [CrossRef]
  43. Park, S.; Song, S. Model-based multi-objective Pareto optimization of the BSFC and NO x emission of a dual-fuel engine using a variable valve strategy. J. Nat. Gas Sci. Eng. 2017, 39, 161–172. [Google Scholar] [CrossRef]
  44. Fairbrother, R.; Leifert, T.; Gande, R.; Salentinig, G. Accurate Gas Exchange and Combustion Analysis Directly at the Test Bed. In Proceedings of the ASME 2012 Internal Combustion Engine Division Fall Technical Conference, Vancouver, BC, Canada, 23–26 September 2012; American Society of Mechanical Engineers: Vancouver, BC, Canada, 2012; pp. 667–676. [Google Scholar]
  45. Rimkus, A.; Vipartas, T.; Kriaučiūnas, D.; Matijošius, J.; Ragauskas, T. The Effect of Intake Valve Timing on Spark-Ignition Engine Performances Fueled by Natural Gas at Low Power. Energies 2022, 15, 398. [Google Scholar] [CrossRef]
  46. Sankesh, D.; Edsell, J.; Mazlan, S.; Lappas, P. Comparative Study between Early and Late Injection in a Natural-gas Fuelled Spark-ignited Direct-injection Engine. Energy Procedia 2017, 110, 275–280. [Google Scholar] [CrossRef]
  47. Bozza, F.; De Bellis, V.; Teodosio, L. A numerical procedure for the calibration of a turbocharged spark-ignition variable valve actuation engine at part load. Int. J. Engine Res. 2017, 18, 810–823. [Google Scholar] [CrossRef]
  48. Kumar Singotia, P.; Saraswati, S. Cycle-by-cycle variations in a spark ignition engine fueled with gasoline and natural gas. IOP Conf. Ser. Mater. Sci. Eng. 2019, 691, 012061. [Google Scholar] [CrossRef]
  49. Duan, X.; Deng, B.; Liu, Y.; Li, Y.; Liu, J. Experimental study the impacts of the key operating and design parameters on the cycle-to-cycle variations of the natural gas SI engine. Fuel 2021, 290, 119976. [Google Scholar] [CrossRef]
  50. Jahirul, M.I.; Masjuki, H.H.; Saidur, R.; Kalam, M.A.; Jayed, M.H.; Wazed, M.A. Comparative engine performance and emission analysis of CNG and gasoline in a retrofitted car engine. Appl. Therm. Eng. 2010, 30, 2219–2226. [Google Scholar] [CrossRef]
  51. Heoy Geok, H.; Mohamad, T.; Abdullah, S.; Yusoff, A.; Shamsudeen, A.; Adril, E. Experimental investigation of performance and emission of a sequential port injection natural gas engine. Eur. J. Sci. Res. 2009, 30, 204–214. [Google Scholar]
  52. Yan, B.; Wang, H.; Zheng, Z.; Qin, Y.; Yao, M. The effects of LIVC Miller cycle on the combustion characteristics and thermal efficiency in a stoichiometric operation natural gas engine with EGR. Appl. Therm. Eng. 2017, 122, 439–450. [Google Scholar] [CrossRef]
  53. Tirkey, J.V. Thermodynamic performance analysis of over-expansion stroke and late inlet valve close on hcng-si engine. Int. J. Power Energy Syst. 2018, 38. [Google Scholar] [CrossRef]
  54. Wang, J.; Duan, X.; Wang, W.; Guan, J.; Li, Y.; Liu, J. Effects of the continuous variable valve lift system and Miller cycle strategy on the performance behavior of the lean-burn natural gas spark ignition engine. Fuel 2021, 297, 120762. [Google Scholar] [CrossRef]
  55. Garlet, R.A.; Fagundez, J.L.S.; Hausen, R.B.; Roso, V.R.; Lanzanova, T.D.M.; Salau, N.P.G.; Martins, M.E.S. Prospects of performance, emissions and cost of methane-based fuels in a spark-ignition engine compared to conventional Brazilian fuels. Fuel 2024, 357, 129788. [Google Scholar] [CrossRef]
  56. Bohon, S.; Fang, T. Performance and emission testing of a bi-fuel outboard spark-ignition engine. Int. J. Engine Res. 2016, 17, 576–592. [Google Scholar] [CrossRef]
  57. Kim, J.; Park, S.S.; Bae, C. The effects of late intake valve closing and different cam profiles on the in-cylinder flow field and the combustion characteristics of a compression ignition engine. Proc. Inst. Mech. Eng. Part D J. Automob. Eng. 2018, 232, 853–865. [Google Scholar] [CrossRef]
Figure 1. Engine test setup: 1—spark ignition engine HR16DE; 2—brake dynamometer AMX200/100; 3—dynamometer control system AMX210; 4—electronic control unit MOTEC M800; 5—camshaft position sensor; 6—in-cylinder pressure sensor AVL ZI31_Y7S; 7—pressure signal amplifier; 8—dynamic pressure measurement system AVL DiTEST DPM 800; 9—crankshaft position measurement module LabVIEW Real Time; 10—exhaust gas temperature sensor; 11—oxygen sensor; 12—exhaust gas pressure sensor; 13—emission measurement system MRU MGAprime; 14—data acquisition system; 15—coolant temperature sensor; 16—crankshaft position sensor; 17—crankshaft angle encoder A58M-F; 18—air mass flow meter; 19—indicator of air mass flow meter; 20—intake air temperature sensor; 21—indicator of intake air temperature; 22—throttle; 23—manifold absolute pressure sensor; 24—gasoline fuel tank; 25—fuel pump; 26—fuel consumption meter; 27—indicator of fuel consumption meter; 28—fuel injector; 29—compressed natural gas (NG) tank; 30—electromagnetic valve; 31—gas flow meter RHEONIK RHM015; 32—indicator of gas flow meter; 33—gas pressure reducer; 34—natural gas injector.
Applsci 15 06185 g001
Figure 2. Numerical model of SI engine HR16DE: E1—input button for engine parameters; numbers 1–42—pipe; PLx—plenum (defined volume); MPx—measuring point; SBx—system boundary; Rx—restriction; Ix—injector; Jx—junction; Cx—cylinder; CATx—catalytic converter.
Applsci 15 06185 g002
Figure 3. Influence of engine speed, load, and fuel type on throttle position.
Applsci 15 06185 g003
Figure 4. The in−cylinder pressure while adjusting the IVC timing at 2000 rpm and 3000 rpm.
Applsci 15 06185 g004
Figure 5. The coefficient of variation of indicated mean effective pressure (COVIMEP) at 3000 rpm for 100 engine operating cycles.
Applsci 15 06185 g005aApplsci 15 06185 g005b
Figure 6. The ROHR and MFB while adjusting the IVC timing at 2000 rpm and 3000 rpm.
Applsci 15 06185 g006
Figure 7. The in−cylinder temperature and temperature rise while adjusting the IVC timing at 2000 rpm and 3000 rpm.
Applsci 15 06185 g007
Figure 8. The relationship between exhaust gas temperature (TEX) and IVC timing for G and NG.
Applsci 15 06185 g008
Figure 9. The relationship between BSFC and IVC timing for G and NG.
Applsci 15 06185 g009
Figure 10. The relationship between BTE and IVC timing for G and NG.
Applsci 15 06185 g010
Figure 11. The relationship between CO2 emissions and IVC timing for gasoline and natural gas.
Applsci 15 06185 g011
Figure 12. The relationship between CO emissions and IVC timing for gasoline and natural gas.
Applsci 15 06185 g012
Figure 13. The dependence of CH4 and C3H8 emissions on IVC timing for G and NG.
Applsci 15 06185 g013
Figure 14. The relationship between NO and NO2 emissions and IVC timing for G and NG.
Applsci 15 06185 g014
Table 1. The specifications of SI engine.
ParameterValue
Engine type/codeNaturally aspirated, four-stroke/HR16DE
No. of cylinders/valves4/16
Cylinder arrangementIn-line
Injection typePort fuel injection
Gas distribution systemDouble overhead camshaft (DOHC)
Displacement/firing order1.598 dm3/1-3-4-2
Bore/stroke78.0 mm/83.6 mm
Compression ratio10.7
Max. engine power84 kW at 6000 rpm
Max. engine torque156 Nm at 4400 rpm
Intake valve open/close24°–−11° before TDC 1/24°–59° after BDC 2
Exhaust valve open/close24° before BDC/4° after TDC
Intake and exhaust valve duration228°, 208°
Fuel typeGasoline, compressed natural gas
1 Top dead center; 2 bottom dead center.
Table 2. The specifications of exhaust gas measurement system MRU MGAprime.
GasMeasuring
Principle
ResolutionMeasurement
Reliability
Measuring Range
CO2NDIR 10.01% vol.0.2% vol. 20–50% vol.
CONDIR0.1 ppm2 ppm 20–10,000 ppm
NONDIR0.1 ppm2 ppm 20–4000 ppm
NO2NDIR0.1 ppm1 ppm 20–1000 ppm
CH4NDIR0.1 ppm10 ppm 20–10,000 ppm
C3H8NDIR0.1 ppm2 ppm 20–5000 ppm
O2ES 40.01% vol.±0.25% vol. 30–25% vol.
1 Non-dispersive infrared technology (NDIR); 2 repeatability; 3 accuracy; 4 electrochemical sensor (ES).
Table 3. The properties of the fuels.
PropertiesGasoline (E10)Natural Gas
Density, [kg/m3]753.7 *0.7609
Lower heating value, [MJ/kg]41.7949.22 **
Research octane number (RON)97.1~120
Methane number (MN)-~77
Stoichiometric A/F ratio, [kg/kg]14.24~17.1
Fuel composition, [%Vol.]Gasoline 90.3Methane (CH4) 94.3124
Ethanol 9.7Ethane (C2H6) 4.2309
Propane (C3H8) 0.6631
i-Butane (C4H10) 0.0766
n-Butane (C4H10) 0.1405
neo-Pentane (C5H12) 0.0015
i-Pentane (C5H12) 0.0098
n-Pentane (C5H12) 0.0043
C6 plus (C6+) 0.0015
Nitrogen (N2) 0.4446
Carbon dioxide (CO2) 0.1155
Hydrogen (H), [%Mass]13.8924.34
Carbon (C), [%Mass]82.574.69
Oxygen (O), [%Mass]3.61-
H/C ratio 1.87/13.88/1
Physical state LiquidCompressed gas
* at 15 °C measurement temperature; ** at 0 °C measurement temperature, 25 °C combustion temperature, and 1.01325 bar pressure.
Table 4. The input data for the BURN combustion process analysis.
ObjectInput Data
Fuel propertiesFuel type, stoichiometric air-to-fuel ratio (AFR), lower heating value (LHV).
Engine valuesNumber of cylinders, engine cycle, bore, stroke, compression ratio, connecting rod length, piston top surface area, cylinder head and liner, pressure in cylinder pcyl.
Operation pointEngine speed n, break mean effective pressure BMEP, start and end of high pressure, air mass flow Bair, mass flow of gasoline Bf_g and natural gas Bf_ng, residual gas content, piston and cylinder head wall temperature, liner temperature when piston at top and bottom dead center.
Table 5. The ignition delay (ID), 50% and 90% of the mass fraction burned (MFB50, MFB90).
Test ConditionsCombustion PhaseIVC,
24° aBDC
IVC,
38° aBDC
IVC,
52° aBDC
IVC,
59° aBDC
GNGGNGGNGGNG
n = 2000 rpm
BMEP = 0.31 MPa
ID14.313.613.713.212.812.210.810.1
MFB5017.318.513.414.210.110.77.68.3
MFB9032.938.031.234.728.029.321.121.4
n = 2000 rpm
BMEP = 0.79 MPa
ID9.68.98.78.48.17.87.47.3
MFB508.910.37.58.85.97.14.35.4
MFB9019.023.318.222.116.920.214.217.0
n = 3000 rpm
BMEP = 0.31 MPa
ID11.77.811.410.311.210.711.010.9
MFB505.75.35.75.65.85.65.75.5
MFB9019.418.820.019.620.720.521.721.6
n = 3000 rpm
BMEP = 0.79 MPa
ID7.86.77.46.56.56.26.85.8
MFB505.06.84.36.23.75.32.84.8
MFB9017.419.616.519.015.618.214.717.4
Disclaimer/Publisher’s Note: The statements, opinions and data contained in all publications are solely those of the individual author(s) and contributor(s) and not of MDPI and/or the editor(s). MDPI and/or the editor(s) disclaim responsibility for any injury to people or property resulting from any ideas, methods, instructions or products referred to in the content.

