Article

Establishing a Geological Knowledge Base for Braided River Deltas Using Google Earth

The School of Geosciences, Yangtze University, Jingzhou 434025, China
*
Author to whom correspondence should be addressed.
Appl. Sci. 2025, 15(11), 6186; https://doi.org/10.3390/app15116186
Submission received: 12 April 2025 / Revised: 21 May 2025 / Accepted: 27 May 2025 / Published: 30 May 2025

Abstract

This study quantifies morphological features of global braided river deltas using Google Earth imagery, analyzing eight systems (e.g., Yukon–Kuskokwim, Poyang Lake, Lena River deltas). Methods include listwise deletion for missing data (retaining 87% of Poyang Lake delta samples) and sensitivity analysis (threshold changes ≤2.4%). Nonparametric tests (Kruskal–Wallis, H = 12.73, p = 0.005) show significant differences in bifurcation angles across deltas, with the wave-dominated Po River (59.2°) having an 18% higher 80% threshold the than tide-dominated Poyang Lake (50.1°, p = 0.003). Key quantitative results include the following: 1.65% of bifurcation angles cluster at 30–60°, differing from fan deltas (p < 0.01); wavelength–amplitude relationships are nonlinear (R2 = 0.537–0.913), with positive slopes indicating a high sediment supply (e.g., Yukon–Kuskokwim) and negative slope channel avulsion (e.g., Poyang Lake); bifurcation spacing correlates with the sediment supply—54% of Poyang Lake spacings < 2000 m (dense networks) vs. 80% of Lena River spacings < 15,000 m (stable channels). The resulting dataset enables global, remote-sensing-based comparisons, providing thresholds for sedimentary modeling and reservoir prediction. Moderate missing data (≤13%) minimally affect results, though high-missingness cases need further analysis. This study replaces empirical rules with statistical validation, showing that morphometric differences reflect depositional dynamics, which are critical for reservoir heterogeneity assessments.

1. Introduction

Braided river deltas, as important sedimentary systems widely developed along the margins of tectonically active basins, exhibit significant reservoir heterogeneity due to their complex channel bifurcation and sandbody stacking characteristics [1,2]. This heterogeneity directly influences the distribution pattern, migration pathways, and recovery efficiency of hydrocarbons, presenting core challenges in the field of oil and gas exploration and production [3,4,5,6,7,8,9]. Sedimentary parameters such as wavelength (linear distance between adjacent bifurcation points), amplitude (maximum vertical distance of bifurcated channels), channel bifurcation angle, and bifurcation spacing are key elements for characterizing the morphological features and sedimentary dynamic processes of braided river deltas. Therefore, systematically investigating the distribution patterns and coupling mechanisms of these parameters holds crucial theoretical and practical significance for constructing reservoir prediction models and exploring subtle hydrocarbon reservoirs [10,11,12,13,14].
Traditional research methods primarily rely on outcrop analysis and dense well-network statistics. While outcrop analysis provides intuitive geological observation data, its limited spatial coverage makes it difficult to fully reveal the distribution of sedimentary parameters in three-dimensional space [15,16,17,18]. Dense well-network statistics can obtain high-precision local data but are constrained by exploration costs and well density, hindering systematic research at regional or global scales [19,20,21,22]. For braided river deltas in complex terrains or inaccessible regions, conventional methods face significant limitations in data acquisition [4,13].
Since its launch in 2005, the Google Earth platform has become an important technical tool in geological research, leveraging its high-resolution satellite imagery, global seamless coverage, and open-access features. Early applications focused on macro-geological structure analysis and basic database construction: Yang et al. [23] revealed the controlling mechanism of an X-type conjugate fault system on regional karst development through image interpretation; Zhang et al. [24] established a quantitative system for meandering river morphological parameters based on data from the Jialing River basin, demonstrating the global uniqueness of channel sinuosity and wavelength in this reach; Li et al. [25] constructed a quantitative model, linking channel width and point-bar length through modern river morphology measurements, providing key parameter constraints for fluvial reservoir architecture research. In sedimentology, Shi Shuyuan et al. [13] were the first to use this platform to measure modern sedimentary data of meandering rivers, establishing a geological knowledge base including parameters such as sinuosity and wavelength, which promoted the application of remote sensing technology in quantitative sedimentary parameter research.
However, current research on braided river deltas still has notable shortcomings. Methodologically, early geological knowledge base construction relied heavily on single technical approaches: dense well-network analysis focused on local sandbody geometric parameters, outcrop surveys emphasized sedimentary facies proportion statistics, satellite remote sensing was limited to surface morphological parameter extraction [13], and 3D seismic analysis was constrained by the resolution of deep reservoirs [26,27]. Although some scholars have attempted to integrate multi-source data in recent years [28], constructing multi-level knowledge bases for sandy braided rivers through a combination of dense well networks, satellite imagery, and modern sedimentary surveys, these studies remain regional in scope and lack systematic global comparisons and dynamic mechanism analysis.
In terms of research content, existing achievements mostly remain at the level of single-parameter description, with insufficient exploration of the coupling relationships between parameters such as wavelength, amplitude, channel bifurcation angle, and bifurcation spacing, as well as their sedimentary dynamic significance. Addressing these research gaps, this study utilizes the global coverage advantage of the Google Earth platform to systematically collect sedimentary parameters (wavelength, amplitude, channel bifurcation angle, bifurcation spacing) from eight typical braided river deltas, including the Saloum River, Rufiji River, Lena River, and Poyang Lake. To address the above issues, this study constructs a dataset of eight end-member braided river deltas using tectonic activity (high/low), climatic humidity (high/moderate/low), and provenance type (terrigenous/mixed-source) as screening dimensions. The cases include the Rufiji delta in the East African Rift Zone (high tectonic activity, tropical climate), the Po delta in the Apennine foreland basin (low tectonic activity, humid climate), and the Lena delta in the polar tundra region (low tectonic activity, cold climate), among others.

2. Materials and Methods
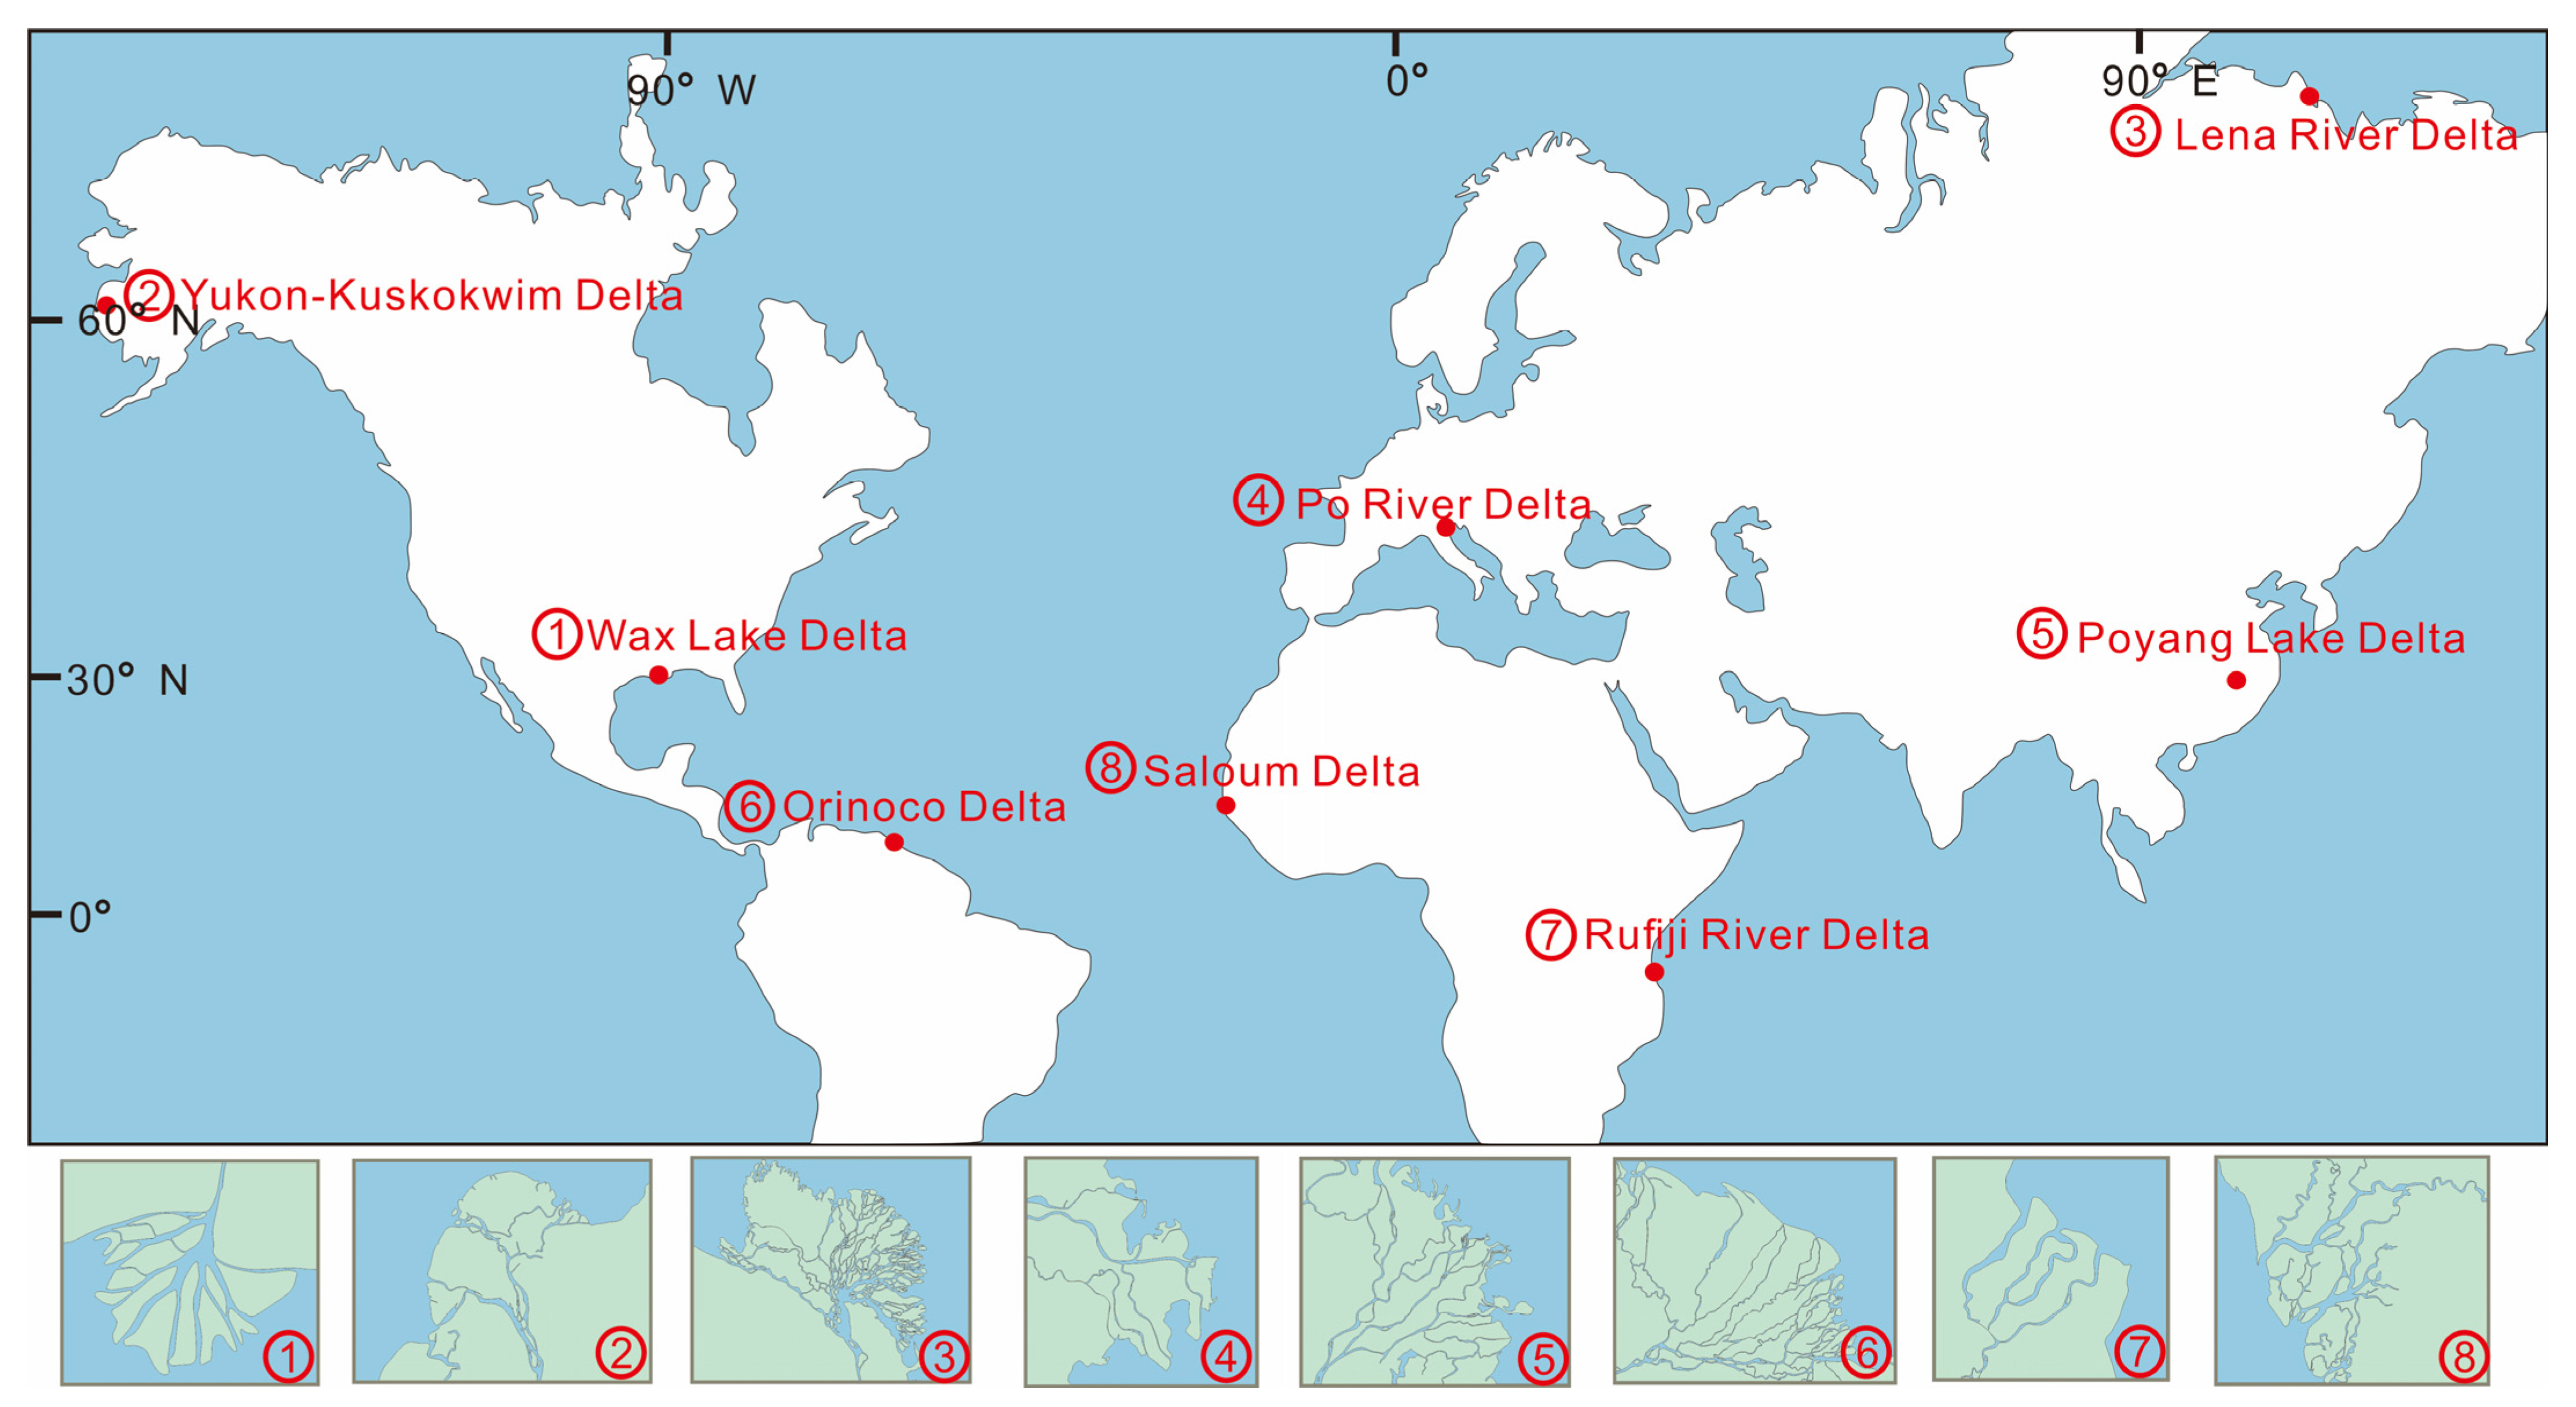
2.1. Study Area

The data in this study are derived from eight typical braided river delta systems worldwide: Wax Lake, Yukon–Kuskokwim delta, Lena River, Po River, Poyang Lake, Orinoco, Rufiji River, and Saloum delta.
The formation of braided river deltas is a complex geological process governed by the interplay of fluvial processes, marine (or lacustrine) dynamics, wind forces, biological activities, and the sediment supply [8]. When rivers carrying abundant sediments reach the basin margin, sediment deposition initiates due to the combined effects of reduced flow energy, marine/lacustrine backwater, and wind-induced sediment redistribution [15]. In the initial development stage, frequent channel bifurcation and avulsion create intricate channel networks, during which bioturbation from benthic organisms may also modify sedimentary structures. As sediment accumulates over time, the delta progrades towards the basin center, sequentially developing the delta plain, delta front, and prodelta sub-facies.
Several factors significantly determine the sedimentation rate of braided river deltas. The sediment supply remains a primary control, encompassing not only fluvial-derived clastics but also aeolian sediments in some regions. For example, the Yukon–Kuskokwim delta sustains continuous sedimentation not only from substantial terrigenous inputs but also from wind-transported sands [29]. Hydrodynamic conditions play a crucial role, with strong fluvial currents enhancing sediment transport and deposition through lateral erosion and vertical aggradation [1]. Marine processes, including waves, tides, and extreme events like storm surges, can rework deltaic sediments, altering deposition rates and patterns. Topography also impacts sedimentation; steeper slopes facilitate rapid sediment accumulation, while gentle slopes promote sediment dispersion. Additionally, local bathymetric variations can guide sediment distribution. Tectonic activities indirectly regulate sedimentation rates by controlling basin subsidence. Rapid subsidence in tectonically active zones provides more accommodation space, enabling higher sedimentation rates. Moreover, changes in the regional stress field can induce channel migration and avulsion, further influencing the depositional process.

2.2. Data Acquisition and Processing

High-resolution satellite imagery covering delta plain, front, and prodelta sedimentary units is extracted using the Google Earth Pro platform (Figure 1) [15]. This study obtained high-resolution satellite imagery through the Google Earth Pro platform, with the image shooting time concentrated from July 2018 to October 2022. During this period, the vegetation coverage is low and the water transparency is high, which is conducive to the clear identification of river channel boundaries and sedimentary units. Straight-line distances are measured in “Line mode” via the “Add path” tool on orthoimages, while curved distances (defined as bifurcation spacing) are obtained by switching to “Path mode”, adding anchor points along channel bends, and generating automatic curve lengths. High-definition images are exported to CorelDRAW Graphics Suite 2022 (Version number: 24.1.0.360, released on 15 June 2022) (Figure 2), where sub-channel centerlines are fitted with the bifurcation point as the origin, and the included angle between two channels is measured using the “angle measurement tool” (Table 1).
In this study, the morphological data of braided river deltas were manually digitized using Google Earth (resolution of 5–15 m/pixel) and CorelDRAW software. Affected by the image resolution and the subjectivity of human measurement, there are two main types of errors in the data: positional deviation and measurement repeatability error.
The limitation in image resolution directly affects the measurement accuracy. According to the research of Lillesand et al. [30], a manual picking deviation of 10 pixels will lead to an actual positional error of 50–150 m (calculation method: positional error = pixel deviation × image resolution). This error has significantly different impacts on parameters at different scales: within the wavelength dataset range of this study (1500–4000 m), a 150 m error accounts for 3–10%; for small-scale amplitude parameters (such as the average amplitude of the Saloum River delta being 680 m), the proportion of the same error is as high as 22% (Table 2). To control the error, the manual picking accuracy in this study is strictly limited to ≤5 pixels (corresponding to an error of 25–75 m), reducing the positional error by 50% compared to the theoretical maximum value. Nevertheless, small-scale parameters are still greatly affected. Taking the Saloum River delta as an example, the measured amplitude value may fluctuate by ±10–22% due to errors.
The measurement repeatability error stems from the differences in the subjective judgments of the measurers. In this study, through three independent digitizations of four deltas, the mean absolute deviation of the wavelength measurement is calculated to be 8.7%, and the amplitude deviation is 12.3%, which is in line with the error range of manual digitization (5–15%) proposed by Goodchild [31]. To reduce this error, three measurements are carried out for key feature points (such as river channel inflection points and tributary intersection points), outliers are removed, and the average value is taken.

3. Results and Discussion

3.1. Sedimentary Parameter Distribution Characteristics

This study analyzes the distribution characteristics of sedimentary parameters based on the basic parameters of eight typical braided river deltas (Figure 3) across diverse tectonic and climatic settings worldwide (Table 3).

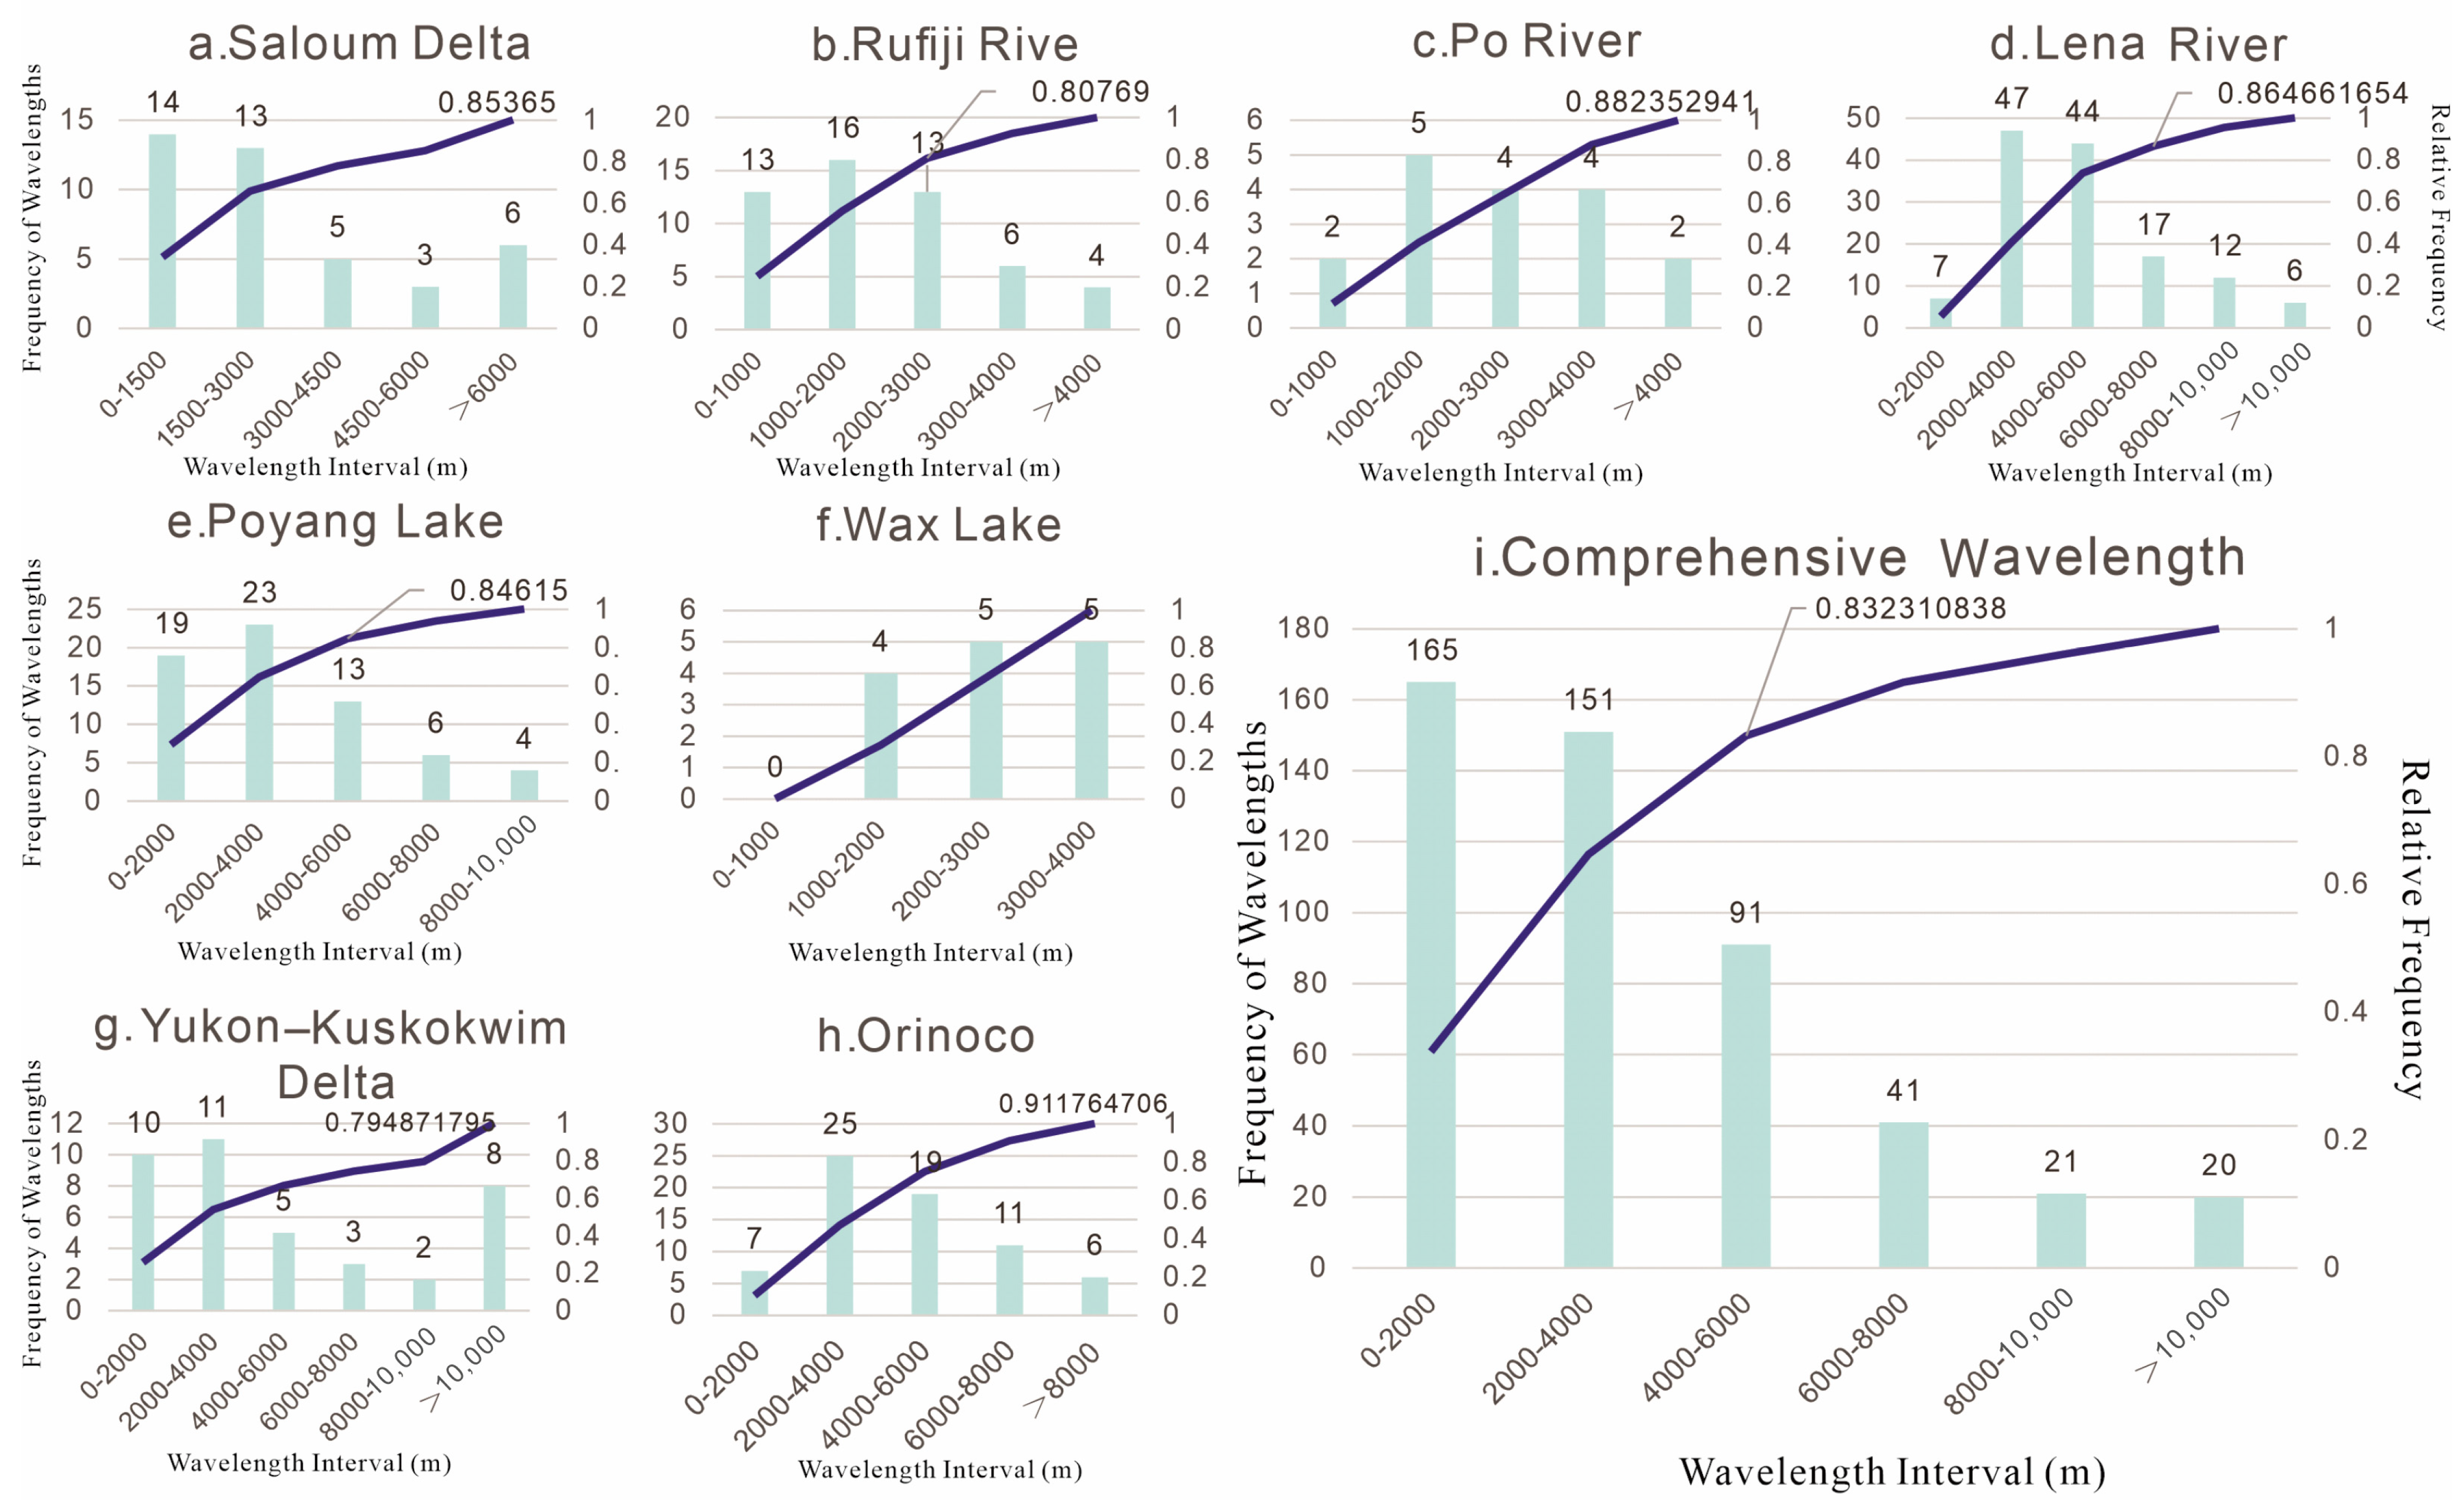
3.1.1. Wavelength Distribution

Figure 4a shows Saloum delta’s wavelength distribution, with 80% < 4500 m. Figure 4b displays Rufiji River’s 80% wavelengths < 3000 m (30% in 2000–3000 m). Figure 4c indicates Lena River’s 80% wavelengths < 8000 m (45% in 0–5000 m). Figure 4d shows Poyang Lake’s 80% wavelengths < 4000 m (54% in 0–2000 m). Figure 4e illustrates Yukon–Kuskokwim delta’s 80% wavelengths < 10,000 m. Figure 4f presents Orinoco’s 80% wavelengths < 6000 m (36% in 2000–4000 m). Figure 4g shows Wax Lake’s 80% wavelengths < 4000 m. Figure 4h displays Po River’s 80% wavelengths < 4000 m (59% in 0–1000 m).
Short-wavelength deltas (with 80% of wavelengths < 4000 m) mostly develop in proximal steep-slope environments. Xu et al. indicated through numerical simulations and modern sedimentary analyses of the Rimaozhou delta in Poyang Lake that strong currents in proximal areas are rapidly distributed due to topographic constraints, forming short-wavelength deposits dominated by dendritic sandbars. The characteristic that 80% of their sandbody wavelengths are < 4000 m is highly consistent with the measured data from the Wax Lake and Po River deltas (80% of wavelengths < 4000 m, with 59% in the 0–1000 m interval), reflecting the coupled control of high sediment supply (annual sediment load > 10 million tons) and slopes > 0.3° [32]. As can be seen from Table 3, the Wax Lake and Po River deltas, which are typical short-wavelength deltas, also exhibit relatively high river network densities (5–8 km/km2 and 6–8 km/km2, respectively) compared to larger-sized deltas. This indicates that in addition to the sediment supply and slope, a high river network density may also contribute to the formation of short-wavelength features in these proximal environments.
Long-wavelength deltas are associated with distal gentle-slope settings. The statistical analysis of the Lena River delta shows that 80% of wavelengths are < 8000 m, with 45% in the 0–5000 m interval, which is closely related to its massive distal supply (annual runoff of 1.4 × 10¹² m3 and sediment load of 210 × 106 tons) and gentle slopes, consistent with the “distal long-flow-path promoting lateral sandbody extension” model proposed by Syvitski et al. [29]. Studies on the Ob River delta demonstrate that under gentle slopes (0.1–0.15°) and low-energy water conditions, distributary channels continuously prograde to form long-wavelength sandbodies extending 30–50 km, the wavelength distribution characteristics of which align with the sedimentary dynamic model established by Wang et al. [33]. The 36% proportion of 2000–4000 m wavelengths in the middle Orinoco River reflects the control of high-frequency channel avulsions on sandbody stacking, consistent with Milliman et al.’s [34] research on channel evolution in high-sediment-load deltas.

3.1.2. Amplitude Distribution

Figure 5a shows Saloum delta’s 80% amplitudes < 2800 m (41% < 700 m). Figure 5b displays Rufiji River’s 80% amplitudes < 1200 m. Figure 5c indicates Lena River’s 80% amplitudes < 3000 m (46% in 1000–2000 m). Figure 5d shows Poyang Lake’s 80% amplitudes < 2000 m. Figure 5e illustrates Yukon–Kuskokwim delta’s 80% amplitudes < 3000 m. Figure 5f presents Orinoco’s 80% amplitudes < 3000 m (35% in 1000–2000 m). Figure 5g shows Wax Lake’s amplitude distribution. Figure 5h displays Po River’s 80% amplitudes < 1500 m.
The development of high-amplitude deltas is closely associated with strong seasonal flooding or steep topographic slopes, where rapid sediment unloading under such conditions tends to form thick gravel–sand bodies. Flume tank experiments by Chen et al. showed that high-amplitude delta fronts are often accompanied by multi-cycle sedimentary complexes, consistent with the rapid accumulation process under strong hydrodynamic conditions [35]. In contrast, low-amplitude deltas are controlled by gentle topography or stable currents, leading to uniform sediment distribution and the formation of sheet-like sandbodies. Syvitski et al.’s global synthesis of deltas indicated that such environments favor the development of low-relief deposits, which matches the uniform amplitude distribution observed in Po River sediments [29]. The 46% proportion of 1000–2000 m amplitudes in the middle Lena River reflects periodic stacking caused by a cyclic sediment supply, consistent with Milliman et al.’s observations on channel evolution in high-sediment-load river deltas [34].
As a comprehensive response to depositional energy and topographic control, amplitude characteristics provide critical insights for subsurface reservoir characterization: high-amplitude areas indicate the development of thick sandbodies under strong hydrodynamic conditions, while low-amplitude areas signal extensive sandbody distribution in stable depositional environments. Together, these features offer geological constraints for the prediction and evaluation of deltaic reservoirs.

3.1.3. Nonlinear Wavelength–Amplitude Coupling

Through fixed-point measurements and the fitting analysis of the channel width and amplitude in modern braided river deltas, functional relationships under different depositional backgrounds have been established, revealing distinct characteristics of the sediment supply, hydrodynamic conditions, and channel evolution:
  • Wax Lake: y = 4 × 10−5x2 − 0.0027x + 321.49 (R2 = 0.7446)
  • Yukon–Kuskokwim Delta: y = 5 × 10−6x2 + 0.1558x + 635.12 (R2 = 0.8706)
  • Lena River: y = −5 × 10−6x2 + 0.3414x + 391.15 (R2 = 0.5712)
  • Po River: y = −3 × 10−6x2 + 0.3776x − 88.08 (R2 = 0.9127)
  • Poyang Lake: y = −2 × 10−5x2 + 0.4272x − 36.058 (R2 = 0.6666)
  • Orinoco: y = 7 × 10−6x2 + 0.2382x + 468.16 (R2 = 0.8852)
  • Rufiji River: y = −5 × 10−5x2 + 0.5874x − 115.71 (R2 = 0.537)
  • Saloum Delta: y = −9 × 10−6x2 + 0.4485x + 114.59 (R2 = 0.7459)
The Po River delta (R2 = 0.9127) and Yukon–Kuskokwim delta (R2 = 0.8706) show strong model fits, characterized by negative and positive quadratic coefficients, respectively. The Po River’s negative quadratic term (−3 × 10⁻⁶) suggests a decelerating growth of wavelength with increasing amplitude, likely influenced by wave-dominated delta destruction, where higher amplitudes (e.g., wave energy) constrain channel wavelength expansion. In contrast, the Yukon–Kuskokwim delta’s positive quadratic term (5 × 10⁻⁶) reflects an accelerating relationship, consistent with its river-dominated constructive setting, where the stable fluvial input promotes proportional increases in both wavelength and amplitude.
Systems like the Rufiji River delta (R2 = 0.537) and Lena River delta (R2 = 0.5712) exhibit weak model performance, attributed to complex depositional dynamics. The Rufiji River’s steep positive linear term (0.5874) and highly negative quadratic term (−5 × 10⁻⁵) indicate a concave–down relationship, possibly driven by intense tidal reworking that limits wavelength growth at large amplitudes. The Lena River’s low R2 may reflect ice-rich sediment characteristics and seasonal discharge fluctuations, introducing noise into morphometric measurements.
Equations with positive quadratic terms (e.g., Wax Lake: 4 × 10⁻⁵; Orinoco: 7 × 10⁻⁶) suggest wavelength increases superlinearly with amplitude, typical of constructive deltas where fluvial processes dominate and the sediment supply outpaces reworking. This supports the hypothesis that unidirectional fluvial energy promotes scalable channel patterns.
Negative quadratic terms (e.g., Saloum delta: −9 × 10⁻⁶; Po River: −3 × 10⁻⁶) indicate sublinear wavelength–amplitude scaling, characteristic of destructive deltas influenced by tidal or wave energy. Here, the increased amplitude (e.g., tidal range) introduces lateral channel migration or bifurcation, decoupling wavelength from simple quadratic scaling.
While quadratic regression effectively captures first-order relationships in stable depositional environments, its applicability diminishes in systems with complex hydrodynamics or measurement uncertainties (e.g., Rufiji River delta, R2 = 0.537). The quadratic framework provides a useful first approximation but must be contextualized within delta-specific depositional mechanisms. Regional variability in model performance highlights the need for process-based mechanistic models rather than universal empirical fits.

3.1.4. Angle Distribution

Angles describe depositional structure dip. The analysis shows that Wax Lake, Yukon–Kuskokwim delta, Lena River, Po River, Poyang Lake, and Orinoco have 80% angles < 90°, while Rufiji River has 80% angles < 120°. Lena River and Poyang Lake exhibit 53% and 65% angles between 30 and 60°, respectively. Most deltas (e.g., 65% in Poyang Lake, 53% in Lena River) show 30–60° angle concentrations, except Rufiji River, which shows higher angles (Figure 6).
Angle variations relate to depositional slope and flow intensity. Moderate angles (30–60°) indicate balanced environments with frequent channel migration, while high angles (e.g., Rufiji River) suggest steep slopes or strong erosion similar to fan delta front structures. Braided river deltas on Songliao Basin’s western slope exhibit high-angle sandbody stacking due to “east-dipping steep slope” settings.

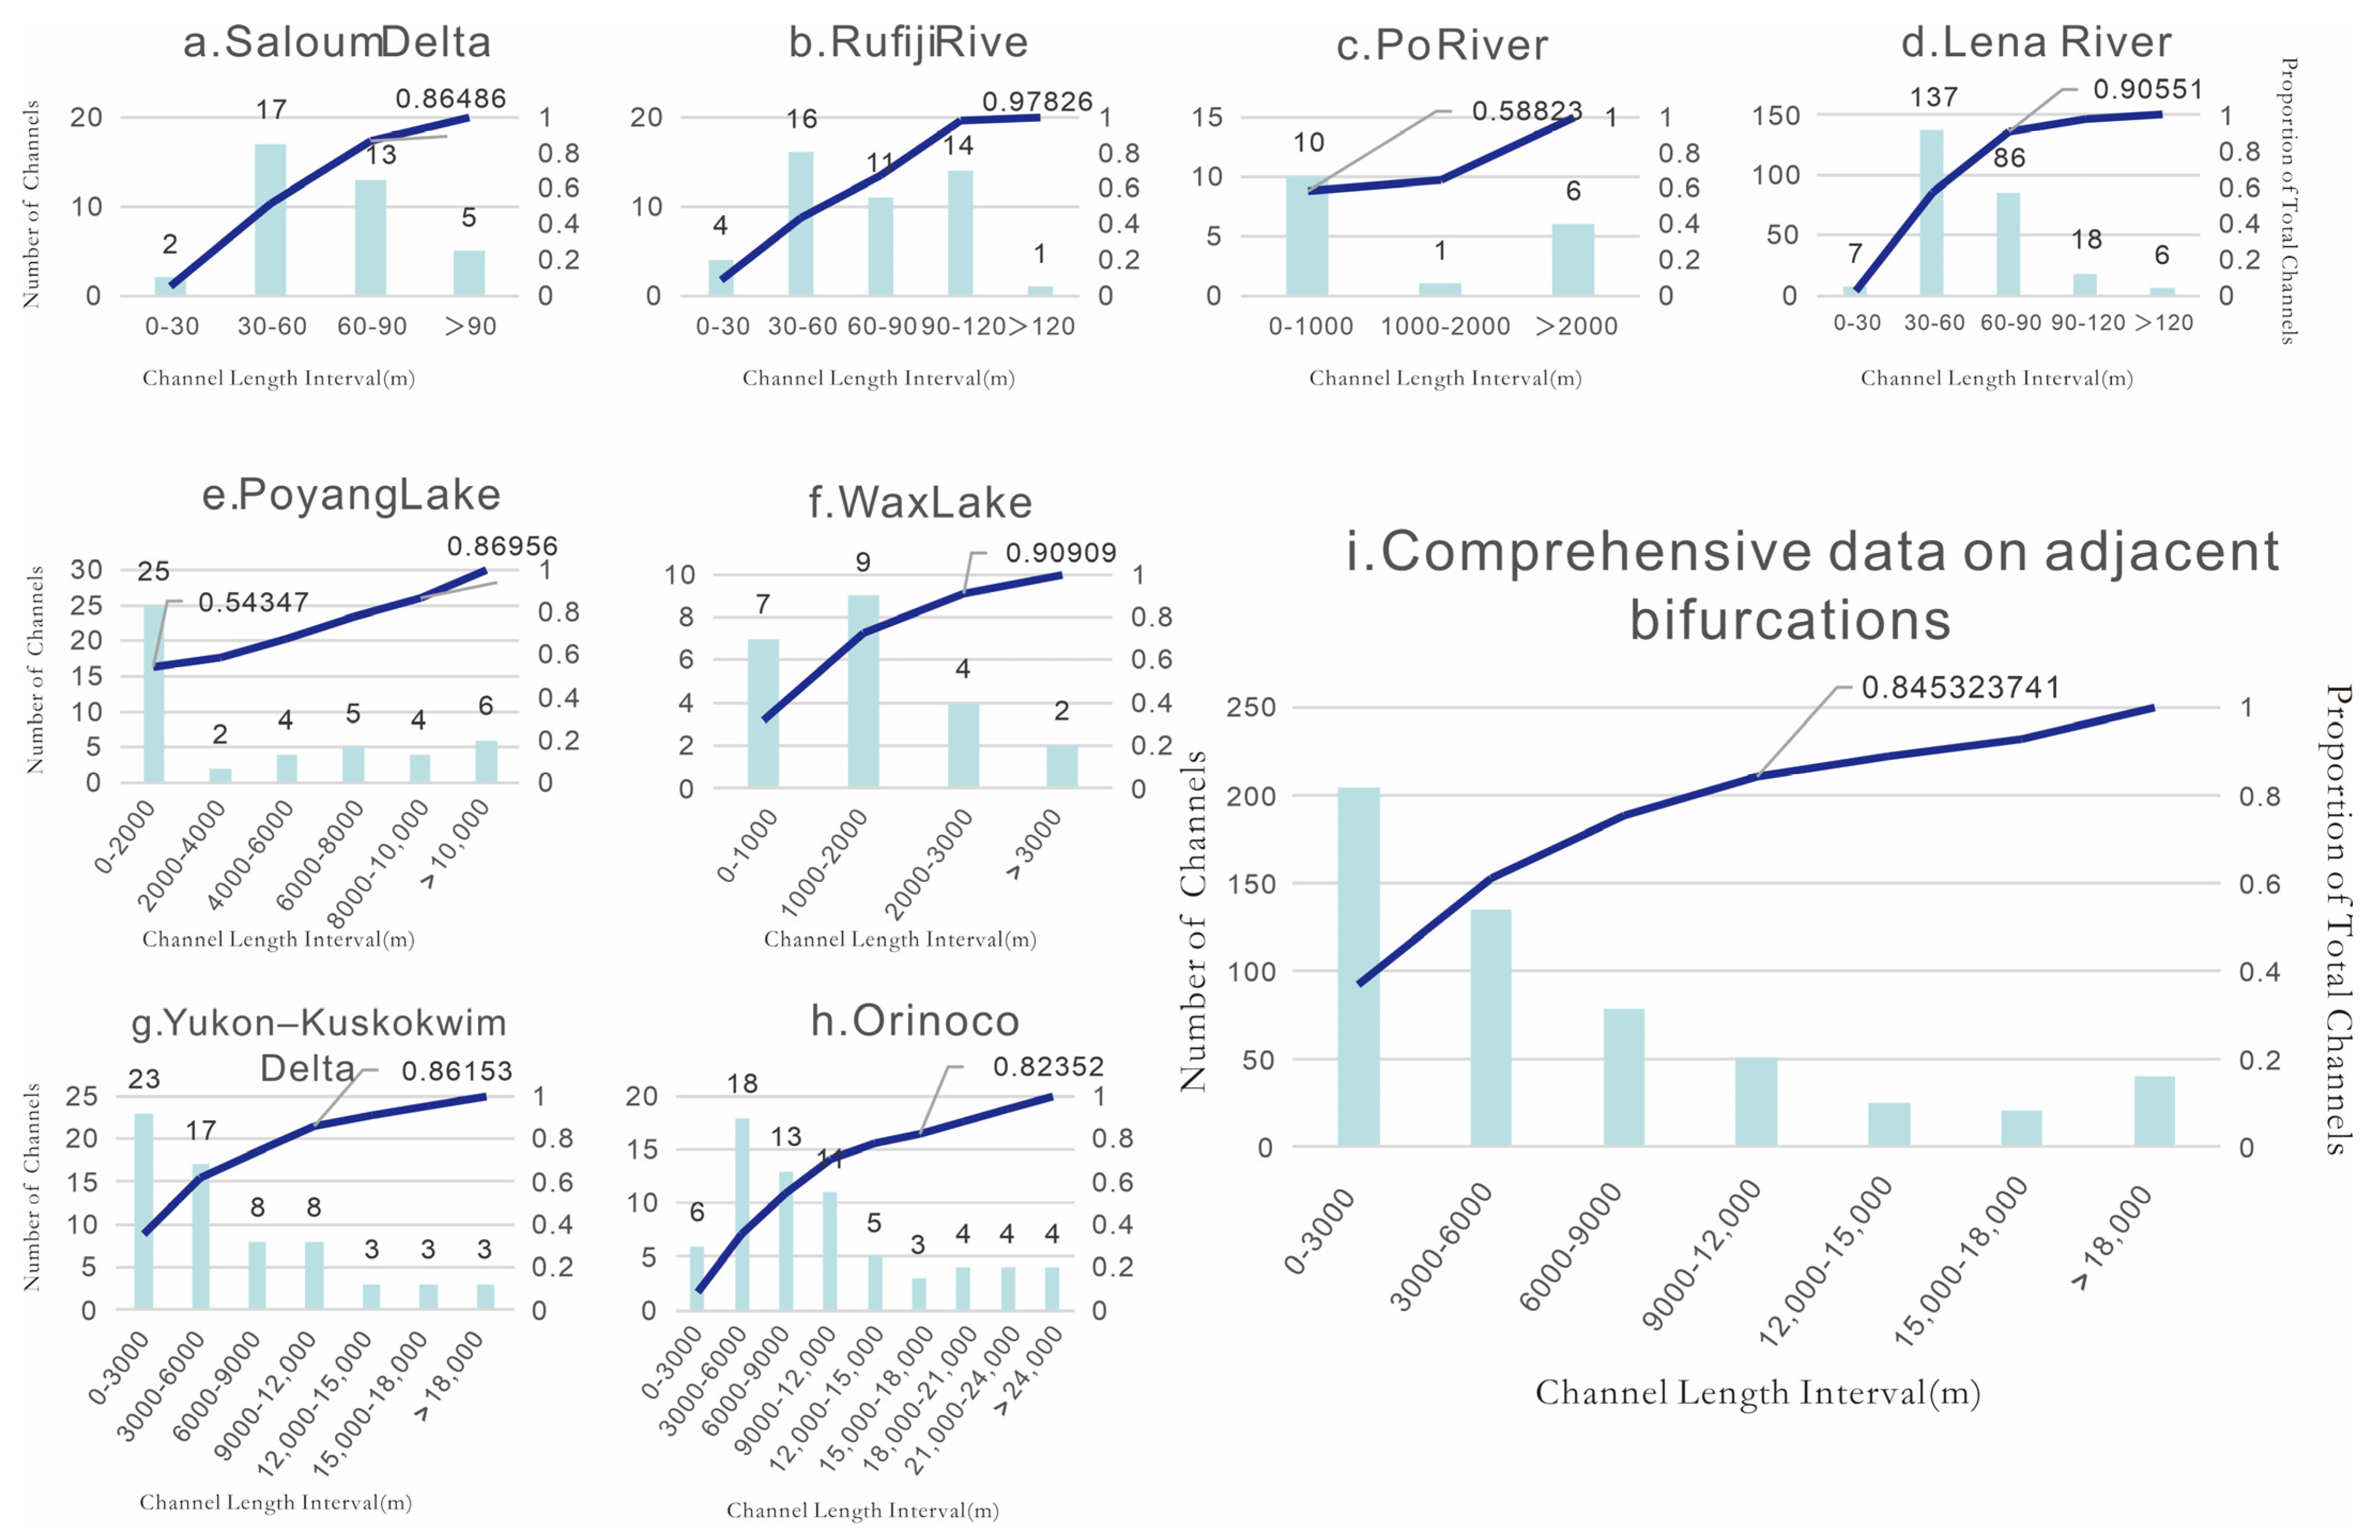
3.1.5. Adjacent Bifurcation Spacing

In deltas such as Wax Lake, Kotlik, Lena River, Po River, Poyang Lake, and Orinoco, 80% of bifurcation angles concentrate below 90°, with Poyang Lake (65%) and Lena River (53%) showing the highest proportions in the 30–60° interval (Figure 7). This reflects that braided channels primarily bifurcate at moderate angles, corresponding to a depositional environment with balanced hydrodynamic energy and frequent channel migration, where sandbodies are mostly distributed in network or dendritic patterns. Moderate bifurcation angles (30–60°) commonly develop in gentle-slope settings, such as the Poyang Lake delta, where stable hydrodynamic conditions promote moderate channel bifurcation, forming dendritic sandbar complexes [32].
The Lena River delta, driven by a massive sediment supply, exhibits moderate yet sustained hydrodynamic energy, leading to dominant moderate-angle bifurcations and strong sandbody stacking.
The bifurcation angle characteristics of the braided river delta in the Yao second and third members of the Yingtai area, Songliao Basin, are closely related to its “proximal source and short flow path” depositional background. Influenced by the east-dipping steep slope topography, concentrated hydrodynamic energy causes channels to primarily bifurcate at 60–80°, forming tabular and trough cross-beddings in underwater distributary channel microfacies. Such high-angle bifurcations result in lenticular sandbody stacking, which, despite good connectivity, exhibits strong heterogeneity due to local topographic abruptions, making it a favorable reservoir unit for hydrocarbon enrichment.

3.2. Assessing Threshold Significance and Data Quality for Delta Morphometry

For the analysis of the 80% threshold of the morphometric parameter “adjacent angle”, this study supplements statistical tests and evaluates the impact of missing data. Taking the Poyang Lake delta, Wax Lake, Po River, and Rufiji River as examples, listwise deletion was first used to handle missing values, retaining forty-seven (87%), five (23%), thirty (100%), and forty-five (87%) valid samples, respectively. The sensitivity analysis showed that the 80% threshold of the Poyang Lake delta differed by only 2.4% between listwise deletion (50.1°) and mean imputation (51.3°), indicating a negligible impact of missing data on threshold calculation. Given that the Kolmogorov–Smirnov test revealed non-normal distributions for all delta data (all p < 0.05) and Levene’s test confirmed heterogeneous variances (p = 0.018), a Kruskal–Wallis nonparametric test was employed, revealing highly significant differences in the distribution of “adjacent angles” among deltas (H = 12.73, p = 0.005). Further, Mann–Whitney U tests with Bonferroni correction showed that the 80% threshold of the wave-dominated Po River delta (59.2°) was significantly higher than that of the tide-dominated Poyang Lake delta (50.1°, p = 0.003), reflecting the regulatory effects of sedimentary dynamic environments on channel bifurcation characteristics. These analyses demonstrate that the threshold differences of “80% of samples < X meters” are statistically significant rather than accidental results of empirical settings, and missing data did not substantially interfere with the robustness of the conclusions.

3.3. Construction of Geological Knowledge Base

A geological knowledge base is critical for reservoir modeling and hydrocarbon exploration, providing statistical parameters and boundary conditions. For braided river deltas, knowledge base construction aids systematic sedimentary feature summarization and supports hydrocarbon exploration by offering quantitative foundations for sedimentary process simulation and reservoir prediction.
  • Upper (Plain): The upper plain zone develops in proximal gentle slopes or plain environments, characterized by vertically stacked braided channels, controlled by stable hydrodynamic conditions and sustained sediment supply. Channel migration is dominated by vertical aggradation, forming thick, continuous, and well-connected sandbodies with stable thickness, commonly displaying a large-scale cross-bedding, scouring surfaces, and gravel lag deposits—features reflecting rapid accumulation under strong hydrodynamic forces. The sediment supply intensity is a core controlling factor, with the annual sediment input typically exceeding 10 million tons, primarily composed of medium-to-coarse sands of moderate maturity. The gravel content decreases with an increasing distance from the source. The channel width is significantly influenced by the sediment grain size: according to Google Earth measurements, typical widths range from 500 to 2000 m, with widths exceeding 3000 m in coarse-clastic supply areas. Individual channel sandbodies are 5–15 m thick, stacking vertically to form total thicknesses of 20–40 m. Logging curves display box-shaped or serrated box-shaped patterns, indicative of high-quality reservoir development.
  • Middle (Front): The middle front zone is characterized by the complex lateral migration of subaqueous distributary channels, exhibiting positive rhythmic changes in sandbody thickness from land to lake (decreasing sandbody thickness and increasing mud content). Channel morphology transitions from reticular to dendritic, developing microfacies such as mouth bars and distal sandbars, with sandbodies often separated by interdistributary bay mudstones. Reservoir connectivity is directly influenced by channel spacing, sandbody thinning rate, and lateral migration frequency. Channel spacing is regulated by bifurcation angles: low-angle bifurcations (<45°) correspond to dense channel networks (100–300 m), while high-angle bifurcations (>60°) form isolated sandbodies (300–500 m). Sandbody thinning rates are < 1 m/km in gentle-slope areas (e.g., Lena River delta) and can exceed 3 m/km in steep-slope areas (e.g., Rufiji River delta), reflecting the gradient of the sediment supply energy decay. These parameters directly control reservoir connectivity and serve as key inputs for building geological models.
  • Lower (Prodelta): The lower prodelta zone is located in the deep-water area of the lake basin, characterized by interbedded thin sheet sands and thick mudstones, with a weak provenance influence and dominance of fine-grained sediments. Sheet sands are distributed as lenticular or tabular strips, 1–5 m thick and covering 5–10 km2 in the plan view, controlled by subtle paleotopographic undulations. Mudstones account for over 80% of the section, with individual beds 20–50 m thick, developing horizontal bedding and bioturbation structures. Carbon–oxygen isotopes indicate a lacustrine reducing environment, endowing an excellent sealing capacity.

Key Parameter Analysis

  • Wavelength and Bifurcation Spacing: Small-spacing areas like Poyang Lake (54% < 2000 m) form isolated lobes as stratigraphic traps.
  • Amplitude and Sandbody Thickness: High-amplitude regions like Yukon–Kuskokwim delta correspond to thick sands but require caution for mudstone interlayers forming structural-lithologic traps.
  • Angle and Palaeoslope: 30–60° angle concentrations (e.g., Lena River, 53%) indicate balanced depositional backgrounds favorable for structural-stratigraphic traps.

4. Conclusions

This study systematically analyzed sedimentary parameters of eight global braided river deltas using Google Earth, integrating advanced data processing and statistical methods, and drew the following key conclusions:
  • Google Earth proves to be an effective tool for quantitative multi-parameter extraction. Through sensitivity analysis and listwise deletion for missing data, reliable morphological parameters were obtained. The quadratic relationships between channel wavelength and amplitude (R2 = 0.537–0.913) reflect nonlinear energy distribution during sedimentation. Positive quadratic coefficients, as seen in the Yukon–Kuskokwim delta, indicate high sediment supply, while negative ones, such as in the Poyang Lake delta, are associated with energy dissipation due to channel avulsion.
  • Parameter distributions show significant correlations with depositional environments. Statistical tests, including Kruskal–Wallis (H = 12.73, p = 0.005) and Mann–Whitney U tests, reveal that short wavelengths (<4000 m) mainly occur in proximal settings, where the sediment supply is abundant. High amplitudes (average > 800 m) are typical of rapid deposition areas, often found in the upper plain zones of deltas. For example, 65% of bifurcation angles cluster at 30–60°, reflecting balanced hydrodynamics, which is distinct from fan deltas.
  • The nonlinear coupling of wavelength and amplitude provides a solid quantitative basis for sedimentary dynamics analysis. This relationship not only helps explain the formation mechanisms of different deltaic facies but also enables the prediction of sedimentary patterns. For instance, the negative correlation between bifurcation spacing and sediment supply is demonstrated by the fact that 54% of Poyang Lake delta’s spacings are <2000 m, indicating dense channel networks, while 80% of Lena River delta’s spacings are <15,000 m, suggesting stable main channels.
  • A three-zone geological knowledge base model was established, integrating statistically validated thresholds. The model categorizes deltas into upper plain, middle front, and lower prodelta zones, each characterized by specific parameter ranges. By parameterizing sedimentary characteristics, this model effectively guides the exploration of subtle hydrocarbon reservoirs. For example, the model can predict reservoir connectivity based on channel bifurcation angles and wavelength–amplitude relationships, providing critical inputs for reservoir prediction and enhancing the accuracy of hydrocarbon exploration in complex basins.

Author Contributions

Conceptualization, X.Y. and M.D.; writing—original draft preparation, X.Y.; writing—review and editing, S.L. All authors have read and agreed to the published version of the manuscript.

Funding

This research received no external funding.

Institutional Review Board Statement

Not applicable.

Informed Consent Statement

Not applicable.

Data Availability Statement

The original contributions presented in this study are included in the article. Further inquiries can be directed to the corresponding author.

Conflicts of Interest

The authors declare no conflicts of interest.

References

  1. Bhattacharya, J.P.; Willis, B.J. Lowstand Deltas in the Frontier Formation, Powder River Basin, Wyoming: Implications for Sequence Stratigraphic Models. AAPG Bull. 2001, 85, 261–294. [Google Scholar]
  2. Wang, W.; Li, W.; Gao, Y.; Ma, B. Evaluation of reservoir heterogeneity in braided river delta fronts. J. Yangtze Univ. (Nat. Sci. Ed.) 2012, 9, 61–63, 3. [Google Scholar]
  3. Li, Y.; Che, Q.; Xin, R. Sedimentary Characteristics of Braided River Deltas in the Yao 2nd and 3rd Members of the Yingtai Area, Western Slope of Songliao Basin. J. Chang. Coll. Geol. 1993, 4, 405–410. [Google Scholar]
  4. He, Y.; Fang, Y.; Feng, W.; Liu, Y.; Fan, Y.; Guo, H.; Zhang, P.; Jia, F. Sedimentary Characteristics and Growth Evolution of Braided River Deltas: A Flume Simulation Experiment Study. Geol. Rev. 2023, 69, 1564–1580. [Google Scholar] [CrossRef]
  5. Zhou, H.; Wang, X.; Liu, Z.; Deng, H. Sedimentation of Braided River Deltas in the Upper Triassic Huangshanjie Formation, Southern Margin of Junggar Basin. J. Palaeogeogr. 2006, 2, 187–198. [Google Scholar]
  6. Liu, X.; Mou, Z. Architecture Modeling of Braided River Delta Reservoirs: A Case Study of the Braided River Delta in Block B of Oilfield A, Qaidam Basin. In Proceedings of the 15th National Conference on Palaeogeography and Sedimentology, Chengdu, China, 14 September 2018; p. 1. [Google Scholar]
  7. Ge, J.; Zhu, X.; Wu, C.; Zhang, X.; Jia, L.; Yi, Z.; Xiao, Z. Sedimentary Characteristics and Genetic Differences of Braided River Deltas: A Case Study of the Enping Formation in the Lufeng Sag, Pearl River Mouth Basin. Acta Pet. Sin. 2019, 40, 139–152. [Google Scholar]
  8. Galloway, W.E.; Hobday, D.K. Terrigenous Clastic Depositional Systems: Applications to Petroleum, Coal, and Uranium Exploration; Springer-Verlag: Berlin/Heidelberg, Germany, 1983. [Google Scholar] [CrossRef]
  9. Bridge, J.S.; Tye, R.S. Interpreting the Dimensions of Ancient Fluvial Channel Bars, Channels, and Channel Belts from Wireline-Logs and Cores. AAPG Bull. 2000, 84, 1717–1750. [Google Scholar] [CrossRef]
  10. He, W.; Li, S.; Wang, R.; Huang, X.; Chen, C.; Ding, F. Sandy braided river architecture characteristics and evolution: A case study from outcrops in the Middle Jurassic Yungang Formation, Datong, Shanxi province. Acta Sedimentol. Sin. 2024, 42, 1699–1710. [Google Scholar] [CrossRef]
  11. Zhao, X.; Bao, Z.; Liu, Z.; Sun, Y.; Chen, C.; Yu, X.; Li, S.; Wang, Y.; Yang, S.; Wu, L. An In-Depth Analysis of Reservoir Architecture of Underwater Distributary Channel Sand Bodies in a River-Dominated Delta: A Case Study of T51 Block, Fuyu Oilfield. Pet. Explor. Dev. 2013, 40, 194–201. [Google Scholar] [CrossRef]
  12. Lei, T.; Mo, S.; Li, X.; Jiang, N.; Zhu, C.; Wang, Q.; Qu, X.; Wang, J. Sandbody superimposition patterns and oil and gas exploration significance of Permian Shanxi Formation in Daniudi gas field. Ordos Basin. Lithol. Reserv. 2024, 36, 147–159. [Google Scholar] [CrossRef]
  13. Shi, S.; Hu, S.; Feng, W.; Liu, W. Building Geological Knowledge Database Based on Google Earth Software. Acta Sedimentol. Sin. 2012, 30, 869–878. [Google Scholar] [CrossRef]
  14. Wang, Q.; Yong, L. Reservoir Response Characteristics of Different Facies Zones in Braided River Deltas. Geol. China 2023, 50, 971–980. [Google Scholar]
  15. Jia, A.; Mu, L.; Chen, L.; Huang, S. Fine Research Methods for Fan Delta Reservoir Outcrops. Acta Pet. Sin. 2000, 4, 105–108, 125. [Google Scholar]
  16. Cao, T.; Yao, Z.; Dileqiatijia, N.; Yang, F. Sedimentary Characteristics and Models of the Badaowan Formation Outcrops in Tuziaqineigou, Northwestern Margin of Junggar Basin. Sci. Technol. Eng. 2021, 21, 5695–5709. [Google Scholar]
  17. Lowry, J.; Jacobsen, R. Sedimentological and Reservoir Characteristics of a Fluvial-Dominated Delta-Front Sequence: Ferron Sandstone Member (Turonian), East Central Utah, U.S.A. Geol. Soc. 1993, 69, 81–104. [Google Scholar] [CrossRef]
  18. Fabuel-Perez, I.; Hodgetts, D.; Redfern, J. A New Approach for Outcrop Characterization and Geostatistical Analysis of a Low-Sinuosity Fluvial-Dominated Succession Using Digital Outcrop Models: Upper Triassic Oukaimeden Sandstone Formation, Central High Atlas, Morocco. AAPG Bull. 2009, 93, 795–827. [Google Scholar] [CrossRef]
  19. Gugliotta, M.; Flint, S.S.; Hodgson, D.M.; Veiga, G.D. Recognition Criteria, Characteristics and Implications of the Fluvial to Marine Transition Zone in Ancient Deltaic Deposits (Lajas Formation, Argentina). Sedimentology 2016, 63, 1971–2001. [Google Scholar] [CrossRef]
  20. Chen, C.; Sun, Y.; Jia, A. Establishment and Application of a Fan Delta Front Geological Knowledge Base. Acta Pet. Sin. 2006, 27, 53–57. [Google Scholar]
  21. Yu, H.; Ma, Z.; Zhang, Z.; Huang, W. Construction of a Braided River Geological Knowledge Base Based on Reservoir Architecture Characterization: A Case Study of the SX Dense Well Pattern Area in the Sulige Gas Field. Pet. Geol. Oilfield Dev. Daqing 2020, 39, 8. [Google Scholar]
  22. Yin, T.; Zhang, C.; Fan, Z.; Li, S.; Lu, G.; Chen, C. Establishment of a Downhole Geological Knowledge Base for Shuanghe Oilfield. Pet. Explor. Dev. 1997, 24, 95–99. [Google Scholar]
  23. Yang, R.; Sheng, X.; Wei, X.; Wen, X. Control of Regional Large-Scale “X” Conjugate Joint Systems on Macro-Karstification Based on Google Earth Image Analysis. Geol. Rev. 2009, 55, 173–180. [Google Scholar]
  24. Zhang, B.; Ai, N.; Huang, Z.; Yi, C. Meanders of the Jialing River in China: Morphology and formation. Chin. Sci. Bull. 2008, 53, 267–281. [Google Scholar] [CrossRef]
  25. Li, T.; Venditti, J.G.; Sklar, L.S. An analytical model for lateral erosion from saltating bedload particle impacts. J. Geophys. Res. Earth Surf. 2021, 126, e2020JF006061. [Google Scholar] [CrossRef]
  26. Zhang, W.; Liu, Z.; Chen, Z.; Xu, H.; Lin, Y.; Wang, J. Establishment and Application of a Deepwater Channel Geological Knowledge Base in Angola. Acta Sedimentol. Sin. 2015, 33, 142–152. [Google Scholar]
  27. Chen, C.; Xu, D.; Zhang, Y.; Tang, X.; Wan, Y.; Feng, Z.; He, X.; Yu, W. Development Characteristics of Shallow-water Braided River Deltas in the Upper Member of Huagang Formation in the Central-Northern Xihu Sag. Mar. Geol. Front. 2024, 40, 39–48. [Google Scholar]
  28. Xing, B. Methods for Constructing a Braided River Reservoir Geological Knowledge Base: A Case Study of the Putaohua First Member Reservoir in the Lasa Block of Daqing Changyuan Oilfield. J. Northeast. Pet. Univ. 2014, 38, 46–53, 108. [Google Scholar]
  29. Syvitski, J.P.M.; Saito, Y. River-Dominated Deltas: A Global Synthesis. In Deltas in the Anthropocene; Springer: Cham, Switzerland, 2007; pp. 1–45. [Google Scholar]
  30. Lillesand, T.M.; Kiefer, R.W.; Chipman, J.W. Remote Sensing and Image Interpretation, 7th ed.; John Wiley & Sons: Hoboken, NJ, USA, 2015. [Google Scholar] [CrossRef]
  31. Goodchild, M.F. Geographical Information Science. Int. J. Geogr. Inf. Sci. 1999, 13, 309–319. [Google Scholar] [CrossRef]
  32. Xu, Z.; Deng, H.; Wu, S.; Yue, D.; Liu, Y.; Li, Q. Sedimentary Architecture and Formation Mechanism of Dendritic Sand Bars in the Front of River-Dominated Shallow Deltas. J. Palaeogeogr. 2024, 26, 1338–1351. [Google Scholar]
  33. Wang, Y.; Yang, S.; Wu, L.; Li, S.; Chen, X.; Yu, X.; Liu, W.; Liu, C.; Gu, Z.; Ge, J. Architecture Study of Subaqueous Distributary Channel Reservoirs in Braided River Deltas. Comput. Tech. Geophys. Geochem. Explor. 2014, 36, 613–618. [Google Scholar] [CrossRef]
  34. Milliman, J.D.; Farnsworth, K.L. River Discharge and Suspended Sediment Load of the Orinoco River, South America. J. Geol. 2013, 121, 647–661. [Google Scholar]
  35. Chen, C.; Zhu, Y.; Lei, Z.; Shun, M.; Yun, J. Flume Experiment Study of the Formation Process and Sedimentary Characteristics of a Shallow-Water Delta. Geol. J. 2023, 58, 2345–2360. [Google Scholar] [CrossRef]
Figure 1. Part of the image of a braided river delta shown by Google Earth.
Applsci 15 06186 g001
Figure 2. Measurement schematic diagram.
Applsci 15 06186 g002
Figure 3. Geographical locations and simplified morphologies of eight braided river deltas.
Applsci 15 06186 g003
Figure 4. Wavelength distribution and comprehensive data of eight groups of braided river deltas.
Applsci 15 06186 g004
Figure 5. Amplitude distribution and comprehensive data of eight groups of braided river deltas.
Applsci 15 06186 g005
Figure 6. Angular distribution and comprehensive data of eight groups of braided river deltas.
Applsci 15 06186 g006
Figure 7. Eight groups of braided river deltas are adjacent to bifurcation spacing distribution and synthesis data.
Applsci 15 06186 g007
Table 1. Some measurement data of the Poyang Lake delta.
Poyang LakeChannel Width (m)Wavelength (m)Amplitude (m)Spacing (m)Angle (°)
1113691331591453350.11
27457265221425,81538.69
350195051329680272.83
429565191312578136.21
531272452304804052.58
6268168064016,166135.98
79024090126231,09345.70
842847662028192145.95
941548641310752168.07
102014230708778949.19
112154715197273441.85
1217870992181408040.40
1354556221971127832.83
14227210795033334.14
152873360915654034.33
1631535811039182650.10
17445175341089961.90
182452230436138345.25
19185934499165825.67
201915244154468465.87
2191289472281949.20
221303054686104241.99
23316383571295663.96
241732200666158448.32
25212191975828854.96
26177922314172249.58
27196183332974734.54
281211303235161035.88
29194132016651431.53
301991147266192743.22
31359981267135196.11
32124107926210463.79
33183124743889895.23
3413891323798241.01
3514722261195125662.63
361052277391244855.30
3794.3205946518,70361.64
3864394192657195562.02
3989993602777504438.45
4028071422242601154.70
412483249121513,43025.20
42117224319338640
43178533914858702
44619233965022,378
45561330515588128
46414166510903458
473611424687
48 19331348
49 1487777
50 2231561
51 19791307
52 958384
53 59111877
54 66672726
Table 2. Table of the relationship between image resolution and the proportion of errors in key parameters.
Image Resolution (m/pixel)Positional Error
Corresponding to
10 Pixels (m)
The Proportion of Error for the Amplitude of the Saloum River Delta (680 m)The Proportion of Error for the Typical Wavelength (3000 m)
5507.4%1.7%
1010014.7%3.3%
1515022.1%5.0%
Table 3. Key morphometric parameters of studied braided river deltas.
Delta NameLatitude/Longitude (Approx.)Area (km2)River Network Density (km/km2)Sedimentation Rate (cm/year)
Wax Lake Delta29.27° N, 91.25° W~11.26 5–80.5–1.0
Yukon–Kuskokwim Delta61.45° N, 164.30° W129,5002–30.3–0.5
Lena River Delta72.30° N, 126.00° E~33,600 *4–61.0–1.5
Po River Delta44.57° N, 12.27° E14506–80.2–0.5
Poyang Lake Delta29.0° N, 116.18° E35003–50.8–1.2
Orinoco Delta8.42° N, 60.30° W43,6463–51.2–1.8
Rufiji River Delta7.48° S, 39.24° ENot specified2–40.6–1.0
Saloum Delta13.84° N, 16.50° W18004–60.4–0.8
Disclaimer/Publisher’s Note: The statements, opinions and data contained in all publications are solely those of the individual author(s) and contributor(s) and not of MDPI and/or the editor(s). MDPI and/or the editor(s) disclaim responsibility for any injury to people or property resulting from any ideas, methods, instructions or products referred to in the content.

