
Investigation on the Effect of Opening Size and Position on Wind-Driven Cross-Ventilation in an Isolated Gable Roof Building


Abstract
1. Introduction

| Authors | Study Type | Turbulence Model | Influential Physical Parameters | Performance Indicator |
|---|---|---|---|---|
| Yi et al. [13] | Exp | - | Opening size | V, Cp, DC, Q |
| Chu et al. [14] | Exp | - | Wind direction, Opening size | V, Cp, DC |
| Karava et al. [9] | Exp | - | Opening position | V, VF, Cp, Q |
| Tominaga & Blocken [26] | Exp | - | Urban density | V, TKE, Conc, TSF, Q |
| Ohba et al. [20] | Exp | - | Wind direction | V, VF, Q |
| Karava et al. [27] | Exp | - | Wall porosity, Opening ratio, Opening position | Cp, ACH, Q |
| Tominaga & Blocken [28] | Exp | - | Opening position, Opening size | V, TKE, Conc, Q |
| Tominaga et al. [17] | Exp | - | Roof geometry, Roof angle, Roof eave | V, Cp, Q |
| Sudirman et al. [29] | Exp | - | Wind direction, Internal partition | V, Q |
| Golubić et al. [30] | Exp | - | Urban density, Wind direction, Wind speed | V, Cp, ACH, Q |
| Evola & Popov [31] | CFD | RANS (Standard k-ε, RNG) | Opening position | V, Cp, Q |
| Hu, Ohba & Yoshie [32] | CFD | LES (Smagorinsky SGS) | Wind direction | V, Cp, TKE, Q |
| Ramponi & Blocken [22] | CFD | RANS (Standard k-ε, Realizable k-ε, RNG k-ε, SST k-ω, RSM) | Computational domain size, Grid resolution, Turbulence model, Discretization scheme | V, TKE, VF |
| Shetabivash [8] | CFD | RANS (Standard k-ε) | Opening geometry, Opening position | V, VF, Q |
| Kasim et al. [10] | CFD | RANS (RNG k-ε) | Opening position | V, Q |
| Derakhshan & Shaker [11] | CFD | RANS (SST k-ω) | Opening geometry, Opening position, Wind direction | V, Cp, Q |
| van Hooff et al. [23] | CFD | RANS (Standard k-ε, RNG k-ε, Realizable k-ε, RSM, SST k-ω), LES (Dynamic Smagorinsky SGS) | Turbulence model | V, TKE, IJA, Q |
| Shirzadi et al. [33] | CFD | RANS (Standard k-ε, RNG k-ε, SST k-ω, RSM) | Urban density | V, Cp |
| Shirzadi, et al. [34] | CFD | RANS (Standard k-ε, SST k-ω) | Wind direction, Urban density | V, Cp, TKE, Q |
| Gautam et al. [35] | CFD | RANS (SST k-ω) | Wall porosity, Wind direction | V, Cp, TKE, DC, TD, Q |
| Hwang and Gorlé [16] | CFD | LES (Smagorinsky SGS) | Opening position, Opening size, Wall porosity, Wind direction | V, AA, Q |
| Kurabuchi et al. [36] | CFD | LES (Standard Smagorinsky) | Opening position, Wind direction | VF, Cp, TKE |
| Hu et al. [32] | CFD | LES (Standard Smagorinsky) | Wind direction | VF, Cp, TKE, Q |
| Kobayashi et al. [37] | CFD | RANS (RSM) | Opening size | Cp, DC, Q |
| Meroney [38] | CFD | RANS (Standard k-ε, Realizable k-ε, RNG, Standard k-ω, RSM), LES (Standard Smagorinsky), DES | Opening position, Turbulence model | V, VF, Cp, DFR |
| Nikas et al. [21] | CFD | RANS (Standard k-ω) | Wind direction, Wind speed | V, VF, Q |
| Cheung and Liu [39] | CFD | RANS (Standard k-ε) | Wind direction, Building disposition | V, VF, Q |
| Peren et al. [12,18,19] | CFD | RANS (Standard k-ε, Realizable k-ε, RNG k-ε, Standard k-ω, SST k-ω, RSM) | Roof angle, Opening position, Turbulence model, Roof geometry, Roof eave, Opening ratio | V, VF, Cp, Q |
| Tong et al. [40] | CFD | LES (Dynamic Smagorinsky) | Wind direction, Urban density | V, ACH |
| Zhang et al. [15] | CFD | RANS (Standard k-ε, RNG k-ε, Realizable k-ε) | Number of external openings, Opening size, Opening position, Position and geometry of internal wall | V, Q |
| Fu et al. [41] | CFD | RANS (Realizable k-ε) | Opening position, Building level | V, VF, Cp, TKE, DFR, AEE |
| Tai et al. [34] | CFD | RANS (RNG k-ε) | Louver angle, Opening position, Effective opening area | V, Cp, TKE, DFR, AEE, AA |
| Li et al. [42] | CFD | RANS (Standard k-ε) | Planar area ratio, Opening position | V, Cp, TKE, DFR, AEE, AA |
| Kosutova et al. [26] | Exp, CFD | RANS (RNG k-ε, SST k-ω, RSM) | Turbulence model, Opening position, Louver | V, VF, TKE, AA, AEE, DFR, Q |
| Jiang et al. [43] | Exp, CFD | LES (Smagorinsky SGS, Filtered dynamic SGS) | Opening position | V, VF, Cp, Q |
| Kato et al. [44] | Exp, CFD | LES (Standard Smagorinsky) | Opening size | V, VF, Cp, TKE, Q |
| Kobayashi et al. [45] | Exp, CFD | RANS (RSM) | Opening size | V, VF, Cp |
| Larsen et al. [46] | Exp, CFD | RANS (Standard k-ω) | Wind direction, Wind speed | V, ACH |
| Bangalee et al. [47] | Exp, CFD | RANS (RNG k-ε) | Opening position, Wind speed | V, VF, Q |
| Shirzadi et al. [48] | Exp, CFD | RANS (Standard k-ε, RNG k-ε, SST k-ω) | Wind direction, Urban density, Planar area ratio | V, Cp, TKE, Q |
2. Numerical Methodology
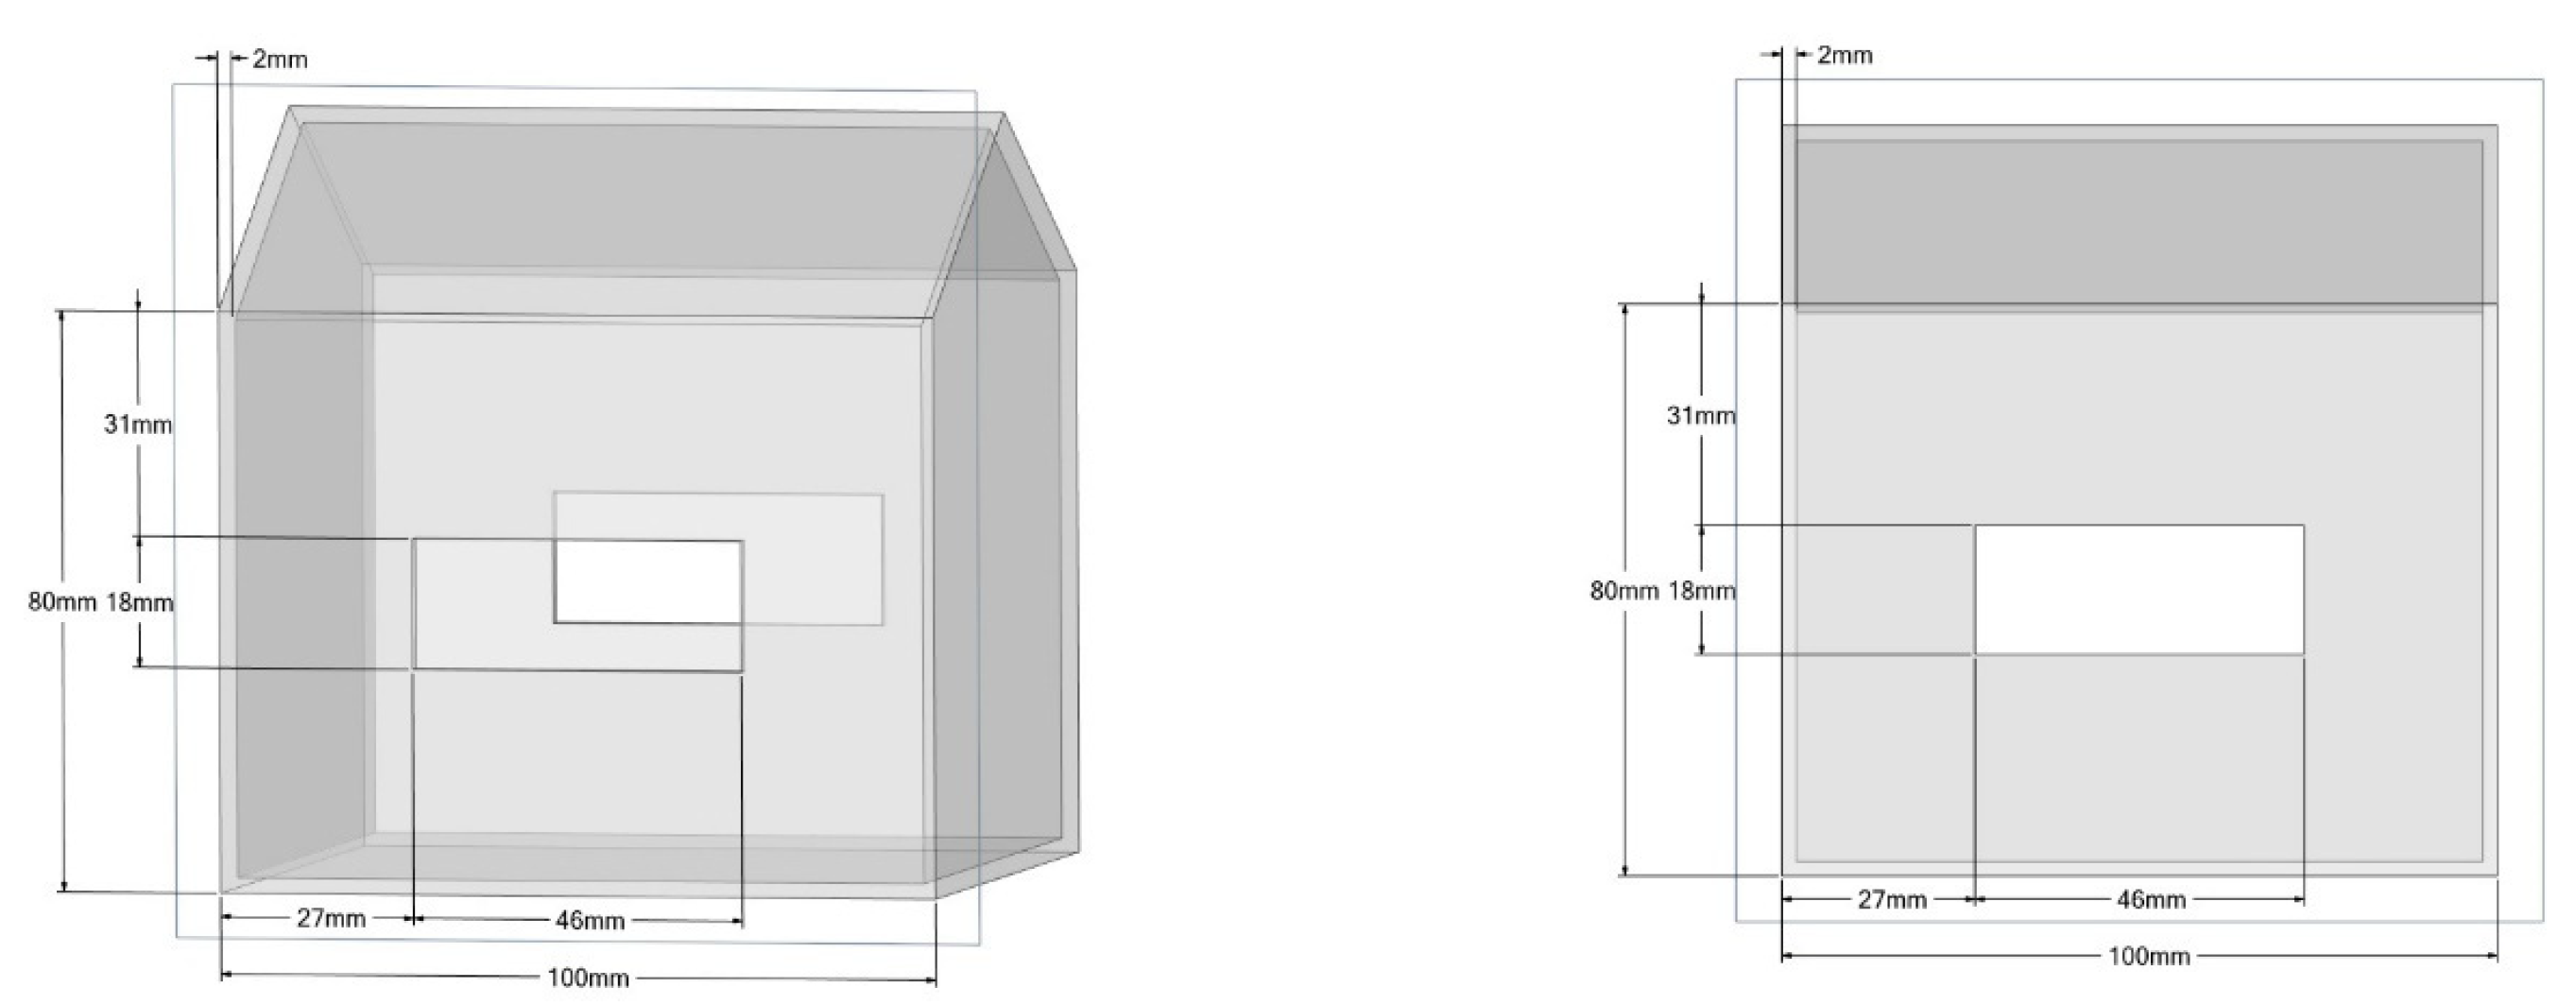
2.1. Building Geometry and Configurations
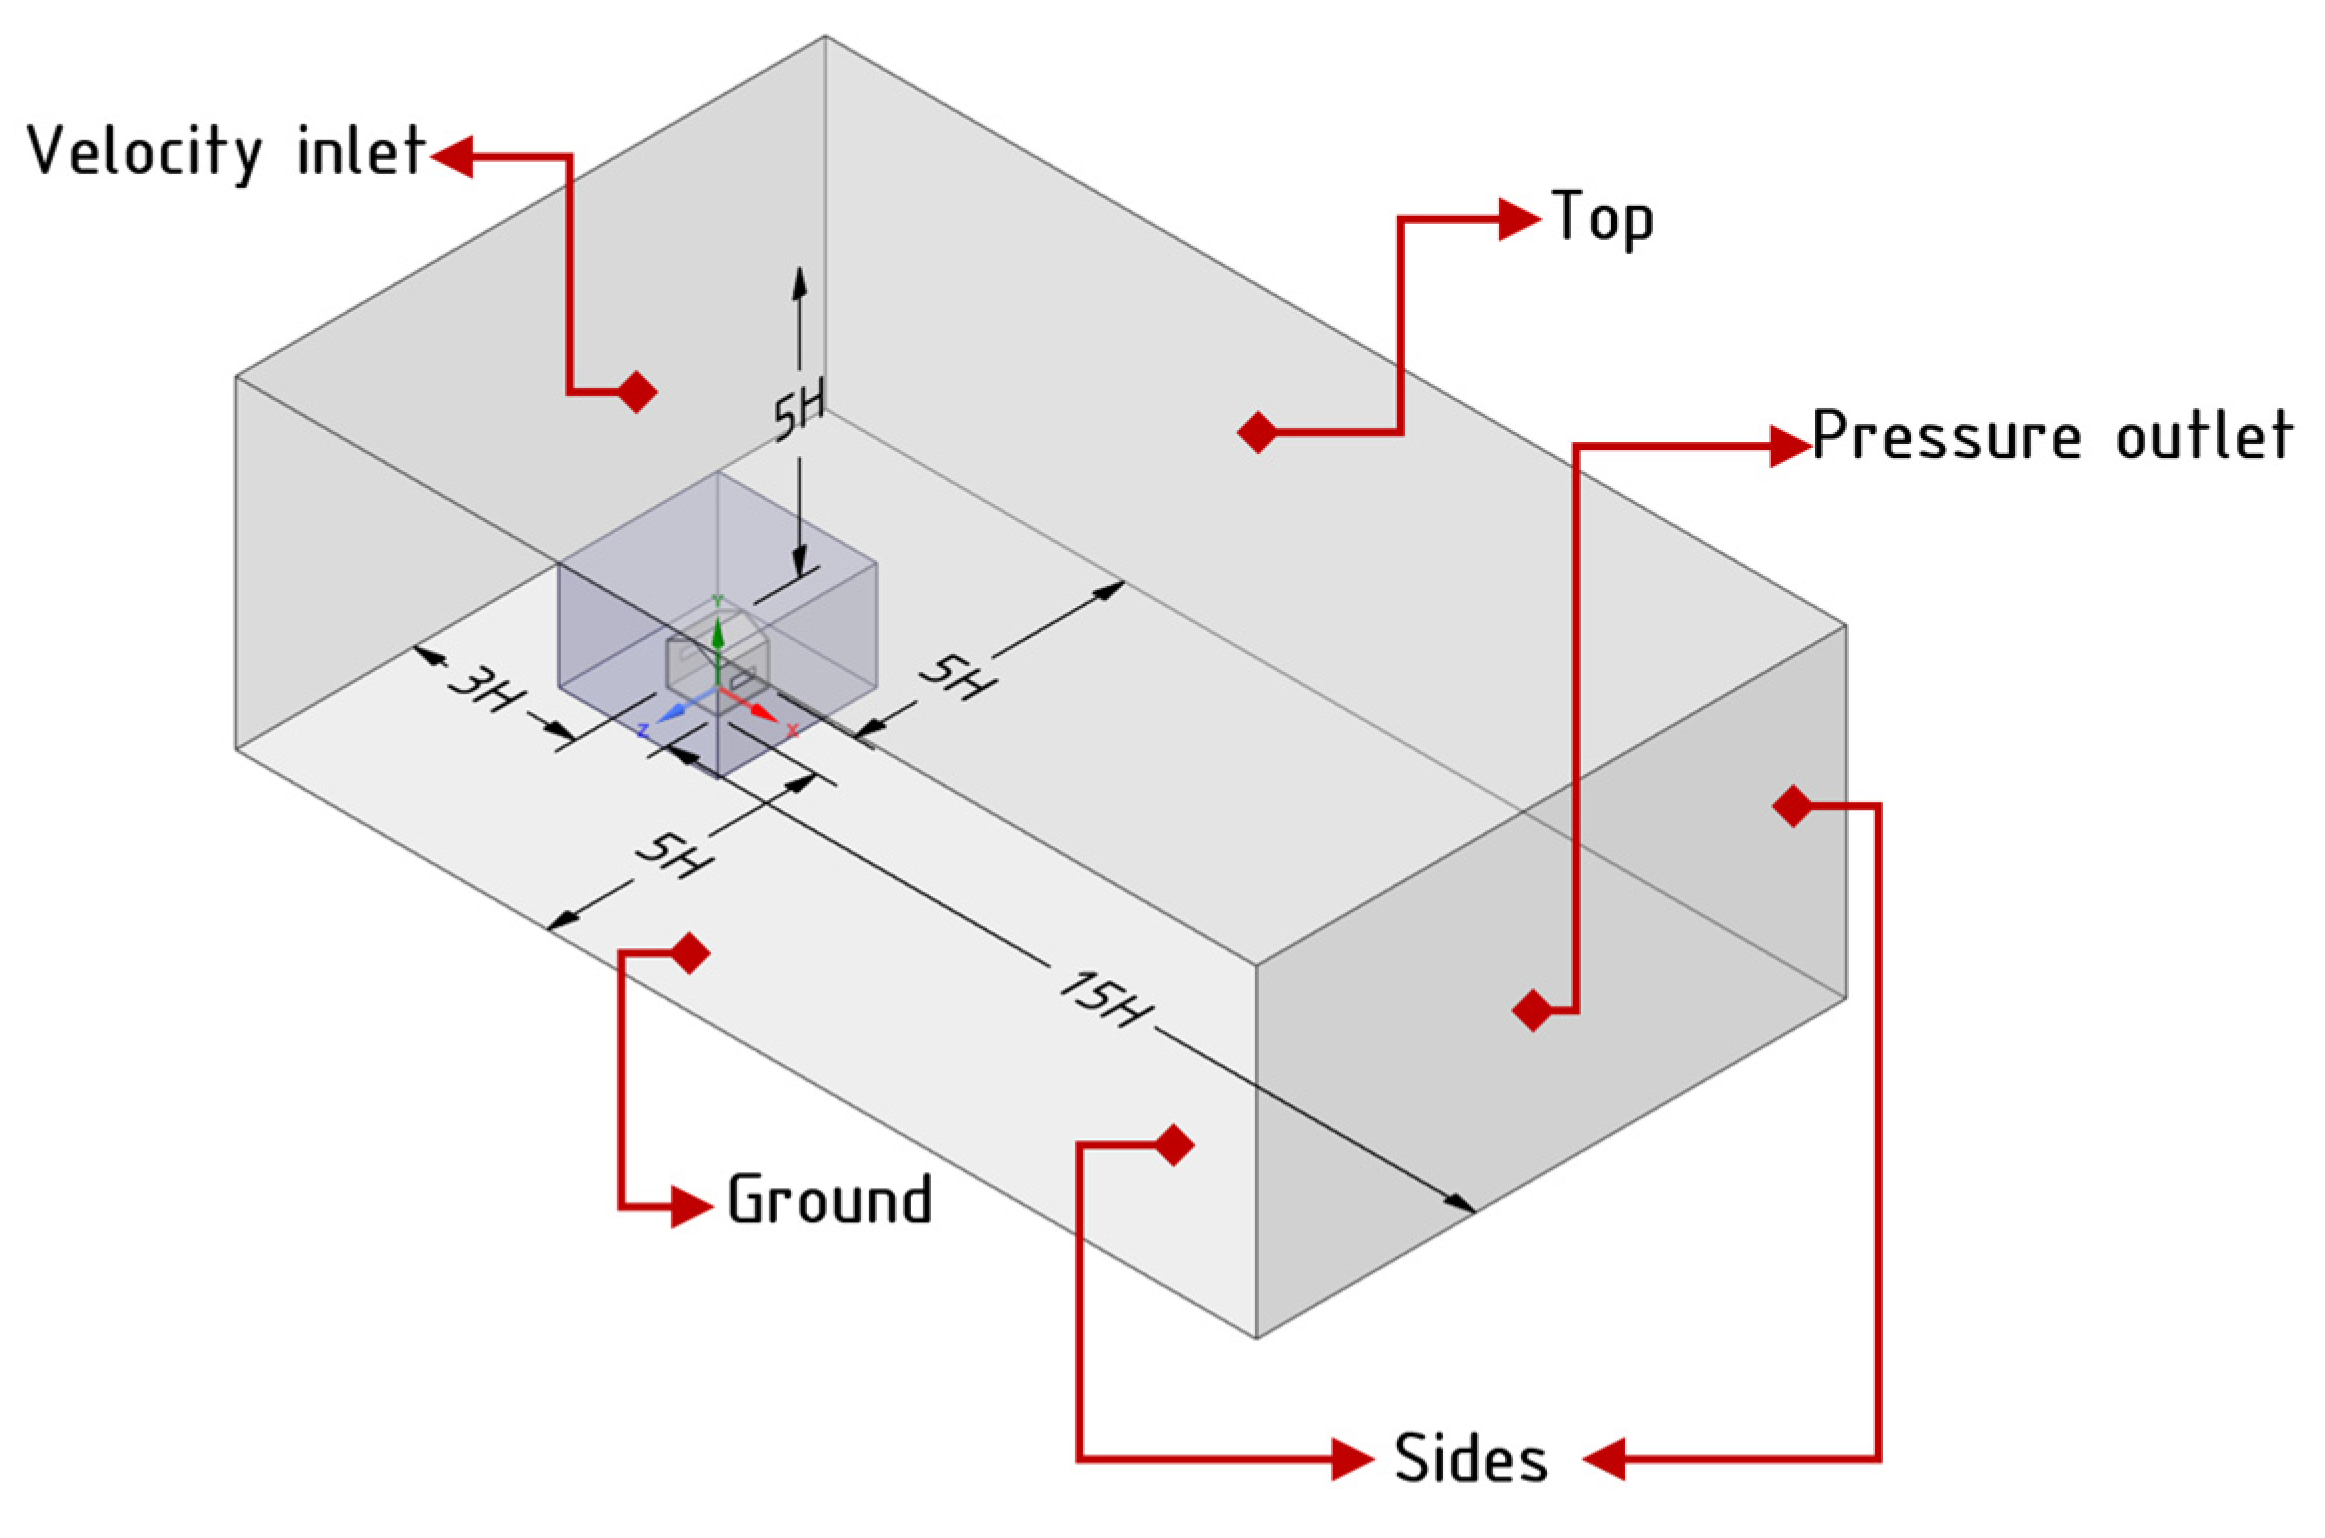
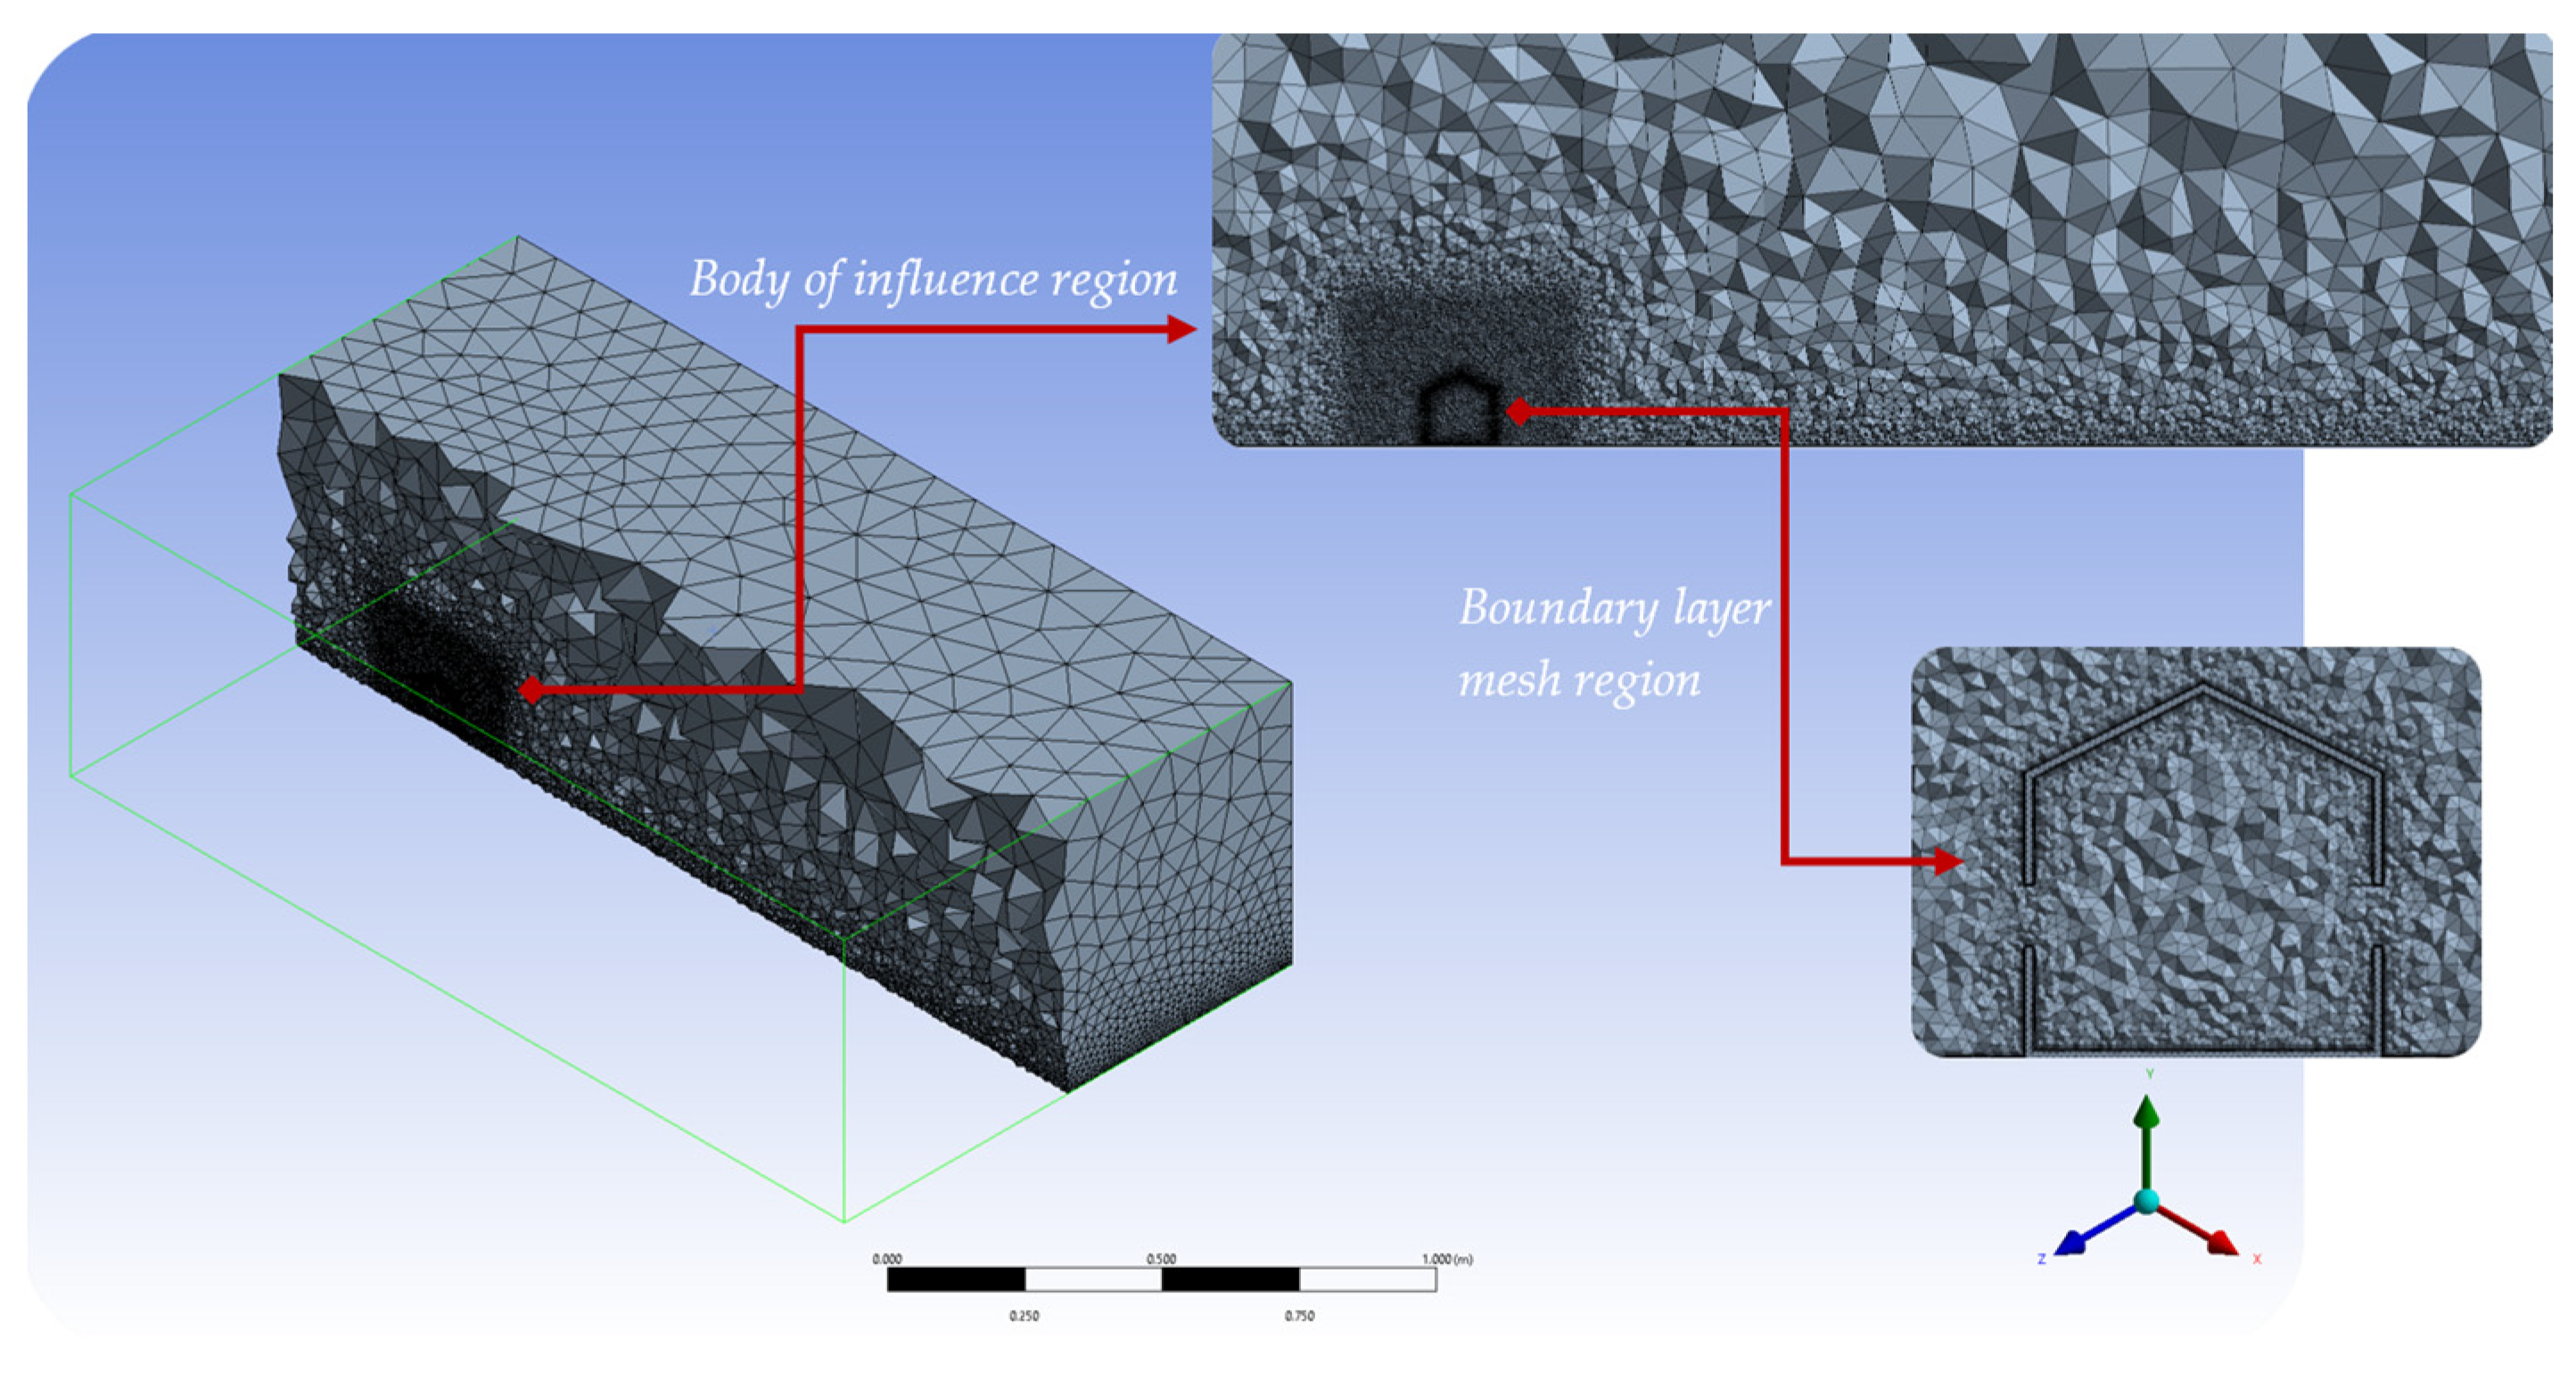
2.2. Computational Flow Domain and Grids
2.3. Boundary Conditions
2.4. CFD Solver Settings
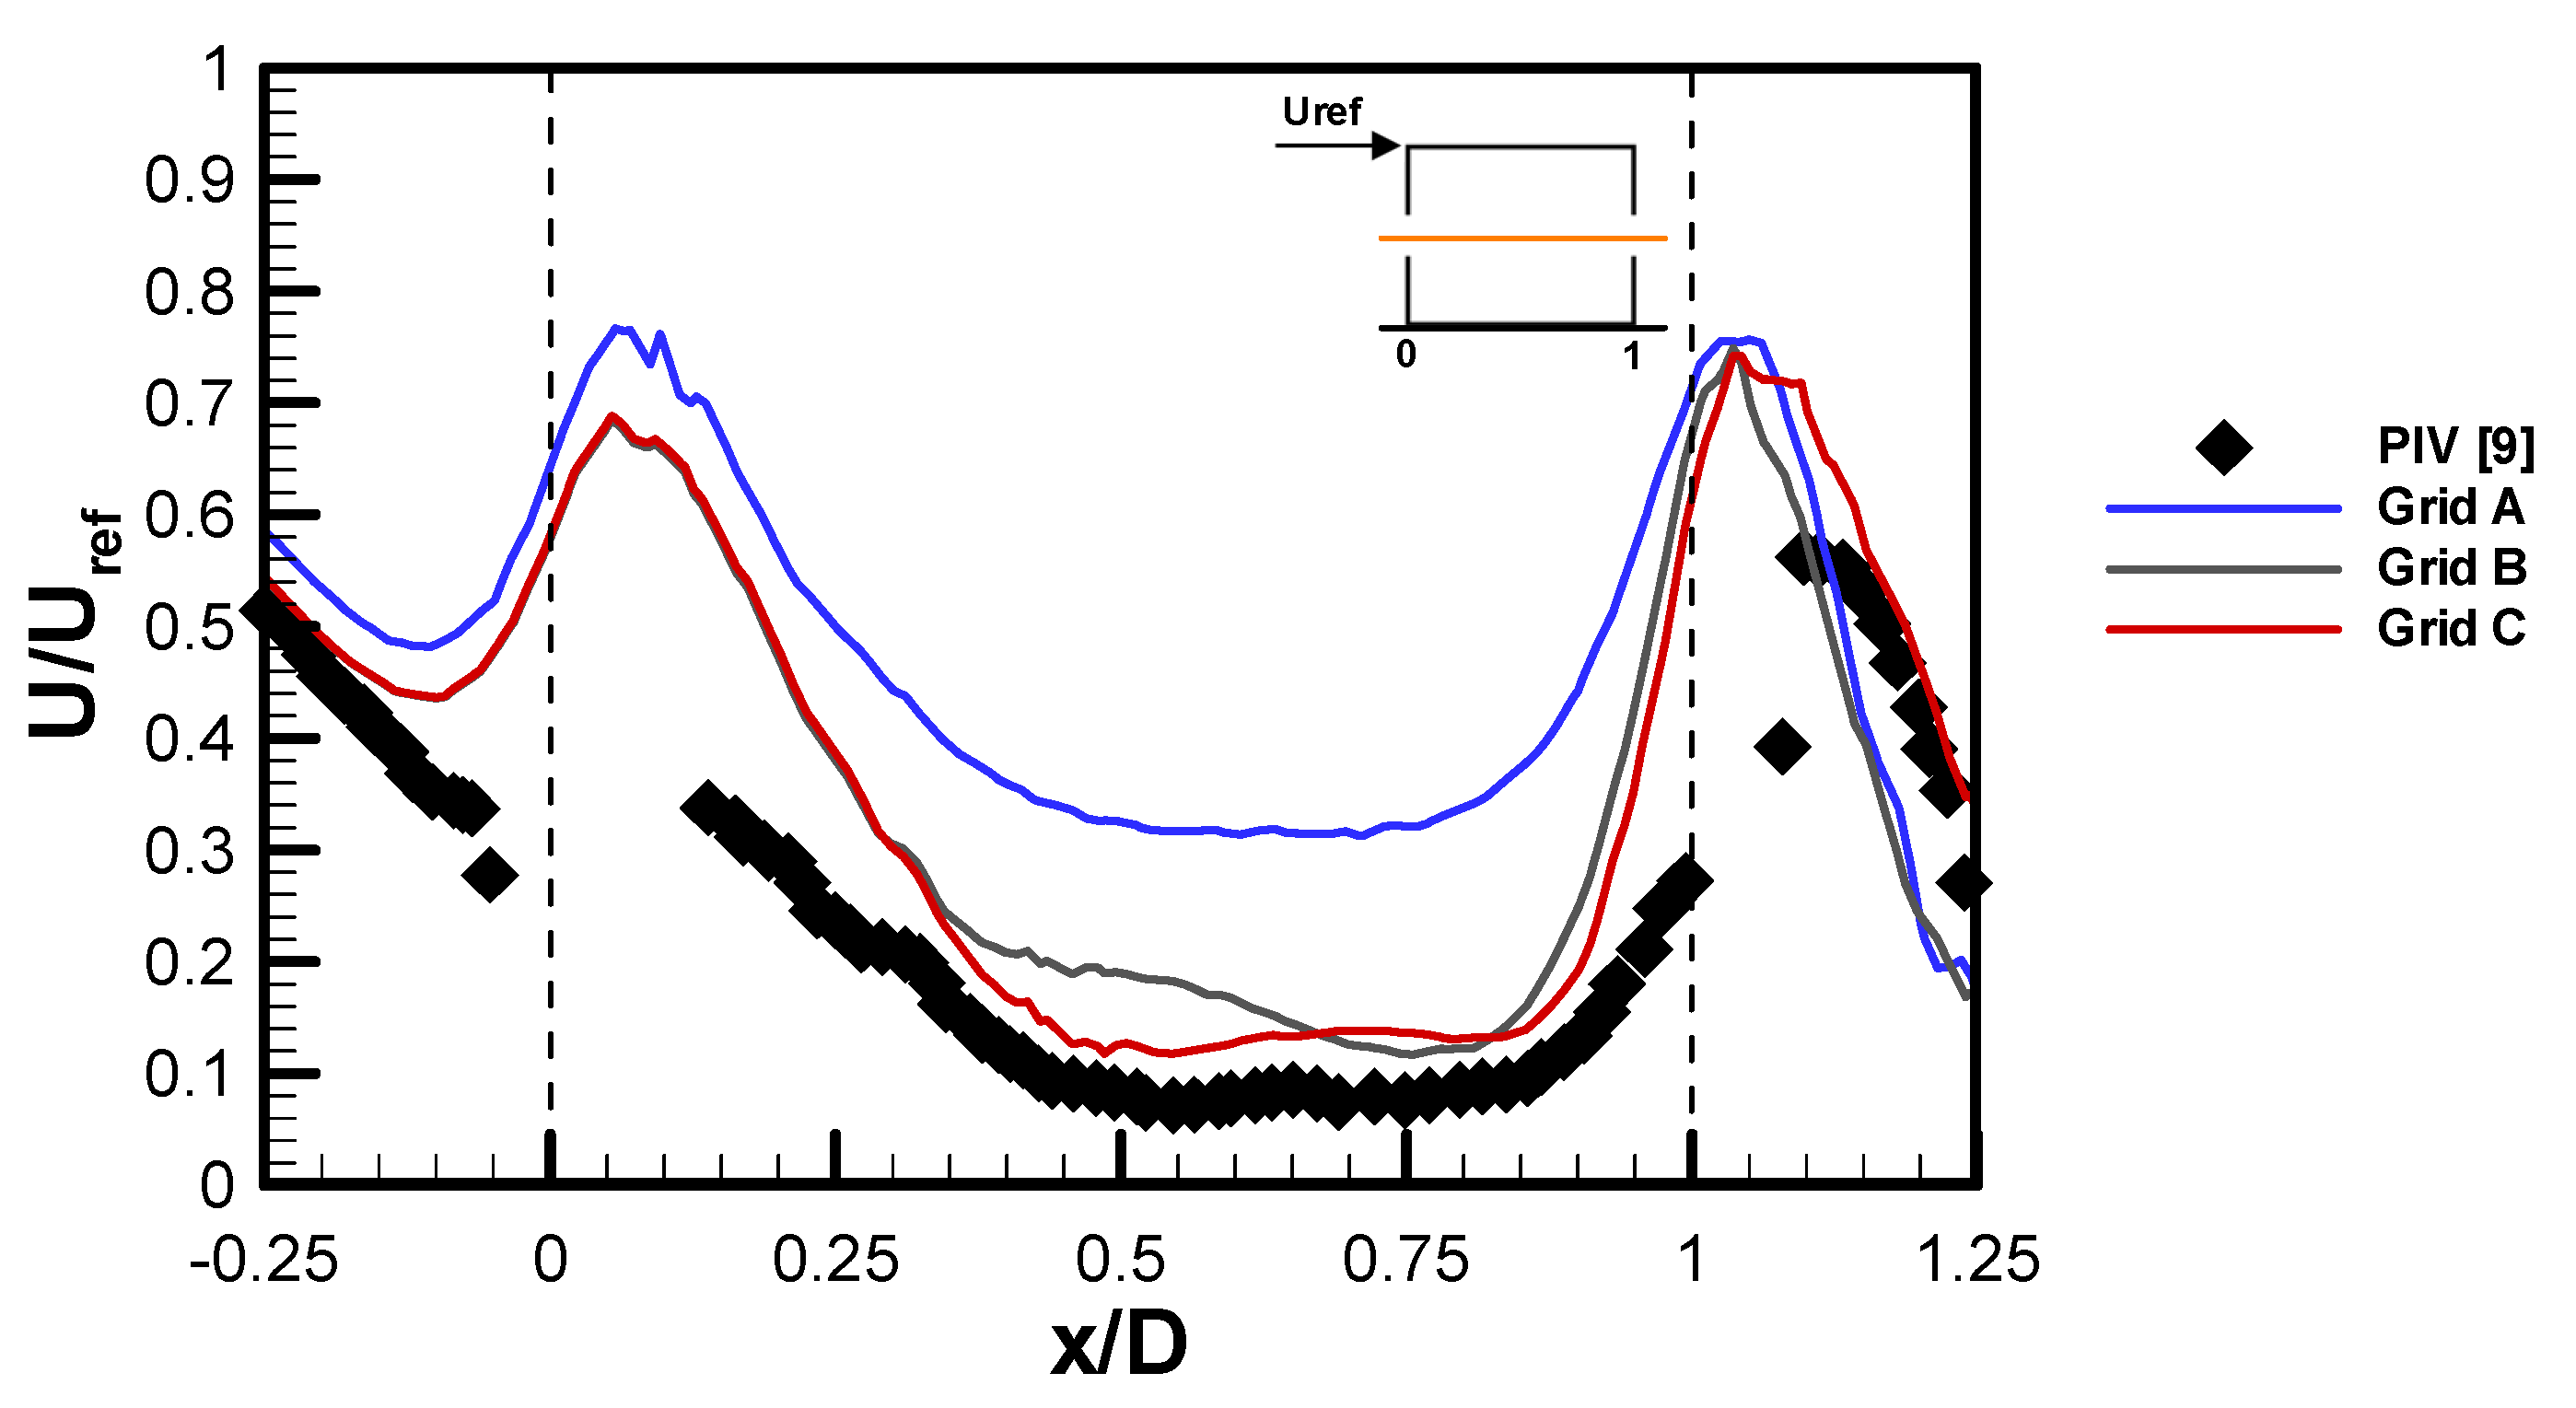
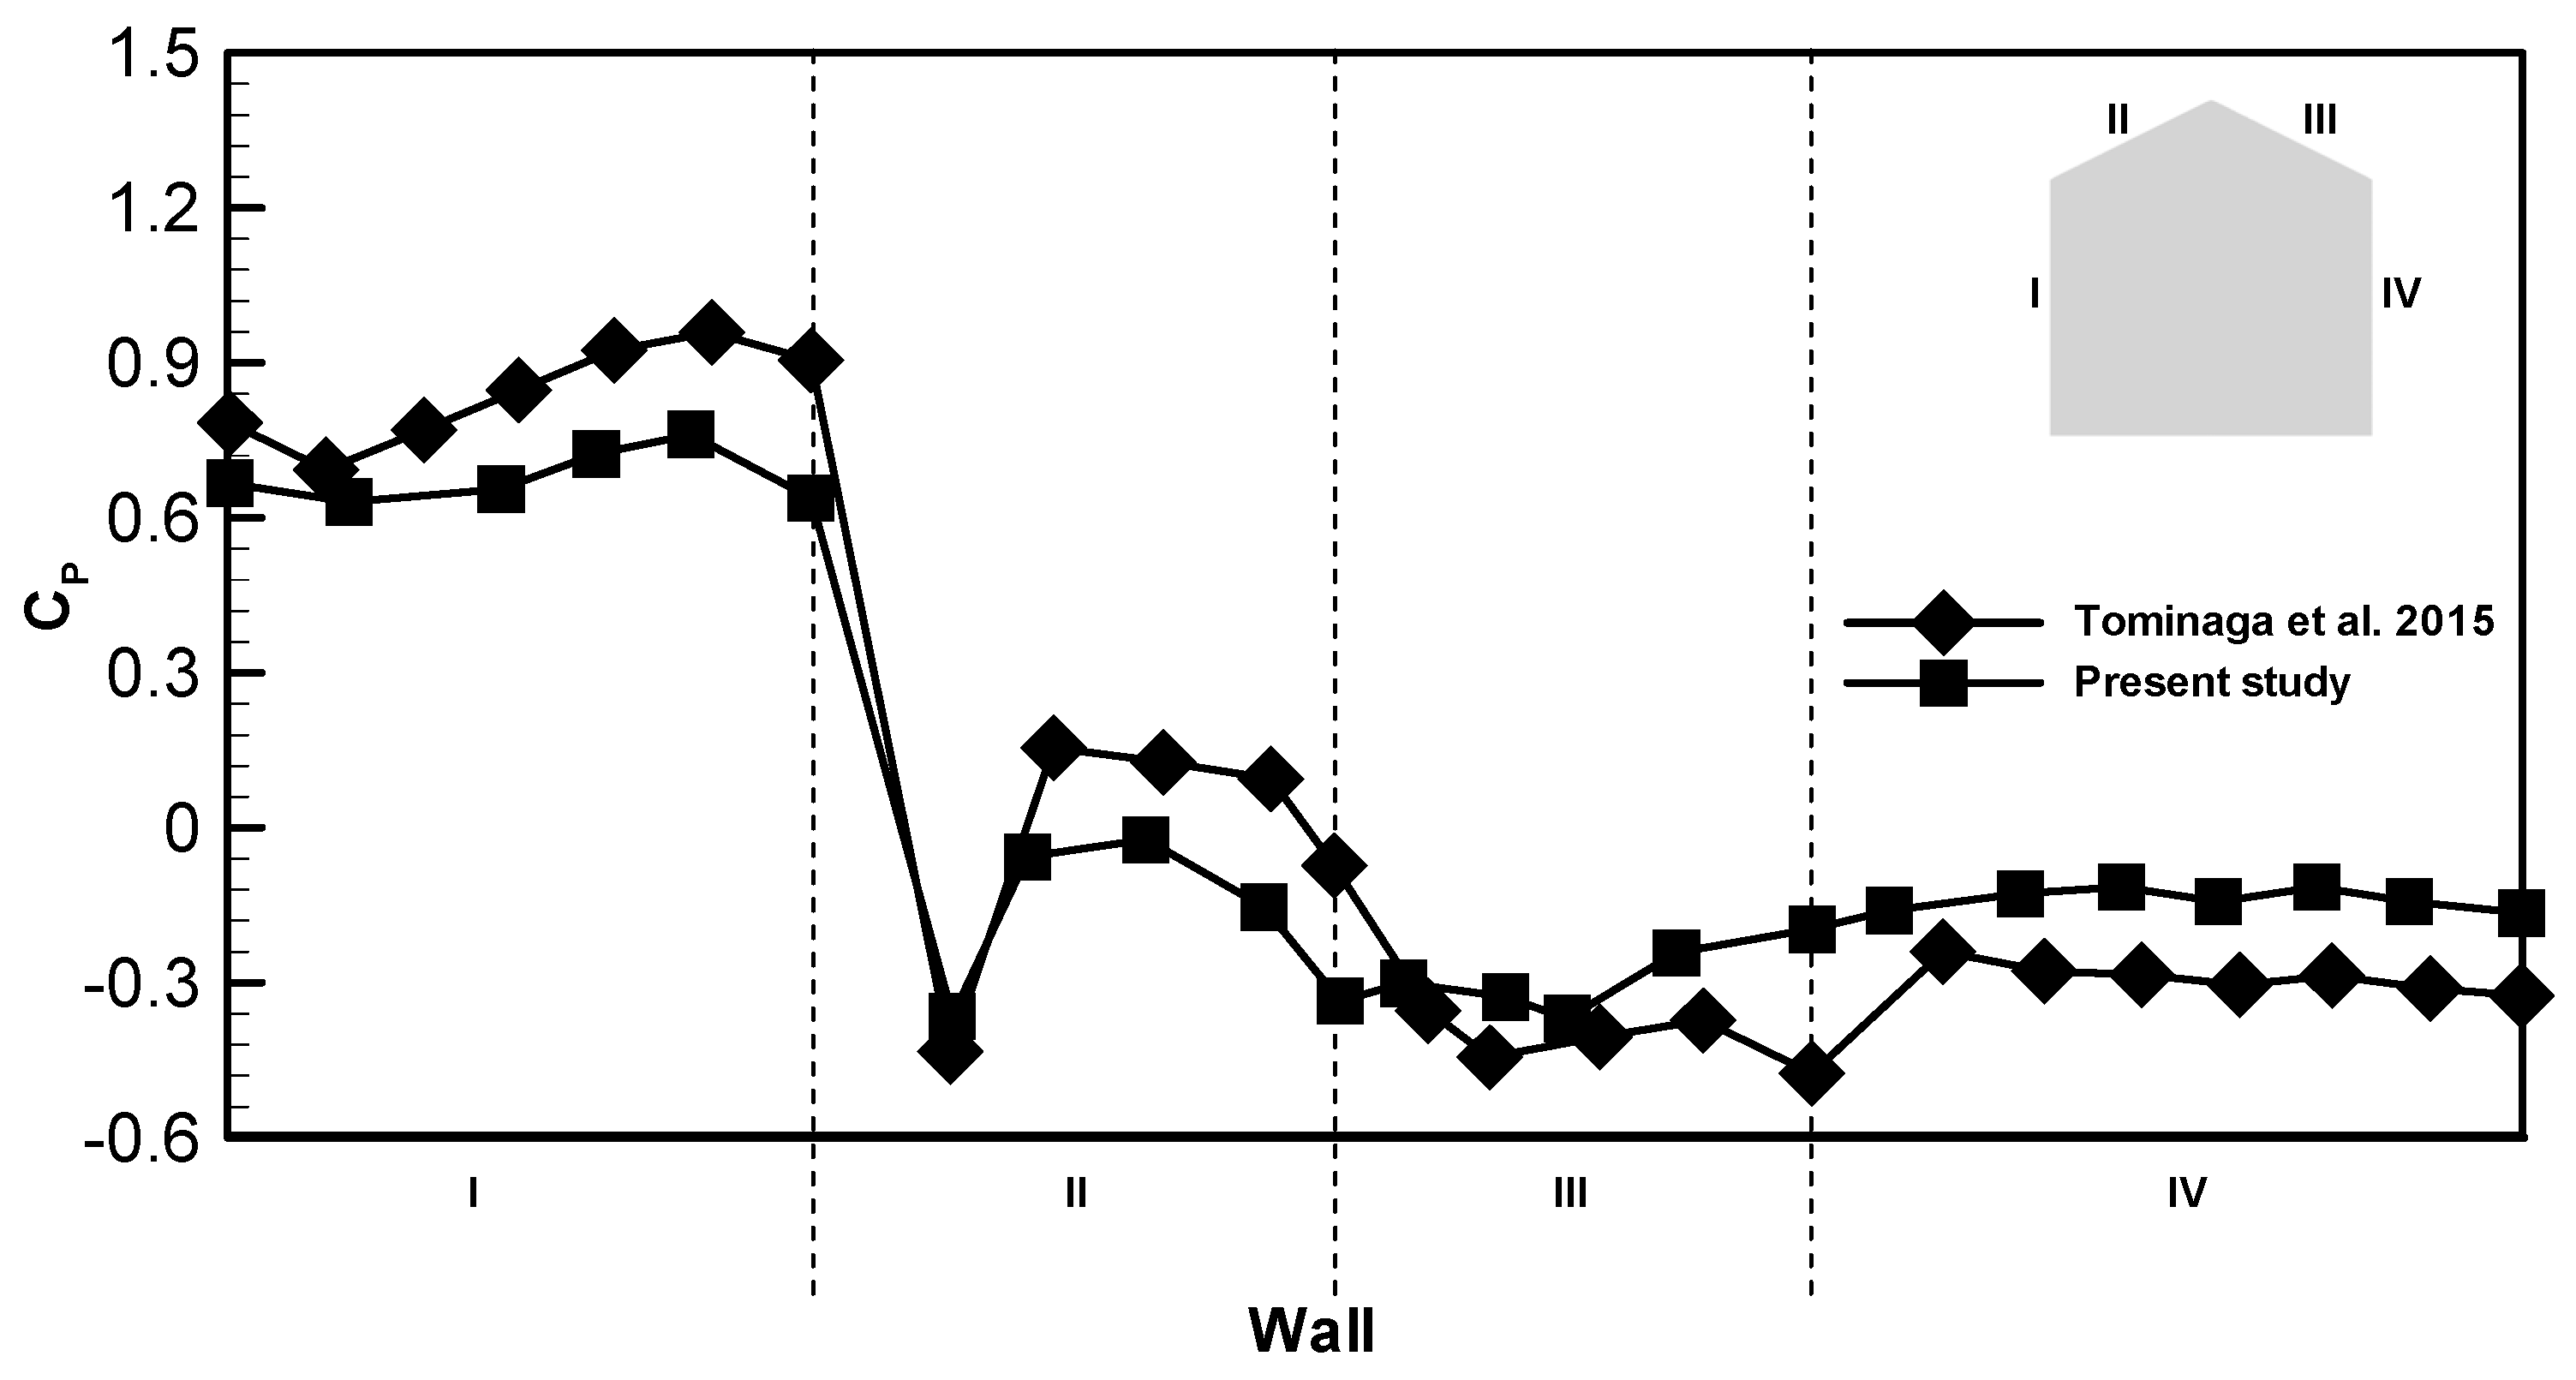
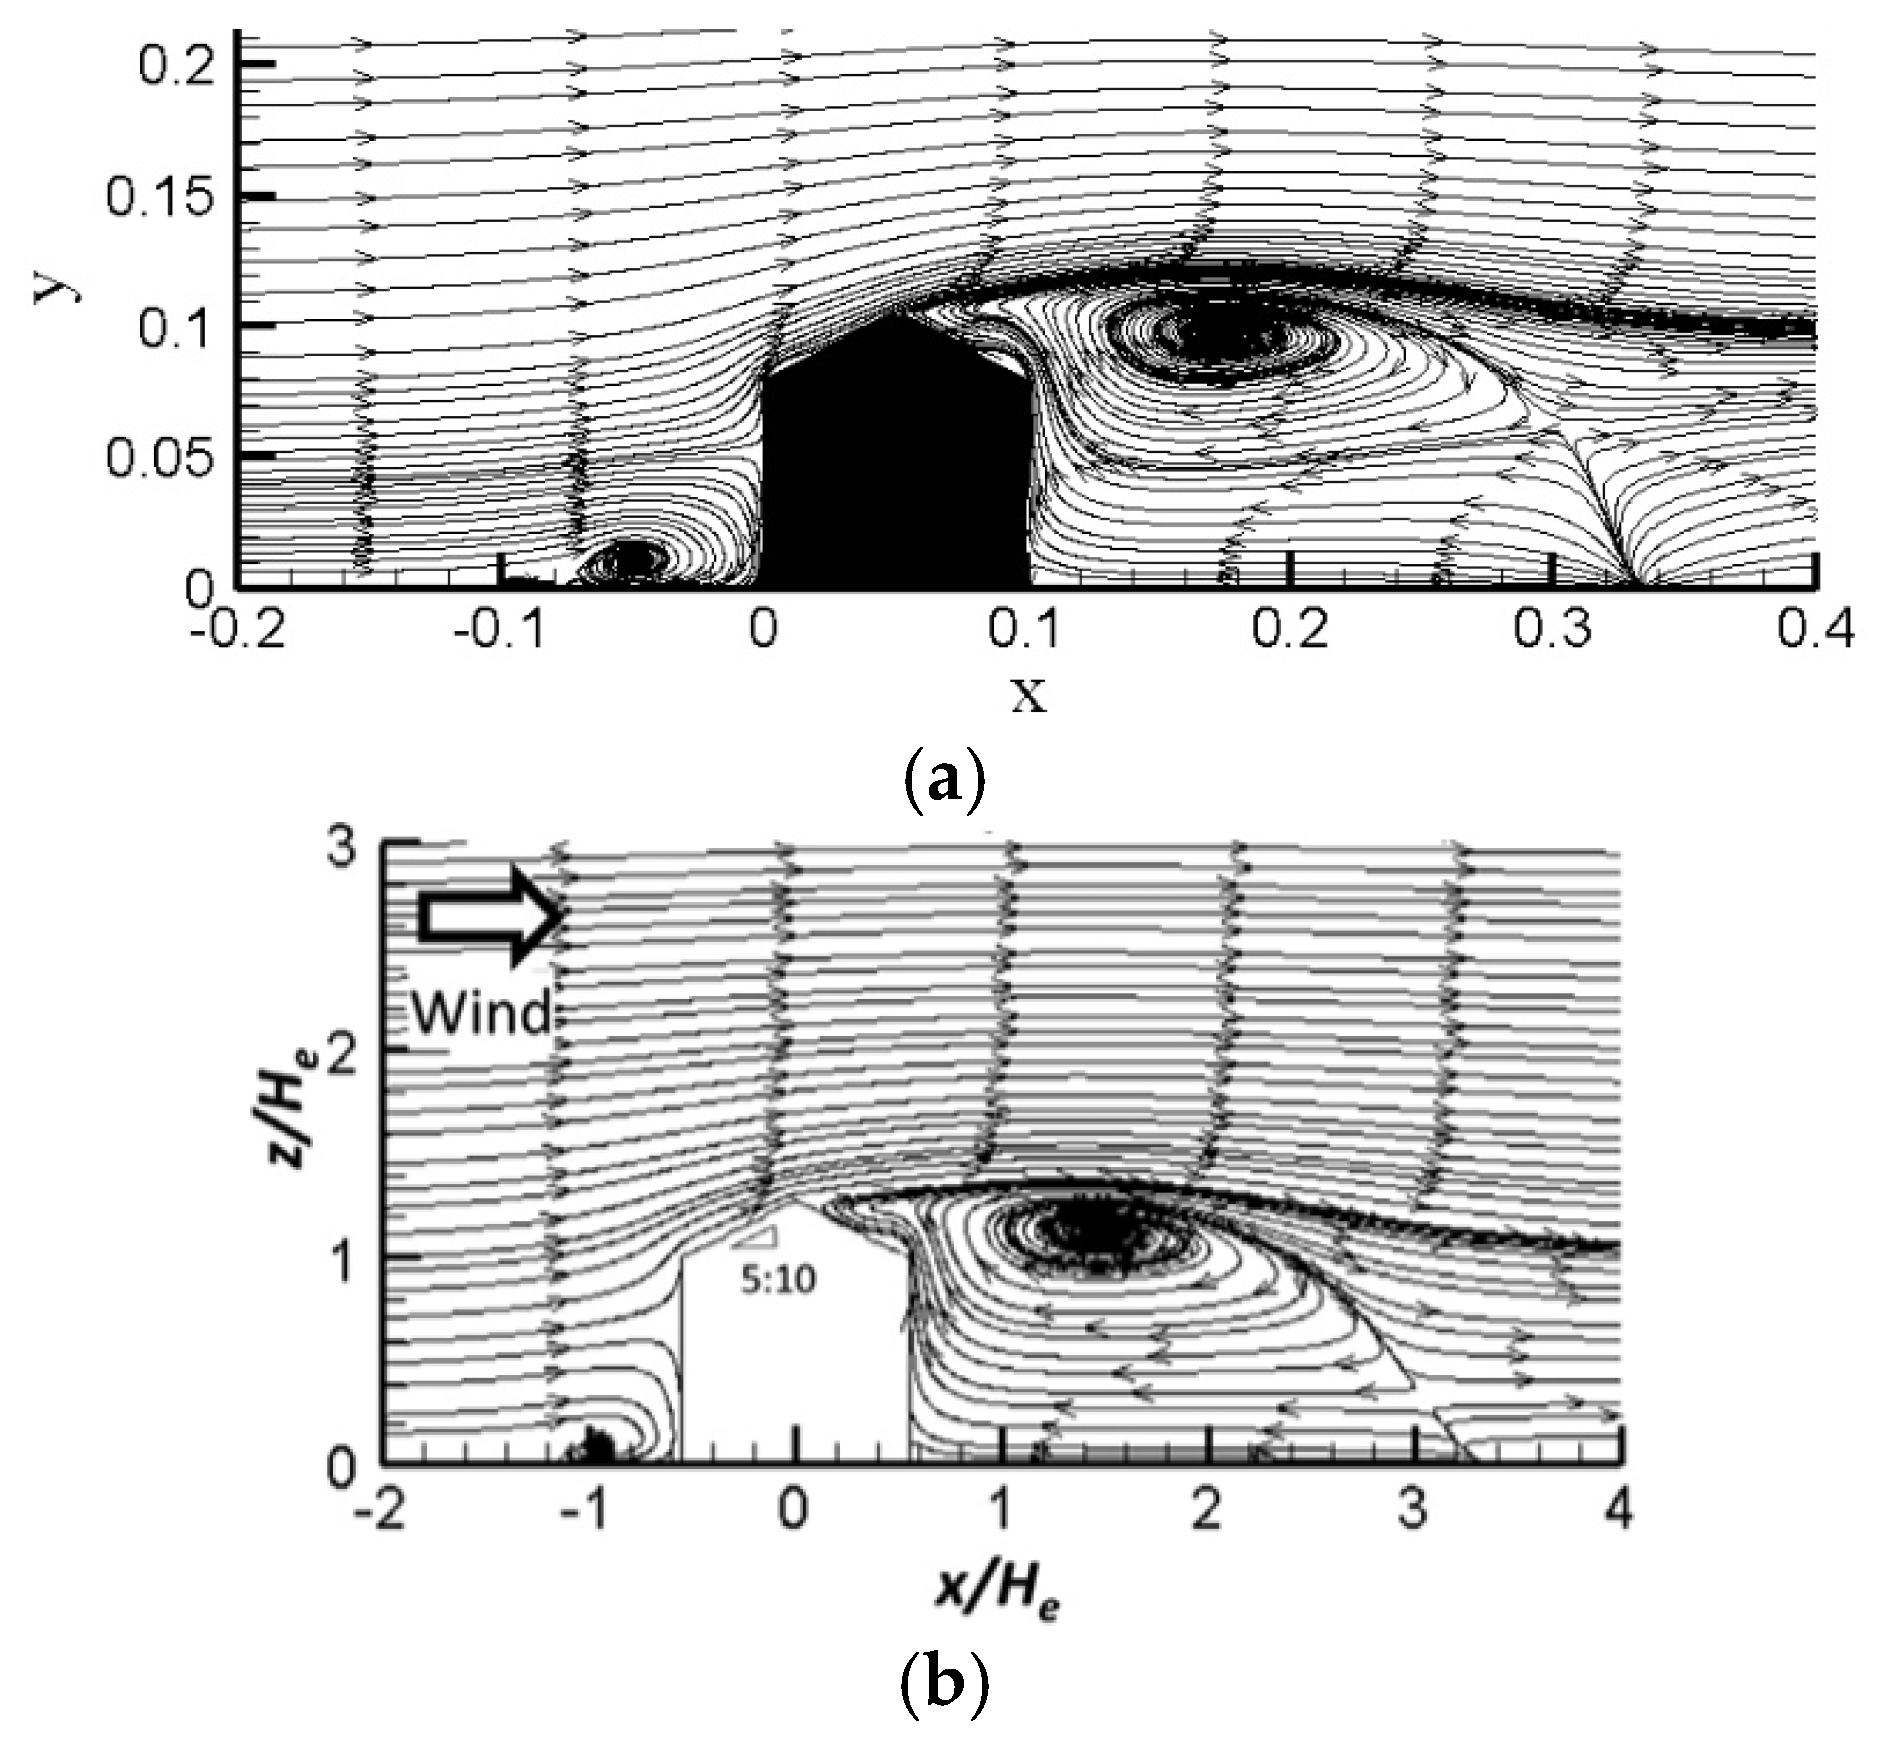
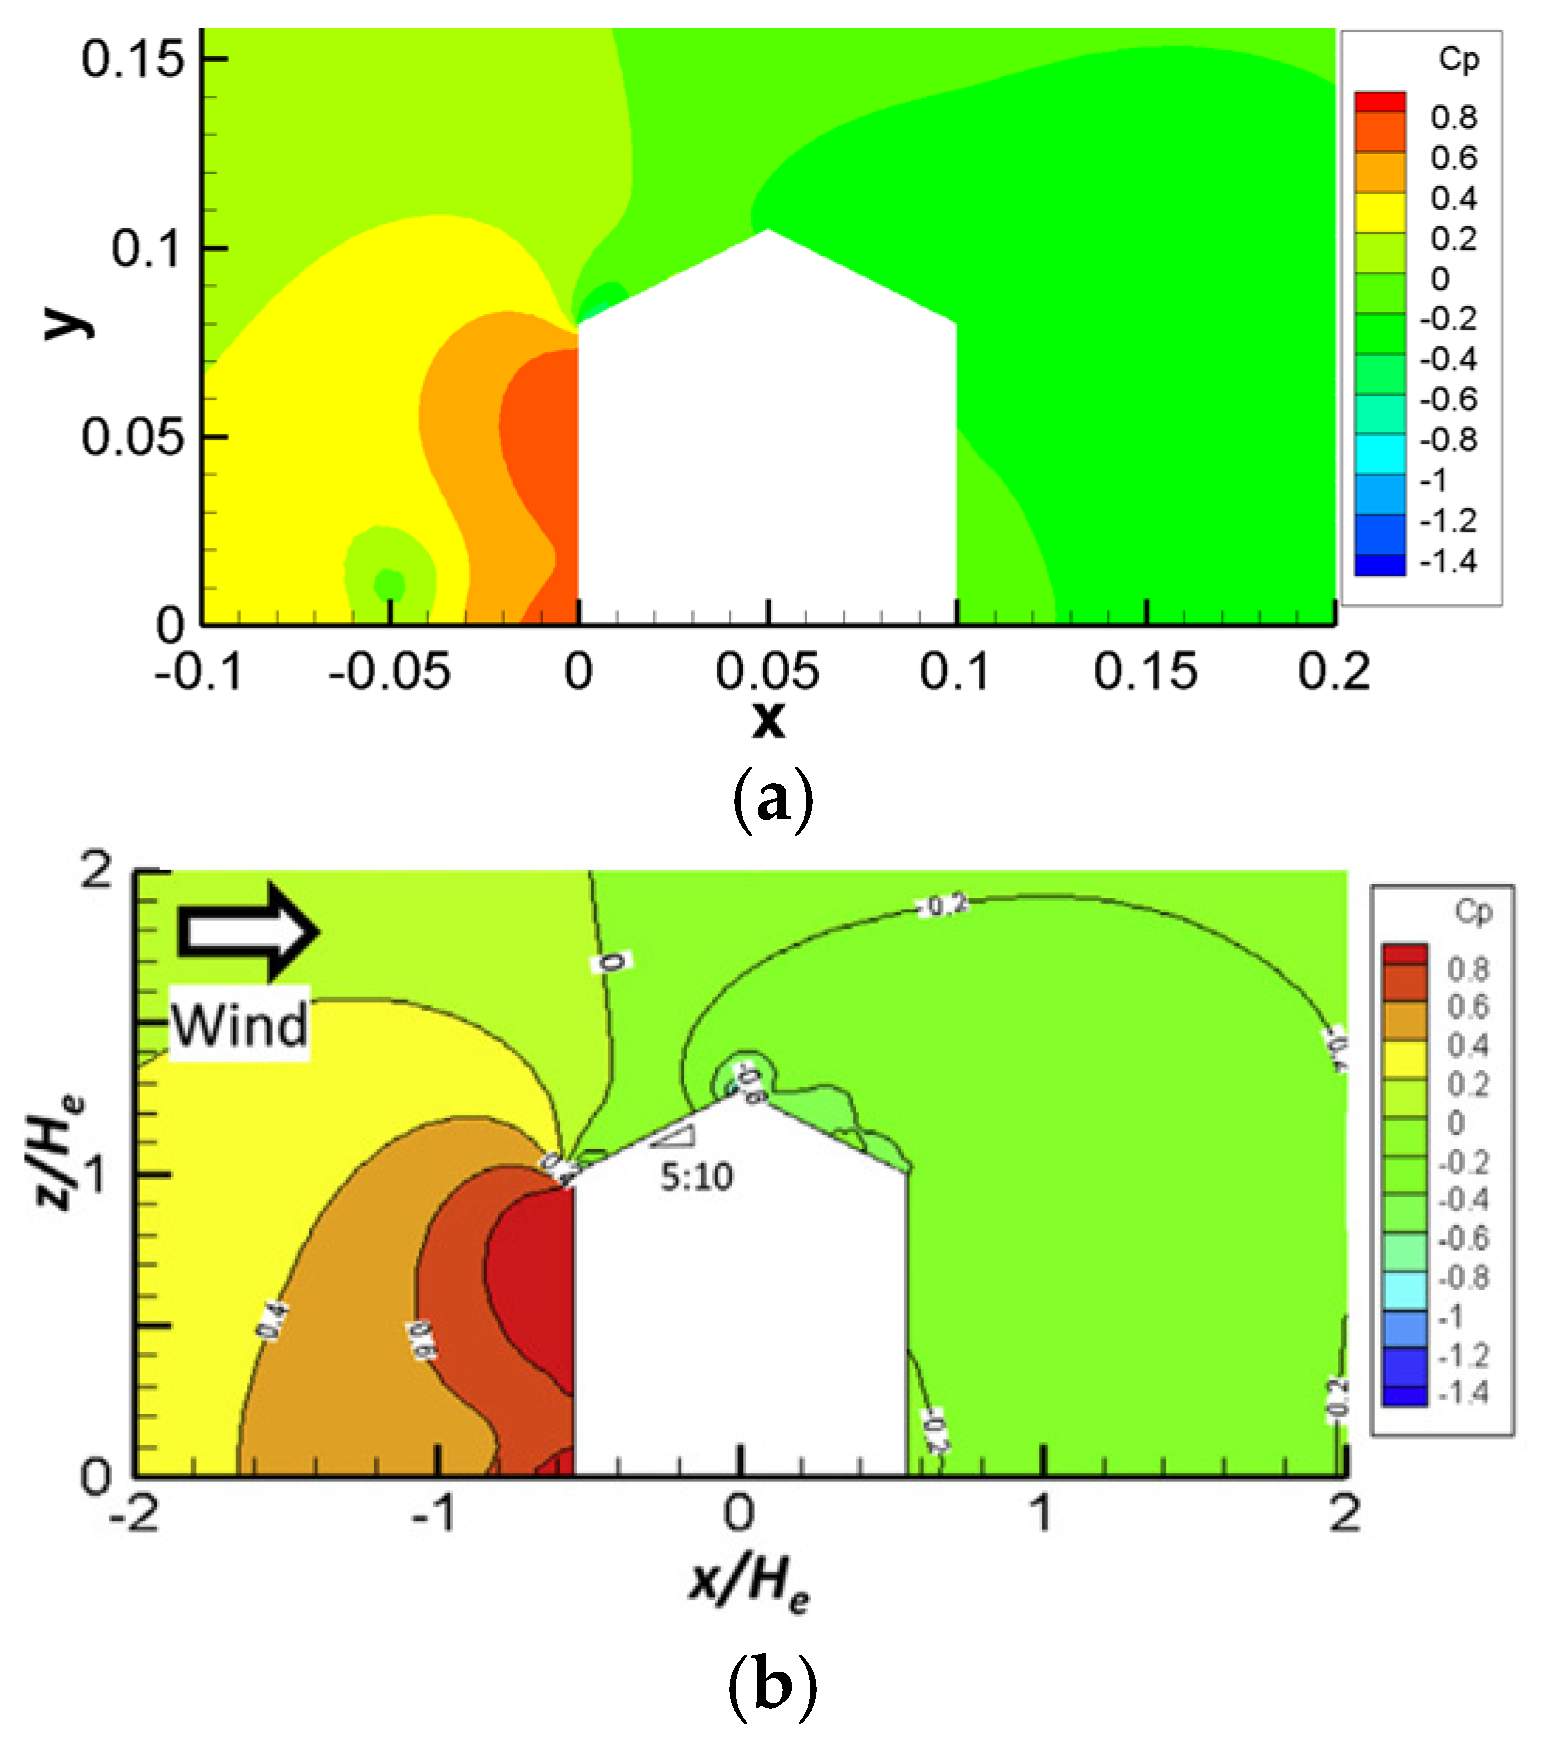
2.5. Grid Sensitivity and Validation of the Model
2.6. Sensitivity Analysis
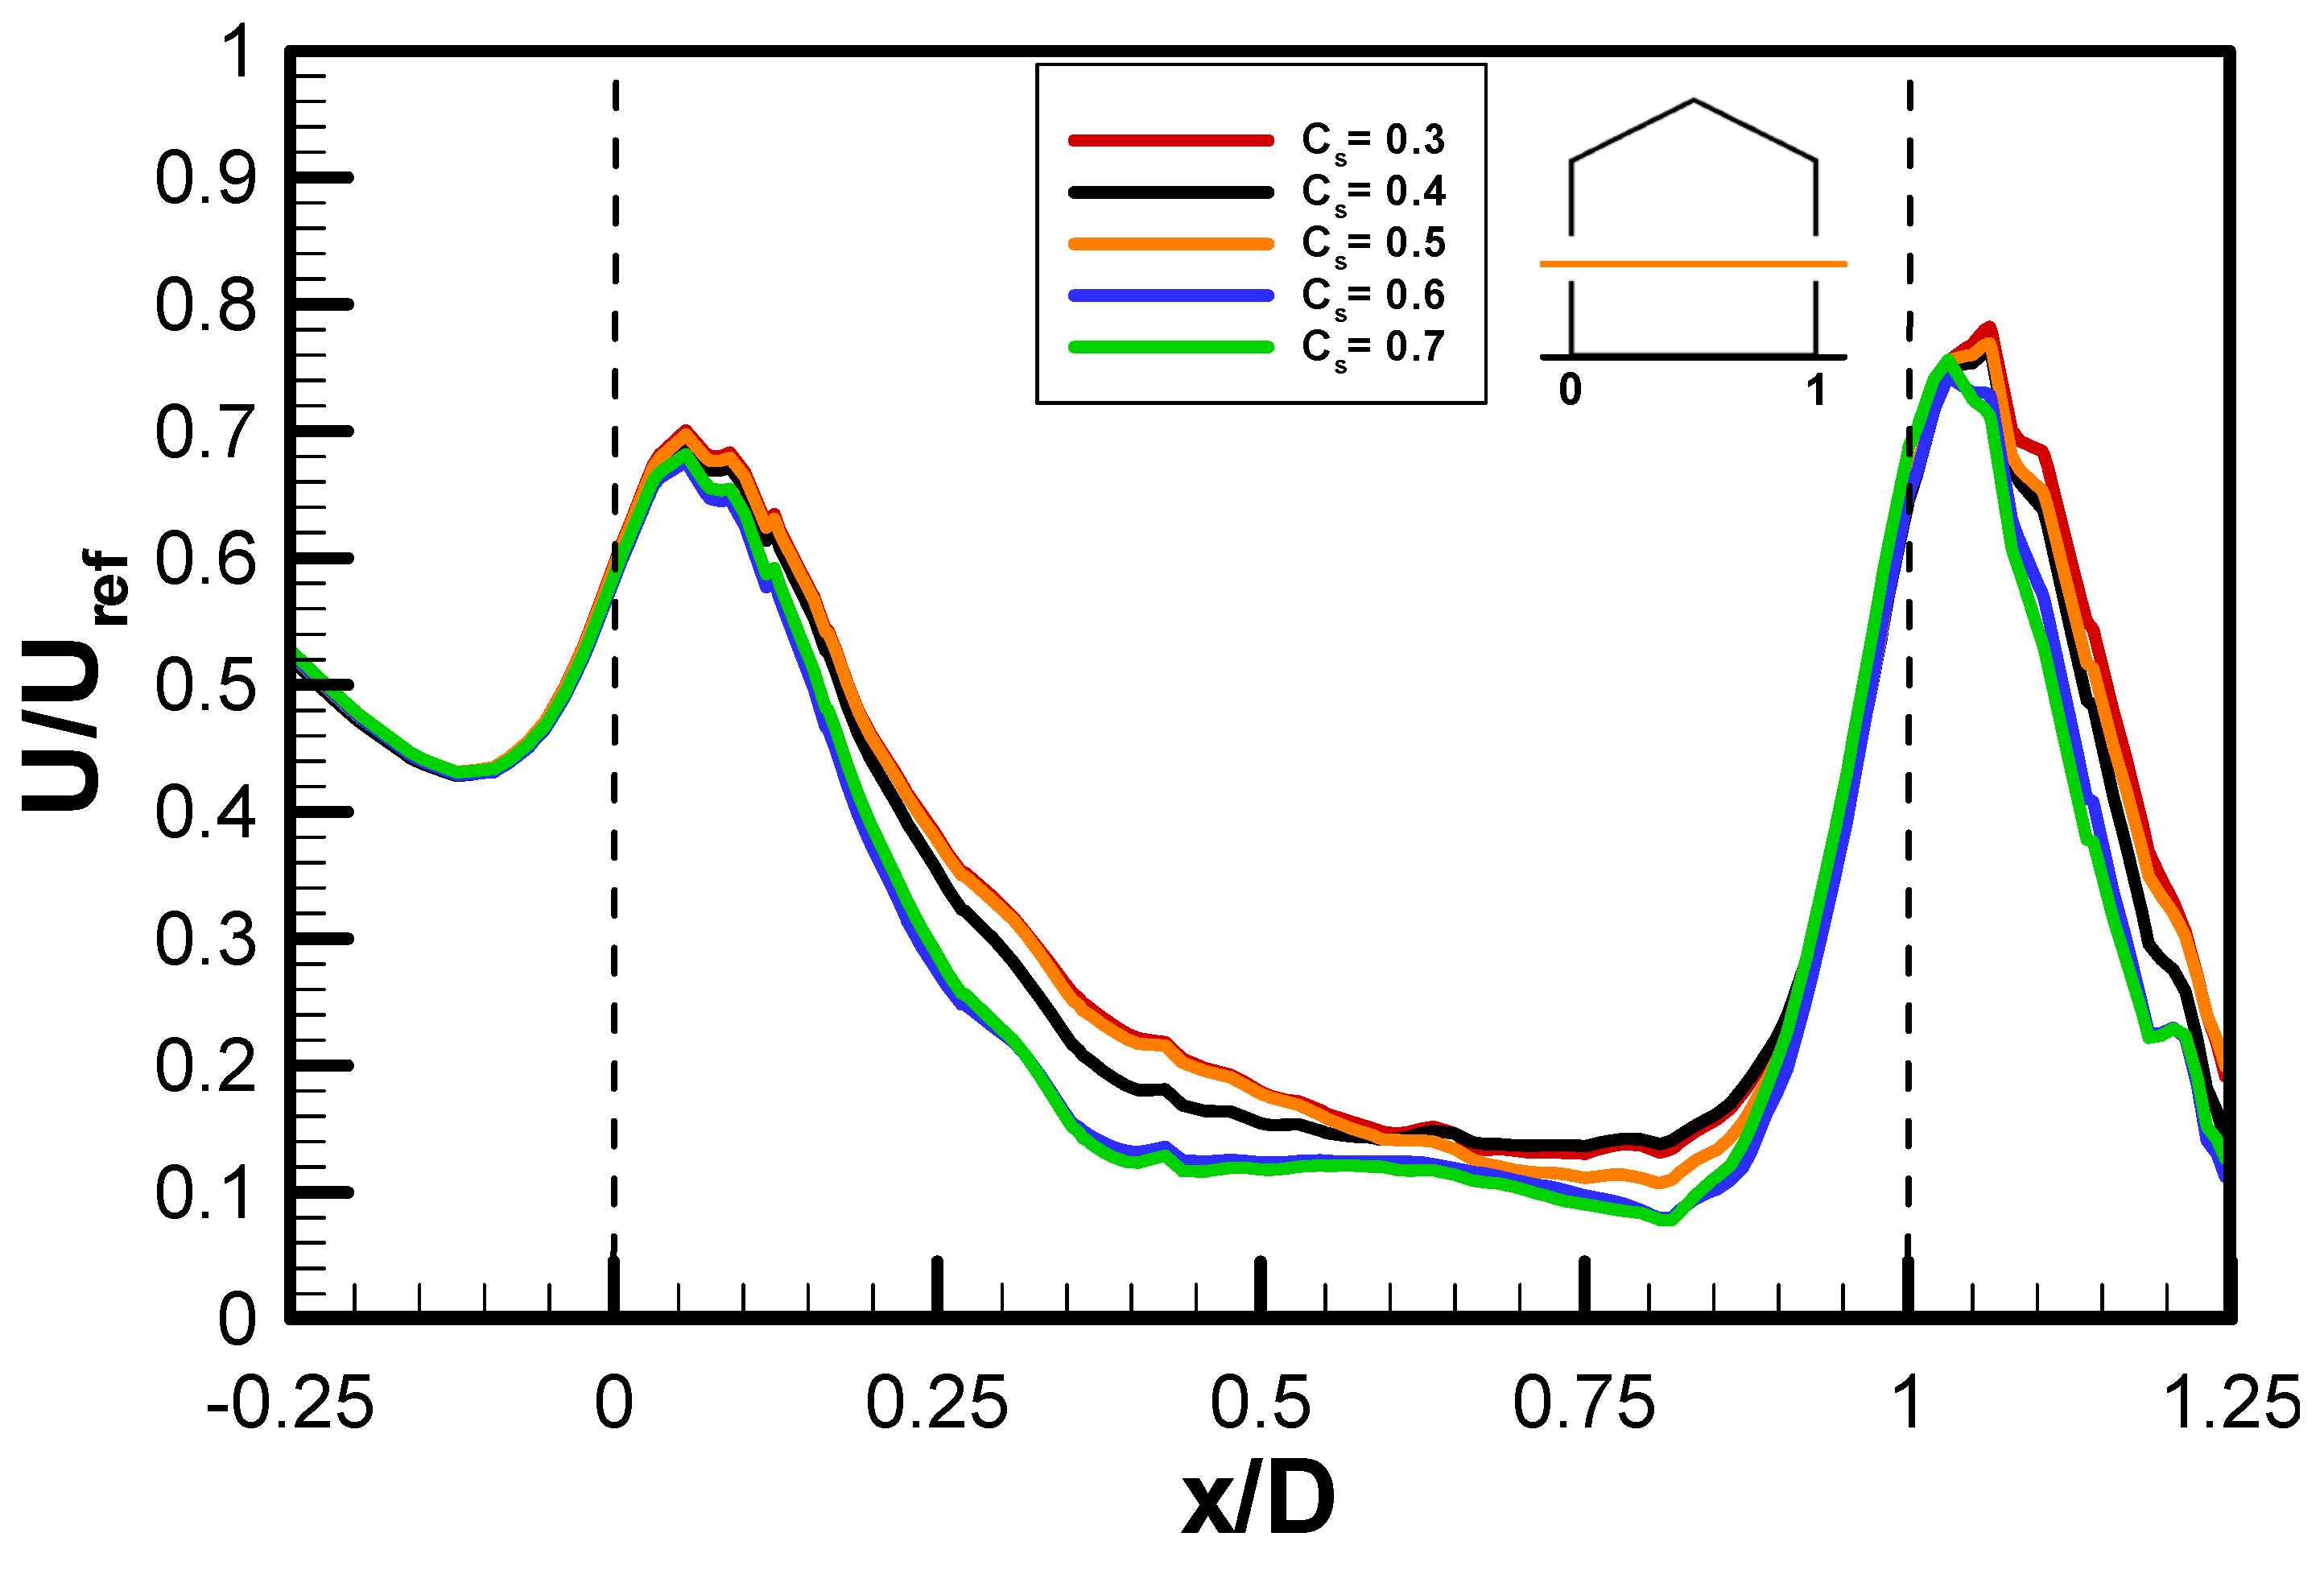
2.6.1. Impact of Roughness Constant
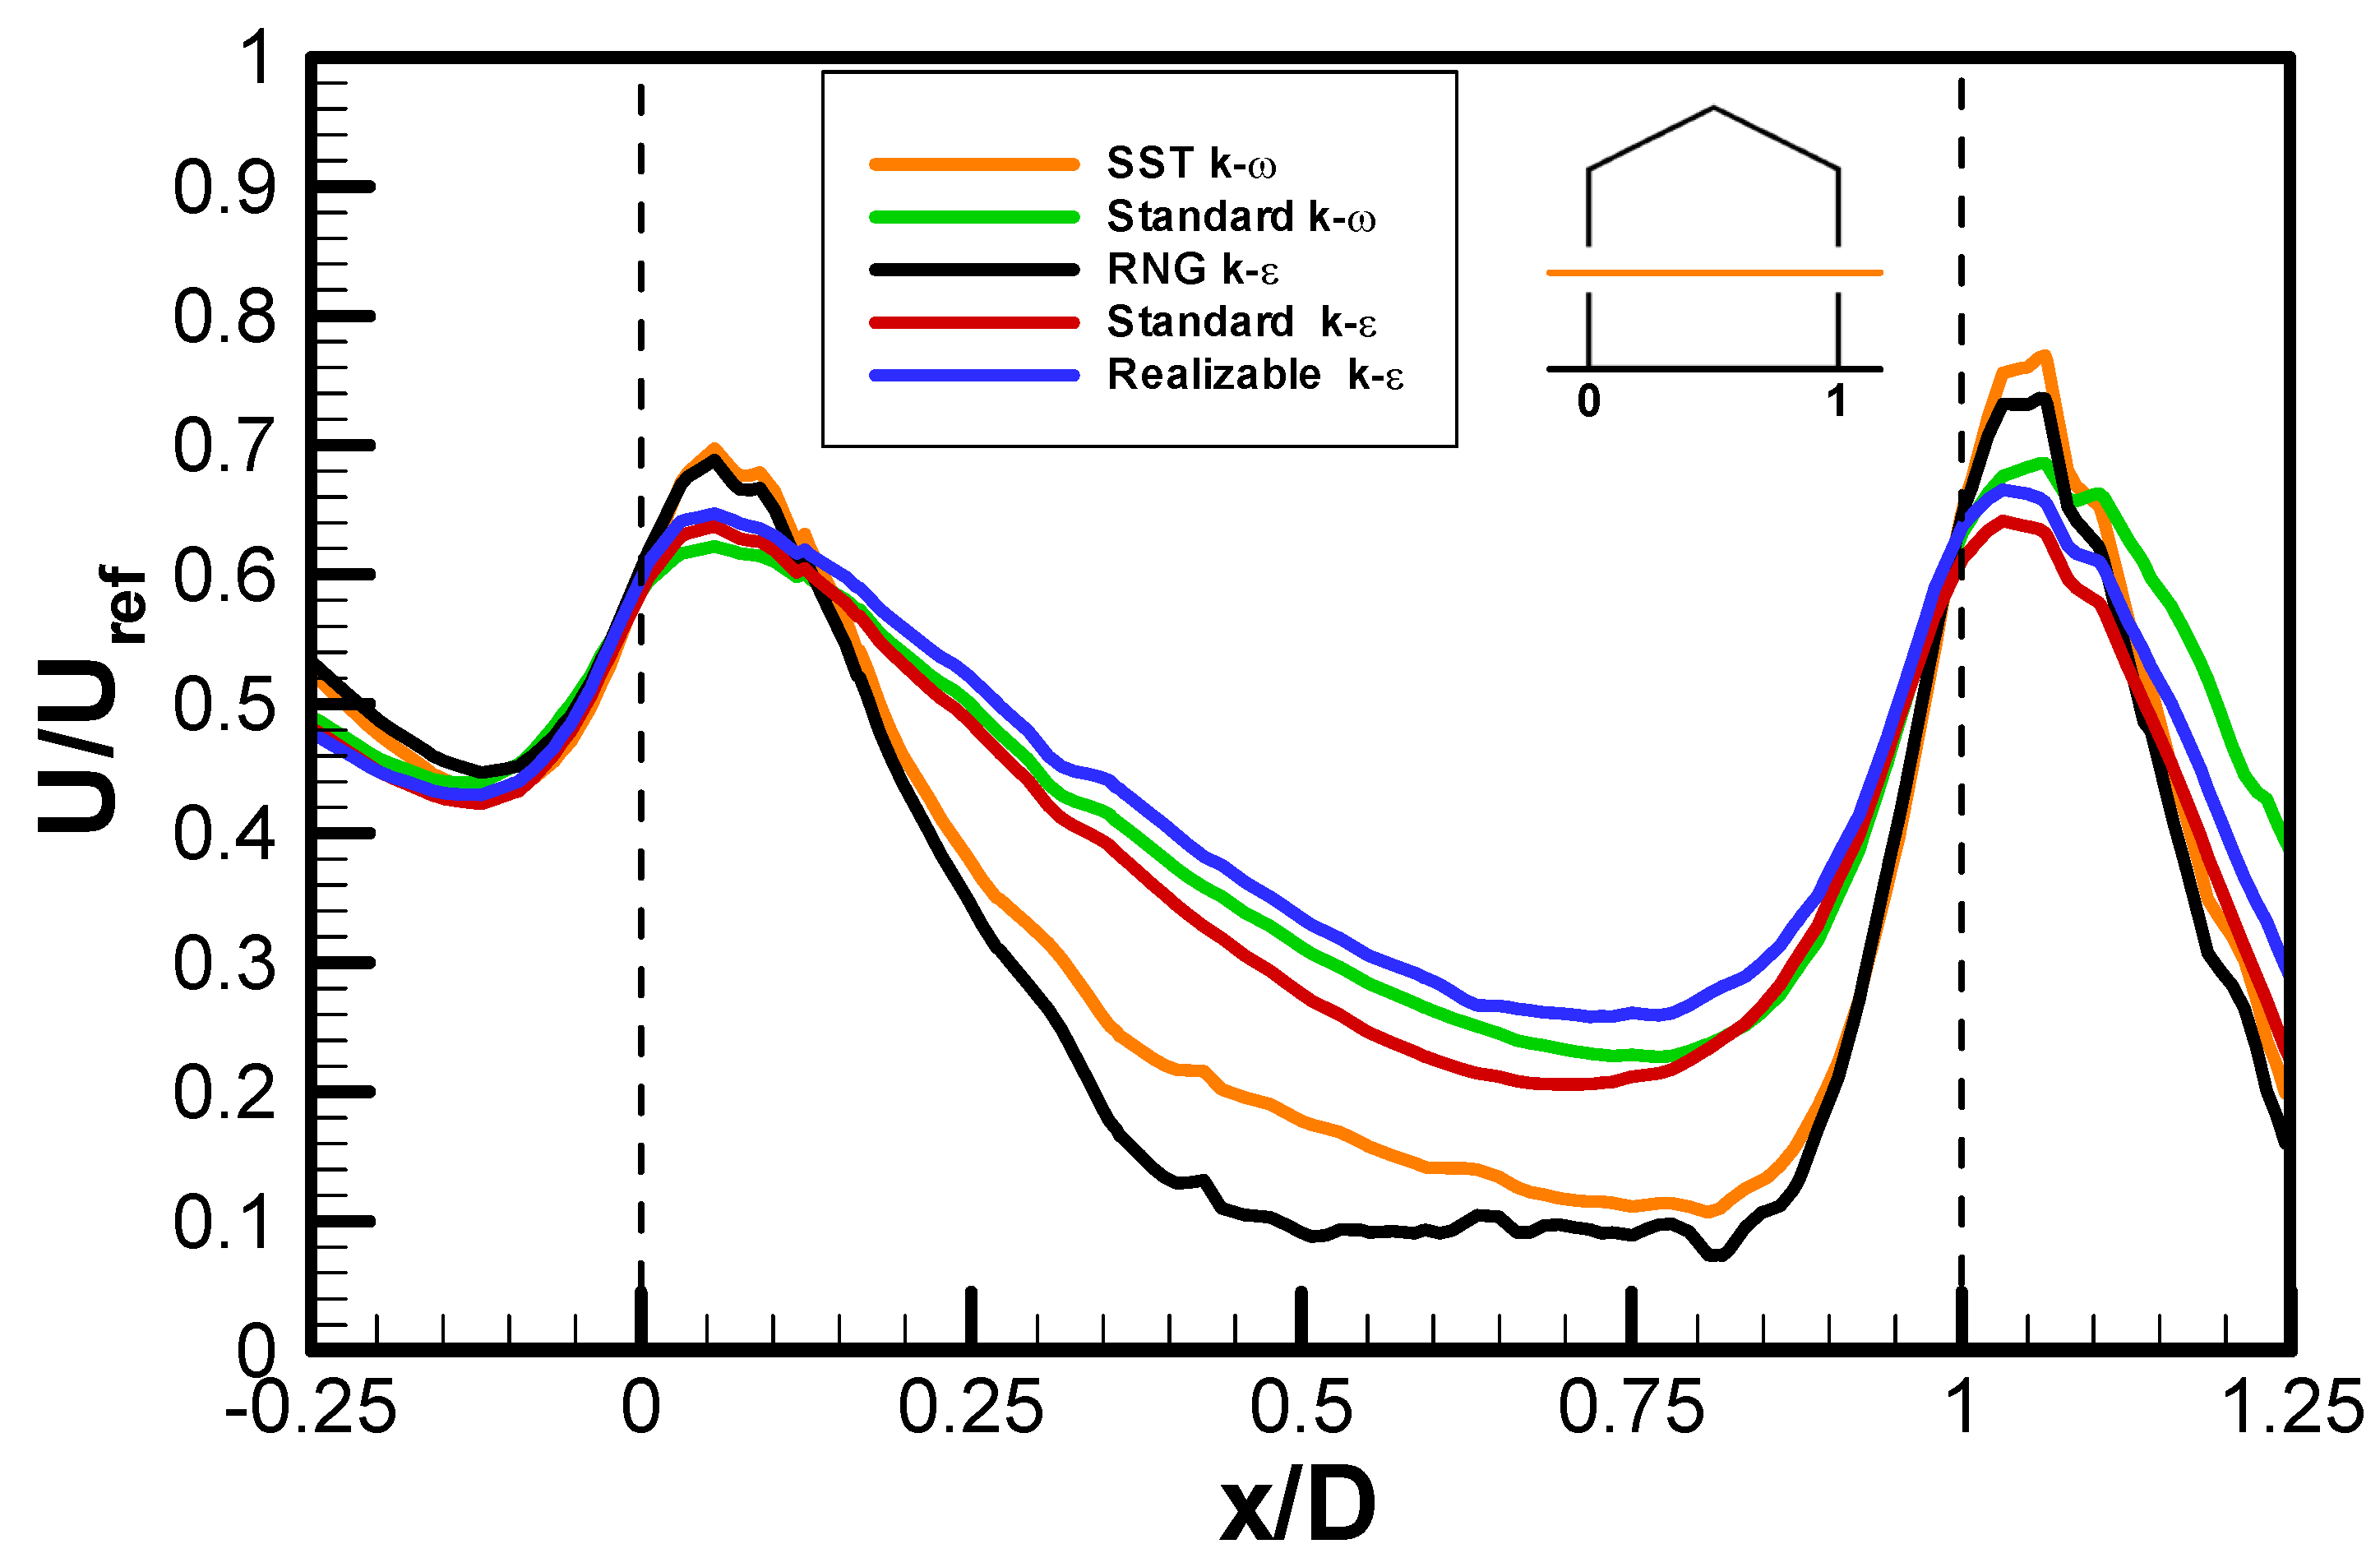
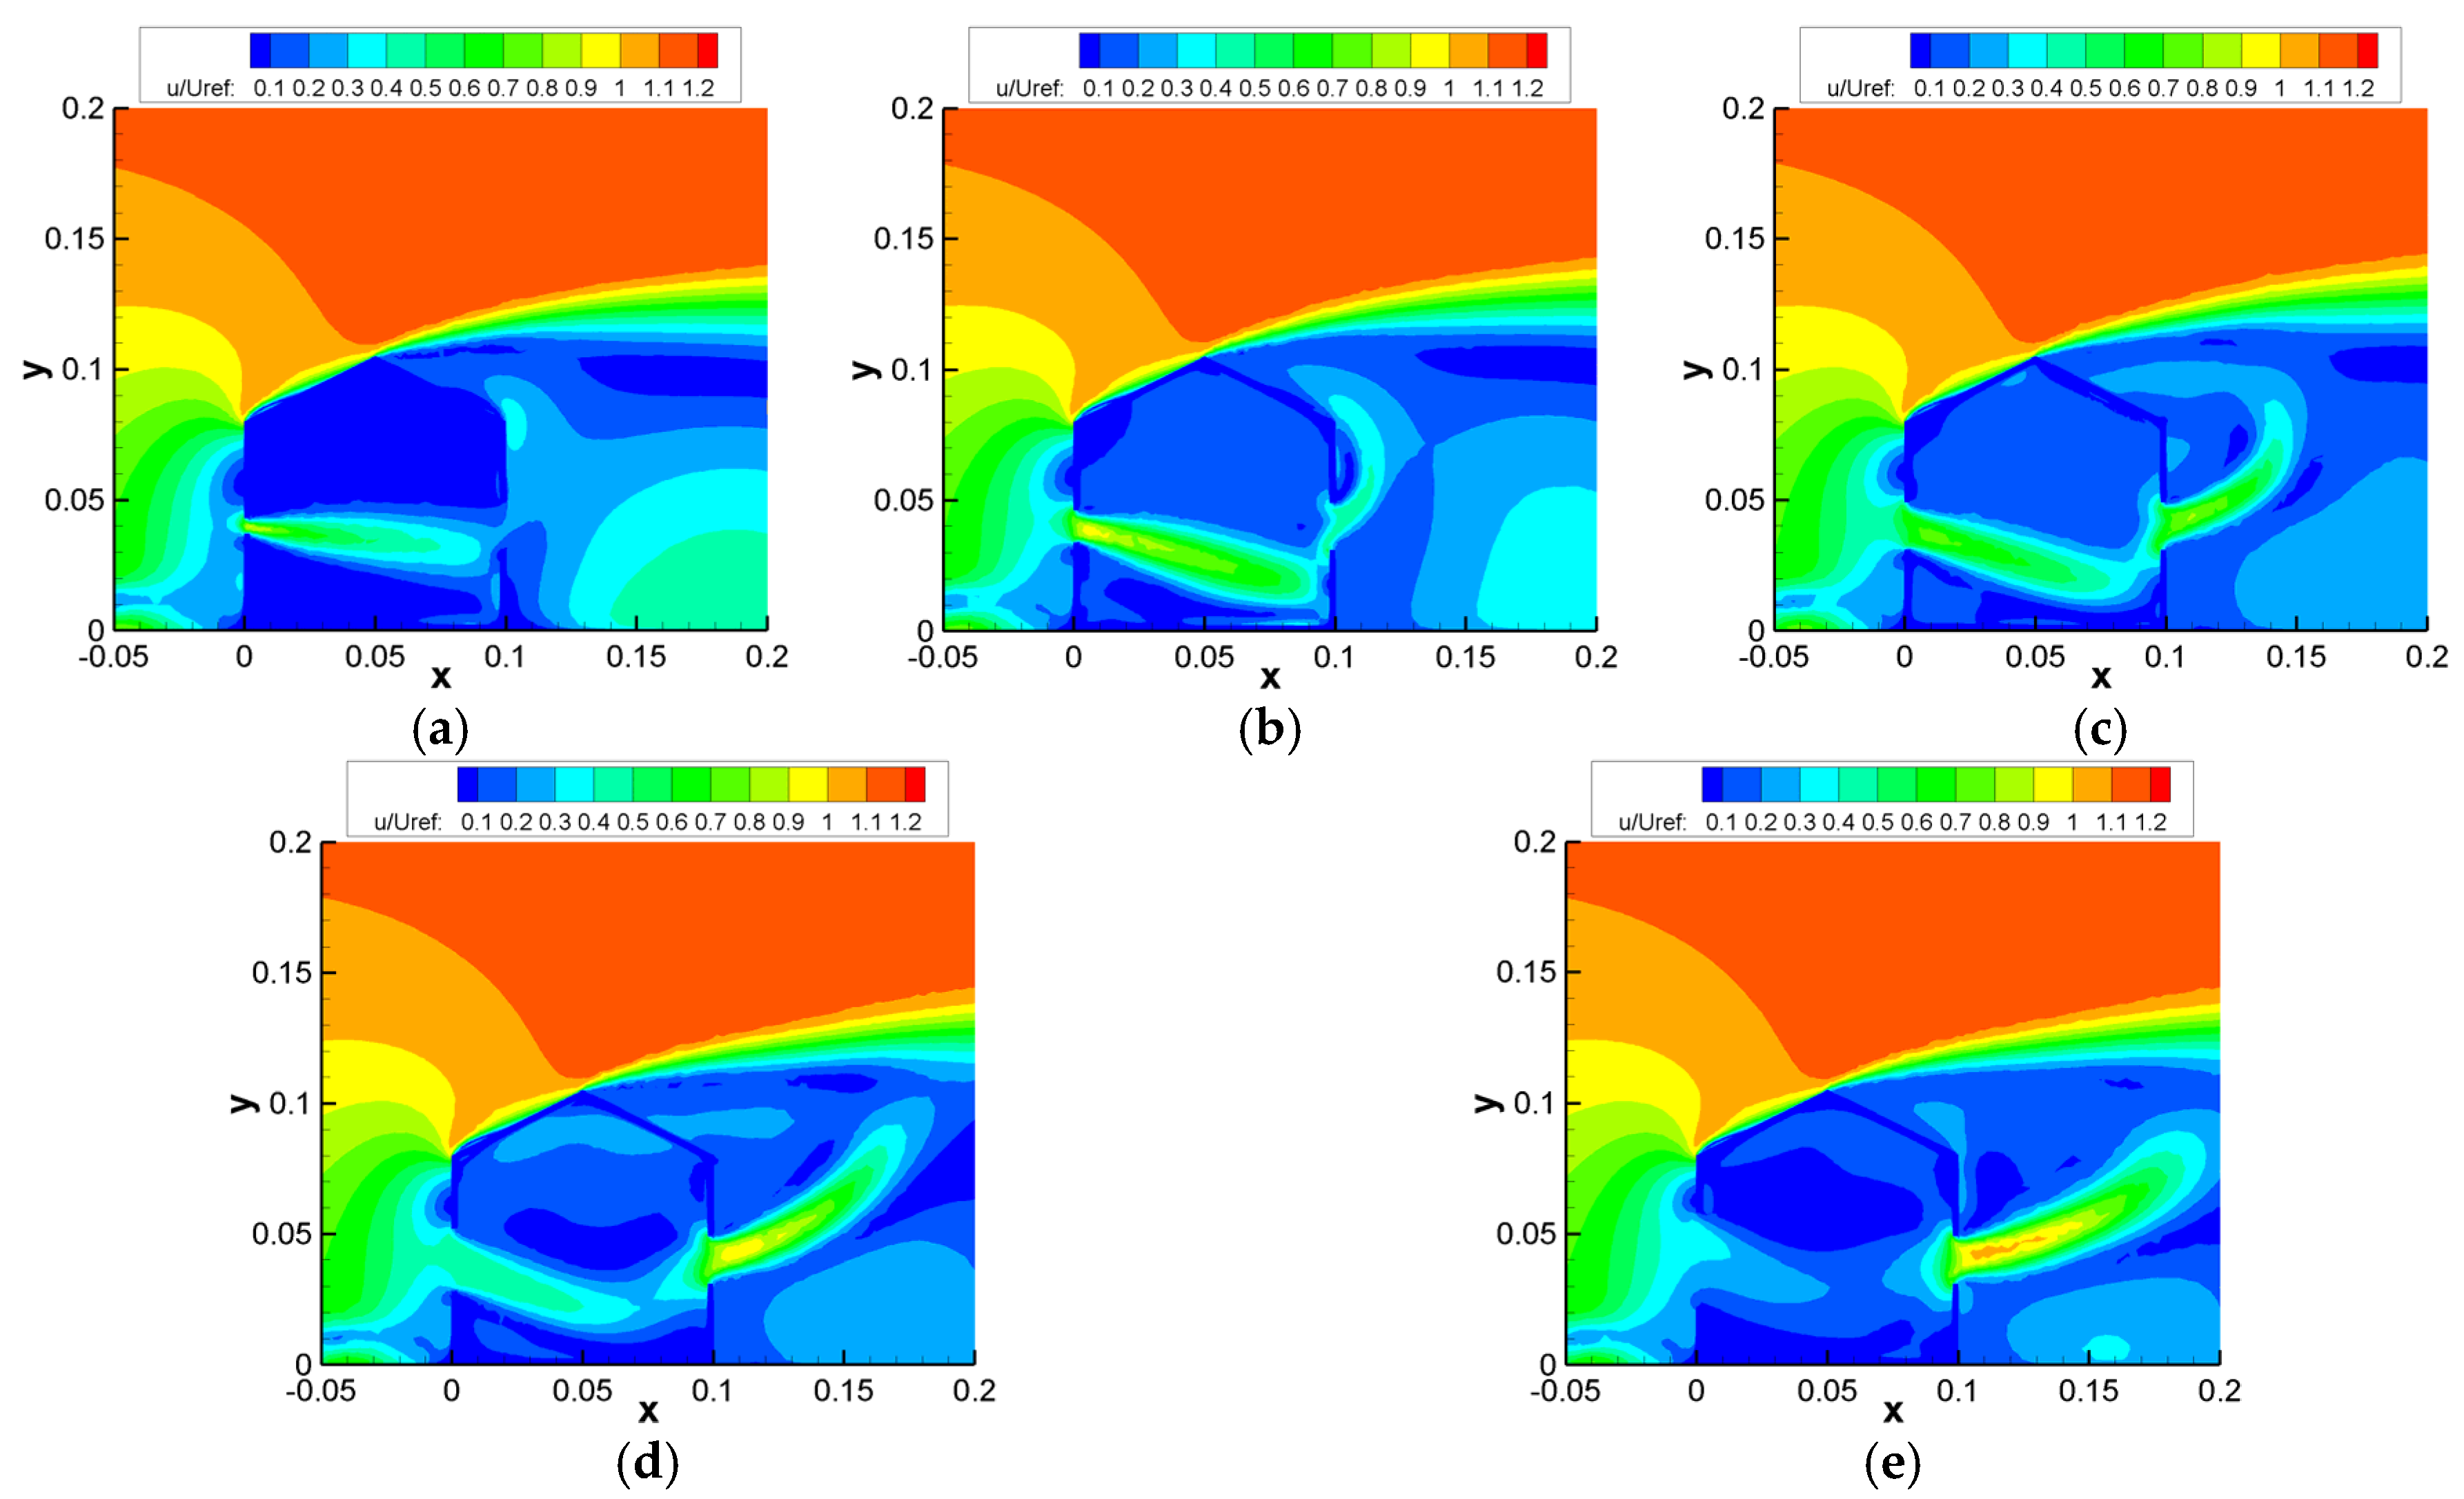
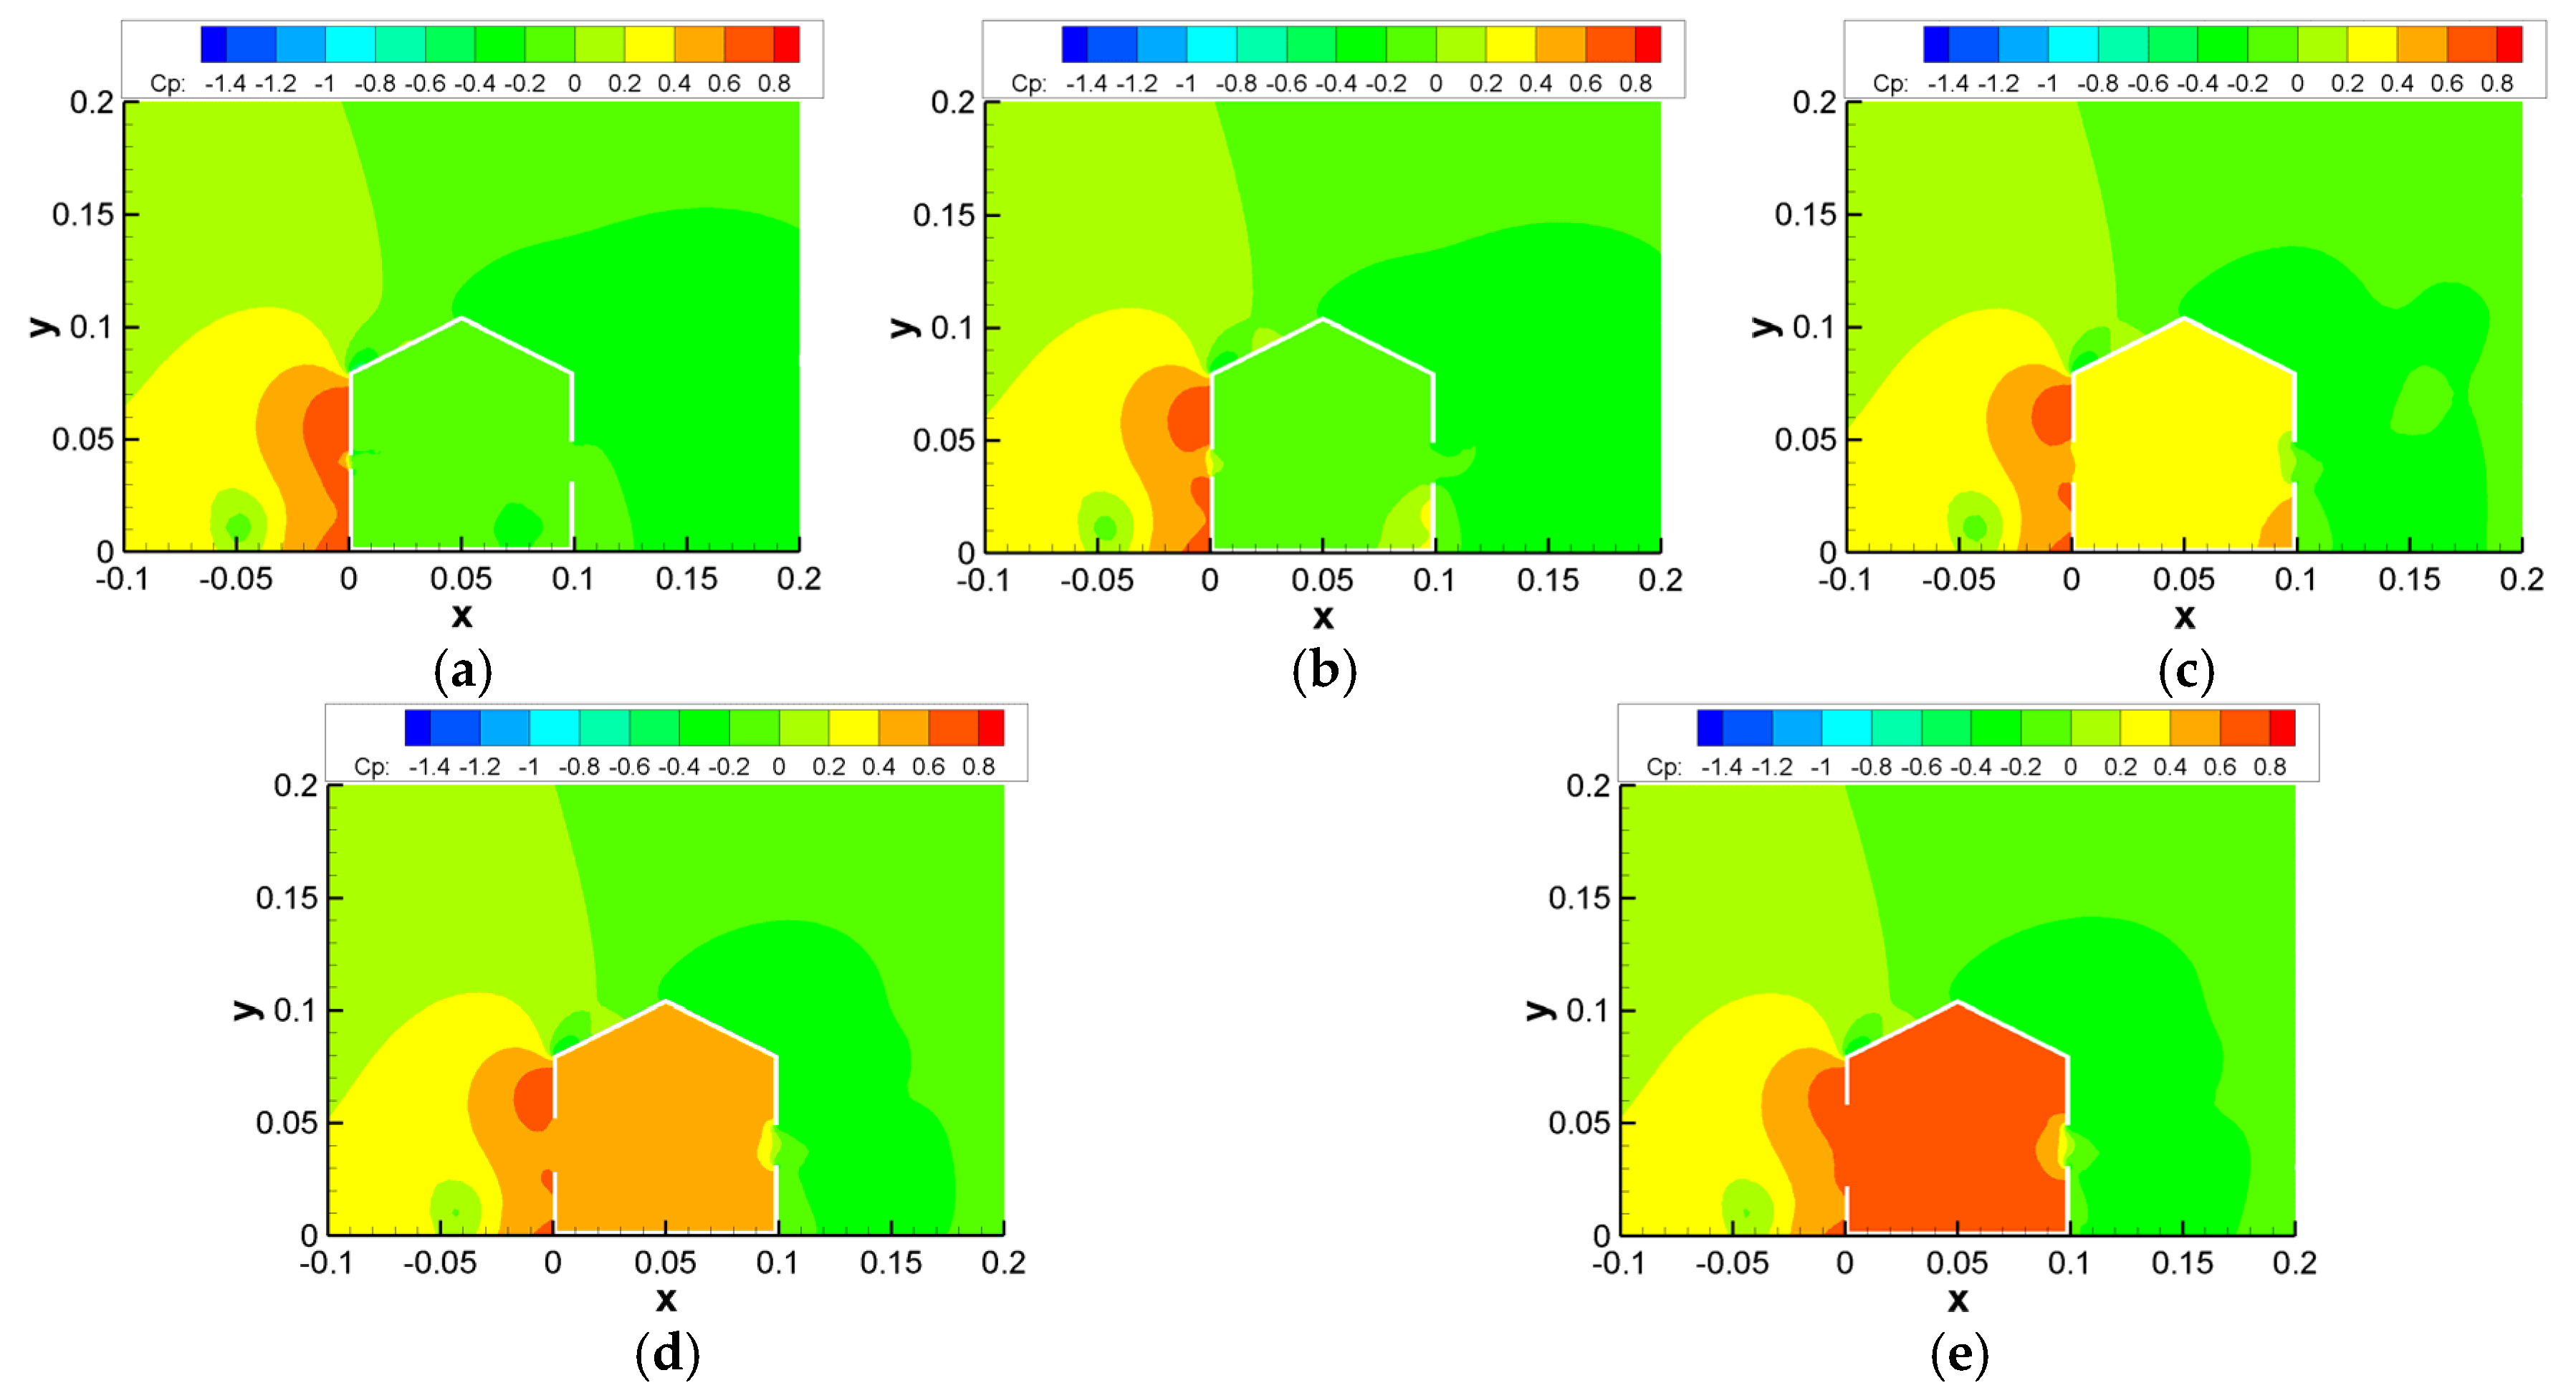
2.6.2. Impact of Turbulence Model
3. Results
3.1. Impact of Opening Sizes
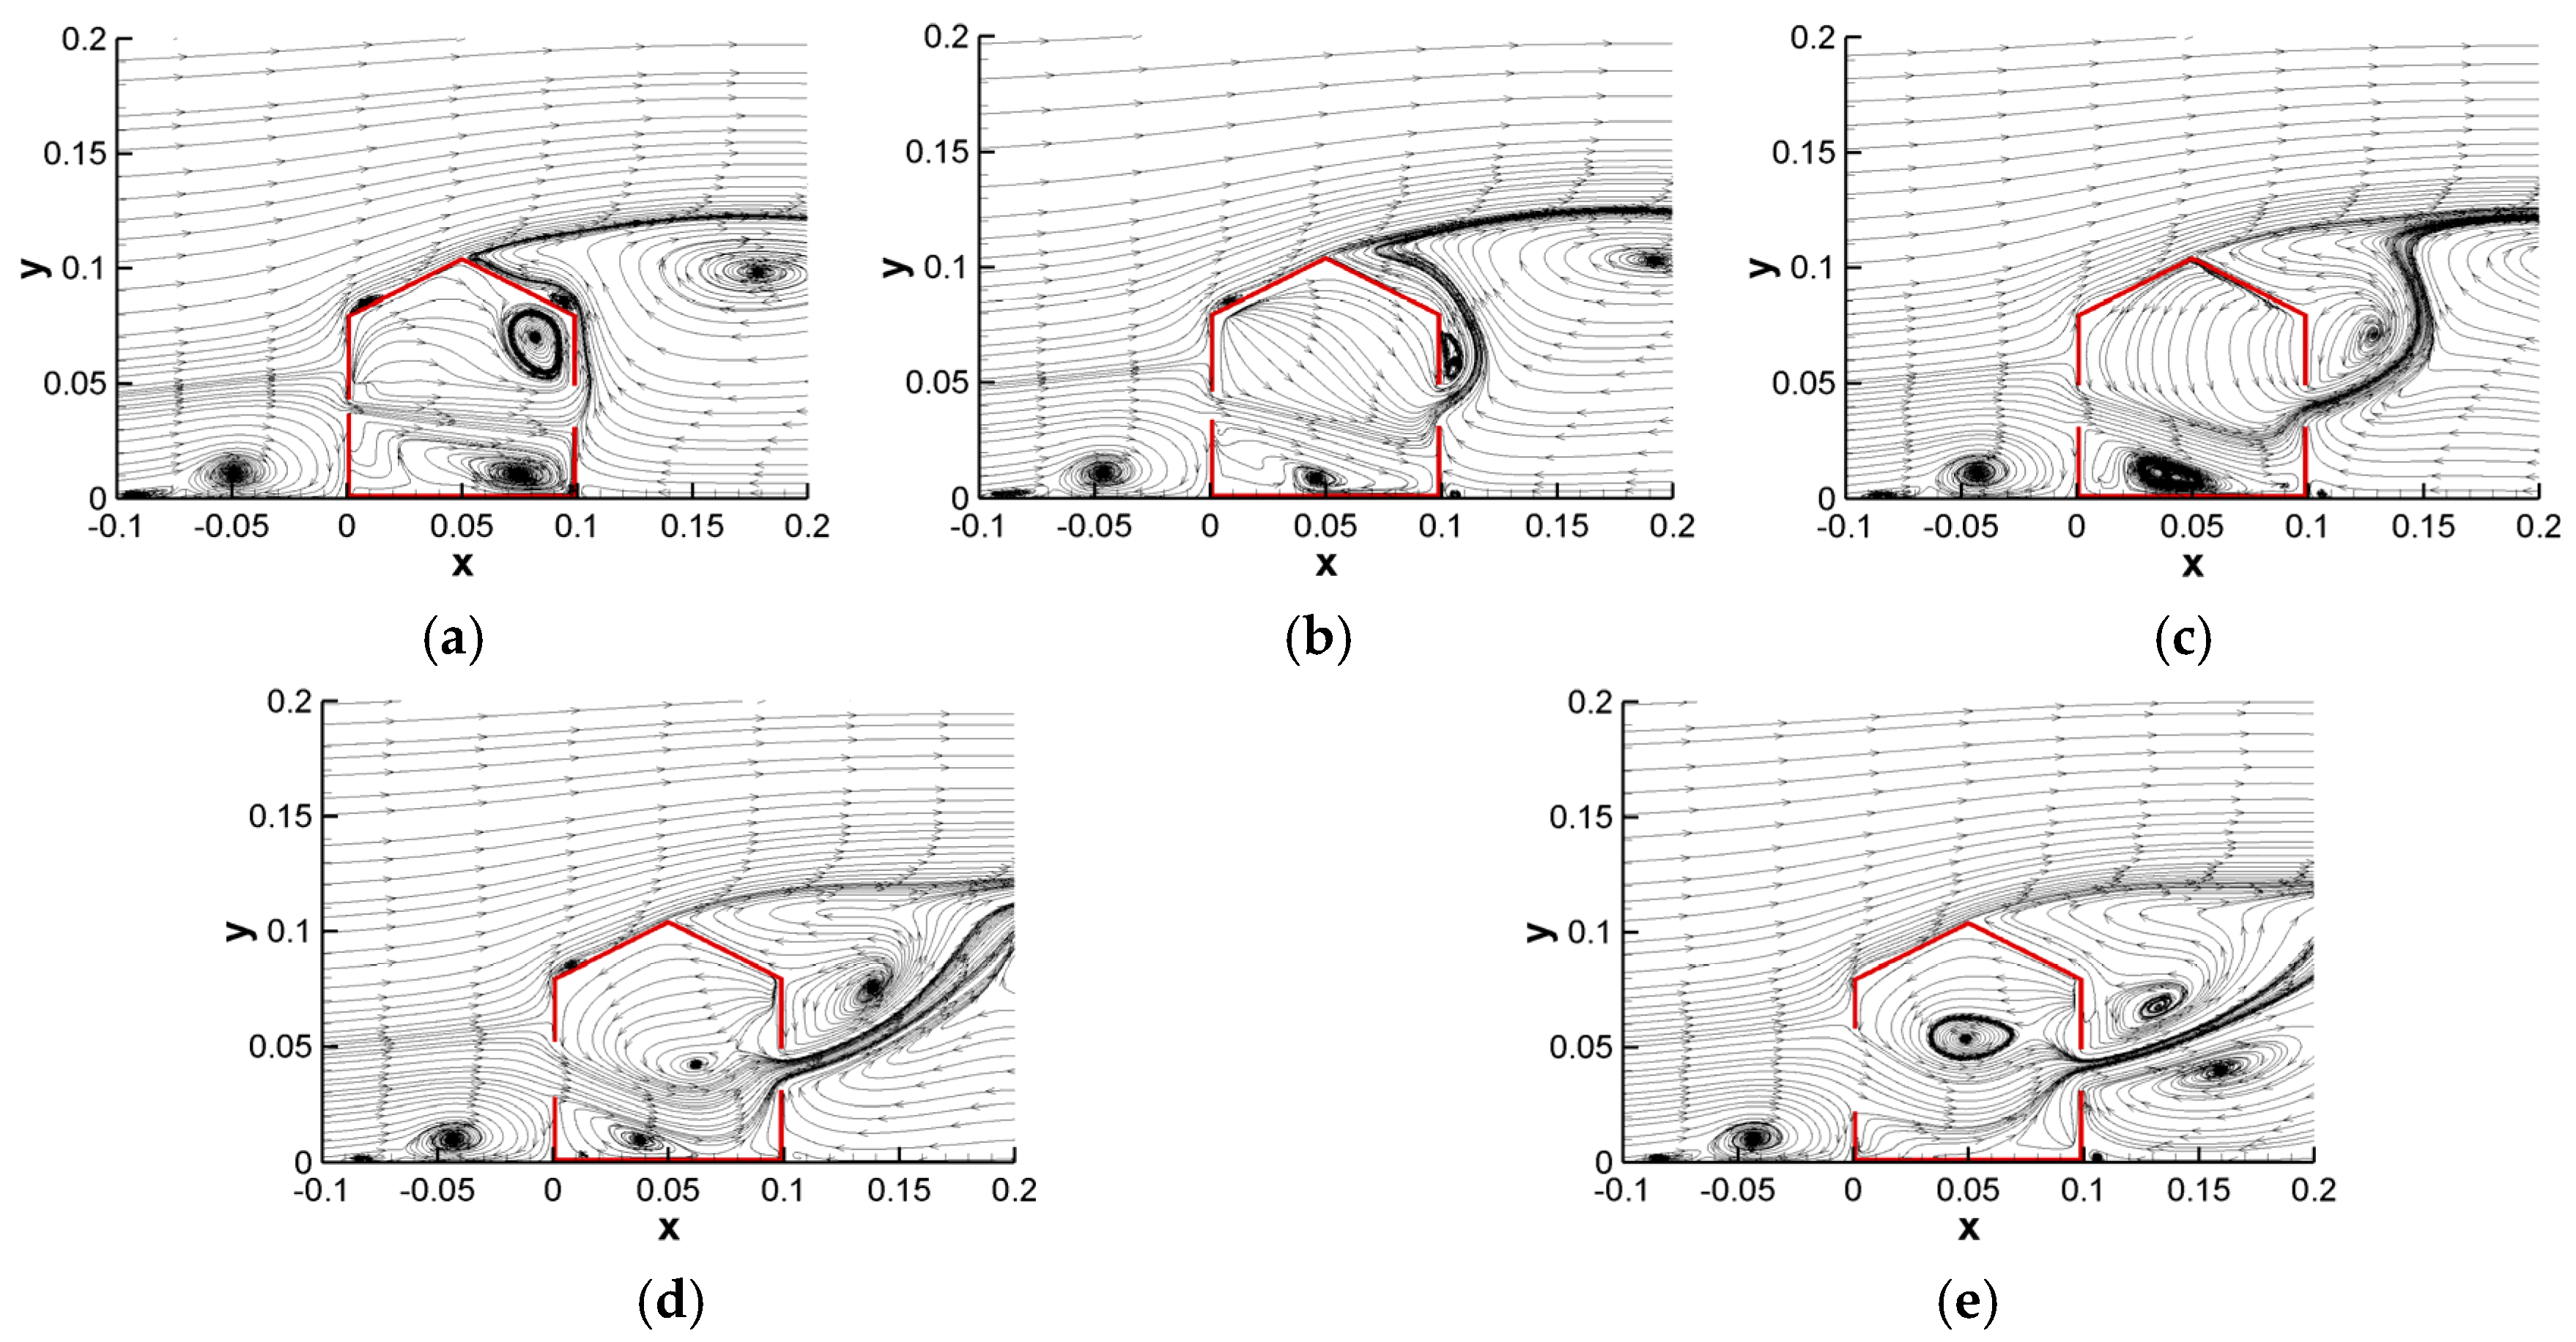
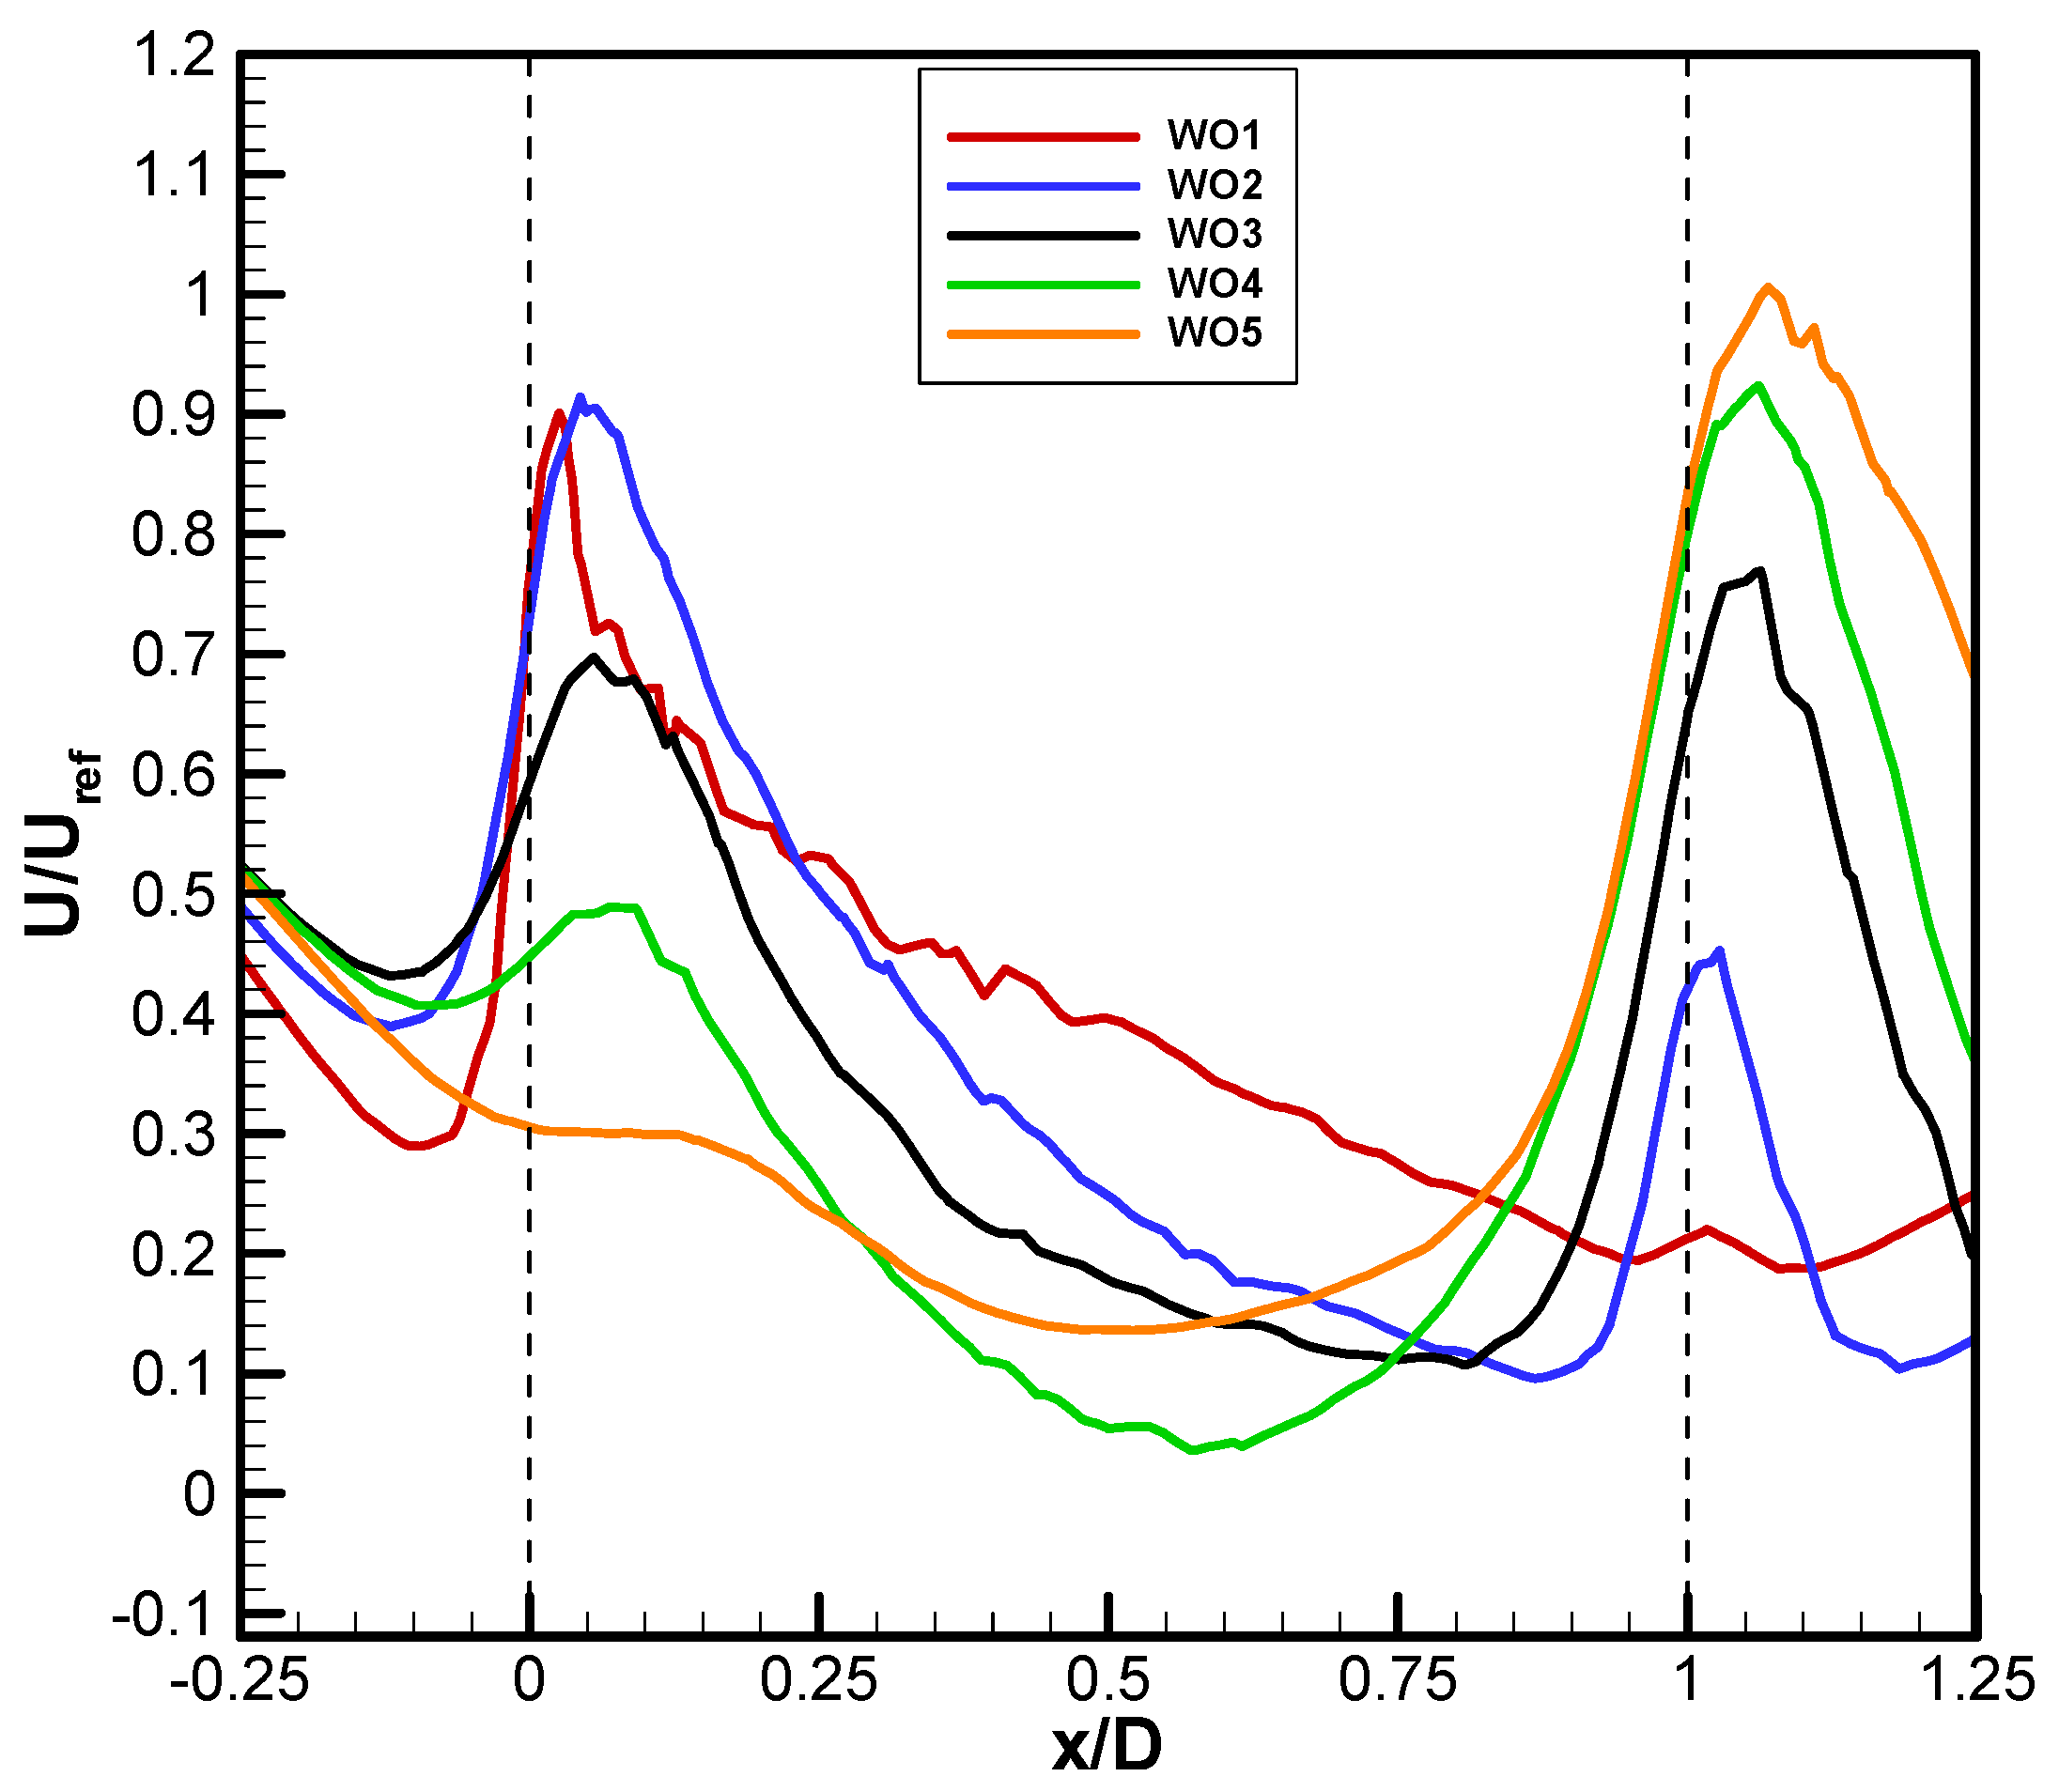
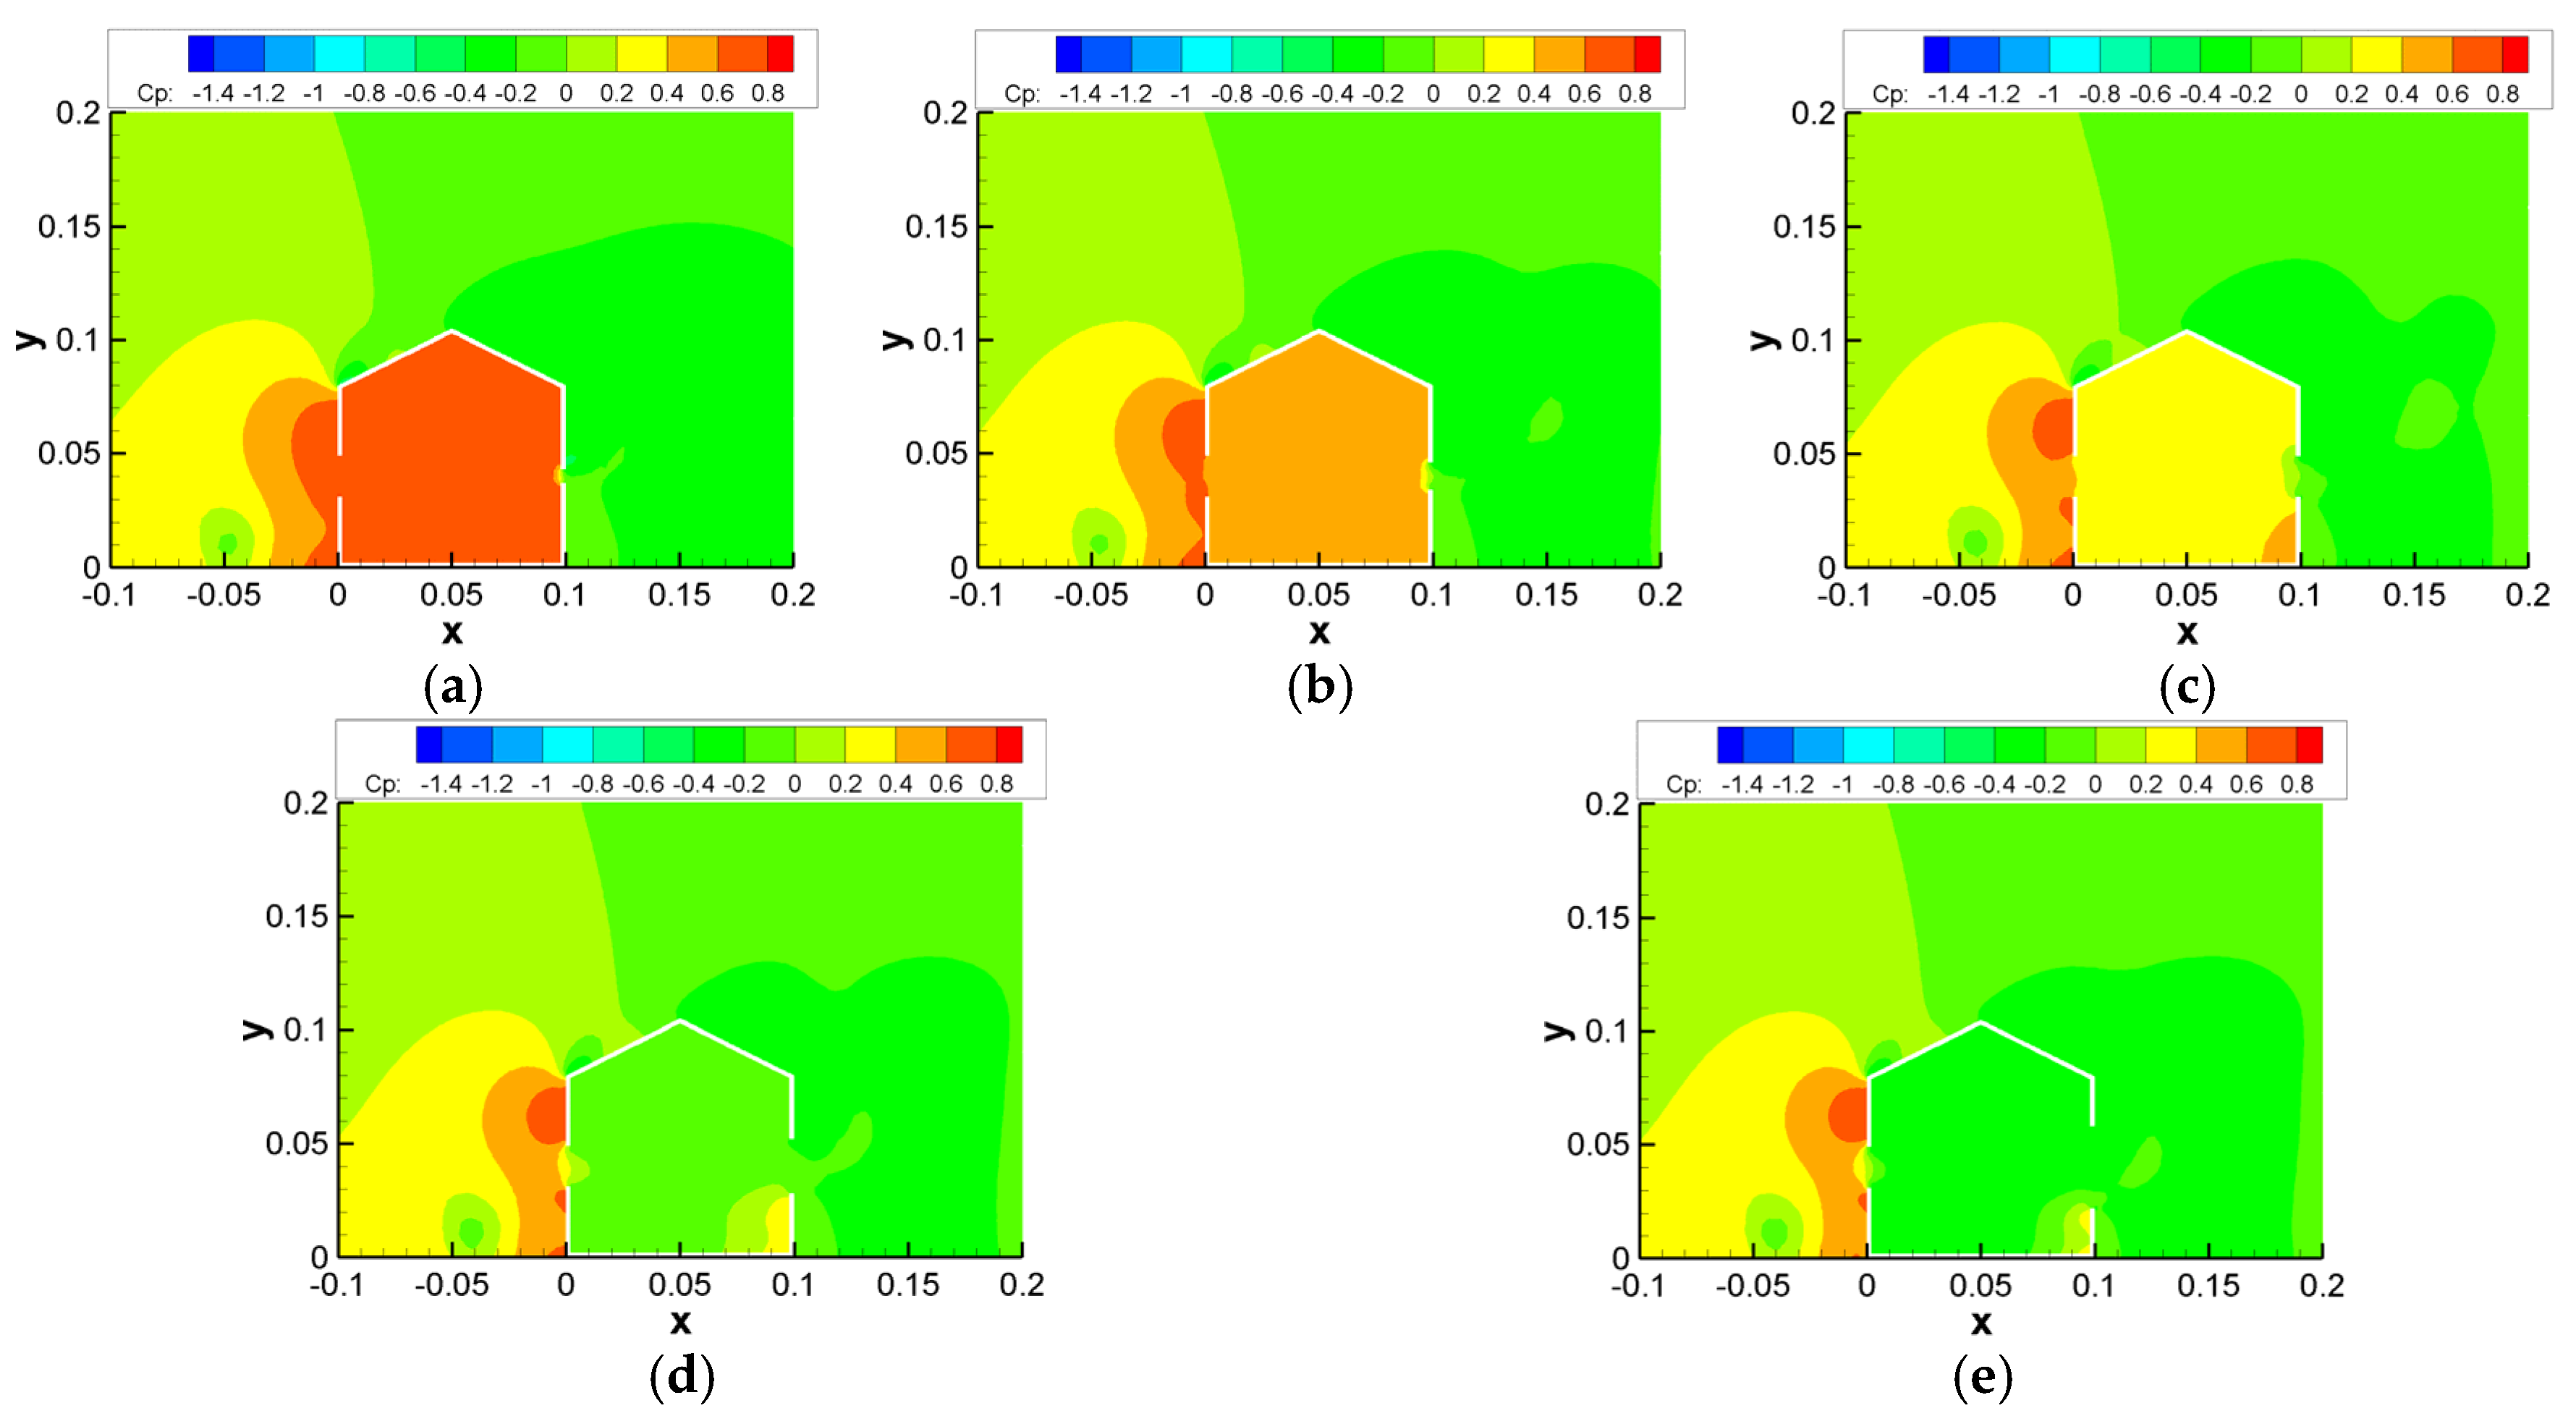
3.1.1. Results for Building Models with Varying Windward Opening Sizes
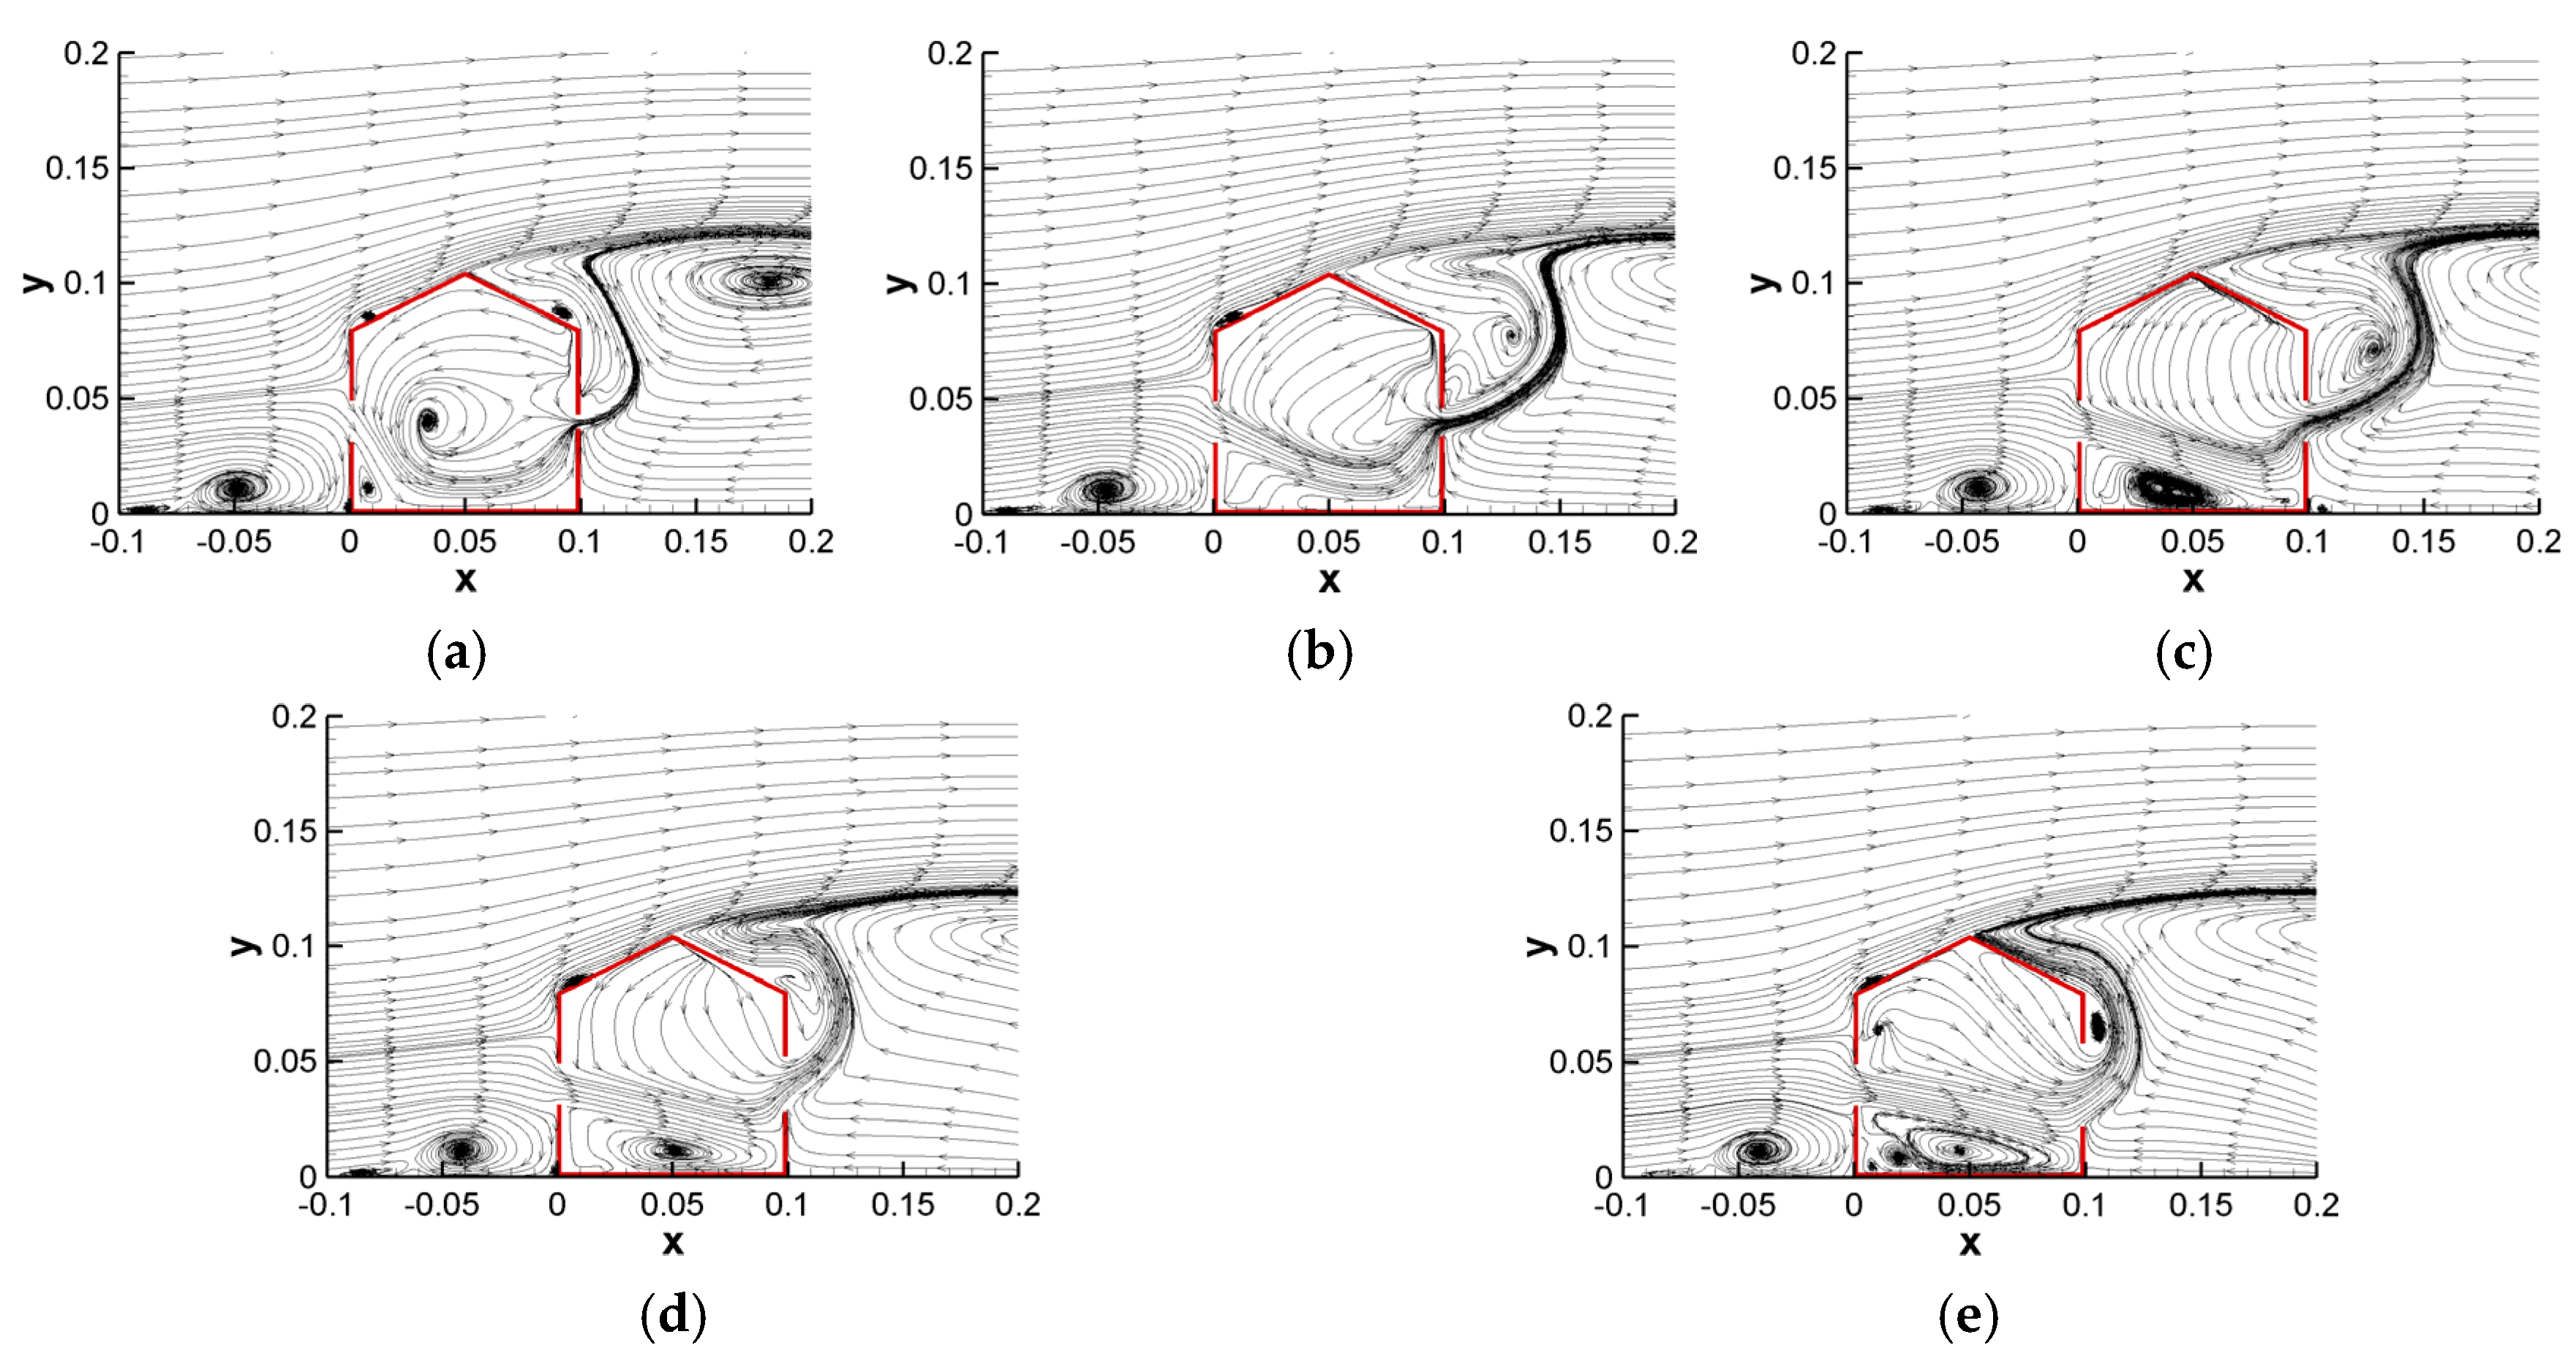
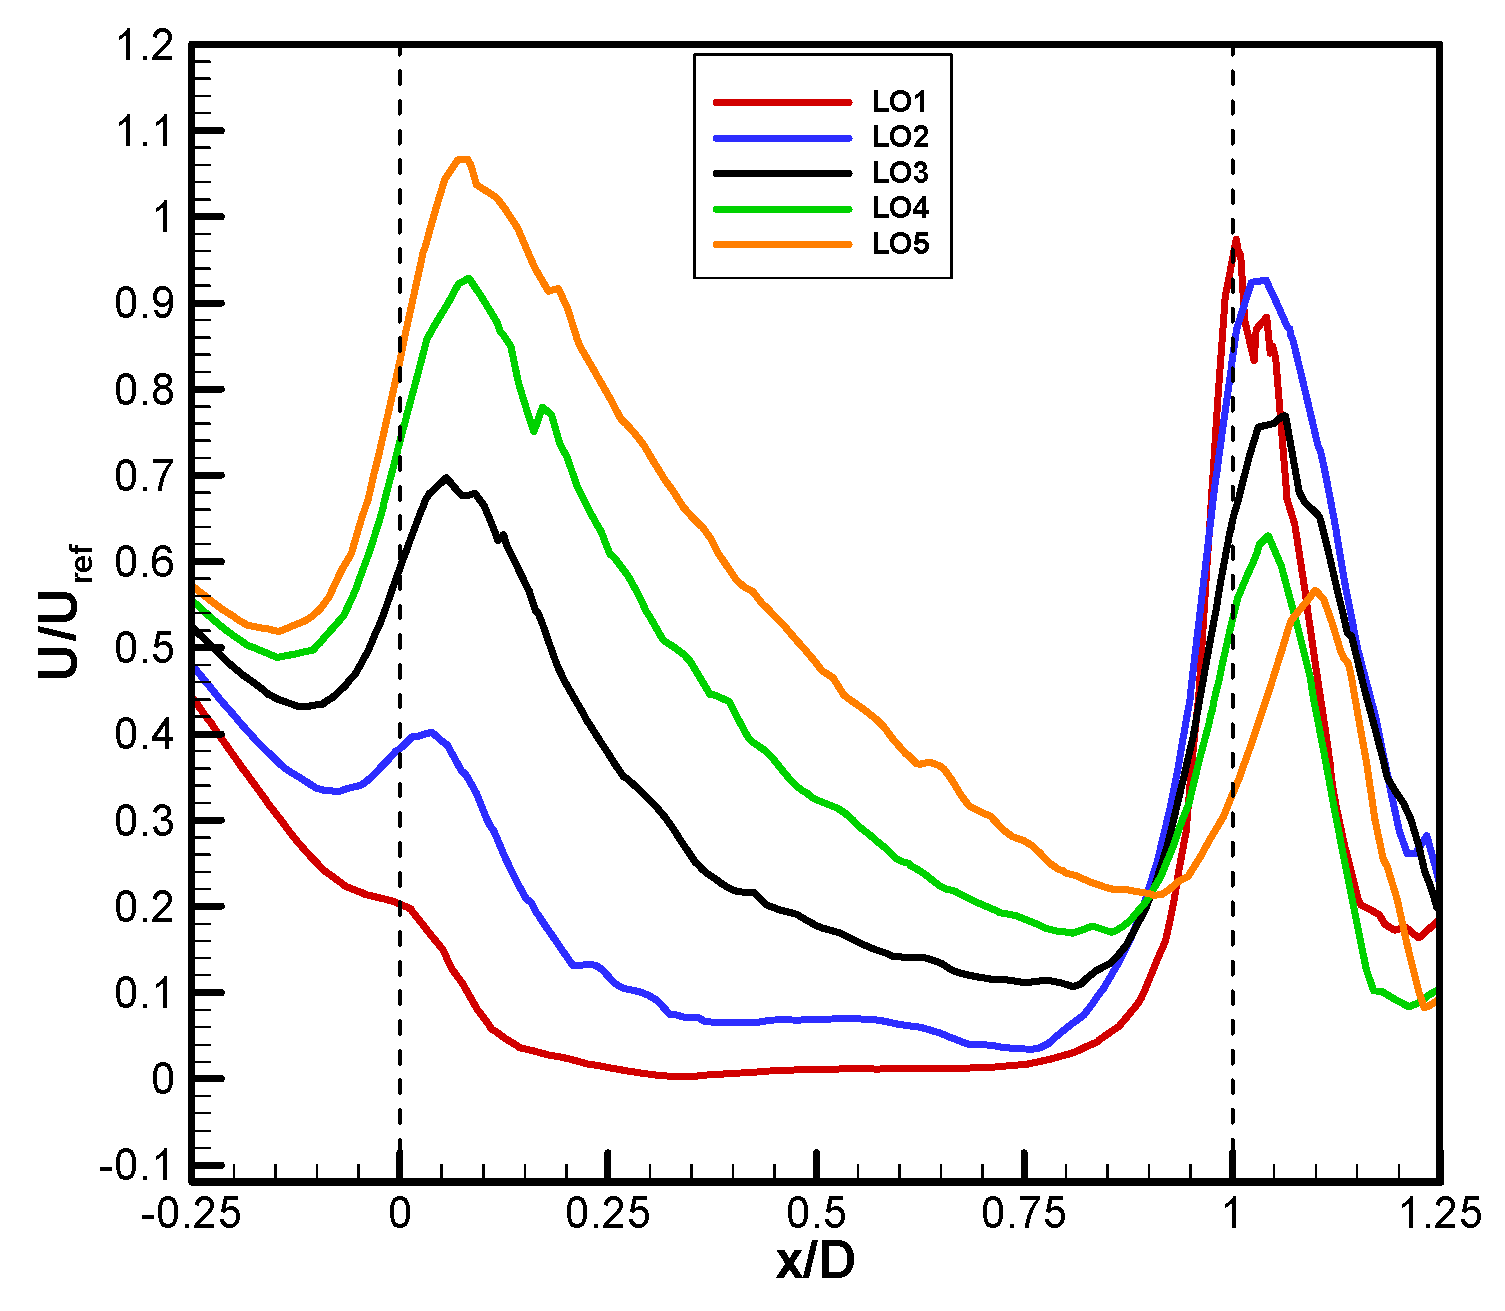
3.1.2. Results for Building Models with Varying Leeward Opening Sizes
3.2. Impact of Opening Positions
3.2.1. Results for Building Models with a Fixed 20 mm Inlet Position and Varying Outlet Positions
3.2.2. Results for Building Models with a Fixed 40 mm Inlet Position and Varying Outlet Positions
3.2.3. Results for Building Models with a Fixed 60 mm Inlet Position and Varying Outlet Positions
3.3. Analysis of Ventilation Rate Results
3.4. Limitations and Future Work
- This study considered an isolated building model.
- All simulations were performed under isothermal conditions.
- The study considered a constant wind perpendicular to the inlet openings.
- No internal obstacles were considered within the building model.
4. Conclusions
- It was observed that increasing the inlet opening has a strong but non-linear effect on the distribution and intensity of airflow throughout the volume. Although a significant increase in outlet velocity was observed as the inlet opening increased, the fact that the minimum velocity in the middle region occurred at WO4 and WO5 indicated a complex relationship between the opening size and the internal flow balance. The finding suggests that in natural ventilation systems, optimized opening ratios rather than simply larger openings may provide more effective performance.
- It was stated that an improvement in the exit opening had a significant effect on the air flow inside the building. Larger openings increase the air speed in the entrance and middle areas, thereby improving ventilation efficiency, while reducing the speed values in the exit area. Therefore, when optimizing the size of the openings, the aim should be to ensure balanced air flow throughout the entire volume rather than focusing on a single area.
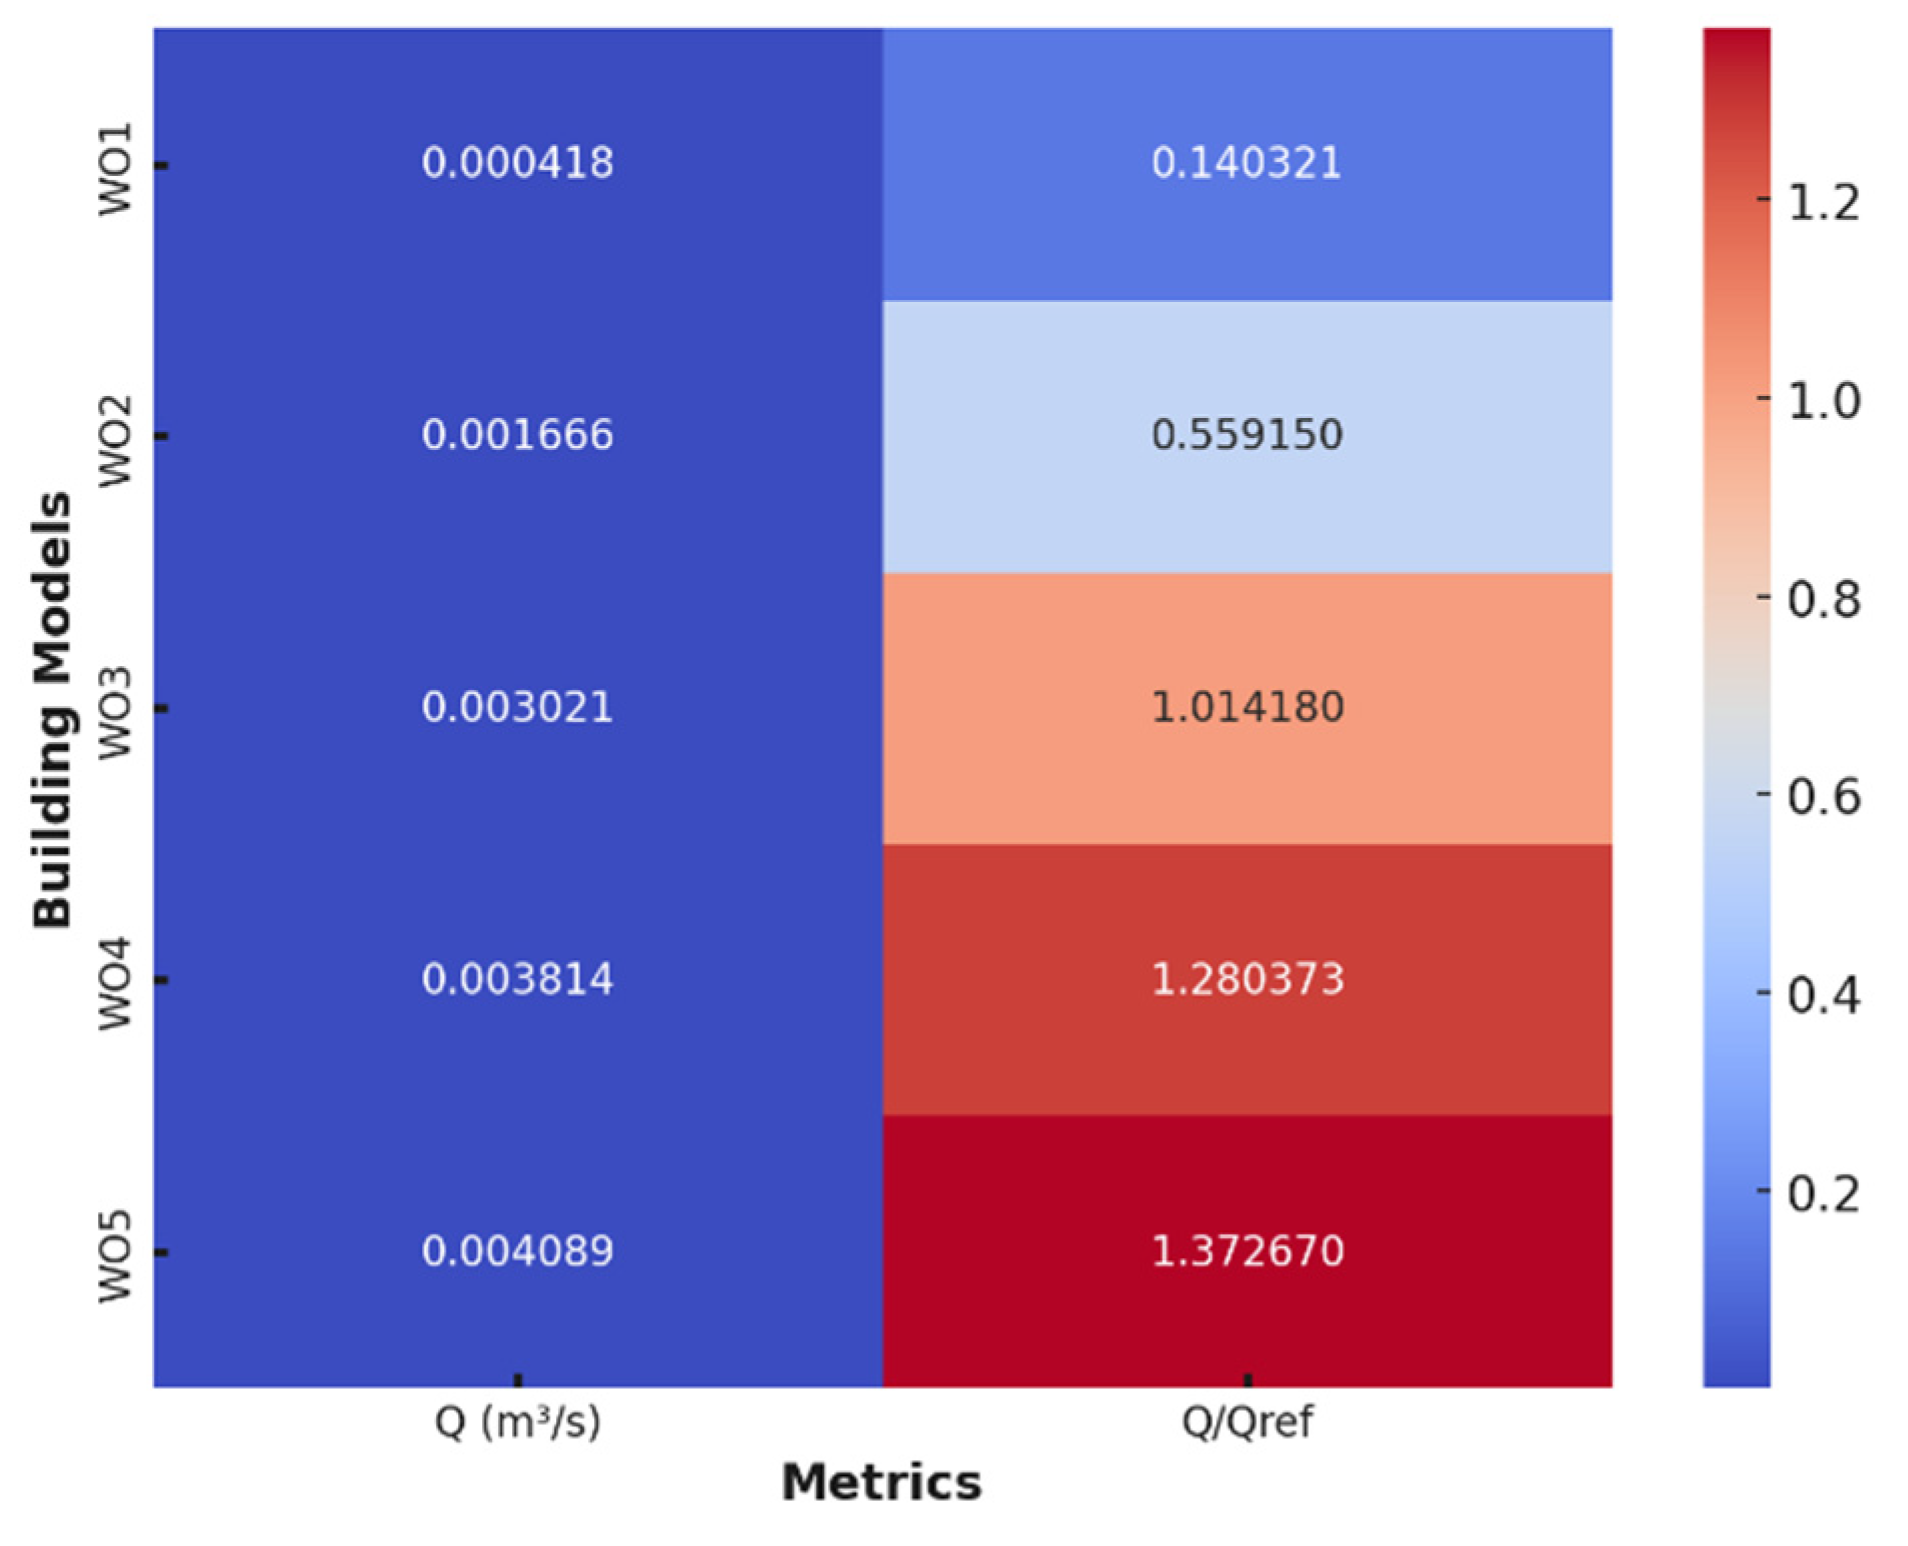
- Among the cross-ventilated isolated building models with fixed outlet window opening size and varying inlet opening sizes, the lowest ventilation rate was calculated in the WO1 model with 0.000418 m3/s.
- The ventilation rate improved significantly from WO1 model to WO5 model, reaching 0.004089 m3/s.
- The normalized ventilation ratio (Q/Qref) reached the highest value of 1.372670 in the WO5 model, providing a ventilation ratio 37.27% higher than the reference building model.
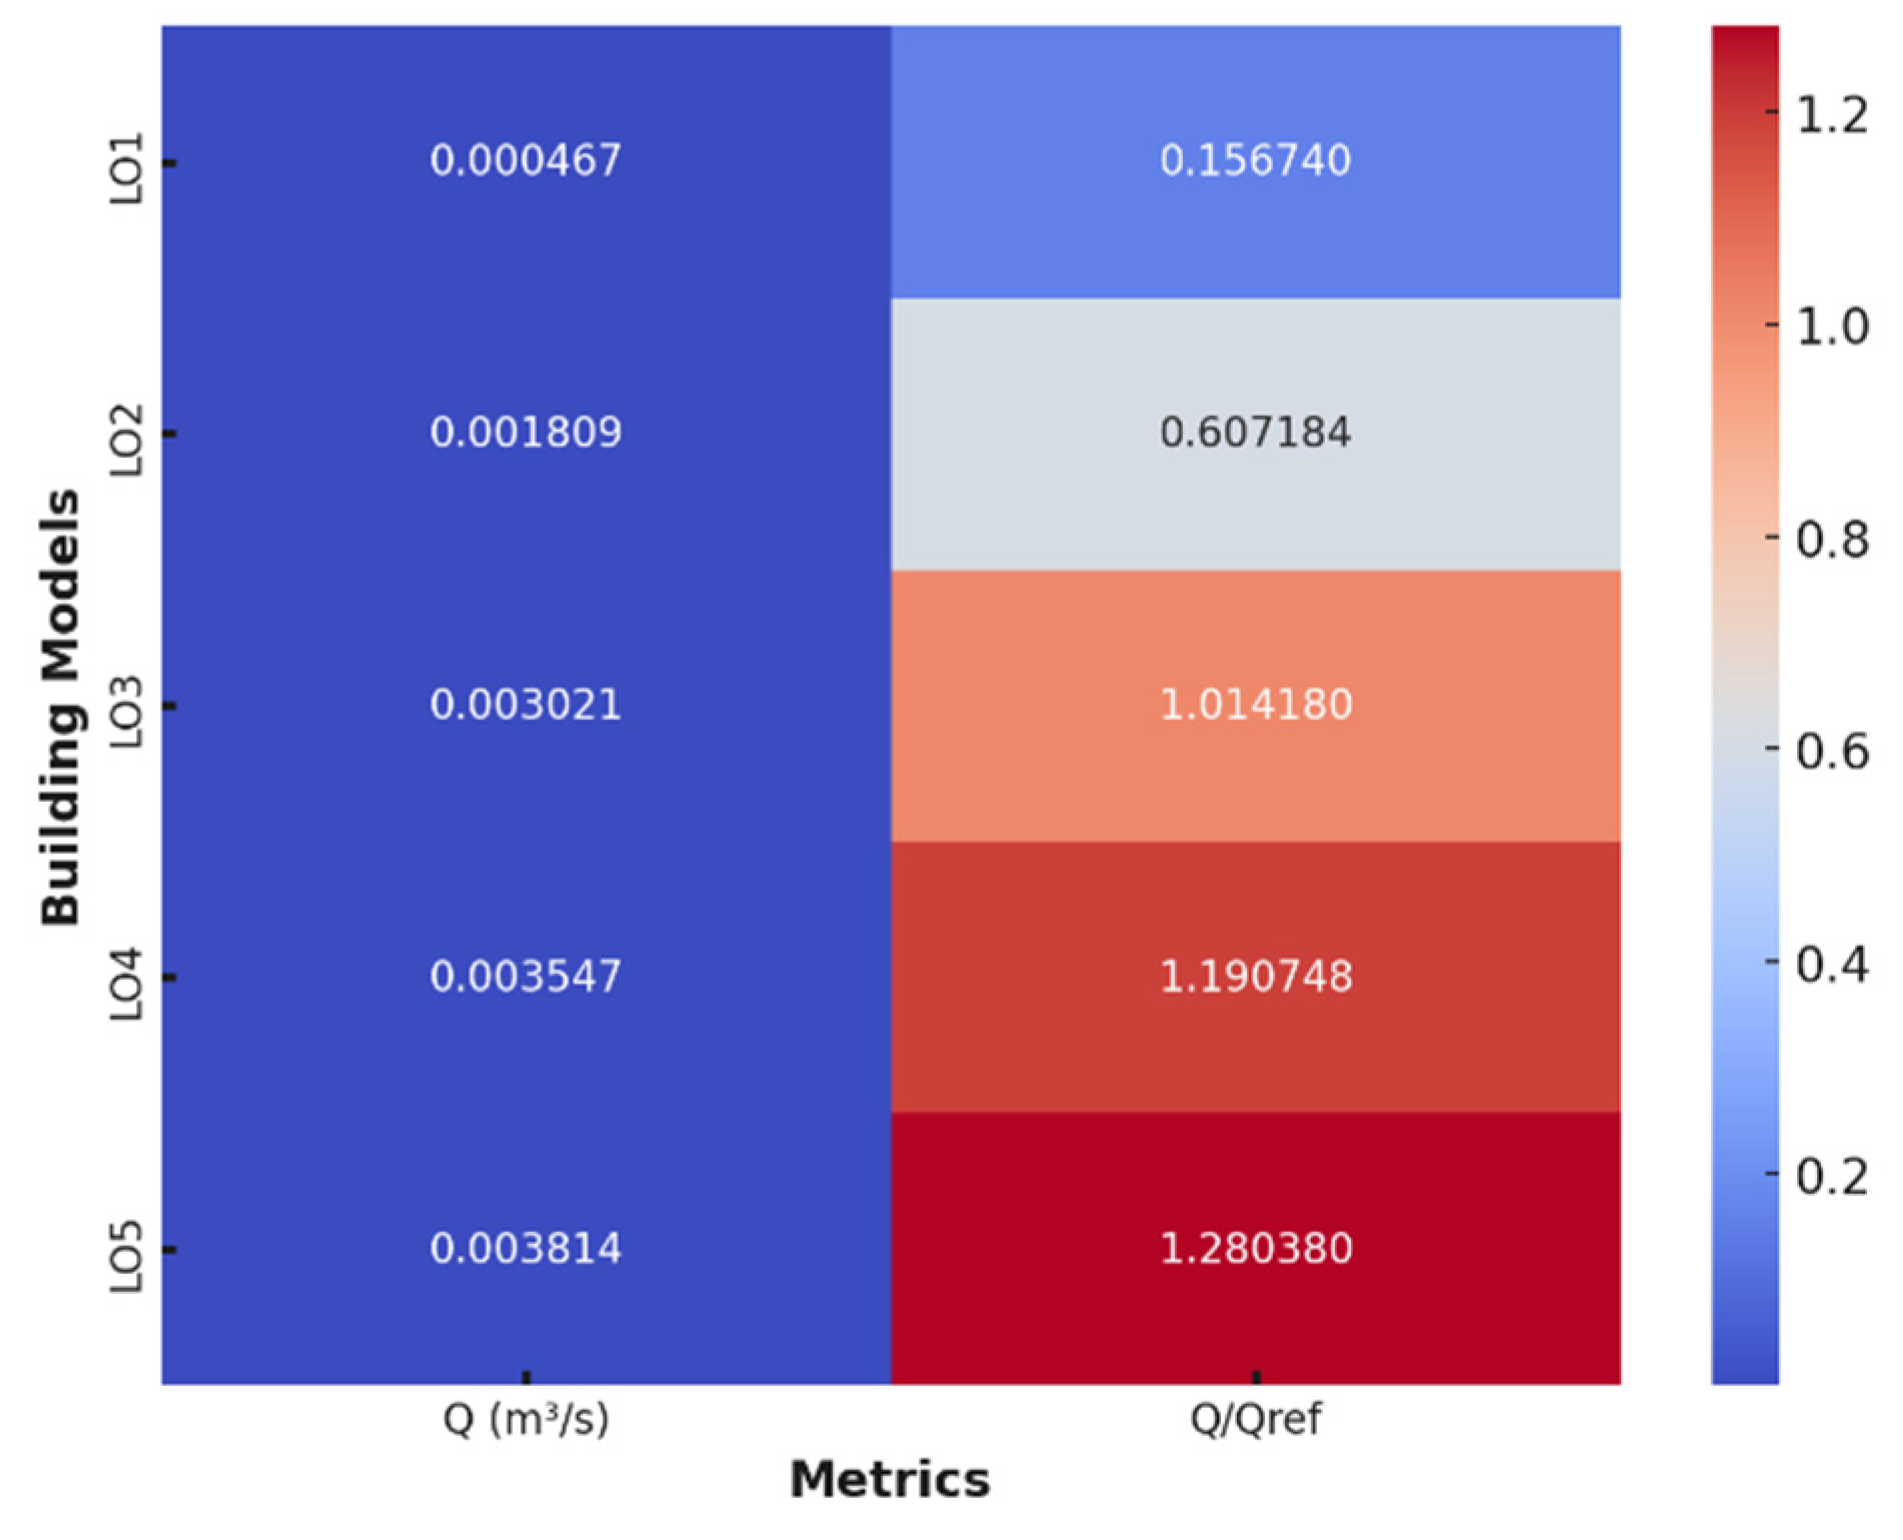
- When the ventilation rates calculated for isolated building models with fixed inlet window size and varying outlet window sizes were analyzed, the LO5 model was the most efficient with a ventilation rate of 0.003814 m3/s.
- The LO1 model had the lowest performance in terms of normalized ventilation rate, providing approximately 28% more ventilation than the reference model.
- In the building models with the highest inlet opening of 60 mm, the Upper-Lower model reached the highest ventilation rate of 0.003129 m3/s. Among all configurations related to the opening positions, the best ventilation performance was obtained in the Upper-Lower building model.
Author Contributions
Funding
Institutional Review Board Statement
Informed Consent Statement
Data Availability Statement
Conflicts of Interest
References
- Pérez-Lombard, L.; Ortiz, J.; Pout, C. A review on buildings energy consumption information. Energy Build. 2008, 40, 394–398. [Google Scholar] [CrossRef]
- Orme, M. Estimates of the energy impact of ventilation and associated financial expenditures. Energy Build. 2001, 33, 199–205. [Google Scholar] [CrossRef]
- Omrani, S.; Garcia-Hansen, V.; Capra, B.R.; Drogemuller, R. Effect of natural ventilation mode on thermal comfort and ventilation performance: Full-scale measurement. Energy Build. 2017, 156, 1–16. [Google Scholar] [CrossRef]
- Santamouris, M. Cooling the buildings–past, present and future. Energy Build. 2016, 128, 617–638. [Google Scholar] [CrossRef]
- Kolokotroni, M.; Aronis, A. Cooling-energy reduction in air-conditioned offices by using night ventilation. Appl. Energy 1999, 63, 241–253. [Google Scholar] [CrossRef]
- Gratia, E.; De Herde, A. Natural cooling strategies efficiency in an office building with a double-skin façade. Energy Build. 2004, 36, 1139–1152. [Google Scholar] [CrossRef]
- Schulze, T.; Eicker, U. Controlled natural ventilation for energy efficient buildings. Energy Build. 2013, 56, 221–232. [Google Scholar] [CrossRef]
- Shetabivash, H. Investigation of opening position and shape on the natural cross ventilation. Energy Build. 2015, 93, 1–15. [Google Scholar] [CrossRef]
- Karava, P.; Stathopoulos, T.; Athienitis, A.K. Airflow assessment in cross-ventilated buildings with operable façade elements. Build. Environ. 2011, 46, 266–279. [Google Scholar] [CrossRef]
- Kasim, N.F.M.; Zaki, S.A.; Ali, M.S.M.; Ikegaya, N.; Razak, A.A. Computational study on the influence of different opening position on wind-induced natural ventilation in urban building of cubical array. Procedia Eng. 2016, 169, 256–263. [Google Scholar] [CrossRef]
- Derakhshan, S.; Shaker, A. Numerical study of the cross-ventilation of an isolated building with different opening aspect ratios and locations for various wind directions. Int. J. Vent. 2017, 16, 42–60. [Google Scholar] [CrossRef]
- Perén, J.I.; Van Hooff, T.; Leite, B.C.C.; Blocken, B. CFD analysis of cross-ventilation of a generic isolated building with asymmetric opening positions: Impact of roof angle and opening location. Build. Environ. 2015, 85, 263–276. [Google Scholar] [CrossRef]
- Yi, Q.; Zhang, G.; König, M.; Janke, D.; Hempel, S.; Amon, T. Investigation of discharge coefficient for wind-driven naturally ventilated dairy barns. Energy Build. 2018, 165, 132–140. [Google Scholar] [CrossRef]
- Chu, C.R.; Chiu, Y.H.; Chen, Y.J.; Wang, Y.W.; Chou, C.P. Turbulence effects on the discharge coefficient and mean flow rate of wind-driven cross-ventilation. Build. Environ. 2009, 44, 2064–2072. [Google Scholar] [CrossRef]
- Zhang, X.; Weerasuriya, A.U.; Wang, J.; Li, C.Y.; Chen, Z.; Tse, K.T.; Hang, J. Cross-ventilation of a generic building with various configurations of external and internal openings. Build. Environ. 2022, 207, 108447. [Google Scholar] [CrossRef]
- Hwang, Y.; Gorlé, C. Large-eddy simulations of wind-driven cross ventilation, Part 2: Comparison of ventilation performance under different ventilation configurations. Front. Built Environ. 2022, 8, 911253. [Google Scholar] [CrossRef]
- Tominaga, Y.; Zhang, X.; Miyakoshi, K. Wind tunnel experiment on cross-ventilation of generic isolated building with various roof shapes: Impact of roof pitch and eaves. Build. Environ. 2024, 265, 111974. [Google Scholar] [CrossRef]
- Peren, J.I.; Van Hooff, T.; Ramponi, R.; Blocken, B.; Leite, B.C.C. Impact of roof geometry of an isolated leeward sawtooth roof building on cross-ventilation: Straight, concave, hybrid or convex? J. Wind Eng. Ind. Aerodyn. 2015, 145, 102–114. [Google Scholar] [CrossRef]
- Perén, J.I.; Van Hooff, T.; Leite, B.C.C.; Blocken, B. Impact of eaves on cross-ventilation of a generic isolated leeward sawtooth roof building: Windward eaves, leeward eaves and eaves inclination. Build. Environ. 2015, 92, 578–590. [Google Scholar] [CrossRef]
- Ohba, M.; Irie, K.; Kurabuchi, T. Study on airflow characteristics inside and outside a cross-ventilation model, and ventilation flow rates using wind tunnel experiments. J. Wind Eng. Ind. Aerodyn. 2001, 89, 1513–1524. [Google Scholar] [CrossRef]
- Nikas, K.S.; Nikolopoulos, N.; Nikolopoulos, A. Numerical study of a naturally cross-ventilated building. Energy Build. 2010, 42, 422–434. [Google Scholar] [CrossRef]
- Tominaga, Y.; Blocken, B. Wind tunnel experiments on cross-ventilation flow of a generic building with contaminant dispersion in unsheltered and sheltered conditions. Build. Environ. 2015, 92, 452–461. [Google Scholar] [CrossRef]
- Shirzadi, M.; Naghashzadegan, M.; Mirzaei, P.A. Improving the CFD modelling of cross-ventilation in highly-packed urban areas. Sustain. Cities Soc. 2018, 37, 451–465. [Google Scholar] [CrossRef]
- Ramponi, R.; Blocken, B. CFD simulation of cross-ventilation for a generic isolated building: Impact of computational parameters. Build. Environ. 2012, 53, 34–48. [Google Scholar] [CrossRef]
- Van Hooff, T.; Blocken, B.; Tominaga, Y. On the accuracy of CFD simulations of cross-ventilation flows for a generic isolated building: Comparison of RANS, LES and experiments. Build. Environ. 2017, 114, 148–165. [Google Scholar] [CrossRef]
- Kosutova, K.; van Hooff, T.; Vanderwel, C.; Blocken, B.; Hensen, J. Cross-ventilation in a generic isolated building equipped with louvers: Wind-tunnel experiments and CFD simulations. Build. Environ. 2019, 154, 263–280. [Google Scholar] [CrossRef]
- Karava, P.; Stathopoulos, T.; Athienitis, A.K. Wind-induced natural ventilation analysis. Sol. Energy 2007, 81, 20–30. [Google Scholar] [CrossRef]
- Tominaga, Y.; Blocken, B. Wind tunnel analysis of flow and dispersion in cross-ventilated isolated buildings: Impact of opening positions. J. Wind Eng. Ind. Aerodyn. 2016, 155, 74–88. [Google Scholar] [CrossRef]
- Sudirman, M.; Gillmeier, S.; van Hooff, T.; Blocken, B. Wind tunnel measurements of cross-ventilation flow in a realistic building geometry: Influence of building partitions and wind direction. J. Wind Eng. Ind. Aerodyn. 2024, 254, 105907. [Google Scholar] [CrossRef]
- Golubić, D.; Meile, W.; Brenn, G.; Kozmar, H. Wind-tunnel analysis of natural ventilation in a generic building in sheltered and unsheltered conditions: Impact of Reynolds number and wind direction. J. Wind Eng. Ind. Aerodyn. 2020, 207, 104388. [Google Scholar] [CrossRef]
- Evola, G.; Popov, V. Computational analysis of wind driven natural ventilation in buildings. Energy Build. 2006, 38, 491–501. [Google Scholar] [CrossRef]
- Hu, C.H.; Ohba, M.; Yoshie, R. CFD modelling of unsteady cross ventilation flows using LES. J. Wind Eng. Ind. Aerodyn. 2008, 96, 1692–1706. [Google Scholar] [CrossRef]
- Shirzadi, M.; Mirzaei, P.A.; Naghashzadegan, M.; Tominaga, Y. Modelling enhancement of cross-ventilation in sheltered buildings using stochastic optimization. Int. J. Heat Mass Transf. 2018, 118, 758–772. [Google Scholar] [CrossRef]
- Tai, V.C.; Kai-Seun, J.W.; Mathew, P.R.; Moey, L.K.; Cheng, X.; Baglee, D. Investigation of varying louver angles and positions on cross ventilation in a generic isolated building using CFD simulation. J. Wind Eng. Ind. Aerodyn. 2022, 229, 105172. [Google Scholar] [CrossRef]
- Gautam, K.R.; Rong, L.; Zhang, G.; Abkar, M. Comparison of analysis methods for wind-driven cross ventilation through large openings. Build. Environ. 2019, 154, 375–388. [Google Scholar] [CrossRef]
- Kurabuchi, T.; Ohba, M.; Endo, T.; Akamine, Y.; Nakayama, F. Local dynamic similarity model of cross-ventilation part 1-theoretical framework. Int. J. Vent. 2004, 2, 371–382. [Google Scholar] [CrossRef]
- Kobayashi, T.; Sagara, K.; Yamanaka, T.; Kotani, H.; Takeda, S.; Sandberg, M. Stream tube based analysis of problems in prediction of cross-ventilation rate. Int. J. Vent. 2009, 7, 321–334. [Google Scholar] [CrossRef]
- Meroney, R.N. CFD prediction of airflow in buildings for natural ventilation. In Proceedings of the Eleventh Americas Conference on Wind Engineering, San Juan, Puerto Rico, 22–26 June 2009. [Google Scholar]
- Cheung, J.O.; Liu, C.H. CFD simulations of natural ventilation behaviour in high-rise buildings in regular and staggered arrangements at various spacings. Energy Build. 2011, 43, 1149–1158. [Google Scholar] [CrossRef]
- Tong, Z.; Chen, Y.; Malkawi, A. Defining the Influence Region in neighborhood-scale CFD simulations for natural ventilation design. Appl. Energy. 2016, 182, 625–633. [Google Scholar] [CrossRef]
- Fu, X.; Tai, V.C.; Moey, L.K.; Abd Rahman, N.F.; Ahmad, K.A.; Baglee, D. Opening configurations and natural cross ventilation performance in a double-loaded multi-level apartment building: A CFD analysis. Build. Environ. 2024, 254, 111404. [Google Scholar] [CrossRef]
- Li, Q.; Tai, V.C.; Moey, L.K.; Go, T.F.; Safehian, J.; Yazdi, M.H. Impact of planar area ratio and opening positions on natural cross ventilation performance in sheltered high-rise buildings: A simulation study. Build. Environ. 2023, 245, 110889. [Google Scholar] [CrossRef]
- Jiang, Y.; Alexander, D.; Jenkins, H.; Arthur, R.; Chen, Q. Natural ventilation in buildings: Measurement in a wind tunnel and numerical simulation with large-eddy simulation. J. Wind Eng. Ind. Aerodyn. 2003, 91, 331–353. [Google Scholar] [CrossRef]
- Kato, S.; Murakami, S.; Mochida, A.; Akabayashi, S.I.; Tominaga, Y. Velocity-pressure field of cross ventilation with open windows analyzed by wind tunnel and numerical simulation. J. Wind Eng. Ind. Aerodyn. 1992, 44, 2575–2586. [Google Scholar] [CrossRef]
- Kobayashi, T.; Sandberg, M.; Kotani, H.; Claesson, L. Experimental investigation and CFD analysis of cross-ventilated flow through single room detached house model. Build. Environ. 2010, 45, 2723–2734. [Google Scholar] [CrossRef]
- Larsen, T.S.; Nikolopoulos, N.; Nikolopoulos, A.; Strotos, G.; Nikas, K.S. Characterization and prediction of the volume flow rate aerating a cross ventilated building by means of experimental techniques and numerical approaches. Energy Build. 2011, 43, 1371–1381. [Google Scholar] [CrossRef]
- Bangalee, M.Z.I.; Miau, J.J.; Lin, S.Y.; Yang, J.H. Flow visualization, PIV measurement and CFD calculation for fluid-driven natural cross-ventilation in a scale model. Energy Build. 2013, 66, 306–314. [Google Scholar] [CrossRef]
- Shirzadi, M.; Tominaga, Y.; Mirzaei, P.A. Experimental and steady-RANS CFD modelling of cross-ventilation in moderately-dense urban areas. Sustain. Cities Soc. 2020, 52, 101849. [Google Scholar] [CrossRef]
- Franke, J.; Hellsten, A.; Schlunzen, K.H.; Carissimo, B. The COST 732 Best Practice Guideline for CFD simulation of flows in the urban environment: A summary. Int. J. Environ. Pollut. 2011, 44, 419–427. [Google Scholar] [CrossRef]
- Tominaga, Y.; Mochida, A.; Yoshie, R.; Kataoka, H.; Nozu, T.; Yoshikawa, M.; Shirasawa, T. AIJ guidelines for practical applications of CFD to pedestrian wind environment around buildings. J. Wind Eng. Ind. Aerodyn. 2008, 96, 1749–1761. [Google Scholar] [CrossRef]
- Aktepe, B.; Demir, H. Impact of Window Opening Shapes on Wind-Driven Cross Ventilation Performance in a Generic Isolated Building: A Simulation Study. Gazi Univ. J. Sci. Part C Des. Technol. 2024, 12, 758–768. [Google Scholar] [CrossRef]
- Tablada, A.; De Troyer, F.; Blocken, B.; Carmeliet, J.; Verschure, H. On natural ventilation and thermal comfort in compact urban environments–the Old Havana case. Build. Environ. 2009, 44, 1943–1958. [Google Scholar] [CrossRef]
- Al-Aghbari, O.H.; Moey, L.K.; Tai, V.C.; Go, T.F.; Yazdi, M.H. Study on the Impact of Sawtooth Roof Inclination Angles and Asymmetrical Opening Positions for An Isolated Building in Cross Ventilation. Jordan J. Mech. Ind. Eng. 2022, 16, 865. [Google Scholar]
- Tominaga, Y.; Akabayashi, S.I.; Kitahara, T.; Arinami, Y. Air flow around isolated gable-roof buildings with different roof pitches: Wind tunnel experiments and CFD simulations. Build. Environ. 2015, 84, 204–213. [Google Scholar] [CrossRef]
- Ramponi, R.; Blocken, B. CFD simulation of cross-ventilation flow for different isolated building configurations: Validation with wind tunnel measurements and analysis of physical and numerical diffusion effects. J. Wind Eng. Ind. Aerodyn. 2012, 104, 408–418. [Google Scholar] [CrossRef]
- Moey, L.K.; Chan, K.L.; Tai, V.C.; Go, T.F.; Chong, P.L. Investigation on the effect of opening position across an isolated building for wind-driven cross ventilation. J. Mech. Eng. Sci. 2021, 15, 8141–8152. [Google Scholar] [CrossRef]


| Building Model | Size of Opening (mm) (Width × Height) | Building Model | Size of Opening (mm) (Width × Height) | ||||
|---|---|---|---|---|---|---|---|
| Windward | Leeward | Windward | Leeward | ||||
| WO1 |  | 15.33 × 6 | 46 × 18 | LO1 |  | 46 × 18 | 15.33 × 6 |
| WO2 |  | 30.67 × 12 | LO2 |  | 30.67 × 12 | ||
| WO3 |  | 46 × 18 | LO3 |  | 46 × 18 | ||
| WO4 |  | 61.3 × 24 | LO4 |  | 61.3 × 24 | ||
| WO5 |  | 92 × 36 | LO5 |  | 92 × 36 | ||
| Case | Building Model | Opening Location | Opening Height (mm) | |
|---|---|---|---|---|
| Windward | Leeward | |||
| I | 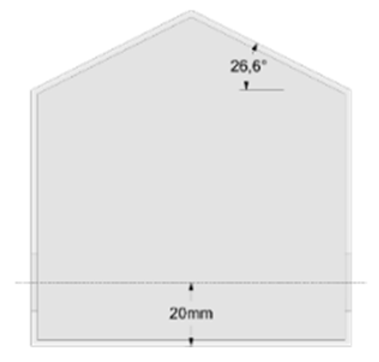 | Lower-Lower | 20 | 20 |
| II | 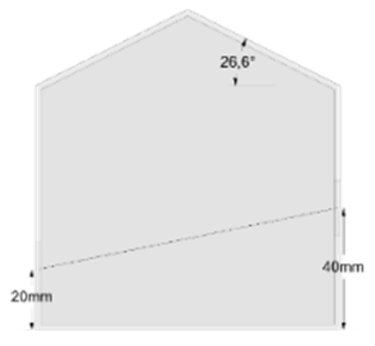 | Lower-Middle | 40 | |
| III | 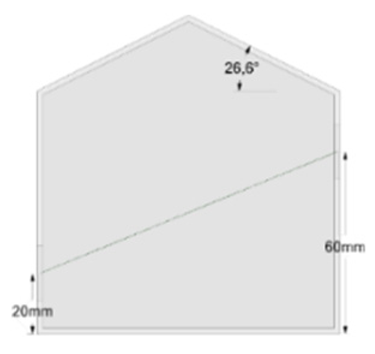 | Lower-Upper | 60 | |
| IV | 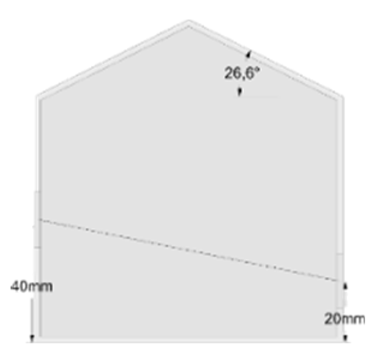 | Middle-Lower | 40 | 20 |
| V | 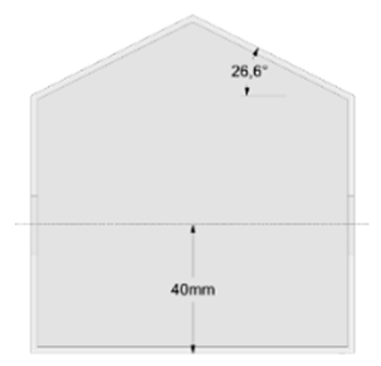 | Middle-Middle | 40 | |
| VI |  | Middle-Upper | 60 | |
| VII |  | Upper-Lower | 60 | 20 |
| VIII | 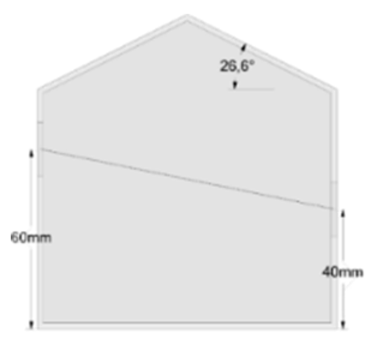 | Upper-Middle | 40 | |
| IX |  | Upper-Upper | 60 | |
| Roughness Constant | Cs = 0.3 | Cs = 0.4 | Cs = 0.5 | Cs = 0.6 | Cs = 0.7 |
| (U/Uref)max | 0.78 | 0.76 | 0.77 | 0.74 | 0.76 |
| (U/Uref)avg | 0.40 | 0.39 | 0.39 | 0.35 | 0.36 |
| Turbulence Model | SST k-ω | Standard k-ω | RNG k-ε | Standard k-ε | Realizable k-ε |
| (U/Uref)max | 0.77 | 0.69 | 0.74 | 0.64 | 0.67 |
| (U/Uref)avg | 0.40 | 0.46 | 0.37 | 0.43 | 0.46 |
Disclaimer/Publisher’s Note: The statements, opinions and data contained in all publications are solely those of the individual author(s) and contributor(s) and not of MDPI and/or the editor(s). MDPI and/or the editor(s) disclaim responsibility for any injury to people or property resulting from any ideas, methods, instructions or products referred to in the content. |
© 2025 by the authors. Licensee MDPI, Basel, Switzerland. This article is an open access article distributed under the terms and conditions of the Creative Commons Attribution (CC BY) license (https://creativecommons.org/licenses/by/4.0/).
Share and Cite
Demir, H.; Aktepe, B. Investigation on the Effect of Opening Size and Position on Wind-Driven Cross-Ventilation in an Isolated Gable Roof Building. Appl. Sci. 2025, 15, 6190. https://doi.org/10.3390/app15116190
Demir H, Aktepe B. Investigation on the Effect of Opening Size and Position on Wind-Driven Cross-Ventilation in an Isolated Gable Roof Building. Applied Sciences. 2025; 15(11):6190. https://doi.org/10.3390/app15116190
Chicago/Turabian StyleDemir, Hacımurat, and Burak Aktepe. 2025. "Investigation on the Effect of Opening Size and Position on Wind-Driven Cross-Ventilation in an Isolated Gable Roof Building" Applied Sciences 15, no. 11: 6190. https://doi.org/10.3390/app15116190
APA StyleDemir, H., & Aktepe, B. (2025). Investigation on the Effect of Opening Size and Position on Wind-Driven Cross-Ventilation in an Isolated Gable Roof Building. Applied Sciences, 15(11), 6190. https://doi.org/10.3390/app15116190