
Federated Learning: A Comparative Study of Defenses Against Poisoning Attacks


Abstract
1. Introduction
- Provides comprehensive discussions of the background and the existing algorithms relating to attack defense in federated learning;
- Introduces a unique defense approach against model attacks in federated learning that combines RPCA with PCA and clustering, which has not been seen in other studies;
- Presents comprehensive experimental evaluations of six state-of-the-art defense algorithms against model attacks in federated learning using four different datasets, providing insights into their performance.
2. Federated Learning
- The server randomly initializes the global model parameters;
- The global model is distributed to a random subset of the clients;
- Each selected client performs standard stochastic gradient descent on its own data for a given number of epochs;
- Each selected client computes the difference between the model after this round of training and the model it received at the beginning of this round of training;
- Each client sends this difference back to the server;
- The server aggregates all the model updates using the FedAvg algorithm [11];
- The server applies the aggregated update to the global model;
- Steps 2–7 are repeated for a given number of time steps (T).
3. Related Work
4. Attack Model
4.1. Classification of Attacks
4.2. Attack Implementation
- The malicious actor controls at least one client;
- The malicious clients have access to some of the legitimate training data, as well as the auxiliary data that will be used to create the adversarial subtask.
5. Defense Methods
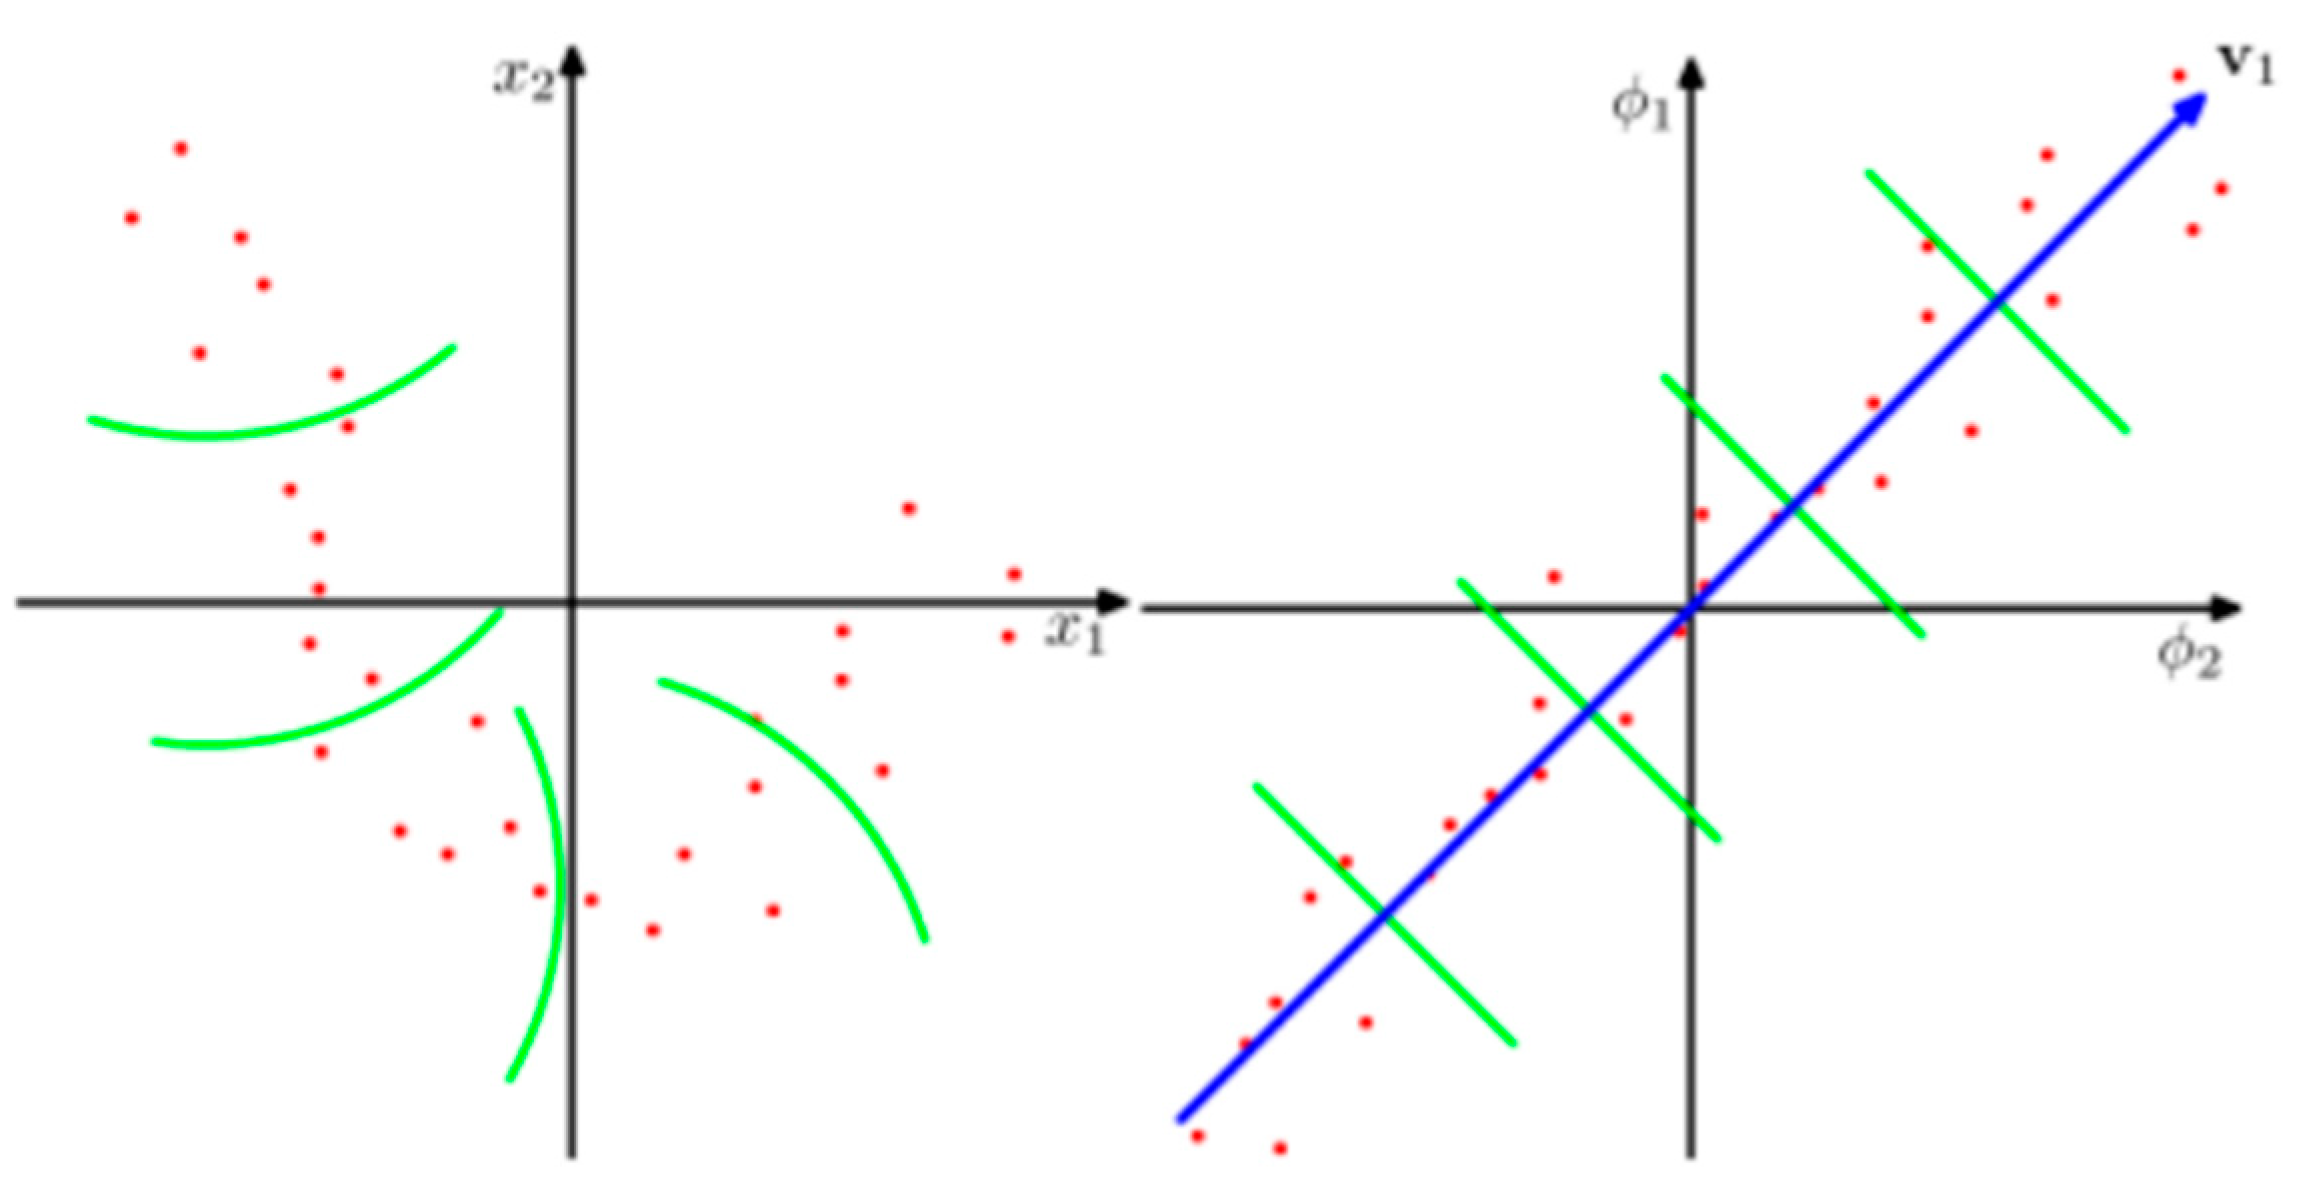
5.1. PCA + K-Means
| Algorithm 1. Identifying malicious model updates using PCA + K-means |
| Input: numberOfAgents, T (number of iterations) |
| Output: globalWeights |
| // Step 1: Initialization and Configuration |
| Initialize agents with indices [1, 2, …, numberOfAgents] |
| Initialize globalWeights |
| Set t = 0 |
| // Step 2: Main Training Loop |
| while t < T do |
| // Step 2a: Calculate probabilities for agent selection |
| probabilities = CalculateSelectionProbabilities(agents) |
| // Step 2b: Start parallel training and wait for completion |
| selectedAgents = SelectAgents(probabilities) |
| updates = ParallelTraining(selectedAgents) |
| // Step 2c: Data Collection and Preprocessing |
| updateMatrix = CollectUpdates(updates) |
| // Step 2d: Dimensionality Reduction with PCA |
| reducedData = PCA(updateMatrix) |
| // Step 2e: Cluster Analysis using K-Means |
| clusters = KMeansClustering(reducedData) |
| // Step 2f: Cluster Selection to identify anomalies |
| selectedClusters = IdentifyAnomalousClusters(clusters) |
| // Step 2g: Weighted Aggregation within clusters |
| aggregatedUpdates = WeightedAggregate(selectedClusters, clusterSizes) |
| // Step 3: Evaluation and Updating |
| globalWeights = UpdateGlobalWeights(globalWeights, aggregatedUpdates) |
| EvaluateModel(globalWeights) |
| // Step 4: Close Loop |
| StoreEvaluationResults(globalWeights) |
| t = t + 1 |
| end while |
| return globalWeights |
5.2. KPCA + K-Means
| Algorithm 2. Identifying malicious model updates using KPCA + K-means |
| Input: numberOfAgents, T (number of iterations) |
| Output: globalWeights |
| // Step 1: Initialization and Configuration |
| Initialize agents with indices [1, 2, …, numberOfAgents] |
| Initialize globalWeights |
| Set t = 0 |
| // Step 2: Main Training Loop |
| while t < T do |
| // Step 2a: Calculate probabilities for agent selection |
| probabilities = CalculateSelectionProbabilities(agents) |
| // Step 2b: Start parallel training and wait for completion |
| selectedAgents = SelectAgents(probabilities) |
| updates = ParallelTraining(selectedAgents) |
| // Step 2c: Data Collection and Preprocessing |
| updateMatrix = CollectUpdates(updates) |
| // Step 2d: Kernel Transformation with KPCA |
| kernelTransformedData = KPCA_Transform(updateMatrix) |
| // Step 2e: Kernel-Based Cluster Analysis using K-Means |
| clusters = KMeansClustering(kernelTransformedData) |
| // Step 2f: Cluster Selection and Weighted Aggregation |
| selectedClusters = IdentifyDistinctiveClusters(clusters) |
| aggregatedKernelUpdates = WeightedAggregate(selectedClusters, clusterSizes) |
| // Step 2g: Inverse Kernel Transformation |
| globalUpdate = KPCA_InverseTransform(aggregatedKernelUpdates) |
| // Step 3: Evaluation and Updating |
| globalWeights = UpdateGlobalWeights(globalWeights, globalUpdate) |
| EvaluateModel(globalWeights) |
| // Step 4: Close Loop |
| StoreEvaluationResults(globalWeights) |
| t = t + 1 |
| end while |
| return globalWeights |
5.3. CONTRA
| Algorithm 3. Identifying malicious model updates using CONTRA |
| Input: numberOfAgents, T (number of iterations) |
| Output: globalWeights |
| // Step 1: Initialization and Configuration |
| Initialize agents with indices [1, 2, …, numberOfAgents] |
| Initialize globalWeights |
| Set t = 0 |
| // Step 2: Main Training Loop |
| while t < T do |
| // Step 2a: Calculate probabilities for agent selection |
| probabilities = CalculateSelectionProbabilities(agents) |
| // Step 2b: Start parallel training and wait for completion |
| selectedAgents = SelectAgents(probabilities) |
| updates = ParallelTraining(selectedAgents) |
| // Step 2c: Calculate Offsets |
| for each agent in selectedAgents do |
| offset[agent] = CalculateOffset(agent.update, referenceUpdate) |
| end for |
| // Step 2d: Similarity Measurement |
| for each agent in selectedAgents do |
| similarityScore[agent] = MeasureSimilarity(offset[agent], referenceUpdate) |
| end for |
| // Step 2e: Weighted Aggregation |
| globalUpdate = 0 |
| totalWeight = 0 |
| for each agent in selectedAgents do |
| if similarityScore[agent] is High then |
| weight = AssignHigherWeight(similarityScore[agent]) |
| globalUpdate += weight * agent.update |
| totalWeight += weight |
| end if |
| end for |
| globalUpdate = globalUpdate/totalWeight |
| // Step 3: Evaluation and Updating |
| globalWeights = UpdateGlobalWeights(globalWeights, globalUpdate) |
| EvaluateModel(globalWeights) |
| // Step 4: Close Loop |
| StoreEvaluationResults(globalWeights) |
| t = t + 1 |
| end while |
| return globalWeights |
5.4. KRUM
| Algorithm 4. Identifying malicious model updates using KRUM |
| Input: numberOfAgents, T (number of iterations) |
| Output: globalWeights |
| // Step 1: Initialization and Configuration |
| Initialize agents with indices [1, 2,..., numberOfAgents] |
| Initialize globalWeights |
| Set t = 0 |
| // Step 2: Main Training Loop |
| while t < T do |
| // Step 2a: Calculate probabilities for agent selection |
| probabilities = CalculateSelectionProbabilities(agents) |
| // Step 2b: Start parallel training and wait for completion |
| selectedAgents = SelectAgents(probabilities) |
| updates = ParallelTraining(selectedAgents) |
| // Step 2c: Calculate Distance |
| distanceMatrix = InitializeDistanceMatrix() |
| for each agent_i in selectedAgents do |
| for each agent_j in selectedAgents, where j ≠ i do |
| distanceMatrix[i][j] = CalculateDistance(agent_i.update, agent_j.update) |
| end for |
| end for |
| // Step 2d: Select Models |
| selectedDistances = SelectSmallestDistances(distanceMatrix) |
| // Step 2e: Calculate Score |
| for each agent in selectedAgents do |
| score[agent] = Sum(selectedDistances[agent]) |
| end for |
| // Step 2f: Choose Final Model |
| krum_index = AgentWithLowestScore(score) |
| globalUpdate = updates[krum_index] |
| // Step 3: Evaluation and Updating |
| globalWeights = UpdateGlobalWeights(globalWeights, globalUpdate) |
| EvaluateModel(globalWeights) |
| // Step 4: Close Loop |
| StoreEvaluationResults(globalWeights) |
| t = t + 1 |
| end while |
| return globalWeights |
5.5. COOMED
| Algorithm 5. Identifying malicious model updates using COOMED |
| Input: numberOfAgents, T (number of iterations) |
| Output: globalWeights |
| // Step 1: Initialization and Configuration |
| Initialize agents with indices [1, 2, …, numberOfAgents] |
| Initialize globalWeights |
| Set t = 0 |
| // Step 2: Main Training Loop |
| while t < T do |
| // Step 2a: Calculate probabilities for agent selection |
| probabilities = CalculateSelectionProbabilities(agents) |
| // Step 2b: Start parallel training and wait for completion |
| selectedAgents = SelectAgents(probabilities) |
| updates = ParallelTraining(selectedAgents) |
| // Step 2c: Calculate Median (COOMED Aggregation) |
| medianUpdates = InitializeMedianUpdates() |
| for each coordinate in globalWeights do |
| values = [] |
| for each agent in selectedAgents do |
| values.append(agent.update[coordinate]) |
| end for |
| medianUpdates[coordinate] = CalculateMedian(values) |
| end for |
| // Step 2d: Global Update |
| globalWeights = medianUpdates |
| // Step 3: Evaluation and Updating |
| EvaluateModel(globalWeights) |
| // Step 4: Close Loop |
| StoreEvaluationResults(globalWeights) |
| t = t + 1 |
| end while |
| return globalWeights |
5.6. RPCA + PCA + K-Means
| Algorithm 6. Identifying malicious model updates using RPCA + PCA + K-means |
| Input: numberOfAgents, T (number of iterations) |
| Output: globalWeights |
| // Step 1: Initialization and Configuration |
| Initialize agents with indices [1, 2,..., numberOfAgents] |
| Initialize globalWeights |
| Set t = 0 |
| // Step 2: Main Training Loop |
| while t < T do |
| // Step 2a: Calculate probabilities for agent selection |
| probabilities = CalculateSelectionProbabilities(agents) |
| // Step 2b: Start parallel training and wait for completion |
| selectedAgents = SelectAgents(probabilities) |
| updates = ParallelTraining(selectedAgents) |
| // Step 2c: Data Collection and Preprocessing |
| updateMatrix = CollectUpdates(updates) |
| // Step 2d: Robust Principal Component Analysis (RPCA) |
| // Decompose matrix into low-rank (L) and sparse (S) |
| [L, S] = RPCA(updateMatrix) |
| // Step 2e: Dimensionality Reduction with PCA |
| reducedData = PCA(L) |
| // Step 2f: Cluster Analysis with K-Means |
| clusters = KMeansClustering(reducedData) |
| // Step 2g: Cluster Selection |
| selectedClusters = IdentifyAnomalousClusters(clusters) |
| // Step 2h: Weighted Aggregation within Clusters |
| aggregatedUpdates = InitializeAggregatedUpdates() |
| for each cluster in selectedClusters do |
| clusterSize = SizeOf(cluster) |
| for each update in cluster do |
| weightedUpdate = WeightUpdate(update, clusterSize) |
| aggregatedUpdates = AddWeightedUpdate(aggregatedUpdates, weightedUpdate) |
| end for |
| end for |
| // Step 3: Evaluation and Updating |
| globalWeights = UpdateGlobalWeights(globalWeights, aggregatedUpdates) |
| EvaluateModel(globalWeights) |
| // Step 4: Close Loop |
| StoreEvaluationResults(globalWeights) |
| t = t + 1 |
| end while |
| return globalWeights |
6. Experimental Setup
6.1. Simulation Model
6.2. Performance Metrics
6.3. Datasets and Deep Neural Networks Architectures
6.3.1. The Fashion-MNIST Dataset
6.3.2. The CIFAR-10 Dataset
6.3.3. The UCI Adult Census Dataset
6.3.4. The Epileptic Seizure Recognition Dataset
7. Experimental Results and Discussion
7.1. Overall Performance
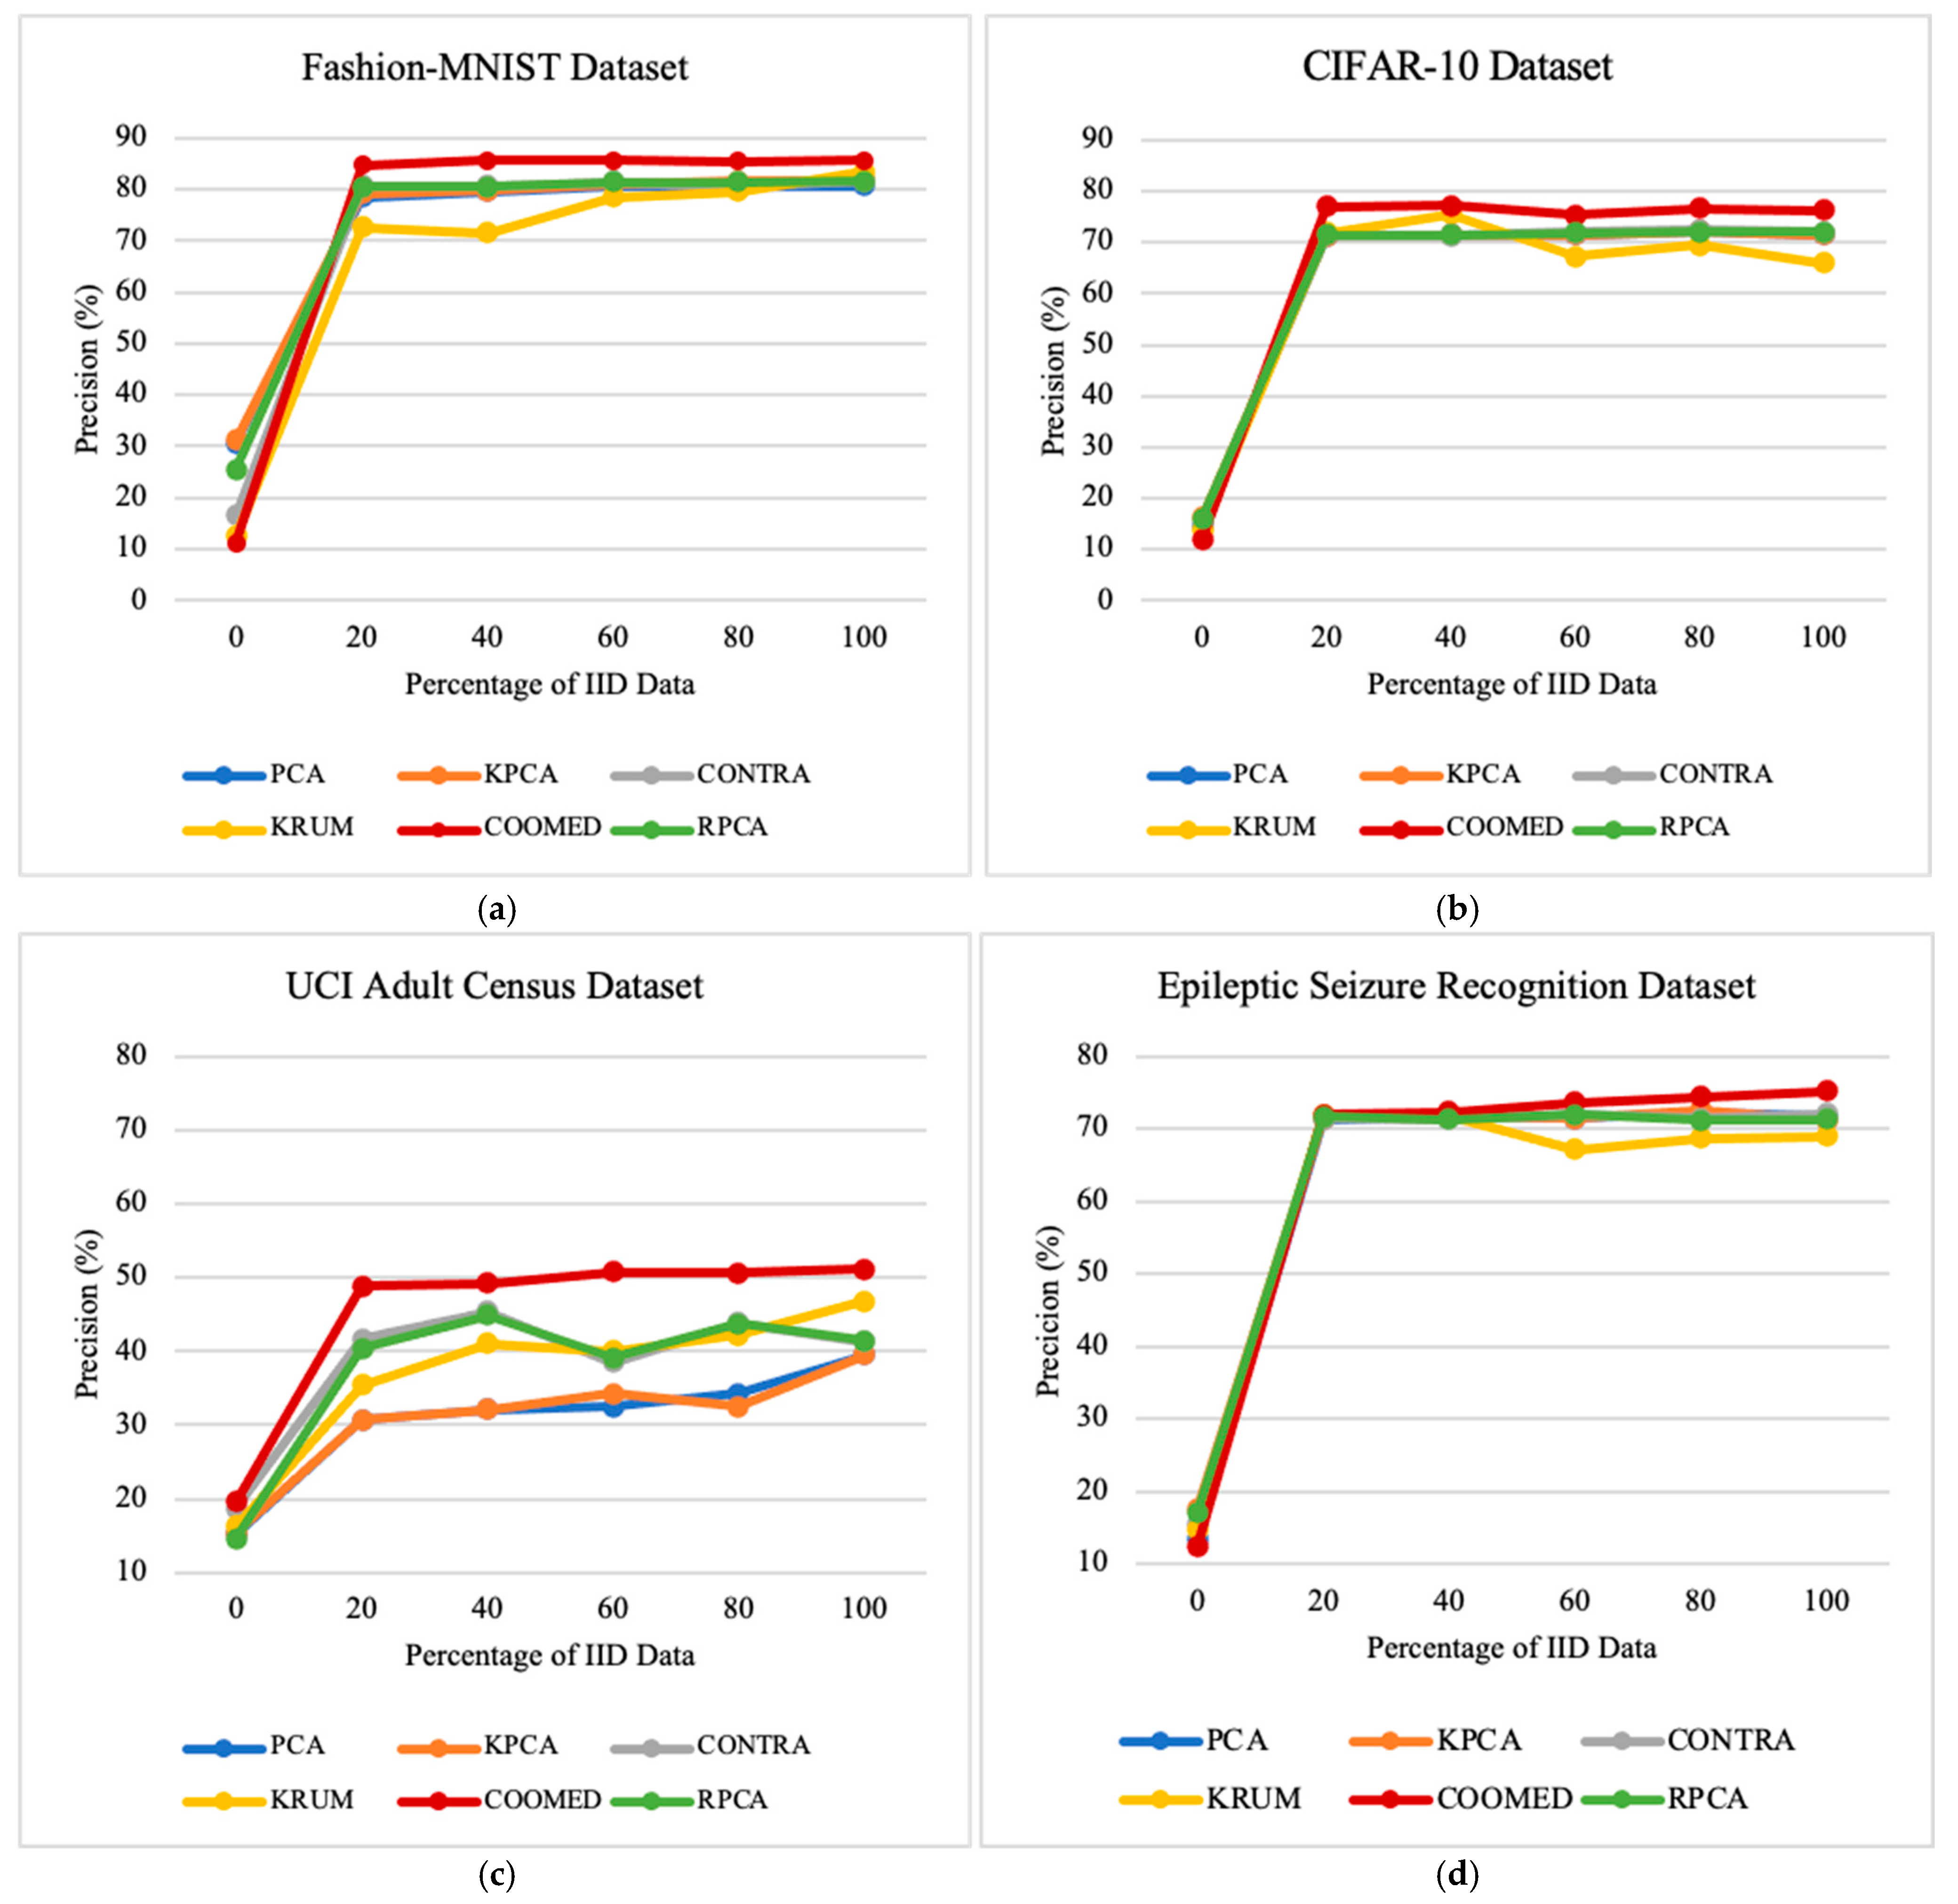
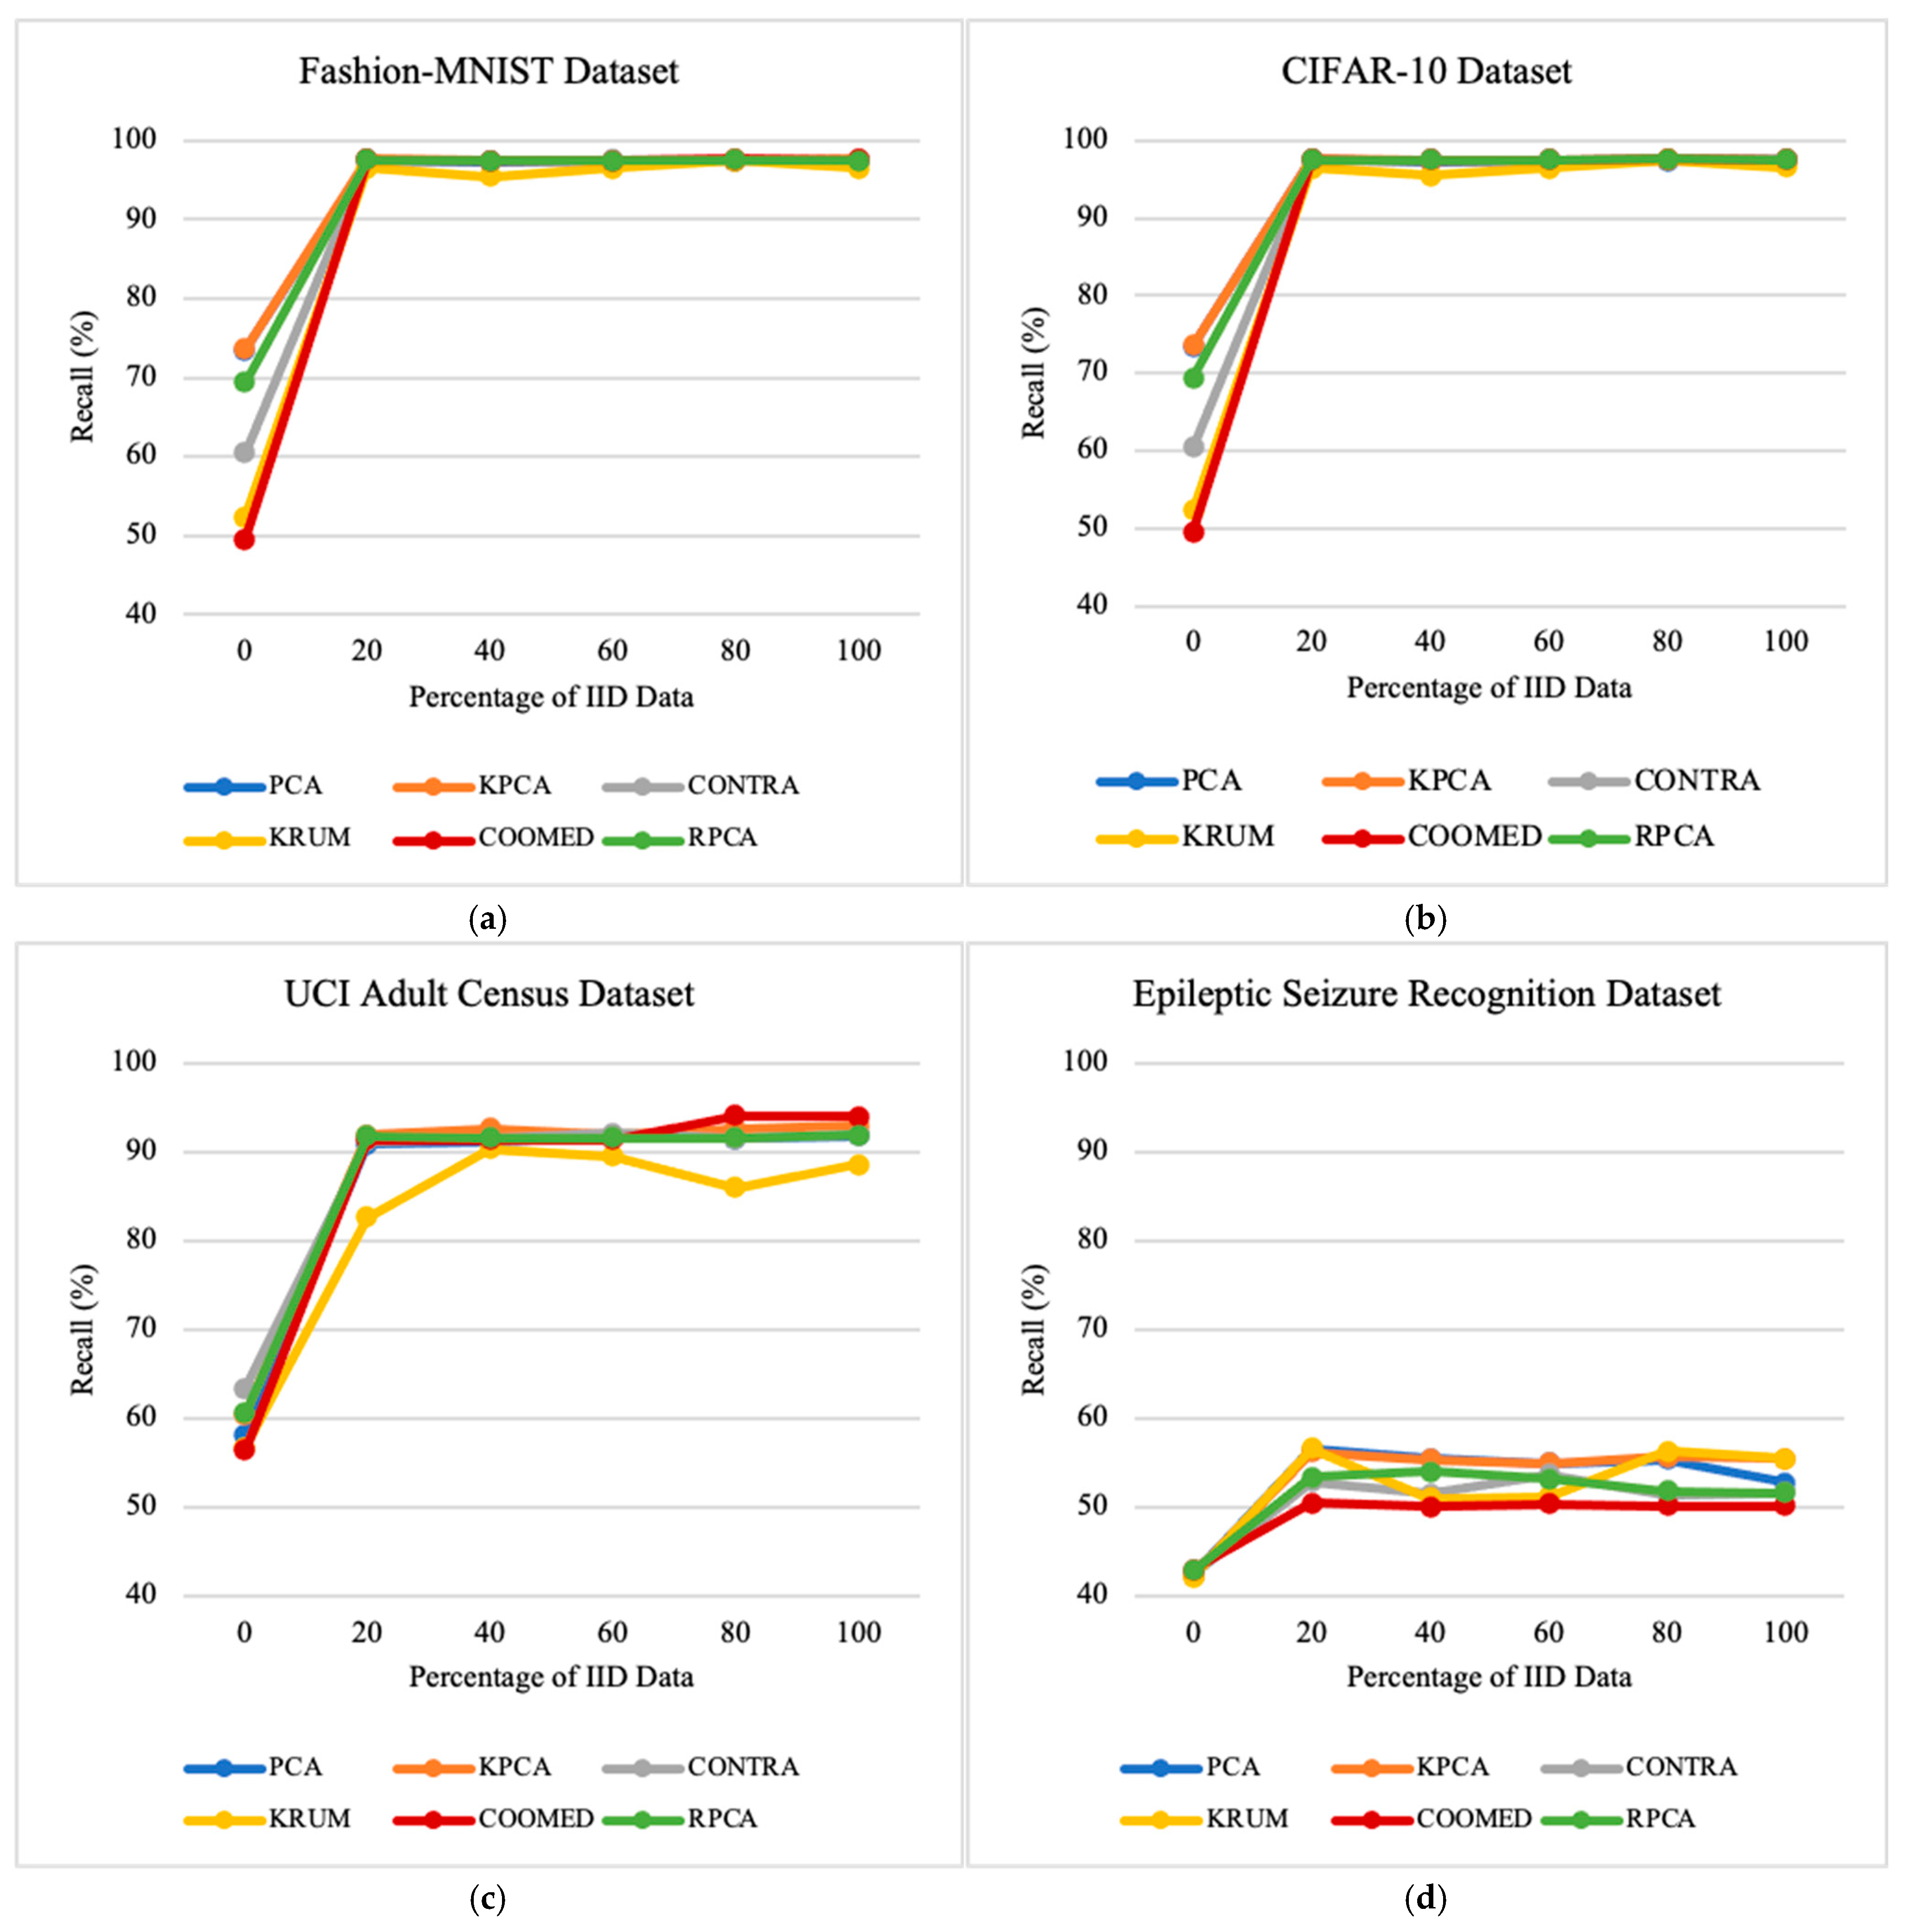
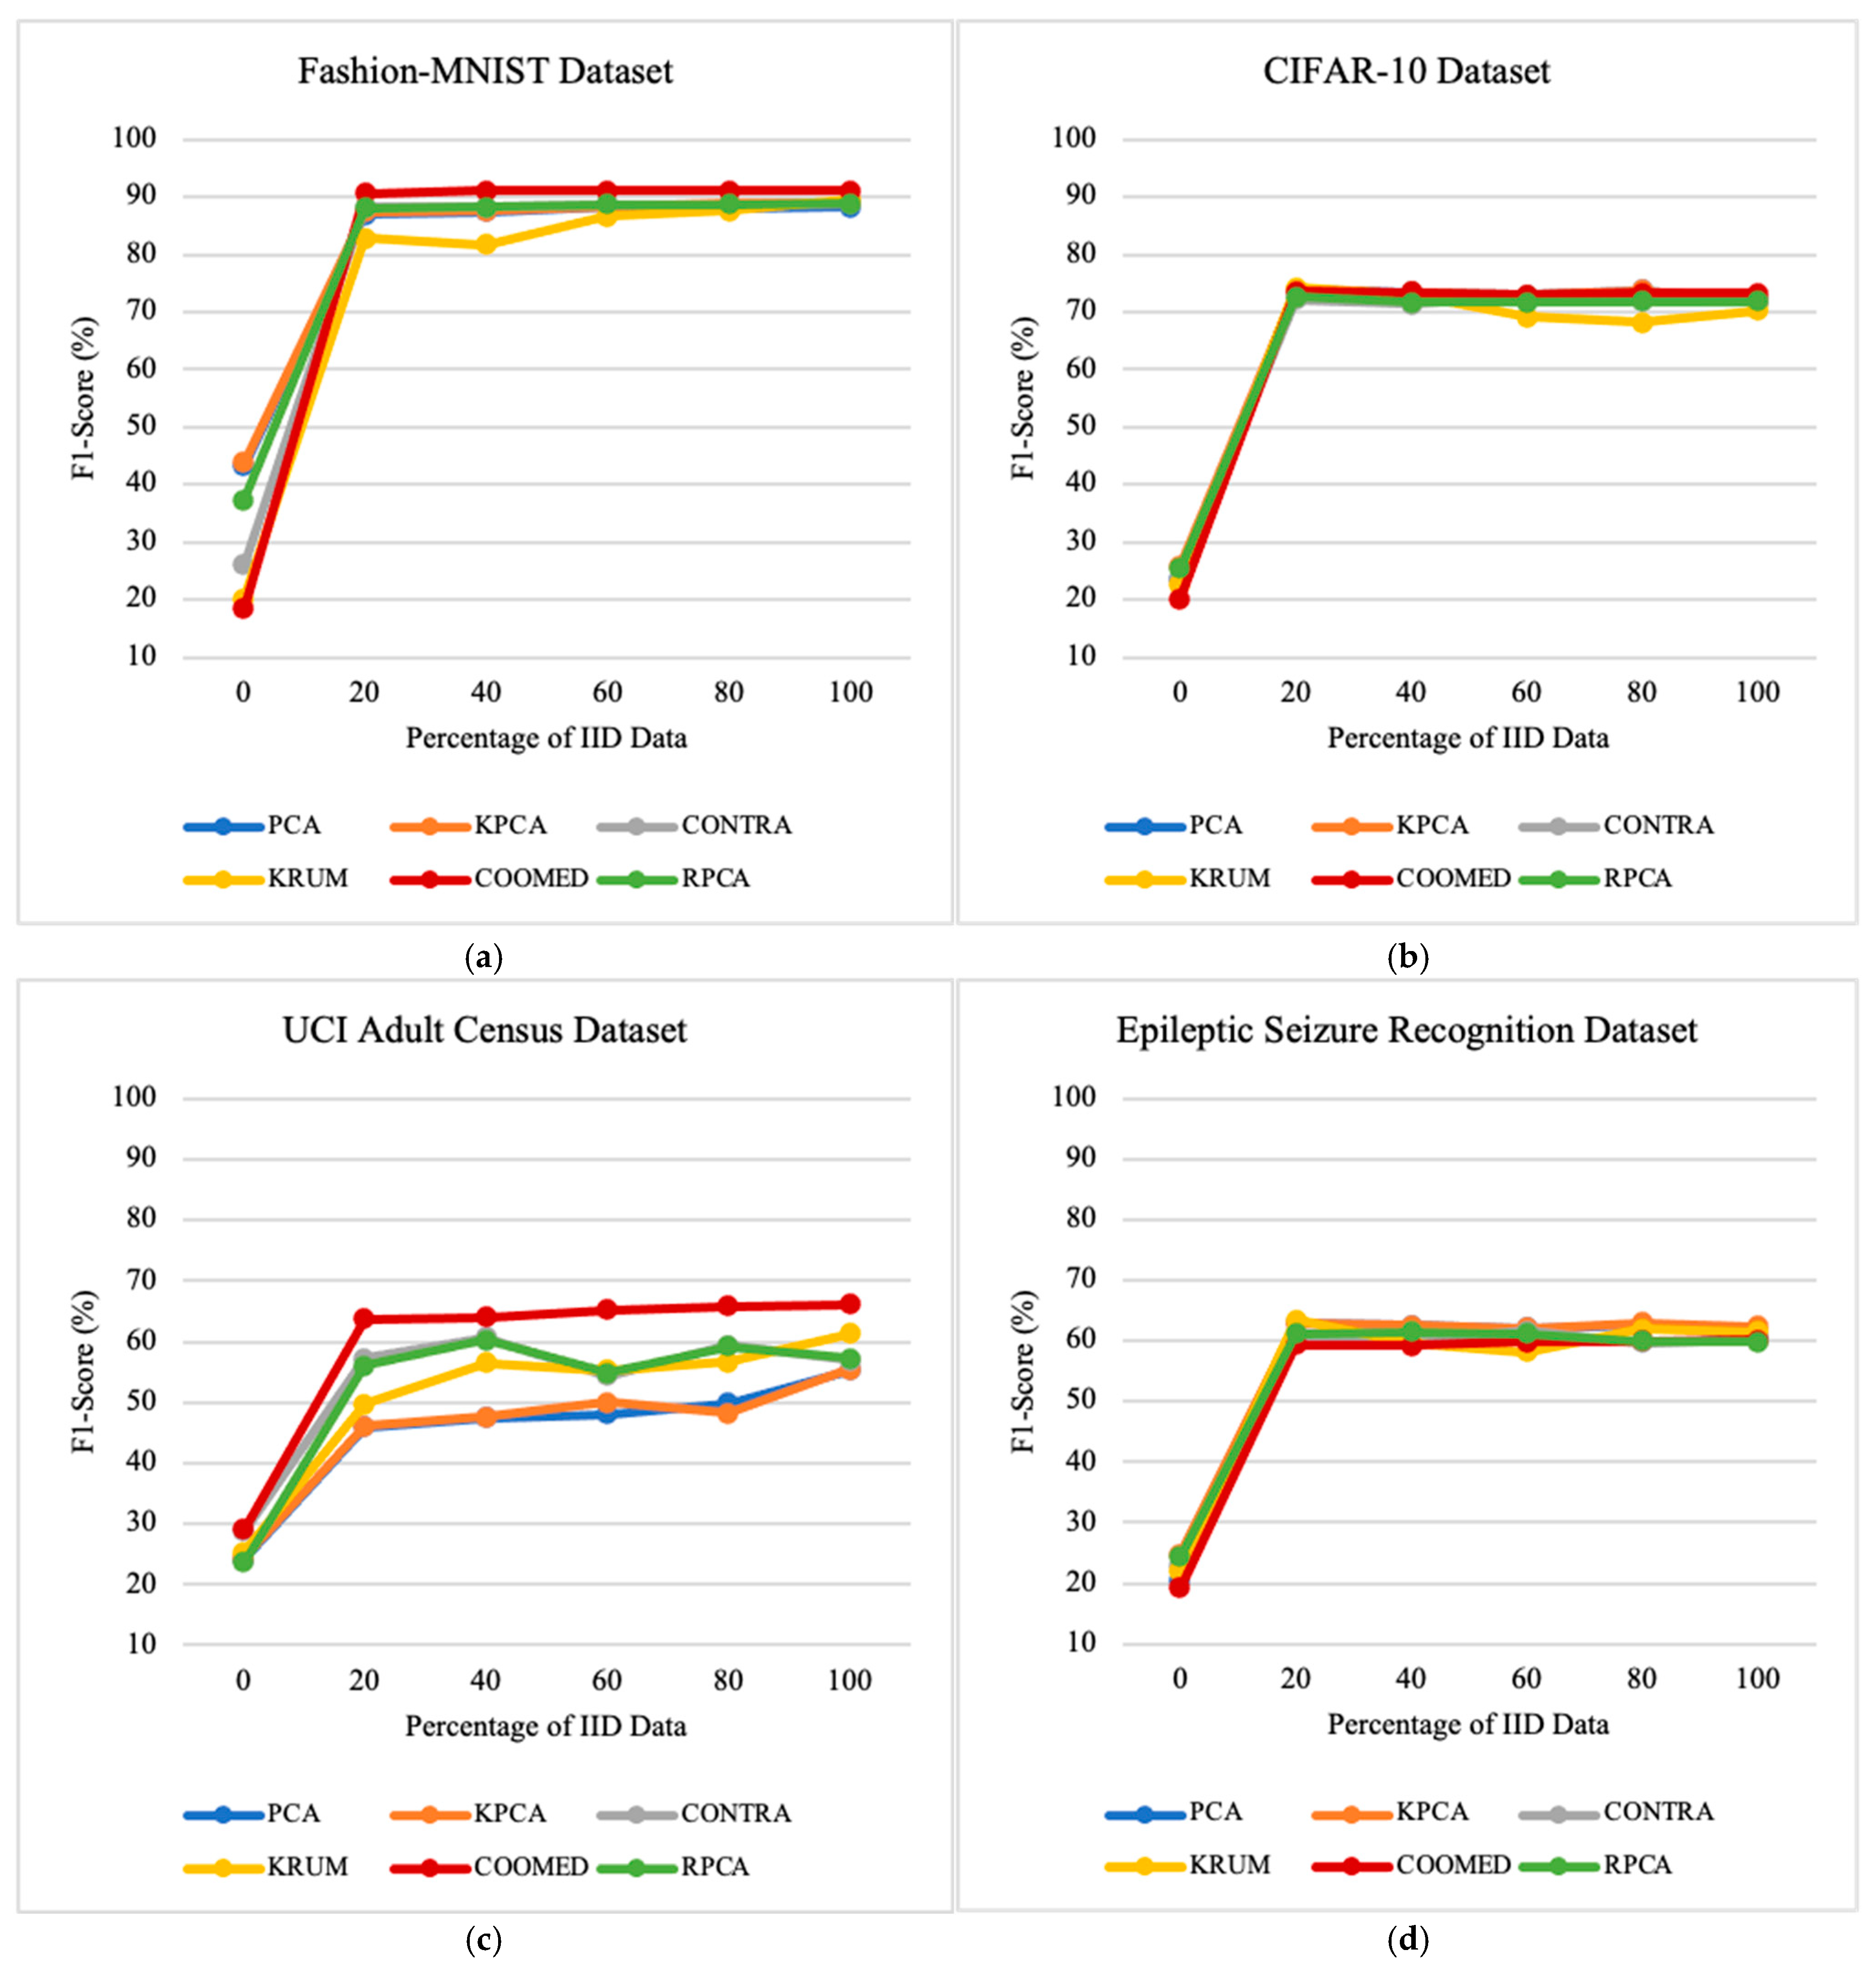
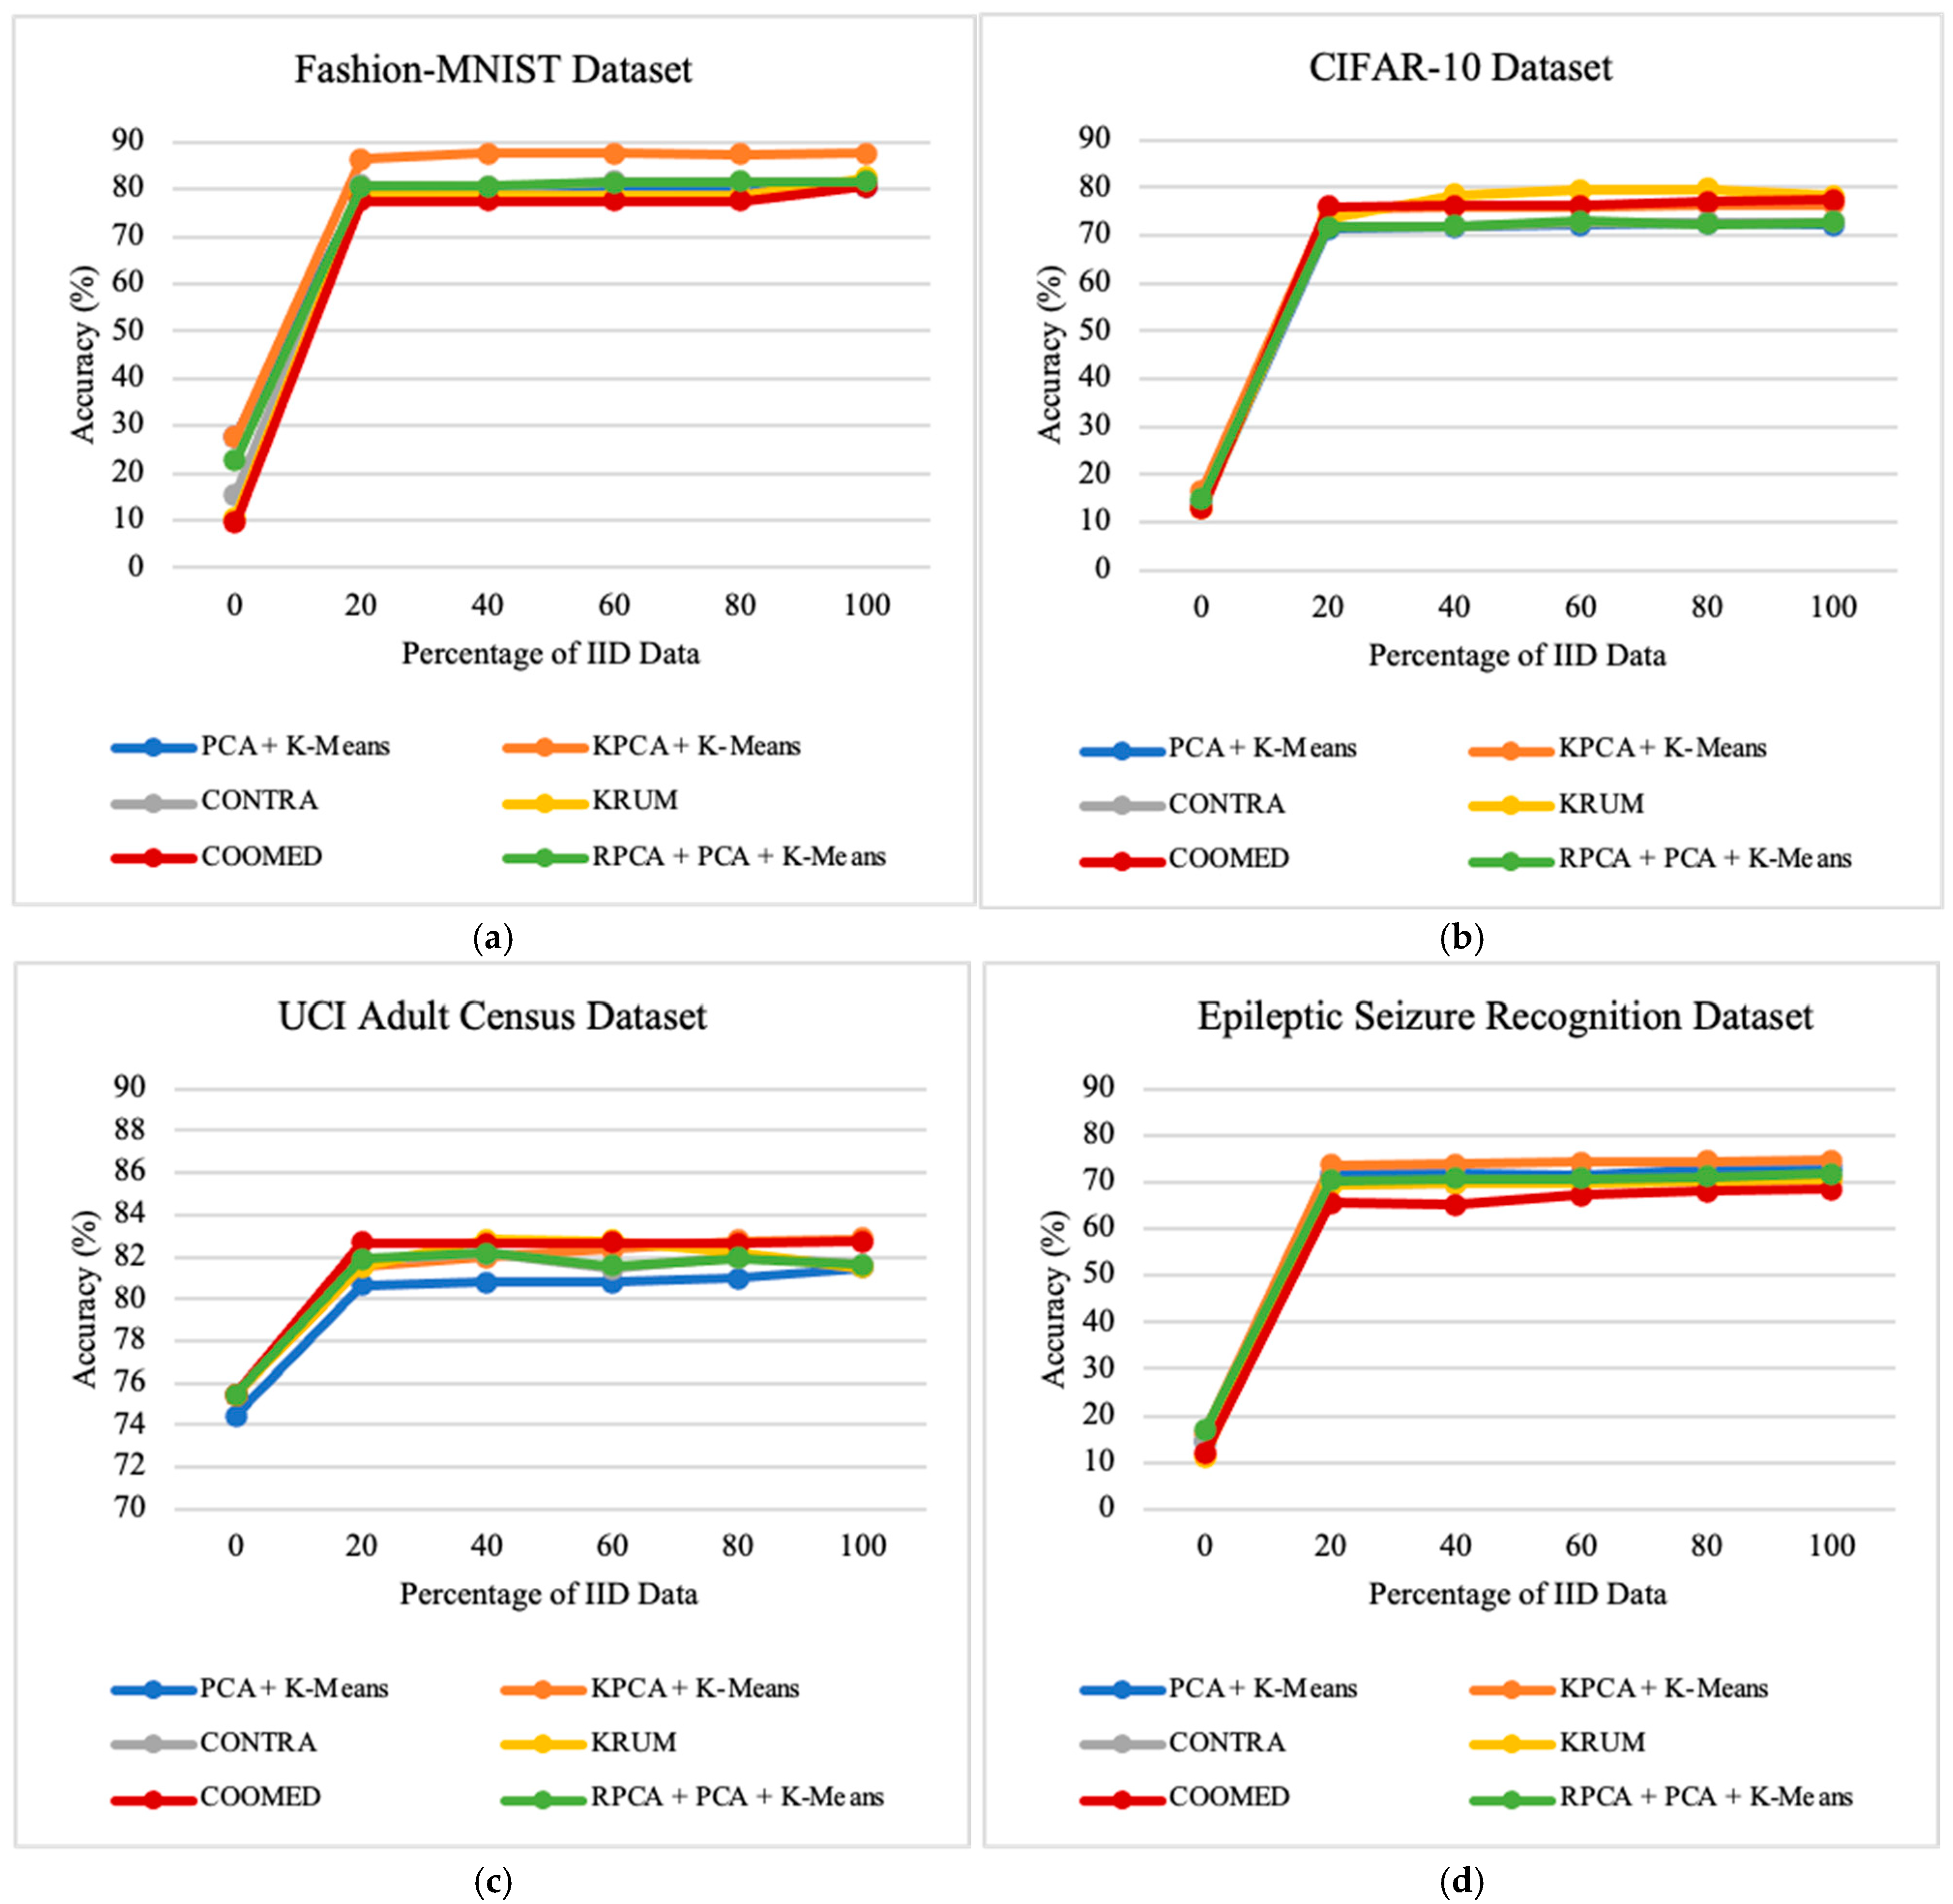
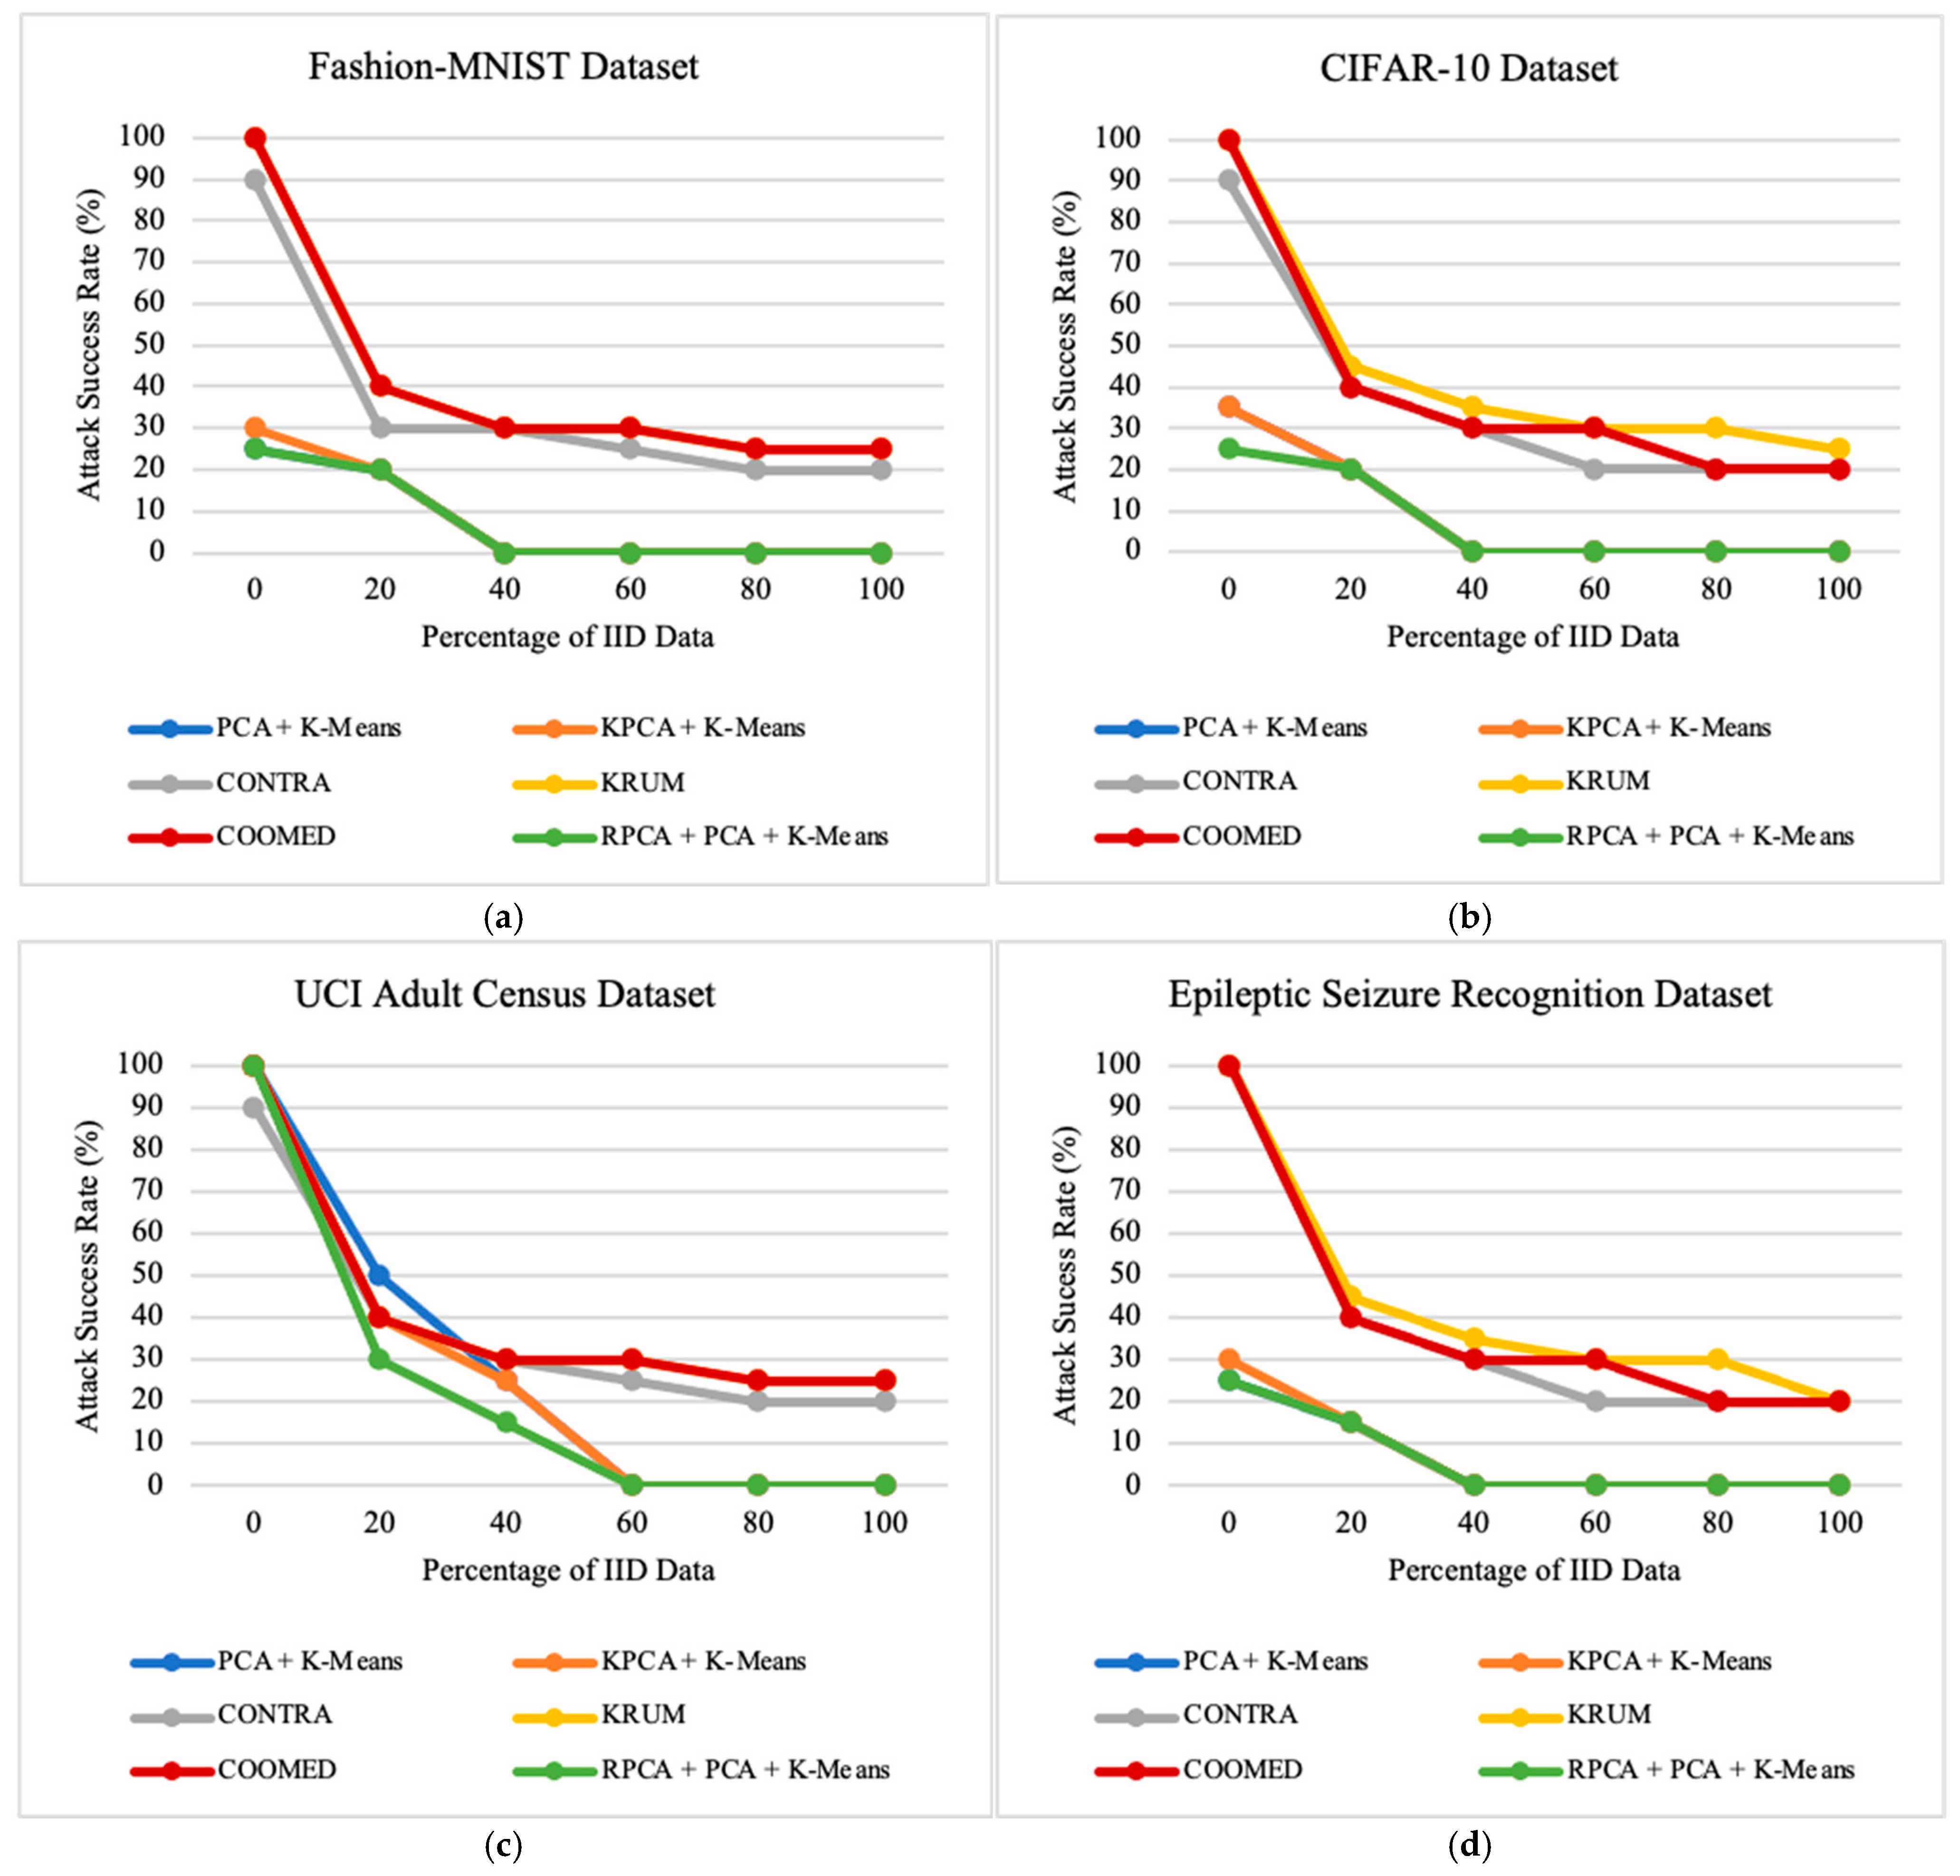
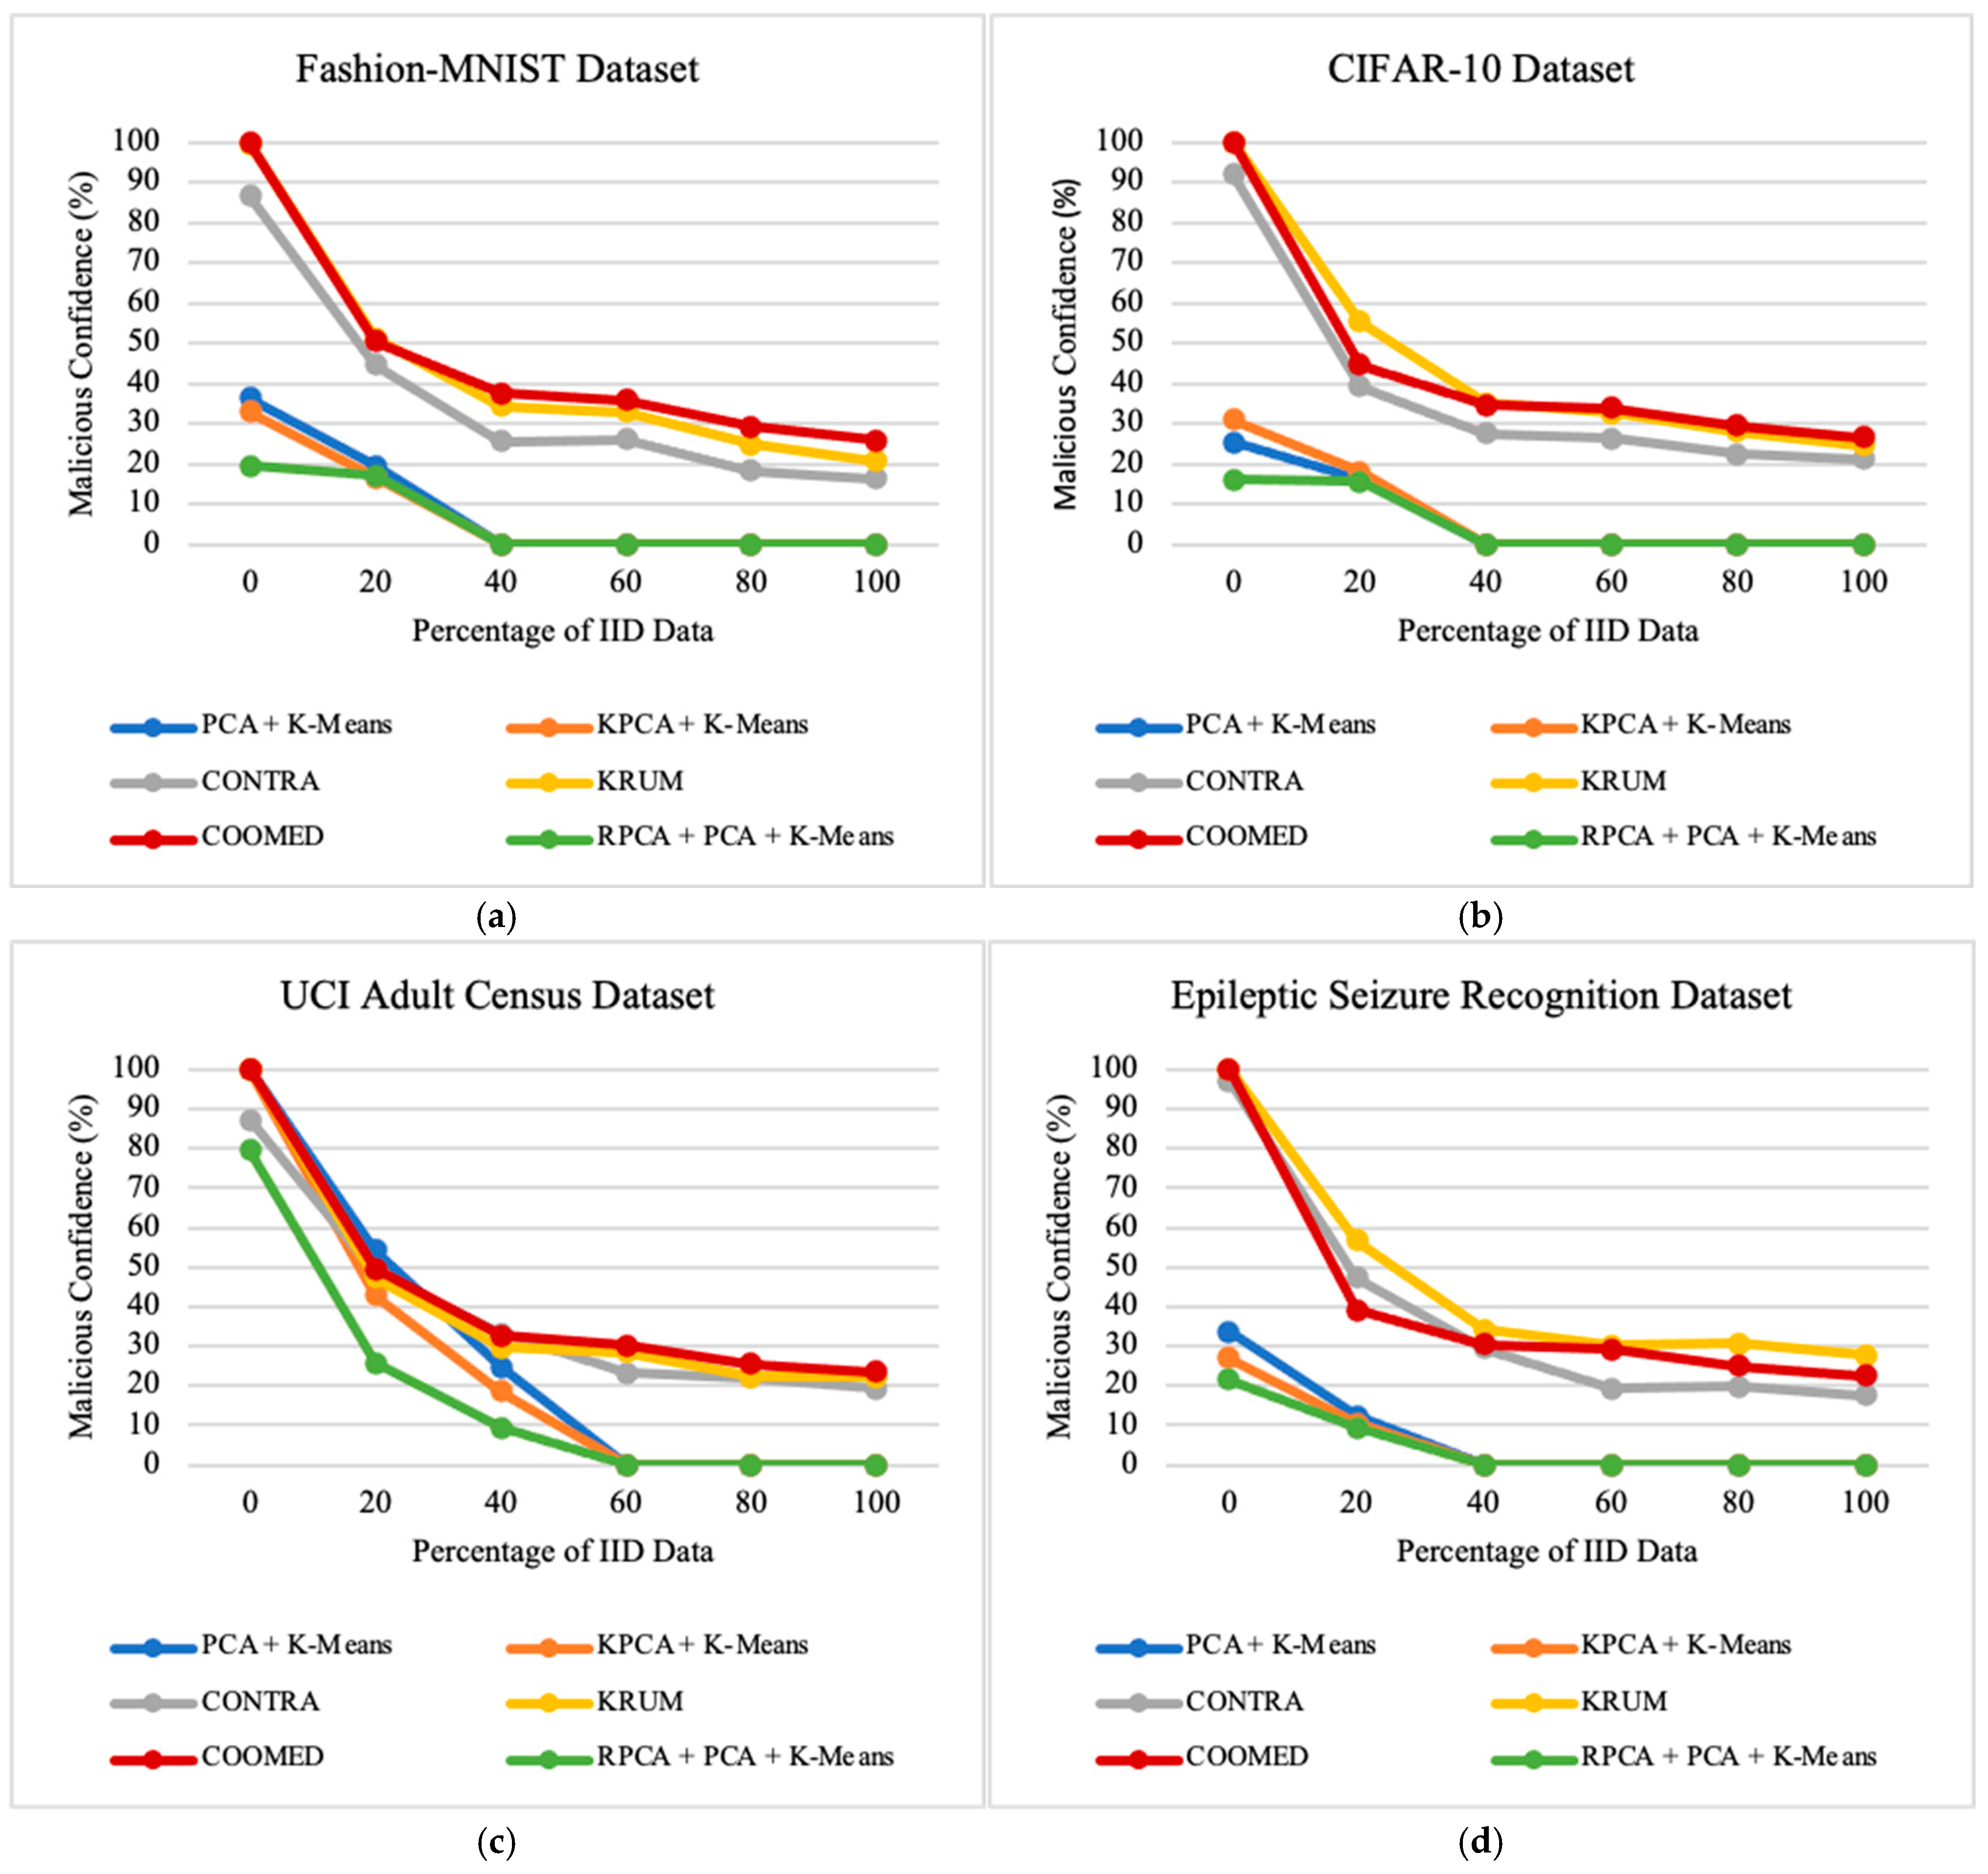
7.2. Impacts of the Percentage of Independent and Identically Distributed Data
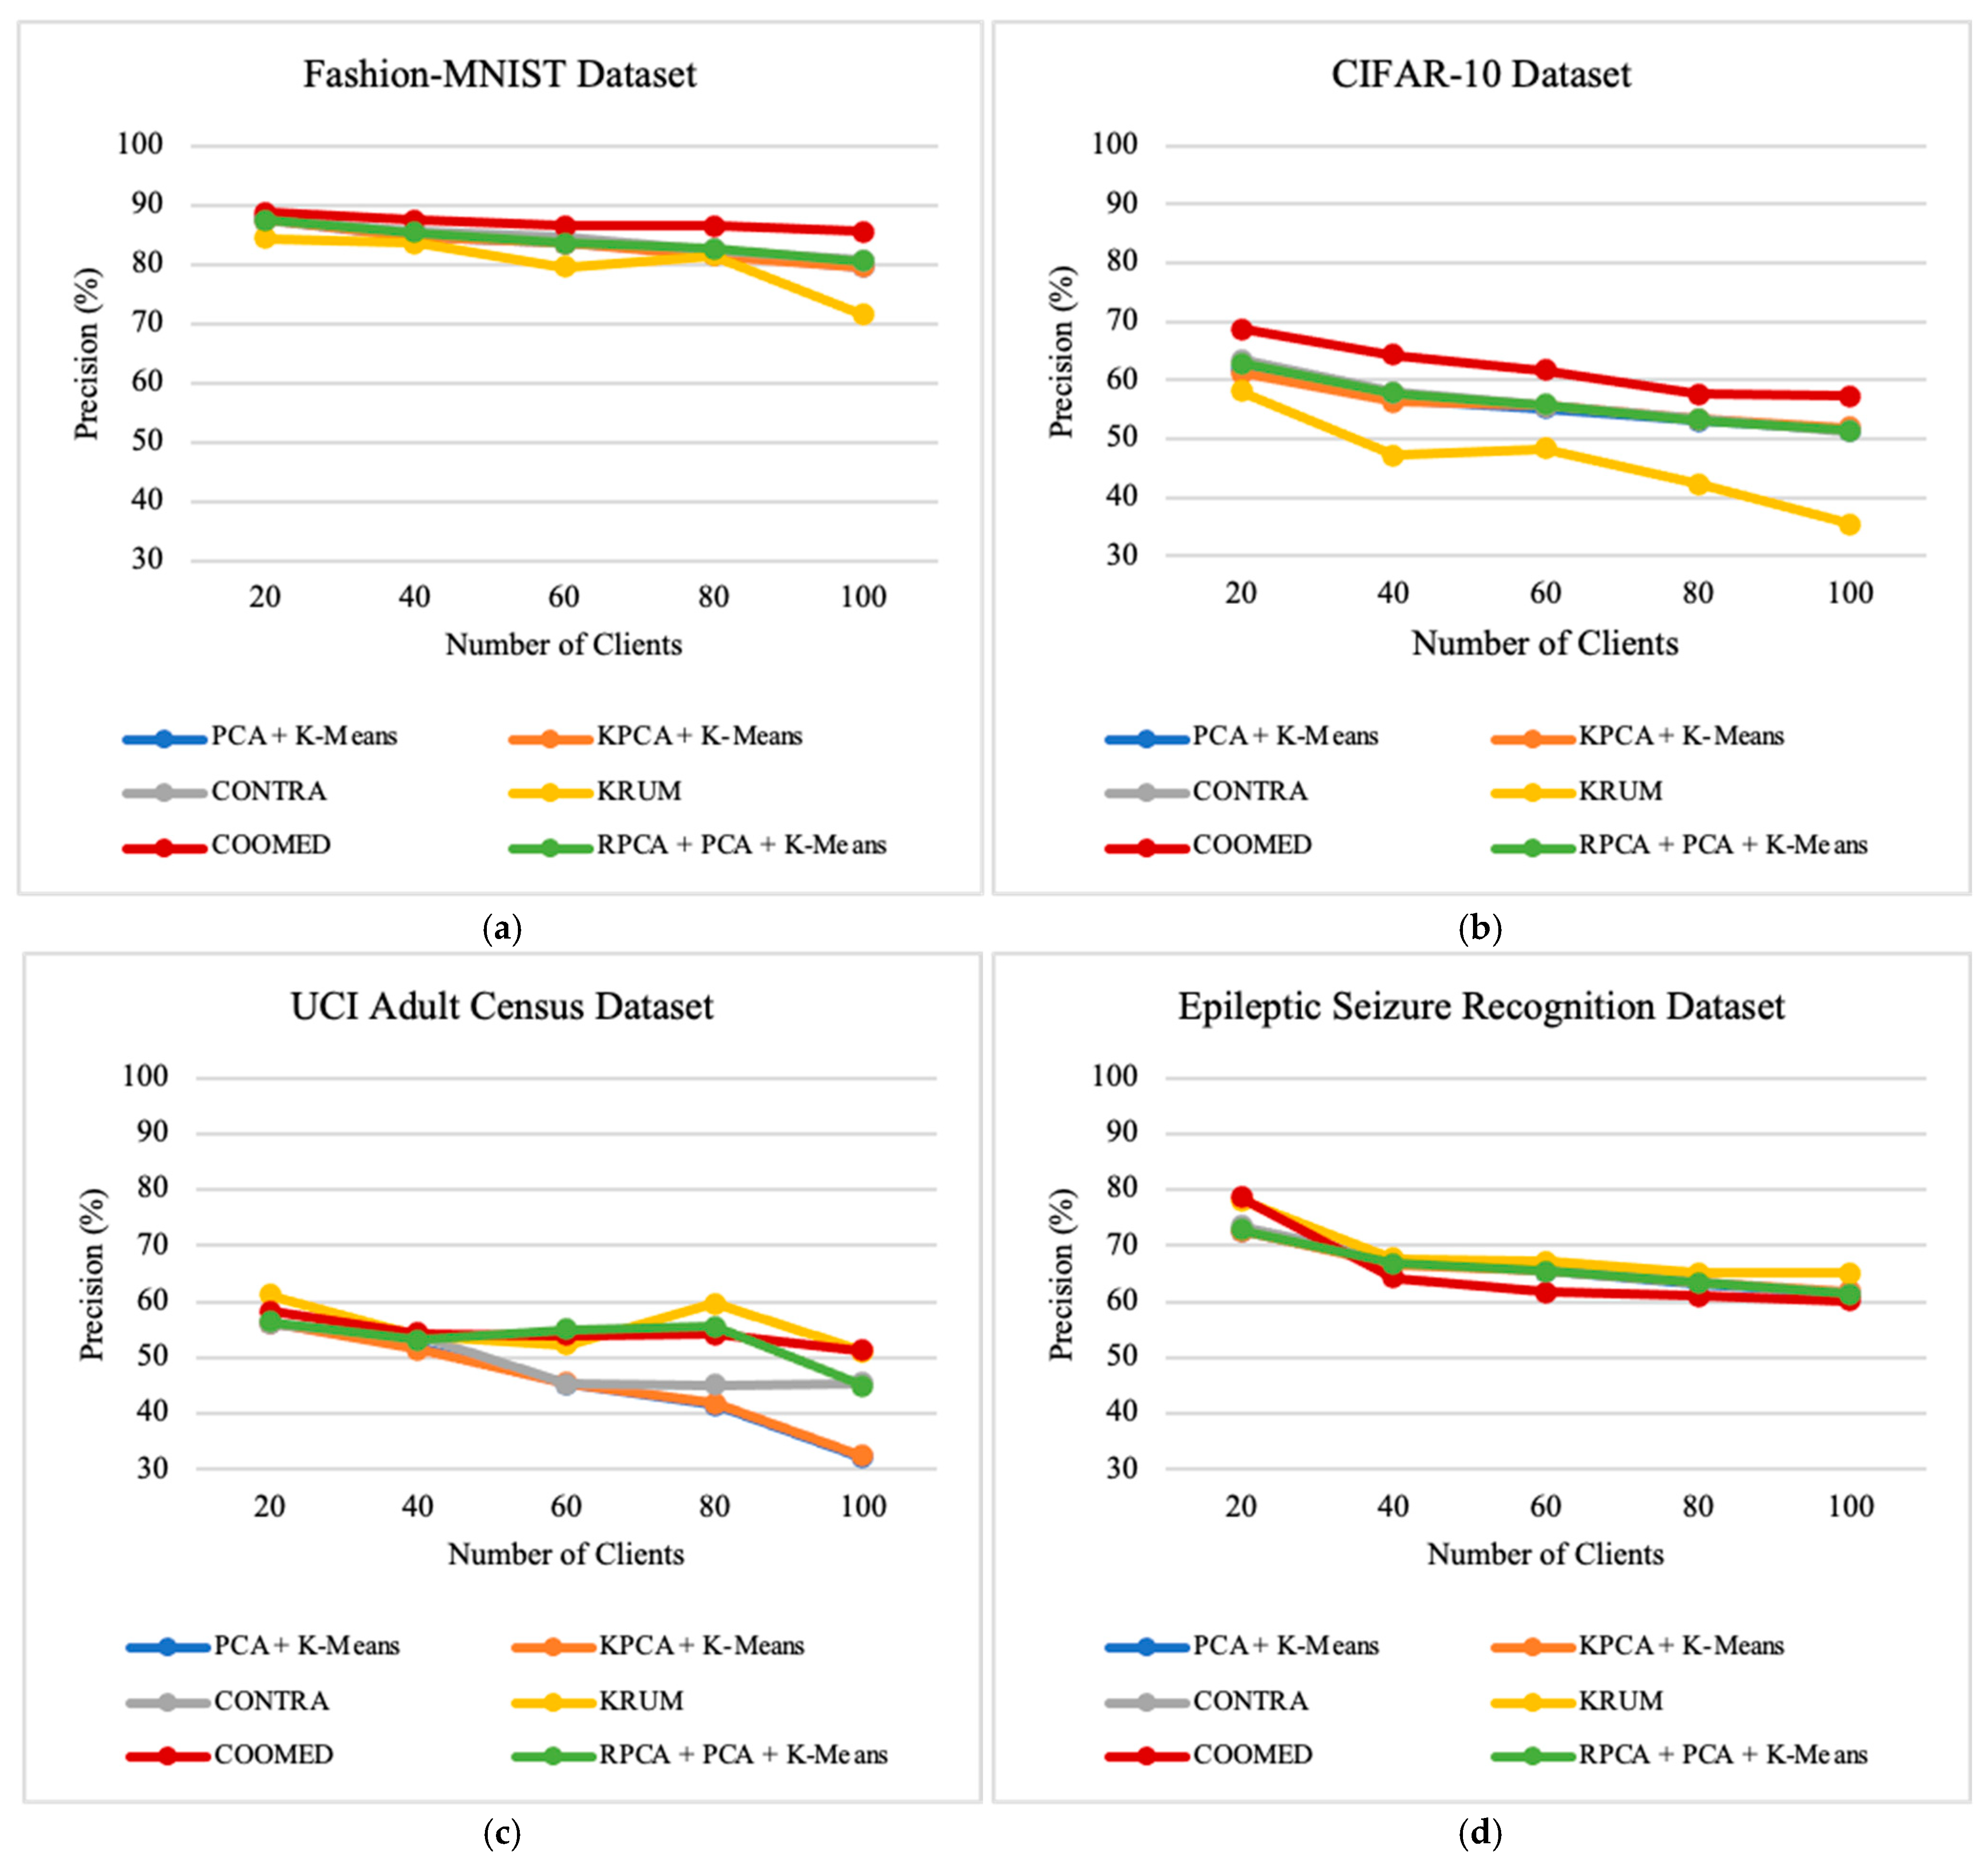
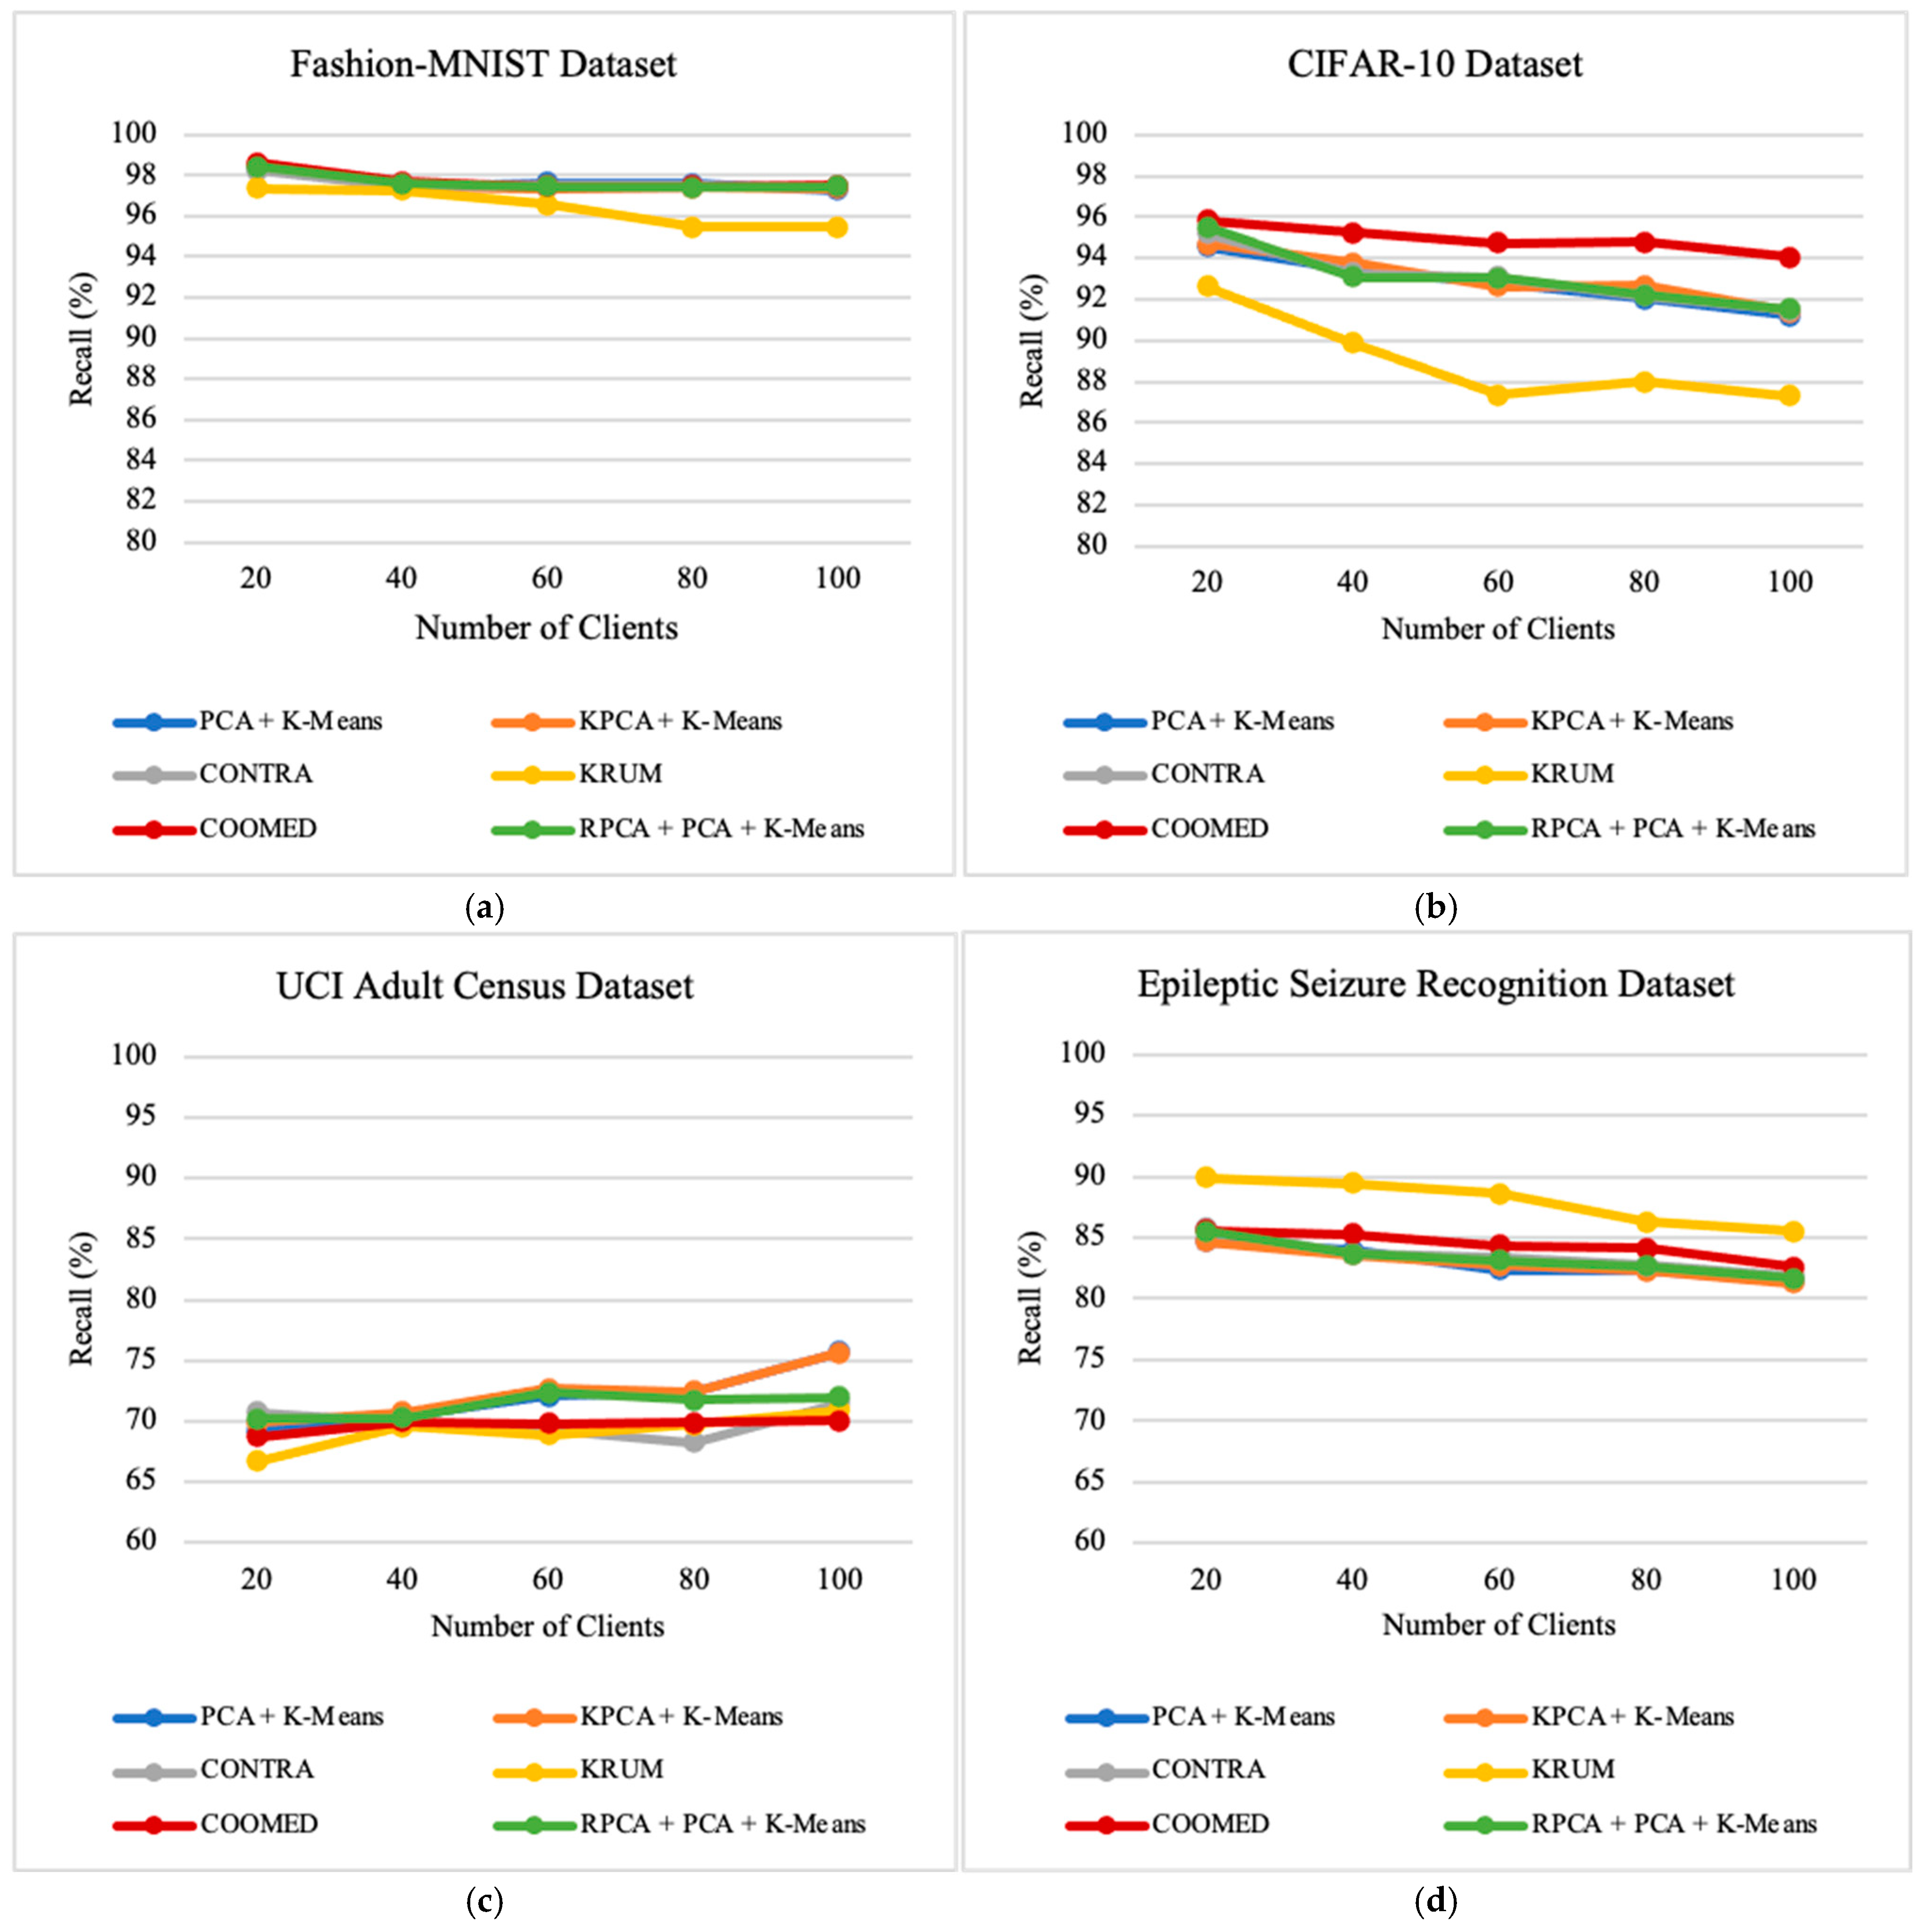
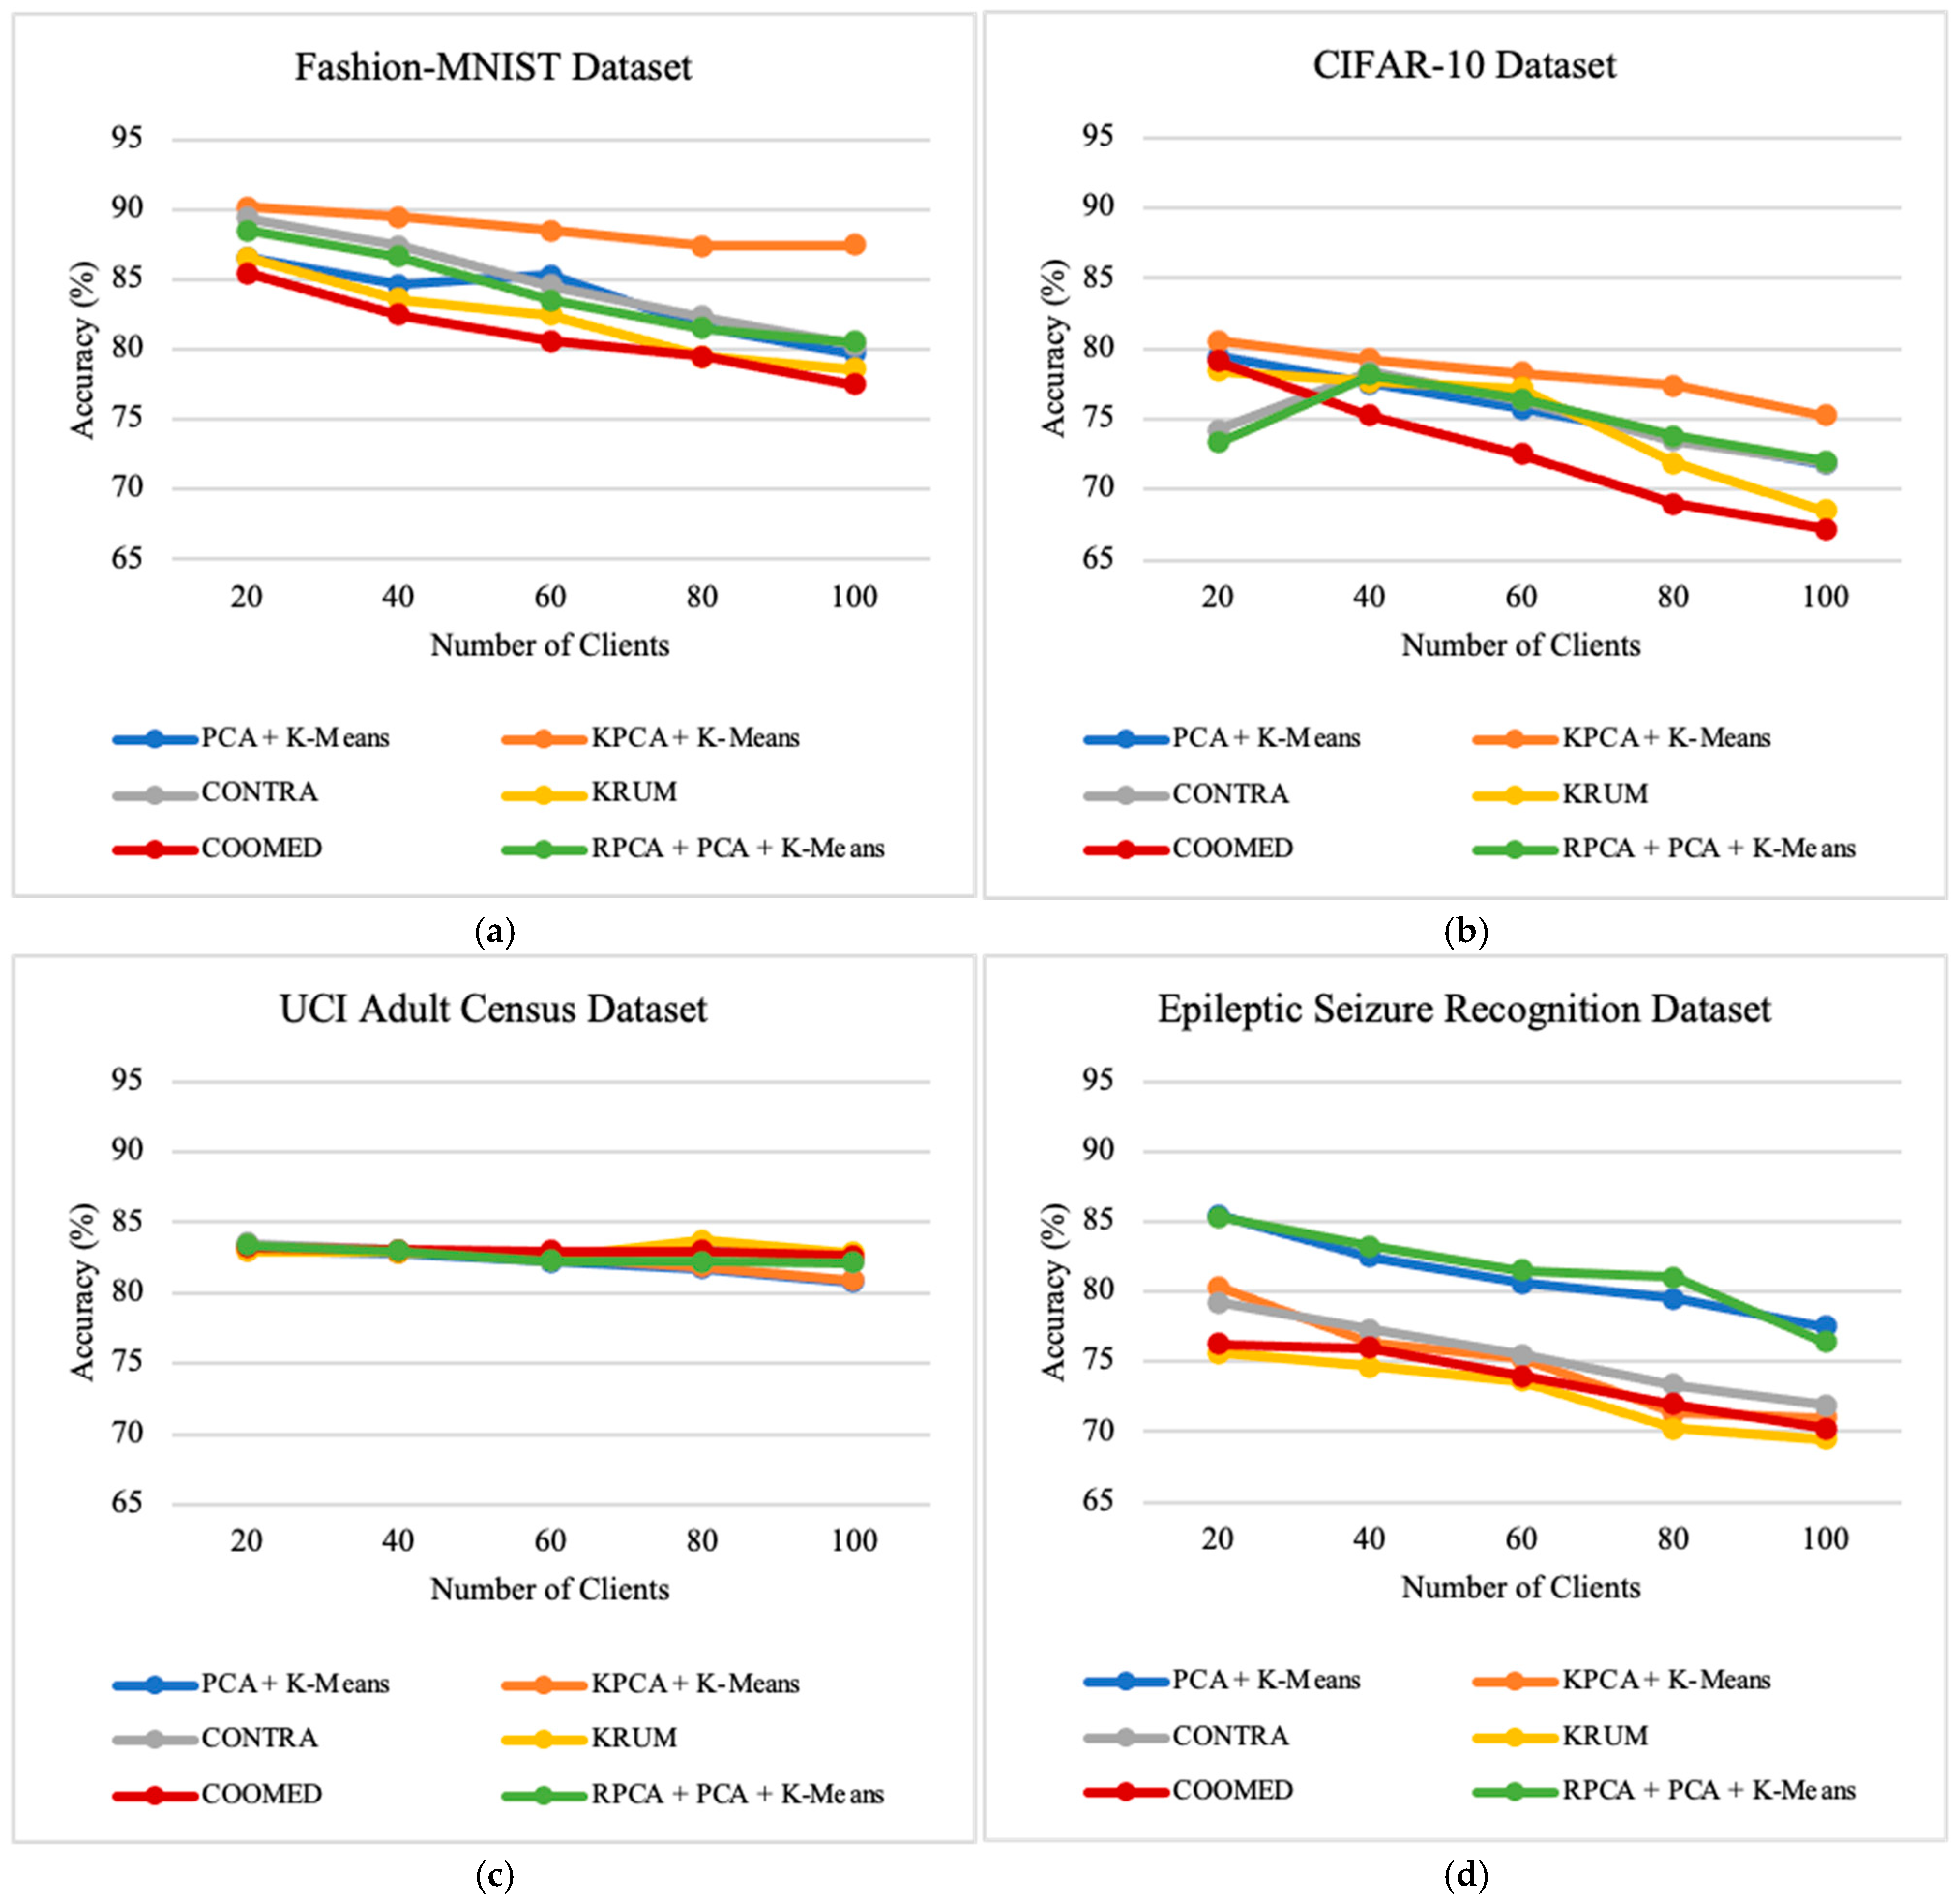
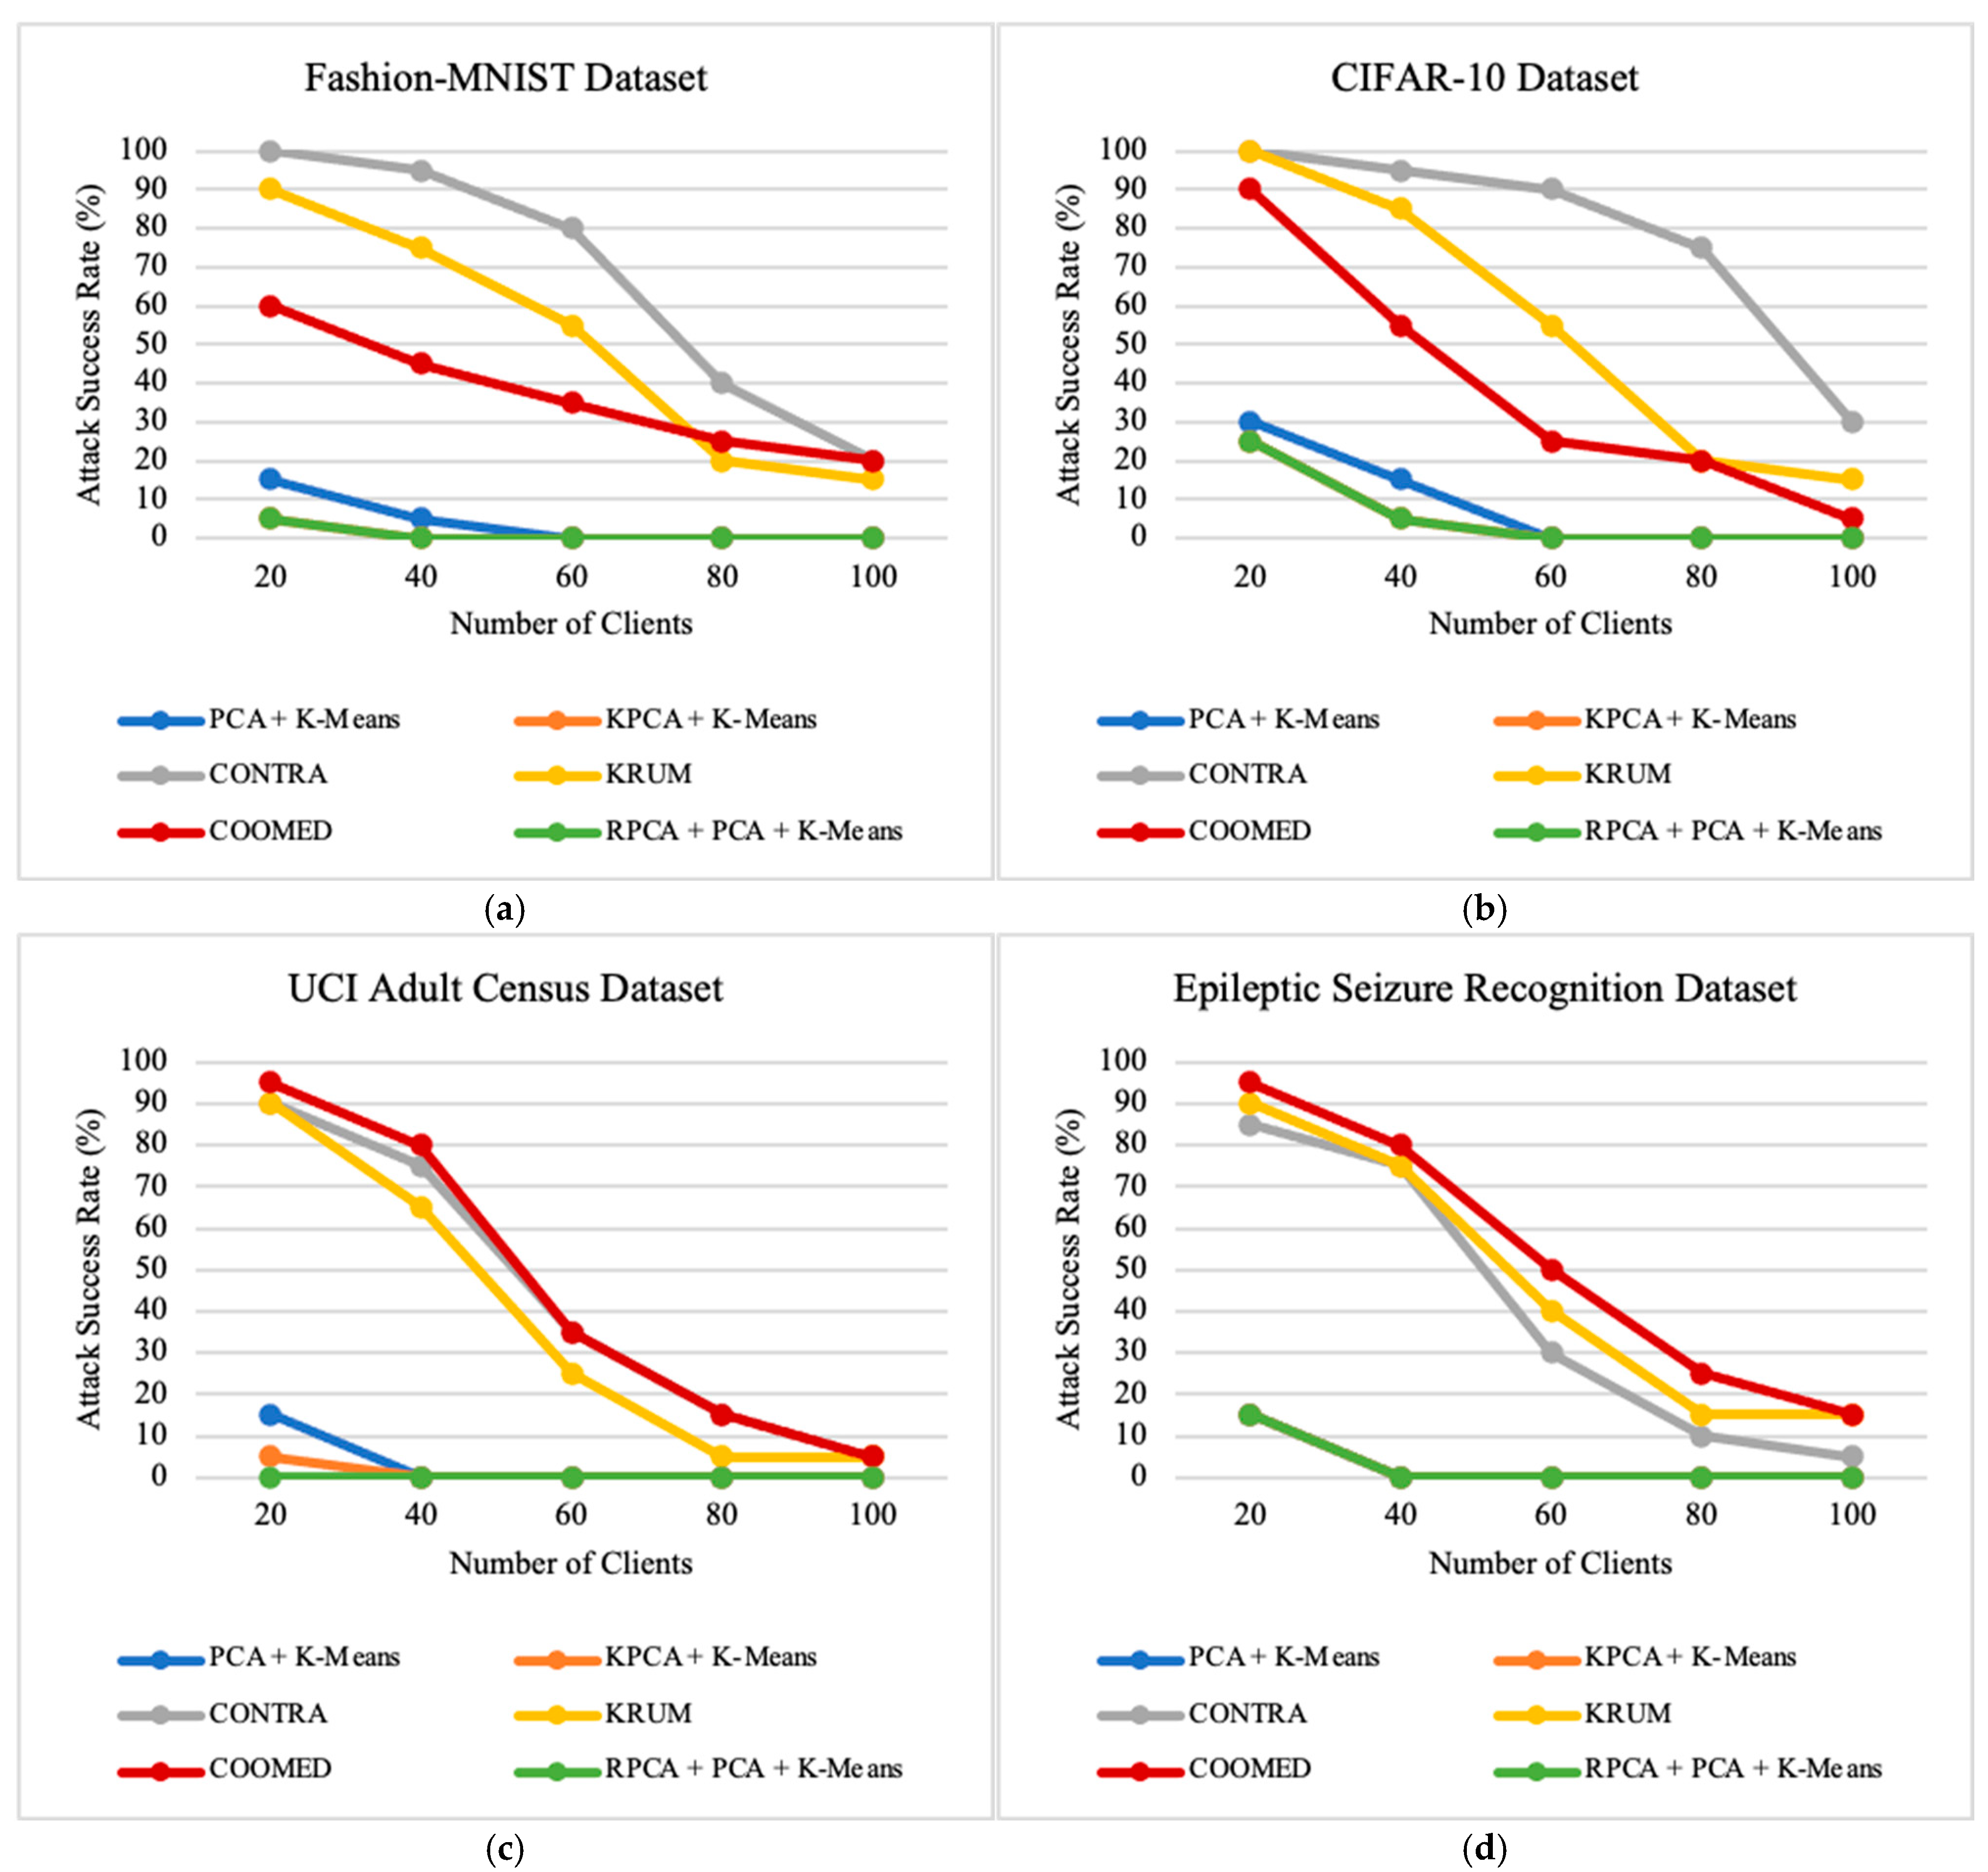
7.3. Impact of Number of Clients
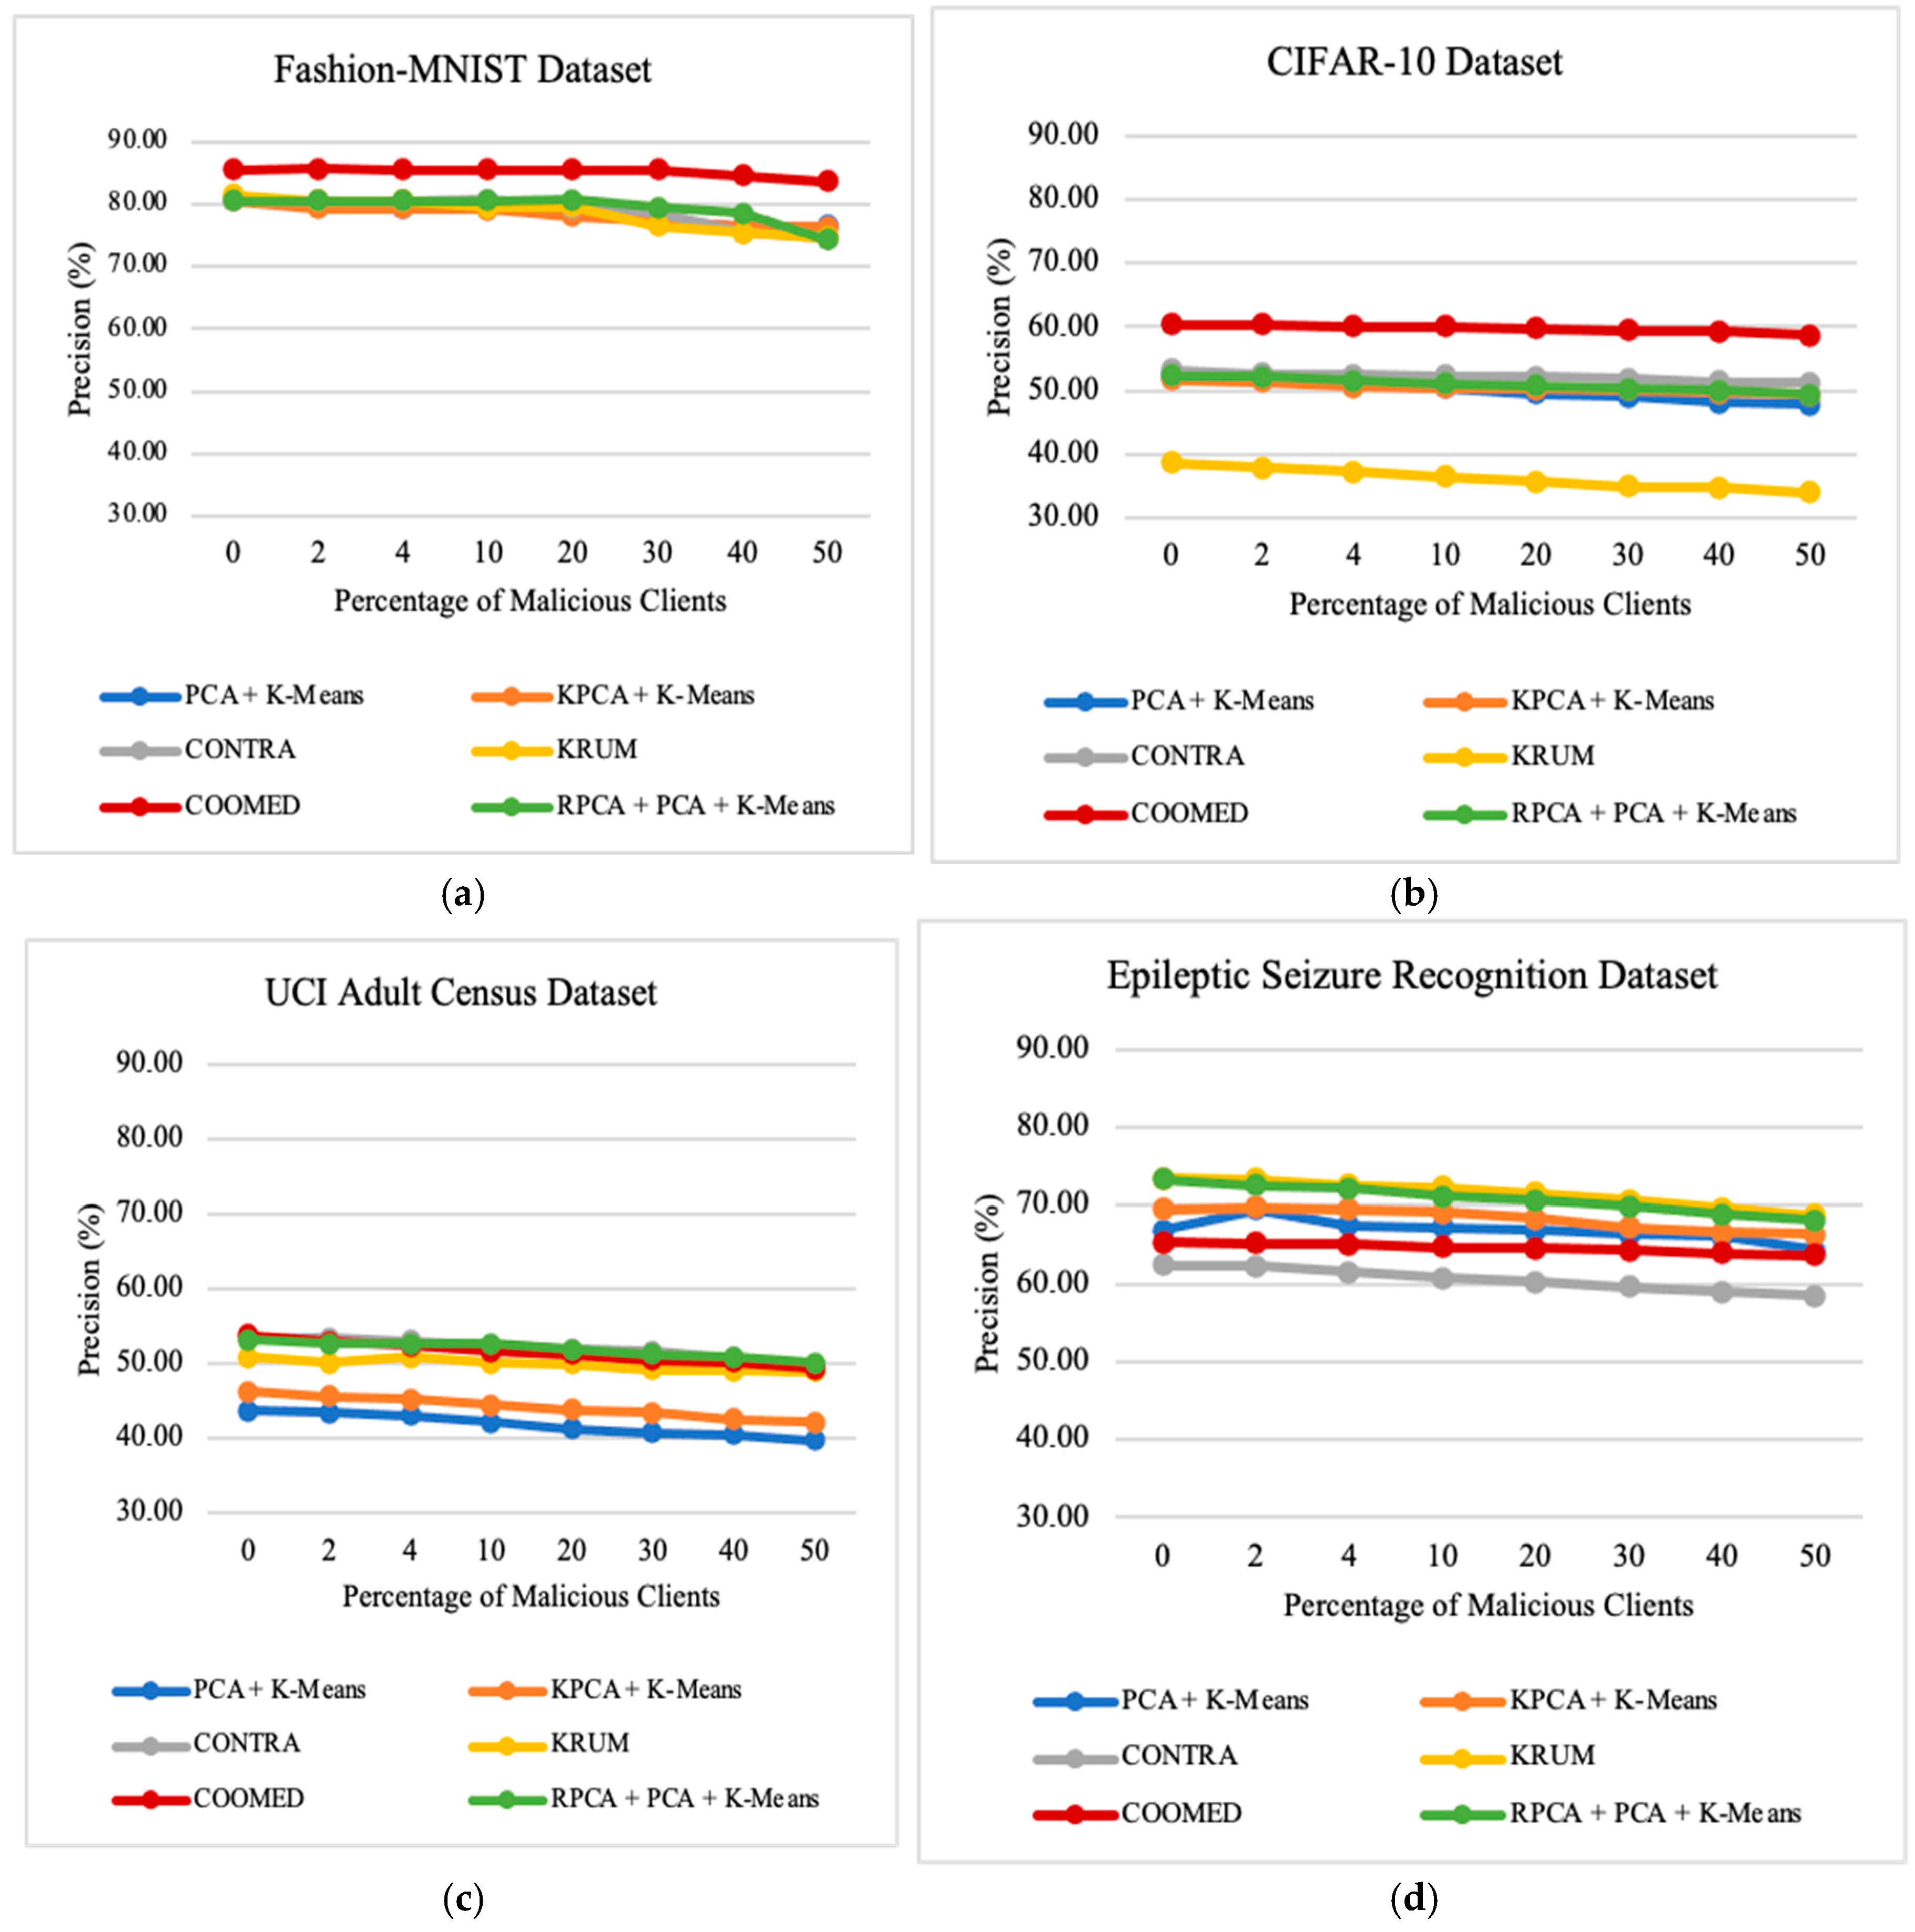
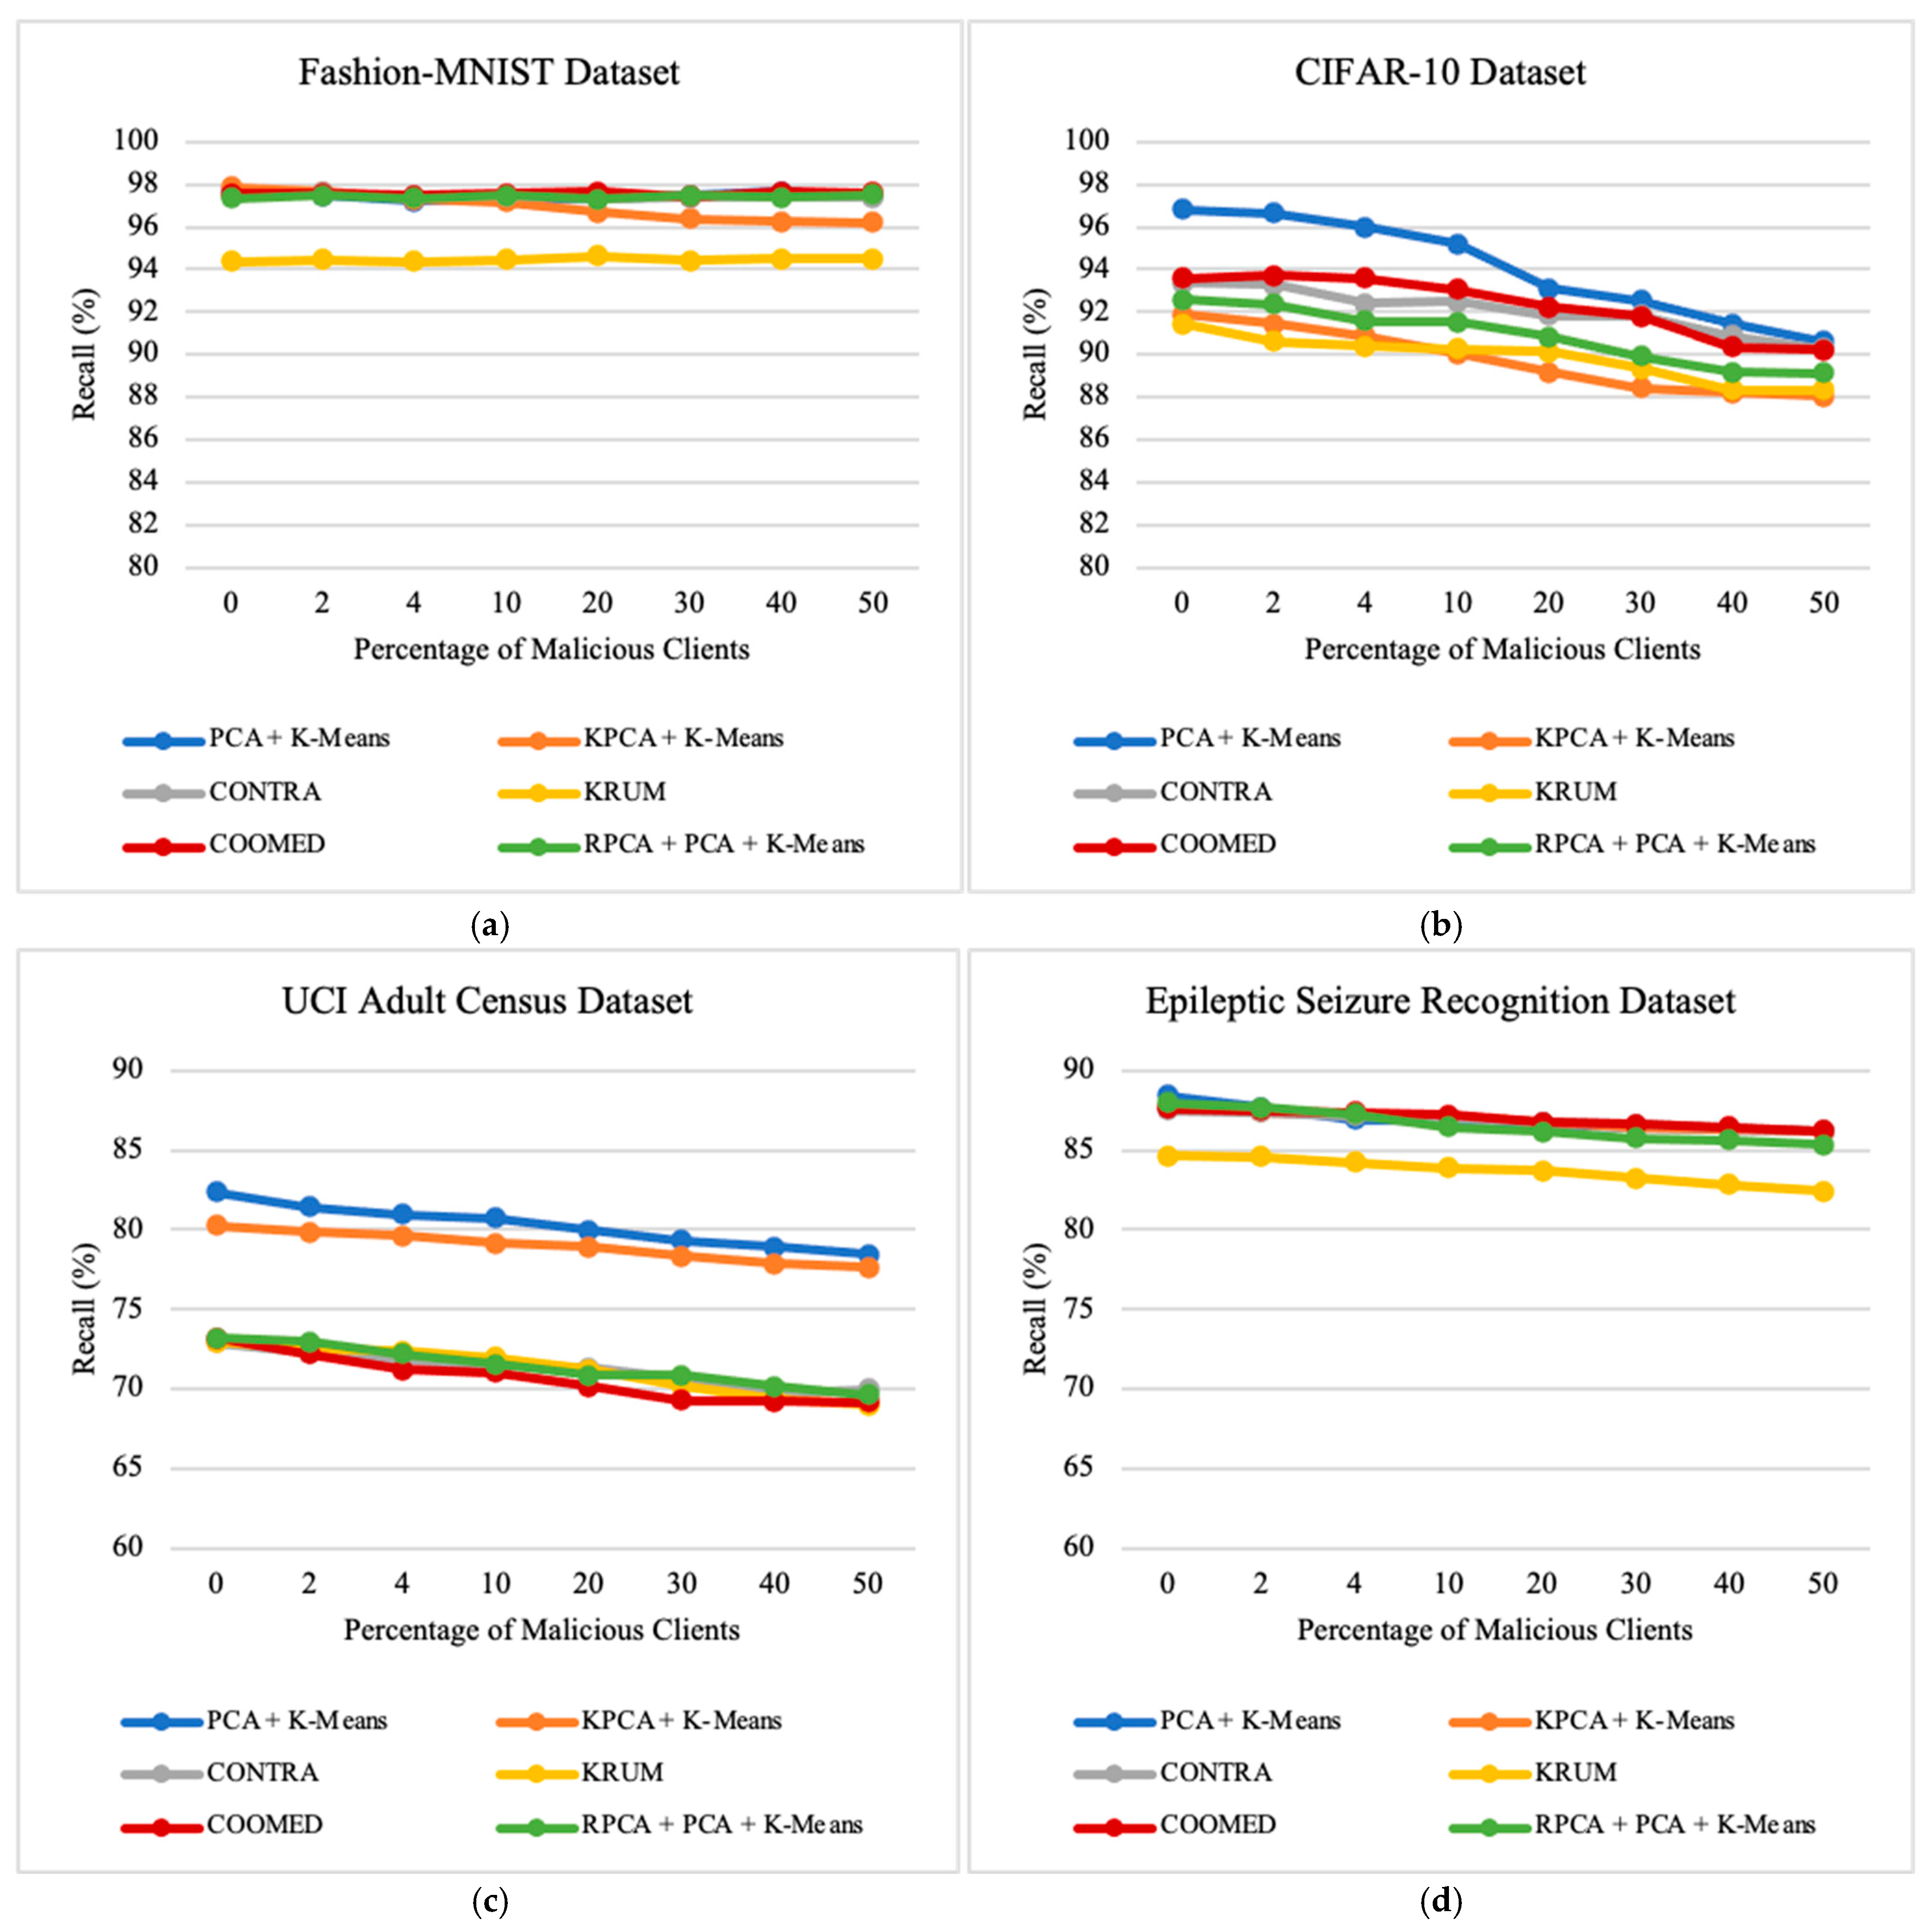
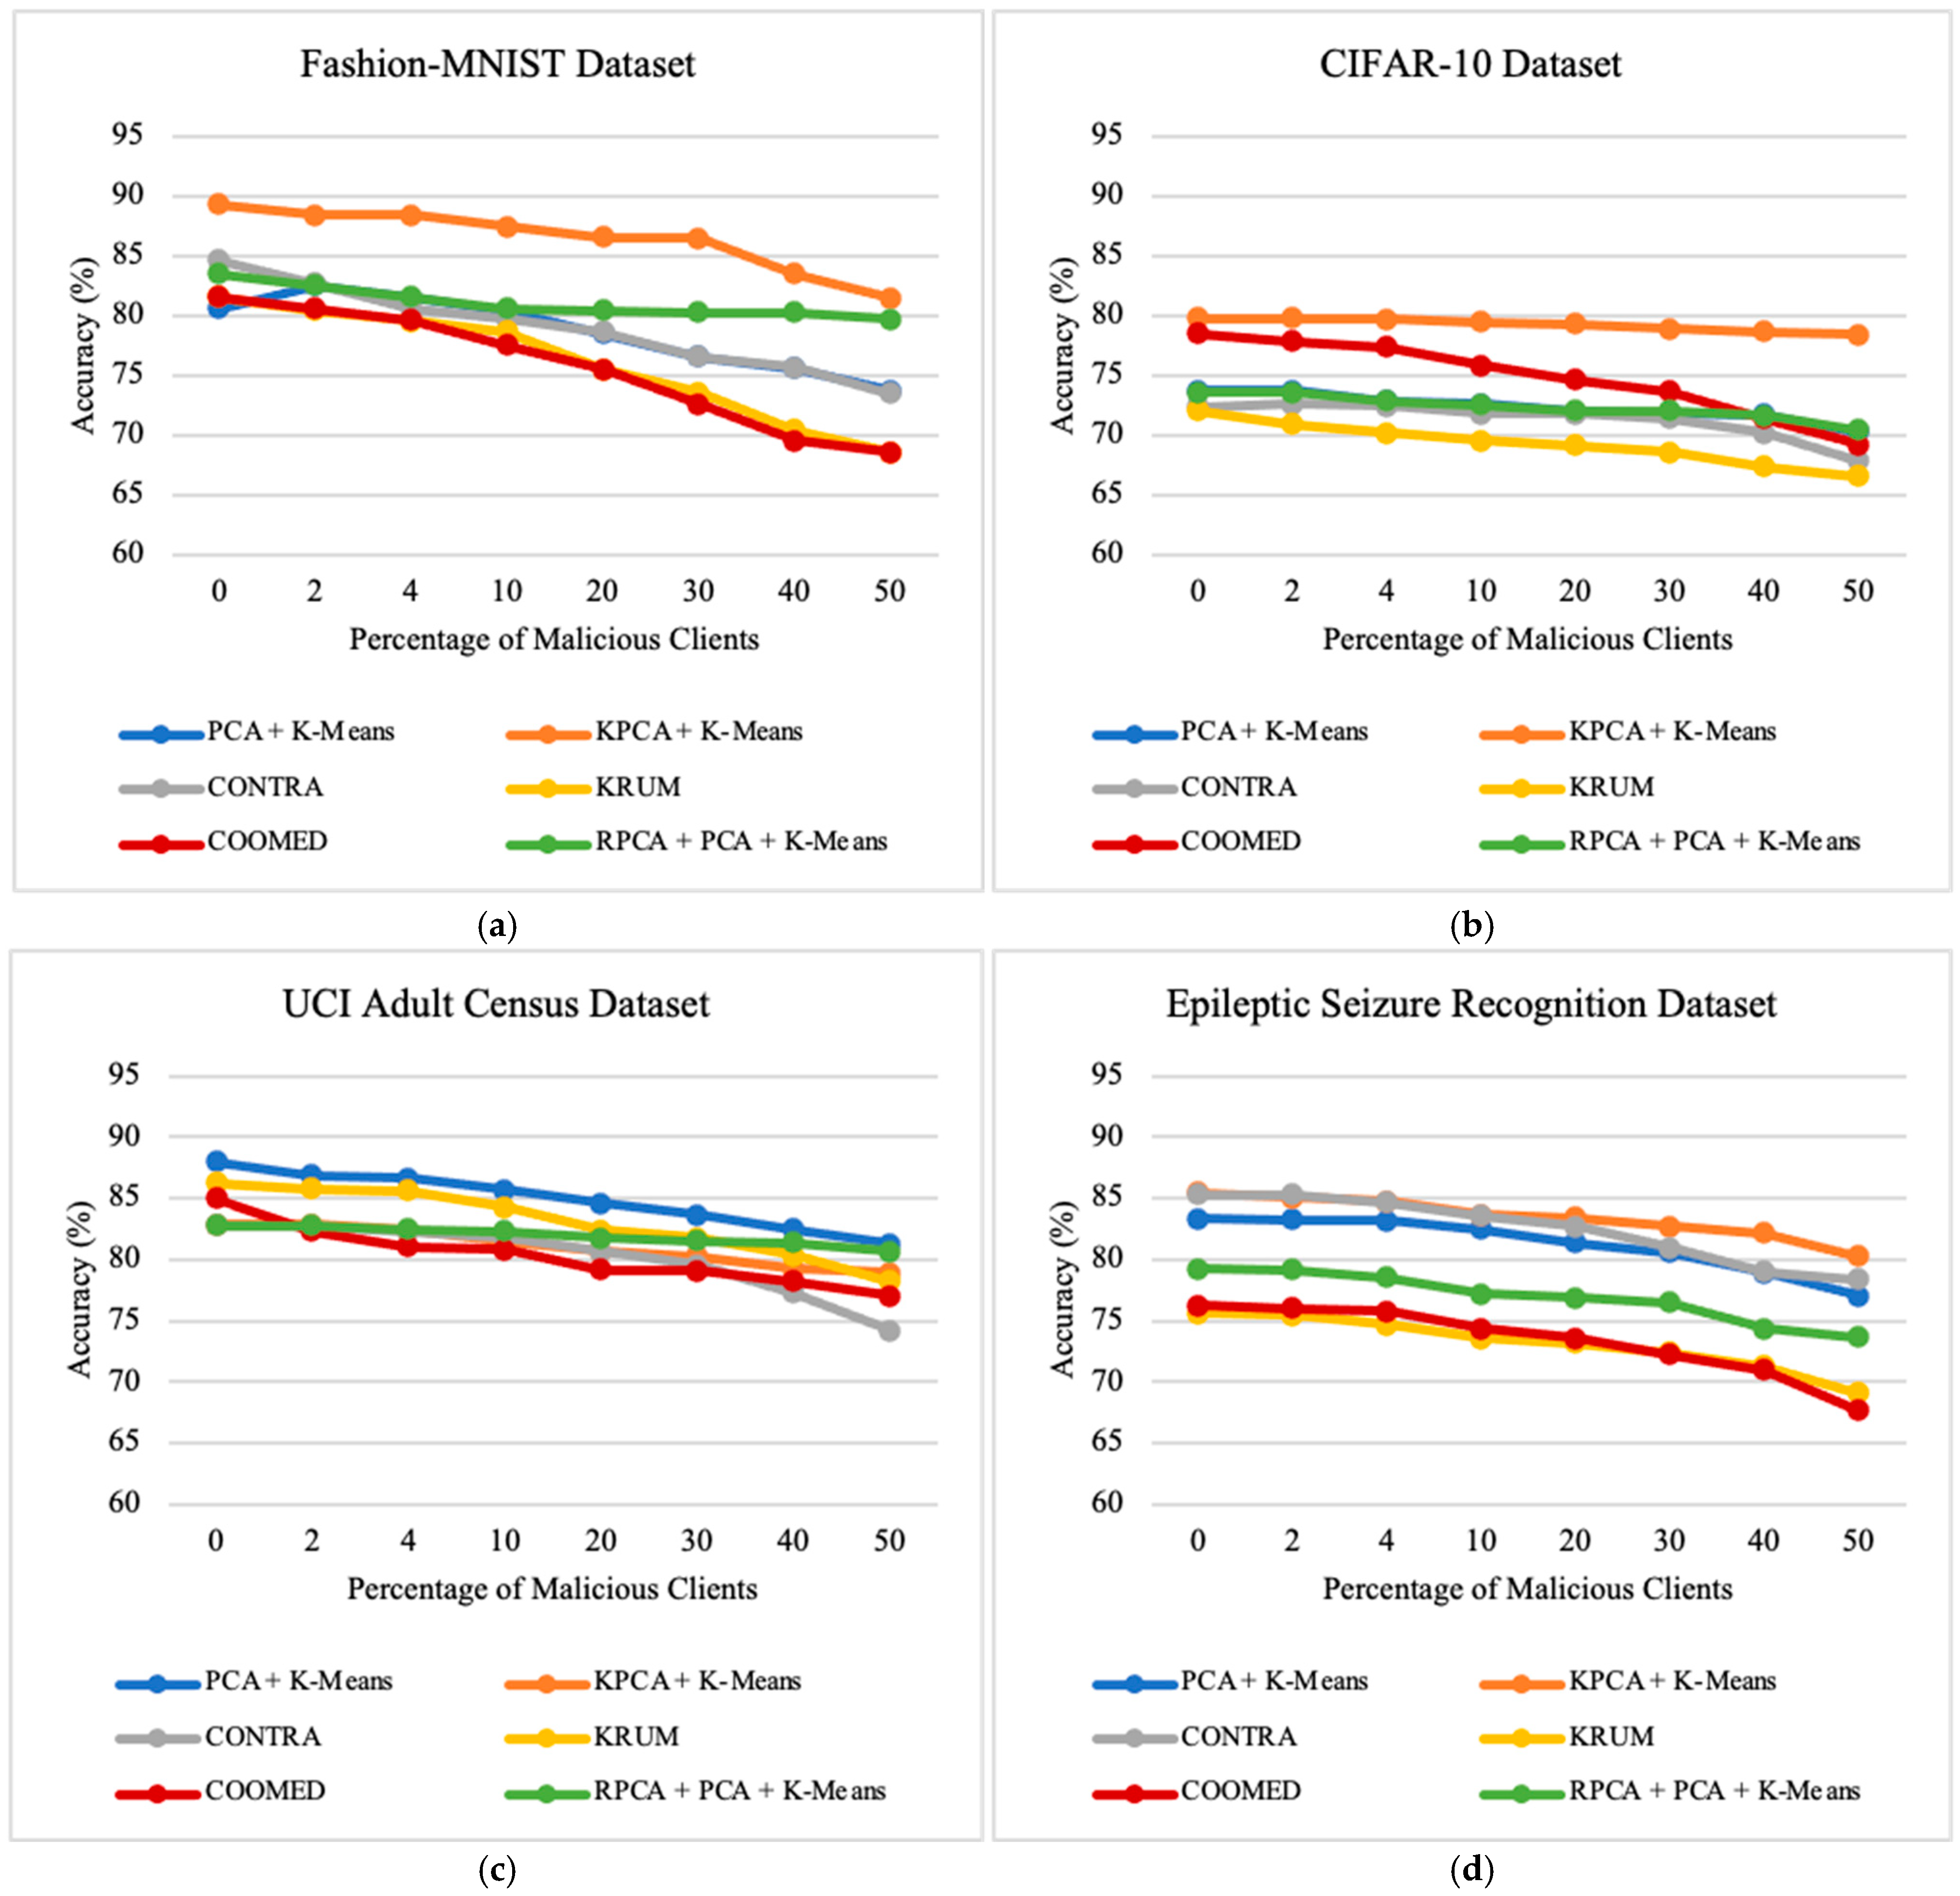
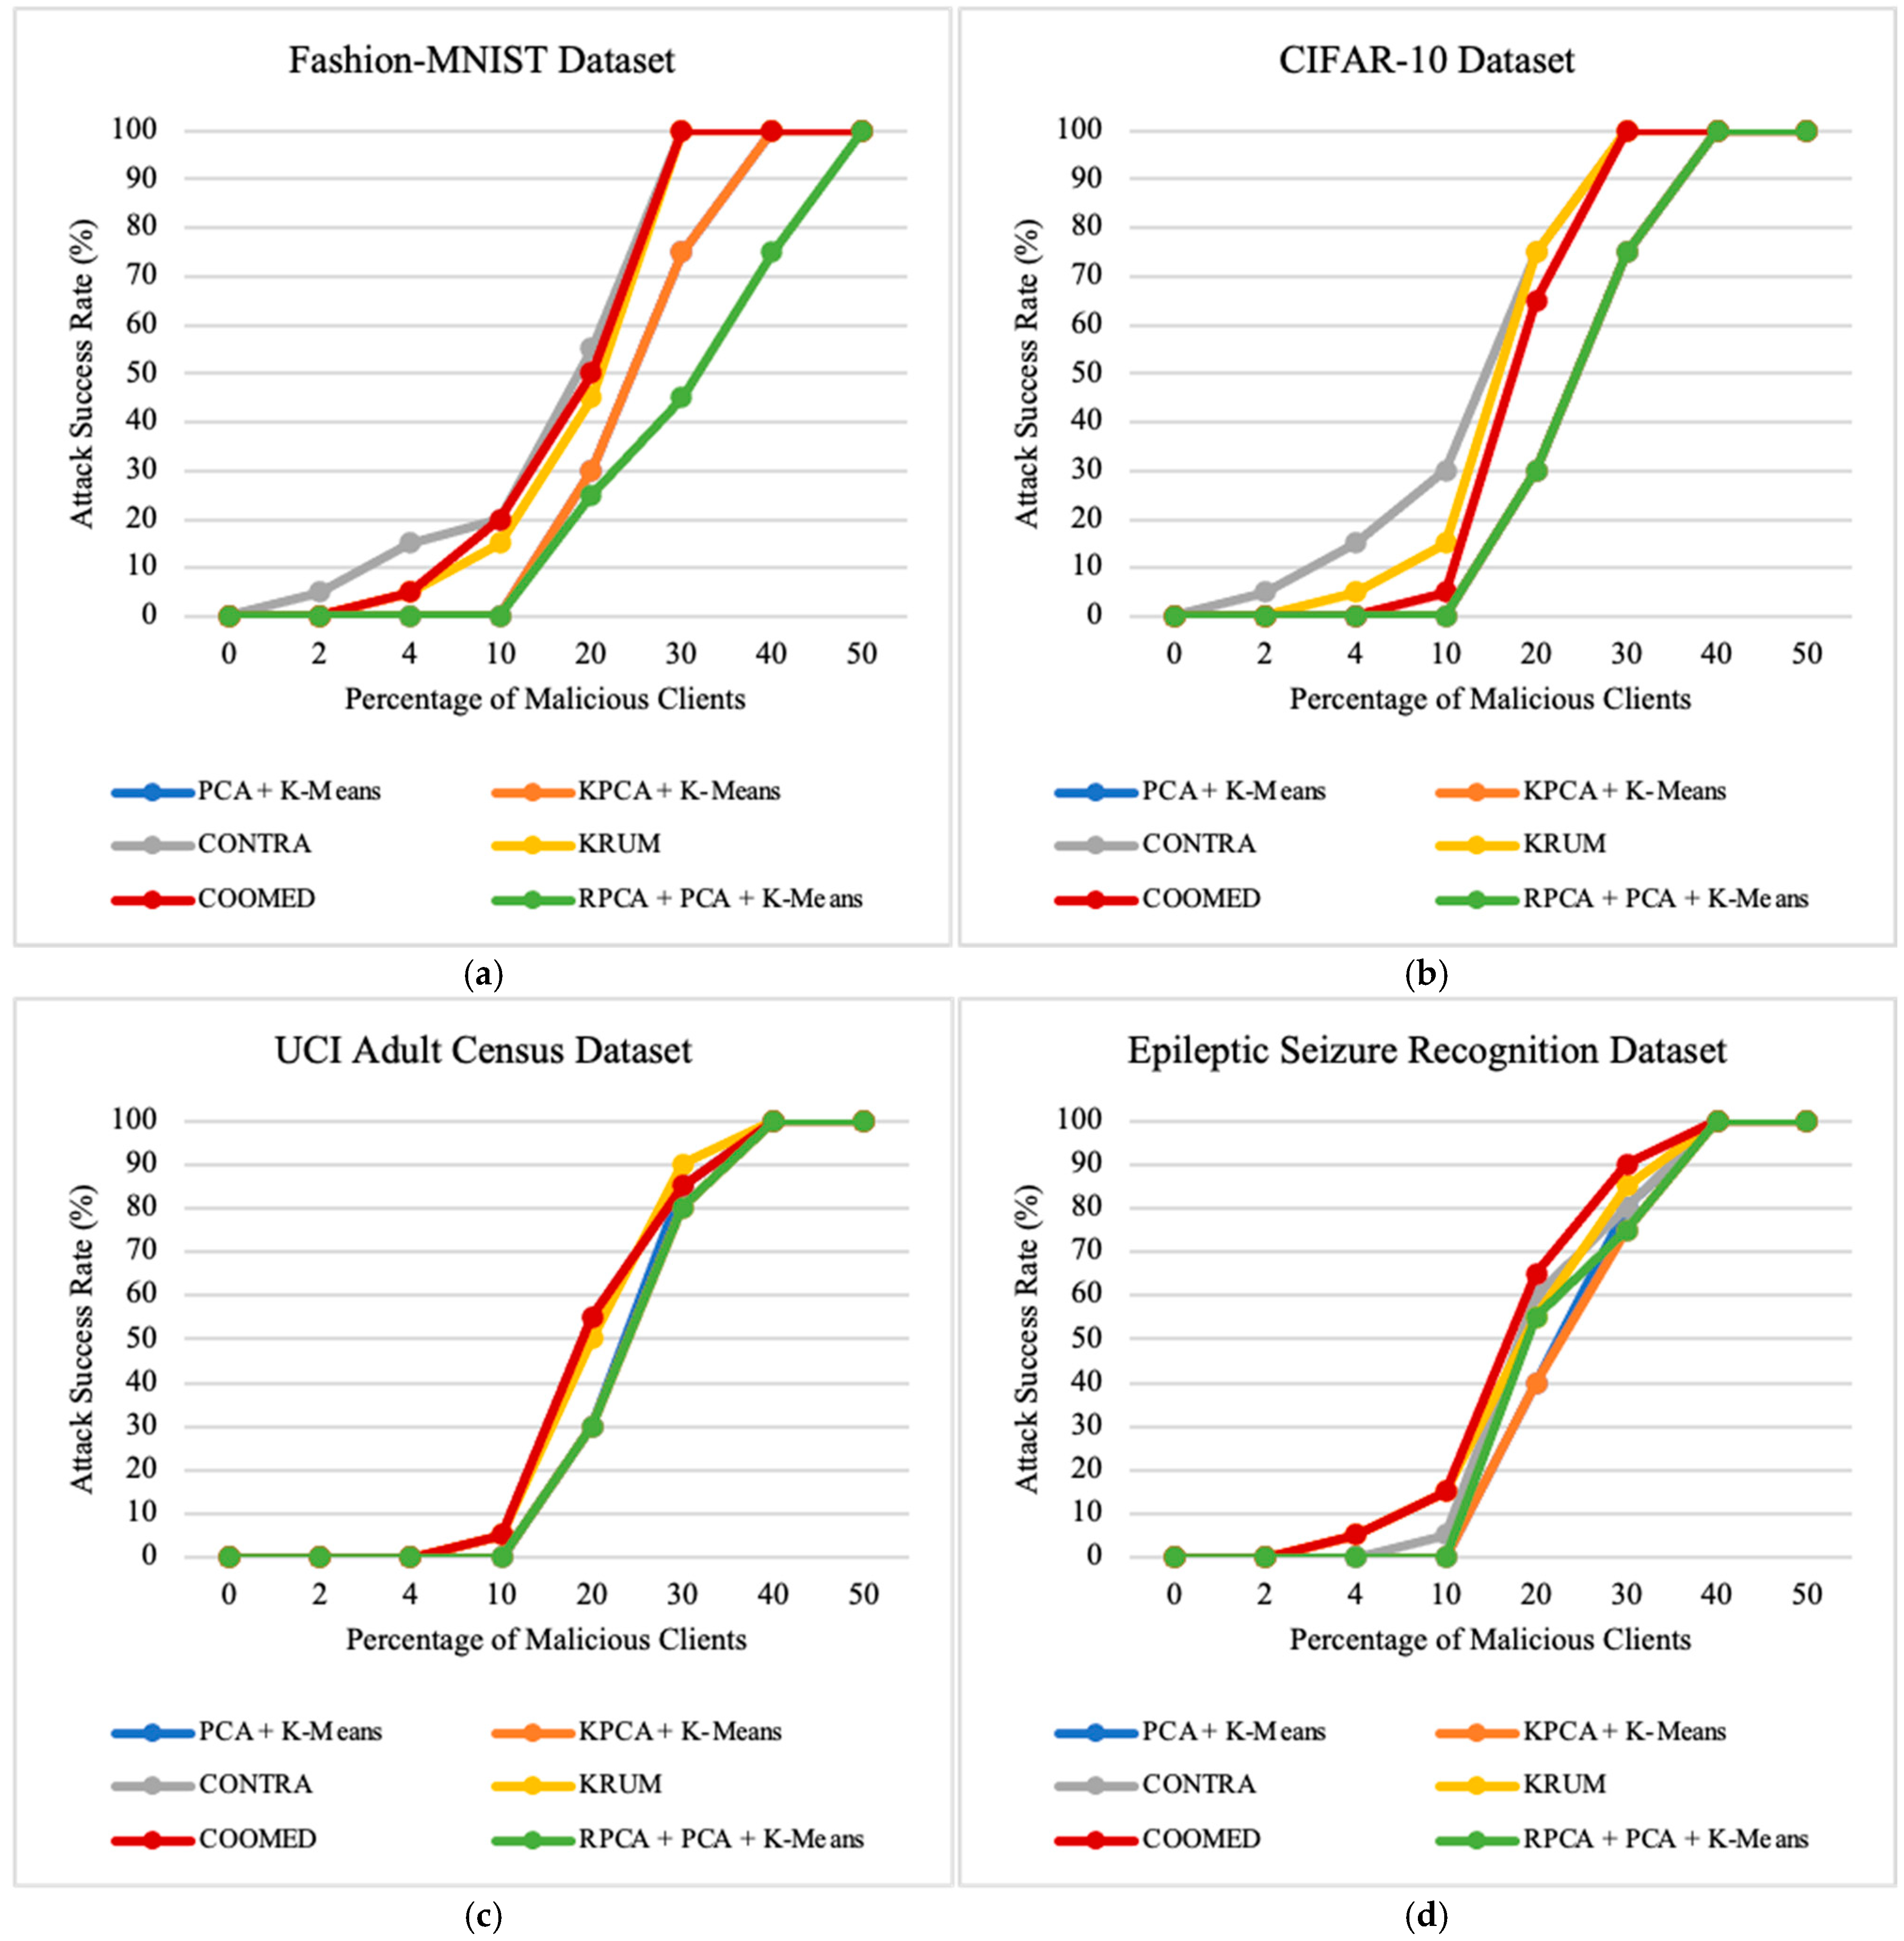
7.4. Impact of the Percentage of Malicious Clients
8. Conclusions and Future Work
Author Contributions
Funding
Institutional Review Board Statement
Informed Consent Statement
Data Availability Statement
Conflicts of Interest
Appendix A


References
- Mammen, P. Federated Learning: Opportunities and Challenges. arXiv 2021, arXiv:2101.0542. [Google Scholar]
- Bagdasaryan, E.; Veit, A.; Hua, Y.; Estrin, D.; Shmatikov, V.; Tech, C. How To Backdoor Federated Learning. In Proceedings of the Twenty Third International Conference on Artificial Intelligence and Statistics, Online, 26–28 August 2020; Machine Learning Research: New York, NY, USA, 2020; Volume 108, pp. 2938–2948. [Google Scholar]
- Bouacida, N.; Mohapatra, P. Vulnerabilities in federated learning. IEEE Access 2021, 9, 63229–63249. [Google Scholar] [CrossRef]
- Kairouz, P.; McMahan, H.B.; Avent, B.; Bellet, A.; Bennis, M.; Bhagoji, A.N.; Bonawitz, K.; Charles, Z.; Cormode, G.; Cummings, R.; et al. Advances and Open Problems in Federated Learning. In Foundations and Trends® in Machine Learning; Now Publishers: Hanover, NH, USA, 2021; Volume 14. [Google Scholar]
- Park, S.; Han, S.; Wu, F.; Kim, S.; Zhu, B.; Xie, X.; Cha, M. Feddefender: Client-side attack-tolerant federated learning. In Proceedings of the 29th ACM SIGKDD Conference on Knowledge Discovery and Data Mining, Long Beach, CA, USA, 6–10 August 2023; pp. 1850–1861. [Google Scholar]
- Tolpegin, V.; Truex, S.; Gursoy, M.E.; Liu, L. Data Poisoning Attacks Against Federated Learning Systems. arXiv 2020. [Google Scholar] [CrossRef]
- Li, D.; Wong, W.E.; Wang, W.; Yao, Y.; Chau, M. Detection and Mitigation of Label-Flipping Attacks in Federated Learning Systems with KPCA and K-Means. In Proceedings of the 2021 8th International Conference on Dependable Systems and Their Applications, DSA, Yinchuan, China, 5–6 August 2021; Institute of Electrical and Electronics Engineers Inc.: Piscataway, NJ, USA, 2021; pp. 551–559. [Google Scholar] [CrossRef]
- Awan, S.; Luo, B.; Li, F. CONTRA: Defending against Poisoning Attacks in Federated Learning. In Proceedings of the European Symposium on Research in Computer Security, Darmstadt, Germany, 4–8 October 2021. [Google Scholar]
- Blanchard, P.; El Mhamdi, E.M.; Guerraoui, R.; Stainer, J. Machine Learning with Adversaries: Byzantine Tolerant Gradient Descent. In Proceedings of the 34th International Conference on Machine Learning (ICML), Sydney, Austrália, 6–11 August 2017. [Google Scholar]
- Yin, D.; Chen, Y.; Ramchandran, K.; Bartlett, P. Byzantine-Robust Distributed Learning: Towards Optimal Statistical Rates. In Proceedings of the 35th International Conference on Machine Learning, Stockholm, Sweden, 10–15 July 2018. [Google Scholar]
- McMahan, H.B.; Moore, E.; Ramge, D.; Hampson, S.; Arcas, B. Communication-Efficient Learning of Deep Networks from Decentralized Data. In Proceedings of the 20th International Conference on Artificial Intelligence and Statistics, Lauderdale, FL, USA, 20–22 April 2017. [Google Scholar]
- Ma, X.; Zhu, J.; Lin, Z.; Chen, S.; Quin, Y. A state-of-the-art survey on solving non-IID data in Federated Learning. Future Gener. Comput. Syst. 2022, 135, 244–258. [Google Scholar] [CrossRef]
- Lo, S.K.; Lu, Q.; Zhu, L.; Paik, H.; Xu, X.; Wang, C. Architectural Patterns for the Design of Federated Learning Systems. arXiv 2021. [Google Scholar] [CrossRef]
- Yang, Q.; Liu, Y.; Chen, T.; Tong, Y. Federated machine learning: Concept and applications. ACM Trans. Intell. Syst. Technol. 2019, 10, 1–19. [Google Scholar] [CrossRef]
- Fung, C.; Yoon, C.J.M.; Beschastnikh, I. Mitigating Sybils in Federated Learning Poisoning. arXiv 2018. [Google Scholar] [CrossRef]
- Bishop, C. Pattern Recognition and Machine Learning; Springer: Berlin/Heidelberg, Germany, 2016; Available online: https://link.springer.com/book/10.1007/978-0-387-45528-0 (accessed on 21 April 2023).
- Bhagoji, A.N.; Chakraborty, S.; Mittal, P.; Calo, S. Analyzing Federated Learning through an Adversarial Lens. In Proceedings of the 36th International Conference on Machine Learning, Long Beach, CA, USA, 9–15 June 2019. [Google Scholar]
- Al Mallah, R.; López, D.; Badu-Marfo, G.; Farooq, B. Untargeted Poisoning Attack Detection in Federated Learning via Behavior AttestationAl. IEEE Access 2023, 11, 125064–125079. [Google Scholar] [CrossRef]
- Shejwalkar, V.; Houmansadr, A. Manipulating the byzantine: Optimizing model poisoning attacks and defenses for federated learning. In Proceedings of the Network and Distributed Systems Security (NDSS) Symposium, Online, 21–25 February 2021; Available online: https://www.ndss-symposium.org/wp-content/uploads/ndss2021_6C-3_24498_paper.pdf (accessed on 14 November 2024).
- Purohit, K.; Das, S.; Bhattacharya, S.; Rana, S. A Data-Driven Defense against Edge-case Model Poisoning Attacks on Federated Learning. arXiv 2024. [Google Scholar] [CrossRef]
- Gong, Z.; Shen, L.; Zhang, Y.; Zhang, L.Y.; Wang, J.; Bai, G. AgrAmplifier: Defending Federated Learning Against Poisoning Attacks Through Local Update Amplification. IEEE Trans. Inf. Forensics Secur. 2023, 19, 1241–1250. [Google Scholar] [CrossRef]
- Huang, L.; Joseph, A.; Nelson, B.; Rubinstein, B.; Tygar, J.D. Adversarial Machine Learning. In Proceedings of the ACM Conference on Computer and Communications Security, Chicago, IL, USA, 17–21 October 2011; pp. 43–58. [Google Scholar]
- Müller, A.C.; Guido, S. Introduction to Machine Learning with Python, 5th ed.; O’Reilly Media, Inc.: Sebastopol, CA, USA, 2016. [Google Scholar]
- Candès, E.J.; Li, X.; Ma, Y.; Wright, J. Robust principal component analysis? J. ACM 2011, 58, 1–37. [Google Scholar] [CrossRef]
- Brunton, S.L.; Kutz, J.N. Data Driven Science & Engineering Machine Learning, Dynamical Systems, and Control; Cambridge University Press: Cambridge, UK, 2019. [Google Scholar]
- GitHub. Fashion-Mnist. Fashion-Mnist Dataset. 2017. Available online: https://github.com/zalandoresearch/fashion-mnist (accessed on 26 June 2023).
- Kaggle. CIFAR-10—Object Recognition in Images. 2015. Available online: https://www.kaggle.com/c/cifar-10 (accessed on 26 June 2023).
- UCI—Machine Learning Repository. Adult. 1996. Available online: https://archive.ics.uci.edu/dataset/2/adult (accessed on 13 September 2023).
- Kanggle. Epileptic Seizure Recognition. 2019. Available online: https://www.kaggle.com/code/maximkumundzhiev/epileptic-seizure-recognition (accessed on 14 September 2023).


| Previous Studies | Dataset | IID | Number of Clients | Malicious Clients | Accuracy | Precision | Recall | F1-Score | ASR | MC |
|---|---|---|---|---|---|---|---|---|---|---|
| Awan et al. [8] | Fashion-MNIST | X | X | X | X | |||||
| CIFAR-10 | X | X | X | X | ||||||
| Li et al. [7] | Fashion-MNIST | X | X | X | X | |||||
| CIFAR-10 | X | X | X | X | ||||||
| Tolpegin et al. [6] | Fashion-MNIST | X | X | X | X | X | ||||
| CIFAR-10 | X | X | X | X | X |
| Dynamic Parameter | Range Values | Default Value |
|---|---|---|
| Percentage of Independent and Identically Distributed (IID) Data | 0 0.2 0.4 0.6 0.8 1 | 0.4 |
| Number of Clients | 20 40 60 80 100 | 100 |
| Percentage of Malicious Clients | 0% 2% 4% 10% 20% 30% 40% 50% | 10% of the clients |
| Layer Type | Size |
|---|---|
| Conv2D + ReLU activation | 64 filters of size 5 × 5 |
| Additional Conv2D + ReLU activation | 64 filters of size 5 × 5 |
| Dropout Layer | Randomly deactivates 25% of neurons |
| Dense Layer + ReLU activation | 128 fully connected neurons |
| Additional Dropout Layer | Randomly deactivates 50% of neurons |
| Output Dense Layer |
| Layer Type | Size |
|---|---|
| Conv2D + Stride of 2 + Padding | 64 filters of size 5 × 5 |
| Batch Normalization Layer | Normalizes the activations of the previous layer |
| Leaky ReLU Activation Layer | alpha = 0.2 |
| Additional Conv2D + Stride of 2 + Padding | |
| ReLU Activation Layer | Converts the 3D output to a 1D vector for the fully connected layer |
| Flatten Layer | |
| Output Dense Layer | Fully connected layer with 10 neurons |
| Layer Type | Size |
|---|---|
| Two Densely Connected Layers + ReLU activation | 256 neurons in each layer Dropout: 0.5 (randomly deactivates 50% of neurons during training for regularization |
| Layer Type | Size |
|---|---|
| Two Densely Connected Layers + ReLU activation | 128 neurons in each layer Dropout: 0.5 (randomly deactivates 50% of neurons during training for regularization |
| Fashion-MNIST Dataset | Accuracy | Precision | Recall | F1-Score | Attack Success Rate | Malicious Confidence | Execution Time (min) |
|---|---|---|---|---|---|---|---|
| PCA + K-means | 79.66 | 79.48 | 97.28 | 87.51 | 0 | 0 | 90 |
| KPCA + K-means | 87.44 | 79.43 | 97.36 | 87.44 | 0 | 0 | 93 |
| CONTRA | 80.31 | 80.64 | 97.46 | 88.49 | 20 | 11.12 | 84 |
| KRUM | 78.61 | 71.45 | 95.47 | 81.53 | 15 | 8.29 | 89 |
| COOMED | 77.50 | 85.54 | 97.51 | 90.69 | 20 | 17.44 | 95 |
| RPCA + PCA + K-Means | 80.52 | 80.54 | 97.45 | 88.43 | 0 | 0 | 96 |
| Execution Time (in min) | PCA + K-Means | KPCA + K-Means | CONTRA | KRUM | COOMED | RPCA + PCA + K-Means |
|---|---|---|---|---|---|---|
| Fashion-MNIST Dataset | 90 | 93 | 84 | 89 | 95 | 96 |
| CIFAR-10 Dataset | 96 | 102 | 87 | 89 | 93 | 105 |
| UCI Adult Census Dataset | 4 | 4 | 4 | 4 | 4 | 4 |
| Epileptic Seizure Recognition Dataset | 106 | 108 | 106 | 102 | 99 | 113 |
| Execution Time (in min) | PCA + K-Means | KPCA + K-Means | CONTRA | KRUM | COOMED | RPCA + PCA + K-Means |
|---|---|---|---|---|---|---|
| Fashion-MNIST Dataset | 61 | 62 | 58 | 61 | 55 | 62 |
| CIFAR-10 Dataset | 62 | 73 | 60 | 57 | 54 | 78 |
| UCI Adult Census Dataset | 2 | 2 | 2 | 2 | 2 | 2 |
| Epileptic Seizure Recognition Dataset | 77 | 79 | 73 | 74 | 69 | 74 |
| Execution Time (in min) | PCA + K-Means | KPCA + K-Means | CONTRA | KRUM | COOMED | RPCA + PCA + K-Means |
|---|---|---|---|---|---|---|
| Fashion–MNIST Dataset | 91 | 101 | 95 | 90 | 89 | 109 |
| CIFAR-10 Dataset | 97 | 111 | 96 | 94 | 100 | 124 |
| UCI Adult Census Dataset | 4 | 5 | 4 | 4 | 4 | 5 |
| Epileptic Seizure Recognition Dataset | 108 | 119 | 118 | 106 | 105 | 126 |
Disclaimer/Publisher’s Note: The statements, opinions and data contained in all publications are solely those of the individual author(s) and contributor(s) and not of MDPI and/or the editor(s). MDPI and/or the editor(s) disclaim responsibility for any injury to people or property resulting from any ideas, methods, instructions or products referred to in the content. |
© 2024 by the authors. Licensee MDPI, Basel, Switzerland. This article is an open access article distributed under the terms and conditions of the Creative Commons Attribution (CC BY) license (https://creativecommons.org/licenses/by/4.0/).
Share and Cite
Carvalho, I.; Huff, K.; Gruenwald, L.; Bernardino, J. Federated Learning: A Comparative Study of Defenses Against Poisoning Attacks. Appl. Sci. 2024, 14, 10706. https://doi.org/10.3390/app142210706
Carvalho I, Huff K, Gruenwald L, Bernardino J. Federated Learning: A Comparative Study of Defenses Against Poisoning Attacks. Applied Sciences. 2024; 14(22):10706. https://doi.org/10.3390/app142210706
Chicago/Turabian StyleCarvalho, Inês, Kenton Huff, Le Gruenwald, and Jorge Bernardino. 2024. "Federated Learning: A Comparative Study of Defenses Against Poisoning Attacks" Applied Sciences 14, no. 22: 10706. https://doi.org/10.3390/app142210706
APA StyleCarvalho, I., Huff, K., Gruenwald, L., & Bernardino, J. (2024). Federated Learning: A Comparative Study of Defenses Against Poisoning Attacks. Applied Sciences, 14(22), 10706. https://doi.org/10.3390/app142210706