

How Can Artificial Intelligence Identify Knee Osteoarthritis from Radiographic Images with Satisfactory Accuracy?: A Literature Review for 2018–2024

Abstract
1. Introduction
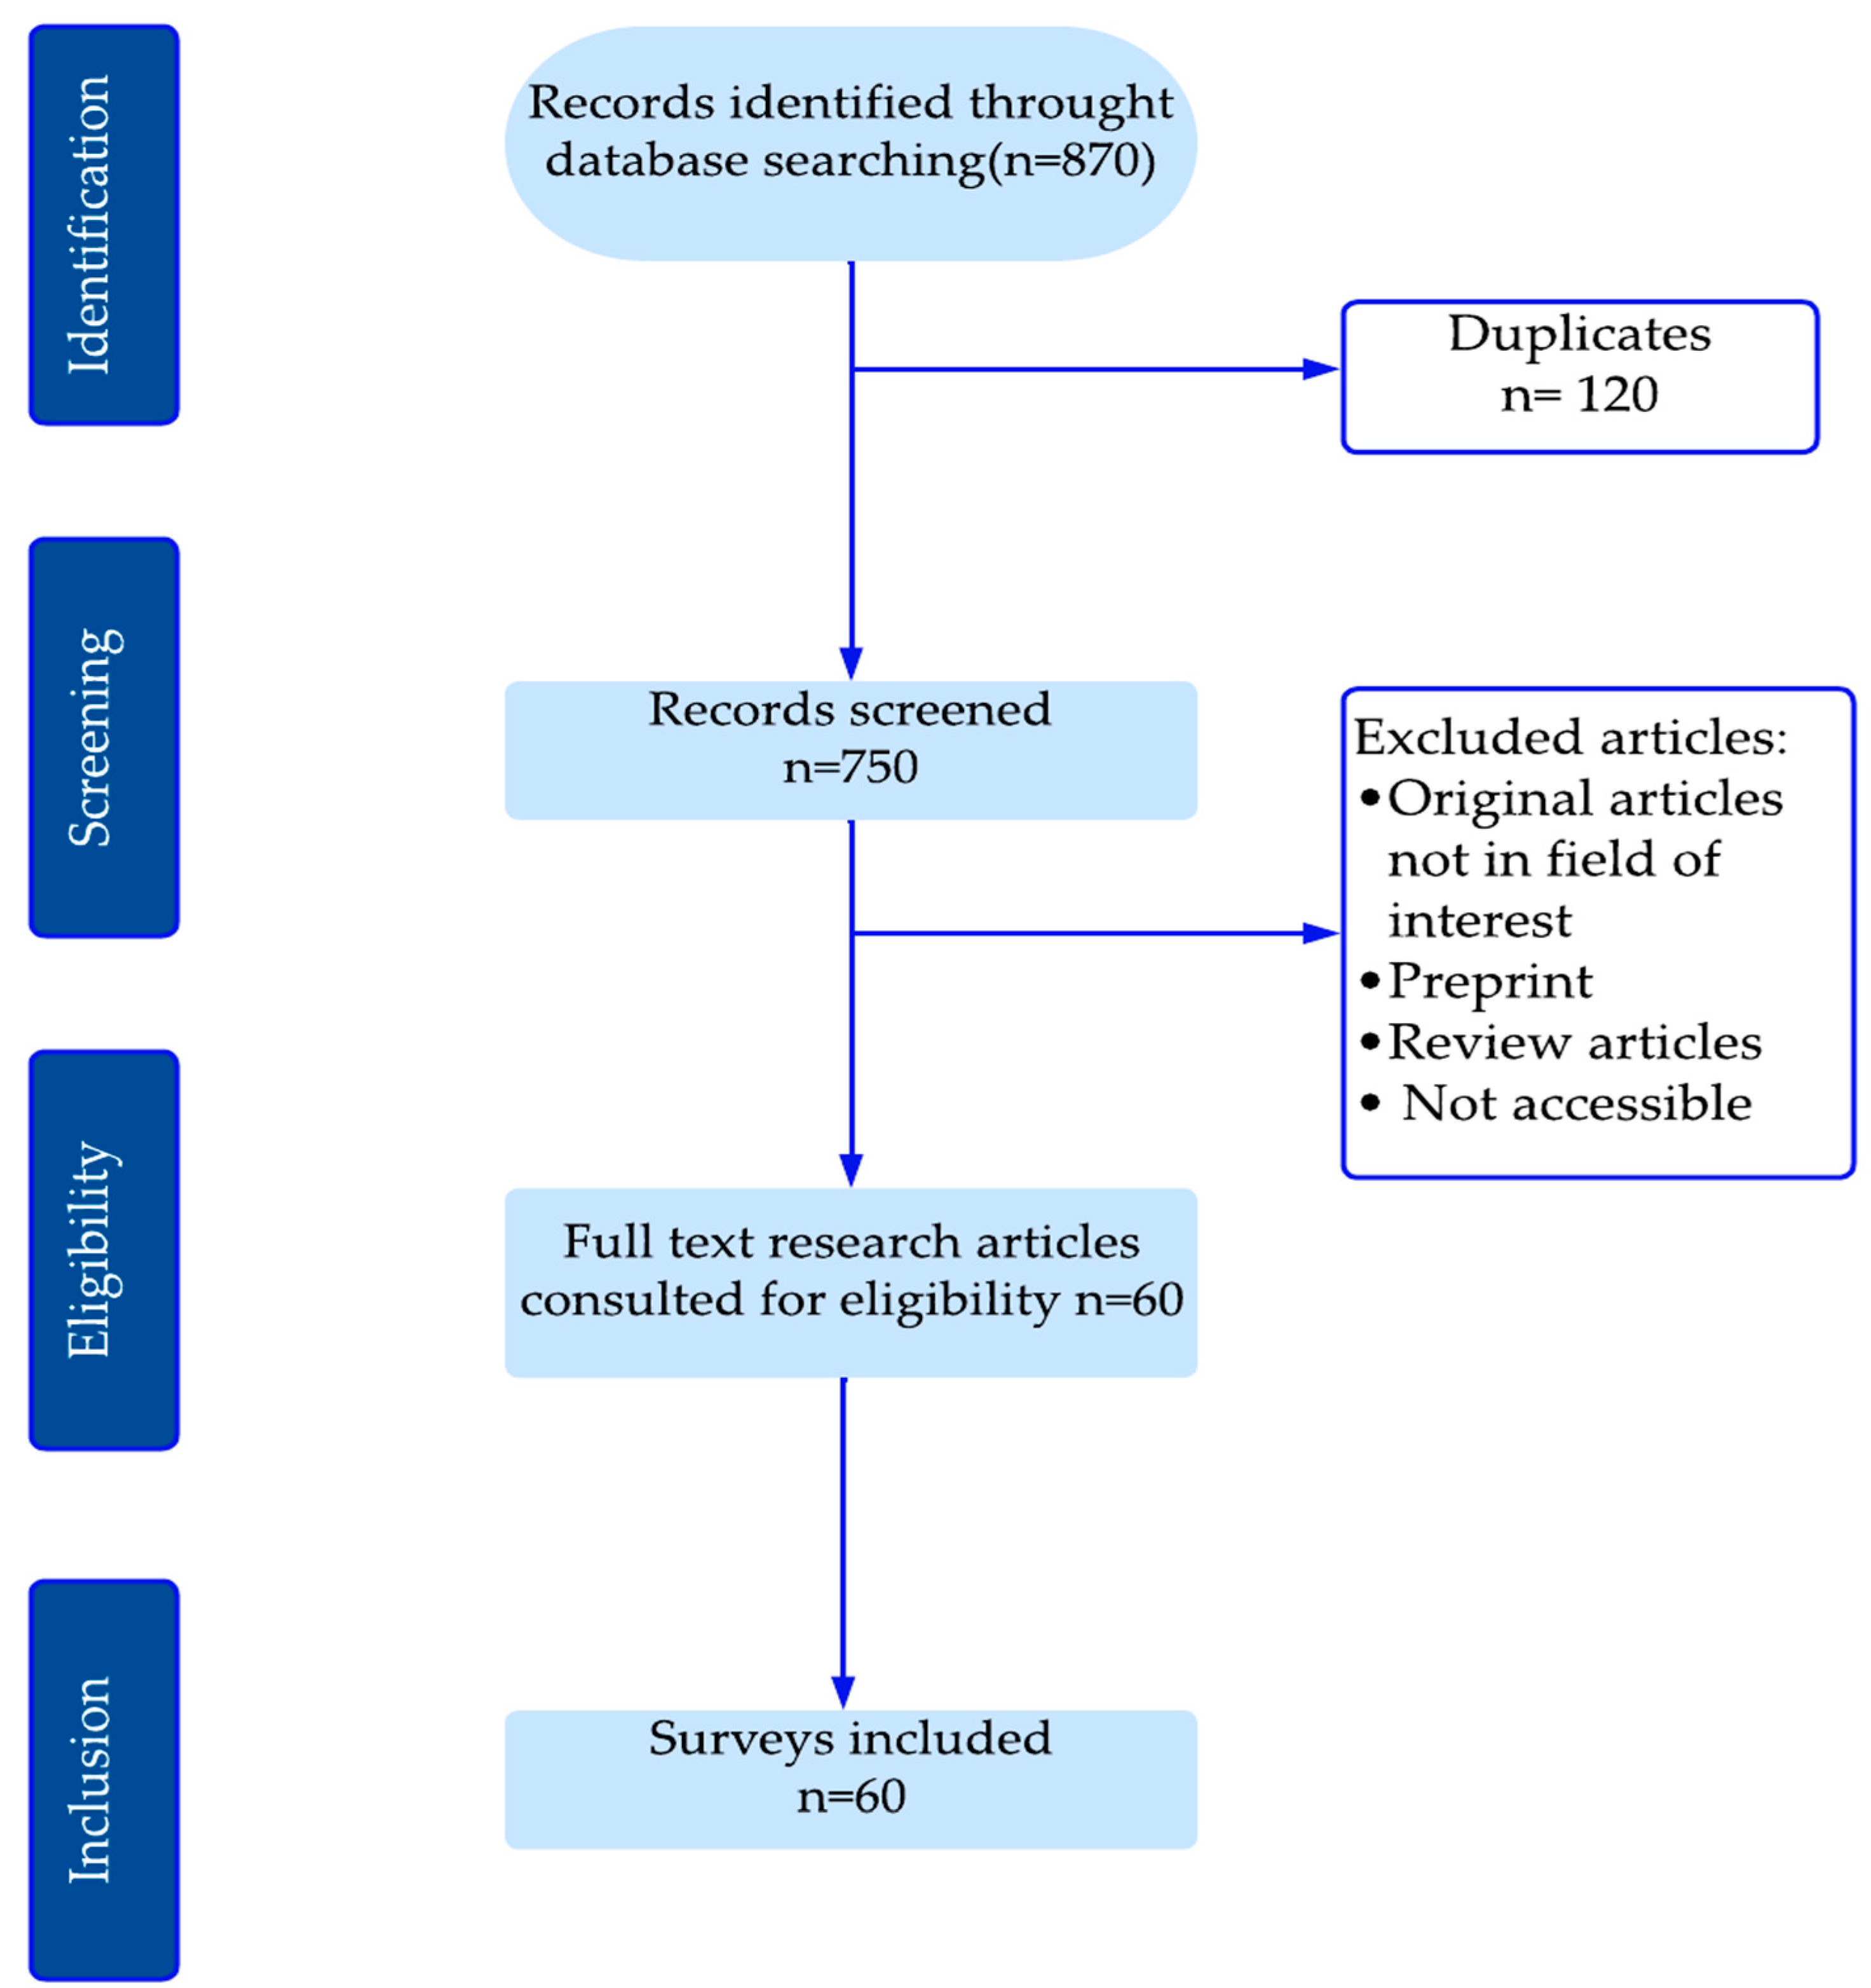
2. Methods
- For RQ1 “What are the principal models currently employed to design diagnostic models for knee osteoarthritis based on radiographic images?”, data from eligible publications include (1) research topic, (2) materials and methods used by the authors, and (3) metric evaluation.
- For RQ2 “What are the potential factors for enhancing the accuracy of traditional machine learning (ML) and deep learning (DL) models developed in recently published research articles?”: (1) Textual descriptions (terms in the full text of the publication) highlighting the draft choices made by the authors.
- For RQ3, “What are the principal challenges and prospective avenues for further research?”: (1) the novelty of the research, (2) the experiments that yielded the best and worst results for each approach, and (3) limitations and discussion.
3. Results
3.1. Data Availability
3.2. ROI Detection/Segmentation
3.3. Knee Osteoarthritis Detection
3.3.1. Deep Learning Models
3.3.2. Hybrid Models
3.3.3. Comparative Analysis of Reviewed Methods and Techniques
- A.
- In the initial phase of the knee osteoarthritis identification process, studies employing methodologies that did not require ROI localization utilized databases of readily available images of individual knees as input to the proposed model. Furthermore, in studies based on ROI detection, manual selection or additional deep learning models for localization are employed before the classification process. Both types of studies, with and without ROI detection, employ pre-processing of the input images with resizing according to the requirements of the models used.
- -
- As demonstrated in Table 6, the methods that employed ROI detection exhibited a slight advantage over the other methods, with the highest accuracy observed in [43] at 99.81%. In this study, the edges of the knee bone are first detected and then filtered to suppress noise without losing essential image information. In the second step, the region of interest (ROI) was identified based on pixel density. Finally, the traditional machine learning K-nearest neighbor (KNN) classifier was constructed to classify knee arthrosis.
- -
- In [44], the manual selection of the ROI before the classification of knee osteoarthritis did not yield satisfactory results. In this approach, the lowest accuracy among studies employing ROI detection was obtained with an average multi-class accuracy of 61.71%.
- -
- A brief analysis of Table 6 allows us to conclude that approaches that did not employ ROI detection achieved performances comparable to those obtained with methods developed with ROI localization. The best performances were obtained in [28] with a weighted kappa coefficient of 0.99 and MAE of 0.0256 using a set of deep learning models. The approach used in [45] exhibited the lowest performance, with a balanced accuracy of 64.13 ± 0.88. This approach employed a Siamese network and a semi-supervised learning technique.
- B.
- In the second phase of feature extraction and classification of knee OA, the most successful techniques were based on additive methodologies for extraction, including cartilage thickness estimation in [6] and Hu invariant moments used in [43].
- -
- -
- Table 6 reveals that the common methodologies used in the different approaches are the use of a multitude of models, with the selection of the optimal model or the adoption of the result obtained by the ensemble of models. The DenseNet and ResNet deep learning models are the most commonly adopted in the proposed approaches, their performance being compared with that of other models. However, they are not the optimal candidates for this purpose. The DenseNet model achieved the best performance in the study [34], using DenseNet169, with an accuracy of 95.93%. In contrast, the ResNet model demonstrated the best performance in [47], using ResNet152V2, with an accuracy of 95.88%.
- -

| References | Methodology | Architecture | With/Wit-Hout ROI | Classes | Dataset | Sample Size | Metric |
|---|---|---|---|---|---|---|---|
| Gornale S.S. et al. [43] | ▪ Multi-class classification using traditional ML models and Hu’s invariant moments. | ◦ KNN and Decision Tree | With | 5 | [6] | 2000 | Accuracy (KNN/DT) = 99.80%/95.75 (Medical expert-I) and 98.65%/95.4 (Medical expert-II) |
| Fatema et al. [46] | ▪ Multi-class classification using optimal features and traditional ML models. | ◦ DT, RF, KNN, GB, XGB | With | 5 | Mendeley and Kaggle | 8660 | Best model (XGB): precision: 99.43% |
| Tariq et al. [28] | ▪ Multi-class classification using an ensemble of deep learning models. | ◦ DenseNet161, DenseNet121, ResNet34,VGG19. | Without | 5 | OAI | 9786 | Best model (Ensemble): Weighted kappa = 0.99, MAE = 0.0256 |
| Raza A. et al. [48] | ▪ Multi-class classification using traditional ML models and 10-fold cross-validation. | ◦ KNN, SVM, Gaussian Naive Bayes, Decision Tree, Random Forest, and XGBoost | Without | 4 | Mendeley | 5778 | Best model (XGBoost and ensemble model) Accuracy: 98.90% |
| Gornale S.S. et al. [49] | ▪ Multi-class classification using DL model and Gradient conjugate. | ◦ Artificial neural networks (ANN) + Gradient conjugate/Gradient descent/Quasi-Newton | With | 5 | [6] | 1650 | Accuracy: 98.7% (surgeon-1), 98.2% (surgeon-2) |
| Kalpana V et al. [47] | ▪ Multi-class classification using DL models. | ◦ DenseNet, EfficientNetB7, Inception, MobileNet, NASNet, ResNet152V2, VGG19, Xception | Without | 5 | Local dataset | 8250 | Best accuracy (MobileNet): 98.36% |
| Touahema S. et al. [50] | ▪ MeedKnee: Multi-class classification using DL model. | ◦ Xception | 5 | Without | OAI | 5000 | Accuracy: 97.20% |
| Wani and Saini [22] | ▪ Multi-class classification using DL models and adjustable ordinal loss | ◦ VGG, DenseNet, ResNet, and Inception V3 | 5 | With | OAI | 1656 | Best model (VGG19): Accuracy = 96.7%, MAE = 0.344 |
| Salama et al. [51] | ▪ Multi-class classification using DL model and JSW annotation. | ◦ U-Net | 5 | With | OAI | 100 | Accuracy:96.3% |
| El-Ghany et al. [34] | ▪ Multi-classification and binary classifications using DL models. | ◦ DenseNet169, Xception, ResNet50, DenseNet121, InceptionResNetV2, InceptionV3 | 2/3 | Without | OAI | 8891/6224 | Best model (DenseNet169) Accuracy: 95.93% (3-class), 93.78 (2-class) |
| Anitha et al. [52] | ▪ Multi-class classification and joint space detection using DL model. | ◦ RCNN | 5 | With | Kaggle | 167 | Accuracy: 95% |
| Al-rimy et al. [33] | ▪ Binary and Multi-class classification using DL model and the gradual cross-entropy (GCE) loss. | ◦ DenseNet169 | 2/5 | Without | OAI | 4982 | Accuracy: 0.9408 (2-class), 0.9179 (3-class), 0.6274 (5-class) |
| Ruikar et al. [53] | ▪ OACnet: Multi-class classification using DL model. | ◦ Deep neural network and handcrafted feature engineering (joint space narrowing, bone spur, sclerosis, and deformation) | 5 | With | OAI | 9492 | Accuracy (DNN-OCnet) = 83.74%, accuracy (DNN-Ocnet + Handcrafted features) = 92.7% |
| Olsson et al. [8] | ▪ Multi-class classification using DL model. | ◦ ResNet35 | Without | 5 | Local dataset | 6403 | AUC > 0.80 for the 5 grades KL—Sensitivity > 92% except for grade KL4 with 84% and a specificity between 61% and 88% |
| Yoon et al. [24] | ▪ MediAI-OA: Binary, Multi-classification suing JSN Rate assessment. | ◦ HRNet (JSN), NASNet | With | 2/5 | OAI | 45,003 | Accuracy: 92% (2-class), 83% (4-class) |
| Ahmed and Mohammed [54] | ▪ Multi-class classification using Convolutional Neural Networks (CNNs). | ◦ VGG16, VGG19, ResNet50 | Without | 5 | Mendeley | 1650 | Best validation accuracy ResNet50: 91.51% |
| M. and Goswami. [55] | ▪ Multi-class classification using CNN model and image sharpening process. | ◦ Inception-Resnet-v2 | With | 5 | OAI | 8260 | Accuracy: 91.03% |
| Yunus et al. [17] | ▪Multi-class classification using a hybrid model and features extraction with LPB. | ◦ Darknet53, Alexnet, ROI localization: YOLOv2 ONNX, Final classification: SVM, KNN | With | 5 | OAI | 3795 | Accuracy = 90.6%, Precision = 85%, Sensitivity = 91% |
| Nguyen Huu et al. [20] | ▪ Binary classification using the CNN model. | ◦ VGG16 | With | 2 | OAI | 2874 | Accuracy = 89% |
| Yong et al. [56] | ▪ Multi-class classification using DL model and ordinal regression. | ◦ Ordinal regression module (ORM) applied on VGG, ResNet, DenseNet, ResNext, GoogLeNet, and Mobilenet. | Without | 5 | OAI | 4130 | Best model (DenseNet161): ACCMacro = 88.09% |
| Abdo et al. [29] | ▪ Binary and multi-class classification using DL model. | ◦ DNN | Without | 2/3 | OAI/[6] | 9737/1650 | 3D-CNN (binary classification) (OAI-I/OAI-II): Accuracy = 85.50%/83.% |
| Yildirim and Mutlu [57] | ▪ Multi-class classification using DL model and textural-based feature extraction. | ◦ Darknet53 combined with HOG and LBP | Without | 5 | Kaggle | 1650 | Accuracy: 83.6% |
| Bhat and Suhasini [58] | ▪ Multi-class classification using a hybrid model. | ◦FFNN), Combination of Deep Belief Networks (DBN), RBM (Restricted Boltzmann Machine), and Multi SVM. | With | 5 | Local dataset | 126 | Average precision: FFNN: 76%, DBN-RBM: 83%, Multi SVM: 74.67% |
| Wang Yu et al. [21] | ▪ Multi-class classification based on a two-step classification strategy with DL models and High-pass filter. | ◦ VGG, ResNet-50 | With | 5 | OAI | 8892 | Average accuracy: 81.41% |
| Bayramoglu et al. [15] | ▪ Binary classification (OA, no OA) using traditional ML model and texture descriptors. | ◦ Logistic Regression combined with texture descriptors: FD, Shannon Entropy, Gabbor, Haralik, Ondelette, Tamura, and Local Binary Pattern (LBP) | With | 2 | OAI/MOST | 9012/3644 | AUC of 0.840 (OA: 0, 825, no OA: 0.852) AP = 0.804 (0.786, 0.820). |
| Riad et al. [31] | ▪ Binary classification using traditional ML model and texture analysis approach. | ◦ KNN, SVM, Radial Basis Function (RBF) kernels | With | 2 | OAI | 688 | Accuracy 80.38% |
| Bonakdari et al. [59] | ▪ KOA structural progressors using a traditional ML model combined with gender, serum biomarkers, age, BMI, and inflammatory factors. | ◦ KNN, Random Forest, Decision Tree, Extreme Learning Machine, and SVM. | Without | 2 | OAI/Napro-xen cohort | 677/44 | Accuracy: >80% using SVM |
| Norman et al. [26] | ▪ Multi-class classification using DL model and demographic variables. | ◦ DenseNet after 15 epochs (DN15) and DenseNet with demographic input vector after 8 epochs: age, sex, and race (DenseNet-DEM-8) | With | 4 | OAI | 39,593 | Sensitivity/Specificity: No OA, Mild OA, Moderate OA, Severe OA: 83.7%/86.1%, 70.2%/83.8%, 68.9%/97.1%, and 86.0%/99.1%, respectively. |
| Pi et al. [60] | ▪ Multi-class classification using an ensemble of DL models and mix voting algorithm. | ◦ DenseNet-161, EfficienNet-b5, EfficienNet-V2-s, RegNet-Y-8GF, ResNet-101, ResNex, WideResNet-50-2, ShuffleNet-V2- × 2-0 | Without | 5 | OAI | 8260 | Accuracy: 76.93% |
| Kwon et al. [7] | ▪ Multi-class classification using DL model and gait analysis data. | ◦ Inception-ResNet-v2 using gait analysis for features extraction with NCA, support vector machine (SVM) classifier, and cubic kernel function. | Without | 5 | Local dataset | 215 | Sensitivity = 0.70, precision = 0.76, F1-score = 0.71 |
| Wahyuningrum et al. [3] | ▪ Multi-class classification using DL model and LSTM. | ◦VGGNet, ResNet, DenseNet combined with LSTM | With | 5 | OAI | 5148 | Average accuracy (VGG16-LSTM) = 75.28% |
| Nguyen et al. [13] | ▪ Binary classification using deep supervised and semi-supervised learning. | ◦ Deep Siamese Neural Network ResNet34 | With | 2 | OAI | 39,902 | Best result (BA): Semixup (SSL): 71.0 ± 0.8, SL without semixup: 70.9 ± 0.8%. |
| Wang Yifan et al. [1] | ▪ Multi-class classification using a novel learning scheme, Estimating Label Confidence, and hybrid loss function. | ◦ ResNet34 and DenseNet121 | With | 5 | OAI | 8302 | Mean accuracy (DenseNet121\ResNet34) = 70.13%/68.32%. |
| Tiulpin et al. [27] | ▪KOA prediction and progression using traditional ML model and clinical data. | ◦ Se-resnext101 32 × 4d/Se-resnet50/Inceptionv4. Final classification with GBM. | With | 3 | OAI/MOST | 4928/3918 | AP (CNN + clinical data) = 70%, Ap (se-resnext50 32 × 4 d) alone = 63%, and 68% when combined with clinical data |
| Hu et al. [61] | ▪ Predicting KOA longitudinal progression during 4 years using adversarial evolving neural. | ◦ ResNet18, VGG19/ResNet50/Vit | Without | 5 | OAI | 3294 | Best accuracy: A-ENN(VGG19): 62.7% and 64.6%, 63.9%, 63.2%, 61.8%, and 60.2% for progression 12-month, 24-month, 36-month, and 48-month, respectively. |
| Raisuddin et al. [45] | ▪ Multi-class classification using Deep Active Learning using Consistency Regularization (CR). | ◦ SSL deep Siamese VGG | Without | 5 | OAI | 9003 | Balanced accuracy = 64.13 ± 0.88 |
| Cueva et al. [44] | ▪ Multi-class classification using computer-assisted diagnostic (CAD) based on the DL model. | ◦ Deep Siamese ResNet34 | With | 5 | [6]/Local dataset | 9182/376 | Average multi-class accuracy: 61.71%. |
4. Discussion
- i.
- Dataset preparation: The initial step in the process of selecting a suitable database is to guarantee an accurate diagnosis of knee osteoarthritis from radiographic images. This can be achieved by using mixed and balanced datasets with external validation, which is a first step towards reliable training. The classification of knee osteoarthritis can be simplified by merging the KL0 and KL1 grades into a single category [13,15,20,26,48]. Although KL1 has no real significance, it reduces the model’s accuracy as it is challenging to differentiate it from KL0.
- ii.
- Model selection: In addition to preparing a suitable database, the type of model chosen, hyperparameters, features extraction and selection, ROI localization, and JSN quantification are the most important factors in effectively improving the accuracy of the trained model. In light of these promising outcomes, the deployment of diverse iterations of YOLLO for real-time ROI detection and localization is becoming increasingly prevalent.
- iii.
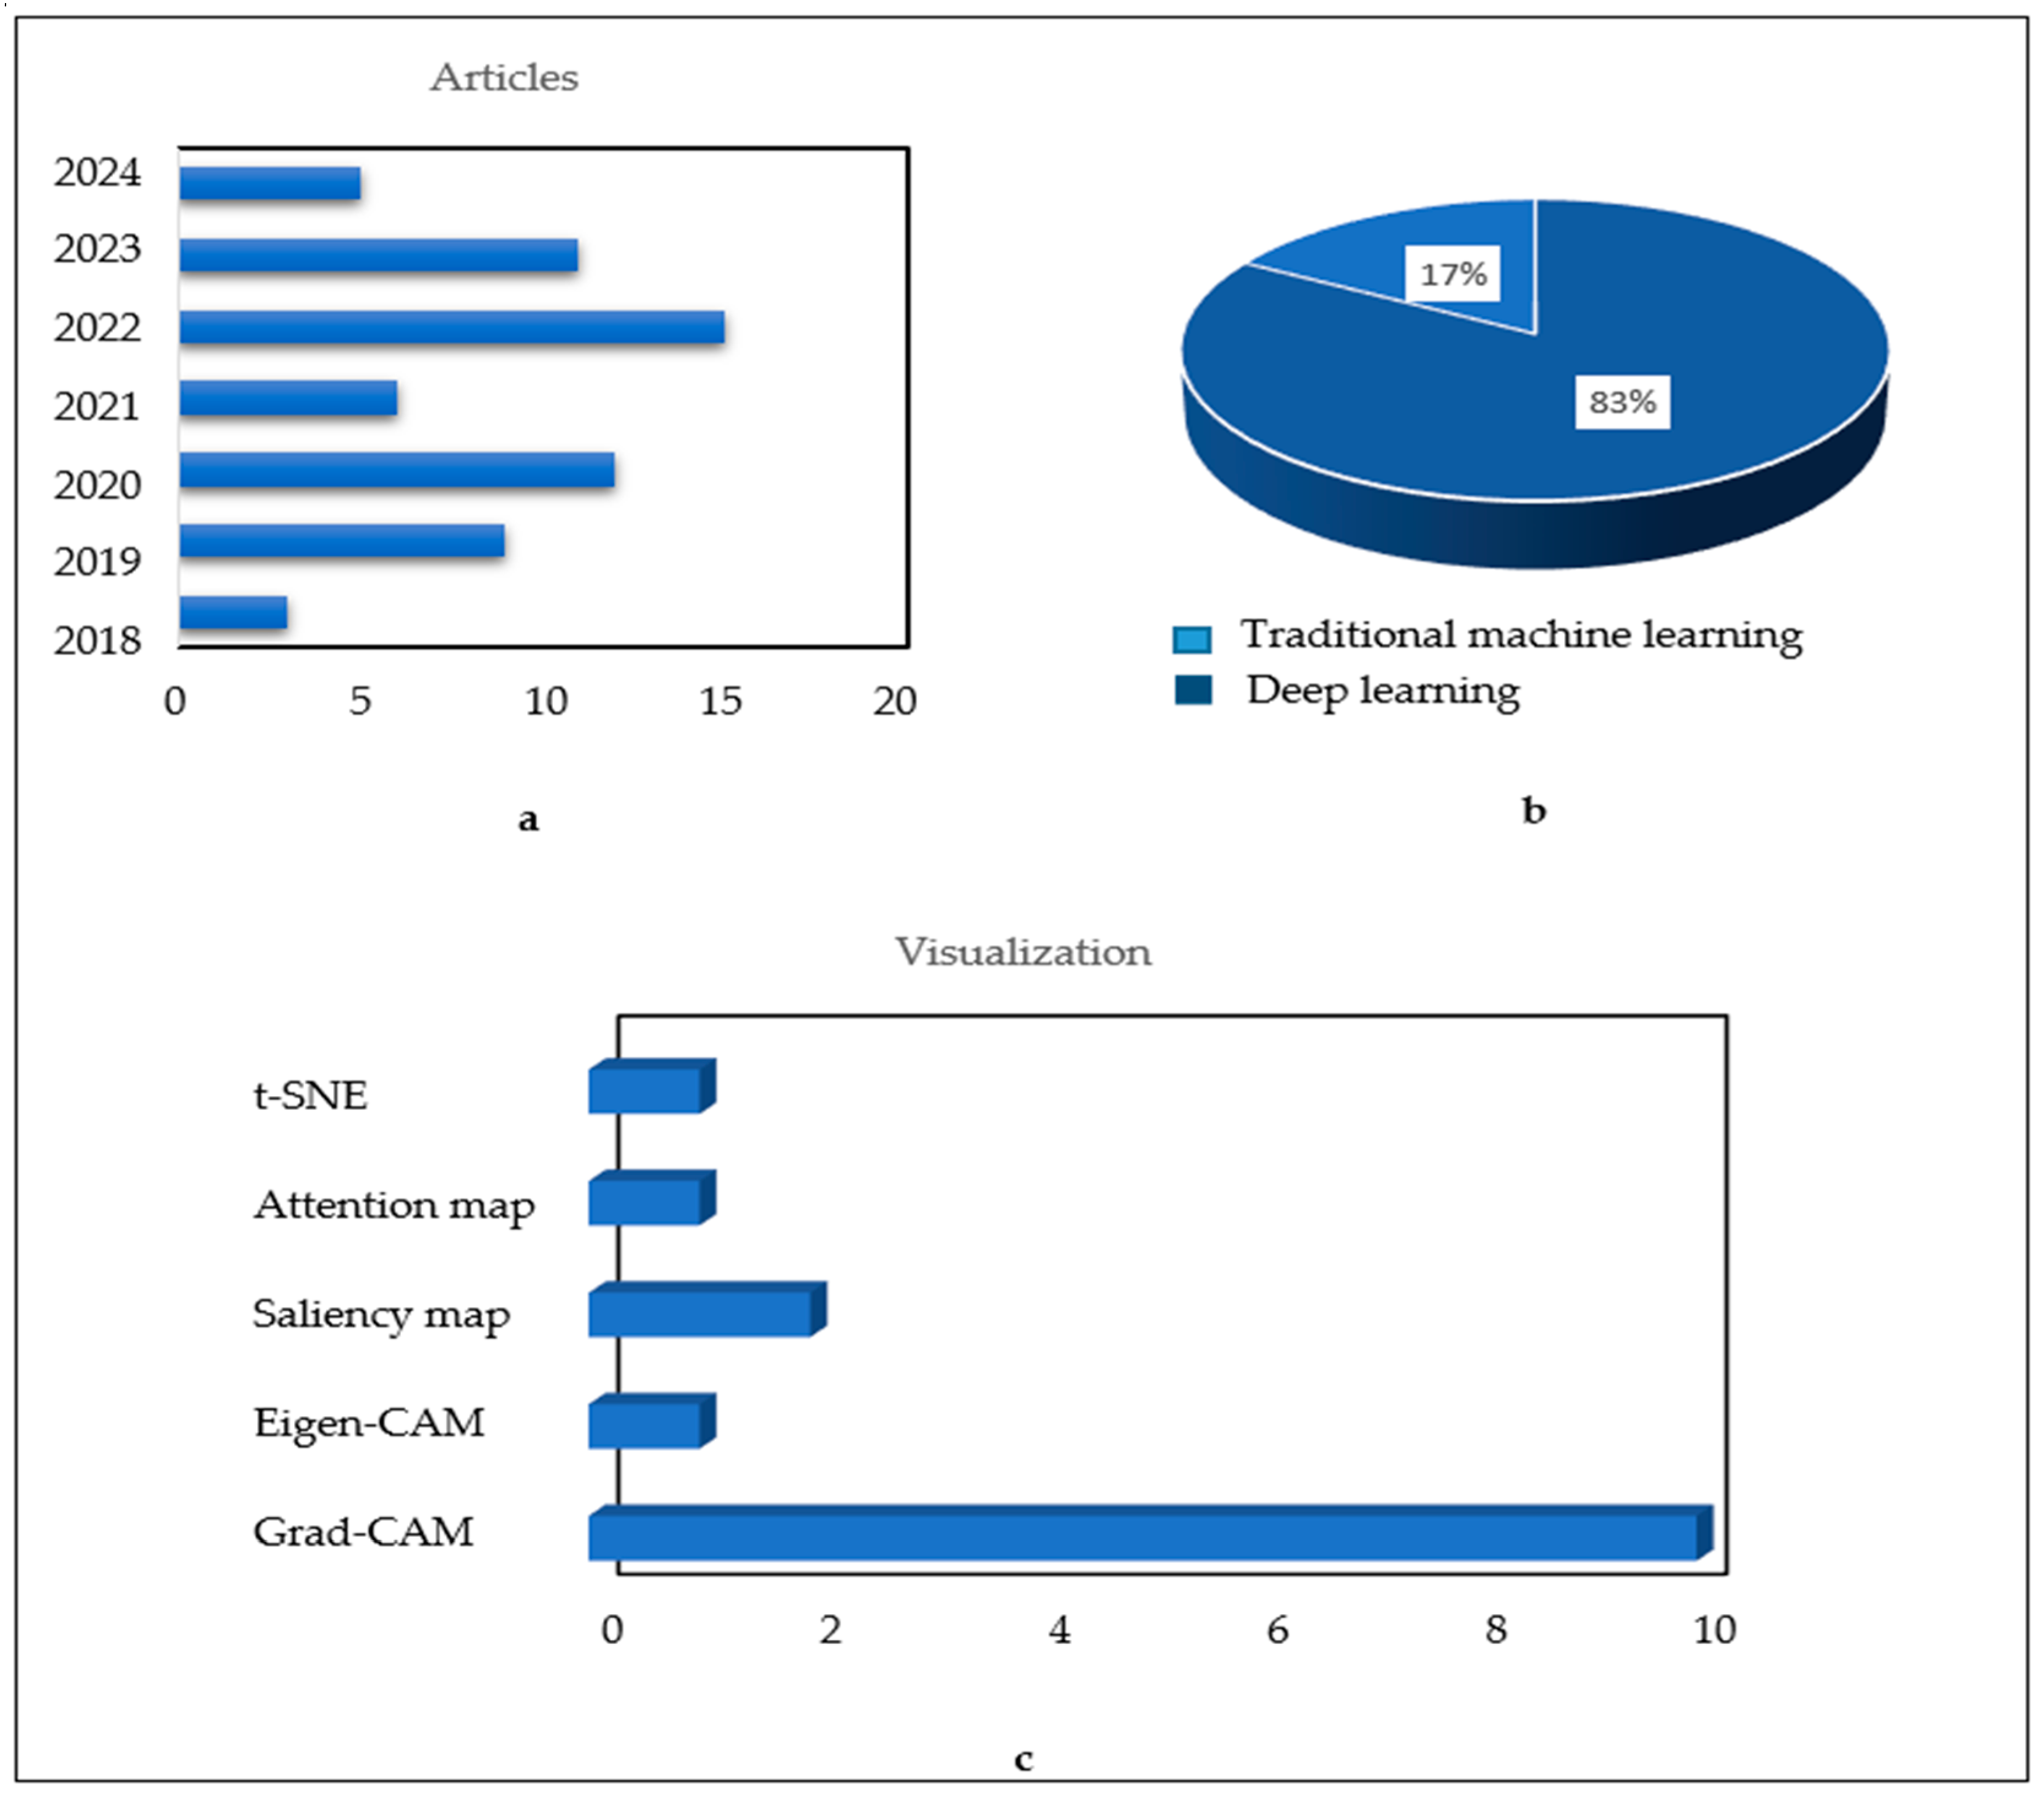
- Visualization: The reliability of a diagnosis is no longer solely based on its accuracy; it is also based on the visualization of areas of deficiency. The orientation of new research towards a precise and justified diagnosis is analogous to that of the specialist doctors who base their final diagnosis on well-defined symptoms. This approach could therefore be used to confirm the degree of knee osteoarthritis by visualizing the key elements that have contributed to the identification of this condition. This would provide greater confidence in the developed approach.
5. Conclusions
Author Contributions
Funding
Institutional Review Board Statement
Informed Consent Statement
Data Availability Statement
Conflicts of Interest
Abbreviations
| AI | Artificial intelligence |
| CNNs | Convolutional neural networks |
| DCNN | Deep convolutional neural network |
| KL | Kellgren and Lawrence |
| KOA | Knee Osteoarthritis |
| OAI | Osteoarthritis initiative |
| TL | Transfer learning |
| RELU | Linear rectified unit |
| ROI | Region of interest |
| RMSE | Root-Mean-Squared Error |
| SGD | Stochastic gradient descent |
| A-ENN | Adversarial evolving neural network |
| DAL | Deep active learning |
| LSTM | Long short-term memory |
| ORM | Ordinal regression module |
| HRNet | High-resolution network |
| CBAM | Convolutional mass attention module |
| KNN | K-Nearest neighbors |
| DT | Decision tree |
| RF | Random forest |
| RQ | Research question |
| EC | Eligibility criteria |
| MAE | Mean absolute error |
| SC | Screening criteria |
| OARSI | Osteoarthritis research society international |
| WOMAC | Western ontario and McMaster universities |
| IKDC | International Knee Documentation Committee |
| KOOS | Knee outcomes in osteoarthritis scores |
| FFNN | Feed Forward Neural Network |
References
- Wang, Y.; Bi, Z.; Xie, Y.; Wu, T.; Zeng, X.; Chen, S.; Zhou, D. Learning From Highly Confident Samples for Automatic Knee Osteoarthritis Severity Assessment: Data From the Osteoarthritis Initiative. IEEE J. Biomed. Health Inform. 2022, 26, 1239–1250. [Google Scholar] [CrossRef] [PubMed]
- Dhami, B.S.; Mehra, M.; Singh, R.P. VGG16 Based Knee Osteoarthritis Grading Using X-ray Images. IJRASET 2022, 10, 678–683. Available online: https://www.ijraset.com/research-paper/vgg16-based-knee-osteoarthritis-grading (accessed on 5 January 2023). [CrossRef]
- Wahyuningrum, R.T.; Anifah, L.; Eddy Purnama, I.K.; Hery Purnomo, M. A New Approach to Classify Knee Osteoarthritis Severity from Radiographic Images based on CNN-LSTM Method. In Proceedings of the IEEE 10th International Conference on Awareness Science and Technology (ICAST), Morioka, Japan, 23–25 October 2019; pp. 1–6. Available online: https://ieeexplore.ieee.org/document/8923284 (accessed on 5 January 2023).
- Wahyuningrum, R.T.; Purnama, I.K.E.; Verkerke, G.J.; van Ooijen, P.M.A.; Purnomo, M.H. A novel method for determining the Femoral-Tibial Angle of Knee Osteoarthritis on X-ray radiographs: Data from the Osteoarthritis Initiative. Heliyon 2019, 6, e04433. [Google Scholar] [CrossRef] [PubMed] [PubMed Central]
- Statistics Adopted from the National Center for Chronic Disease Prevention and Health Promotion. Available online: https://archive.cdc.gov/#/details?q=https://www.cdc.gov/arthritis/data_statistics&start=0&rows=10&url=https://www.cdc.gov/media/releases/2017/p0307-arthritis-climbing.html (accessed on 10 August 2023).
- Gornale, S.S.; Patravali, P.U.; Hiremath, P.S. A Comprehensive Digital Knee X-ray Image Dataset for the Assessment of Osteoarthritis. JSM Biomed. Imaging Data Pap. 2020, 6, 1012. Available online: https://www.academia.edu/79637490/A_Comprehensive_Digital_Knee_X_ray_Image_Dataset_for_the_Assessment_of_Osteoarthritis (accessed on 25 September 2023).
- Kwon, S.B.; Han, H.-S.; Lee, M.C.; Kim, H.C.; Ku, Y.; Ro, D.H. Machine Learning-Based Automatic Classification of Knee Osteoarthritis Severity Using Gait Data and Radiographic Images. IEEE Access 2020, 8, 120597–120603. Available online: https://ieeexplore.ieee.org/document/9130657 (accessed on 5 January 2023). [CrossRef]
- Olsson, S.; Akbarian, E.; Lind, A.; Razavian, A.S.; Gordon, M. Automating classification of osteoarthritis according to Kellgren-Lawrence in the knee using deep learning in an unfiltered adult population. BMC Musculoskelet. Disord. 2021, 22, 844. [Google Scholar] [CrossRef] [PubMed] [PubMed Central]
- Schwartz, A.J.; Clarke, H.D.; Spangehl, M.J.; Bingham, J.S.; Etzioni, D.A.; Neville, M.R. Can a Convolutional Neural Network Classify Knee Osteoarthritis on Plain Radiographs as Accurately as Fellowship-Trained Knee Arthroplasty Surgeons? J. Arthroplast. 2020, 35, 2423–2428. [Google Scholar] [CrossRef] [PubMed]
- Tiulpin, A.; Melekhov, I.; Saarakkala, S. KNEEL: Knee Anatomical Landmark Localization Using Hourglass Networks. In Proceedings of the 2019 IEEE/CVF International Conference on Computer Vision Workshop (ICCVW), Seoul, Republic of Korea, 27–28 October 2019; Available online: https://ieeexplore.ieee.org/document/9022083 (accessed on 5 January 2023).
- Yang, J.; Ji, Q.; Ni, M.; Zhang, G.; Wang, Y. Automatic assessment of knee osteoarthritis severity in portable devices based on deep learning. J. Orthop. Surg. Res. 2022, 17, 540. Available online: https://josr-online.biomedcentral.com/articles/10.1186/s13018-022-03429-2 (accessed on 5 January 2023). [CrossRef] [PubMed]
- Brahim, A.; Jennane, R.; Riad, R.; Janvier, T.; Khedher, L.; Toumi, H.; Lespessailles, E. A decision support tool for early detection of knee OsteoArthritis using X-ray imaging and machine learning: Data from the OsteoArthritis Initiative. Comput. Med. Imaging Graph. 2019, 73, 11–18. [Google Scholar] [CrossRef] [PubMed]
- Nguyen, H.H.; Saarakkala, S.; Blaschko, M.B.; Tiulpin, A. Semixup: In- and Out-of-Manifold Regularization for Deep Semi-Supervised Knee Osteoarthritis Severity Grading From Plain Radiographs. IEEE Trans. Med. Imaging 2020, 39, 4346–4356. Available online: https://ieeexplore.ieee.org/document/9169719 (accessed on 25 September 2023). [CrossRef]
- Tiulpin, A.; Saarakkala, S. Automatic Grading of Individual Knee Osteoarthritis Features in Plain Radiographs using Deep Convolutional Neural Networks. Diagnostics 2020, 10, 932. [Google Scholar] [CrossRef] [PubMed] [PubMed Central]
- Bayramoglu, N.; Tiulpin, A.; Hirvasniemi, J.; Nieminen, M.T.; Saarakkala, S. Adaptive segmentation of knee radiographs for selecting the optimal ROI in texture analysis. Osteoarthr. Cartil. 2020, 28, 941–952. [Google Scholar] [CrossRef] [PubMed]
- Chen, P.; Gao, L.; Shi, X.; Allen, K.; Yang, L. Fully automatic knee osteoarthritis severity grading using deep neural networks with a novel ordinal loss. Comput. Med. Imaging Graph. 2019, 75, 84–92. [Google Scholar] [CrossRef] [PubMed] [PubMed Central]
- Yunus, U.; Amin, J.; Sharif, M.; Yasmin, M.; Kadry, S.; Krishnamoorthy, S. Recognition of Knee Osteoarthritis (KOA) Using YOLOv2 and Classification Based on Convolutional Neural Network. Life 2022, 12, 1126. [Google Scholar] [CrossRef] [PubMed]
- Dalia, Y.; Bharath, A.; Mayya, V.; Sowmya Kamath, S. DeepOA: Clinical Decision Support System for Early Detection and Severity Grading of Knee Osteoarthritis. In Proceedings of the IEEE 5th International Conference on Computer, Communication and Signal Processing (ICCCSP), Chennai, India, 24–25 May 2021; pp. 250–255. Available online: https://ieeexplore.ieee.org/document/9465522 (accessed on 25 September 2023).
- Nagaraj, K.; Jeyakumar, V. A Study on Comparative Analysis of Automated and Semiautomated Segmentation Techniques on Knee Osteoarthritis X-ray Radiographs. In Proceedings of the International Conference on ISMAC in Computational Vision and Bio-Engineering 2018 (ISMAC-CVB); Lecture Notes in Computational Vision and Biomechanics. Pandian, D., Fernando, X., Baig, Z., Shi, F., Eds.; Springer International Publishing: Cham, Switzerland, 2019; pp. 1655–1666. [Google Scholar] [CrossRef]
- Nguyen Huu, P.; Nguyen Thanh, D.; le Thi Hai, T.; Chu Duc, H.; Pham Viet, H.; Nguyen Trong, C. Detection and Classification Knee Osteoarthritis Algorithm using YOLOv3 and VGG16 Models. In Proceedings of the IEEE 7th National Scientific Conference on Applying New Technology in Green Buildings (ATiGB), Da Nang, Vietnam, 11–12 November 2022; pp. 31–36. Available online: https://ieeexplore.ieee.org/document/9984096 (accessed on 25 September 2023).
- Wang, Y.; Li, S.; Zhao, B.; Zhang, J.; Yang, Y.; Li, B. A ResNet-based approach for accurate radiographic diagnosis of knee osteoarthritis. CAAI Trans. Intell. Technol. 2022, 7, 512–521. Available online: https://ietresearch.onlinelibrary.wiley.com/doi/10.1049/cit2.12079 (accessed on 5 January 2023). [CrossRef]
- Wani, Z.M.; Saini, D.S. Deep Neural Network-based Knee Osteoarthritis Grading Using X-rays. IJRASET 2022, 10, 1293–1299. [Google Scholar] [CrossRef]
- Zhang, B.; Tan, J.; Cho, K.; Chang, G.; Deniz, C.M. Attention-based CNN for KL Grade Classification: Data from the Osteoarthritis Initiative. In Proceedings of the 2020 IEEE 17th International Symposium on Biomedical Imaging (ISBI), Iowa City, IA, USA, 3–7 April 2020; pp. 731–735. Available online: https://ieeexplore.ieee.org/document/9098456 (accessed on 5 January 2023).
- Yoon, J.S.; Yon, C.-J.; Lee, D.; Lee, J.J.; Kang, C.H.; Kang, S.-B.; Lee, N.-K.; Chang, C.B. Assessment of a novel deep learning-based software developed for automatic feature extraction and grading of radiographic knee osteoarthritis. BMC Musculoskelet Disord. 2023, 24, 869. [Google Scholar] [CrossRef] [PubMed] [PubMed Central]
- Tian, X.; Han, C.; Wang, J.; Tan, Y.; Zhu, G.; Lei, M.; Ma, S.; Hu, Y.; Li, S.; Chen, H.; et al. Distal tibial tuberosity high tibial osteotomy using an image enhancement technique for orthopedic scans in the treatment of medial compartment knee osteoarthritis. Comput. Methods Programs Biomed. 2020, 191, 105349. [Google Scholar] [CrossRef]
- Norman, B.; Pedoia, V.; Noworolski, A.; Link, T.M.; Majumdar, S. Applying Densely Connected Convolutional Neural Networks for Staging Osteoarthritis Severity from Plain Radiographs. J. Digit. Imaging 2019, 32, 471–477. [Google Scholar] [CrossRef] [PubMed] [PubMed Central]
- Tiulpin, A.; Klein, S.; Bierma-Zeinstra, S.M.A.; Thevenot, J.; Rahtu, E.; van Meurs, J.; Oei, E.H.G.; Saarakkala, S. Multimodal Machine Learning-based Knee Osteoarthritis Progression Prediction from Plain Radiographs and Clinical Data. Sci. Rep. 2019, 9, 20038. Available online: https://www.nature.com/articles/s41598-019-56527-3 (accessed on 5 January 2023). [CrossRef]
- Tariq, T.; Suhail, Z.; Nawaz, Z. Knee Osteoarthritis Detection and Classification Using X-rays. IEEE Access 2023, 11, 48292–48303. Available online: https://ieeexplore.ieee.org/document/10126092 (accessed on 8 January 2024). [CrossRef]
- Abdo, A.A.; El-Tarhouni, W.; Abdulsalam, A.F.; Altajori, A.B. Estimating the severity of knee osteoarthritis using Deep Convolutional Neural Network based on Contrast Limited Adaptive Histogram Equalization technique. In Proceedings of the 2022 International Conference on Engineering & MIS (ICEMIS), Istanbul, Turkey, 4–6 July 2022; pp. 1–6. Available online: https://ieeexplore.ieee.org/document/9914285 (accessed on 5 January 2023).
- Ahmed, S.M.; Mstafa, R.J. Identifying Severity Grading of Knee Osteoarthritis from X-ray Images Using an Efficient Mixture of Deep Learning and Machine Learning Models. Diagnostics 2022, 12, 2939. [Google Scholar] [CrossRef] [PubMed] [PubMed Central]
- Riad, R.; Jennane, R.; Brahim, A.; Janvier, T.; Toumi, H.; Lespessailles, E. Texture analysis using complex wavelet decomposition for knee osteoarthritis detection: Data from the osteoarthritis initiative. Comput. Electr. Eng. 2018, 68, 181–191. [Google Scholar] [CrossRef]
- Mohammed, A.S.; Hasanaath, A.A.; Latif, G.; Bashar, A. Knee Osteoarthritis Detection and Severity Classification Using Residual Neural Networks on Preprocessed X-ray Images. Diagnostics 2023, 13, 1380. [Google Scholar] [CrossRef] [PubMed]
- Al-Rimy, B.A.S.; Saeed, F.; Al-Sarem, M.; Albarrak, A.M.; Qasem, S.N. An Adaptive Early Stopping Technique for DenseNet169-Based Knee Osteoarthritis Detection Model. Diagnostics 2023, 13, 1903. [Google Scholar] [CrossRef] [PubMed]
- El-Ghany, S.A.; Elmogy, M.; El-Aziz, A.A.A. A fully automatic fine-tuned deep learning model for knee osteoarthritis detection and progression analysis. Egypt. Inform. J. 2023, 24, 229–240. [Google Scholar] [CrossRef]
- Tri Wahyuningrum, R.; Yasid, A.; Jacob Verkerke, G. Deep Neural Networks for Automatic Classification of Knee Osteoarthritis Severity Based on X-ray Images. In Proceedings of the 8th International Conference on Information Technology ICIT 2020: IoT and Smart City, Xi’an, China, 25–27 December 2020; ACM: New York, NY, USA, 2021; pp. 110–114. Available online: https://dl.acm.org/doi/10.1145/3446999.3447020 (accessed on 5 January 2023).
- Jain, R.K.; Sharma, P.K.; Gaj, S.; Sur, A.; Ghosh, P. Knee Osteoarthritis Severity Prediction using an Attentive Multi-Scale Deep Convolutional Neural Network. Multimed. Tools Appl. 2023, 83, 6925–6942. [Google Scholar] [CrossRef]
- Sivakumari, T.; Vani, R. Implementation of AlexNet for Classification of Knee Osteoarthritis. In Proceedings of the 2022 7th International Conference on Communication and Electronics Systems (ICCES), Coimbatore, India, 22–24 June 2022; pp. 1405–1409. Available online: https://ieeexplore.ieee.org/document/9835835 (accessed on 5 January 2023).
- Thomas, K.A.; Kidziński, Ł.; Halilaj, E.; Fleming, S.L.; Venkataraman, G.R.; Oei, E.H.G.; Gold, G.E.; Delp, S.L. Automated Classification of Radiographic Knee Osteoarthritis Severity Using Deep Neural Networks. Radiol. Artif. Intell. 2020, 2, e190065. Available online: https://pubs.rsna.org/doi/10.1148/ryai.2020190065 (accessed on 5 January 2023). [CrossRef]
- Tiulpin, A.; Thevenot, J.; Rahtu, E.; Lehenkari, P.; Saarakkala, S. Automatic Knee Osteoarthritis Diagnosis from Plain Radiographs: A Deep Learning-Based Approach. Sci. Rep. 2018, 8, 1727. Available online: https://www.nature.com/articles/s41598-018-20132-7 (accessed on 5 January 2023). [CrossRef]
- Abedin, J.; Antony, J.; McGuinness, K.; Moran, K.; O’Connor, N.E.; Rebholz-Schuhmann, D.; Newell, J. Predicting knee osteoarthritis severity: Comparative modeling based on patient’s data and plain X-ray images. Sci. Rep. 2019, 9, 5761. [Google Scholar] [CrossRef] [PubMed] [PubMed Central]
- Bayramoglu, N.; Nieminen, M.T.; Saarakkala, S. Automated detection of patellofemoral osteoarthritis from knee lateral view radiographs using deep learning: Data from the Multicenter Osteoarthritis Study (MOST). Osteoarthr. Cartil. 2021, 29, 1432–1447. Available online: https://www.oarsijournal.com/article/S1063-4584(21)00835-9/fulltext (accessed on 5 January 2023). [CrossRef] [PubMed]
- Alshamrani, H.A.; Rashid, M.; Alshamrani, S.S.; Alshehri, A.H. Osteo-NeT: An Automated System for Predicting Knee Osteoarthritis from X-ray Images Using Transfer-Learning-Based Neural Networks Approach. Healthcare 2023, 11, 1206. [Google Scholar] [CrossRef] [PubMed]
- Gornale, S.S.; Patravali, P.U.; Hiremath, P.S. Automatic Detection and Classification of Knee Osteoarthritis Using Hu’s Invariant Moments. Front. Robot. AI 2020, 7, 591827. [Google Scholar] [CrossRef] [PubMed]
- Cueva, J.H.; Castillo, D.; Espinós-Morató, H.; Durán, D.; Díaz, P.; Lakshminarayanan, V. Detection and Classification of Knee Osteoarthritis. Diagnostics 2022, 12, 2362. [Google Scholar] [CrossRef] [PubMed] [PubMed Central]
- Raisuddin, A.M.; Nguyen, H.H.; Tiulpin, A. Deep Semi-Supervised Active Learning for Knee Osteoarthritis Severity Grading. In Proceedings of the IEEE 19th International Symposium on Biomedical Imaging (ISBI), Kolkata, India, 28–31 March 2022; pp. 1–5. Available online: https://ieeexplore.ieee.org/document/9761668 (accessed on 5 January 2023).
- Fatema, K.; Rony, M.A.H.; Azam, S.; Muckta, M.S.H.; Hasan, M.Z.; Jonkman, M. Development of an automated optimal distance feature-based decision system for diagnosing knee osteoarthritis using segmented X-ray images. Heliyon 2023, 9, e21703. [Google Scholar] [CrossRef]
- Kalpana, V.; Kumar, G.H. Evaluating the efficacy of deep learning models for knee osteoarthritis prediction based on Kellgren-Lawrence grading system, e-Prime—Advances in Electrical Engineering. Electron. Energy 2023, 5, 100266. [Google Scholar] [CrossRef]
- Raza, A.; Phan, T.-L.; Li, H.-C.; Van Hieu, N.; Nghia, T.T.; Ching, C.T.S. A Comparative Study of Machine Learning Classifiers for Enhancing Knee Osteoarthritis Diagn. Inf. 2024, 15, 183. Available online: https://www.mdpi.com/2078-2489/15/4/183 (accessed on 15 May 2024).
- Gornale, S.S.; Patravali, P.U.; Hiremath, P.S. Detection of Osteoarthritis in Knee Radiographic Images using Artificial Neural Network. Int. J. Innov. Technol. Explor. Eng. IJITEE 2019, 8, 2429–2434. Available online: https://www.ijitee.org/portfolio-item/L30111081219/ (accessed on 5 January 2023). [CrossRef]
- Touahema, S.; Zaimi, I.; Zrira, N.; Ngote, M.N.; Doulhousne, H.; Aouial, M. MedKnee: A New Deep Learning-Based Software for Automated Prediction of Radiographic Knee Osteoarthritis. Diagnostics 2024, 14, 993. [Google Scholar] [CrossRef]
- Salama, A.; Rahouma, K.; Mansour, F.E. Knee osteoarthritis automatic detection using U-Net. IJ-AI 2024, 13, 2122. Available online: https://ijai.iaescore.com/index.php/IJAI/article/view/23241 (accessed on 15 May 2024). [CrossRef]
- Anitha, R.; Archana, M.; Aswini, R.; Christabell Smylin, P. Deep Learning Based Knee Osteoarthritis Detection and Classification. IJARSCT 2024, 4, 230–235. [Google Scholar] [CrossRef]
- Ruikar, D.; Kamble, P.; Ruikar, A.; Houde, K.; Hegadi, R. DNN-Based Knee OA Severity Prediction System: Pathologically Robust Feature Engineering Approach. SN Comput. Sci. 2022, 4, 58. Available online: https://dl.acm.org/doi/10.1007/s42979-022-01476-4 (accessed on 5 January 2023). [CrossRef]
- Huthaifa, A.A.; Emad, A.M. Detection and Classification of The Osteoarthritis in Knee Joint Using Transfer Learning with Convolutional Neural Networks (CNNs). Iraqi J. Sci. 2022, 63, 5058–5071. Available online: https://ijs.uobaghdad.edu.iq/index.php/eijs/article/view/6054 (accessed on 20 January 2023).
- M, G.K.; Goswami, A.D. Automatic Classification of the Severity of Knee Osteoarthritis Using Enhanced Image Sharpening and CNN. Appl. Sci. 2023, 13, 1658. [Google Scholar] [CrossRef]
- Yong, C.W.; Teo, K.; Murphy, B.P.; Hum, Y.C.; Tee, Y.K.; Xia, K.; Lai, K.W. Knee osteoarthritis severity classification with ordinal regression module. Multimed. Tools Appl. 2021, 81, 41497–41509. [Google Scholar] [CrossRef]
- Yildirim, M.; Mutlu, H.B. Automatic detection of knee osteoarthritis grading using artificial intelligence-based methods. Int. J. Imaging Syst. Technol. 2024, 34, e23057. Available online: https://onlinelibrary.wiley.com/doi/10.1002/ima.23057 (accessed on 15 May 2024). [CrossRef]
- Bhat, A.Y.; Suhasini, A. Automated Detection For The Severity Of Knee Osteoarthritis from Plain Radiographs Using Machine Learning Methods. Int. J. Sci. Technol. Res. 2019, 8, 2277–8616. Available online: https://www.ijstr.org/final-print/sep2019/Automated-Detection-For-The-Severity-Of-Knee-Osteoarthritis-From-Plain-Radiographs-Using-Machine-Learning-Methods.pdf (accessed on 5 January 2023).
- Bonakdari, H.; Jamshidi, A.; Pelletier, J.-P.; Abram, F.; Tardif, G.; Martel-Pelletier, J. A warning machine learning algorithm for early knee osteoarthritis structural progressor patient screening. Ther. Adv. Musculoskelet. 2021, 13, 1759720X2199325. Available online: https://journals.sagepub.com/doi/10.1177/1759720X21993254 (accessed on 5 January 2023). [CrossRef]
- Pi, S.-W.; Lee, B.-D.; Lee, M.S.; Lee, H.J. Ensemble deep-learning networks for automated osteoarthritis grading in knee X-ray images. Sci. Rep. 2023, 13, 22887. Available online: https://www.nature.com/articles/s41598-023-50210-4 (accessed on 8 January 2024). [CrossRef]
- Hu, K.; Wu, W.; Li, W.; Simic, M.; Zomaya, A.; Wang, Z. Adversarial Evolving Neural Network for Longitudinal Knee Osteoarthritis Prediction. IEEE Trans. Med. Imaging 2022, 41, 3207–3217. [Google Scholar] [CrossRef] [PubMed] [PubMed Central]


| Category 1 | Category 2 |
|---|---|
| Knee osteoarthritis | Automated |
| Artificial intelligence | Detection |
| Deep learning | Progression |
| Machine learning | |
| X-ray images | |
| Radiographic images | |
| Plain radiograph |
| ID | Filtering Criteria |
|---|---|
| SC1 | The article must include at least the Title, Abstract, Source, Year, and Doi. |
| SC2 | Must be in English. |
| SC3 | Abstract must discuss the implementation of artificial intelligence in knee osteoarthritis diagnosis. |
| SC4 | The article must have been published between January 2018 and May 2024. |
| SC5 | Should not be just a review, survey, preprint, or roadmap. |
| ID | Eligibility Criteria |
|---|---|
| EC1 | Does not address the implementation of artificial intelligence in the KOA diagnosis. |
| EC2 | Is not based on X-ray images. |
| EC3 | Full text not accessible. |
| Dataset | Description | Labeled Images | Availability |
|---|---|---|---|
| OAI | ▪ Osteoarthritis Initiative (OAI) dataset: Multicenter, ten-year observational study of 4796 participants (Men and Women age = 45–79 years) | 4446 (KL and OARSI) | https://nda.nih.gov/oai/ (accessed on 5 January 2023) |
| MOST | ▪ Multicenter Osteoarthritis Study (MOST): PA and lateral knees of 2026 participants (Men and Women average age = 50–79 years) | 2920(KL) | https://most.ucsf.edu (accessed on 5 January 2023) |
| Gornale SS et al. [6] | ▪ Fixed-flexion digital knee X-ray images collected from various Karnataka hospitals, in India (known as Medical-expert) | 1650 (KL) | contact authors |
| Kwon et al. [7] | ▪ 728 limbs with gait analysis data of 364 participants (men and women age ≥ 20 years) collected from Seoul National University Hospital (Korea) from 2013 to 2017 | 215 (KL) | contact authors |
| Olsson et al. [8] | ▪ 6103 radiographic exams collected from Danderyd University Hospital, Stockholm, Sweden | 6403 (KL) | contact authors |
| Schwartz et al. [9] | ▪ Fixed-flexion PA knee X-ray images collected from an outpatient clinic at a large academic joint arthroplasty practice, in Arizona, USA (from 2016 to 2019) | 4755 (IKDC) | contact authors |
| Tiulpin et al. [10] | ▪ 81 subjects, collected from Oulu University Hospital, Finland | 370 (KL) | ClinicalTrials.gov, ID: NCT02937064 |
| Yang et al. [11] | ▪ 2378 participants of the Chinese People’s Liberation Army General Hospital, Beijing, China, collected from January 2020 to January 2021 (men and women age ≥ 40) | 2579 (KL) | contact author |
| References | Method | Dataset (X-ray Images) | Metric |
|---|---|---|---|
| Dalia et al. [18] |
| 400 X-ray images from OAI | Recall = 93%. |
| Gornale S.S. et al. [6] |
| Local dataset: 1650 X-ray images | Not available |
| Nagaraj and Jeyakumar [19] |
| Local dataset of 25 X-ray images | Best models: Center rectangle, Seed point selection: SP = 100%, SE = 0% |
| Nguyen Huu et al. [20] |
| OAI | Train accuracy = 97%, mAP = 97%, IoU = 85% |
| Bayramoglu et al. [15] |
| OAI + MOST | Not available |
| Tiulpin et al. [10] |
| 370 X-ray images from Oulu University Hospital, Finland | Precision (resolution = 2.5) = 93.48% ± 0.44 |
| Wang Yu et al. [21] |
| OAI | Accuracy = 96%, recall = 0.92 |
| Wani and Saini [22] |
| OAI | Mean Jaccard index = 0.858, recall = 92.2 |
| Zhang et al. [23] |
| OAI | IoU = 0.86 |
| Yoon et al. [24] |
| OAI | Not available |
Disclaimer/Publisher’s Note: The statements, opinions and data contained in all publications are solely those of the individual author(s) and contributor(s) and not of MDPI and/or the editor(s). MDPI and/or the editor(s) disclaim responsibility for any injury to people or property resulting from any ideas, methods, instructions or products referred to in the content. |
© 2024 by the authors. Licensee MDPI, Basel, Switzerland. This article is an open access article distributed under the terms and conditions of the Creative Commons Attribution (CC BY) license (https://creativecommons.org/licenses/by/4.0/).
Share and Cite
Touahema, S.; Zaimi, I.; Zrira, N.; Ngote, M.N. How Can Artificial Intelligence Identify Knee Osteoarthritis from Radiographic Images with Satisfactory Accuracy?: A Literature Review for 2018–2024. Appl. Sci. 2024, 14, 6333. https://doi.org/10.3390/app14146333
Touahema S, Zaimi I, Zrira N, Ngote MN. How Can Artificial Intelligence Identify Knee Osteoarthritis from Radiographic Images with Satisfactory Accuracy?: A Literature Review for 2018–2024. Applied Sciences. 2024; 14(14):6333. https://doi.org/10.3390/app14146333
Chicago/Turabian StyleTouahema, Said, Imane Zaimi, Nabila Zrira, and Mohamed Nabil Ngote. 2024. "How Can Artificial Intelligence Identify Knee Osteoarthritis from Radiographic Images with Satisfactory Accuracy?: A Literature Review for 2018–2024" Applied Sciences 14, no. 14: 6333. https://doi.org/10.3390/app14146333
APA StyleTouahema, S., Zaimi, I., Zrira, N., & Ngote, M. N. (2024). How Can Artificial Intelligence Identify Knee Osteoarthritis from Radiographic Images with Satisfactory Accuracy?: A Literature Review for 2018–2024. Applied Sciences, 14(14), 6333. https://doi.org/10.3390/app14146333