Article

Reproducibility of Three-Dimensional Density Measurements in Teeth Using Micro-Computed Tomography: An Image Acquisition Protocol

by
Mary Huaiquin-Zúñiga
1,2,
Camila Castillo-Alonso
3,
Gabriel M. Fonseca
1,2 and
Sandra López-Lázaro
4,*
1
Programa de Magíster en Odontología, Facultad de Odontología, Universidad de La Frontera, Temuco 4780000, Chile
2
Centro de Investigación en Odontología Legal y Forense-CIO, Facultad de Odontología, Universidad de La Frontera, Temuco 4780000, Chile
3
Independent Researcher, Coyhaique 5950591, Chile
4
Departamento de Antropología, Facultad de Ciencias Sociales, Universidad de Chile, Santiago 6850331, Chile
*
Author to whom correspondence should be addressed.
Appl. Sci. 2024, 14(14), 6334; https://doi.org/10.3390/app14146334
Submission received: 13 June 2024 / Revised: 11 July 2024 / Accepted: 15 July 2024 / Published: 20 July 2024

Abstract

:
The use of micro-computed tomography (micro-CT) has become widespread in the examination of dental tissue due to its great precision in small-scale work. Its usefulness in measuring tissue mineral density has been demonstrated; however, it is necessary to develop image acquisition protocols that ensure the reproducibility of observations and offer a detailed step-by-step process. This study proposes a standardised protocol to quantify mineral density using volumetric measurements from micro-CT images, evaluating the reproducibility of density measurements at different points of enamel and dentine. The sample comprised 30 bovine incisors that were scanned using a micro-CT system. Using the MIMICS software v.26, seven reference points in enamel and dentine (crown, cervix, and root) were identified, and mineral density was calculated by using Hounsfield units. The reproducibility of the measurements among the three observers was assessed by calculating Lin’s concordance correlation coefficient (CCC). There was substantial to almost perfect correlation for the enamel (CCC = 0.986–0.995) and dentine (CCC = 0.965–0.997), with the latter showing better results for the cervix (CCC = 0.987–0.997) and crown (CCC = 0.987–0.995) compared with the root (CCC = 0.965–0.985). In the lingual area, the concordance results were broader (CCC = 0.965–0.997) compared with the buccal area (CCC = 0.979–0.995). Despite this difference, the proposed volumetric measurements reached a high level of agreement, which demonstrates the replicability of the present protocol.

1. Introduction

Micro-computed tomography (micro-CT) is one of the most recent imaging techniques of interest for diagnosis and research in several disciplines. It uses the same technology as a CT scanner, namely an X-ray source and a two-dimensional (2D) array detector to obtain multiple images from different angles across an area of interest. Subsequently, these images are used to reconstruct a three-dimensional (3D) volume representation, which increases the precision when observing elements and making measurements compared with an X-ray [1]. The main difference is that micro-CT works at a smaller scale, from a few millimetres to a few centimetres, and with higher resolution in the micron range [2].
Micro-CT is a non-invasive technique that allows one to preserve and standardise the sample. Hence, numerous measurements and calculations can be made regarding the analysed structures, and these measurements can be replicated [3,4]. These qualities have favoured the use of micro-CT imaging for tooth analysis because this approach allows one to reconstruct the tooth in its entirety. Moreover, one can even work with tooth fragments. This imaging tool has been preferred over traditional CT scanners because medical measurements based on conventional CT images can overestimate the values obtained from sectioned teeth [5]. Moreover, micro-CT imaging has proved to be a reliable method for the external observation of internal structures; so, it has been considered a gold standard in comparison with the degree of accuracy of the measurements made with analogous techniques, such as cone beam computed tomography (CBCT) [6,7,8,9]. The precision of this imaging technique in the study of hard tissues allows one to observe all dental structures, given the mineral density differences between dentine and enamel, both of which are mineralised [10,11].
As a result, micro-CT is applicable to various fields in dental research [11]. Enamel, dentine, and pulp cavity thickness, area, volume, and morphology have been used in palaeontology [12], bioarcheology [13,14,15], and clinical odontology [16,17,18] for different purposes related to each discipline. For example, in clinical odontology, micro-CT can help clinicians to evaluate osseointegration and thus treatment success [19,20]. However, the application of micro-CT is limited by the availability of scanners and the limited space available to place the sample inside the equipment (from an isolated tooth to small laboratory animals) [21].
Many authors have pointed out that micro-CT is useful for estimating mineral density in dental tissues, as a means to evaluate treatment effectiveness, tissue development, or the possible effects of an intervention [22,23,24,25]. When viewing micro-CT images in specialised software, they are made up of black, white, and grey pixels due to the differences in the attenuation of the radiation when passing through the different tissues. Hounsfield units (HUs) are used to quantify X-rays that pass through or are absorbed by tissues. Because these units are standardised, the attenuation of X-rays in micro-CT images is correlated to mineral density [26,27]. Hence, HUs can be compared and analysed. However, possibly due to the recent development of the technique, there is a lack of standardised and validated protocols for measuring dental mineral density with micro-CT. It is important to develop standardised and validated protocols because detailed information and documentation regarding the context of image acquisition ensures reproducibility of the methods, validation of the results, and consistency and facilitates peer review [28,29].
In this context, it is relevant to mention that evidence from the specialised literature indicates that there are similarities between bovine and human teeth in terms of the hardness, morphology, and chemical composition of enamel and dentine [27,30,31,32,33]. Although there are some differences, they do not limit the use of bovine teeth as an alternative for human teeth. Nevertheless, these differences must be considered to ensure that the results are interpretated appropriately within the scope of an investigation. This approach requires making methodological adjustments in sampling and analysis, using healthy and well-preserved teeth to minimise bias, and employing techniques such as exploratory micro-CT to accurately study the structural and compositional differences to ensure compatibility and that interpretations are based on the context [34,35]. Given the objective of this research, the use of bovine teeth as a proxy for human teeth is appropriate.
The present study aimed to propose a standardised protocol to quantify mineral density based on micro-CT images in a volumetric manner. This endeavour involved evaluating the reproducibility of the density measurements at different points of the enamel and dentine in bovine teeth generated from the protocol. The originality of this work is the innovative step-by-step process to measure mineral density accurately and in a reproducible manner.

2. Materials and Methods

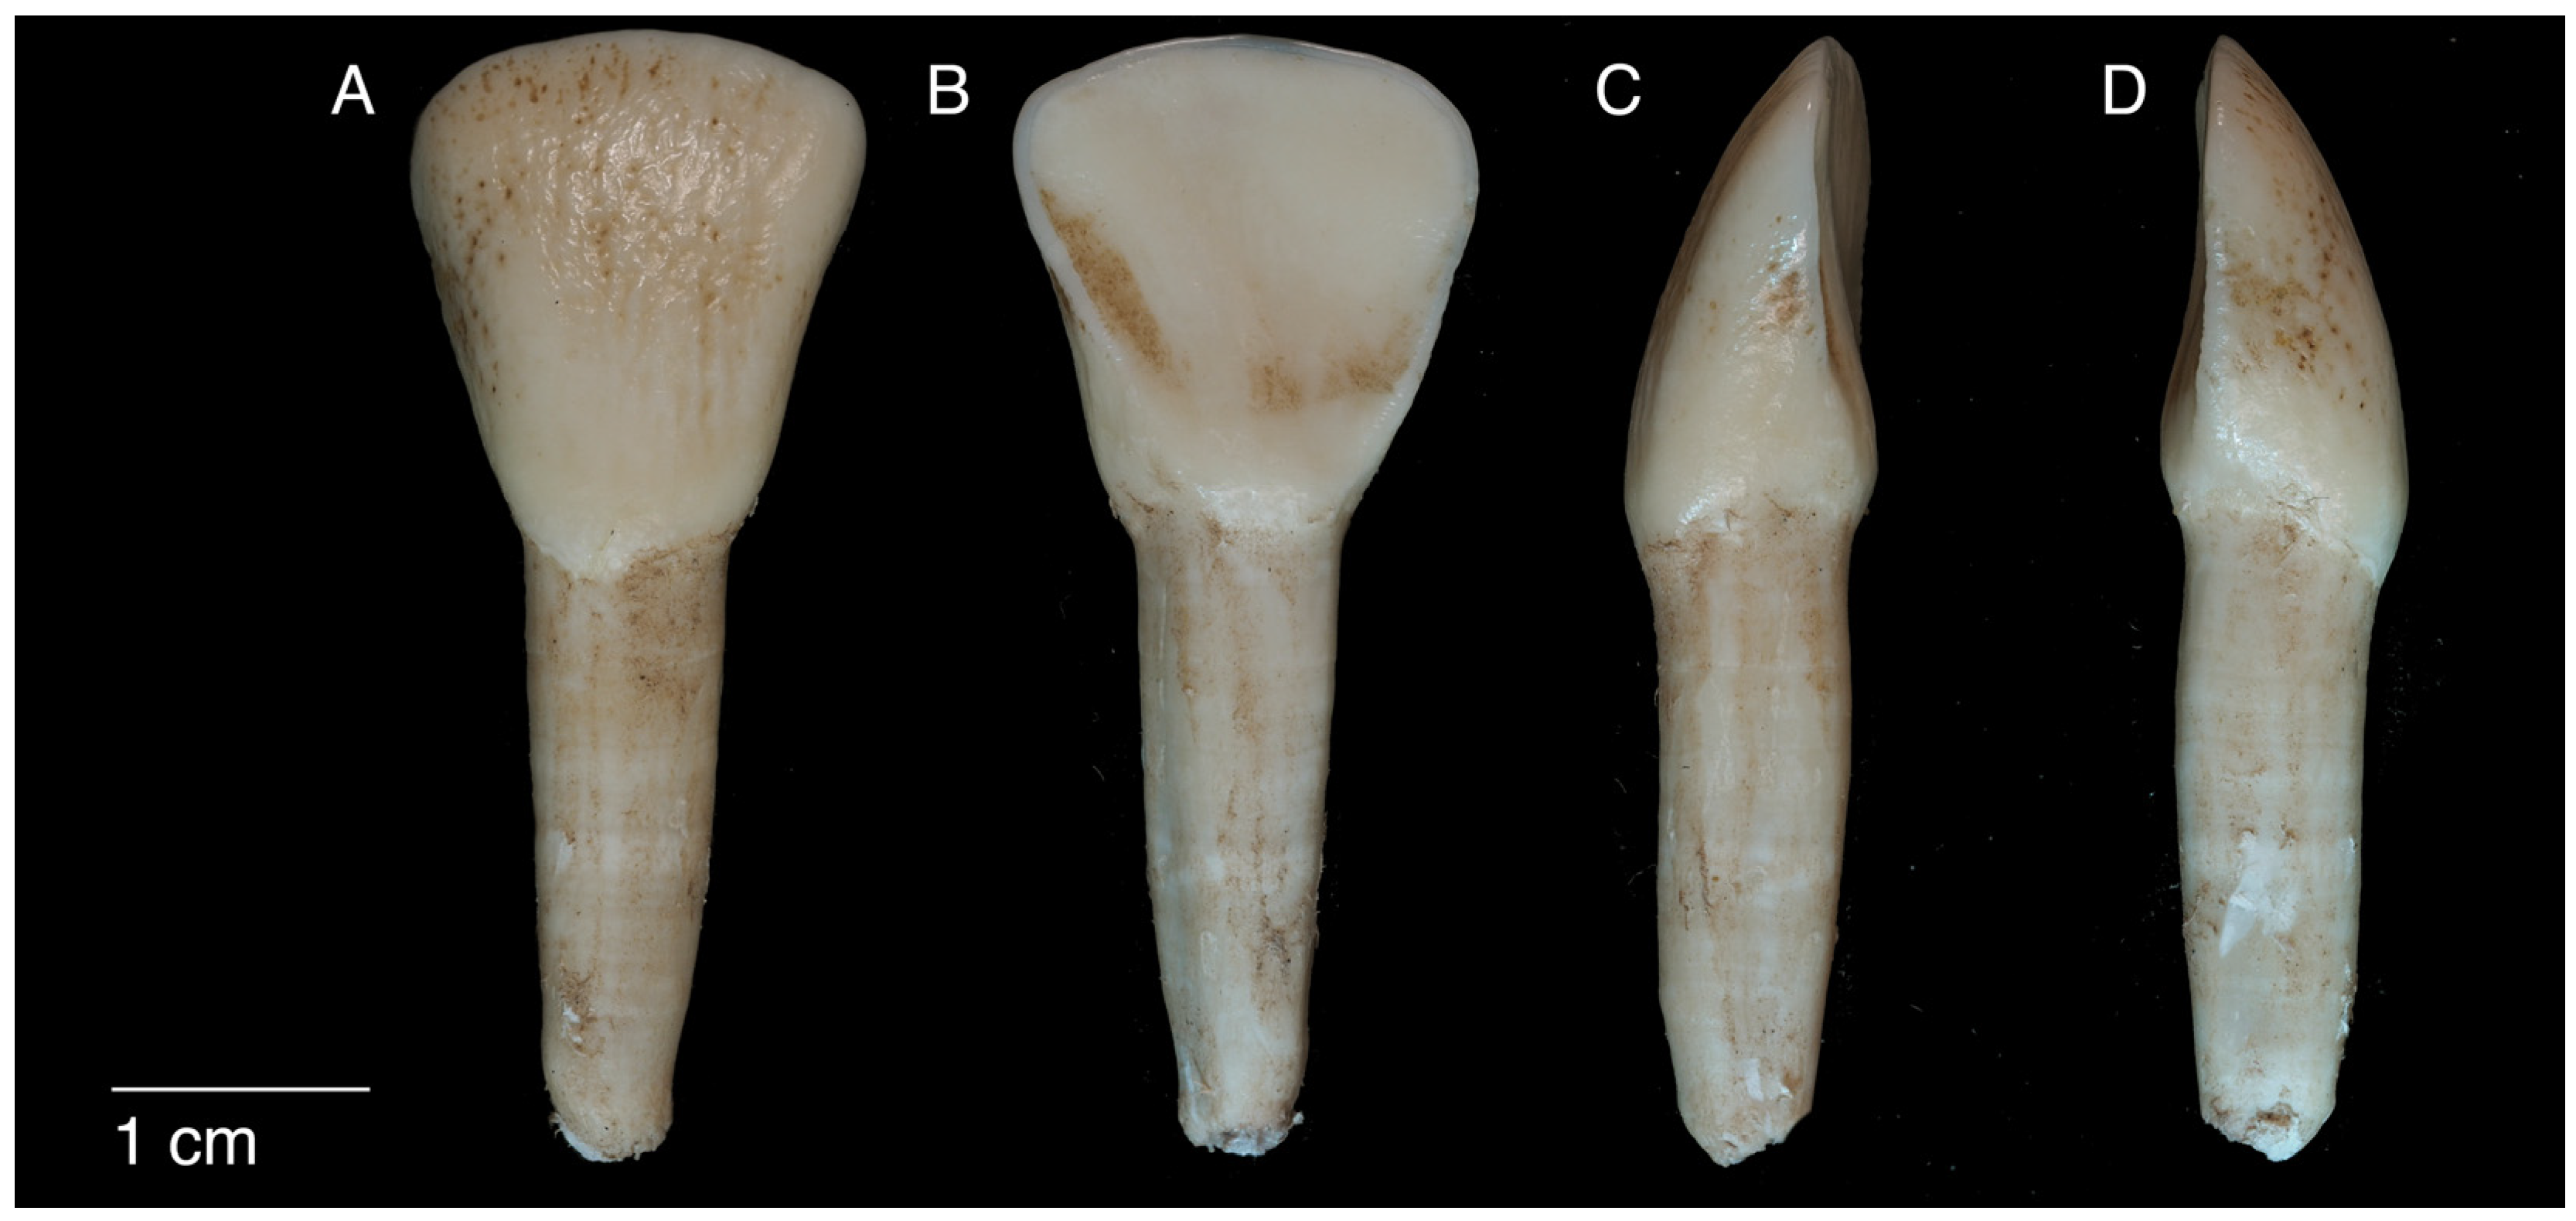
2.1. Sample Composition and Scanning

The sample comprised 30 bovine incisors obtained from a local slaughterhouse in Santiago de Chile (Figure 1). The study was approved by the Institutional Animal Care and Use Committee (CICUA) of the University of Chile, code 21526-FCS-UCH.
Each tooth was scanned by computed tomography to visualise the internal dental tissues. These images were employed to measure mineral density. Each incisor was mounted in a cylindrical sample holder (Bruker, Billerica, MA, USA) and fixed with polyethylene to prevent movement during scanning. The samples were scanned using a high-resolution desktop micro-CT system (SkyScan 1278, Bruker) with the following parameters: 588 µA, 65 kV, 38 W, 1 mm Al filter, a 50 µm voxel size, and a rotation step of 0.2° through 360°. The images were reconstructed using the NRecon v.1.6.9 software (Bruker). Analysis was performed with the MIMICS v.26 software (Materialise, Lovaina, Belgium).

2.2. Dental Mineral Density Measurement Protocol

2.2.1. Segments and Thresholds

Once the micro-CT files of a tooth were uploaded to the MIMICS software, the New Mask tool in the Segment menu was used. By manipulating the minimum and maximum HUs in the Threshold window, the enamel and dentine segments were generated, matching the maximum value of the second with the minimum of the first.

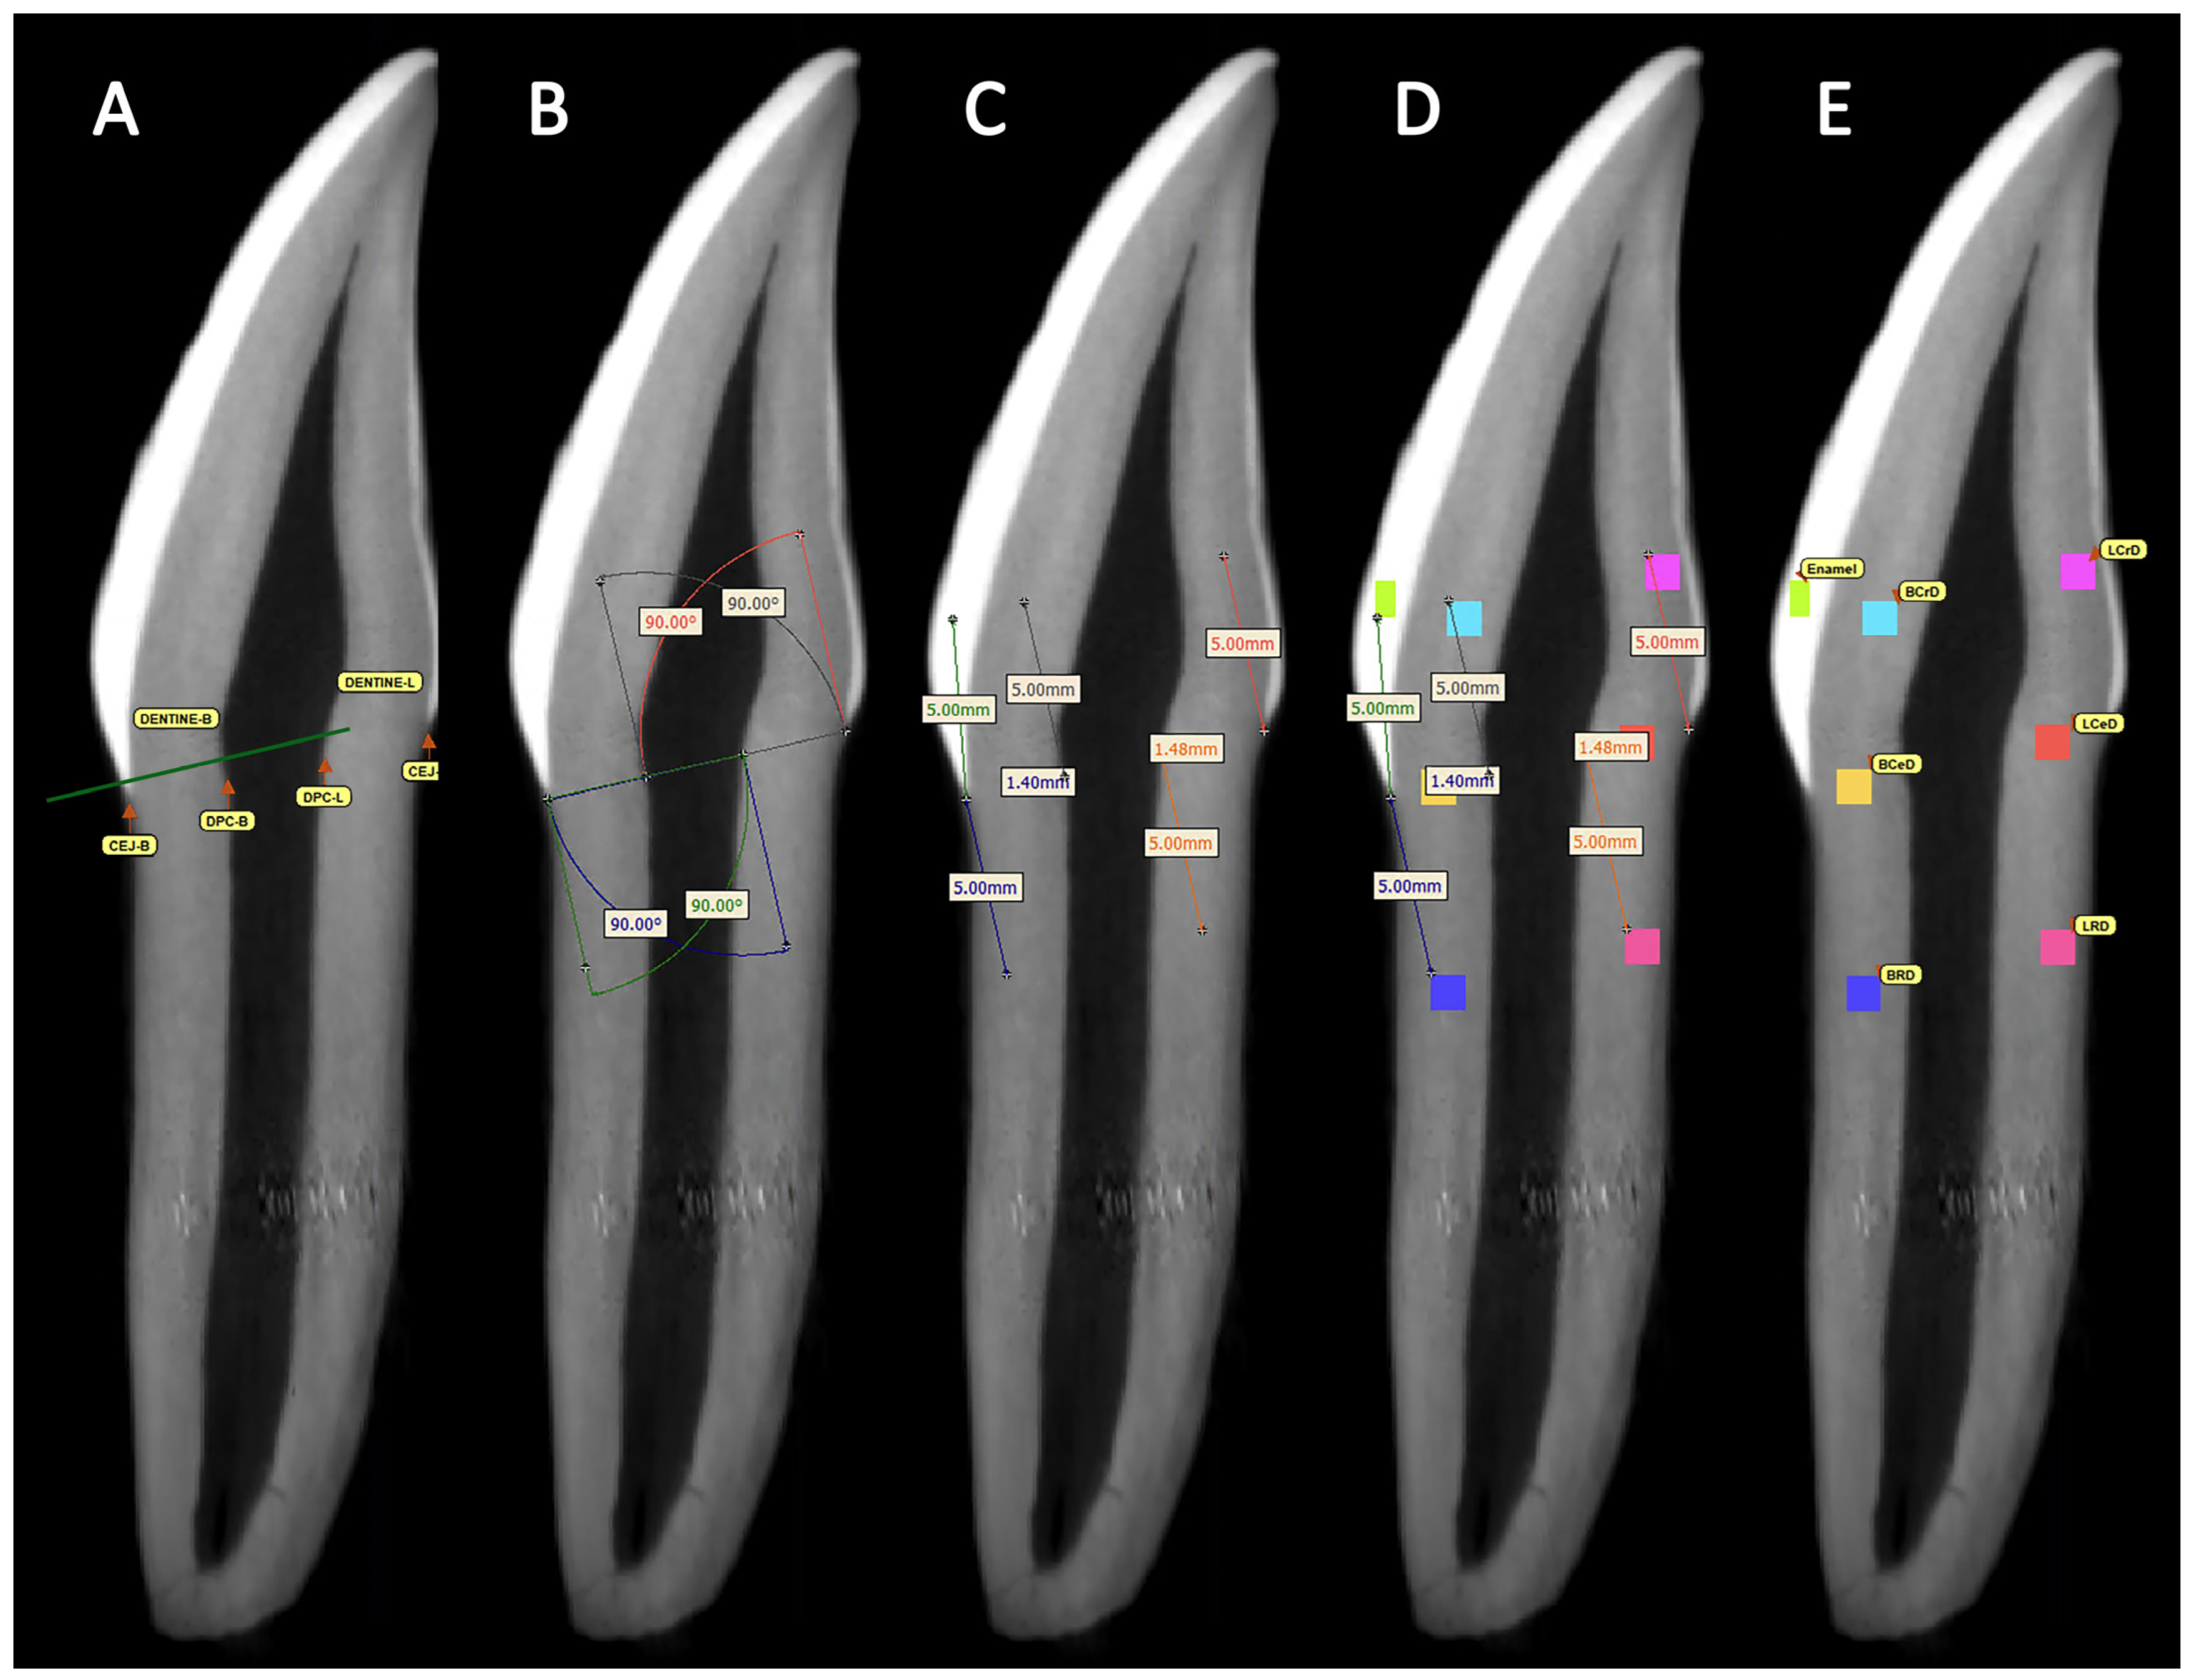
2.2.2. Reference Points

To standardise the location for mineral density measurements, reference points were established in the buccolingual view of the tooth due to the ease with which they are visualised and identified in micro-CT images, which ensures that the steps can be repeated. A frame from the medial third in which the dental tissues were clearly observed was used. With the Distance tool in the Measure tab, a line was drawn from buccal to lingual that joined the visible points of the cemento-enamel junction (CEJ). Following this line, four reference points were located from the limits of the dental tissues; these points were used for the subsequent steps to calculate crown and root dentine mineral density. To estimate cervical dentine mineral density, lines overlapping the CEJ that corresponded to the distance from the dentine to the tooth surface were generated. Due to the intention to evaluate the reproducibility of the mineral density measurements at different points of the tooth, the dentine was evaluated at points on its buccal and lingual surface, thus distinguishing both areas where the samples taken should have been located. Table 1 contains the descriptions of the four reference points and the two mentioned areas, and Figure 2A shows them.

2.2.3. Angles and Distances

Next, the Angle tool was used, and from the previously established reference points, right angles were generated for the dentine sections in the crown and root. Table 2 specifies the points and the order necessary to obtain the four angles (Figure 2B).
With the Distance tool, 5.00 mm was measured following the perpendicular lines to the CEJ formed by the angles. For the cervical dentine, lines were drawn corresponding to half the distance of Dentine-B and Dentine-L. For the enamel, 5.00 mm was drawn from the buccal CEJ point through the enamel in an incisal direction. Figure 2C shows the distances for taking the seven measurements.

2.2.4. Mineral Density Calculation

The New Mask tool was used in the Segment menu, manipulating the Threshold window with the minimum and maximum HUs already established and depending on the tooth tissue that was measured.
For the dentine, the limits of the segment were moved in both the buccolingual and mesiodistal views until obtaining a 0.98 × 0.98 mm square to generate a cube for the 3D calculation of mineral density. In the crown and root, the point of the 5.00 mm distances made previously coincided with the inciso-buccal vertex of the square, although variability in the size of the root sometimes forced the square to be moved so that it coincided with the incisal edge rather than the vertex. For the cervical area, the central point of the square coincided with that of the distance.
For the enamel, a 0.57 × 1.03 × 1.03 mm rectangular prism was generated; the distance generated previously was made to coincide with the cervical edge of the prism. The inciso-apical view was observed to ensure that the entire volume of the prism generated was within the correct dental tissue, moving it along its edge if necessary. Figure 2D shows the buccolingual view with the seven generated prisms and their distances from the CEJ. Figure 2E shows the buccolingual view with the prisms in the enamel and dentine for mineral density measurements.
Finally, in the Properties of the generated segments, the Average Value was obtained and recorded. Figure 3 shows the 3D reconstructed tooth with the prisms of the density measurement points.

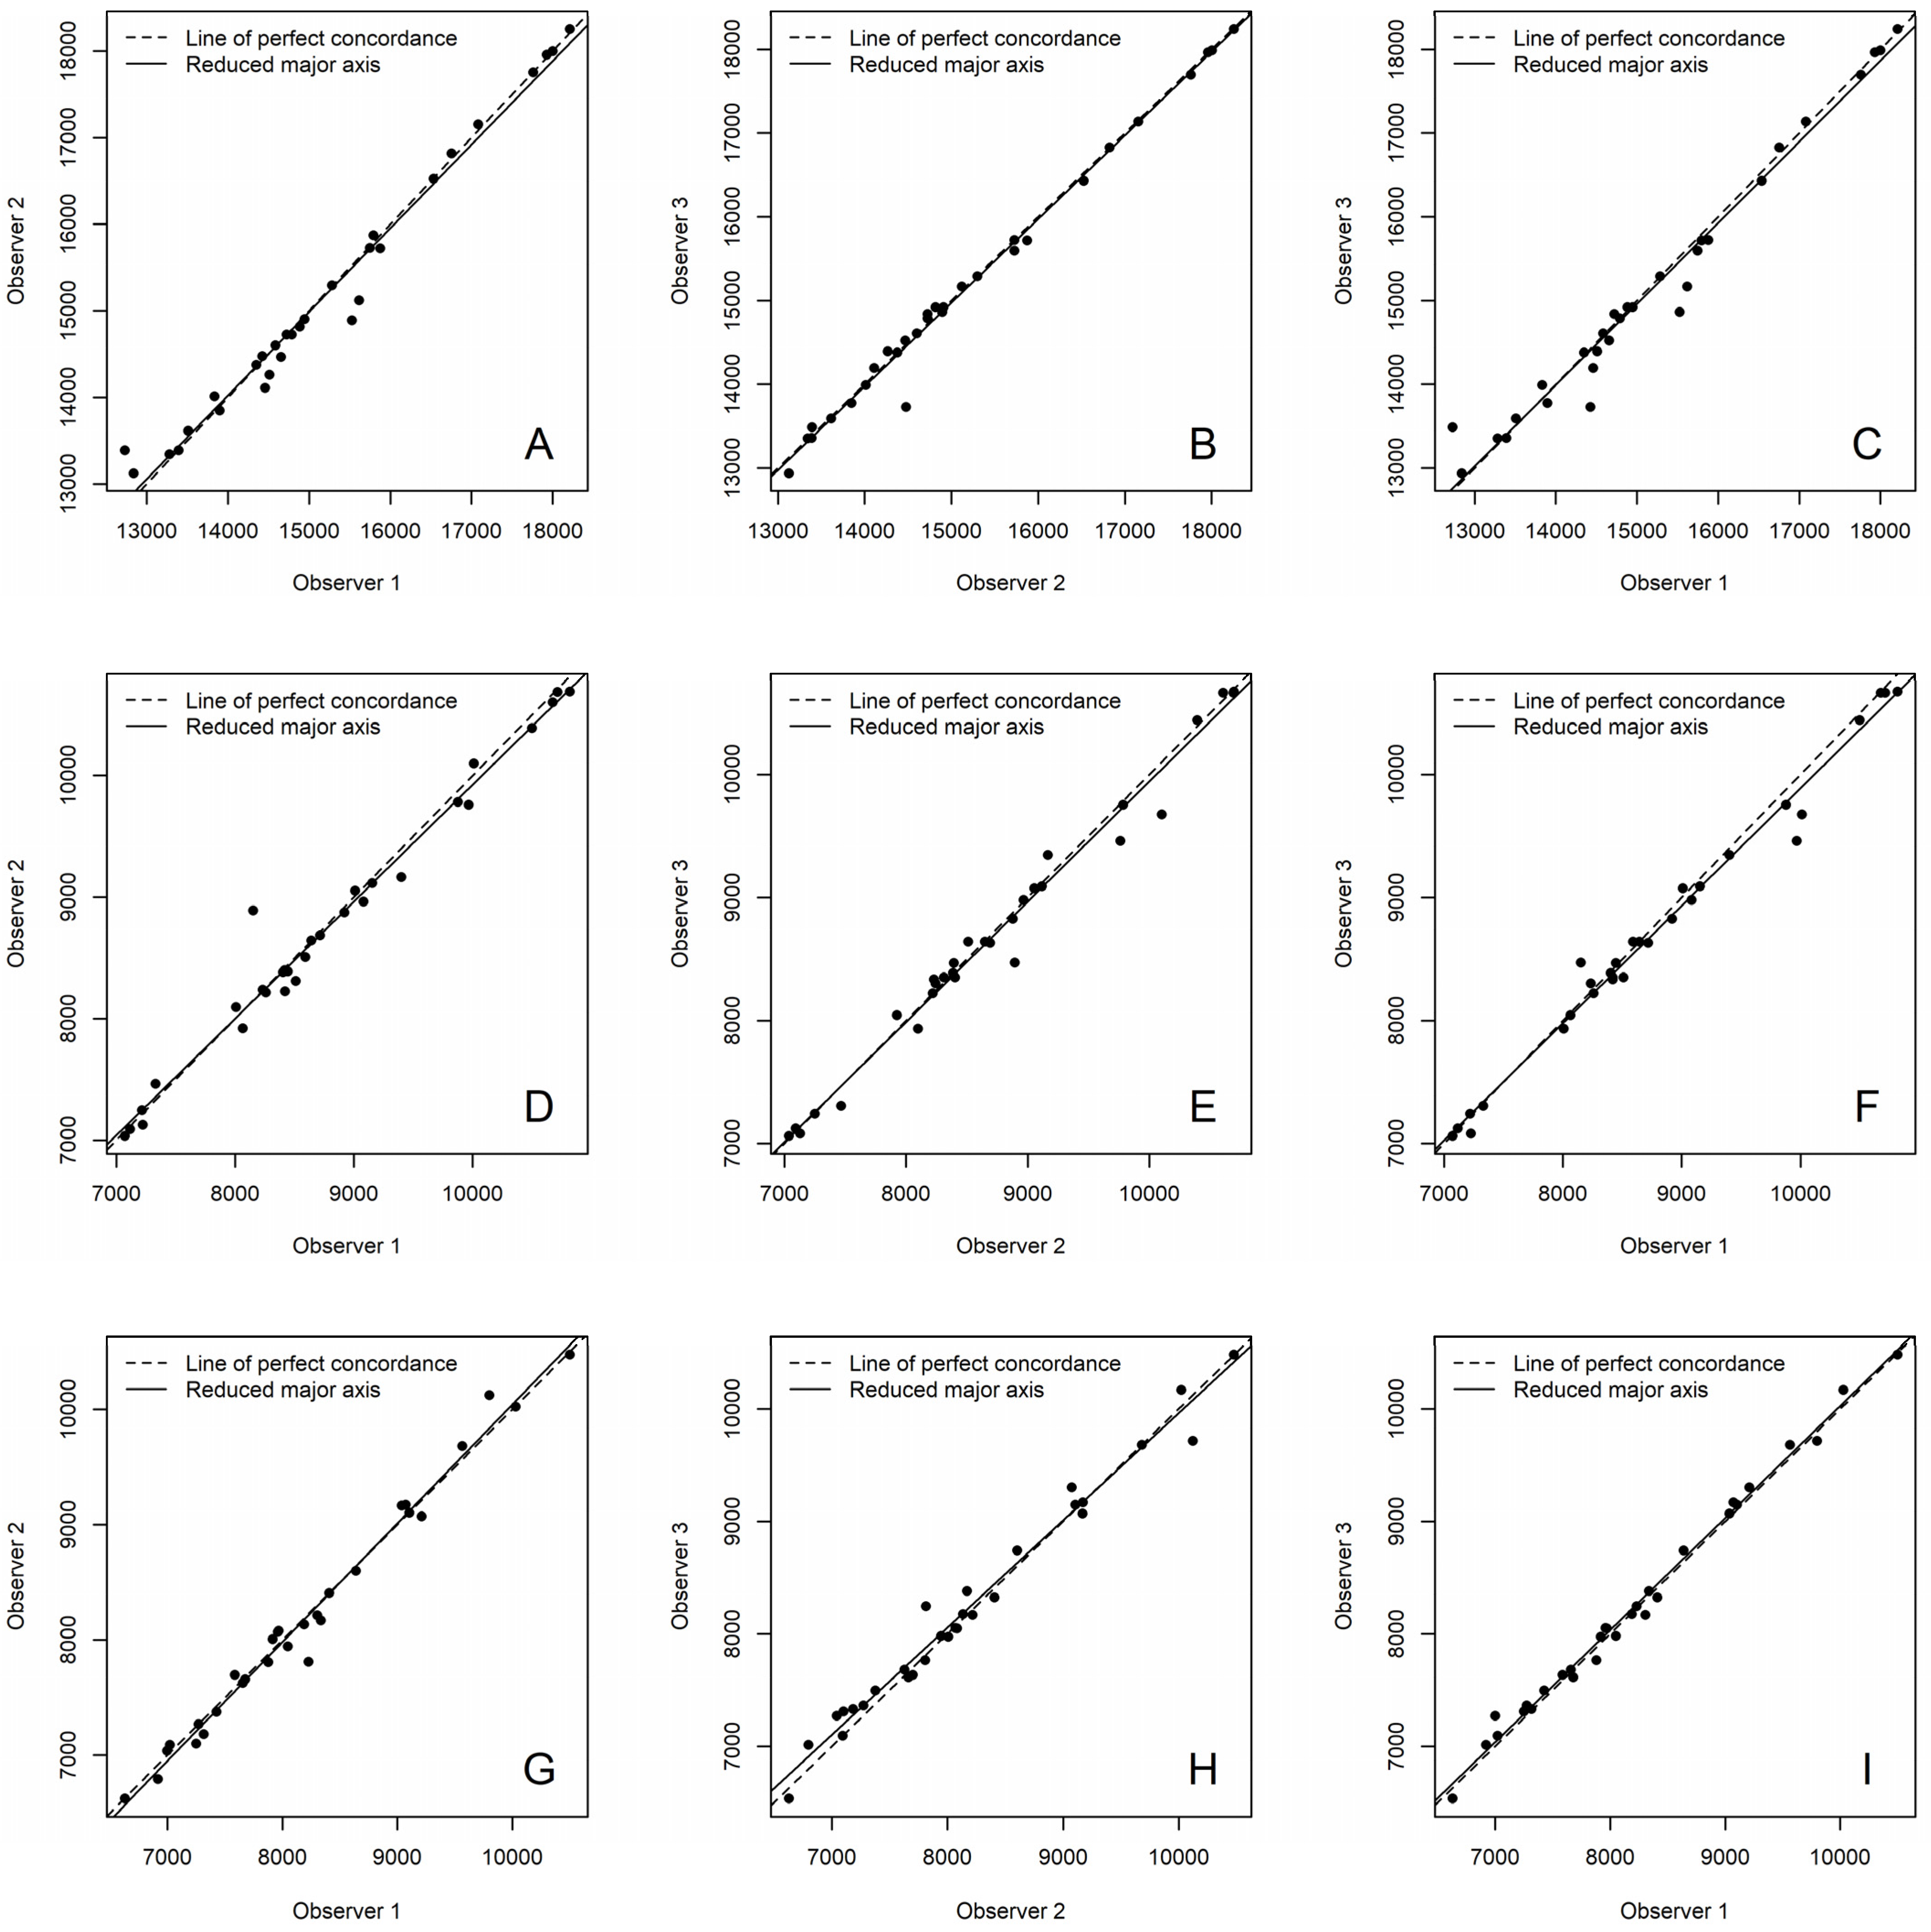
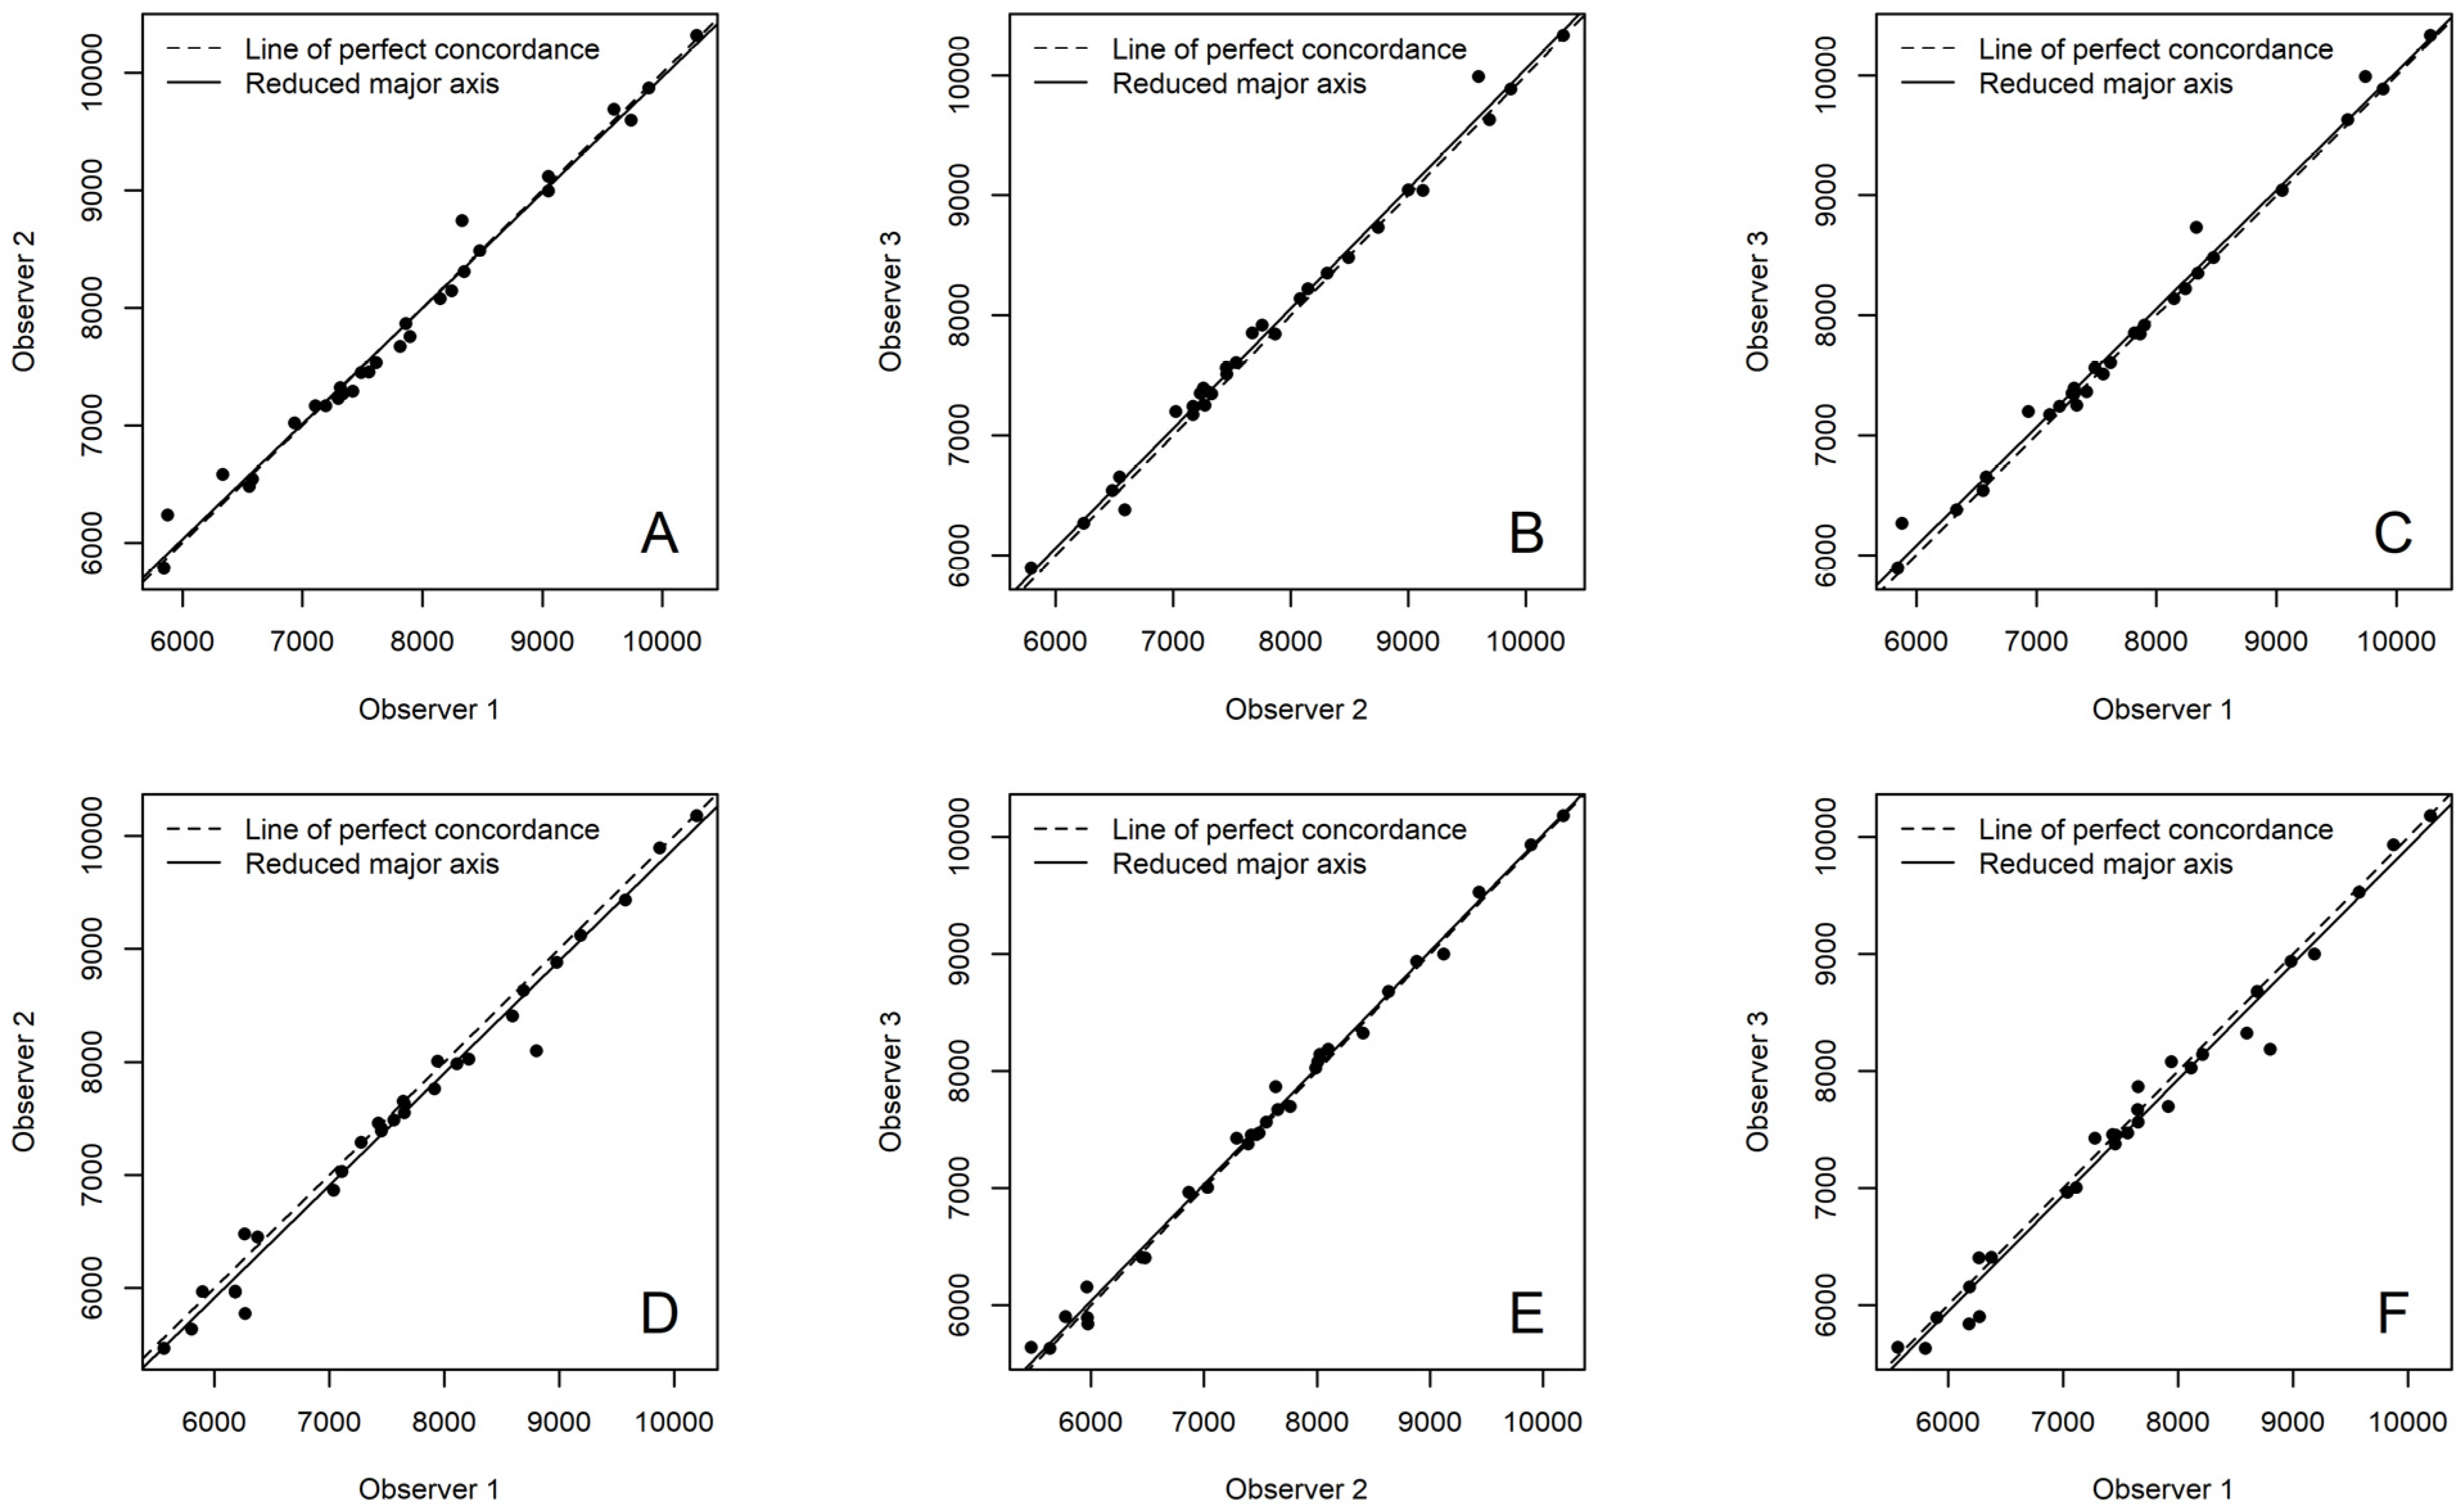
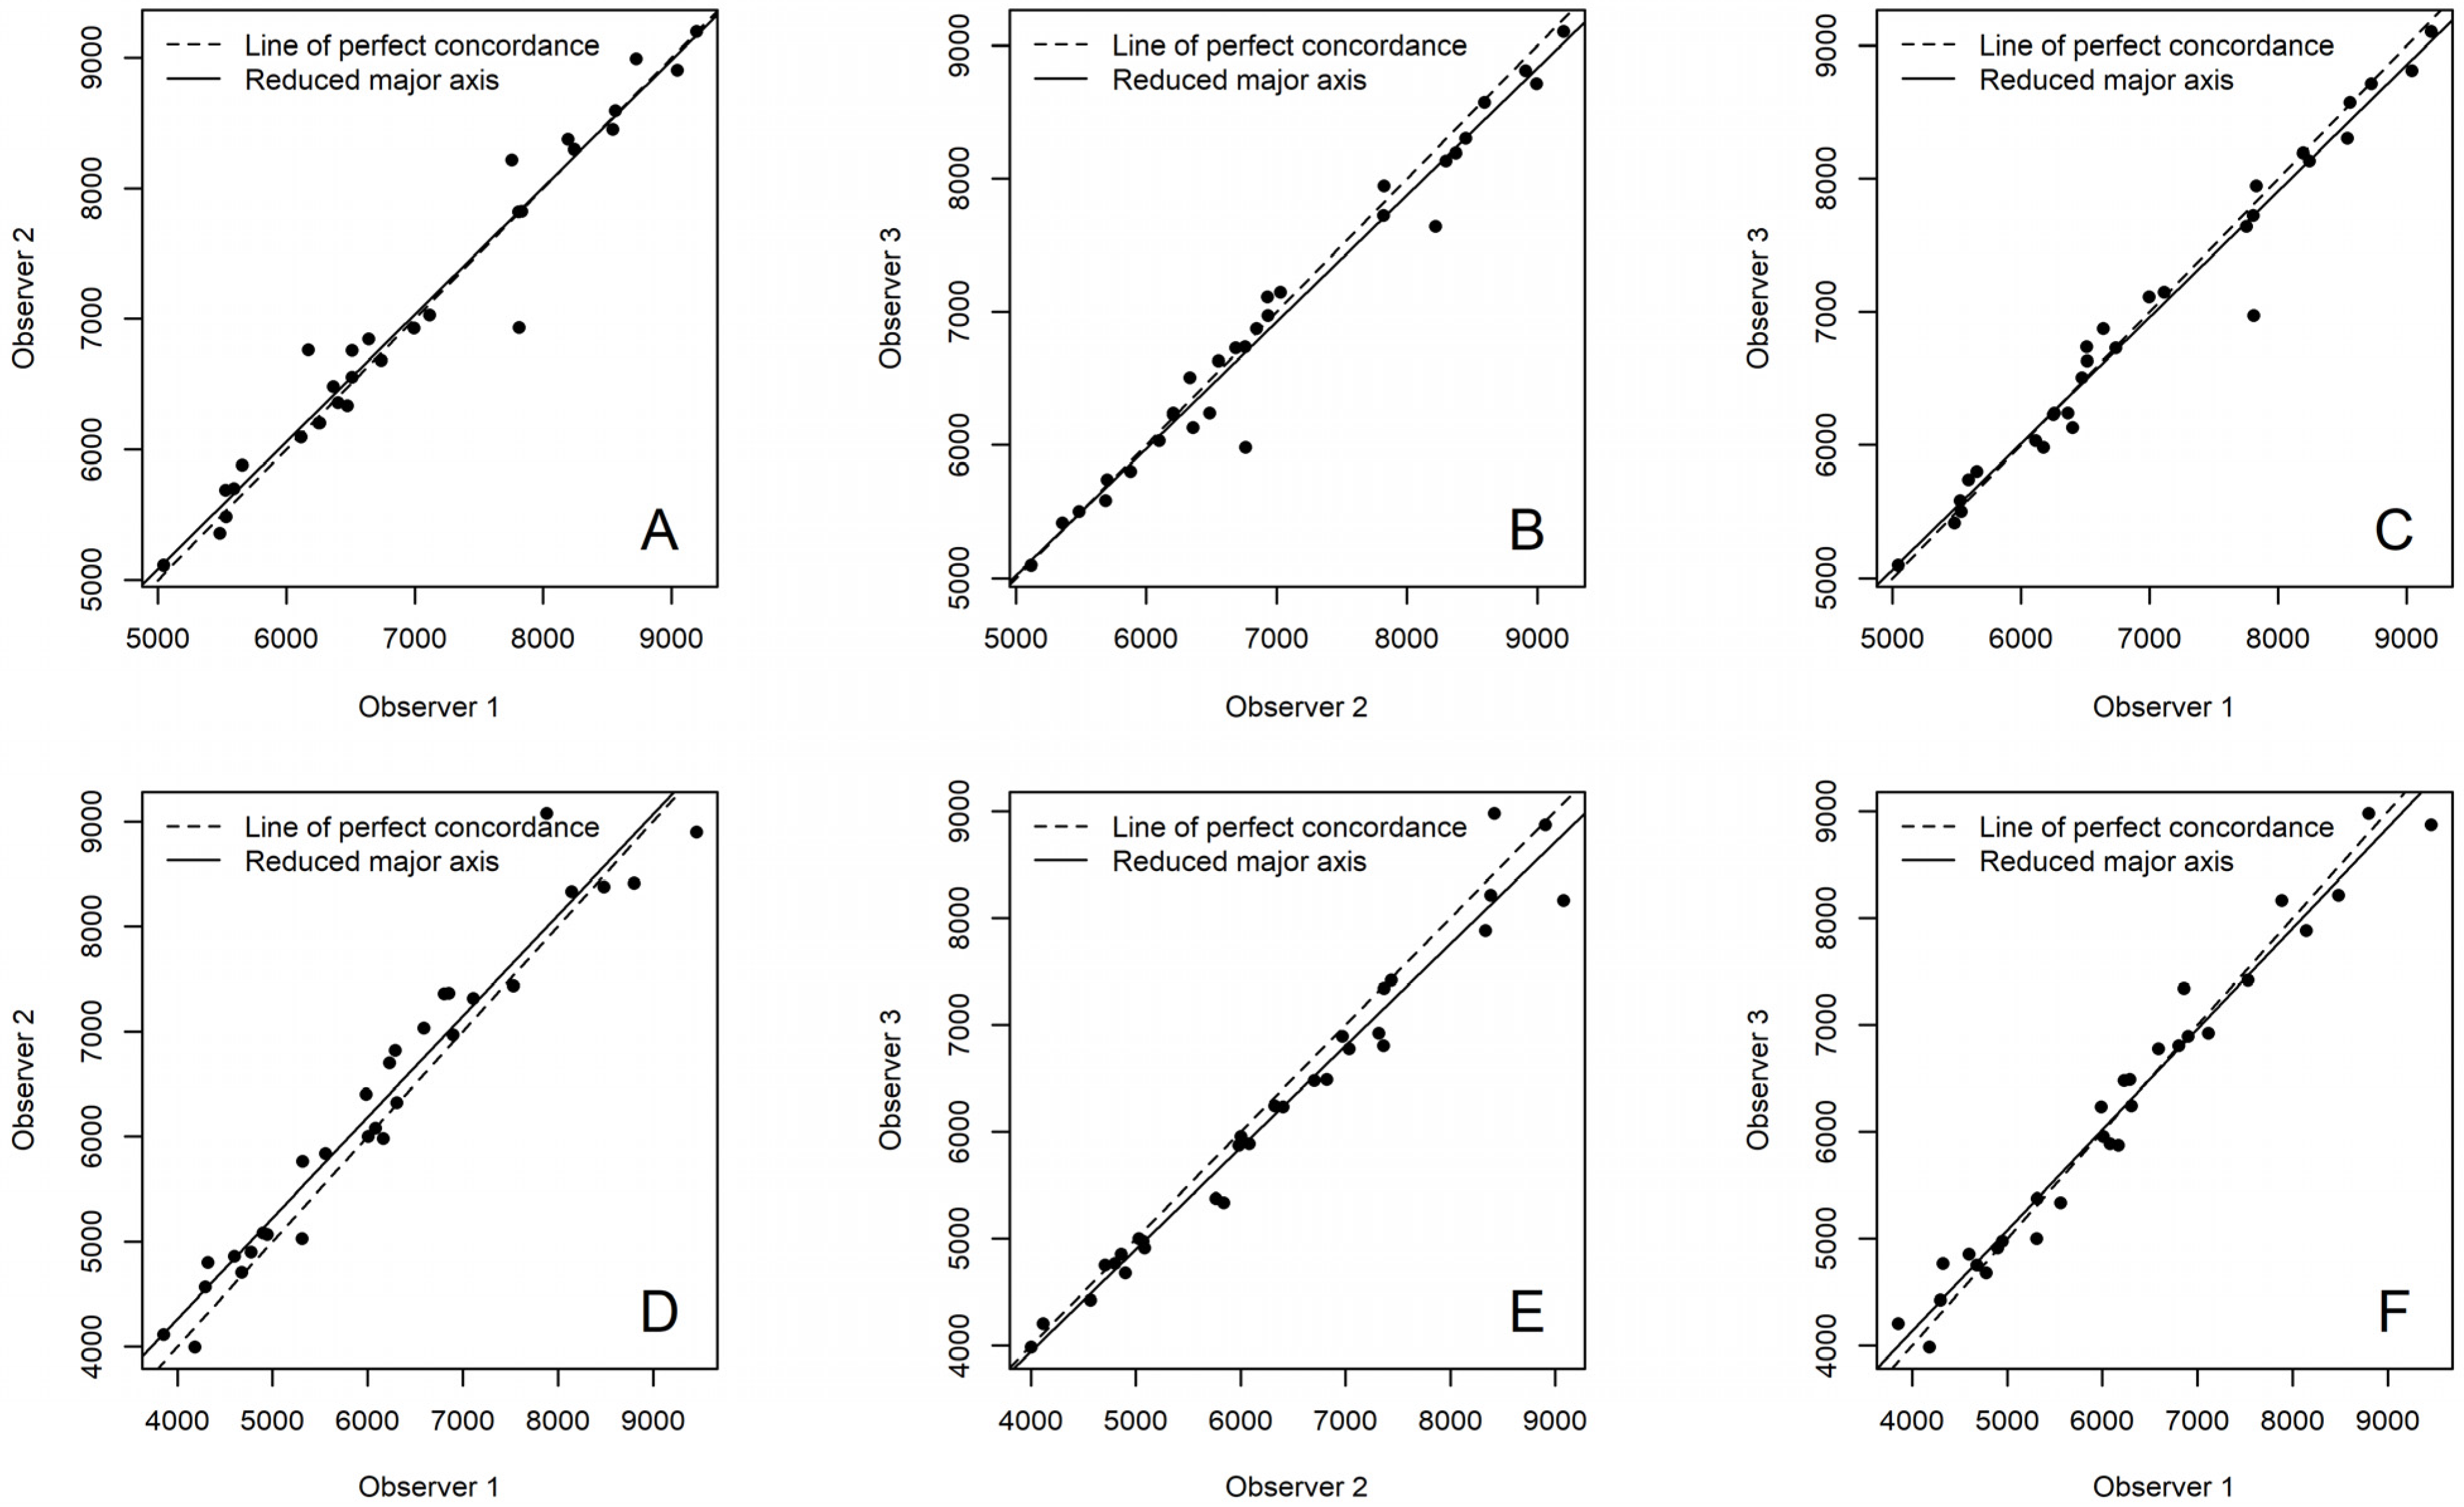
2.3. Statistical Analysis

Normality and equality of variances were assessed with the Shapiro–Wilk test and Levene’s test, respectively. Lin’s concordance correlation coefficient (CCC) [36] was calculated to evaluate the reproducibility of the measurements taken between the three observers: MHZ (Observer 1), SLL (Observer 2), and CCA (Observer 3).
The CCC estimates how well bivariate pairs of observations fit relative to another set of observations, based on the differences in the observations made by two observers and the measurements of both precision and accuracy [37]. Because the measurements of only two observers can be compared at a time, the CCC was estimated three times for each point where mineral density in the dentine and enamel was estimated. Due to the continuous character of the variable, the interpretation regarding the degree of agreement proposed by McBride [38] was used: <0.90, poor; 0.90–0.95, moderate; 0.95–0.99, substantial; and >0.99, almost perfect. Scatter plots were generated to illustrate the results.
All statistical analyses and graphs were generated using RStudio software version 2023.9.1.494, with the “DescTools” package version 0.99.54.

3. Results

Based on the Shapiro–Wilk test and Levene’s test results, the normality and equality of variances of the data could be assumed. According to McBride [38], the CCCs indicated substantial to almost perfect agreement. Table 3 shows the values obtained for each CCC test with details of the enamel and dentine sectors and the comparisons between the observers. All the values were similar.
The reproducibility of the method used on the crown showed substantial to almost perfect agreement for the enamel (CCC = 0.986–0.995). For the dentine, the CCCs for the measurements taken on the buccal side (CCC = 0.993–0.995; almost perfect) were slightly higher than the CCCs for the measurements taken on the lingual side (CCC = 0.987–0.991; substantial to almost perfect). Figure 4 shows the scatter plots of these data. For the cervical area, the highest CCCs were concentrated, with the best on the buccal side (CCC = 0.993–0.995; almost perfect) followed by the lingual side (CCC = 0.987–0.997; substantial to almost perfect). Figure 5 shows the scatter plots of these data.
The lowest agreement was found in the root. Although there were lower CCCs for the measurements taken on the buccal side (CCC = 0.979–0.985; substantial) than for the measurements taken on the lingual side (CCC = 0.965–0.995; substantial to almost perfect), the range of CCCs for the measurements taken on the buccal side was narrower than that of the measurements taken on the lingual side (Figure 6).
Finally, when comparing all the results, the highest and most similar CCCs occurred for the measurements taken on the buccal side. Similarly, the highest and most similar CCCs occurred for the measurements taken in the cervical area, followed by the crown (including enamel and dentine) and, finally, the root. However, these differences did not translate into relevant changes in the agreement categories; so, it can be assumed that the methods proposed to estimate enamel and dentine density at different points are replicable and reliable.

4. Discussion

Since the development of micro-CT systems, their usefulness has been demonstrated in a wide variety of applications in dental research [11]. The widespread use of micro-CT in dental studies has led to the development of standardised image acquisition protocols that can be applied to images taken with different technologies. One of the main aims of these protocols is reproducibility; thus, many authors, including us, have focused on demonstrating high degrees of agreement between measurements by different observers. Slagter et al. [39] developed a reliable and reproducible protocol to measure implant bone thickness based on CBCT images. They found a high level of agreement between observers. Likewise, Curi et al. [40] tested a protocol to enable the comparison of antemortem periapical radiographs with images extracted from postmortem CBCT exams through one angle, linear measurements, and the proportion between these distances. They reported a high level of reproducibility. Kochhar et al. [41] calculated the volume of the cleft region using the Osirix Dicom Viewer and reported a nonsignificant difference in bone volumetric measurements between observers.
This protocol uses HUs, and it is important to acknowledge an ongoing debate: Obtaining HUs from grey levels has not been sufficiently studied [42], and researchers must assume that there is a constant correlation between both [43]. Of note, Genisa et al. [44] analysed mineral density that was estimated based on the HUs of CBCT images and determined from measurements in parts of the jaw and tooth. Even recognising these aforementioned limitations, the authors verified the repeatability of the method, denoted by a high degree of agreement. Hence, we can deduce that HUs are comparable and allow us to evaluate the reproducibility of our proposed protocol to establish sectors to estimate density.
Although the calculated CCCs demonstrated the high concordance of the proposed measurement method, there were important differences between the measurement points. For enamel, given its thickness in the teeth we assessed, this proposal allows the movement of the position of the generated prisms to assess external or internal layers of the tissue. For dentine, the lowest CCCs on the lingual surface can be related to more pronounced differences between its layers compared with the buccal surface. There are more dentinal tubules in the crown, and their number is reduced toward the apex [45]. Moreover, the layers closest to the pulp chamber are denser than the middle and outer ones, particularly in the crown, where there is a significant increase from the middle to the internal layer near the pulp [46,47]. Given these differences in density, the choice of the exact frame from which to begin working to establish the reference points can affect the density values obtained, which may explain the lower concordance in the crown area compared with the cervical area. The root results were the least concordant. A possible explanation is the narrowness of the sampling area, which forced us to increase the flexibility of the cube position and could have increased the differences between the observers.
Despite these limitations, this proposal produced results with high levels of concordance. This outcome can be explained by the ability of micro-CT to provide structural information of objects and to allow morphometric reconstructions, which are advantageous for analysis of volumes and densities compared with other instruments such as radiographs [48]. In other words, because the differences in density in dental tissues seem to be due to the formation and arrangement of the layers that comprise them, a 2D method that allows an estimation of the density of a single layer would be less effective than one that covers a set of layers.
Although the agreement results can be attributed to the characteristics of bovine teeth, there do not seem to be morphological differences in the composition of enamel, dentine, and cementum between bovine and human teeth [49,50,51]. Moreover, physical properties such as composition, enamel diameter, and dentinal tubule diameter are similar between the species [52,53,54]. Although this image acquisition protocol was validated in bovine teeth, it could be applied to human teeth with a simple adaptation of the applied dimensions, as well as other dental research that employs detailed methods and protocols to investigate abrasion and erosion [55,56,57], colour and bleaching [58,59,60], and bond strength [61,62] using bovine teeth.
This protocol can be used on incisors as they are the most similar in morphology to the bovine incisors used in the present study. The aim of developing a measurement protocol based on angles is to enable its adaptation to other types of teeth. However, this adaptability was not assessed in the present study. The present study utilised the buccolingual view of a transverse section because it provides a better visualisation of the dental tissues. However, due to the lack of information regarding the protocol’s functionality in a mesiodistal view, we cannot fully confirm its adaptability to this view.

5. Conclusions

This study has shown the reproducibility of the proposed standardised protocol to quantify mineral density using volumetric measurements based on micro-CT images at different points of enamel and dentine. We recorded the highest CCCs in the enamel (CCC = 0.986–0.995) and buccal dentine (CCC = 0.987–0.995) and the lowest CCCs in the root dentine (CCC = 0.965–0.985). This phenomenon can likely be attributed to the layered formation of dental tissues and the requisite flexibility in the narrow regions that allows the protocol to be implemented effectively. Nevertheless, all the evaluated points achieved substantial to almost perfect agreement, thereby demonstrating the robustness and reproducibility of the proposed protocol.

Author Contributions

Conceptualization, M.H.-Z., C.C.-A., G.M.F. and S.L.-L.; methodology, M.H.-Z., C.C.-A. and S.L.-L.; validation, M.H.-Z., C.C.-A. and S.L.-L.; formal analysis, C.C.-A.; investigation, M.H.-Z., C.C.-A. and S.L.-L.; resources, S.L.-L.; data curation, M.H.-Z., C.C.-A. and S.L.-L.; writing—original draft preparation, M.H.-Z., C.C.-A., G.M.F. and S.L.-L.; writing—review and editing, M.H.-Z., C.C.-A., G.M.F. and S.L.-L.; visualization, M.H.-Z., C.C.-A. and S.L.-L.; supervision, S.L.-L.; project administration, S.L.-L.; funding acquisition, M.H.-Z. and S.L.-L. All authors have read and agreed to the published version of the manuscript.

Funding

This research was supported in part by the Agencia Nacional de Investigación y Desarrollo (ANID) of Chile, through the project ANID FONDECYT 1211534, and ANID-Subdirección de Capital Humano/Magíster Nacional/2023-22230119.

Institutional Review Board Statement

The animal study protocol was approved by the Institutional Animal Care and Use Committee (CICUA) of the University of Chile, code 21526-FCS-UCH.

Informed Consent Statement

Not applicable.

Data Availability Statement

The original contributions presented in the study are included in the article, further inquiries can be directed to the corresponding author.

Acknowledgments

The authors are grateful for the technical support of the Bio-CT Laboratory of the Faculty of Dentistry of the University of Chile for scanning the samples using micro-CT technology.

Conflicts of Interest

The authors declare no conflicts of interest.

References

  1. Holmes, J.; Akkinepalli, R. Computed Tomography versus Plain Radiography to Screen for Cervical Spine Injury: A Meta-Analysis. J. Trauma Inj. Infect. Crit. Care 2005, 58, 902–905. [Google Scholar] [CrossRef] [PubMed]
  2. Davis, G.; Evershed, A.; Mills, D. Quantitative High Contrast X-Ray Microtomography for Dental Research. J. Dent. 2013, 41, 475–482. [Google Scholar] [CrossRef] [PubMed]
  3. Beck, J. What Is the Future of Imaging in Forensic Practice? Radiography 2011, 17, 212–217. [Google Scholar] [CrossRef]
  4. Bibliowicz, J.; Khan, A.; Agur, A.; Singh, K. High-Precision Surface Reconstruction of Human Bones from Point-Sampled Data; Autodesk Inc.: San Francisco, CA, USA, 2011; pp. 1–10. [Google Scholar]
  5. Kim, I.; Paik, K.; Lee, S. Quantitative Evaluation of the Accuracy of Micro-Computed Tomography in Tooth Measurement. Clin. Anat. 2007, 20, 27–34. [Google Scholar] [CrossRef] [PubMed]
  6. Balto, K.; Muller, R.; Carrington, D.; Dobeck, J.; Stashenko, P. Quantification of Periapical Bone Destruction in Mice by Micro-Computed Tomography. J. Dent. Res. 2000, 79, 35–40. [Google Scholar] [CrossRef] [PubMed]
  7. Grande, N.; Plotino, G.; Gambarini, G.; Testarelli, L.; D’Ambrosio, F.; Pecci, R.; Bedini, R. Present and Future in the Use of Micro-CT Scanner 3D Analysis for the Study of Dental and Root Canal Morphology. Ann. Ist. Super. Sanità 2012, 48, 26–34. [Google Scholar]
  8. Marca, C.; Dummer, P.; Bryant, S.; Vier-Pelisser, F.; Só, M.; Fontanella, V.; Dutra, V.; de Figueiredo, J. Three-Rooted Premolar Analyzed by High-Resolution and Cone Beam CT. Clin. Oral Investig. 2013, 17, 1535–1540. [Google Scholar] [CrossRef]
  9. Shaheen, E.; Khalil, W.; Ezeldeen, M.; Van de Casteele, E.; Sun, Y.; Politis, C.; Jacobs, R. Accuracy of Segmentation of Tooth Structures Using 3 Different CBCT Machines. Oral Surg. Oral Med. Oral Pathol. Oral Radiol. 2017, 123, 123–128. [Google Scholar] [CrossRef]
  10. Paqué, F.; Laib, A.; Gautschi, H.; Zehnder, M. Hard-Tissue Debris Accumulation Analysis by High-Resolution Computed Tomography Scans. J. Endod. 2009, 35, 1044–1047. [Google Scholar] [CrossRef]
  11. Swain, M.; Xue, J. State of the Art of Micro-CT Applications in Dental Research. Int. J. Oral Sci. 2009, 1, 177–188. [Google Scholar] [CrossRef]
  12. Martin-Frances, L.; Martinoon-Torres, M.; Martínez de Pinillos, M.; Garcia-Campos, C.; Modesto-Mata, M.; Zanolli, C.; Rodrguez, L.; De Castro, J.M.B. Tooth Crown Tissue Proportions and Enamel Thickness in Early Pleistocene Homo Antecessor Molars (Atapuerca, Spain). PLoS ONE 2018, 13, e0203334. [Google Scholar] [CrossRef] [PubMed]
  13. Fernée, C.; Zakrzewski, S.; Robson Brown, K. Dimorphism in Dental Tissues: Sex Differences in Archaeological Individuals for Multiple Tooth Types. Am. J. Phys. Anthropol. 2021, 175, 106–127. [Google Scholar] [CrossRef] [PubMed]
  14. García-Campos, C.; Martinón-Torres, M.; Martín-Francés, L.; Martínez de Pinillos, M.; Modesto-Mata, M.; Perea-Pérez, B.; Zanolli, C.; Labajo González, E.; Sánchez Sánchez, J.A.; Ruiz Mediavilla, E.; et al. Contribution of Dental Tissues to Sex Determination in Modern Human Populations. Am. J. Phys. Anthropol. 2018, 166, 459–472. [Google Scholar] [CrossRef] [PubMed]
  15. García-Campos, C.; Martinón-Torres, M.; Martínez de Pinillos, M.; Modesto-Mata, M.; Martín-Francés, L.; Perea-Pérez, B.; Zanolli, C.; Bermúdez de Castro, J.M. Modern Humans Sex Estimation through Dental Tissue Patterns of Maxillary Canines. Am. J. Phys. Anthropol. 2018, 167, 914–923. [Google Scholar] [CrossRef] [PubMed]
  16. Hernández-Vázquez, R.; Urriolagoitia-Sosa, G.; Marquet-Rivera, R.; Romero-Ángeles, B.; Mastache-Miranda, O.; Vázquez-Feijoo, J.; Urriolagoitia-Calderón, G. High-Biofidelity Biomodel Generated from Three-Dimensional Imaging (Cone-Beam Computed Tomography): A Methodological Proposal. Comput. Math. Methods Med. 2020, 2020, 1–14. [Google Scholar] [CrossRef] [PubMed]
  17. Harris, S.P.; Bowles, W.R.; Fok, A.; McClanahan, S.B. An Anatomic Investigation of the Mandibular First Molar Using Micro-Computed Tomography. J. Endod. 2013, 39, 1374–1378. [Google Scholar] [CrossRef]
  18. Tomaszewska, I.M.; Leszczyński, B.; Wróbel, A.; Gładysz, T.; Duncan, H.F. A Micro-Computed Tomographic (Micro-CT) Analysis of the Root Canal Morphology of Maxillary Third Molar Teeth. Ann. Anat. 2018, 215, 83–92. [Google Scholar] [CrossRef]
  19. Puwanun, S.; Delaine-Smith, R.; Colley, H.; Yates, J.; MacNeil, S.; Reilly, G. A Simple Rocker-Induced Mechanical Stimulus Upregulates Mineralization by Human Osteoprogenitor Cells in Fibrous Scaffolds. J. Tissue Eng. Regen. Med. 2018, 12, 370–381. [Google Scholar] [CrossRef] [PubMed]
  20. Hong, J.; Kim, U.; Yeo, I. Comparison of Three-Dimensional Digital Analyses and Two-Dimensional Histomorphometric Analyses of the Bone-Implant Interface. PLoS ONE 2022, 17, e0276269. [Google Scholar] [CrossRef]
  21. Rawson, S.; Maksimcuka, J.; Withers, P.; Cartmell, S. X-Ray Computed Tomography in Life Sciences. BMC Biol. 2020, 18, 21. [Google Scholar] [CrossRef]
  22. Dowker, S.; Davis, G.; Elliott, J. X-Ray Microtomography: Nondestructive Three-Dimensional Imaging for in Vitro Endodontic Studies. Oral Surg. Oral Med. Oral Pathol. Oral Radiol. Endod. 1997, 83, 510–516. [Google Scholar] [CrossRef] [PubMed]
  23. Efeoglu, N.; Wood, D.; Efeoglu, C. Microcomputerised Tomography Evaluation of 10% Carbamide Peroxide Applied to Enamel. J. Dent. 2005, 33, 561–567. [Google Scholar] [CrossRef] [PubMed]
  24. Efeoglu, N.; Wood, D.J.; Efeoglu, C. Thirty-Five Percent Carbamide Peroxide Application Causes in Vitro Demineralization of Enamel. Dent. Mater. 2007, 23, 900–904. [Google Scholar] [CrossRef] [PubMed]
  25. Peariasamy, K.; Anderson, P.; Brook, A. A Quantitative Study of the Effect of Pumicing and Etching on the Remineralisation of Enamel Opacities. Int. J. Paediatr. Dent. 2001, 11, 193–200. [Google Scholar] [CrossRef] [PubMed]
  26. Naitoh, M.; Hirukawa, A.; Katsumata, A.; Ariji, E. Evaluation of Voxel Values in Mandibular Cancellous Bone: Relationship between Cone-Beam Computed Tomography and Multislice Helical Computed Tomography. Clin. Oral Implant. Res. 2009, 20, 503–506. [Google Scholar] [CrossRef]
  27. Silva, I.M.; De Freitas, D.; Ambrosano, G.; Bóscolo, F.; Almeida, S. Bone Density: Comparative Evaluation of Hounsfield Units in Multislice and Cone-Beam Computed Tomography. Braz. Oral Res. 2012, 26, 550–556. [Google Scholar] [CrossRef] [PubMed]
  28. Heddleston, J.M.; Aaron, J.S.; Khuon, S.; Chew, T.L. A Guide to Accurate Reporting in Digital Image Acquisition—Can Anyone Replicate Your Microscopy Data? J. Cell Sci. 2021, 134, jcs254144, Erratum in J. Cell Sci. 2021, 134, jcs258933. [Google Scholar] [CrossRef] [PubMed]
  29. Kupitz, D.; Wissel, H.; Wuestemann, J.; Bluemel, S.; Pech, M.; Amthauer, H.; Kreissl, M.C.; Grosser, O.S. Optimization of SPECT/CT Imaging Protocols for Quantitative and Qualitative 99mTc SPECT. EJNMMI Phys. 2021, 8, 1–14. [Google Scholar] [CrossRef]
  30. Arango-Santander, S.; Montoya, C.; Pelaez-Vargas, A.; Ossa, E. Chemical, Structural and Mechanical Characterization of Bovine Enamel. Arch. Oral Biol. 2020, 109, 104573. [Google Scholar] [CrossRef]
  31. Camargo, M.; Marques, M.; de Cara, A. Morphological Analysis of Human and Bovine Dentine by Scanning Electron Microscope Investigation. Arch. Oral Biol. 2008, 53, 105–108. [Google Scholar] [CrossRef]
  32. Costa, B.; Iwamoto, A.; Puppin-Rontani, R.; Pascon, F. Comparative Analysis of Root Dentin Morphology and Structure of Human Versus Bovine Primary Teeth. Microsc. Microanal. 2015, 21, 689–694. [Google Scholar] [CrossRef]
  33. Soares, F.; Follak, A.; da Rosa, L.; Montagner, A.; Lenzi, T.; Rocha, R. Bovine Tooth Is a Substitute for Human Tooth on Bond Strength Studies: A Systematic Review and Meta-Analysis of in Vitro Studies. Dent. Mater. 2016, 32, 1385–1393. [Google Scholar] [CrossRef]
  34. Laurance-Young, P.; Bozec, L.; Gracia, L.; Rees, G.; Lippert, F.; Lynch, R.; Knowles, J. A Review of the Structure of Human and Bovine Dental Hard Tissues and Their Physicochemical Behaviour in Relation to Erosive Challenge and Remineralisation. J. Dent. 2011, 39, 266–272. [Google Scholar] [CrossRef] [PubMed]
  35. Ortiz-Ruiz, A.; Teruel-Fernández, J.; Alcolea-Rubio, L.; Hernández-Fernández, A.; Martínez-Beneyto, Y.; Gispert-Guirado, F. Structural Differences in Enamel and Dentin in Human, Bovine, Porcine, and Ovine Teeth. Ann. Anat. 2018, 218, 7–17. [Google Scholar] [CrossRef]
  36. Lin, L. A Concordance Correlation Coefficient to Evaluate Reproducibility. Biometrics 1989, 45, 255–268. [Google Scholar] [CrossRef] [PubMed]
  37. Barnhart, H.; Haber, M.; Song, J. Overall Concordance Correlation Coefficient for Evaluating Agreement among Multiple Observers. Biometrics 2002, 58, 1020–1027. [Google Scholar] [CrossRef]
  38. McBride, G. A Proposal for Strength-of-Agreement Criteria for Lin’s Concordance Correlation Coefficient. NIWA Client Rep. 2005, 45, 307–310. [Google Scholar]
  39. Slagter, K.; Raghoebar, G.; Vissink, A.; Meijer, H. Inter- and Intraobserver Reproducibility of Buccal Bone Measurements at Dental Implants with Cone Beam Computed Tomography in the Esthetic Region. Int. J. Implant Dent. 2015, 1, 1–5. [Google Scholar] [CrossRef]
  40. Curi, J.; Beaini, T.; da Silva, R.H.; Melani, R.; Chilvarquer, I.; Crosato, E. Guidelines for Reproducing Geometrical Aspects of Intra-Oral Radiographs Images on Cone-Beam Computed Tomography. Forensic Sci. Int. 2017, 271, 68–74. [Google Scholar] [CrossRef]
  41. Kochhar, A.; Sidhu, M.; Prabhakar, M.; Bhasin, R.; Kochhar, G.; Dadlani, H.; Spagnuolo, G.; Mehta, V. Intra- And Interobserver Reliability of Bone Volume Estimation Using OsiriX Software in Patients with Cleft Lip and Palate Using Cone Beam Computed Tomography. Dent. J. 2021, 9, 14. [Google Scholar] [CrossRef]
  42. Eguren, M.; Holguin, A.; Diaz, K.; Vidalon, J.; Linan, C.; Pacheco-Pereira, C.; Vich, M.O.L. Can Gray Values Be Converted to Hounsfield Units? A Systematic Review. Dentomaxillofacial Radiol. 2022, 51, 20210140. [Google Scholar] [CrossRef] [PubMed]
  43. Katsumata, A.; Hirukawa, A.; Okumura, S.; Naitoh, M.; Fujishita, M.; Ariji, E.; Langlais, R.P. Effects of Image Artifacts on Gray-Value Density in Limited-Volume Cone-Beam Computerized Tomography. Oral Surg. Oral Med. Oral Pathol. Oral Radiol. Endodontol. 2007, 104, 829–836. [Google Scholar] [CrossRef]
  44. Genisa, M.; Shuib, S.; Rajion, Z.; Arief, E.; Hermana, M. Density Estimation Based on the Hounsfield Unit Value of Cone Beam Computed Tomography Imaging of the Jawbone System. Proc. Inst. Mech. Eng. Part H J. Eng. Med. 2018, 232, 1168–1175. [Google Scholar] [CrossRef] [PubMed]
  45. Mjör, I.; Nordahl, I. The Density and Branching of Dentinal Tubules in Human Teeth. Arch. Oral Biol. 1996, 41, 401–412. [Google Scholar] [CrossRef] [PubMed]
  46. Komabayashi, T.; Nonomura, G.; Watanabe, L.; Marshall, G.; Marshall, S. Dentin Tubule Numerical Density Variations below the CEJ. J. Dent. 2008, 36, 953–958. [Google Scholar] [CrossRef] [PubMed]
  47. Towle, I.; Salem, A.; Veneziano, A.; Loch, C. Variation in Enamel and Dentine Mineral Concentration and Density in Primate Molars. Arch. Oral Biol. 2023, 153, 105752. [Google Scholar] [CrossRef]
  48. Campioni, I.; Pecci, R.; Bedini, R. Ten Years of Micro-CT in Dentistry and Maxillofacial Surgery: A Literature Overview. Appl. Sci. 2020, 10, 4328. [Google Scholar] [CrossRef]
  49. Posada, M.C.; Sánches, C.F.; Gallego, G.J.; Vargas, A.P.; Restrepo, L.F.; López, J.D. Dientes de Bovino Como Sustituto de Dientes Humanos Para Su Uso En La Odontología. Revisión de Literatura. CES Odontol. 2006, 19, 63–68. [Google Scholar]
  50. Habel, R.E.; St. Clair, L.E. Digestive System of the Ox. In The Anatomy of the Domestic Animals; Sisson, S., Grossman, J., Getty, R., Eds.; Saunders Co: Centennial, CO, USA, 1975; pp. 444–469. [Google Scholar]
  51. Nakamichi, I.; Iwaku, M.; Fusayama, T. Bovine Teeth as Possible Substitutes in the Adhesion Test. J. Dent. Res. 1983, 62, 1076–1081. [Google Scholar] [CrossRef]
  52. Schilke, R.; Lisson, J.A.; Bauß, O.; Geurtsen, W. Comparison of the Number and Diameter of Dentinal Tubules in Human and Bovine Dentine by Scanning Electron Microscopic Investigation. Arch. Oral Biol. 2000, 45, 355–361. [Google Scholar] [CrossRef]
  53. ten Cate, J.M.; Rempt, H.E. Comparison of the in Vivo Effect of a 0 and 1,500 PpmF MFP Toothpaste on Fluoride Uptake, Acid Resistance and Lesion Remineralization. Caries Res. 1986, 20, 193–201. [Google Scholar] [CrossRef] [PubMed]
  54. Camargo, C.H.R.; Siviero, M.; Camargo, S.E.A.; de Oliveira, S.H.G.; Carvalho, C.A.T.; Valera, M.C. Topographical, Diametral, and Quantitative Analysis of Dentin Tubules in the Root Canals of Human and Bovine Teeth. J. Endod. 2007, 33, 422–426. [Google Scholar] [CrossRef] [PubMed]
  55. Attin, T.; Wegehaupt, F.; Gries, D.; Wiegand, A. The Potential of Deciduous and Permanent Bovine Enamel as Substitute for Deciduous and Permanent Human Enamel: Erosion-Abrasion Experiments. J. Dent. 2007, 35, 773–777. [Google Scholar] [CrossRef] [PubMed]
  56. Turssi, C.P.; Messias, D.F.; Corona, S.M.; Serra, M.C. Viability of Using Enamel and Dentin from Bovine Origin as a Substitute for Human Counterparts in an Intraoral Erosion Model. Braz. Dent. J. 2010, 21, 332–336. [Google Scholar] [CrossRef] [PubMed]
  57. Wegehaupt, F.; Gries, D.; Wiegand, A.; Attin, T. Is Bovine Dentine an Appropriate Substitute for Human Dentine in Erosion/Abrasion Tests? J. Oral Rehabil. 2008, 35, 390–394. [Google Scholar] [CrossRef]
  58. Dettwiler, C.A.; Walter, M.; Zaugg, L.K.; Lenherr, P.; Weiger, R.; Krastl, G. In Vitro Assessment of the Tooth Staining Potential of Endodontic Materials in a Bovine Tooth Model. Dent. Traumatol. 2016, 32, 480–487. [Google Scholar] [CrossRef] [PubMed]
  59. Ito, Y.; Otsuki, M.; Tagami, J. Effect of PH Conditioners on Tooth Bleaching. Clin. Exp. Dent. Res. 2019, 5, 212–218. [Google Scholar] [CrossRef]
  60. Wiegand, A.; Vollmer, D.; Foitzik, M.; Attin, R.; Attin, T. Efficacy of Different Whitening Modalities on Bovine Enamel and Dentin. Clin. Oral Investig. 2005, 9, 91–97. [Google Scholar] [CrossRef]
  61. Asaka, Y.; Yamaguchi, K.; Inage, H.; Takamizawa, T.; Kurokawa, H.; Rikuta, A.; Kuroda, T.; Miyazaki, M. Effect of Thermal Cycling on Bond Strengths of Single-Step Self-Etch Adhesives to Bovine Dentin. J. Oral Sci. 2006, 48, 63–69. [Google Scholar] [CrossRef]
  62. Krifka, S.; Börzsönyi, A.; Koch, A.; Hiller, K.A.; Schmalz, G.; Friedl, K.H. Bond Strength of Adhesive Systems to Dentin and Enamel-Human vs. Bovine Primary Teeth in Vitro. Dent. Mater. 2008, 24, 888–894. [Google Scholar] [CrossRef]
Figure 1. Bovine incisor teeth: (A) buccal; (B) lingual; (C) mesial; (D) distal.
Applsci 14 06334 g001
Figure 2. (A) Reference points (the green line corresponds to the cemento-enamel junction (CEJ) line; abbreviations in Table 1). (B) Angles to standardise sampling (grey corresponds to buccal crown dentine, red to lingual crown dentine, green to buccal root dentine, and blue to lingual root dentine). (C) Distances from the CEJ line to position the sampling in different sectors of enamel and dentine. (D) Distances from the CEJ line and prism location for the three-dimensional (3D) calculation of mineral density. (E) Prism location for the 3D calculation of mineral density (abbreviations in Table 1).
Applsci 14 06334 g002
Figure 3. (A) Three-dimensional reconstruction of a tooth with the prisms of density measurement points. (B) Distal surface of tooth.
Applsci 14 06334 g003
Figure 4. The scatter plots show Lin’s concordance correlation coefficients in the crown. (AC) show comparisons between Observers 1 and 2, Observers 2 and 3, and Observers 1 and 3 for enamel, respectively. (DF) show the same comparisons for buccal crown dentine. (GI) show the same comparisons for lingual crown dentine.
Applsci 14 06334 g004
Figure 5. The scatter plots show Lin’s concordance correlation coefficients for the cervical area. (AC) show comparisons between Observers 1 and 2, Observers 2 and 3, and Observers 1 and 3 for buccal cervical dentine, respectively. (DF) show the same comparisons for lingual cervical dentine.
Applsci 14 06334 g005
Figure 6. The scatter plots show Lin’s concordance correlation coefficient in the root. (AC) show comparisons between Observers 1 and 2, Observers 2 and 3, and Observers 1 and 3 for buccal root dentine, respectively. (DF) show the same comparisons for lingual root dentine.
Applsci 14 06334 g006
Table 1. Abbreviations of the reference points and prisms for the mineral density measurements.
Reference PointPrismsAbbreviation
Cemento-enamel junction to buccal surface CEJ-B
Cemento-enamel junction to lingual surface CEJ-L
Dentine pulp chamber to buccal surface DPC-B
Dentine pulp chamber to lingual surface DPC-L
Dentine to buccal surface Dentine-B
Dentine to lingual surface Dentine-L
Buccal crown dentineBCrD
Lingual crown dentineLCrD
Buccal cervical dentineBCeD
Lingual cervical dentineLCeD
Buccal root dentineBRD
Lingual root dentineLRD
Lingual root dentineCEJ-B
Table 2. Use of reference points for the angles to measure crown and root dentine.
Dentine SectionReference Points for the Angles
Buccal crown dentine From CEJ-L to DPC-B
Buccal root dentine From DPC-L to CEJ-B
Lingual crown dentine From DPC-B to CEJ-L
Lingual root dentine From CEJ-B to DPC-L
See Table 1 for the abbreviations.
Table 3. Lin’s concordance correlation coefficients.
SamplingObserver 1 vs. 2Observer 2 vs. 3Observer 1 vs. 3
Enamel0.9890.9950.986
Buccal crown dentine0.9870.9910.991
Lingual crown dentine0.9910.9870.995
Buccal cervical dentine0.9930.9950.993
Lingual cervical dentine 0.9870.9970.989
Buccal root dentine0.9790.9820.985
Lingual root dentine0.9650.9770.985
Disclaimer/Publisher’s Note: The statements, opinions and data contained in all publications are solely those of the individual author(s) and contributor(s) and not of MDPI and/or the editor(s). MDPI and/or the editor(s) disclaim responsibility for any injury to people or property resulting from any ideas, methods, instructions or products referred to in the content.

