Abstract
Online education has gained increasing importance in recent years due to its flexibility and ability to cater to a diverse range of learners. The COVID-19 pandemic has further emphasized the significance of online education as a means to ensure continuous learning during crisis situations. With the disruption of traditional in-person exams, online examinations have become the new norm for universities worldwide. Among the popular formats for online tests are multiple-choice questions, which are drawn from a large question bank. However, creating online tests often involves meeting specific requirements, such as minimizing the overlap between exams, grouping related questions, and determining the desired difficulty level. The manual selection of questions from a sizable question bank while adhering to numerous constraints can be a laborious task. Additionally, traditional search methods that evaluate all possible solutions are impractical and time-consuming for such a complex problem. Consequently, approximate methods like metaheuristics are commonly employed to achieve satisfactory solutions within a reasonable timeframe. This research proposes the application of the Bees Algorithm (BA), a popular metaheuristic algorithm, to address the problem of generating online exams. The proposed solution entails creating multiple exam forms that align with the desired difficulty level specified by the educator, while considering other identified constraints. Through extensive testing and comparison with four rival methods, the BA demonstrates superior performance in achieving the primary objective of matching the desired difficulty level in most test cases, as required by the educator. Furthermore, the algorithm exhibits robustness, indicated by minimal standard deviation across all experiments, which suggests its ability to generalize, adapt, and be practically applicable in real-world scenarios. However, the algorithm does have limitations related to the number of successful solutions and the achieved overlap percentage. These limitations have also been thoroughly discussed and highlighted in this research.
1. Introduction
Over the past few years, the education system has experienced a significant transformation, primarily attributable to the impact of the COVID-19 pandemic. The shift towards online exams has been motivated by the imperative to prioritize the safety and well-being of both students and staff, while also ensuring the uninterrupted progression of education. Online exams provide students with a secure environment in comparison to traditional modes of examination. In general, from an instructor standpoint, multiple-choice questions (MCQ) can be advantageous with respect to the ease of scoring, perceived objectivity in grading, fast return of scores in large classes, and the capacity to ask more questions [1,2].
The process of selecting exam questions, though, can be time-consuming, particularly when multiple exam models are necessary. Furthermore, when exams are administered to a large number of students at different times, it becomes essential to have a question bank that encompasses a considerable number of questions. Question banks facilitate the inclusion of questions in the exam at different intervals, offering a variety of selection criteria. This approach enhances the diversity of the generated exams. However, a challenge faced in both automatic and manual online exam generation is the question bank’s size. To ensure exam variety and minimize repetition, having a question bank larger than the total number of questions required is generally recommended [3,4]. While there is no specific guideline regarding the exact question bank size in relation to the number of questions needed, educational experts and researchers suggest having a substantial number of questions available. A larger question bank offers broader coverage of the curriculum and ensures adequate assessment of all important topics [5,6]. The specific question bank size will depend on factors such as the subject matter, questions’ difficulty level, and desired variety in the exams [3,4]. Generating various exam models from a question bank can be accomplished through manual or automated methods. The manual process is typically intricate and time-consuming, while employing an algorithm to automate the task allows for precise adherence to specific criteria instead of random question selection. This approach guarantees that the exam models maintain consistent difficulty levels and meet the required constraints.
The multiple-exam composition problem has recently attracted the attention of many researchers [2]. The problem at hand involves the automated generation of multiple MCQ exam papers or test sheets. These test sheets cover the same subject matter and maintain an identical or nearly identical difficulty level, ensuring a fair assessment process. It is crucial that the difficulty levels of the generated exams align with the desired test level established by the educator. Furthermore, to promote diversity and mitigate the potential for cheating, the overlap between the different tests, in terms of identical questions, should not exceed a specified percentage.
In this study, we propose a method to simultaneously create multiple forms of MCQ exams while adhering to specific criteria, including the difficulty level, avoidance of question repetition, and a predetermined number of questions in each section. Given that traditional search methods that exhaustively examine all feasible solutions are often impractical and time-consuming for larger problem sizes, we introduce a metaheuristic algorithm as a solution, namely, the Bees Algorithm (BA) [7].
In brief, the concept of the BA revolves around a set of initial solutions. The algorithm then focuses on exploiting promising and elite solutions by making modifications to enhance the likelihood of discovering improved solutions. The ultimate objective is to achieve the optimal or near-optimal solution through these iterative refinements [8]. The motivation for employing the BA algorithm lies in its ability to effectively tackle real-world problems that have proven challenging for other classical algorithms [8]. This algorithm, in particular, demonstrates promise in addressing combinatorial optimization problems [7]. Moreover, for the multiple-exam composition problem specifically, we opted for the BA for two primary reasons. Firstly, despite its popularity and simplicity, the BA has not been previously applied to solve this particular problem, unlike other well-known methods such as Simulated Annealing (SA) [9], the Genetic Algorithm (GA) [10], Particle Swarm Optimization (PSO) [2,11,12], and Ant Colony Optimization (ACO) [13]. Secondly, we believe that the BA possesses an inherent advantage over other methods which directly aligns with the multiple-exam composition problem. Specifically, it naturally selects the best and elite solutions as part of its optimization process, thereby readily generating multiple exams (i.e., solutions) in each run. In other words, the BA does not require any additional steps to generate multiple tests simultaneously, as seen in other algorithms, such as the random algorithm [14], SA [9], GA [10], and ACO [13], which involve repeating runs and/or sorting the population to select the best individuals, or incorporating parallelization, as in PSO [2,11,12].
The problem tackled in this research is defined as follows [15]:
Let a question bank and the generated test where n ≤ k. The difficulty level requirement of the exam set by the educator is DLR ∈ [0, 1]; the difficulty level of each question, DLx ∈ [0, 1], is also determined by the educator. Moreover, each question belongs to a certain chapter (part). The objective function that determines the quality of the solution (exam) computes the average of the difficulty values of all questions in the exam and then compares it to the required difficulty level DLR, as shown in Equation (1) [15].
where represents the difficulty level of question . The smaller becomes, the better the fitness of the solution. In addition, each generated exam must adhere to the following constraints, where C1, C2, and C3 are hard (i.e., mandatory) constraints, while C4 is a soft (i.e., desired but not mandatory) constraint:
- C1: Each question in the exam must be unique.
- C2: The difficulty level of each question should not be concentrated around the required difficulty level of the exam, ensuring diversity. In other words, selecting questions all of the same difficulty level for the test is not allowed.
- C3: The number of questions extracted from each chapter (or section) must match the desired number specified by the educator.
- C4: To generate multiple exams while ensuring a high level of uniqueness in each test, it is desirable to restrict the percentage of overlapping questions between tests. The acceptable overlap percentage can be determined using Equation (2). This approach guarantees that the exams exhibit minimal redundancy and maintain a diverse collection of questions. Following [2], the maximum acceptable overlap percentage is 0.3. Assuming we have m generated tests, the overlap percentage between the m tests is calculated as follows:
- is the number of overlapping questions between all tests;
- is the number of unique questions within
- is the number of tests generated;
- is the number of questions in each test.
The term accounts for the diversity of the questions involved in the overlapping count. Its purpose is to slightly mitigate the impact of overlap when the questions involved in the overlapping count are different. This approach is used to address situations in which the overlapping portion consists of a small number of questions, indicating a higher similarity between the exams. To illustrate this concept, consider the following example:
Let us consider five exams, each consisting of ten questions. Suppose there are 15 overlapping questions, all of which come from Q1, Q2, and Q3. In this case, the overlap percentage would be calculated as ((15 − 3)/50) × 100 = (12/50) × 100 = 24%.
On the other hand, suppose we have 15 overlapping questions, but these questions include Q1, Q2, Q3, Q4, and Q5. In this case, the overlap percentage would be ((15 − 5)/50) × 100 = (10/50) × 100 = 20%. The second scenario is considered better than the first because it demonstrates more diversity in the questions included in the overlapping. If we remove the “U” (unique) component from Equation (2), both scenarios would yield the same overlap percentage, which we believe is not fair.
In this research, the BA is employed to construct a number of MCQ exams from a question bank while adhering to specific constraints. The primary objective of the solution is to attain the desired difficulty level determined by the educator. As a metaheuristic algorithm, the BA offers an approximate solution that can be optimal or near-optimal. As previously highlighted, the BA is well-suited for simultaneously generating multiple exam forms as it interacts with a population of solutions and selects the best and elite solutions during an intensified search process.
This study presents four main contributions. Firstly, it introduces a unique adaptation of the BA, specifically designed to address this problem. Secondly, it enables the generation of multiple online tests simultaneously, meeting the user requirements without resorting to parallelization techniques. Thirdly, it introduces problem-specific neighborhood moves, crafted to adhere to the constraints of this particular problem. Finally, the experimental results demonstrate that our proposed method performs favorably compared to existing approaches, delivering high-quality solutions to the problem at hand.
The remainder of this paper is organized as follows. Section 2 reviews some background information, as well as previous related work. Section 3 details the proposed BA approach for the multiple-exam composition problem. Section 4 describes our experiments and results. Section 5 discusses our findings, and finally Section 6 concludes the study.
2. Background and Related Work
This section provides an overview of the fundamentals of metaheuristics and the BA, while the related work part briefly covers the single-exam generation problem, in which the proposed algorithm generates only one exam paper, and multiple-exam generation, where multiple versions of the exam are generated.
2.1. Metaheuristics
A metaheuristic is a problem-independent algorithmic framework that can solve intricate and complex problems by providing “acceptable” solutions in a reasonable amount of time; it follows a set of principles or strategies for guiding algorithms using heuristic optimization [16]. Metaheuristic algorithms generally outperform simple heuristics. Numerous different classifications exist for metaheuristic algorithms. One approach classifies them as population-based versus single-solution-based. Population-based algorithms search a problem domain by processing a population of individuals (i.e., possible problem solutions) [17]. Examples of this category include Genetic Algorithms (GAs) and Particle Swarm Optimization (PSO). On the other hand, there exist algorithms with a single solution that is traversed over the search space like Hill-Climbing (HC) and Simulated Annealing (SA) [18]. This work focuses on the Bees Algorithm (BA) as a population-based metaheuristic.
2.2. Bees Algorithm (BA)
Bee-inspired algorithms are commonly employed as metaheuristic optimization techniques, leveraging the intelligent behavior of honeybees [19]. These algorithms belong to the category of swarm intelligence optimization methods, drawing inspiration from the cooperative foraging behavior of natural bee colonies [20]. The Bee Algorithm (BA) and its closely related variant, the Artificial Bee Colony (ABC), have demonstrated successful applications in various optimization problems. They have been particularly effective in domains such as vehicle routing and transportation, as exemplified by [21,22,23,24], as well as in timetabling and scheduling problems, as demonstrated in [25,26,27].
In nature, a bee colony is characterized as a collective entity that exhibits a wide-ranging presence, extending over significant distances (often exceeding ten kilometers) in multiple directions simultaneously to explore a vast area in search of food. The success of a colony’s foragers relies on their ability to be directed towards productive food sources. In theory, flower patches that can attract a large number of bees are expected to offer abundant nectar and pollen, making them easily accessible with minimal energy expenditure. Conversely, flower patches that provide limited nectar or pollen tend to attract fewer bees [28].
In a bee colony, foraging begins with scout bees searching for suitable flowers. These scouts explore their surroundings in a random manner, moving from one patch to another. When a scout bee discovers a source of nectar or pollen, it returns to the hive and performs a unique behavior known as the waggle dance on the dance floor. This peculiar dance holds significance in colony communication, as it conveys three essential pieces of information about the flower patches: direction, distance, and source quality, as depicted in Figure 1. Equipped with this information, the colony can effectively guide its bees without the need for external supervision or a predetermined blueprint. Follower bees inside the hive, who have been awaiting the dance, as well as the scout bees, then return to the flower patch. While collecting food from the patch, the bees assess its quality and continue to refine the waggle dance, if necessary, upon their return to the colony. This iterative process ensures that the colony continues its search for the most suitable patches, with bees performing additional waggle dances to recruit more individuals if the patch still contains ample food and requires additional workers [28]. The BA tries to mimic this process by applying the following steps [28]:
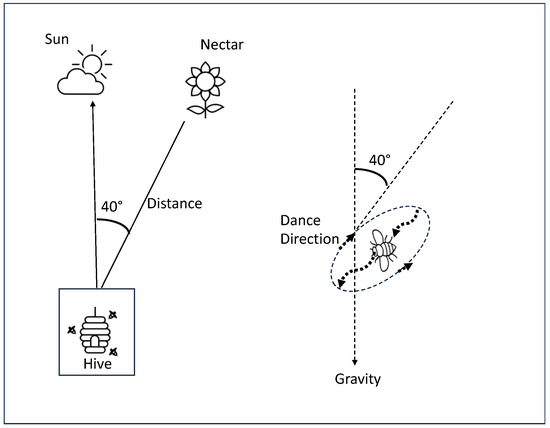
Figure 1.
Information that appears in the waggle dance (inspired by [29]).
- Initialize the population with random solutions.
- Evaluate the fitness of the population.
- While (stopping condition not met):
- o Select the best sites for neighborhood search.
- o Select elite sites from the best sites.
- o Recruit bees around selected sites and evaluating fitness.
- o Select the fittest bee from each site.
- o Assign the remaining bees to a random search and assessing their fitness.
- End While.
- Return the best bee as the final solution.
The BA begins with a population of solutions as its initial starting point. During the first iteration, bees make numerous local moves in order to explore potential solutions to the problem. This process is repeated until a predetermined number of solutions have been discovered. The best solutions, determined by their fitness, are retained. Subsequently, new neighboring solutions are generated around these top-performing solutions. These newly generated solutions are then evaluated to estimate the solutions that should be aimed for. The process continues iteratively until the algorithm satisfies a specified termination condition, ultimately returning a satisfactory solution to the problem [30].
2.3. The Single-Exam Generation Problem
The demand for performing online exams has increased remarkably in recent times. As a result, there has been a growing interest in developing optimal and efficient methods to generate online exams. Several approaches have been employed to address the single-exam generation problem. One straightforward method is the randomization approach utilized in [14], in which a Shuffling Algorithm was employed to detect and prevent the duplication or repetition of randomly generated questions. Additionally, Simulated Annealing (SA) has been employed in [9] to select test items in a web-based environment, aiming to achieve a balanced distribution of information, content coverage, and item exposure (i.e., a measure of the frequency with which a test question is selected), within the generated test. Nevertheless, more sophisticated metaheuristic optimization algorithms are the current trend for solving this problem, as evident by [2,10,11,12,13,15,31,32,33,34]. Particle Swarm Optimization (PSO) is a widely used optimization algorithm that imitates a flock of birds to locate an optimal solution. In PSO, each bird is referred to as a particle that flies searching for nourishment, which then shares the location of a favorable site. By doing so, the rest of the flock, or the swarm, can profit until they locate the optimal spot or solution. PSO was used in [15] to generate exams based on an objective difficulty level, while satisfying several constraints, such as the required number of questions in the exam and the number of questions used per section. A fitness function for each particle, i.e., exam, was calculated. The swarm keeps moving towards the global best until it reaches an optimal solution or satisfies the termination condition. The results of this approach showed that PSO succeeds in finding the best test to fit the requirements from a question bank with great speed, accuracy, and stability.
The Genetic Algorithm (GA) has also proven to be powerful for generating online exams [10,15,31,32,33]. GA is an algorithm based on natural selection, in which the best individuals are selected for reproduction. The offspring then inherit characteristics from their parents. At the start of each generation, several individuals are selected and sorted according to their respective fitness levels. If the individual with the best fitness satisfies the requirements, the algorithm will stop. Otherwise, crossover and mutation will take place. The algorithm keeps iterating this process until a satisfactory solution is found.
Studies [31,32,33] used GAs to generate online tests. The work in [31] attempted to generate tests with many requirement constraints, such as the number of questions, question types, difficulty, answer time, and exposure. The fitness function measures the difficulty level of the test, the class distribution, the total time needed to complete the test and the average exposure to the test paper. This approach yielded reasonable, diverse test papers, with a fast-running time of approximately 10 s.
The researchers in [32] developed two distinct models to generate tests, each considering a problem with a different objective. The first model solves the Specified Length of Assessment Time problem (SLAT), in which the generated exam must be solved in a fixed period of time. The second is the Fixed Number of Test Items (FNTI) problem, wherein the exam must consist of a specific number of questions. The proposed models are the Concept Lower Bound First Genetic (CLFG) approach, which addresses SLAT problems, and the Feasible Item First Genetic (FIFG) approach, used to solve FNTI problems. Both models attempt to make all questions in an exam meet the lower bound of the expected relevance of each concept to be addressed.
Another work that also used GA to generate a test is [33], in which each question in the question bank had the following attributes: a question score, difficulty, teaching requirement, item type, unit of knowledge point, estimated answer time, and item number. The fitness function depends on the deviation between the required values set by the user and the actual values of the following constraints: knowledge points, difficulty coefficient, teaching requirement, and the time required. The algorithm generated tests that met all the requirements and were vigorously tested by altering the size of the question bank and changing the type of questions.
2.4. The Multiple-Exam Generation Problem
When it comes to tests, educators often create multiple versions of each test to prevent cheating among students. However, this introduces a new challenge where the generated tests must maintain similar difficulty levels while covering the same content to ensure fairness. To address this challenge, researchers have explored various metaheuristic algorithms, such as PSO, GA, and ACO, which have shown promising results in generating appropriate versions of tests.
In order to produce multiple unique exams in one run, researchers opted for parallelism in [2], using multi-swarm PSO. In their approach, a thread represents a swarm responsible for forming an exam that satisfies certain constraints, such as uniqueness, the diversity of the difficulty levels between questions, and multi-part questions appearing together. Also, the number of questions extracted from each section is equal to a pre-specified number. Each particle within a swarm thread represents a nominee exam, for which the average difficulty level is the objective function. To ensure the variety and uniqueness of the exam, the overlap percentage between exams should not exceed the overlap threshold set by the educator. Throughout the program, threads are connected via migration, where more robust swarms help the weaker ones. A thorough examination of the results has been conducted, through which the approach in [2] proved to be superior to many others, including Simulated Annealing (SA) [9] and Random Search algorithms [14].
The work in [11] also utilized a single objective PSO approach. The constraints that the resulting exams had to meet were identical to those in [2]. The fitness function calculates the average difficulty level of the exam and subtracts it from the required difficulty level. As the fitness value decreases, the quality of the exam improves. In order to generate multiple exams, the researchers employed parallelism, assigning each thread to a separate swarm. This approach yielded satisfactory solutions within a short timeframe. However, the algorithm faced challenges in terms of generating sufficient variety. Consequently, none of these migration theories were applied in this study.
The study in [12] proposed using Multiswarm Multiobjective Particle Swarm Optimization (MMPSO) to generate multiple tests in one run. The outcome of this approach depends on the tests’ overall difficulty and the total testing time. To generate multiple tests, several subswarms were created. SA was employed to create the initial population, thus increasing the diversity of the generated tests. Here the constraints set were also identical to those in [2]. The objective function combines the average difficulty of the exam and the total exam duration. The MMPSO algorithm with SA and migration was tested against several PSO algorithms such as MMPSO, MMPSO with SA, and MMPSO with migration (without SA). The results indicated that MMPSO with migration and SA achieved excellent results with respect to the variety and number of successful attempts.
The study [10] presents an automated generator for multiple test questions using the GA. The questions were categorized in the question bank based on the six levels of Bloom’s classification. Previous exam questions were processed and stored in the question bank based on Bloom’s classification level. As shown in the results, the decrease in the number of questions impacts each level in Bloom’s taxonomy, while a test is of good quality when it covers at least three levels of Bloom’s taxonomy.
In [34], a different metaheuristic algorithm was employed. A Tabu-Search-based algorithm called the Bit Map Selection Tabu Approach (BMST) was used to search the solution space effectively. Tabu search prohibits revisiting solutions that were previously encountered. The constraint set was the gross relevance of the chosen questions between the maximum and minimum boundaries of the related concept to be learned. The fitness function stands for the average discrimination of the resulting test. BMST was tested against the feasible-time-first Algorithm (FTF), Random Search, and exhaustive search algorithms. The results showed that near-optimal test sheets can be obtained in much shorter times when using BMST.
Another popular metaheuristic algorithm that can solve such problems is the Ant Colony Optimization (ACO) algorithm. It emulates the attitude of ants while searching for food to find the optimized solution. The main procedure of this algorithm, as described in [13], is based on constructing a graph, where each question from the question bank is represented as a node, and the connecting lines denote the paths formed by the ants to create a test. During the construction process, as the ant builds a solution, the heuristic and pheromone information is influenced by the discriminative nature of the question and signifies the suitability of including the question in the current solution. Once the colony completes the construction of tests, the best solution is chosen. Subsequently, a local search is performed on the best solution to enhance it by exchanging certain questions. Finally, the pheromone values associated with the questions in the best test are updated in the global pheromone memory. The researchers highlight that the results demonstrate the effectiveness of the ACO method in generating tests that meet the requirements and provide satisfactory solutions, which are not impacted by the size of the question bank.
As observed from the review of related work, none of the previous studies have employed the BA to solve the multi-exam generation problem. We firmly believe that the BA is particularly well-suited for addressing this problem due to its capability of handling multiple preferred solutions concurrently, such as the best and elite solutions. This feature facilitates the extraction of multiple tests simultaneously without the need for parallelization, as will be discussed shortly. Furthermore, the BA stands out for its simple implementation and straightforward parameter configuration compared to other types of metaheuristics. It possesses the advantage of effectively handling both discrete and continuous optimization problems, while also adapting its behavior based on the quality of the generated solutions [35]. Therefore, in our research, we aim to explore the feasibility of utilizing the BA as an approach to tackling this problem.
3. Methodology
This section provides a detailed description of the algorithm employed to address the multiple-exam composition problem. Firstly, we will outline the main steps followed by the BA to solve this problem. After specifying the number of desired exams (m), the required difficulty level (DLR), the number of questions in each part, and the overlap threshold, the algorithm proceeds as follows:
- Generate an initial population of bees (s > m), in which each bee represents a potential exam, and s denotes the scout bees. Sort the population based on each bee’s fitness, i.e., the exam’s difficulty level, calculated using Equation (1).
- Select the fittest bees (m) for neighborhood search. During neighborhood search, some questions in the selected exam are replaced, resulting in a new exam or neighbor. The number of neighbors generated for the elite (fittest) bees (e) within m is higher than the number of neighbors generated for the remaining bees (m-e). The fittest bee from each of the m patches or neighborhoods is then chosen to transfer to the next generation. Two neighborhood search methods are applied: random for the best and elite bees, and deterministic when the set of m exams fails the overlap condition. In the deterministic method, overlapping questions are replaced with new questions from the same chapters with similar difficulty levels. This preserves the fitness value while reducing the overlap percentage.
- Test the overlap condition by comparing the m exams and keeping track of overlapping questions. If the overlap condition is satisfied, select the fittest bees from the m patches to transfer to the next generation and discard the remaining (s-m) bees. However, if the ratio of overlapping questions to the remaining questions in the exams exceeds the overlap threshold, perform a new neighborhood search operation on the previously selected m bees until the overlap condition is met. The overlap percentage is calculated by dividing the number of repeated questions by the total number of questions in the m exams, as shown in Equation (2).
- Generate new (s-m) bees randomly to maintain the original population size.
The stopping condition test memorizes the best DLR and checks whether the overlap percentage has changed. If not, the algorithm returns the desired m exams. The process (steps 2–4) repeats until the termination condition is met. The termination condition can be satisfied when the resulting set of bees includes m exams that fulfill all the conditions specified by the educator, or when the algorithm reaches a maximum pre-defined number of iterations, or when the overlapping percentage remains unchanged for five consecutive iterations. Algorithm 1 presents the pseudocode of the proposed method.
| Algorithm 1: BA for Multiple Exam Generation. |
| Input: number of the desired exams (m), required difficulty level, overlap percentage, number of required chapters and the number of questions in each chapter. Output: multiple tests satisfying the conditions. Initialize the number of scout bees s, number of best sites e and patch size. Initialize a population of s scout bees. Repeat until maximum iterations is reached. If iteration ! = 0 Then If the overlap condition is not satisfied Then Apply overlap neighborhood move. End if If stopping condition is satisfied Then Return the m exams generated. End if End if Calculate the objective function of the population. Choose m best sites for neighborhood search. Assign the size of the neighborhood (patch size). Apply neighborhood search; search more around the best e sites. Select the fittest bee from each patch. Assign the (s-m) remaining bees to random search. Generate a new population of scout bees. End Repeat Return the m exams generated. |
A crucial aspect of the algorithm is the representation of a problem’s solution, which, in our case, corresponds to an exam or test. The exam is structured into parts or chapters, with each part containing multiple questions of varying difficulty levels. The educator specifies the number of questions per part, the overall difficulty level of the test, and the desired overlap percentage between tests. Hence, the solution is represented as a test object comprising parts or chapters, where each part consists of a collection of questions identified via a question ID. Figure 2 provides an illustration of a solution representation for an exam.

Figure 2.
An example of a solution representation.
As mentioned earlier, our neighborhood move involves replacing one question in the exam to generate a new exam. In the following section, we present an example of a question bank that will be utilized to illustrate and describe the behavior of our algorithm.
| Ch1 | Q1 | Q2 | Q3 | Q4 | Q5 | Q6 | Q7 | Q8 | Q9 | Q10 |
| DL | 0.56 | 0.93 | 0.45 | 0.12 | 0.98 | 0.71 | 0.24 | 0.25 | 0.2 | 0.62 |
| Ch2 | Q11 | Q12 | Q13 | Q14 | Q15 | Q16 | Q17 | Q18 | Q19 | Q20 |
| DL | 0.37 | 0.54 | 0.5 | 0.36 | 0.86 | 0.13 | 0.9 | 0.67 | 0.76 | 0.28 |
| Ch3 | Q21 | Q22 | Q23 | Q24 | Q25 | Q26 | Q27 | Q28 | Q29 | Q30 |
| DL | 0.42 | 0.21 | 0.33 | 0.60 | 0.13 | 0.59 | 0.78 | 0.94 | 0.81 | 0.63 |
The initial step involves initializing a random population. In this example, population size = 3, and there are two exams to be generated (m = 2). Each exam consists of five questions, with two questions allocated to chapter 1, two questions to chapter 2, and one question to chapter 3. The desired difficulty level is set to 0.65, and the overlap limit is defined as 0.2. The fitness of each exam is calculated by computing the difference between the average difficulty level of the exam and the required difficulty level specified by the user.
| Exam 1 | Question | Q8 | Q9 | Q13 | Q11 | Q24 | Fitness |
| Chapter | Ch1 | Ch1 | Ch2 | Ch2 | Ch3 | 0.266 | |
| Difficulty | 0.25 | 0.2 | 0.5 | 0.37 | 0.60 |
| Exam 2 | Question | Q1 | Q7 | Q17 | Q14 | Q25 | Fitness |
| Chapter | Ch1 | Ch1 | Ch2 | Ch2 | Ch3 | 0.212 | |
| Difficulty | 0.56 | 0.24 | 0.9 | 0.36 | 0.13 |
| Exam 3 | Question | Q2 | Q6 | Q12 | Q18 | Q29 | Fitness |
| Chapter | Ch1 | Ch1 | Ch2 | Ch2 | Ch3 | 0.016 | |
| Difficulty | 0.93 | 0.71 | 0.54 | 0.67 | 0.32 |
Next, a neighborhood search is conducted on the fittest m bees (exams), for which m equals 2 in this instance. During this step, one question is exchanged within the fittest m exams, and replaced by another question from the same chapter. As Exam 3 is the fittest (or elite) exam, we will extract two neighbors from it. For clarity, the exchanged questions are denoted in bold text.
| Exam 4 (neighbor 2) | Question | Q1 | Q7 | Q17 | Q19 | Q25 | Fitness |
| Chapter | Ch1 | Ch1 | Ch2 | Ch2 | Ch3 | 0.132 | |
| Difficulty | 0.56 | 0.24 | 0.9 | 0.76 | 0.13 |
| Exam 5 (neighbor 3) | Question | Q2 | Q6 | Q12 | Q18 | Q21 | Fitness |
| Chapter | Ch1 | Ch1 | Ch2 | Ch2 | Ch3 | 0.004 | |
| Difficulty | 0.93 | 0.71 | 0.54 | 0.67 | 0.42 |
| Exam 6 (neighbor 3) | Question | Q2 | Q6 | Q11 | Q18 | Q29 | Fitness |
| Chapter | Ch1 | Ch1 | Ch2 | Ch2 | Ch3 | 0.05 | |
| Difficulty | 0.93 | 0.71 | 0.37 | 0.67 | 0.32 |
The next step is to select the fittest exams from each neighborhood or patch, specifically Exams 4 and 5. We then evaluate the overlap ratio for each exam. In this case, as there are no overlapping questions between them, the overlap ratio is 0, which does not exceed the defined overlap threshold. Consequently, we need to generate a new random population of (s-m) bees. Since the m bees are Exams 4 and 5, only one new bee is created randomly. Thus, the new set of bees comprises Exams 4, 5, and 7.
| Exam 4 | Question | Q1 | Q7 | Q17 | Q19 | Q25 | Fitness |
| Chapter | Ch1 | Ch1 | Ch2 | Ch2 | Ch3 | 0.132 | |
| Difficulty | 0.56 | 0.24 | 0.9 | 0.76 | 0.13 |
| Exam 5 | Question | Q2 | Q6 | Q12 | Q18 | Q21 | Fitness |
| Chapter | Ch1 | Ch1 | Ch2 | Ch2 | Ch3 | 0.004 | |
| Difficulty | 0.93 | 0.71 | 0.54 | 0.67 | 0.42 |
| Exam 7 | Question | Q5 | Q1 | Q20 | Q15 | Q30 | Fitness |
| Chapter | Ch1 | Ch1 | Ch2 | Ch2 | Ch3 | 0.126 | |
| Difficulty | 0.98 | 0.56 | 0.85 | 0.86 | 0.63 |
Then, we proceed to repeat the neighborhood search operation on Exams 5 and 7, since they are the best exams.
| Exam 8 (neighbor 5) | Question | Q5 | Q6 | Q12 | Q18 | Q21 | Fitness |
| Chapter | Ch1 | Ch1 | Ch2 | Ch2 | Ch3 | 0.014 | |
| Difficulty | 0.98 | 0.71 | 0.54 | 0.67 | 0.42 |
| (neighbor 7) | Question | Q10 | Q1 | Q20 | Q15 | Q30 | Fitness |
| Chapter | Ch1 | Ch1 | Ch2 | Ch2 | Ch3 | 0 | |
| Difficulty | 0.35 | 0.56 | 0.85 | 0.86 | 0.63 |
| Exam 9 (neighbor 5) | Question | Q2 | Q6 | Q12 | Q18 | Q29 | Fitness |
| Chapter | Ch1 | Ch1 | Ch2 | Ch2 | Ch3 | 0 | |
| Difficulty | 0.93 | 0.71 | 0.54 | 0.67 | 0.40 |
The fittest exams from each neighborhood are Exams 9 and 10. Since there are no overlapping questions between them, the overlap percentage is calculated as 0%. At this point, we check the stopping condition. Since we have two distinct exams, both with a fitness value of 0, the algorithm terminates, resulting in two unique exams that have the same difficulty level and the required distribution of questions across chapters.
Furthermore, we provide an example of the overlap neighborhood move, which occurs when the algorithm exceeds the predefined overlap percentage. When the algorithm fails to satisfy the overlap condition, it focuses on diversifying the top m exams. This is accomplished by replacing as many overlapping questions as possible with new questions from the same chapter. The replacement questions are carefully selected to ensure a similar or closely matched difficulty level to the questions they replace. The process of changing the overlapping questions is carried out individually for each question and one exam at a time. In other words, for every overlapping question, an attempt is made sequentially on each overlapping exam to replace the corresponding question with another unique question from the same chapter, with a similar or closely matched difficulty level. If the attempt is successful, there is no need to consider other exams. However, if the attempt fails, the next exam in the sequence is taken into consideration.
The parameters used in this example are as follows: population size = 3, m = 2 (number of exams), and five questions per exam. The difficulty level is set to 0.65, and the overlap limit is defined as 0.15. Exams 1 and 2 are identified as the best exams (m best exams). It is noteworthy that both Q9 and Q13 appear twice in the selected best exams. The total number of overlapping questions (O) is determined as 2 + 2 = 4. The variable U represents the number of unique questions within the set of overlapping questions (O). Since all overlapping questions are either Q9 or Q13, U = 2. To calculate the overlap percentage, we use the formula in Equation (2), which in this case yields (4 − 2)/(5 × 2) = 0.2. Consequently, the overlap percentage exceeds the maximum overlap threshold specified above.
| Exam 1 | Question | Q2 | Q9 | Q13 | Q18 | Q29 | Fitness |
| Chapter | Ch1 | Ch1 | Ch2 | CH2 | CH3 | 0.126 | |
| Difficulty | 0.93 | 0.2 | 0.5 | 0.67 | 0.32 |
| Exam 2 | Question | Q8 | Q9 | Q13 | Q11 | Q24 | Fitness |
| Chapter | Ch1 | Ch1 | Ch2 | Ch2 | Ch3 | 0.266 | |
| Difficulty | 0.25 | 0.2 | 0.5 | 0.37 | 0.60 |
| Exam 3 | Question | Q1 | Q9 | Q12 | Q14 | Q25 | Fitness |
| Chapter | Ch1 | Ch1 | Ch2 | Ch2 | Ch3 | 0.292 | |
| Difficulty | 0.56 | 0.2 | 0.54 | 0.36 | 0.13 |
The overlap neighborhood move is then performed on the best m exams, specifically Exams 1 and 2. During this process, the overlapping questions are replaced with new and unique questions from the same chapter. The replacement questions are chosen to have a difficulty level that is either identical to or within a 0.05 margin of the question being replaced. In this case, since Q7 is available and meets the specified criteria (from chapter 1 and within the margins of the difficulty level), it is an appropriate replacement for Q9. Similarly, Q13 is replaced with Q12 for the same reasons. These changes were applied to Exam 1.
| Exam 1 | Question | Q2 | Q7 | Q12 | Q18 | Q29 | Fitness |
| Chapter | Ch1 | Ch1 | Ch2 | Ch2 | Ch3 | 0.11 | |
| Difficulty | 0.93 | 0.24 | 0.54 | 0.67 | 0.32 |
| Exam 2 | Question | Q8 | Q9 | Q13 | Q11 | Q24 | Fitness |
| Chapter | Ch1 | Ch1 | Ch2 | Ch2 | Ch3 | 0.266 | |
| Difficulty | 0.25 | 0.2 | 0.5 | 0.37 | 0.60 |
After the execution of the overlap neighborhood move, the resulting best m exams are entirely distinct from each other. As a result, the overlap percentage is now reduced to zero.
4. Experimental Design and Results
To evaluate the performance of the proposed algorithm, we utilized two datasets obtained from references [2,15]. These datasets are outlined in Table 1. The first dataset, the small question bank (small QB) consists of 1000 questions with varying difficulty levels, distributed across 14 chapters. The second dataset, the large question bank (large QB) consists of 12,000 questions with diverse difficulty levels across 12 chapters.

Table 1.
Summary of experimental datasets; dataset 1 for the small question bank [2], dataset 2 for the large question bank [15].
To run the algorithm, the educator needs to provide several parameters, including the number of desired exams (m), the difficulty level requirement for each exam (DLR), the desired chapters (Ch1, Ch2, … Chc) for each exam, and the number of questions covering each selected chapter (Qn1, Qn2, … Qnc). Additionally, there are other parameters specific to our Bee Algorithm (BA) that need to be specified, such as the number of scout bees (initial population size) (s), the number of best solutions from the m exams (e), the neighborhood (patch) size for both e and m-e, and the maximum allowed overlap percentage between generated tests. We conducted a parameterized test, exploring different values for these parameters to determine the optimal configuration for our algorithm.
The performance criterion considered was that the quality of each exam, as measured by the fitness function, should have a margin of error no greater than 0.0001 [2]. We also introduced additional measures to handle the trade-off between fitness value and runtime. If the algorithm fails to produce m exams with a fitness value within the range of [0, 0.0001] within the allocated time, the margin of error is increased to 0.15. The resulting exams should not exceed a maximum overlap percentage of 0.3, as assumed in reference [2].
Initially, the algorithm prioritizes the fitness value, which is based on the difficulty of the exam. The algorithm keeps track of its solutions and saves the overall best solutions. Once an acceptable fitness value is achieved, the algorithm shifts its focus towards improving the overlap percentage. If the overlap percentage does not improve over five iterations, the algorithm terminates and outputs its best solution.
We implemented the proposed approach using Python 3.6.12 in the Colab environment, leveraging several libraries that support machine learning algorithms.
To evaluate the effectiveness of the proposed approach, we conducted a comparative analysis with four other algorithms: Parallel Migration PSO (PMPSO) [2], sequential PSO (SPSO) [2], the random algorithm (RA) [14], and the Simulated Annealing (SA) [9] algorithm. The results of these four methods were documented in reference [2].
The performance measurements used for evaluation were the quality of the solution and the standard deviation. Multiple runs of each algorithm were performed to obtain robust results. It is important to note that the population size and difficulty level requirement (DLR) were kept consistent across all algorithms in this comparison. However, the size of the question bank was varied to evaluate the algorithms’ performance across different search space sizes (i.e., different datasets). The objective function computed the quality of the solution, with a decreasing fitness function indicating an improved solution. The fitness value of each test was measured to assess the quality of the results.
The standard deviation served as a measure of the generated exam’s proximity to the desired difficulty level (DLR). It acted as an indicator of the algorithm’s stability or robustness [2]. To evaluate the stability of the algorithm, we measured the standard deviation across multiple DLRs.
Table 2 presents the parameters utilized in the conducted experiments. We performed two distinct experiments, each executed twice: once on the large question bank and once on the small question bank. The first experiment aimed to assess the algorithms’ performance when varying the number of generated exams, while the second experiment evaluated their performance when altering the required difficulty level. As the BA is a stochastic algorithm that can produce different results with each run, each experiment was repeated ten times to ensure accurate and reliable outcomes, which aligns with the number of runs conducted in [2].
Table 2.
Parameters used in the testing phase.
Table 3 shows the detailed performance of all algorithms when changing the number of exams while keeping the difficulty level the same. The large question bank was used in this experiment. The success rate measures the number of times the algorithm reaches a successful solution, i.e., a solution with a fitness ∈ [0, 0.0001]. Figure 3 shows the average fitness of all algorithms.
Table 3.
Algorithms’ results when changing the number of exams, using the large question bank.
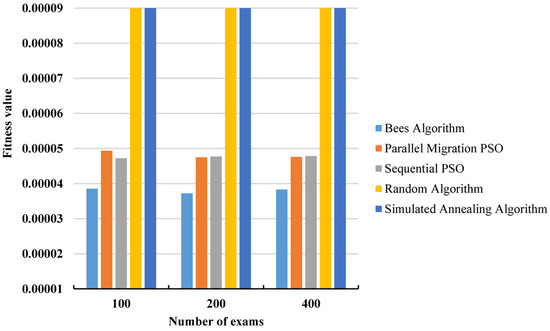
Figure 3.
Average fitness values for different numbers of exams using the large question bank.
As evident from the outcomes presented in Table 3 and Figure 3, the BA exhibits superior performance in terms of average fitness values across all dataset sizes compared to all other methods. The PMPSO and the SPSO demonstrate comparable performance, while the RA and SA underperform across all test cases. With regard to the standard deviation, the BA and PSO methods exhibit similar values, with slightly smaller deviations observed for the PSOs. This suggests that all three algorithms demonstrate stability, as the variation between different runs is minimal. Conversely, the RA and SA once again underperform in this aspect.
For the success rate, the BA was able to achieve an approximately 93% success rate on average, compared to the 100% success rate for the PSOs and much worse success rates for the RA and SA.
For the overlap percentage, it is important to highlight that our method for calculating the overlap percentage differs from the approach used by [2]. The reason behind this discrepancy is that their calculation involves dividing the number of overlapping questions by the number of tests, without considering the total number of questions in the tests. We believe that this method is not accurate for calculating the overlap percentage because when calculating a percentage, it is necessary to consider the relationship between a part and the whole. In other words, both the numerator and the denominator should be of the same type. Since exams are distinct entities from questions, we have developed our own formula for determining the overlap percentage, as shown in Equation (2). Therefore, a direct comparison of the overlap percentage between the algorithms cannot be provided. However, since we have established a baseline for comparison, which is the overlap threshold defined by the user, our ultimate objective is to ensure that the overlap percentage does not exceed this threshold, regardless of the calculation method employed. Observing the obtained results, it is evident that the BA was unable to attain the targeted overlap percentage of 30% for the larger test cases. This outcome is somewhat expected as the likelihood of question repetition increases with a larger number of exams.
Table 4 shows the performance of all algorithms when varying the number of exams using the small question bank, while Figure 4 shows a comparison of the algorithms in terms of average fitness values with respect to the number of exams.
Table 4.
Algorithms’ results when changing the number of exams using the small question bank.

Figure 4.
Average fitness values for different numbers of exams using the small question bank.
Based on the outcomes presented in Table 4 and Figure 4, it is evident once again that the BA generated exams with smaller fitness values compared to all other competing methods. This indicates that the exams produced by the BA were closer to the desired DLR. However, it should be noted that the two variants of PSO achieved an optimal success rate, which the BA did not attain, albeit with a small margin. Nevertheless, the BA exhibited a significantly higher success rate compared to the RA and SA. For standard deviation, both the BA and PSO methods demonstrated comparable values, suggesting stability across different runs for the obtained results. In contrast, the RA and SA exhibited much higher deviations, indicating instability in the outcomes across multiple runs. On the other hand, the BA once again fell short of achieving the desired overlap percentage, as calculated using our method.
Figure 5 illustrates the runtime behavior (in seconds) of the Bees Algorithm when varying the number of exams for question banks of different sizes. It can be observed from the figure that as the size of the question bank increases, the runtime also significantly increases, which is expected.
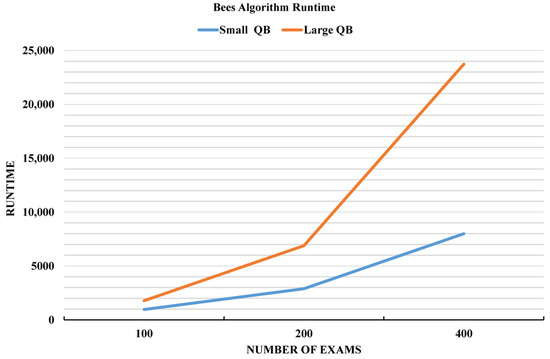
Figure 5.
Bees Algorithm’s runtime when changing the number of exams.
The subsequent experiment involves modifying the required difficulty level (DLR) using the large question bank. The results of all algorithms for this experiment are presented in Table 5, while Figure 6 provides a side-by-side comparison of the algorithms in terms of their average fitness values. From these findings, it can be observed that the BA outperforms the PSO methods in terms of average fitness in three out of five instances (DLR = 0.4, 0.5, and 0.6), while having a slightly worse fitness for a DLR = 0.7, and much worse fitness for a DLR = 0.3. Nevertheless, the BA outperforms the RA and SA consistently in all instances. Also, the BA and both PSO algorithms demonstrate comparable standard deviations in most instances, outperforming the RA and SA.
Table 5.
Algorithms’ results when changing the DLR using the large question bank.
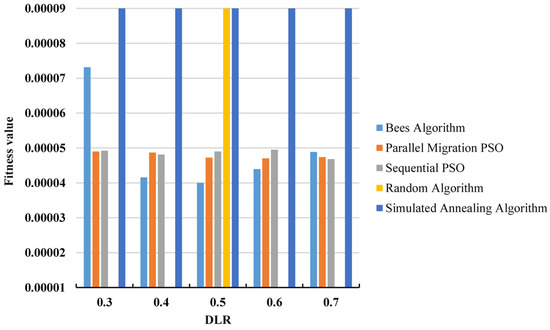
Figure 6.
Average fitness values for different DLRs using the large question bank.
Regarding the success rate, the BA achieved an average success rate of approximately 90% across the various test cases, significantly outperforming the RA and SA, which failed to obtain any successful solutions for the majority of the test cases. The PSO methods, though, had a 100% success rate for all test cases. In terms of the overlap percentage, the BA achieves better results in this experiment compared to the previous one on the same question bank (Table 3), as is discussed in more detail in Section 5.
The performance of the algorithms when varying the required difficulty levels using the small question bank is presented in Table 6. Similar to previous experiments, both PSO methods exhibited higher success rates than the BA in all instances, except for the instance in which DLR = 0.3, where both PSO methods significantly underperformed in comparison to the BA.
Table 6.
Algorithms’ results when changing the DLR using the small question bank.
Figure 7 and Figure 8 provide a comparison of the average fitness values for each method across different instances, with Figure 8 separating the outlier instance (DLR = 0.3) for clarity. From these figures, it can be observed that the BA demonstrated better performance in terms of average fitness in two instances (DLR = 0.3 and 0.5), while it had a worse average fitness than the PSO methods in the remaining three instances. However, it is worth noting that the BA consistently outperformed the RA and SA in all instances. Additionally, the PSO methods exhibited slightly better standard deviations than the BA in most cases. Again in this experiment, the desired threshold for the overlap percentage was still not achieved by the BA.
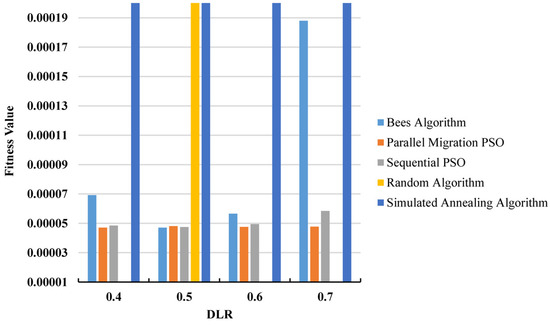
Figure 7.
Average fitness values when changing the DLR [0.4–0.7] for the small question bank.
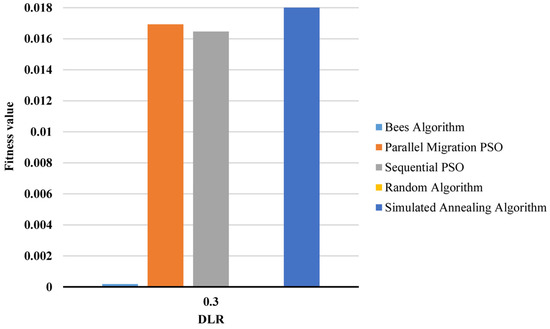
Figure 8.
Average fitness for DLR = 0.3 for the small question bank.
5. Discussion
In our study, we evaluated the performance of the Bees Algorithm (BA) based on four key criteria: the number of successful solutions, fitness, overlap percentage, and standard deviation. The computational experimentation demonstrated that the BA achieved favorable results in terms of successful solutions, fitness, and standard deviation compared to its rival methods. Specifically, the BA outperformed all competing methods in terms of average fitness in most test cases. However, the PSO methods (both parallel and sequential versions) exhibited a higher success rate, highlighting their advantage over the BA in this particular metric, although the BA outperformed the RA and SA in this metric.
Amongst the different difficulty levels (DLRs) considered, the case of DLR = 0.5 consistently showed the best results in terms of the fitness function, standard deviation, and successful solutions, as indicated in (Table 3, Table 4, Table 5 and Table 6). This can be attributed to the nature of our neighborhood move, which selects replacement questions at random. Therefore, it is relatively easier to balance difficulty level values for DLR = 0.5, since there is an approximately equal number of questions with higher and lower difficulty levels than 0.5. On the other hand, in the case of a DLR = 0.7, the majority of the questions in the database have a difficulty level lower than 0.7, making it more challenging to generate an exam with that difficulty level.
Furthermore, the standard deviation results were comparable to those of the PMPSO, according to the computational results. Once again, the case of DLR = 0.5 exhibited greater a robustness of the algorithm. Additionally, the successful solutions were generally close to the optimal solution, as evident in the results, particularly for DLR = 0.5. It is worth noting that even better results could have been achieved if we had set a margin of error less than 15%. Furthermore, the BA did not meet the specified overlap threshold reported in [2]. Despite this, our results can be considered reasonable, especially considering the small question bank, which has a limited number of questions per chapter. For instance, taking the first row of Table 4 as an example, the dataset of the small bank for the first ten chapters comprised 614 unique questions, while the total number of generated questions was 10,000. This resulted in a significant overlap percentage.
Moreover, in line with the results presented in Table 3, there is a direct correlation between the number of exams and the overlap percentage. As expected, as the number of exams increased, the overlap percentage also increased. Additionally, Table 5 revealed that the selected difficulty level (DLR) could impact the overlap percentage, as previously explained.
In conclusion, we believe that the BA successfully achieved our research goals by producing near-optimal solutions that satisfied the required difficulty level set by the educator. It displayed robustness with respect to the difficulty level, as evidenced by the small standard deviation.
6. Conclusions
Automatically generated online exams have garnered significant interest among researchers and educators. However, there is a scarcity of resources that can produce multiple versions of the same exam automatically. Educators require such tools for fair assessments and to prevent cheating during exams. This study aims to contribute to the field of education by providing a method to quickly generate unique and fair exams compared to manual solutions. We propose the utilization of the Bees Algorithm (BA) to compose multiple exams from a question bank, with a focus on achieving the desired difficulty level as the primary objective. Each generated exam also adheres to several constraints defined by the educators to ensure an equitable examination process. The contribution of this research lies in presenting a customized version of the BA, specifically designed to address the problem at hand. Our proposed method enables the generation of multiple online tests simultaneously, effectively meeting user requirements without the need for parallelization techniques. Additionally, we introduce innovative problem-specific neighborhood moves that are designed to adhere to the constraints of the problem.
Through extensive testing on benchmark data and comparison with the four rival methods reported in [2], the experimental results indicate that our algorithm outperforms the competing methods in terms of the primary objective, i.e., the difficulty level of the exams, in the majority of test cases. Furthermore, the algorithm exhibits a small standard deviation across all experiments, demonstrating its robustness. However, it has a slightly lower success rate compared to the Particle Swarm Optimization (PSO) methods, although it outperforms the Random and Simulated Annealing (SA) algorithms in this aspect. Furthermore, the BA fell short of attaining the targeted overlap percentage, as assumed in [2].
For future work, we aim to enhance the design of the BA by employing smarter neighborhood moves, particularly when dealing with overlapping questions between exams. Fine-tuning this approach and exploring alternative methods may mitigate the overlap percentage and further improve the algorithm’s performance in terms of exam construction. One possible approach is to utilize question selection heuristics instead of randomly selecting replacement questions. An example heuristic is the Least Recently Used (LRU) heuristic, which prioritizes questions that have been used the least number of times in previous exams. By favoring less recently used questions, the LRU heuristic can maximize question diversity and minimize overlap. Additionally, runtime improvements can be achieved through parallelization or other optimization techniques (e.g., adaptive parameter tuning). Moreover, we intend to test the algorithm’s scalability by evaluating larger-sized instances.
In conclusion, the BA is a metaheuristic algorithm that proves useful in solving our problem. It stands out for its simplicity, adaptability, and ease of use. We believe that our BA competes well with other metaheuristic algorithms that have been successfully applied to this problem. Our research findings hold promise for improving educational outcomes by reducing the workload for instructors, enhancing student satisfaction, and optimizing resource allocation.
Author Contributions
Conceptualization, M.H.; methodology, M.H.; validation, M.H. and R.H.; formal analysis, M.H.; investigation, M.H. and R.H; resources, M.H. and N.A.; data curation, M.H and R.H.; writing—original draft preparation, R.H.; writing—review and editing, M.H. and N.A.; visualization, M.H.; supervision, M.H.; project administration, M.H; funding acquisition N.A. All authors have read and agreed to the published version of the manuscript.
Funding
This work has been funded by King Saud University, Riyadh, Saudi Arabia, through the Researchers Supporting Project number (RSPD2023R857).
Institutional Review Board Statement
Not applicable.
Informed Consent Statement
Not applicable.
Data Availability Statement
The data presented in this study are available in 10.1109/ACCESS.2021.3057515, reference number 2 and 10.6688/JISE.201811_34(6).0004, reference number 15.
Acknowledgments
This work has been funded by King Saud University, Riyadh, Saudi Arabia, through the Researchers Supporting Project number (RSPD2023R857). The authors acknowledge the contributions of Rafeef Alazzaz, Demah Alawadh, Atheer Mohammad, Beshayer Al-mutawa, Ghadah Alshabib for their role in reviewing the literature, implementing the algorithm, and reporting the results.
Conflicts of Interest
The authors declare no conflict of interest.
References
- Stanger-Hall, K.F. Multiple-Choice Exams: An Obstacle for Higher-Level Thinking in Introductory Science Classes. CBE—Life Sci. Educ. 2012, 11, 294–306. [Google Scholar] [CrossRef] [PubMed]
- Nguyen, T.; Nguyen, L.T.T.; Bui, T.; Loc, H.D.; Pedrycz, W.; Snasel, V.; Vo, B. Multi-Swarm Optimization for Extracting Multiple-Choice Tests From Question Banks. IEEE Access 2021, 9, 32131–32148. [Google Scholar] [CrossRef]
- Raje, S.; Stitzel, S. Strategies for Effective Assessments While Ensuring Academic Integrity in General Chemistry Courses during COVID-19. J. Chem. Educ. 2020, 97, 3436–3440. [Google Scholar] [CrossRef]
- Beerepoot, M.T.P. Formative and Summative Automated Assessment with Multiple-Choice Question Banks. J. Chem. Educ. 2023, 100, 2947–2955. [Google Scholar] [CrossRef]
- Wen, J.; Lu, W.; Chen, Z. Innovation and Construction of Examination Database of Pharmacology. Indian J. Pharm. Educ. Res. 2020, 54, 279–283. [Google Scholar] [CrossRef]
- Krzic, M.; Brown, S. Question Banks for Effective Online Assessments in Introductory Science Courses. Nat. Sci. Educ. 2022, 51, e20091. [Google Scholar] [CrossRef]
- Yuce, B.; Mastrocinque, E.; Packianather, M.S.; Lambiase, A.; Pham, D.T. The Bees Algorithm and Its Applications. In Handbook of Research on Artificial Intelligence Techniques and Algorithms; IGI Global: Pennsylvania, PA, USA, 2015; pp. 122–151. ISBN 978-1-4666-7258-1. [Google Scholar]
- Al-Negheimish, S.; Alnuhait, F.; Albrahim, H.; Al-Mogherah, S.; Alrajhi, M.; Hosny, M. An Intelligent Bio-Inspired Algorithm for the Faculty Scheduling Problem. Int. J. Adv. Comput. Sci. Appl. 2018, 9, 151–159. [Google Scholar] [CrossRef]
- Lu, P.; Cong, X.; Zhou, D. The Research on Web-Based Testing Environment Using Simulated Annealing Algorithm. Sci. World J. 2014, 2014, 167124. [Google Scholar] [CrossRef]
- Rahim, T.N.T.A.; Aziz, Z.A.; Rauf, R.H.A.; Shamsudin, N. Automated Exam Question Generator Using Genetic Algorithm. In Proceedings of the 2017 IEEE Conference on e-Learning, e-Management and e-Services (IC3e), Miri, Malaysia, 16–17 November 2017; pp. 12–17. [Google Scholar]
- Nguyen, T.; Bui, T.; Vo, B. Multi-Swarm Single-Objective Particle Swarm Optimization to Extract Multiple-Choice Tests. Vietnam J. Comp. Sci. 2019, 6, 147–161. [Google Scholar] [CrossRef]
- Bui, T.; Nguyen, T.; Huynh, H.M.; Vo, B.; Chun-Wei Lin, J.; Hong, T.-P. Multiswarm Multiobjective Particle Swarm Optimization with Simulated Annealing for Extracting Multiple Tests. Sci. Program. 2020, 2020, e7081653. [Google Scholar] [CrossRef]
- Hu, X.-M.; Zhang, J.; Chung, H.S.-H.; Liu, O.; Xiao, J. An Intelligent Testing System Embedded With an Ant-Colony-Optimization-Based Test Composition Method. IEEE Trans. Syst. Man Cybern. Part C (Appl. Rev.) 2009, 39, 659–669. [Google Scholar] [CrossRef]
- Naik, K.; Sule, S.; Jadhav, S.; Pandey, S. Automatic Question Paper Generation System Using Randomization Algorithm. Int. J. Eng. Technol. Res. 2014, 2, 192–194. [Google Scholar]
- Bui, T.; Nguyen, T.; Vo, B.; Pedrycz, W.; Snasel, V. Application of Particle Swarm Optimization to Create Multiple-Choice Tests. J. Inf. Sci. Eng. 2018, 34, 1405–1423. [Google Scholar] [CrossRef]
- Glover, F.; Sörensen, K. Metaheuristics. Scholarpedia 2015, 10, 6532. [Google Scholar] [CrossRef]
- Cheng, S.; Liu, B.; Ting, T.O.; Qin, Q.; Shi, Y.; Huang, K. Survey on Data Science with Population-Based Algorithms. Big Data Anal. 2016, 1, 3. [Google Scholar] [CrossRef]
- Gandomi, A.; Yang, X.-S.; Talatahari, S.; Alavi, A. Metaheuristic Algorithms in Modeling and Optimization. In Metaheuristic Applications in Structures and Infrastructures; Elsevier: Amsterdam, The Netherlands, 2013; pp. 1–24. ISBN 978-0-12-398364-0. [Google Scholar]
- Ziarati, K.; Akbari, R.; Zeighami, V. On the Performance of Bee Algorithms for Resource-Constrained Project Scheduling Problem. Appl. Soft Comput. 2011, 11, 3720–3733. [Google Scholar] [CrossRef]
- Li, T.; Zhou, C.; Hu, M. An Improved Artificial Bee Colony Algorithm for 3D Protein Structure Prediction. In Proceedings of the 2017 International Conference on Biometrics Engineering and Application, Hong Kong, China, 21–23 April 2017; Association for Computing Machinery: New York, NY, USA, 2017; pp. 7–12. [Google Scholar]
- Korkmaz, E.; Akgüngör, A.P. The Forecasting of Air Transport Passenger Demands in Turkey by Using Novel Meta-heuristic Algorithms. Concurr. Comput. 2021, 33, e6263. [Google Scholar] [CrossRef]
- Korkmaz, E.; Akgüngör, A.P. Comparison of Artificial Bee Colony and Flower Pollination Algorithms in Vehicle Delay Models at Signalized Intersections. Neural Comput. Appl. 2020, 32, 3581–3597. [Google Scholar] [CrossRef]
- Korkmaz, E.; Doğan, E.; Akgüngör, A. Estimation of Car Ownership in Turkey Using Artificial Bee Colony Algorithm. In Proceedings of the 3rd International Conference on Traffic and Transport Engineering (ICTTE), Belgrade, Serbia, 24–25 November 2016. [Google Scholar]
- Dogan, E.; Korkmaz, E.; Akgungor, A.P. Comparison Of Different Approaches In Traffic Forecasting Models For The D-200 Highway In Turkey. Sci. J. Silesian Univ. Technol. Ser. Transp. 2018, 99, 25–42. [Google Scholar] [CrossRef]
- Li, J.-Q.; Song, M.-X.; Wang, L.; Duan, P.-Y.; Han, Y.-Y.; Sang, H.-Y.; Pan, Q.-K. Hybrid Artificial Bee Colony Algorithm for a Parallel Batching Distributed Flow-Shop Problem With Deteriorating Jobs. IEEE Trans. Cybern. 2020, 50, 2425–2439. [Google Scholar] [CrossRef]
- Alhuwaishel, N.; Hosny, M. A Hybrid Bees/Demon Optimization Algorithm for Solving the University Course Timetabling Problem. In Proceedings of the 3rd NAUN International Conference on Mathematical, Computational and Statistical Sciences, Dubai, United Arab Emirates, 22–24 February 2015. [Google Scholar]
- Almaneea, L.I.; Hosny, M.I. A Two Level Hybrid Bees Algorithm for Operating Room Scheduling Problem. In Intelligent Computing; Arai, K., Kapoor, S., Bhatia, R., Eds.; Advances in Intelligent Systems and Computing; Springer International Publishing: Cham, Switzerland, 2019; Volume 858, pp. 272–290. ISBN 978-3-030-01173-4. [Google Scholar]
- Pham, D.; Ghanbarzadeh, A.; Koç, E.; Otri, S.; Rahim, S.; Zaidi, M. The Bees Algorithm Technical Note; Manufacturing Engineering Centre, Cardiff University: Cardiff, UK, 2005; pp. 1–57. [Google Scholar]
- Talbi, E.-G. Metaheuristics: From Design to Implementation; John Wiley & Sons, Inc.: Hoboken, NJ, USA, 2009; Volume 74, ISBN 978-0-470-27858-1. [Google Scholar]
- Teodorović, D.; Dell’Orco, M. Bee Colony Optimization—A Cooperative Learning Approach to Complex Transportation Problems. Adv. OR AI Methods Transp. 2005, 51, 60–69. [Google Scholar]
- Ma, L.; Zhu, X.; Feng, Q. Improvement and Design of Genetic Algorithm in Personalized Test Paper Composition System. In Proceedings of the 4th International Conference on Computer Science and Application Engineering, Sanya, China, 20–22 October 2020; Association for Computing Machinery: New York, NY, USA, 2020; pp. 1–5. [Google Scholar]
- Hwang, G.-J.; Lin, B.M.T.; Tseng, H.-H.; Lin, T.-L. On the Development of a Computer-Assisted Testing System with Genetic Test Sheet-Generating Approach. IEEE Trans. Syst. Man Cybern. Part C (Appl. Rev.) 2005, 35, 590–594. [Google Scholar] [CrossRef]
- Shushu, L.; Fengying, W. Strategy and Realization of Auto-Generating Exam Paper Based on Genetic Algorithm. In Proceedings of the 2010 International Conference on Artificial Intelligence and Computational Intelligence, Sanya, China, 23–24 October 2010; Volume 2, pp. 478–482. [Google Scholar]
- Hwang, G.-J.; Yin, P.-Y.; Yeh, S.-H. A Tabu Search Approach to Generating Test Sheets for Multiple Assessment Criteria. IEEE Trans. Educ. 2006, 49, 88–97. [Google Scholar] [CrossRef]
- Baronti, L.; Castellani, M.; Pham, D.T. An Analysis of the Search Mechanisms of the Bees Algorithm. Swarm Evol. Comput. 2020, 59, 100746. [Google Scholar] [CrossRef]
Disclaimer/Publisher’s Note: The statements, opinions and data contained in all publications are solely those of the individual author(s) and contributor(s) and not of MDPI and/or the editor(s). MDPI and/or the editor(s) disclaim responsibility for any injury to people or property resulting from any ideas, methods, instructions or products referred to in the content. |
© 2023 by the authors. Licensee MDPI, Basel, Switzerland. This article is an open access article distributed under the terms and conditions of the Creative Commons Attribution (CC BY) license (https://creativecommons.org/licenses/by/4.0/).