Abstract
The cracking resistance of asphalt mixture is a non-negligible issue. However, the cracking resistance evolution law, motivated by two factors (thermos-oxidative aging degree and test temperature), is not yet well understood. The aim of this investigation is to gain more insight into the effect of thermos-oxidative aging and test temperature on the cracking resistance of asphalt mixture. Asphalt mixture (AC-13) and stone mastic asphalt mixture (SMA-13) were selected and exposed to different thermo-oxidative aging degrees (unaging (UA); short-term thermo-oxidative aging (STOA); long-term thermo-oxidative aging for 2/5/8 days (LTOA2d/LTOA5d/LTOA8d)). A direct tension test at different test temperatures (10 °C, 20 °C, 30 °C, 40 °C) was adopted to obtain their stress–strain curves and evaluation indexes (tensile strength, ultimate strain, pre-peak strain energy density, and post-peak strain energy density). The comprehensive index-cracking resistance index (CRI) was established by the entropy weight method combined with the technique to order preference by similarity to ideal solution (TOPSIS) method and the corresponding aging coefficient was determined. The results showed that STOA can increase the aging coefficient of asphalt mixture, thereby boosting the cracking resistance. Additionally, the effect can be weakened by elevations in the test temperature. Meanwhile, LTOA can decrease the aging coefficient and thereby weaken the cracking resistance. This effect becomes more prominent with elevations in the test temperature. SMA-13 possesses a superior cracking resistance to AC-13, with a gap in CRI value of 3–69%, regardless of the aging degree and test temperature. A good relationship exists between the aging coefficient and the two factors (aging degree and test temperature).
1. Introduction
Cracking is one of the most common hazards in asphalt pavement, associated with the cracking resistance of the main constituent of asphalt–pavement mixture. Aging occurs throughout the life cycle of asphalt pavement. During mixing, pavement rolling, and service, the asphalt mixture itself is inevitably exposed to complex environmental factors (such as oxygen, a high ambient temperature, light, and water), which can cause changes in the cracking resistance of asphalt mixture to a certain extent, and thereby change the durability of asphalt pavement [1,2]. Generally speaking, aging can be classified into thermo-oxidative aging, light-oxidative aging, and water aging, of which thermo-oxidative aging is the most common. Therefore, it is important to study the cracking resistance of asphalt mixture considering thermo-oxidative aging, and much research has been conducted on this issue. Song et al. [3] demonstrated the existence of aging during the transportation procedure using a direct tension test at low temperatures, and the results revealed that cracking resistance at low temperatures worsened with transportation time. Yan et al. [4] and Zhu et al. [5] investigated the cracking resistance of AC13 in STOA and conditions through a disk-shaped compact tension (DCT) test (−12℃). The results show that STOA can accelerate the cracking propagation regardless of the increased effect on the tensile strength. Song et al. [6] conducted a trabecular bending beam test (0 °C, −10 °C, −20 °C) on a warm mixed asphalt mixture to investigate aging degree variation and discovered that cracking resistance at low temperatures deteriorated more severely in LTOA than STOA. This accordingly emphasized the need for research on asphalt mixtures under LTOA conditions. Bonaquist et al. [7], Chen et al. [8], Wang et al. [9], and Wu [10] examined the effects of different degrees of aging (LTOA and STOA) on cracking resistance by semi-circular bending (SCB) test (15 °C, 20 °C and 25 °C). They all concluded that the cracking process can be sped up with the increase in aging degree. Islam et al. [11] studied the effect of aging duration on the indirect tensile strength of AC at 20 °C and highlighted that tensile strength increased with the extension of LTOA duration, but first increased and then decreased with the extension of STOA duration. Similarly, Radeef et al. [12] adopted an indirect tension (IDT) test (25 °C) to study the rubberized asphalt mixture under LTOA and STOA conditions. They found that STOA can enhance the cracking resistance and LTOA can degrade it in reverse.
Moreover, some researchers took test temperature into consideration, as well as the degree of aging. Omranian et al. [13] used the SCB test (10 °C, 20 °C and 30 °C) to evaluate the cracking resistance of treated AC-14 exposed to different STOA durations. The results showed that mixtures exposed to longer aging durations were more prone to cracking at lower test temperatures and that the regulation is reversed at high temperatures. Ye [14] evaluated the cracking resistance of AC-13 treated with different degrees of aging (UA, STOA, LTOA) by the application of the SCB test (0 °C, −5 °C, −10 °C, −20 °C). It was found that the mixture was more susceptible to cracking when treated by deeper degrees of aging at the discussed test temperature region. Wang et al. [15] compared the significance of LTOA and test temperature on the cracking resistance of AC-13 under unaging and LTOA conditions using the SCB test (−20 °C. −10 °C. 0 °C. 25 °C). It was concluded that cracking resistance was more remarkably affected by test temperature than LTOA. Hamedi et al. [16] studied the impact of short-term aging on the cracking resistance of asphalt mixture using the SCB test (−10 °C to −22 °C). It was demonstrated that the short-term aging asphalt mixture exhibited a superior cracking resistance to that of the mixture under unaging conditions at a lower test temperature, which was captured by the elevation in the surface free energy of the asphalt binder caused by aging.
As described in the above literature, a majority of the current experimental research on cracking resistance that considers different degrees of aging is limited to low or medium temperatures. However, cracking can also occur at high temperatures [17]. Therefore, it is necessary to test cracking resistance at high temperatures. Even so, it is worth noting the cracking resistance of asphalt mixture considering a high temperature (30 °C) was only reported in one study [13]. As the highest temperatures can reach about 40 °C in most parts of southern China, it seems that the highest test temperature should be set at 40 °C instead.
Furthermore, as asphalt mixture is a kind of multi-phase composite material, its overall mechanical properties are bound to be associated with its internal structure, such as its gradation. On this basis, a few studies have been launched to probe the effect of gradation on the cracking resistance of asphalt mixture. Li et al. [18] employed the SCB test at different test temperatures below 0 °C on both continuous gradation and gap gradation asphalt mixtures (AC-16, SMA-16, AC-20). Additionally, test results were more influenced by gradation than test temperature. Yin et al. [19] conducted an indirect tension low-temperature creep test (0 °C, 10 °C, and −20 °C) on AC-20 with different gradations (coarse, medium, and fine). It was revealed that medium gradation showed the best cracking resistance at 0 °C, medium gradation at −10 °C, and coarse gradation at −20 °C.
There are five main types of indoor evaluation method for the cracking resistance of asphalt mixture: semi-circular bending test, indirect tension test, trabecular bending test, disk shaped compact tension test [20,21] and direct tension test. Among them, the direct tension test is simpler regarding the specimen preparation as well as loading mode, more direct regarding the stress–strain data acquisition and better regarding the reflection of actual stress state of the asphalt mixture. Therefore, it is more suitable to be employed than the other four test methods [22,23,24]. As mentioned in the literature review, however, only the direct tension test was reported [3].
In terms of evaluation indexes, tensile strength, peak deformation, and modulus are most widely used. Nevertheless, Wang et al. [25] believed that conflicting conclusions could be drawn based on the three indexes mentioned above, and a single tensile strength index and failure strain sometimes cannot fully reflect the cracking resistance of the asphalt mixture. Based on this situation, Yang et al. [26] evaluated the cracking resistance by calculating the strain energy density. The result showed that the cracking resistance decay rate of the asphalt mixture prepared by the oven heating method was equivalent to that prepared by the delayed mixing method. Furthermore, Zheng [27] revealed that it is difficult to judge the cracking resistance of asphalt mixture using only the fracture energy index and established a more comprehensive evaluation index by determining the weight of each index through the analytic hierarchy process (AHP). However, the weight definition is susceptible to the decision-makers’ preference for the AHP method, leading to less convincing evaluation results. In contrast, the entropy weight TOPSIS method, a combination of the entropy weight method and TOPSIS method, cannot only avoid the influence of human subjectivity on the evaluation results but also has the advantages of less information loss and flexible computation, meaning that it is widely used in economic, management and other scientific fields, but is less applied in the pavement engineering material field [28,29,30].
Therefore, in this paper, SMA-13 and AC-13 were selected as they are commonly used in road engineering. Additionally, monotonic tensile tests were conducted on these two asphalt mixtures with different thermo-oxidative aging degrees at different test temperatures. The change rule of commonly used indexes (tensile strength, ultimate strain, and pre-peak and post-peak strain energy density) was obtained with different aging degrees, test temperatures, and mixture gradations. Finally, the comprehensive cracking resistance index (CRI) was established by the entropy weight TOPSIS method to evaluate the cracking resistance of asphalt mixture with different thermo-oxidative aging degrees.
2. Materials and Test Protocol
2.1. Materials
The styrene-butadiene-styrene (SBS)-modified asphalt was used and purchased from Shell (Xingyue) Co., Ltd., located in Foshan City, Guangdong Province, China. Its fundamental performance parameters were tested. The results are shown in Table 1. The diabase, limestone, and limestone powder were selected for the coarse aggregate, fine aggregate, and filler, respectively, sourced from a test section of the highway in Foshan City, Guangdong Province, China. Their fundamental performance parameters were tested. The results are summarized in Table 2. Furthermore, the aggregate gradation of AC-13 and SMA-13 is presented in Table 3.

Table 1.
Basic performance parameters test results of SBS-modified asphalt.
Table 2.
Basic performance parameters test results of coarse aggregate, fine aggregate and filler.
Table 3.
Mineral aggregate gradation.
2.2. Specimen Preparation
Compared with existing compaction methods, the wheel-rolling method was selected for the compact asphalt mixture plate specimen (300 mm × 300 mm × 50 mm) by virtue its better field simulation [31]. Then, each plate specimen was cut into a beam specimen (250 mm × 50 mm × 50 mm) by a rock-cutting machine.
The Strategic Highway Research Program (SHRP) proposed oven-heating, delayed mixing, and microwave-heating methods to simulate the thermos-oxidative aging of asphalt mixture. Among them, the oven-heating method is the most effective and common one. Therefore, this method was used in this study.
(1) STOA: put the mixed loose asphalt mixture in the oven with a temperature controlled at 135 °C for 4 h and stir hourly; then, mold the specimen according to the chapter mentioned above.
(2) LTOA: based on STOA, the beam specimen should be placed in the oven with temperature controlled at 85 °C for the intended number of days (2, 5 and 8 days).
2.3. Monotonic Direct Tension Test
The monotonic direct tension test was conducted by the material test systems (MTS) 810 machine imported from MTS Company located in Eden Prairie, MN, USA. For each specimen, each of the two ends was bonded with a round steel loading plate by steel glue. Then, after at least 3 days, specimens were moved into a temperature-controlled cabinet at the corresponding target test temperature for 4 h. Subsequently, specimens were shifted out and clamped onto the loading platform to be tested at a loading rate of 5 mm/min [32]. Pretension was performed at the beginning of each test to prevent eccentric phenomena from occurring during the test process. All the test results were acquired through the built-in computer system at a sampling frequency of 10 Hz. The relative indexes were calculated according to the following equations.
where denotes the tensile strength (MPa); denotes peak loading value (N); and d denote the width and the height of the specimen, respectively (mm); denotes the ultimate strain (10−6) denote the strain value of extensometers corresponding to the loading value, respectively (10−6); denotes the pre-peak strain energy density (MJ/m3); denotes the post-peak strain energy density (MJ/m3); denotes the strain at which the corresponding stress drops to half of the tensile strength (10−6); denotes stress in the tension process (MPa); denotes strain in the tension process (10−6).
2.4. Entropy Weight-TOPSIS Method
The idea of the entropy weight TOPSIS method is to use the entropy weight method to determine the weight of each index and then use the TOPSIS method to calculate the value of the comprehensive indexes. The specific steps are described below.
2.4.1. Establish the Initial Evaluation Matrix
There were 40 evaluation objects and 3 evaluation indexes in this study. The initial evaluation matrix is depicted in the following equation:
where denotes the jth evaluation index value of the ith evaluation object.
2.4.2. Standardize the Initial Evaluation Matrix
In view of the different dimensions among the three kinds of indexes, the standardized evaluation matrix is expressed as follows:
where denotes the jth evaluation index value of the ith evaluation object after standardization; denotes the minimum value of the jth evaluation index; denotes the maximum value of the jth evaluation index.
2.4.3. Calculate Entropy Weight of Each Index
The entropy and entropy weight of each index can be calculated according to the following equations:
where denotes the entropy of each evaluation index and denotes the entropy weight of each evaluation index.
2.4.4. Establish Weighted Standardization Evaluation Matrix
The weighted standardization evaluation matrix is established according to the following equation:
where denotes the jth evaluation index value of the ith evaluation object after being weighted.
2.4.5. Determine the Ideal Solution and Calculate the Euclidean Distance
The positive and negative ideal solution can be defined as follows:
The Euclidean distance between the evaluation object and the positive and negative ideal solution can be measured as follows.
where and denote the positive and negative ideal solution, respectively; and denote the Euclidean distance between the evaluation object and the positive and negative ideal solution for each evaluation object.
2.4.6. Calculate the Closeness of Each Evaluation Object to the Ideal Solution
The closeness of each of each evaluation object to the ideal solution can finally be defined as follows and can be regarded as the CRI value of each evaluation object.
where denotes the closeness of each evaluation object to the ideal solution.
3. Results and Discussion
3.1. Stress–Strain Plot
Figure 1, Figure 2, Figure 3 and Figure 4 show the stress–strain curves in the direct tension test process for AC-13 and SMA-13 with different aging degrees at 10 °C, 20 °C, 30 °C, 40 °C, respectively.
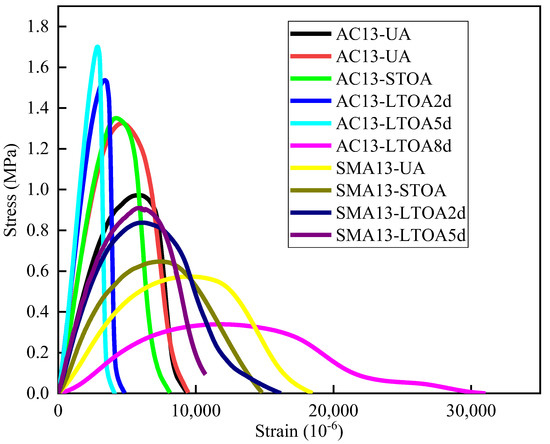
Figure 1.
Stress–strain plots of AC-13 and SMA-13 under different aging degrees, plotted at 10 °C.
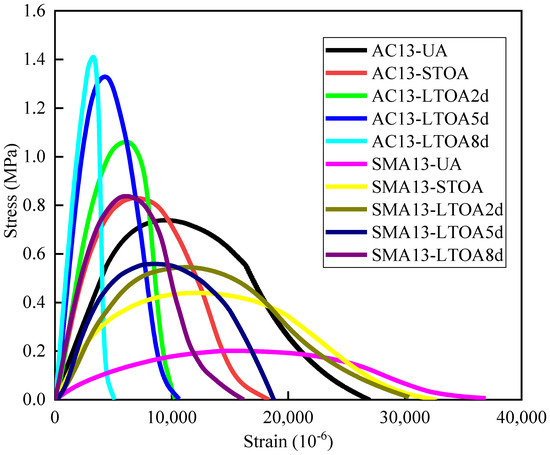
Figure 2.
Stress–strain plots of AC-13 and SMA-13 under different aging degrees, plotted at 20 °C.
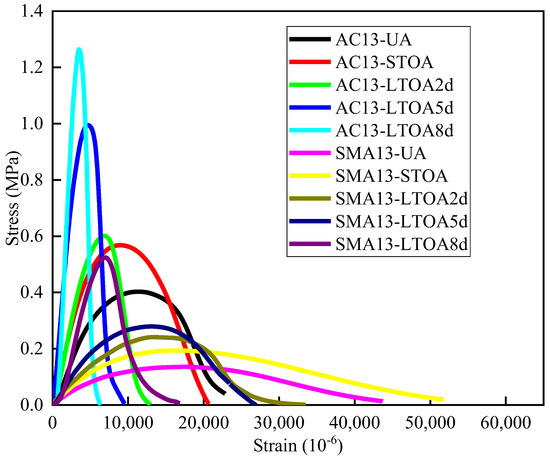
Figure 3.
Stress–strain plots of AC-13 and SMA-13 under different aging degrees, plotted at 30 °C.
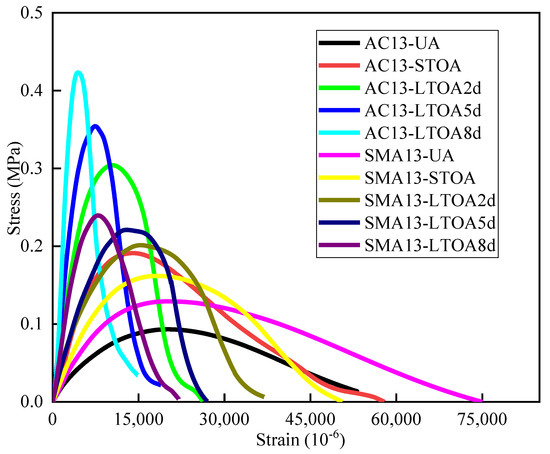
Figure 4.
Stress–strain plots of AC-13 and SMA-13 under different aging degrees, plotted at 40 °C.
As shown in Figure 1, Figure 2, Figure 3 and Figure 4, the overall shape of these plots can all be divided into three similar stages and the plot of AC13-UA in Figure 3 is taken as an example for the illustration. (1) Elastic stage: the plot in the initial loading phase is approximately a straight line, and the stress linearly increases with the increase in strain. (2) Strain-hardening stage: with the elevation of strain, the plot begins to deviate from the straight line in the former stage and to stretch as an approximate arc. With the elevation of strain, stress continues to nonlinearly climb to a peak value with a speed slower than that in the former stage. (3) Strain-softening stage: with the continuous elevation of strain, stress shows a remarkable downward trend as soon as stress reaches over the peak value.
For both AC-13 and SMA-13, the stress–strain plots exhibit similar a change with the increase in degree of aging at the same test temperature. The plots of AC13-UA, AC13-STOA, AC13-LTOA2d, AC13-LTOA5d and AC13-LTOA8d in Figure 1 are as shown in Figure: With the increase in aging degree, each plot shifts upward and is left as a whole. Particularly, the slope of the straight line in the elastic stage becomes steeper, which means that the elevation of the degree of aging can increase the rigidity of the asphalt mixture. The arc length and the radius of curvature of the hardening stage curve decrease. At the same time, the downward trend of the strain-softening stage becomes sharper.
For both AC-13 and SMA-13, the stress–strain plots present a few changes with the elevation of test temperature under the same degree of aging. The plots of SMA13-UA in Figure 1, Figure 2, Figure 3 and Figure 4 are used as an example. Each entity generally tends to shift downward and to the right. Specifically, the slope of the elastic stage decreases, which indicates that the rigidity of the asphalt mixture can be weakened with the increase in test temperature. The deviation of the strain-hardening stage curve from the former straight line tends to be more pronounced. Furthermore, the downward trend of the strain-softening stage curve becomes gentler.
There are also differences between stress–strain curves of AC-13 and SMA-13 when the same aging degree and test temperature are considered. The plots of AC13-LTOA2d and SMA13-LTOA2d in Figure 4 are taken as an example. The coverage height of the plot of SMA-13 is lower than that of AC-13. However, the coverage width of the plot of SMA-13 is remarkably greater than that of AC-13, which causes the whole plot of SMA-13 to be plumper.
3.2. Tensile Strength
Table 4 and Figure 5 and Figure 6 present the tensile strength results versus test temperature for AC-13 and SMA-13 under different degrees of aging. As shown in Figure 5 and Figure 6, the tensile strength of both SMA-13 and AC-13 gradually increases with the increase in aging degree when test temperature remains the same. This phenomenon can be explained as follows: under a thermo-oxidative aging environment, light components can be transformed into asphaltene by the chemical reaction between the hydrocarbon (derivatives) in asphalt and oxygen, which undoubtedly increases the number of polar molecules in bitumen. A high temperature can also enhance the polarity of aggregate molecules [33]. It is worth mentioning that the adhesion between asphalt and aggregate is generated by the linkage of polar molecules. Therefore, it follows that the adhesion between bitumen and aggregate can be strengthened and the load-bearing capacity of the asphalt mixture can be enhanced after thermo oxidative aging.
Table 4.
Tensile strength at different test temperatures of AC-13 and SMA-13 under different aging degrees.
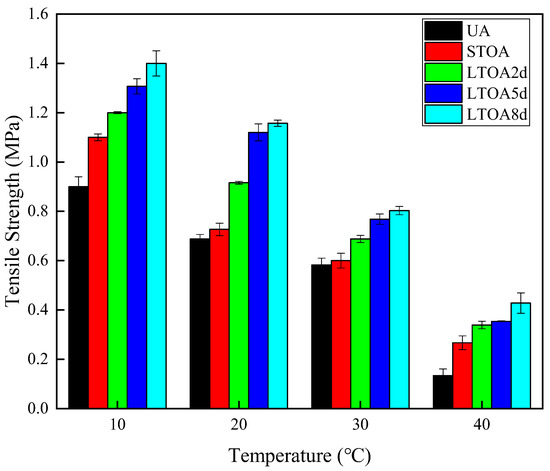
Figure 5.
Tensile strength versus test temperature for AC-13 under different degrees of aging.
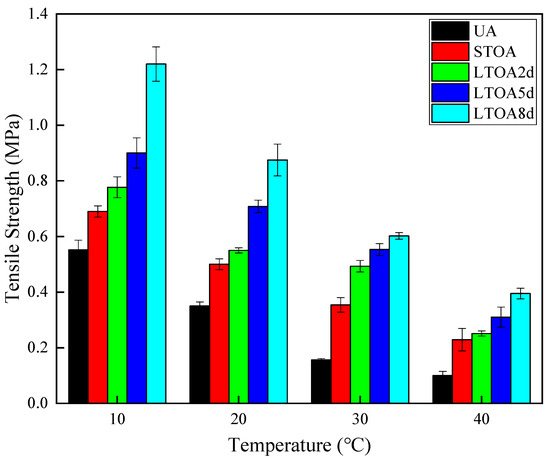
Figure 6.
Tensile strength versus test temperature for SMA-13 under different degrees of aging.
For AC-13, the increase trend of the tensile strength becomes weaker with the overall elevation of aging degree. At 10 °C and 30 °C, STOA presents the most obvious increasing effect on tensile strength, with a growth gradient of 22% (10 °C) and 99% (40 °C). With the increase in aging degree, the growth gradient drops to 10% (10 °C) and 55% (40 °C). Comparatively, there are fluctuations in AC-13 at 20 °C and 30 °C, which means that the LTOA2d condition presents the most obvious increasing effect on tensile strength by a growth gradient of 29% (20 °C) and 15% (30 °C). Similarly, the growth gradient drops to 6% for the LTOA8d condition. At 10 °C and 20 °C, the elevation effect of aging degree on tensile strength of SMA-13 fluctuates, but it is worth noting that the LTOA8d condition exhibits the most remarkable elevation effect by a growth gradient of 20% (10 °C) and 13% (20 °C). At 30 °C and 40 °C, while the STOA condition presents the most obvious increasing effect on the tensile strength of SMA-13 by a growth gradient of 20% (30 °C) and 13% (40 °C). The growth gradient declines with the increase in aging degree at 30 °C; however, it fluctuates at 40 °C.
With the elevation in test temperature, the tensile strength at each degree of aging shows a decreasing trend for both AC-13 and SMA-13. The cause of the phenomenon may be illustrated as follows: the increase in test temperature can intensify the periodic thermal movement of macromolecules inside the asphalt mixture, thus enlarging the distance between the macromolecules, weakening the mutual attraction between the macromolecules, and eventually reducing the load required to destroy the structure of the asphalt mixture [34]. For AC-13 under LTOA2d, LTOA5d and LTOA8d conditions, tensile strength decreases approximately linearly, with an average decline rate of 24% with every increase of 10 °C. Comparatively, for AC-13 under STOA conditions, tensile strength decreases unsteadily by 12% (from 10 °C to 20 °C), 30% (from 20 °C to 30 °C) and 21% (from 30 °C to 40 °C). When it comes to AC-13 under UA conditions, tensile strength decreases by an average decline rate of 18% with every increase of 10 °C when temperature is in the range of from 10 °C to 30 °C; however, a sharp drop in tensile strength by 50% appears when temperature goes up from 30 °C to 40 °C. Similarly, for SMA-13 under UA, STOA, LTOA5d and LTOA8d conditions, tensile strength steadily decreases with an average decline rate of 36% (UA and STOA), 22% (LTOA5d and LTOA8d) with every increase of 10 °C. When it comes to SMA-13 under LTOA2d conditions, volatility occurs in the tensile strength descent trend by 29% (from 10 °C to 20 °C), 7% (from 20 °C to 30 °C) and 31% (from 30 °C to 40 °C).
Additionally, it is easy to see that the tensile strength of AC-13 is higher than that of SMA-13 when the aging degree and test temperature remain the same and the value of the gap can be up to 2.8 times as high (UA, 30 °C). This may be attributed to the following causes: the higher admixture of AC-13 aggregate renders a thicker asphalt mortar film, which has a correspondingly stronger ability to grip the aggregate than SMA-13. In addition, the higher distribution uniformity of air voids in AC-13 means that it performs better regarding the overall structural uniformity of the mixture, thus endowing AC-13 with a higher tensile strength at the macroscopic level [35,36]. Furthermore, the gap between the tensile strength of AC-13 and SMA-13 is narrowed by the elevation of aging degree and test temperature.
3.3. Ultimate Strain
Table 5 and Figure 7 and Figure 8 display the ultimate strain results versus test temperature for AC-13 and SMA-13 under different degrees of aging. As shown in Figure 7 and Figure 8, the ultimate strain of both SMA-13 and AC-13 gradually descends with the increase in aging degree at the same test temperature. The reason for this phenomenon may be that during thermos-oxidative aging, long-term exposure to a high temperature increases the kinetic energy of light molecules in asphalt and further widens the diffusion rate gap between light and heavy molecules, thus weakening the intermolecular attraction and reducing the stability of asphalt mortar or even the overall structure of the asphalt mixture [37].
Table 5.
Ultimate strain at different test temperatures of AC-13 and SMA-13 under different degrees of aging.
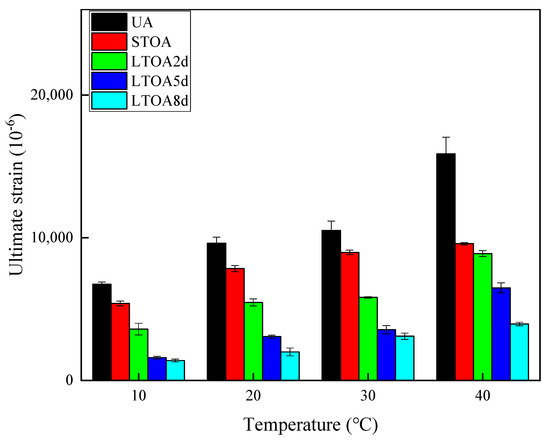
Figure 7.
Ultimate strain versus test temperature for AC-13 under different degrees of aging.
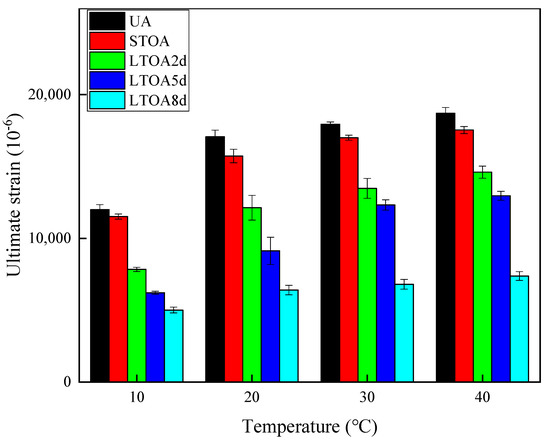
Figure 8.
Ultimate strain versus test temperature for SMA-13 under different degrees of aging.
For AC-13, the ultimate strain of the mixture undergoing STOA, LTOA2d, LTOA5d, and LTOA8d is 19–40%, 43–46%, 59–76%, and 75–80% lower than that of the unaging mixture, respectively. For SMA-13, the ultimate strain of the mixture undergoing STOA, LTOA2d, LTOA5d, and LTOA8d decreases by 4–12%, 21–35%, 31–48%, and 58–64%, respectively, compared with that of the unaging mixture. Additionally, the attenuation effect of aging on the ultimate strain of AC-13 is significantly greater than that of SMA-13. For AC-13 at 10 °C, 20 °C and 40 °C, the ultimate strain decreases linearly when aging degree is confined to LTOA2d conditions by a decrease gradient of 23% (10 °C), 31% (20 °C) and 22% (30 °C). When the degree of aging continuously deepens, the ultimate decrease recedes. It is worth noting that the decrease gradient drops to only 3% (10 °C), 4% (20 °C) and 16% (30 °C) when the degree of aging reaches LTOA8d. When the test temperature is 40 °C, AC-13 treated by STOA conditions shows a dramatic drop in ultimate strain, by 40%. Then, the ultimate strain exhibits an approximate linear descent trend with a decrease gradient of 16%. For SMA-13 at 10 °C and 20 °C, the ultimate strain decreases slightly, by 3% (10 °C) and 8% (20 °C), under STOA conditions, and when aging degree reaches LTOA2d, there is a sharper descent with a decrease gradient of 23% (10 °C) and 21% (20 °C). However, when the degree of aging further decreases, the descent of the ultimate strain slows down and becomes steadier, with a decrease gradient of 9% (10 °C) and 17% (20 °C). For SMA-13 at 30 °C and 40 °C, the descent of the ultimate strain exhibits slight fluctuations, with an average decrease gradient of 5% (STOA), 18% (LTOA2d), 8% (LTOA5d) and 30% (LTOA8d).
With the elevation of test temperature, the ultimate strain under each aging degree shows an increasing trend for both AC-13 and SMA-13. The cause of this phenomenon may be explained as follows: the Brownian motion in asphalt molecules becomes more active, and free volume between molecules increases under the impact of rising temperature, which reduces the viscous flow of asphalt mortar and the eventual enhancement in ultimate strain [38]. For AC-13 under STOA and LTOA8d conditions, the ultimate strain grows nearly proportionally by an average increase rate of 26% (STOA) and 61% (LTOA8d) with every increase of 10 °C. Comparatively, for AC-13, under the other aging conditions, ultimate strain increases unsteadily. However, when test temperature climbs from 30 °C to 40 °C, the sharpest variation in ultimate strain can be seen, with an average increase rate of 80% (UA), 85% (LTOA2d) and 182% (LTOA5d). For SMA-13, the increasing tendency of the ultimate strain is weakened with the elevation of test temperature. For SMA-13 under LTOA5d conditions, ultimate strain steadily increases, with an average increase rate of 50% with every rise of 10 °C, when the discussed test temperature is in the range of from 10 °C to 30 °C. When test temperature increases from 30 °C to 40 °C, the average increase rate drops to only 10%. At the same time, for SMA-13 under the other four aging conditions, ultimate strain lifts by 42% (UA), and only 37% (STOA), 55% (LTOA2d) and 28% (LTOA8d), with the elevation of test temperature from 10 °C to 20 °C. With further elevations in test temperature, the ultimate increasing tendency becomes flat, with an average increase rate of 7% (UA), 8% (STOA), 16% (LTOA2d), 10% (LTOA8d).
Moreover, it is apparent that the ultimate strain of SMA-13 is higher than that of AC-13. This can be explained by the following causes: one is that the contact action between coarse aggregates is more prominent in SMA-13 than AC-13. Furthermore, the lignin fiber in SMA-13 can fully contact and fuse with asphalt to form a wet surface under its large surface area and excellent bitumen-absorbing property, which strengthens the viscosity of the bitumen film wrapped around the aggregate [39,40]. The combined action of the above two aspects can better restrain the sliding between aggregates and then improve the overall deformation of the mixture to a certain extent. In addition, the gap between the ultimate strain of AC-13 and SMA-13 is narrowed with the elevation of test temperature. Furthermore, whatever the test temperature, the largest gap between the ultimate strain of AC-13 and SMA-13 exists under LTOA5d conditions by 3 times (10 °C), 2 times (20 °C), 2.5 times (30 °C) and 1.1 times (40 °C).
3.4. Pre-Peak Strain Energy Density
Table 6 and Figure 9 and Figure 10 show the pre-peak strain energy density results versus test temperature for AC-13 and SMA-13 under different degrees of aging. As shown in Figure 9 and Figure 10, at the same test temperature, the strain energy density of AC-13 and SMA-13 both increase after short-term aging and gradually decay as the aging degree deepens into long-term aging. The reason for this phenomenon may be as follows: after thermo-oxidative aging, the content of the carbonyl group, carbonyl group, sulfoxide group, and aromatic group increases to some degree. During short-term aging, the content of the former two groups, which are beneficial for boosting the association between molecules, jumps with a greater degree so that the toughness of the overall structure of the asphalt mixture is enhanced, and more energy is required for cracking [41]. In comparison, the growth of the aromatic group, which has a high rigidity, dominates in the long-term aging process. The results may reduce the toughness of the overall structure of the asphalt mixture and the energy required for cracking under external loads. Specifically, for AC-13, the pre-peak strain energy density under short-term aging ascends by 2% (10 °C), 14% (20 °C), 17% (30 °C) and 35% (40 °C). When the degree of aging extends to LTOA2d, there is a descent in the pre-peak strain energy density by 10% (10 °C and 40 °C), 16% (20 °C) and 19% (30 °C). However, when the degree of aging extends further, the tendency to decrease slows down and becomes steadier, with a decrease rate of 11% (10 °C), 13% (20 °C and 30 °C) and 20% (40 °C). Likewise, for SMA-13, the pre-peak strain energy density under short-term aging ascends by 35% (10 °C), 60% (20 °C) and 39% (30 °C) and 62% (40 °C). When the degree of aging extends to LTOA2d, there is a violent descent in the pre-peak strain energy density, by 11% (10 °C and 20 °C) 21% (30 °C) and 34% (40 °C). With the continuous deepening of the degree of aging, the decrease trend becomes steadier by a decrease rate of only 8.5%.
Table 6.
Pre-peak strain energy density at different test temperatures of AC-13 and SMA-13 under different degrees of aging.
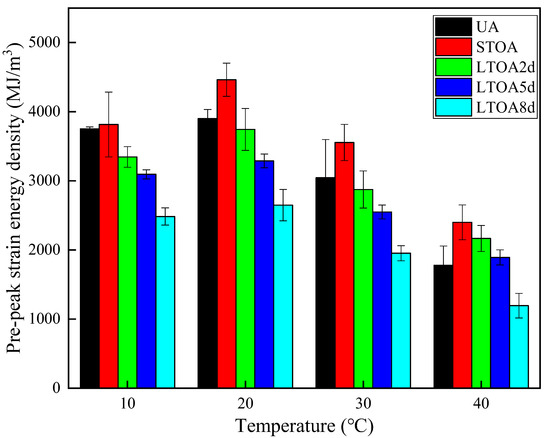
Figure 9.
Pre-peak strain energy density versus test temperature for AC-13 under different degrees of aging.
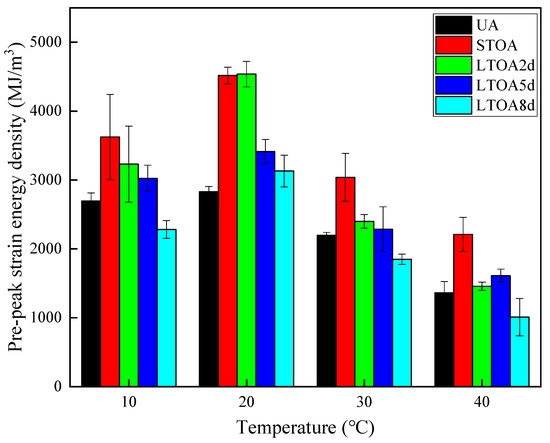
Figure 10.
Pre-peak strain energy density versus test temperature for SMA-13 under different degrees of aging.
For asphalt mixtures with the same aging duration, the pre-peak strain energy density of AC-13 and SMA-13 slightly increases as the test temperature rises from 10 °C to 20 °C, while it descends as the test temperature continues to rise to 40 °C. The reason for this phenomenon may be that the increase in temperature can increase the amplitude of molecular motion, and thus cause a corresponding increase in the heat energy, which activates the rotation of the segment around the main chain axis and exhibits a crimped and stretched conformation [26]. Thus, more energy is required to fracture the overall macrostructure of the asphalt mixture. Furthermore, asphalt mixture exhibits a leather state in the temperature range of 20–40 °C, in which there is a mutual slide between molecules, and the slip becomes more intense with the increase in temperature [33]. Therefore, the energy required to break the interaction between molecular chains eventually drops. As the test temperature rises from 10 °C to 20 °C, the pre-strain energy density of AC-13 grows slightly by 4% (UA), 17% (STOA), 12% (LTOA2d), 6% (LTOA5d) and 3% (LTOA8d). When the test temperature continues to rise, the pre-strain energy density is nearly proportional, with an average decrease rate of 27% (UA), 23% (STOA), 21% (LTOA2d and LTOA5d) and 27% (LTOA8d) with every increase of 10 °C. Analogously, the pre-strain energy density of AC-13 grows slightly by 4% (UA), 17% (STOA), 12% (LTOA2d), 7% (LTOA5d) and 3% (LTOA8d). Analogously, for SMA-13, the pre-strain energy density slightly increases by 5% (UA), 25% (STOA), 20% (LTOA2d), 13% (LTOA5d) and 37% (LTOA8d) when the test temperature rises from 10 °C to 20 °C. Furthermore, it descends nearly linearly, with an average decrease rate of 26% (UA, STOA and LTOA5d) and 33% (LTOA2d and LTOA8d) with every increase of 10 °C.
Furthermore, when test temperature is 10 °C, 30 °C and 40 °C, the pre-peak strain energy density of AC-13 is higher than that of SMA-13 and the gap reaches about 37% on average. However, the pre-peak strain energy density of AC-13 is lower than that of SMA-13 under both short-term and long-term aging conditions when the test temperature is 20 °C.
3.5. Post-Peak Strain Energy Density
Table 7 and Figure 11 and Figure 12 illustrate post-peak strain energy density results for AC-13 and SMA-13, respectively. Similar to the pre-peak strain energy density, as shown in Figure 11 and Figure 12, at the same test temperature, the post-peak strain energy density of AC-13 and SMA-13 both increases under short-term aging and gradually decrease as the degree of aging moves toward long-term aging. Concretely, for AC-13, the post-peak strain energy density under short-term aging ascends by 53% (1 °C), 42% (20 °C) and 53% (30 °C) and 63% (40 °C). When the degree of aging extends to LTOA2d, there is a violent drop in the post-peak strain energy density by 36% (10 °C, 20 °C and 40 °C) and 31% (20 °C). However, when the degree of aging deepens further, there is a tendency to decrease more flatly, with a decrease rate of 14% (10 °C and 30 °C), 11% (20 °C) and 12% (40 °C). In the same way, for SMA-13, the post-peak strain energy density under short-term aging ascends by 29% (10 °C), 25% (20 °C and 30 °C) and 34% (40 °C). When degree of aging extends to LTOA2d, there is a dramatic drop in the post-peak strain energy density by 20% (10 °C), 31% (20 °C) and 38% (30 °C and 40 °C). With the continuous deepening of the degree of aging, the descent trend becomes steadier, with a decrease rate of 6% 10 °C), 3% (20 °C), 10% (30 °C) and 13% (40 °C).
Table 7.
Post-peak strain energy density at different test temperatures of AC-13 and SMA-13 under different degrees of aging.
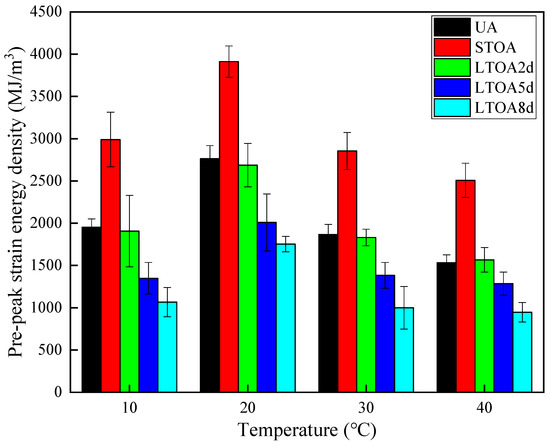
Figure 11.
Post-peak strain energy density versus test temperature for AC-13 under different degrees of aging.
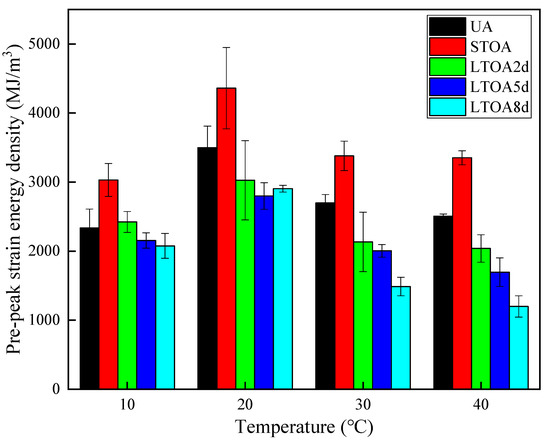
Figure 12.
Post-peak strain energy density versus test temperature for SMA-13 under different degrees of aging.
Moreover, when the aging degree remains the same, as the test temperature increases from 10 °C to 20 °C, the post-strain energy density of AC-13 grows slightly, by 41% (UA and LTOA2d), 31% (STOA), 49% (LTOA5d), 64% (LTOA8d). When the test temperature reaches t30 °C, the post-strain energy density drops dramatically, with a decrease rate of 32% (UA, LTOA2d and LTOA5d), 27% (STOA) and 43% (LTOA8d). Comparatively, the descent trend of the post-strain energy density becomes stable, with a decrease rate of 12% (UA and LTOA2d), 17% (STOA) and 22% (LTOA5d LTOA8d). Ulteriorly, the post-strain energy density of SMA-13 grows slightly, by 50% (UA), 44% (STOA), 25% (LTOA2d) and 35% (LTOA8d), as the test temperature climbs from 10 °C to 20 °C. Furthermore, when the test temperature reaches 30 °C, a sudden drop appears in the post-strain energy density of SMA-13, with a decrease rate of 23% (UA and STOA), 30% (LTOA2d and LTOA5d) and 47% (LTOA8d). Furthermore, when test temperature rises from 30 °C to 40 °C, it also decreases more steadily, with a decrease rate of 6% (UA) 2% (STOA), 4% (LTOA2d), 11% (LTOA5d and LTOA8d).
When the aging degree and test temperature both remain the same, the post-peak strain energy density of SMA-13 is higher than that of AC-13, and the value of the gap can reach up to 95% (LTOA8d, 10 °C). The causes of the phenomenon can be explained as follows: There are more coarse aggregates in SMA-13, which provides it with a better skeleton action between coarse aggregates than AC-13. Additionally, a favorable skeleton action can produce a certain hoop effect on asphalt mortar and hinder asphalt mortar from peeling from aggregates [35]. Furthermore, due to the addition of fiber with a superior tensile performance, the fiber in SMA-13 acts as a reinforcement to the effective transfer of stress when exposed to an external load, thus delaying cracking propagation [42]. Therefore, more energy is needed to destroy the structure of SMA-13.
3.6. Analysis of CRI and Aging Coefficient
Previous analyses have shown that different conclusions may be drawn when different indicators are used to evaluate the cracking resistance of the asphalt mixture. In order to make up for the defects in single-indicator evaluation, the above four indicators are combined to propose a comprehensive indicator. Table 8 shows the weight of each indicator, calculated by the entropy weight method, and Table 9 shows the calculation results of the entropy weight TOPSIS method.
Table 8.
Calculation results of entropy weight of four direct tension test indexes.
Table 9.
Calculation results of CRI for AC-13 and SMA-13.
As shown in Table 8, the CRI of SMA-13 is larger than that of AC-13, suggesting that the former has superior cracking resistance to the latter. The main reason for this is that ultimate strain and post-peak strain energy density are given greater weight among the four indexes, as shown in Table 8. Furthermore, the CRI of AC-13 and SMA-13 under STOA conditions increases by 4–20% and 14–24%, respectively, compared with the unaging condition. The results show that STOA improves the cracking resistance of both AC-13 and SMA-13. In addition, the benefit is weakened with the increase in the test temperature. In contrast, the CRI under LTOA conditions is lower than that under unaging conditions for both AC-13 and SMA13, suggesting that long-term aging weakens their cracking resistance. Furthermore, this weakening effect becomes more pronounced as the test temperature increases.
Figure 13 and Figure 14 depict the aging coefficient results versus test temperature for AC-13 and SMA-13 under different degrees of aging. The aging coefficient is defined as the ratio of CRI under aging conditions compared to that under unaging conditions, which can eliminate the impact of CRI under unaging conditions. Figure 13 and Figure 14 illustrate the aging coefficient versus test temperature for AC-13 and SMA-13, respectively. As shown in Figure 13 and Figure 14, the aging coefficient of SMA-13 is higher than that of AC-13 by 1.4–36% when aging degree and test temperature remain the same, which means that SMA-13 is superior to AC-13 in terms of aging resistance. In addition, for both AC-13 and SMA-13, the aging coefficient under STOA condition is above 1, which demonstrates that STOA can have an increasing effect on the cracking resistance of AC-13 and SMA-13. For AC-13, the aging coefficient increases by 20%, 15%, 13%, 4%, respectively, at 10 °C, 20 °C, 30 °C and 40 °C; for SMA-13, this increases by 24%, 17%, 16%, 14%, respectively, at 10 °C, 20 °C, 30 °C and 40 °C. It is apparent that the increase amplitude of the aging coefficient of SMA-13 is bigger than that of AC-13, which demonstrates that the gaining effect of STOA is more prominent on SMA-13. Furthermore, it is not difficult to determine that the gaining effect can be lowered with the elevation of test temperature.
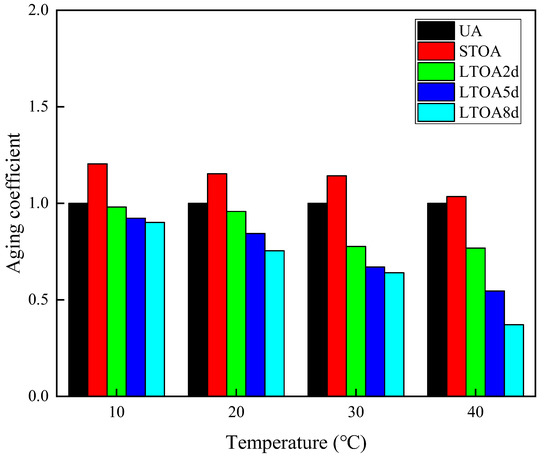
Figure 13.
Aging coefficient versus test temperature for AC-13 under different degrees of aging.
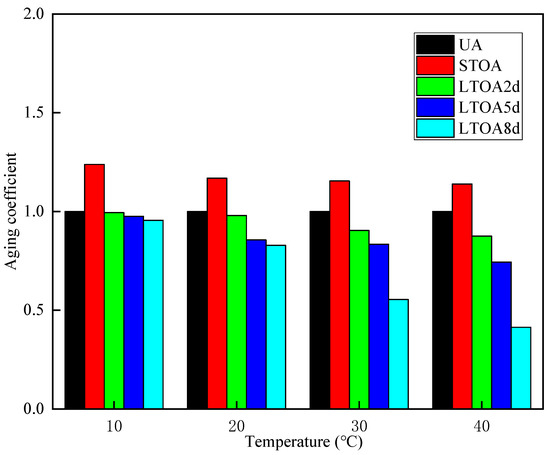
Figure 14.
Aging coefficient versus test temperature for SMA-13 under different degrees of aging.
Under LTOA conditions, the aging coefficient is below 1, and the aging coefficient decreases with the deepening of the degree of aging. This shows that LTOA conditions can have a weakening effect on the cracking resistance, and the weakening effect becomes increasingly prominent with the deepening of aging degree. For AC-13, the aging coefficient decreases by 2–23% (LTOA2d), 7–45% (LTOA5d), 10–63% (LTOA8d). For SMA-13, the aging coefficient decreases by 1–12% (LTOA2d), 2–25% (LTOA5d), 4–59% (LTOA8d). Additionally, the decrease amplitude of the aging coefficient of SMA-13 is smaller than that of AC-13, which indicates that the weakening effect of LTOA is more prominent on AC-13. Similarly, it is not difficult to find that the gaining effect can be lowered by the elevation of test temperature.
Meanwhile, a non-linear surface fitting method was applied to better describe the relationship between the aging coefficient and long-term aging duration and test temperature. Figure 15 and Table 10 depict the corresponding fitting result. The correlation coefficient of the fitting result of AC-13 and SMA-13 is 0.95 and 0.94, respectively, which reveals that the formula that is used can describe the relationship between the aging coefficient and the long-term aging duration and test temperature, where c denotes aging coefficient, d denotes long-term aging duration, and T denotes test temperature.
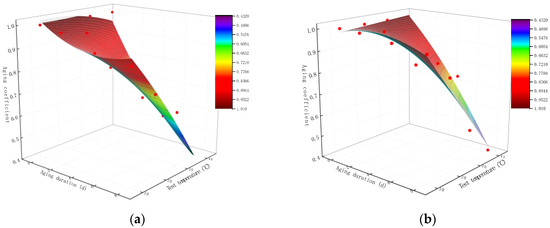
Figure 15.
Non-linear surface fitting graph: (a) AC-13; (b) SMA-13.
Table 10.
Non-linear surface fitting result.
In conclusion, SMA-13 is superior to AC-13 regarding the cracking resistance when considering different aging degrees and test temperatures. However, in practical engineering, economic cost is a necessary factor to be considered, so a brief cost analysis is given in Table 11. Table 11 shows that the annual expenses are 16.5 RMB·m−2 for AC-13 pavement; however, they are 11.4 RMB·m−2 on SMA-13. Apparently, the application of SMA-13 can save costs by 44% when compared with AC-13.
Table 11.
Cost calculation of AC-13 and SMA-13 [43].
4. Conclusions
A direct tension test was conducted on two kinds of asphalt mixture (AC-13 and SMA-13) with five degrees of aging (UA, STOA, LTOA2d, LTOA5d and LTOA8d) at different test temperatures (10 °C, 20 °C, 30 °C, 40 °C). The objective is to comprehensively investigate the effect of aging degree/test temperature/gradation on the cracking resistance of the asphalt mixture. The main findings of this paper are as follows:
- For both AC-13 and SMA-13, the tensile strength gradually ascends as the degree of aging progresses further, but descends as test temperature rises. Additionally, AC-13 has a higer tensile strength than SMA-13. The ultimate strain increases as the degree of aging degree progresses further, but decreases as the test temperature increases. SMA-13 can produce a higher ultimate strain compared with AC-13.
- For both AC-13 and SMA-13, the pre-peak strain energy density increases as the degree of aging progresses further, but goes down as the test temperature increases. SMA-13 can produce a higher ultimate strain than AC-13. STOA conditions can boost the pre-peak and post-peak strain energy density, while LTOA conditions can reduce them. Additionally, the pre-peak and post-peak strain energy density both exhibit a tendency to increase first and then decrease, with their maximum occurring at 20 °C. Moreover, the superiority of SMA-13 lies in the post-peak strain energy density rather than the pre-peak strain energy density.
- In the discussed region of aging degree and test temperature, SMA-13 has a higher CRI and aging coefficient value than AC-13 by 3–69%; this means that SMA-13 is endowed with a better cracking resistance whether it is under aging conditions or not.
- STOA can enlarge the aging coefficient of the asphalt mixture, which means that STOA can increase cracking resistance even under aging conditions. Additionally, this positive effect can be weakened by an elevation in test temperature. LTOA can lower the aging coefficient, which indicates that LTOA can weaken the cracking resistance and the lowering effect can be boosted by elevations in the test temperature
- The relationship between aging coefficient and the two factors (aging degree and test temperature) can be reflected by the functional expression of the non-linear surface (R2 = 0.95 for AC-13 and R2 = 0.94 for SMA-13).
Author Contributions
Conceptualization, S.Y.; data curation, S.Y. and K.L.; formal analysis, S.Y.; funding acquisition, Z.Z.; investigation, S.Y.; methodology, S.Y.; resources, K.L.; supervision, Z.Z.; validation, K.L.; writing—original draft, S.Y.; writing—review and editing, S.Y. and K.L. All authors have read and agreed to the published version of the manuscript.
Funding
This research was funded by Science and Technology Planning Project of Transportation of Guangdong Province, grant number 1912-0002.
Institutional Review Board Statement
Not applicable.
Informed Consent Statement
Not applicable.
Data Availability Statement
Data sharing not applicable.
Conflicts of Interest
The authors declare no conflict of interest.
References
- Abouelsaad, A.; White, G. The combined effect of ultraviolet irradiation and temperature on hot mix asphalt mixture aging. Sustainability 2022, 14, 5942. [Google Scholar] [CrossRef]
- Hu, H.W.; Vizzari, D.; Zha, X.D.; Roberts, R. Solar pavements: A critical review. Renew Sustain. Energy Rev. 2021, 152, 111712. [Google Scholar] [CrossRef]
- Song, J.C.; Fu, S. Analysis of aging behavior of drainage asphalt mixture in transportation. J. Highw. Transp. Res. Dev. 2019, 15, 93–96. (In Chinese) [Google Scholar]
- Yan, K.W.; Su, X.; Zhu, Y.F.; Si, C.D. Analysis of low temperature cracking resistance of asphalt mixture and simulation of fracture process. J. Guangxi. Univ. 2021, 46, 89. (In Chinese) [Google Scholar]
- Zhu, Y.; Zhang, J.; Si, C.; Yan, T.; Li, Y. Laboratory Evaluation on Performance of Recycled Asphalt Binder and Mixtures under Short-Term Aging Conditions. Sustainability 2021, 13, 3404. [Google Scholar] [CrossRef]
- Song, Y.; Liu, H.; Ding, N. The low temperature performance of warm mix asphat mixture considering aging. J. Comp. Mater. 2018, 35, 441–450. (In Chinese) [Google Scholar] [CrossRef]
- Bonaquist, R.; Paye, B.; Johnson, C. Application of Intermediate temperature semi-circular bending (SCB) test results to design mixtures with improved load associated cracking resistance. Road Mater. Pavement Des. 2016, 18, 2–29. [Google Scholar] [CrossRef]
- Chen, Q.; Ling, T.; He, L. Study on influence factors of asphalt mixture cracking resistance based on SCB test. Highw. Traffic Tech. 2018, 34, 37–41. (In Chinese) [Google Scholar] [CrossRef]
- Wang, L.; Shan, M.; Li, C. The cracking characteristics of the polymer-modified asphalt mixture before and after aging based on the digital image correlation technology. Constr. Build. Mater. 2020, 260, 119802. [Google Scholar] [CrossRef]
- Wu, B.; Wu, X.; Xiao, P.; Chen, C.; Xia, J.; Lou, K. Evaluation of the Long-Term Performances of SMA-13 Containing Different Fibers. Appl. Sci. 2021, 11, 5145. [Google Scholar] [CrossRef]
- Islam, M.R.; Hossain, M.I.; Tarefder, R.A. A Study of Asphalt aging using indirect tensile strength test. Constr. Build. Mater. 2015, 95, 218–223. [Google Scholar] [CrossRef]
- Radeef, H.R.; Abdul, N.; Razin, A. Effect of aging and moisture damage on the cracking resistance of rubberized asphalt mixture. Mater. Today Proc. 2021, 42, 2853–2858. [Google Scholar] [CrossRef]
- Omranian, S.R.; Hamzah, M.O.; Valentin, J.; Hasan, M.R.M. Determination of optimal mix from the standpoint of short term aging based on asphalt mixture fracture properties using response surface method. Constr. Build. Mater. 2018, 179, 35–48. [Google Scholar] [CrossRef]
- Ye, S. Crack Resistance of Aged Asphalt Mixture at Low Temperatrue Based on SCB Test. Master’s Thesis, Anhui University of Science and Technology, Huainan, China, 2022. (In Chinese). [Google Scholar] [CrossRef]
- Wang, J.; Qin, Y.; Zeng, W. Crack resistance of plant mixed reclaimed SBS modified asphalt mixture. J. Chang’an Univ. 2019, 39, 27–34+51. (In Chinese) [Google Scholar] [CrossRef]
- Hamedi, G.H.; Saedi, D.; Ghahremani, H. Effect of short-term aging on low-temperature cracking in asphalt mixtures using mechanical and thermodynamic methods. J. Mater. Civil. Eng. 2020, 13, 04020288. [Google Scholar] [CrossRef]
- Arabzadeh, A.; Staver, M.D.; Podolsky, J.H.; Williams, R.C.; Hohmann, A.D.; Cochran, E.W. At the frontline for mitigating the undesired effects of recycled asphalt: An alternative bio oil-based modification approach. Constr. Build. Mater. 2021, 310, 125253. [Google Scholar] [CrossRef]
- Li, P.; Wu, Z.; Ma, K.; Zhang, Y. Study on low temperature crack resistancec of asphalt mixture based on SCB test. J. Wuhan. Uni. Tech. 2015, 39, 238–241. (In Chinese) [Google Scholar]
- Yin, H.; Gao, S. The low temperature crack resistancec of asphalt mixture evaluated by indirect tension test. J. Func. Mater. 2021, 52, 9126–9130. (In Chinese) [Google Scholar]
- Zhang, R.H.; Huang, J.D.; Zheng, W. Evaluation of the significance of different mix design variables on asphalt mixtures cracking performance measured by laboratory performance tests. Constr. Build. Mater. 2022, 350, 128693. [Google Scholar] [CrossRef]
- Ashani, S.S.; Varamini, S.; Elwardany, M.D.; Tighe, S. investigation of low-temperature cracking resistance of asphalt mixtures by conducting disc-shaped compact tension (DCT) and semi-circular bend (SCB) tests. Constr. Build. Mater. 2022, 359, 129275. [Google Scholar] [CrossRef]
- Stewart, C.M.; Oputa, C.W.; Garcia, E. Effect of specimen thickness on the fracture resistance of hot mix asphalt in the disk-shaped compact tension (DCT) configuration. Constr. Build. Mater. 2018, 160, 487–496. [Google Scholar] [CrossRef]
- Phan, T.M.; Nguyen, S.N.; Seo, C.B.; Park, D.W. Effect of treated fibers on performance of asphalt mixture. Constr. Build. Mater. 2021, 274, 122051. [Google Scholar] [CrossRef]
- Li, X.; Gibson, N.; Youtcheff, J. Evaluation of asphalt mixture cracking performance using the monotonic direct tension test in the AMPT. Road Mater. Pavement Des. 2017, 18, 447–466. [Google Scholar] [CrossRef]
- Wang, D.; Guo, D.T.; Chang, H.; Yao, H.X.; Wang, T. Research on the Performance of regenerant modified cold recycled mixture with asphalt emulsions. Sustainability 2021, 13, 7284. [Google Scholar] [CrossRef]
- Yang, T.; Chen, S.Y.; Pan, Y.Y.; Zhao, Y.L. Investigation of the accuracy of fracture energy in evaluating the low-temperature cracking performance of asphalt mixture. J. Mater. Civ. Eng. 2022, 34, 04022201. [Google Scholar] [CrossRef]
- Zheng, D. Research on Key Parameters and Viscoelastic Analysis of Semi-Circular Bending Fracture Test of Asphalt Mixture at Low Temperature. Master’s Thesis, Southeast University, Nanjing, China, 2020. [Google Scholar]
- Liu, Z.; Li, S.; Wang, Y. Characteristics of asphalt modified by waste engine oil/polyphosphoric acid: Conventional, high-temperature rheological, and mechanism properties. J. Clean. Prod. 2022, 330, 129844. [Google Scholar] [CrossRef]
- Idem, Z.G.; Bura, A. Developing a harvest plan by considering the effects of skidding techniques on forest soil using a hybrid topsis-entropy method. For. Sci. 2022, 68, 312–324. [Google Scholar]
- Fan, A. Evaluation and countermeasures of future medical and pension security problems in shenzhen based on entropy weight and TOPSIS. Adv. Appl. Math. 2021, 10, 603–616. (In Chinese) [Google Scholar] [CrossRef]
- Chang, J.; Li, J.; Hu, H.W.; Qian, J.F.; Yu, M. Numerical investigation of aggregate segregation of superpave gyratory compaction and its influence on mechanical properties of asphalt mixtures. J. Mater. Civ. Eng. 2023, 35, 04022453. [Google Scholar] [CrossRef]
- Wei, H.; Zhang, H.; Li, J.; Zheng, J.; Ren, J. Effect of loading rate on failure characteristics of asphalt mixtures using acoustic emission technique. Constr. Build. Mater. 2023, 364, 129835. [Google Scholar] [CrossRef]
- Li, J.; Zhang, J.H.; Yang, X.R.; Zhang, A.S.; Yu, M. Monte carlo simulations of deformation behaviour of unbound granular materials based on a real aggregate library. Int. J. Pavement. Eng. 2023, 24, 2165650. [Google Scholar] [CrossRef]
- Li, G.N.; Gu, Z.J.; Tan, Y.Q.; Xing, C.; Zhang, J.J.; Zhang, C. Research on the phase structure of styrene-butadiene-styrene modified asphalt based on molecular dynamics. Constr. Build. Mater. 2022, 326, 126933. [Google Scholar] [CrossRef]
- Liu, G.Q.; Han, D.D.; Zhu, C.Z.; Wang, F.F. Asphalt-mixture force chains length distribution and skeleton composition investigation based on computational granular mechanics. J. Mater. Civ. Eng. 2021, 33, 04021033. [Google Scholar] [CrossRef]
- Zhao, Y.J.; Zhang, Y.; Jiang, J.W. Application and Improvement of discrete finite-element method for mesoscale fracture analysis of asphalt mixtures. J. Transp. Eng. Part B Pavements 2021, 147, 04021001. [Google Scholar] [CrossRef]
- Yang, Y.; Wang, Y.X.; Cao, J.; Xu, Z.G.; Li, Y.L.; Liu, Y.H. Reactive molecular dynamic investigation of the oxidative aging impact on asphalt. Constr. Build. Mater. 2021, 279, 121298. [Google Scholar] [CrossRef]
- Yu, C.H.; Hu, K.; Yang, Q.L.; Chen, C.J. Multi–scale observation of oxidative aging on the enhancement of high–temperature property of SBS–modified asphalt. Constr. Build. Mater. 2021, 313, 125478. [Google Scholar] [CrossRef]
- Yue, Y.C.; Abdelsalam, M.; Khater, A.; Mohamed, G. A comparative life cycle assessment of asphalt mixtures modified with a novel composite of diatomite powder and lignin fiber. Constr. Build. Mater. 2022, 323, 126608. [Google Scholar] [CrossRef]
- Xia, Y. Comprehensive Study about Effect of Basalt Fiber, Gradation, Nominal Maximum Aggregate Size and Asphalt on the Anti-Cracking Ability of Asphalt Mixtures. Appl. Sci. 2021, 11, 2289. [Google Scholar] [CrossRef]
- Zhou, Y.; Chen, J.D.; Zhang, K.; Guan, Q.H.; Guo, H.M.; Xu, P.; Wang, J. Study on aging performance of modified asphalt binders based on characteristic peaks and molecular weights. Constr. Build. Mater. 2019, 225, 1077–1085. [Google Scholar] [CrossRef]
- Wu, B.W.; Meng, W.J.; Xia, J.; Xiao, P. Influence of basalt fibers on the crack resistance of asphalt mixtures and mechanism analysis. Materials 2022, 15, 744. [Google Scholar] [CrossRef]
- Ren, Y.; Zheng, Y. The comprehensive benefit analysis of economic SMA based on the whole life cycyle theory. Highway 2015, 60, 201–206. [Google Scholar]
Disclaimer/Publisher’s Note: The statements, opinions and data contained in all publications are solely those of the individual author(s) and contributor(s) and not of MDPI and/or the editor(s). MDPI and/or the editor(s) disclaim responsibility for any injury to people or property resulting from any ideas, methods, instructions or products referred to in the content. |
© 2023 by the authors. Licensee MDPI, Basel, Switzerland. This article is an open access article distributed under the terms and conditions of the Creative Commons Attribution (CC BY) license (https://creativecommons.org/licenses/by/4.0/).