Abstract
Cs2LiYCl6: Ce3+ (CLYC) is a dual-mode gamma-neutron scintillator with a medium gamma-ray resolution and pulse-shape discrimination (PSD) capability. The PSD performance of CLYC is greatly weakened when coupled with silicon photomultipliers (SiPMs) because of SiPMs’ low detection efficiency for the ultrafast Core-Valence-Luminescence (CVL) component under gamma excitation. In our previous work, the PSD Figure-of-Merit (FoM) value was optimized to 2.45 at the gamma-equivalent energy region of the thermal neutron by using the charge comparison method. However, this value was reduced to 1.37 at the lower gamma-equivalent energy region of more than 325 keV, and neutrons were difficult to distinguish from gamma rays. Hence, new algorithms should be studied to improve the PSD performance at low gamma-equivalent energy regions. Convolutional Neural Networks (CNNs) have excellent image recognition capabilities, and thus, neutron and gamma-ray waveforms can be discriminated by their characteristics through a known training set. In this study, neutron and gamma-ray waveforms were measured with a 137Cs source and moderated 252Cf source via an SiPM array-coupled CLYC detector and divided into two groups: training and PSD testing. The CNN training set comprised 137Cs characteristic gamma-ray waveforms and thermal neutron waveforms that were discriminated by the charge comparison method from the training group. A CNN with two convolution-pooling layers was designed to accomplish PSD with the test group. The PSD FoM value of the CNN method was calculated to be 37.20 at the gamma-equivalent energy region of more than 325 keV. This result was much higher than that of the charge comparison method, indicating that neutrons and gamma rays could be better distinguished with the CNN method, especially at low gamma-equivalent energy regions.
1. Introduction
A Cs2LiYCl6: Ce3+ (CLYC) scintillator is a scintillation crystal capable of simultaneously detecting neutrons and gamma rays [1,2]. CLYC crystals have four scintillation mechanisms [3]: core-to-valence luminescence (CVL), Ce3+ (direct electron–hole capture by Ce3+), Vk (binary Vk-electron diffusion), and self-trapped exciton (STE) emission, where CVL and Ce3+ have a shorter decay time. The secondary particles produced by γ-rays in CLYC crystals are electrons, while thermal neutrons cause 6Li (n, α)3H, and fast neutrons will have 35Cl (n, p)35S, 35Cl (n, α)35P nuclear reactions [4]. Electrons in CLYC will have CVL, Ce3+, Vk, and STE mechanisms, while heavy ions such as α particles and 3H only have Vk and STE mechanisms [5]. Therefore, the different emission mechanisms of neutrons and γ-rays in CLYC lead to the difference in pulse waveforms. Silicon photomultipliers (SiPMs) are solid-state photomultipliers with the following features: small size, high gain, low voltage, and magnetic field insensitivity [6]. Therefore, SiPM-coupled CLYC detectors are used in small spectrometers [7], environmental dose detection [8], space radiation measurement [9], and other fields. In these fields, CLYC detectors work in complex radiation environments where pulse-shape discrimination (PSD) is required.
Commonly used PSD methods are: charge comparison, rise-time [10], and frequency-domain analyses (wavelet transform [11] and pulse-gradient analysis [12]). However, the discrimination effect of the rise-time method is generally not as good as that of the charge comparison method, and the frequency-domain analysis method needs to convert the time-domain signal to the frequency domain, which requires additional calculation. Therefore, the charge comparison method is widely used and very suitable for the current pulse [5]. The charge comparison method uses the ratio of the integral amplitude of the signal in different time windows as the discrimination parameter to discriminate the particles, namely the fast-integration time window and the slow-integration time window. The fast time window includes the sharp rise part and the peak part of the signal, while the slow time window includes the signal-attenuation part, as shown in Figure 1. However, SiPMs’ large parasitic capacitance will integrate the initial current pulse, resulting in the reduction in the difference between the neutron and γ signal shape, and therefore reducing the PSD performance of the charge comparison method [13]. Dinar et al. used a pole-zero cancellation network to offset the influence of large capacitance on the signal [14], and Wang et al. used the signal-differentiation algorithm to amplify the difference between the shape of a neutron and the gamma signal, and then used the charge comparison method to discriminate the signal [9]. Subsequently, the results showed that the charge comparison method had excellent PSD performance in the thermal neutron-equivalent electron luminescence energy region. However, due to the decrease in signal amplitude and signal-to-noise ratio in the lower equivalent electron luminescence energy region, the effect of neutron and gamma signal discrimination was poor, and particle discrimination was impossible. In addition, the PSD performance of the charge comparison method heavily depended on the selection of window parameters [2]; these window parameters needed to be traversed and optimized in advance to improve the calculation time of PSD. Therefore, the SiPM-coupled CLYC detector urgently needs an efficient calculation method that can improve the PSD discrimination ability in the low equivalent electron luminescence energy region.
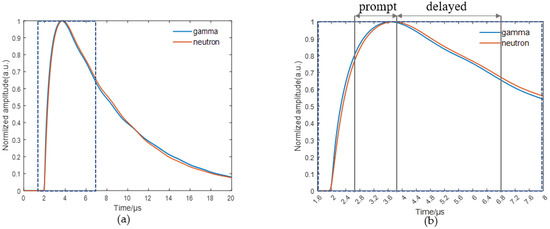
Figure 1.
Schematic diagram of time window selection for charge comparison method. (a) is the original diagram; (b) is the enlargement of the dotted box area in (a).
Artificial neural networks, one of the main methods in nonlinear science and computational intelligence science, were first applied to n/γ particle discrimination in 1998 by Zhong et al., who found that the use of an artificial neural network could improve the effect of PSD discrimination in low-energy regions [15]. Subsequently, Esposito [16], Ronchi [17], and Liu et al. [18] used artificial neural networks to achieve n/γ particle discrimination in different measurement conditions and detectors. However, in these studies, the artificial neural network structure was based on the traditional backpropagation neural network (BPNN). Traditional BPNNs have the following main defects: (1) the learning speed is slow; and (2) the network generalization ability is poor [19], which leads to problems such as a high time consumption and low accuracy in PSD discrimination. The Convolutional Neural Network (CNN) also uses the backpropagation framework for learning in supervised learning [20], but it contains convolution and pooling layers, with local connections, weight sharing, and rough descriptions [21]. Compared with traditional BPNNs, CNNs have a better learning rate and generalization ability [22].
Therefore, a CNN was designed in this study and the input signal in the two-dimensional matrix format was selected to be used in the PSD of the CLYC detector. This study aimed to discriminate the collected neutron and gamma signals and analyze them in comparison with the result of the charge comparison method.
2. Data Acquisition
In our experiment, we used a CLYC scintillator with an 6Li enrichment degree of 95% manufactured by Beijing Glass Research Institute, a cylinder with a size of φ3.81 cm × 3.81 cm. The silicon photomultiplier uses the 8 × 8 array from SensL where each element is composed of 3 × 3 mm2 J-series SiPM elements. A φ62 mm readout board was designed to sum all the outputs of each sensor to a single-channel output and amplify this output by a Trans-Impedance Amplifier (TIA) circuit. The SiPM’s bias voltage was converted by a 5.5 V input on the readout board and was set to 28.5 V. A 2 mm-thick aluminum shell was machined to assemble this detector. An oscilloscope (6104 A, Lecroy) operating at a frequency of 500 Ms/s in 12-bit mode was used to acquire detector pulses with a length of 20 μs. The properties of CLYC and SiPM are shown in Table 1 and Table 2. The experiment uses a 137Cs source with an activity of 10 kBq to collect gamma signals. The 252Cf source with an activity of 9 kBq is moderated by polyethylene with a size of 30 cm × 30 cm × 24 cm to obtain thermal neutrons. The 252Cf source and the CLYC detector were placed in a cylindrical hole of φ10 cm × 14 cm inside the polyethylene, as shown in Figure 2, to obtain a higher thermal neutron flux. The energy spectrum of 252Cf neutron source is shown in Figure 3. After calculation, the ratio of thermal neutrons to nonthermal neutrons was 1:2.61, so the γ signal in the article was mainly collected by 137Cs. We set the signal threshold to 420 mV (equivalent electron luminescence energy is about 325 keV), and then randomly divided the signals collected by the CLYC detector into two groups: a training set and a test set, where the training set is the signal at the γ peak and the thermal neutron peak of the collected signal; the test set signal has no special requirements. The training set was used to select the charge comparison method’s parameters and train CNN, while the test set was utilized to compare the charge comparison method’s and CNN’s PSD performance.

Table 1.
CLYC’s main properties.
Table 2.
SiPMs’ main properties.
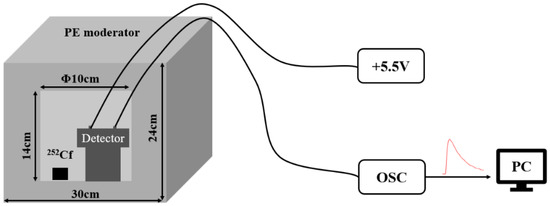
Figure 2.
Thermal neutron signal acquisition.
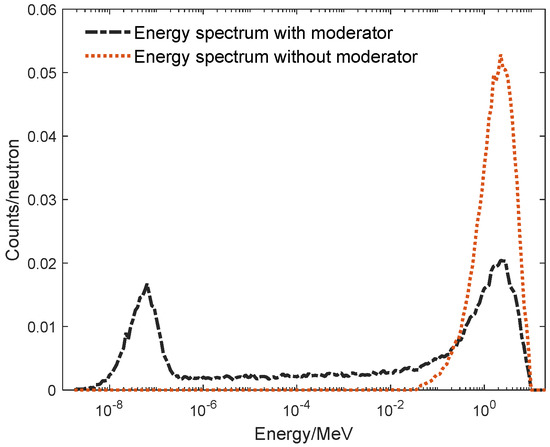
Figure 3.
The simulated energy spectrum of 252Cf neutron source moderated by PE.
3. Pulse-Shape Discrimination
3.1. Time Window Optimization of Charge Comparison
Figure 4 depicts the normalized pulse form created by neutrons and gamma rays in the CLYC scintillator. The γ and neutron signals in Figure 4 were extracted from the 137Csγ peak and the 252Cf source thermal neutron peak, respectively. The equivalent energy of the gamma signal was 637.98 keV (energy resolution: 8%@662 keV), and the equivalent energy of the neutron signal was 3266.58 keV. After normalization, the equivalent energy of the gamma signal was 1270.23 keV, the neutron signal was 1262.67 keV, and there was no significant difference in electron equivalents. There is an observable, but unclear, difference between the two waveforms. Due to the large parasitic capacitance of the SiPM array, the difference in pulse shape appears on the rising edge instead of the falling edge due to the integration of the parasitic capacitance on the signal. Moreover, the single signal as illustrated in Figure 4, rather than the average signal, is more disturbed by noise, resulting in a faster reduction in neutrons on the falling edge of the signal. The charge comparison method can discriminate unknown signals based on the difference between different signals. The more obvious the initial difference between neutron and gamma signals, the better the PSD performance. The selection of the prompt and total window is shown in Figure 4. There are many possible combinations of window widths. Under this condition, choosing the best window combination can produce the best discrimination performance. We then discriminated the signal by the PSD parameter, which is calculated as
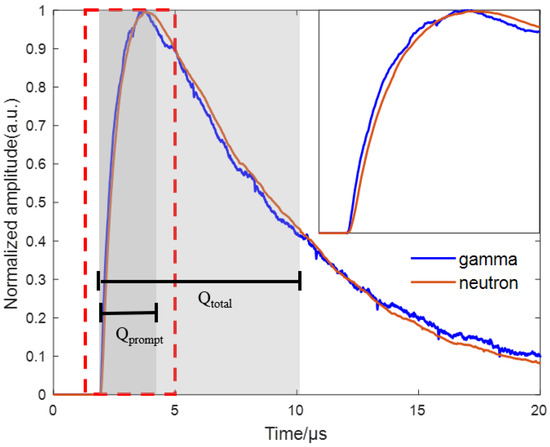
Figure 4.
The pulse shape and time window of neutron and γ in CLYC.
Here, Qt is the total window charge integral and Qp is the prompt window charge integral. The figure of merit (FoM) was introduced to evaluate the PSD’s performance and is defined as
where |Pγ − Pn| represents the distance between the γ peak and the neutron peak, and FWHMγ and FWHMn are the half-height widths of the γ and neutron peaks, respectively.
This study set the prompt window range to [0, 1 s] and the total window range to [0, 2 s] to produce the best combination of prompt and total windows, wherein the value of the total window should be greater than that of the prompt window, traversed in steps of 10 ns. After the traversal was completed, a two-dimensional distribution map of the PSD FoM value changing with the prompt and total window could be drawn. In Figure 5, it can be seen that the FoM value is more sensitive to changes in the prompt window. The optimal prompt and total window size under this experimental condition are [140 ns, 530 ns].
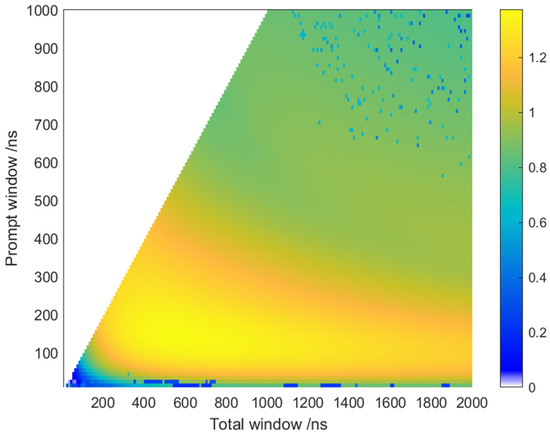
Figure 5.
Two-dimensional histogram of PSD FoM value changing with prompt window and total window.
3.2. Convolutional Neural Network
The CNN consists of three parts: the convolution layer, the pooling layer, and the fully connected layer. Local features can be extracted from signals by the convolution layer, and its calculation principle is
The pooling layer can reduce the magnitude of parameters, and the calculation principle is
The fully connected layer is responsible for parameter output, and its calculation principle is
Here, the superscript of the parameter represents the number of network layers: a is the output value, W is the weight, b is the additional bias, and f is the activation function [23].
The sample error is obtained after the Convolutional Neural Network has completed forward propagation, and then the weights are updated by gradient descent and backward propagation. The error gradient of the output layer z is equal to δ, and its transmission in the fully connected layer is
The pooling layer’s transfer mode is
The transfer mode in the convolution layer is
The and values are then determined according to the relationship between z, W, and b. The weights are updated using the formula below.
where η is the learning efficiency, λ is the regularization coefficient, and n is the number of training samples.
The training set signal is first classified by the charge comparison method, with the neutron signal’s label set to 1 and γ set to 0. The unknown set signal does not need to be classified. The structure of the CNN network in this study is shown in Figure 6, which includes the signal feature extraction process and the signal classification process. After passing through the convolutional (the activation function is ReLU, defined in Equation (10)) and pooling layers to extract features, the spread layer will modify the signal to a shape suitable for the input of the fully connected layer, then pass through two fully connected layers (the activation function is ReLU). Finally, at the output layer (the activation function is sigmoid, defined in Equation (11)), the output parameters corresponding to each input signal are output. The backpropagation algorithm can transfer the error between the output parameter a and the preset label of the signal and modify the structural parameters in the CNN, reducing the error between parameter a and the preset label to increase the CNN’s discrimination accuracy. The training ends when the accuracy rate reaches a certain value. The CNN of this study is based on the code written by MatLab. Algorithm 1 shows the algorithm flow of the CNN in this study.
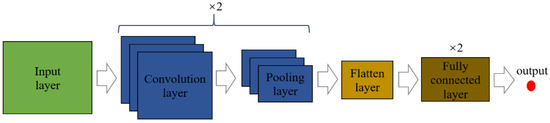
Figure 6.
CNN structure.
| Algorithm 1 CNN algorithm process |
|
|
|
|
|
|
|
|
|
|
|
|
|
|
Jeong et al. [24] observed that the input signal format of CNN was a one-dimensional vector. These researchers tried to fold the input signal of the one-dimensional vector into a two-dimensional matrix format as the input of the CNN. The folding of the one-dimensional input signal is shown in Figure 7. The convolution and pooling rules show that the conversion of the input signal into a two-dimensional matrix can reduce the number of operations in the convolution and pooling layers, thereby reducing the training time. The smooth signal variation in the one-dimensional vector format during convolution and pooling makes it difficult to extract signal features from networks, whereas the two-dimensional matrix format integrates the feature extraction of the discontinuous position of the waveform to strengthen the PSD performance of the network. To verify the above inference, two CNNs were created separately, with no differences in network structure except the input signal format, and both were trained using the same input signal. The training effect was evaluated by the accuracy, which is the percentage of correct particles in the total number of particles judged by CNN. Table 3 shows the training time and training effect after the same amount of time. The training time of the input signal in the two-dimensional matrix format is shorter, and the training effect is better. Therefore, this study uses a CNN whose input signal format is a two-dimensional matrix.
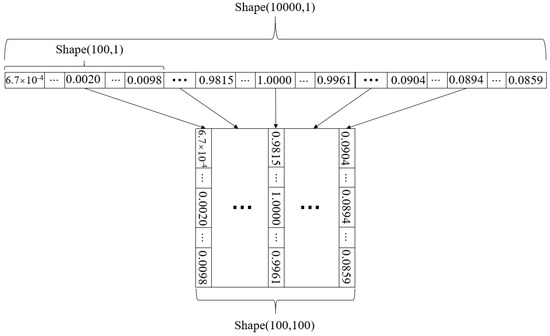
Figure 7.
Format conversion diagram of input signal.
Table 3.
Comparison of one-dimensional vector input and two-dimensional matrix input results.
After inputting the neutron and gamma signals shown in Figure 4 into the CNN, the convolution-pooling layer extracts and transfers the features of the signal. Figure 8 shows the changes in neutron and gamma signals after passing through the first and second convolutional layers. It can be seen from the figure that CNN can extract the characteristics of neutron and gamma signals and amplify the differences between the features of different types of signals as a way to increase the accuracy of the subsequent signal classification process.
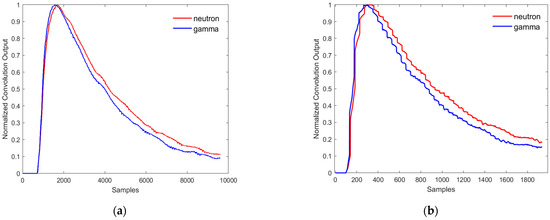
Figure 8.
Changes in neutron and gamma signals after convolution layers: first layer (a); second layer (b).
In the following formula
D represents the difference between the two signals, and the larger the value of D, the more obvious the difference. g is the gamma signal, n is the neutron signal, and N is the length of the signal. After calculation, the values of D of the input signal, after the first convolution layer and after the second convolution layer are 5.437 × 10⁻⁴, 1.8 × 10⁻³, and 3.9 × 10⁻³, respectively, which indicates that the difference is significantly improved by each process.
4. Results and Discussion
We set the prompt and total window to [140 ns, 530 ns] and classified the unknown signal. The PSD performance is shown in Figure 9. The charge comparison method exhibited a satisfactory PSD performance for neutrons and γ rays in the thermal neutron energy region, as shown in the figure, but the PSD performance gradually dropped with the decrease in energy until it could not be identified. Figure 10 is a histogram of the PSD parameters of particles in all energy intervals in Figure 9. The FoM value of the charge comparison method is 1.37, as calculated by Equation (2). Figure 11 shows the PSD effect (FoM) diagram under different energy ranges. From the figure, it can be seen that the FoM value range increases with the augmentation of energy. The tortuous part of the figure is due to the excessive number of signals in some energy segments.
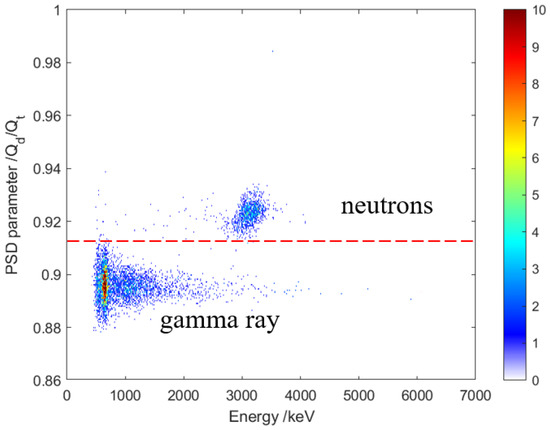
Figure 9.
PSD 2-D histogram of neutron and γ-rays.
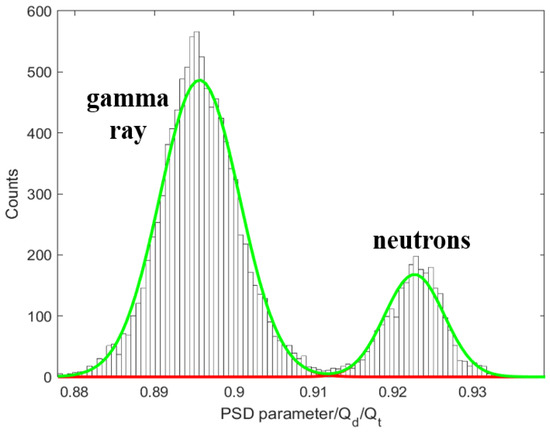
Figure 10.
PSD one-dimensional projection.
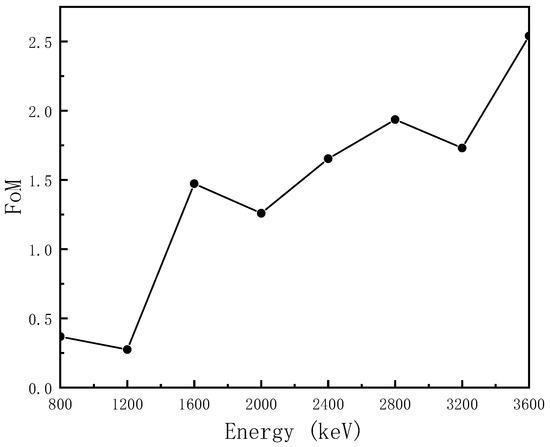
Figure 11.
FoM values at different energy ranges.
We converted the unknown signal into a two-dimensional matrix format and fed it into the trained CNN. Figure 12 shows the two-dimensional histogram of the CNN output parameter a. It can be seen from the figure that the PSD performance of the CNN at different energy intervals has no obvious fluctuations. By projecting the count on the X-axis of Figure 12 to the Y-axis and performing Gaussian fitting, we obtained a one-dimensional projection of the output parameter a. Due to the characteristics of the activation function at the output layer, the Gaussian peaks were complemented (as shown in Figure 13) during Gaussian fitting, and the FoM value of CNN is 37.20 based on Equation (2). To verify the reliability of the CNN output results, all the signals located in the thermal neutron energy region were extracted from the unknown concentration. After the unknown signal was given a clear label by the charge comparison method, the CNN was used to classify them, and the results of the classification using CNN were compared with the charge comparison method, as shown in Table 4. According to Table 4, the accuracy of the CNN in the thermal neutron energy zones discrimination result compared to the charge comparison method can be calculated as 99.95%, and the neutron F1 measure is 0.99988. The gamma ray events around 3 MeV are not shown in Figure 12, since the training set γ-ray selects the signal of the all-energy peak of 137Cs, so the output of the high-energy γ-signal may be slightly larger, which is not shown in Figure 12. Even if the output of the high-energy γ-signal is greater than that of the low-energy γ-signal, by comparing the output of the CNN and charge comparison method classification results, it was found that the results of CNN have good accuracy and neutron F1 measure in the thermal neutron energy region.
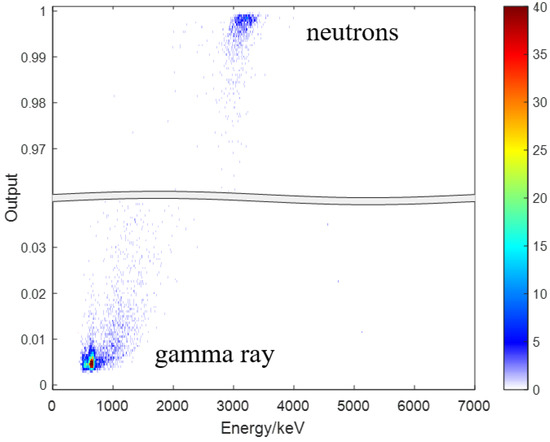
Figure 12.
CNN output 2-D histogram of neutron and γ ray.
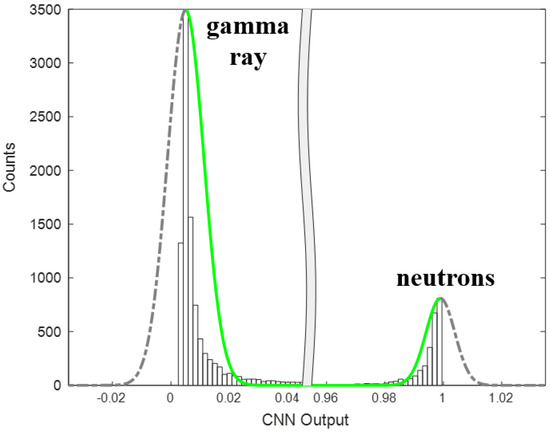
Figure 13.
One-dimensional projection of CNN output parameters.
Table 4.
Comparison of charge comparison method and CNN discrimination results.
5. Conclusions
In this study, a CNN was used to discriminate the pulse shape of the signal above 325 keV of the CLYC detector. When comparing the input of different formats, we found that the input signal of the two-dimensional matrix format was better than the one-dimensional vector format in terms of training time and effect. After further analysis of the feature extraction and transmission processes of the CNN, it was found that the CNN could effectively extract the features of the input signal and amplify the feature variance of different types of signals during the transmission process. After using the CNN and charge comparison method to classify the same unknown signal, the charge comparison method’s FoM value was 1.37, whereas the CNN’s FoM value was 37.20, showing that the CNN had better n/γ discrimination ability. Although the output of the high-energy γ signal is slightly higher than that of the low-energy γ, the accuracy rate of the CNN in the thermal neutron energy region was 99.95%, and the neutron F1 measure was 0.99988, indicating that the results were highly reliable. Future work will focus on conducting experiments to collect more high-energy gamma signals for training and perfecting the CNN method. We concluded that CNNs provided a new method for CLYC detectors to discriminate neutrons and γ-rays.
Author Contributions
Conceptualization, X.T. and Q.W.; Data curation, J.L. and H.L.; Formal analysis, H.Y. and H.L.; Funding acquisition, X.T.; Investigation, Y.L.; Methodology, X.T., H.Y., C.D. and Q.W.; Project administration, Q.W.; Software, J.L., Y.L. and C.D.; Writing—original draft, J.L.; Writing—review & editing, H.L. All authors have read and agreed to the published version of the manuscript.
Funding
This work was supported in part by the National Natural Science Foundation of China (Grant Nos. 41904162 and 42004151), the Sichuan Science and Technology Program (Grant Nos. 2021JDRC0011 and 2021YFSY0058), the Nuclear Energy Development Research Program (Research on High Energy X-ray Imaging of Nuclear Fuel), Open Foundation of Artificial Intelligence Key Laboratory of Sichuan Province (Grants Nos. 2020RZJ01).
Institutional Review Board Statement
Not applicable.
Informed Consent Statement
Not applicable.
Data Availability Statement
All the data generated and analyzed during this study are included in this paper or are available from the corresponding authors on reasonable request.
Conflicts of Interest
The authors declare no conflict of interest.
References
- Bourne, M.M.; Mussi, C.; Miller, E.C.; Clarke, S.D.; Pozzi, S.A.; Gueorguiev, A. Characterization of the CLYC detector for neutron and photon detection. Nucl. Instrum. Methods Phys. Res. Sect. A 2014, 736, 124–127. [Google Scholar] [CrossRef]
- Lee, D.; Stonehill, L.; Klimenko, A.; Terry, J.; Tornga, S. Pulse-shape analysis of Cs2LiYCl6:Ce scintillator for neutron and gamma-ray discrimination. Nucl. Instrum. Methods Phys. Res. Sect. A 2011, 664, 1–5. [Google Scholar] [CrossRef]
- Wang, Q.; Dai, H.; Deng, C.; Xie, B.; Wu, Y.; Tuo, X. Temperature dependence of SiPM array coupled Cs2LiYCl6:Ce3+ detector per-formance. Nucl. Instrum. Methods Phys. Res. Sect. A 2022, 1025, 166112. [Google Scholar] [CrossRef]
- Wang, Q.; Tuo, X.; Deng, C.; Liu, L.; Cheng, Y.; Zhang, C.; Yang, Y. Characterization of a Cs2LiYCl6:Ce3+ scintillator coupled with two silicon photomultiplier arrays of different Sizes. Nucl. Instrum. Methods Phys. Res. Sect. A 2019, 942, 162339. [Google Scholar] [CrossRef]
- Li, K.-N.; Zhang, X.-P.; Gui, Q.; Jin, P.; Tian, G. Characterization of the new scintillator Cs2LiYCl6:Ce3+. Nucl. Sci. Tech. 2018, 29, 1–6. [Google Scholar] [CrossRef]
- Budden, B.S.; Couture, A.J.; Stonehill, L.C.; Klimenko, A.V.; Terry, J.R.; Perry, J.O. Analysis of Cs2LiYCl6:Ce3+ (CLYC) waveforms as read out by solid state photomultipliers. In Proceedings of the 2012 IEEE Nuclear Science Symposium and Medical Imaging Conference Record (NSS/MIC), Anaheim, CA, USA, 27 October–3 November 2012; pp. 347–350. [Google Scholar] [CrossRef]
- Nocente, M.; Fazzi, A.; Tardocchi, M.; Cazzaniga, C.; Lorenzoli, M.; Pirovano, C.; Rebai, M.; Uboldi, C.; Varoli, V.; Gorini, G. Experimental investigation of silicon photomultipliers as compact light readout systems for gamma-ray spectroscopy applications in fusion plasmas. Rev. Sci. Instrum. 2014, 85, 11E108. [Google Scholar] [CrossRef] [PubMed]
- Dinar, N.; Celeste, D.; Puzo, P.; Silari, M. Characterization of CLYC scintillator coupled with photomultipliers and a large SIPM array. Radiat. Prot. Dosim. 2017, 180, 399–402. [Google Scholar] [CrossRef] [PubMed]
- Wang, Q.; Tuo, X.; Deng, C.; Zhang, Z.; Zhang, J.; Yang, J.; Yang, Y. Improvement on pulse-shape discrimination performance of SiPM array coupled Cs2LiYCl6:Ce3+ detector. J. Instrum. 2019, 14, P11005. [Google Scholar] [CrossRef]
- Takaku, D.; Oishi, T.; Baba, M. Development of Neutron-Gamma Discrimination Technique using Pattern-Recognition Method with Digital Signal Processing. Prog. Nucl. Sci. Technol. 2011, 1, 210–213. [Google Scholar] [CrossRef]
- Arahmane, H.; Mahmoudi, A.; Hamzaoui, E.M.; Maissa, Y.B.; El Moursli, R.C. Neutron-gamma discrimination based on support vector machine combined to nonnegative matrix factorization and continuous wavelet transform. Measurement 2020, 149, 106958. [Google Scholar] [CrossRef]
- Aspinall, M.D.; D’Mellow, B.; Mackin, R.O.; Joyce, M.J.; Hawkes, N.P.; Thomas, D.J.; Jarrah, Z.; Peyton, A.J.; Nolan, P.J.; Boston, A.J. Verification of the digital discrimination of neutrons and γ rays using pulse gradient analysis by digital measurement of time of flight. Nucl. Instrum. Methods Phys. Res. 2007, 583, 432–438. [Google Scholar] [CrossRef]
- Mesick, K.E.; Stonehill, L.C.; Morrell, J.T.; Coupland, D.D. Performance of Several Solid State Photomultipliers with CLYC Scintillator. In Proceedings of the 2015 IEEE Nuclear Science Symposium and Medical Imaging Conference (NSS/MIC), San Diego, CA, USA, 31 October–7 November2015. [Google Scholar]
- Dinar, N.; Celeste, D.; Silari, M.; Varoli, V.; Fazzi, A. Pulse shape discrimination of CLYC scintillator coupled with a large SiPM array. Nucl. Instrum. Methods Phys. Res. Sect. A 2019, 935, 35–39. [Google Scholar] [CrossRef]
- Cao, Z.; Miller, L.; Buckner, M. Implementation of dynamic bias for neutron–photon pulse shape discrimination by using neural network classifiers. Nucl. Instrum. Methods Phys. Res. Sect. A 1998, 416, 438–445. [Google Scholar] [CrossRef]
- Esposito, B.; Fortuna, L.; Rizzo, A. Neural neutron/gamma discrimination in organic scintillators for fusion applications. In Proceedings of the 2004 IEEE International Joint Conference on Neural Networks, Budapest, Hungary, 25–29 July 2004. [Google Scholar]
- Ronchi, E.; Söderström, P.A.; Nyberg, J.; Sundén, E.A.; Conroy, S.; Ericsson, G.; Hellesen, C.; Gatu Johnson, M.; Weiszflog, M. An artificial neural network-based neutron–gamma discrimination and pile-up rejection framework for the BC-501 liquid scintillation detector. Nucl. Instrum. Methods Phys. Res. Sect. A 2009, 610, 534–539. [Google Scholar] [CrossRef]
- Liu, G.; Aspinall, M.; Ma, X.; Joyce, M. An investigation of the digital discrimination of neutrons and γ rays with organic scintillation detectors using an artificial neural network. Nucl. Instrum. Methods Phys. Res. Sect. A 2009, 607, 620–628. [Google Scholar] [CrossRef]
- Zhang, C.-X.; Lin, S.-T.; Zhao, J.-L.; Yu, X.-Z.; Wang, L.; Zhu, J.-J.; Xing, H.-Y. Discrimination of neutrons and γ -rays in liquid scintillator based on Elman neural network. Chin. Phys. C 2016, 40, 086204. [Google Scholar] [CrossRef][Green Version]
- Lecun, Y.; Bottou, L.; Bengio, Y.; Haffner, P. Gradient-based learning applied to document recognition. Proc. IEEE 1998, 86, 2278–2324. [Google Scholar] [CrossRef]
- Ketkar, N. Convolutional Neural Networks; Springer International Publishing: Berlin/Heidelberg, Germany, 2017; pp. 197–242. [Google Scholar]
- LeCun, Y.; Bengio, Y. Convolutional networks for images, speech, and time-series. In The Handbook of Brain Theory & Neural Networks; University of Montreal: Montreal, QC, Canada, 1995; ED-11; pp. 34–39. [Google Scholar]
- Bouvrie, J. Notes on Convolutional Neural Networks; Technical Report TR-0200 (4230-46)-3; Aerospace Corp.: Los Angeles, CA, USA, 2006. [Google Scholar]
- Jeong, Y.; The NEOS II Collaboration; Han, B.Y.; Jeon, E.J.; Jo, H.S.; Kim, D.K.; Kim, J.Y.; Kim, Y.D.; Ko, Y.J.; Lee, H.M.; et al. Pulse-shape Discrimination of Fast Neutron Background using Convolutional Neural Network for NEOS II. J. Korean Phys. Soc. 2020, 77, 1118–1124. [Google Scholar] [CrossRef]
Publisher’s Note: MDPI stays neutral with regard to jurisdictional claims in published maps and institutional affiliations. |
© 2022 by the authors. Licensee MDPI, Basel, Switzerland. This article is an open access article distributed under the terms and conditions of the Creative Commons Attribution (CC BY) license (https://creativecommons.org/licenses/by/4.0/).