
Aquila Optimizer with Bayesian Neural Network for Breast Cancer Detection on Ultrasound Images

Abstract
:1. Introduction
2. Related Works
3. The Proposed Model
3.1. Image Pre-Processing
3.2. Feature Extraction Using SqueezeNet
3.3. Image Classification Using BNN
- Batch Normalization is a process to accelerate network training via decreasing the internal covariate shift (which defines the variations in the distribution of activation unit because of parameter changes) performed by normalizing the hidden layer activation through an evaluated and from every mini-batch.
- Dropout is a regularization method, also regarded as a Bayesian methodology: the process eliminates part of the network in a random fashion which makes the weight stochastic quantity: , where refers to the first weight of the network, and denotes the direct product using binary vector randomly.
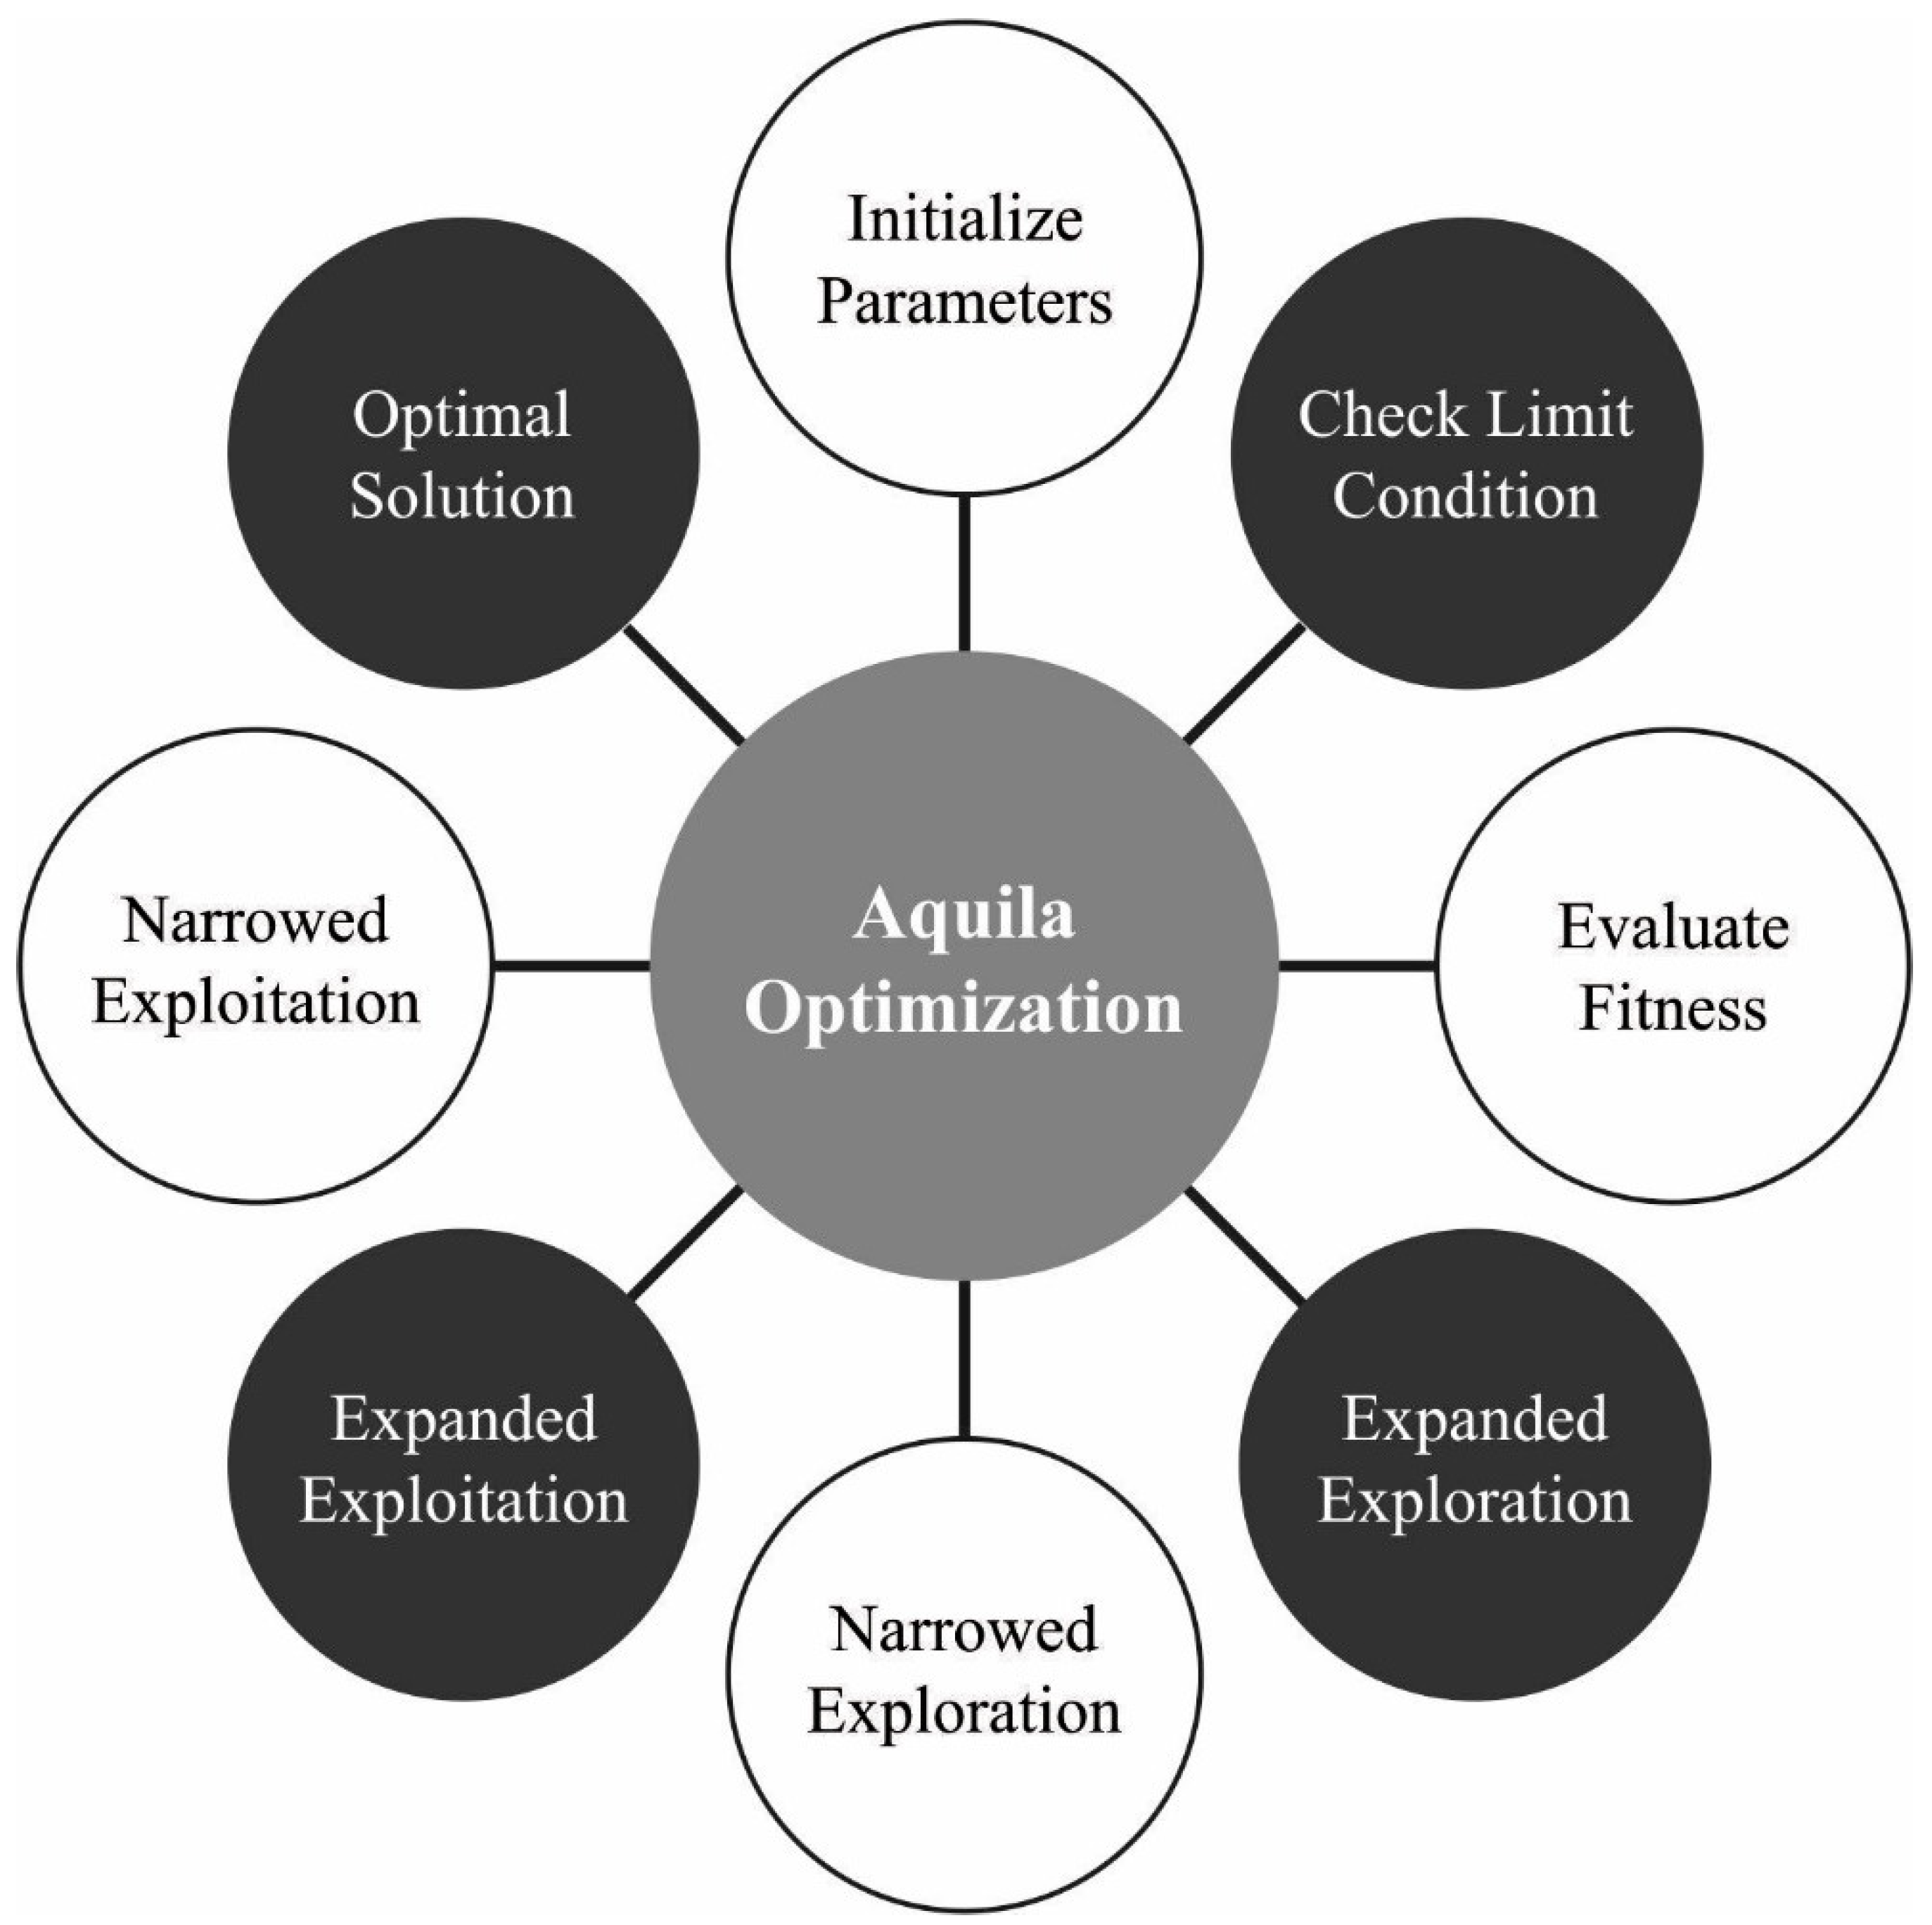
3.4. Parameter Optimization
4. Results and Discussion
5. Conclusions
Author Contributions
Funding
Institutional Review Board Statement
Informed Consent Statement
Data Availability Statement
Conflicts of Interest
References
- Muhammad, M.; Zeebaree, D.; Brifcani, A.M.A.; Saeed, J.; Zebari, D.A. Region of interest segmentation based on clustering techniques for breast cancer ultrasound images: A review. J. Appl. Sci. Technol. Trends 2020, 1, 78–91. [Google Scholar]
- Sun, Q.; Lin, X.; Zhao, Y.; Li, L.; Yan, K.; Liang, D.; Sun, D.; Li, Z.C. Deep learning vs. radiomics for predicting axillary lymph node metastasis of breast cancer using ultrasound images: Don’t forget the peritumoral region. Front. Oncol. 2020, 10, 53. [Google Scholar] [CrossRef] [PubMed]
- Ayana, G.; Dese, K.; Choe, S.W. Transfer learning in breast cancer diagnoses via ultrasound imaging. Cancers 2021, 13, 738. [Google Scholar] [CrossRef] [PubMed]
- Qian, X.; Pei, J.; Zheng, H.; Xie, X.; Yan, L.; Zhang, H.; Han, C.; Gao, X.; Zhang, H.; Zheng, W.; et al. Prospective assessment of breast cancer risk from multimodal multiview ultrasound images via clinically applicable deep learning. Nat. Biomed. Eng. 2021, 5, 522–532. [Google Scholar] [CrossRef]
- Zhang, X.; Li, H.; Wang, C.; Cheng, W.; Zhu, Y.; Li, D.; Jing, H.; Li, S.; Hou, J.; Li, J.; et al. Evaluating the accuracy of breast cancer and molecular subtype diagnosis by ultrasound image deep learning model. Front. Oncol. 2021, 11, 623506. [Google Scholar] [CrossRef]
- Khairalseed, M.; Javed, K.; Jashkaran, G.; Kim, J.W.; Parker, K.J.; Hoyt, K. Monitoring Early Breast Cancer Response to Neoadjuvant Therapy Using H-Scan Ultrasound Imaging: Preliminary Preclinical Results. J. Ultrasound Med. 2019, 38, 1259–1268. [Google Scholar] [CrossRef]
- Zhang, T.; Jiang, Z.; Xve, T.; Sun, S.; Li, J.; Ren, W.; Wu, A.; Huang, P. One-pot synthesis of hollow PDA@ DOX nanoparticles for ultrasound imaging and chemo-thermal therapy in breast cancer. Nanoscale 2019, 11, 21759–21766. [Google Scholar] [CrossRef]
- Wang, Y.; Choi, E.J.; Choi, Y.; Zhang, H.; Jin, G.Y.; Ko, S.B. Breast cancer classification in automated breast ultrasound using multiview convolutional neural network with transfer learning. Ultrasound Med. Biol. 2020, 46, 1119–1132. [Google Scholar] [CrossRef]
- Yan, Y.; Liu, Y.; Wu, Y.; Zhang, H.; Zhang, Y.; Meng, L. Accurate segmentation of breast tumors using AE U-net with HDC model in ultrasound images. Biomed. Signal Process. Control 2022, 72, 103299. [Google Scholar] [CrossRef]
- Zhang, G.; Zhao, K.; Hong, Y.; Qiu, X.; Zhang, K.; Wei, B. SHA-MTL: Soft and hard attention multi-task learning for automated breast cancer ultrasound image segmentation and classification. Int. J. Comput. Assist. Radiol. Surg. 2021, 16, 1719–1725. [Google Scholar] [CrossRef]
- Hijab, A.; Rushdi, M.A.; Gomaa, M.M.; Eldeib, A. Breast cancer classification in ultrasound images using transfer learning. In Proceedings of the 2019 Fifth International Conference on Advances in Biomedical Engineering (ICABME), Tripoli, Lebanon, 17–19 October 2019; pp. 1–4. [Google Scholar]
- Kalafi, E.Y.; Jodeiri, A.; Setarehdan, S.K.; Lin, N.W.; Rahmat, K.; Taib, N.A.; Ganggayah, M.D.; Dhillon, S.K. Classification of breast cancer lesions in ultrasound images by using attention layer and loss ensemble in deep convolutional neural networks. Diagnostics 2021, 11, 1859. [Google Scholar] [CrossRef] [PubMed]
- Lee, H.; Park, J.; Hwang, J.Y. Channel attention module with multiscale grid average pooling for breast cancer segmentation in an ultrasound image. IEEE Trans. Ultrason. Ferroelectr. Freq. Control. 2020, 67, 1344–1353. [Google Scholar] [PubMed]
- Xie, X.Z.; Niu, J.W.; Liu, X.F.; Li, Q.F.; Wang, Y.; Han, J.; Tang, S. DG-CNN: Introducing Margin Information into Convolutional Neural Networks for Breast Cancer Diagnosis in Ultrasound Images. J. Comput. Sci. Technol. 2022, 37, 277–294. [Google Scholar] [CrossRef]
- Zhu, Y.C.; AlZoubi, A.; Jassim, S.; Jiang, Q.; Zhang, Y.; Wang, Y.B.; Ye, X.D.; Hongbo, D.U. A generic deep learning framework to classify thyroid and breast lesions in ultrasound images. Ultrasonics 2021, 110, 106300. [Google Scholar] [CrossRef] [PubMed]
- Zhuang, Z.; Li, N.; Joseph Raj, A.N.; Mahesh, V.G.; Qiu, S. An RDAU-NET model for lesion segmentation in breast ultrasound images. PLoS ONE 2019, 14, e0221535. [Google Scholar] [CrossRef] [PubMed]
- Lahmiri, S. An iterative denoising system based on Wiener filtering with application to biomedical images. Opt. Laser Technol. 2017, 90, 128–132. [Google Scholar] [CrossRef]
- Saood, A.; Hatem, I. COVID-19 lung CT image segmentation using deep learning methods: U-Net versus SegNet. BMC Med. Imaging 2021, 21, 19. [Google Scholar] [CrossRef]
- Iandola, F.N.; Han, S.; Moskewicz, M.W.; Ashraf, K.; Dally, W.J.; Keutzer, K. SqueezeNet: AlexNet-level accuracy with 50x fewer parameters and <0.5 MB model size. arXiv 2016, arXiv:1602.07360. [Google Scholar]
- Koonce, B. SqueezeNet. In Convolutional Neural Networks with Swift for Tensorflow; Apress: Berkeley, CA, USA, 2021; pp. 73–85. [Google Scholar]
- Ullah, A.; Elahi, H.; Sun, Z.; Khatoon, A.; Ahmad, I. Comparative analysis of AlexNet, ResNet18 and SqueezeNet with diverse modification and arduous implementation. Arab. J. Sci. Eng. 2022, 47, 2397–2417. [Google Scholar] [CrossRef]
- Wu, A.; Nowozin, S.; Meeds, E.; Turner, R.E.; Hernández-Lobato, J.M.; Gaunt, A.L. Deterministic variational inference for robust bayesian neural networks. arXiv 2018, arXiv:1810.03958. [Google Scholar]
- Meng, X.; Babaee, H.; Karniadakis, G.E. Multi-fidelity Bayesian neural networks: Algorithms and applications. J. Comput. Phys. 2021, 438, 110361. [Google Scholar] [CrossRef]
- Abualigah, L.; Yousri, D.; Abd Elaziz, M.; Ewees, A.A.; Al-Qaness, M.A.; Gandomi, A.H. Aquila optimizer: A novel meta-heuristic optimization algorithm. Comput. Ind. Eng. 2021, 157, 107250. [Google Scholar] [CrossRef]
- AlRassas, A.M.; Al-qaness, M.A.; Ewees, A.A.; Ren, S.; Abd Elaziz, M.; Damaševičius, R.; Krilavičius, T. Optimized ANFIS model using Aquila Optimizer for oil production forecasting. Processes 2021, 9, 1194. [Google Scholar] [CrossRef]
- Al-Dhabyani, W.; Gomaa, M.; Khaled, H.; Fahmy, A. Dataset of breast ultrasound images. Data Brief 2020, 28, 104863. [Google Scholar] [CrossRef] [PubMed]


| Class | No. of Images |
|---|---|
| Benign | 437 |
| Malignant | 210 |
| Normal | 133 |
| Total Number of Images | 780 |
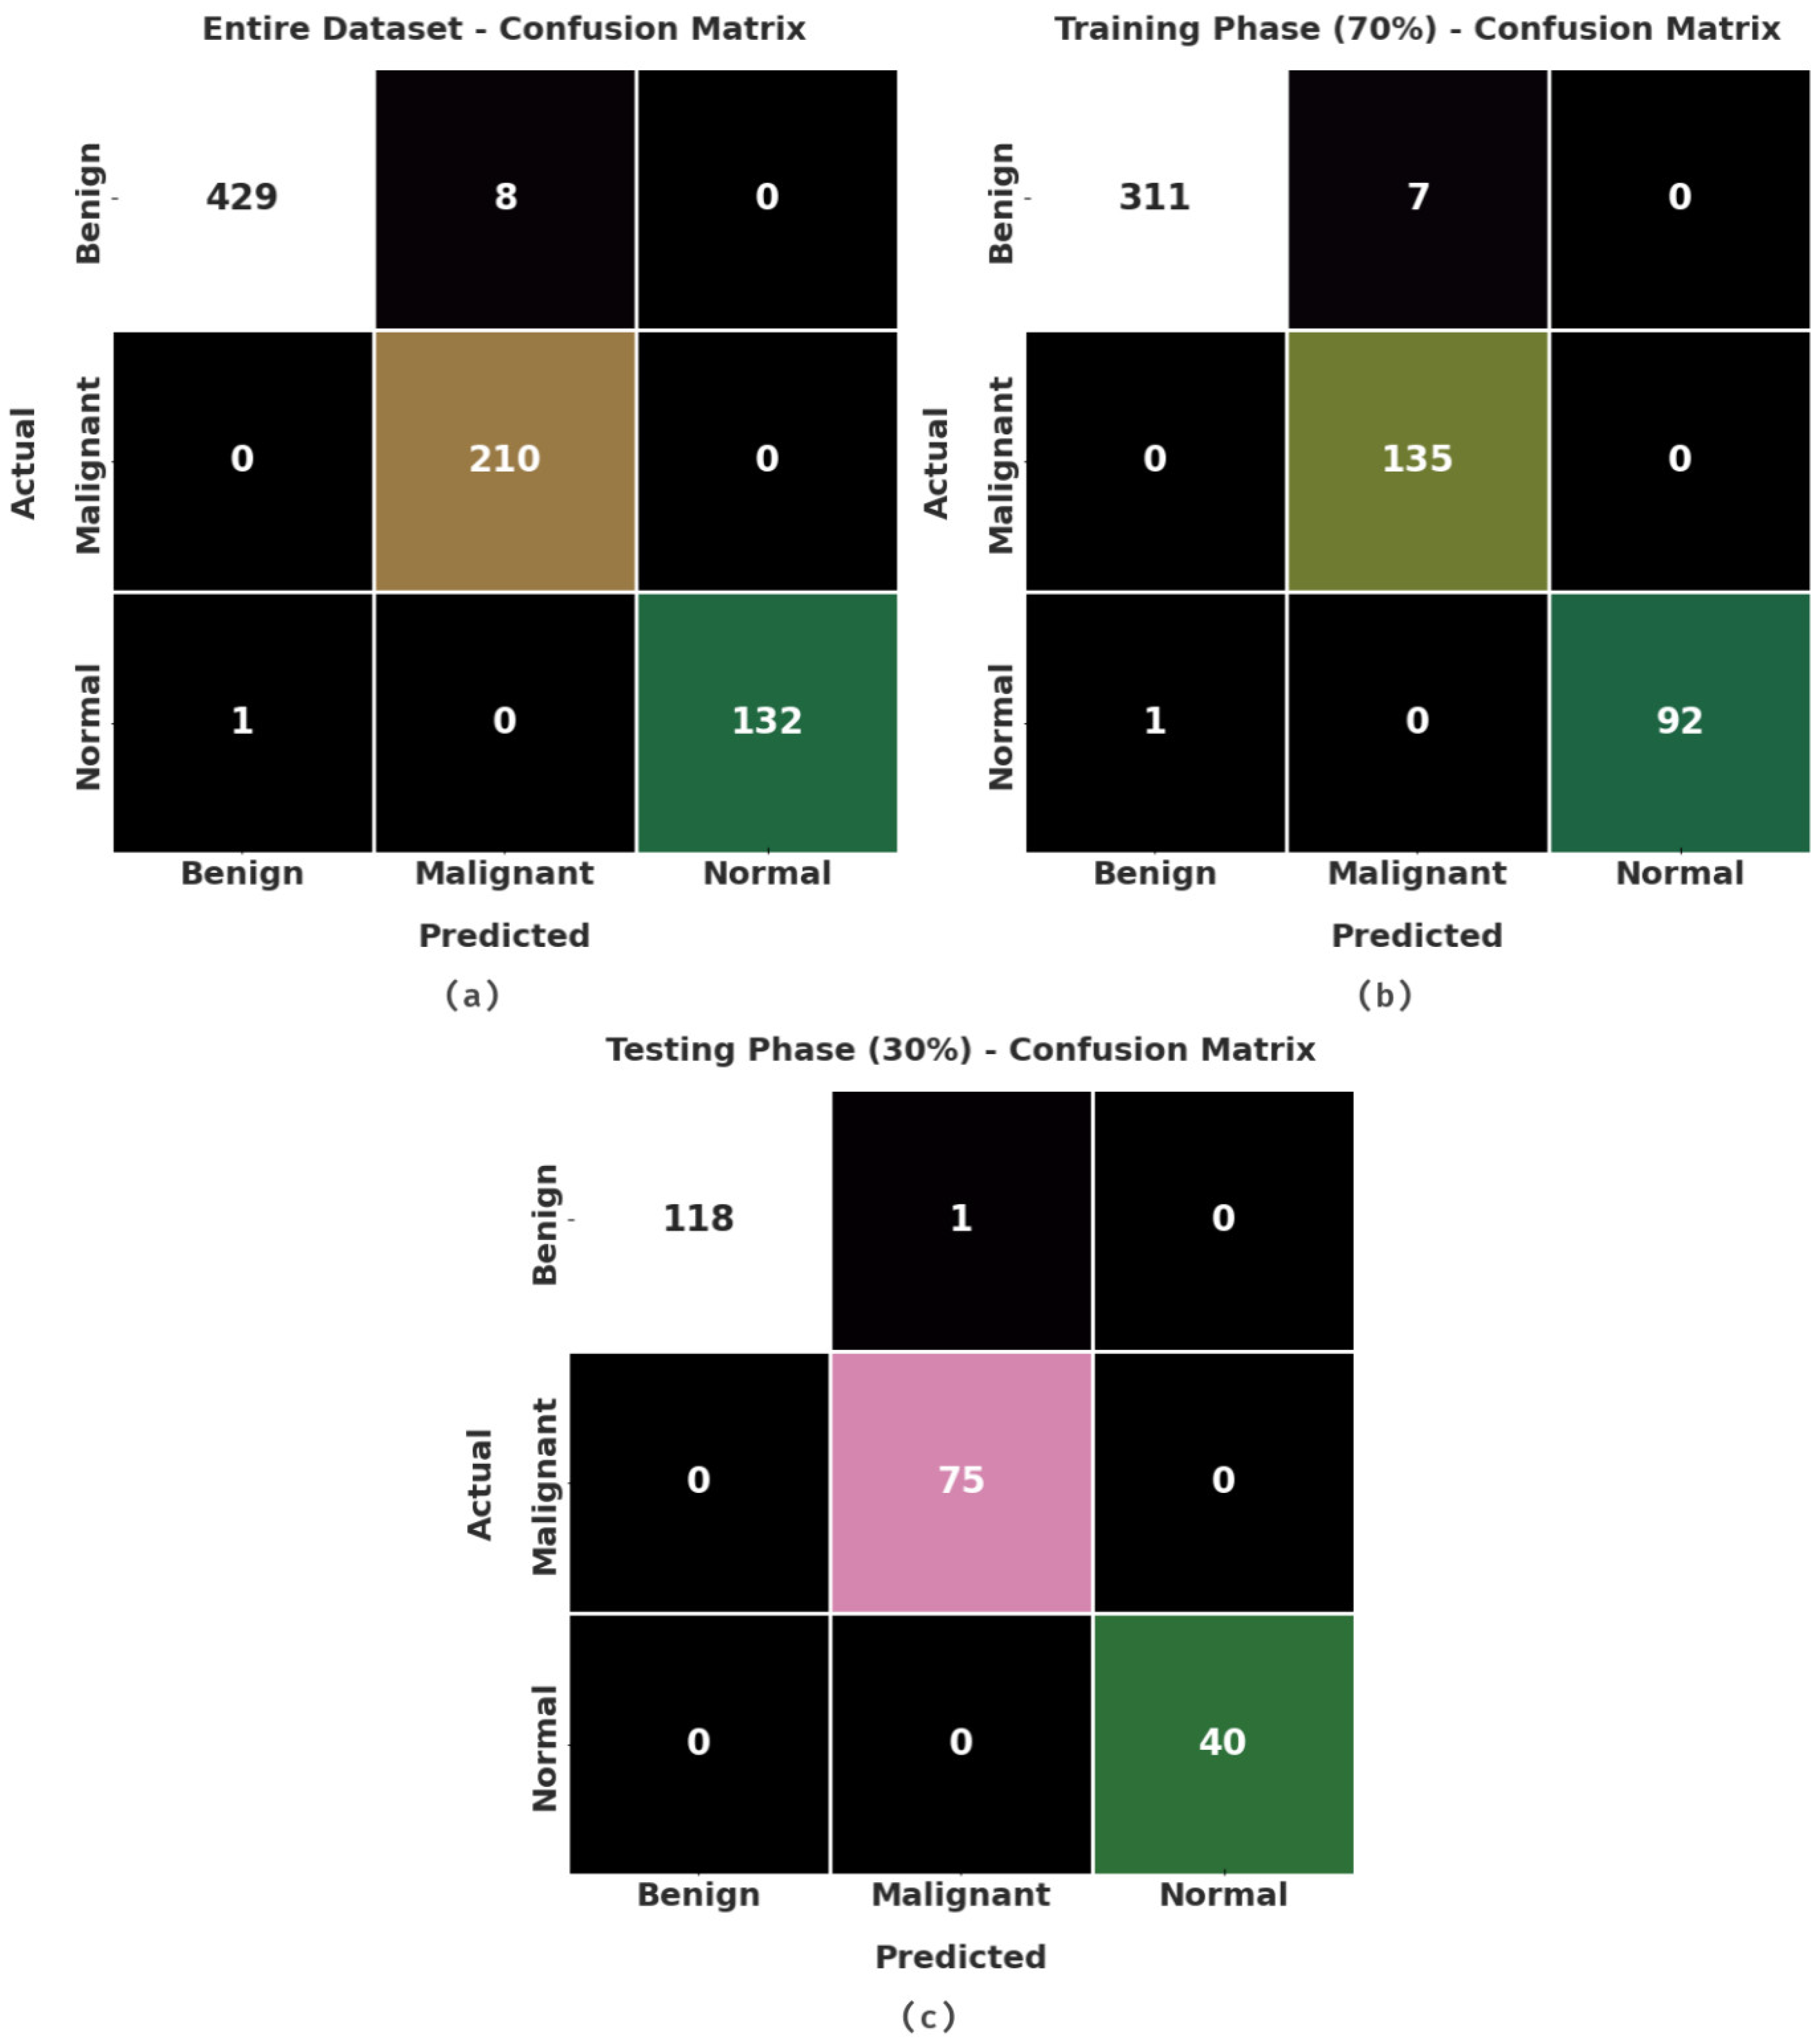
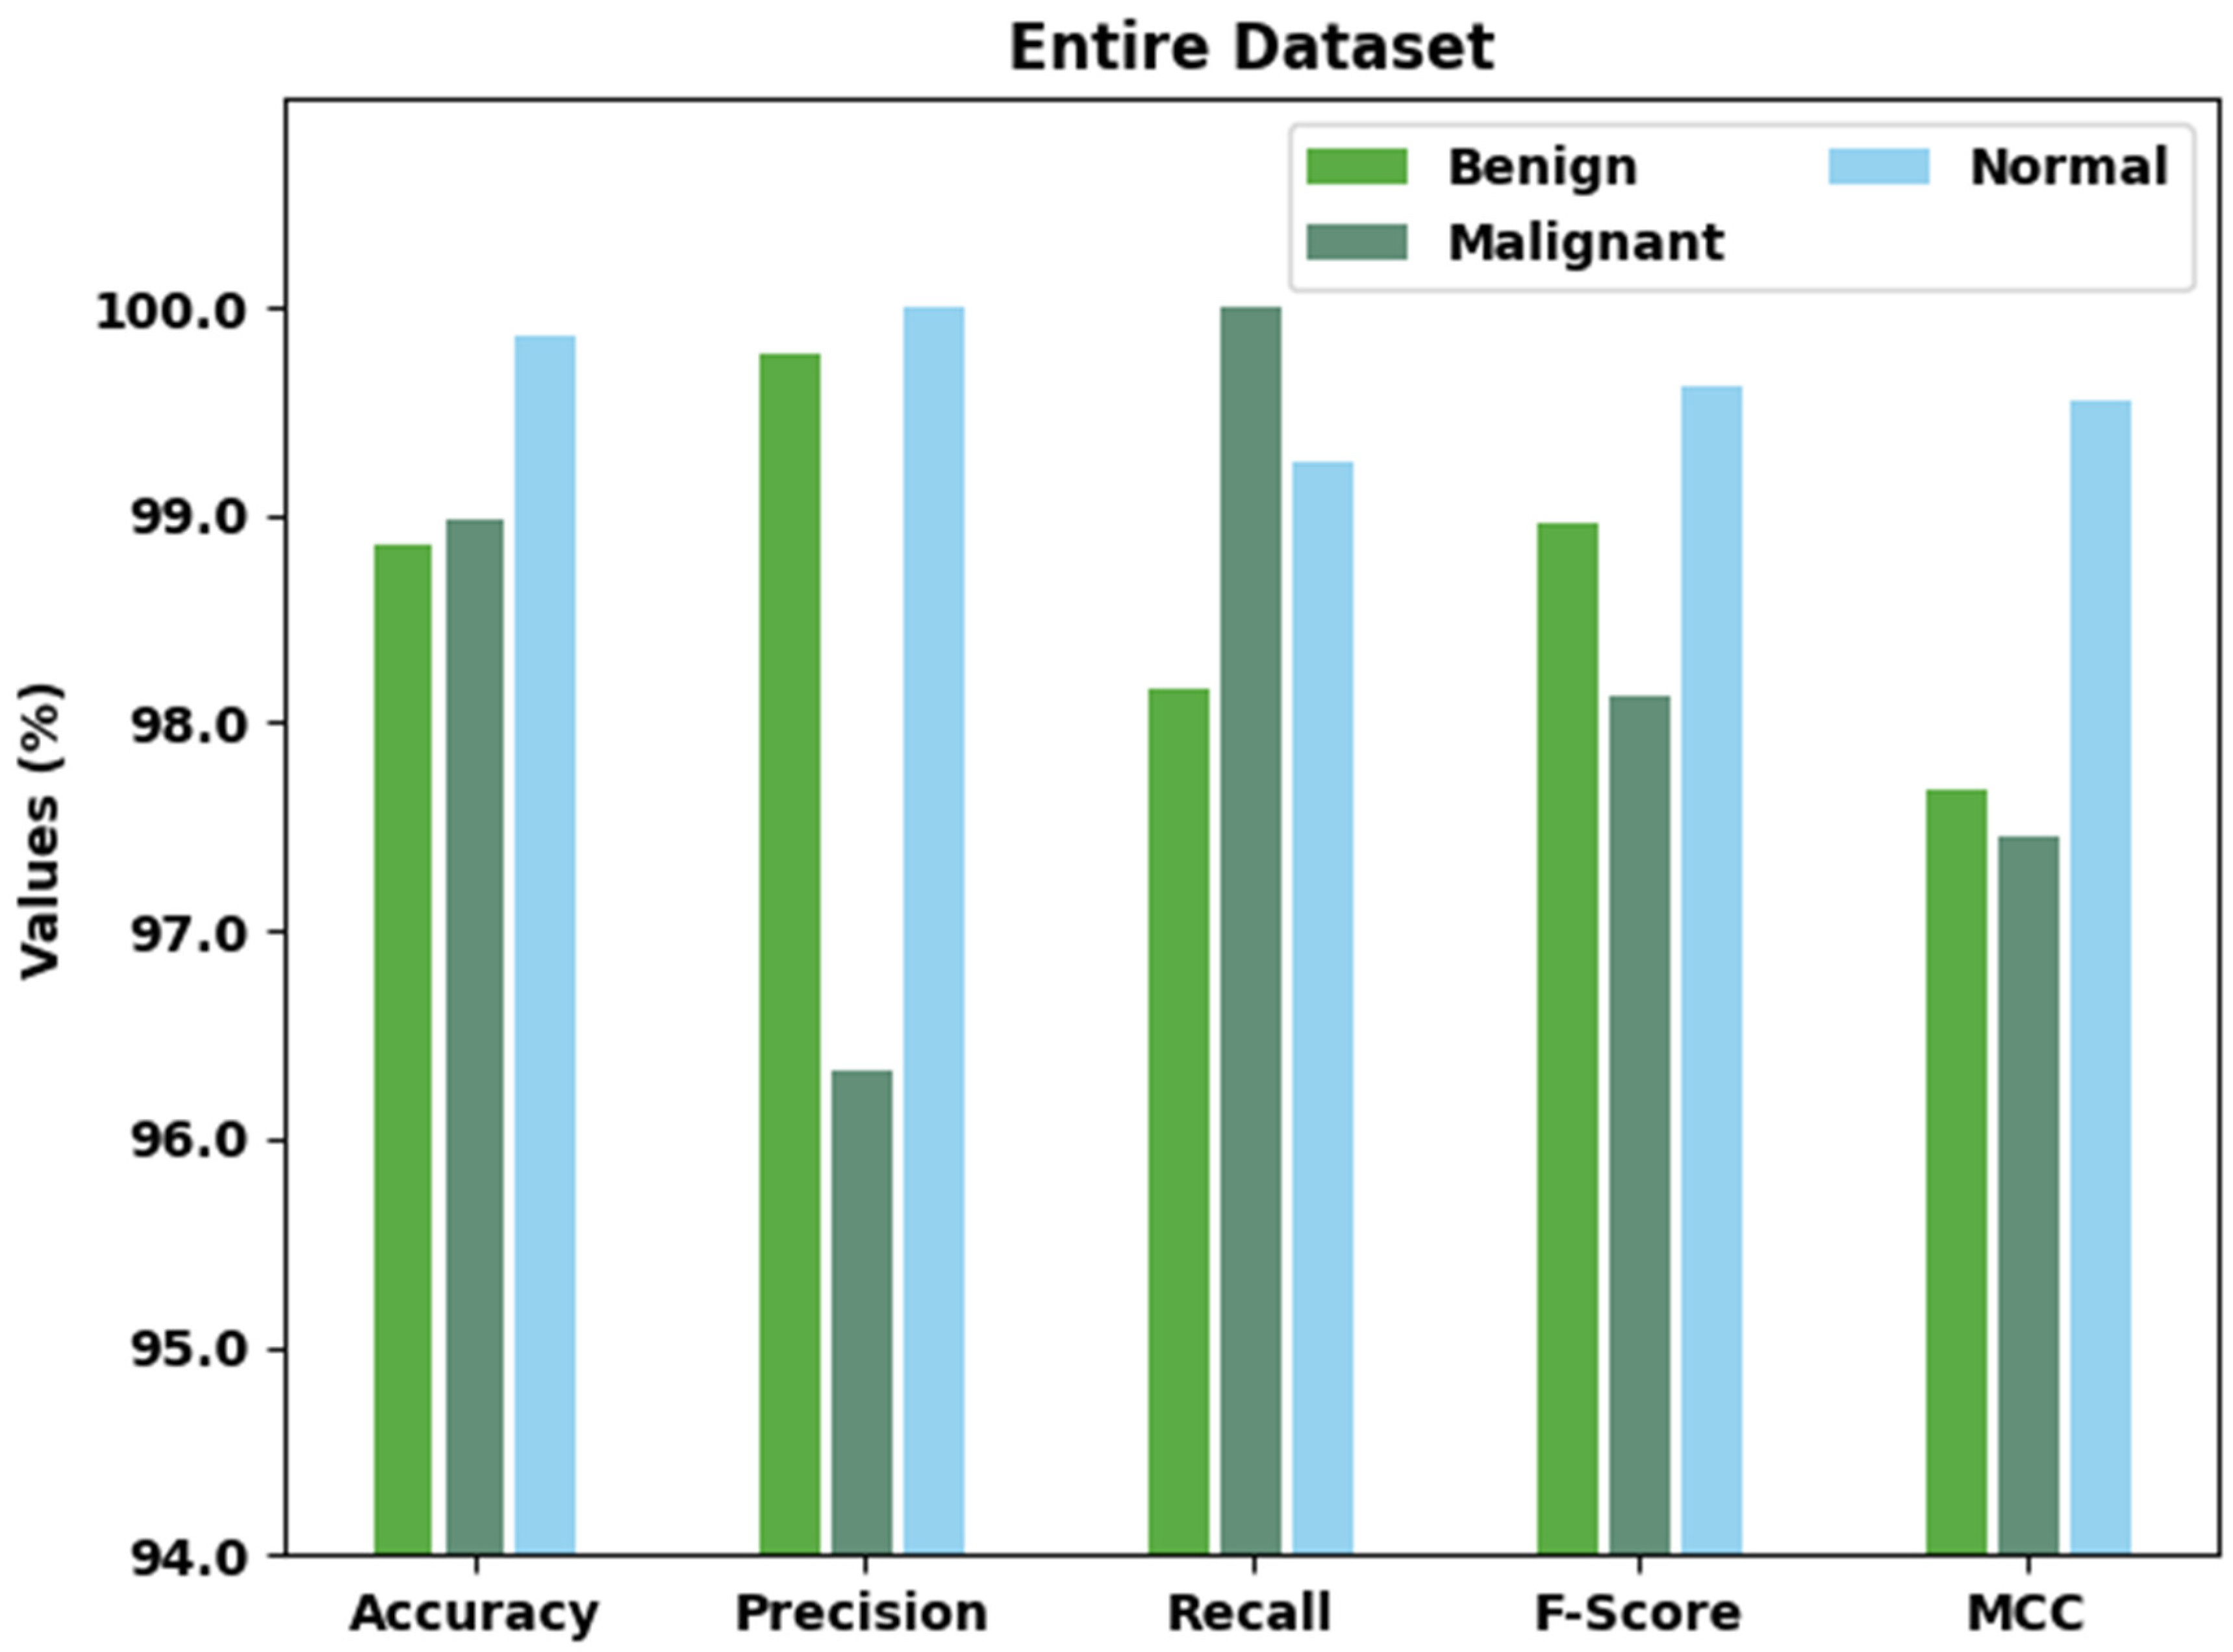
| Entire Dataset | |||||
|---|---|---|---|---|---|
| Class Labels | Accuracy | Precision | Recall | F-Score | MCC |
| Benign | 98.85 | 99.77 | 98.17 | 98.96 | 97.68 |
| Malignant | 98.97 | 96.33 | 100.00 | 98.13 | 97.46 |
| Normal | 99.87 | 100.00 | 99.25 | 99.62 | 99.55 |
| Average | 99.23 | 98.70 | 99.14 | 98.91 | 98.23 |
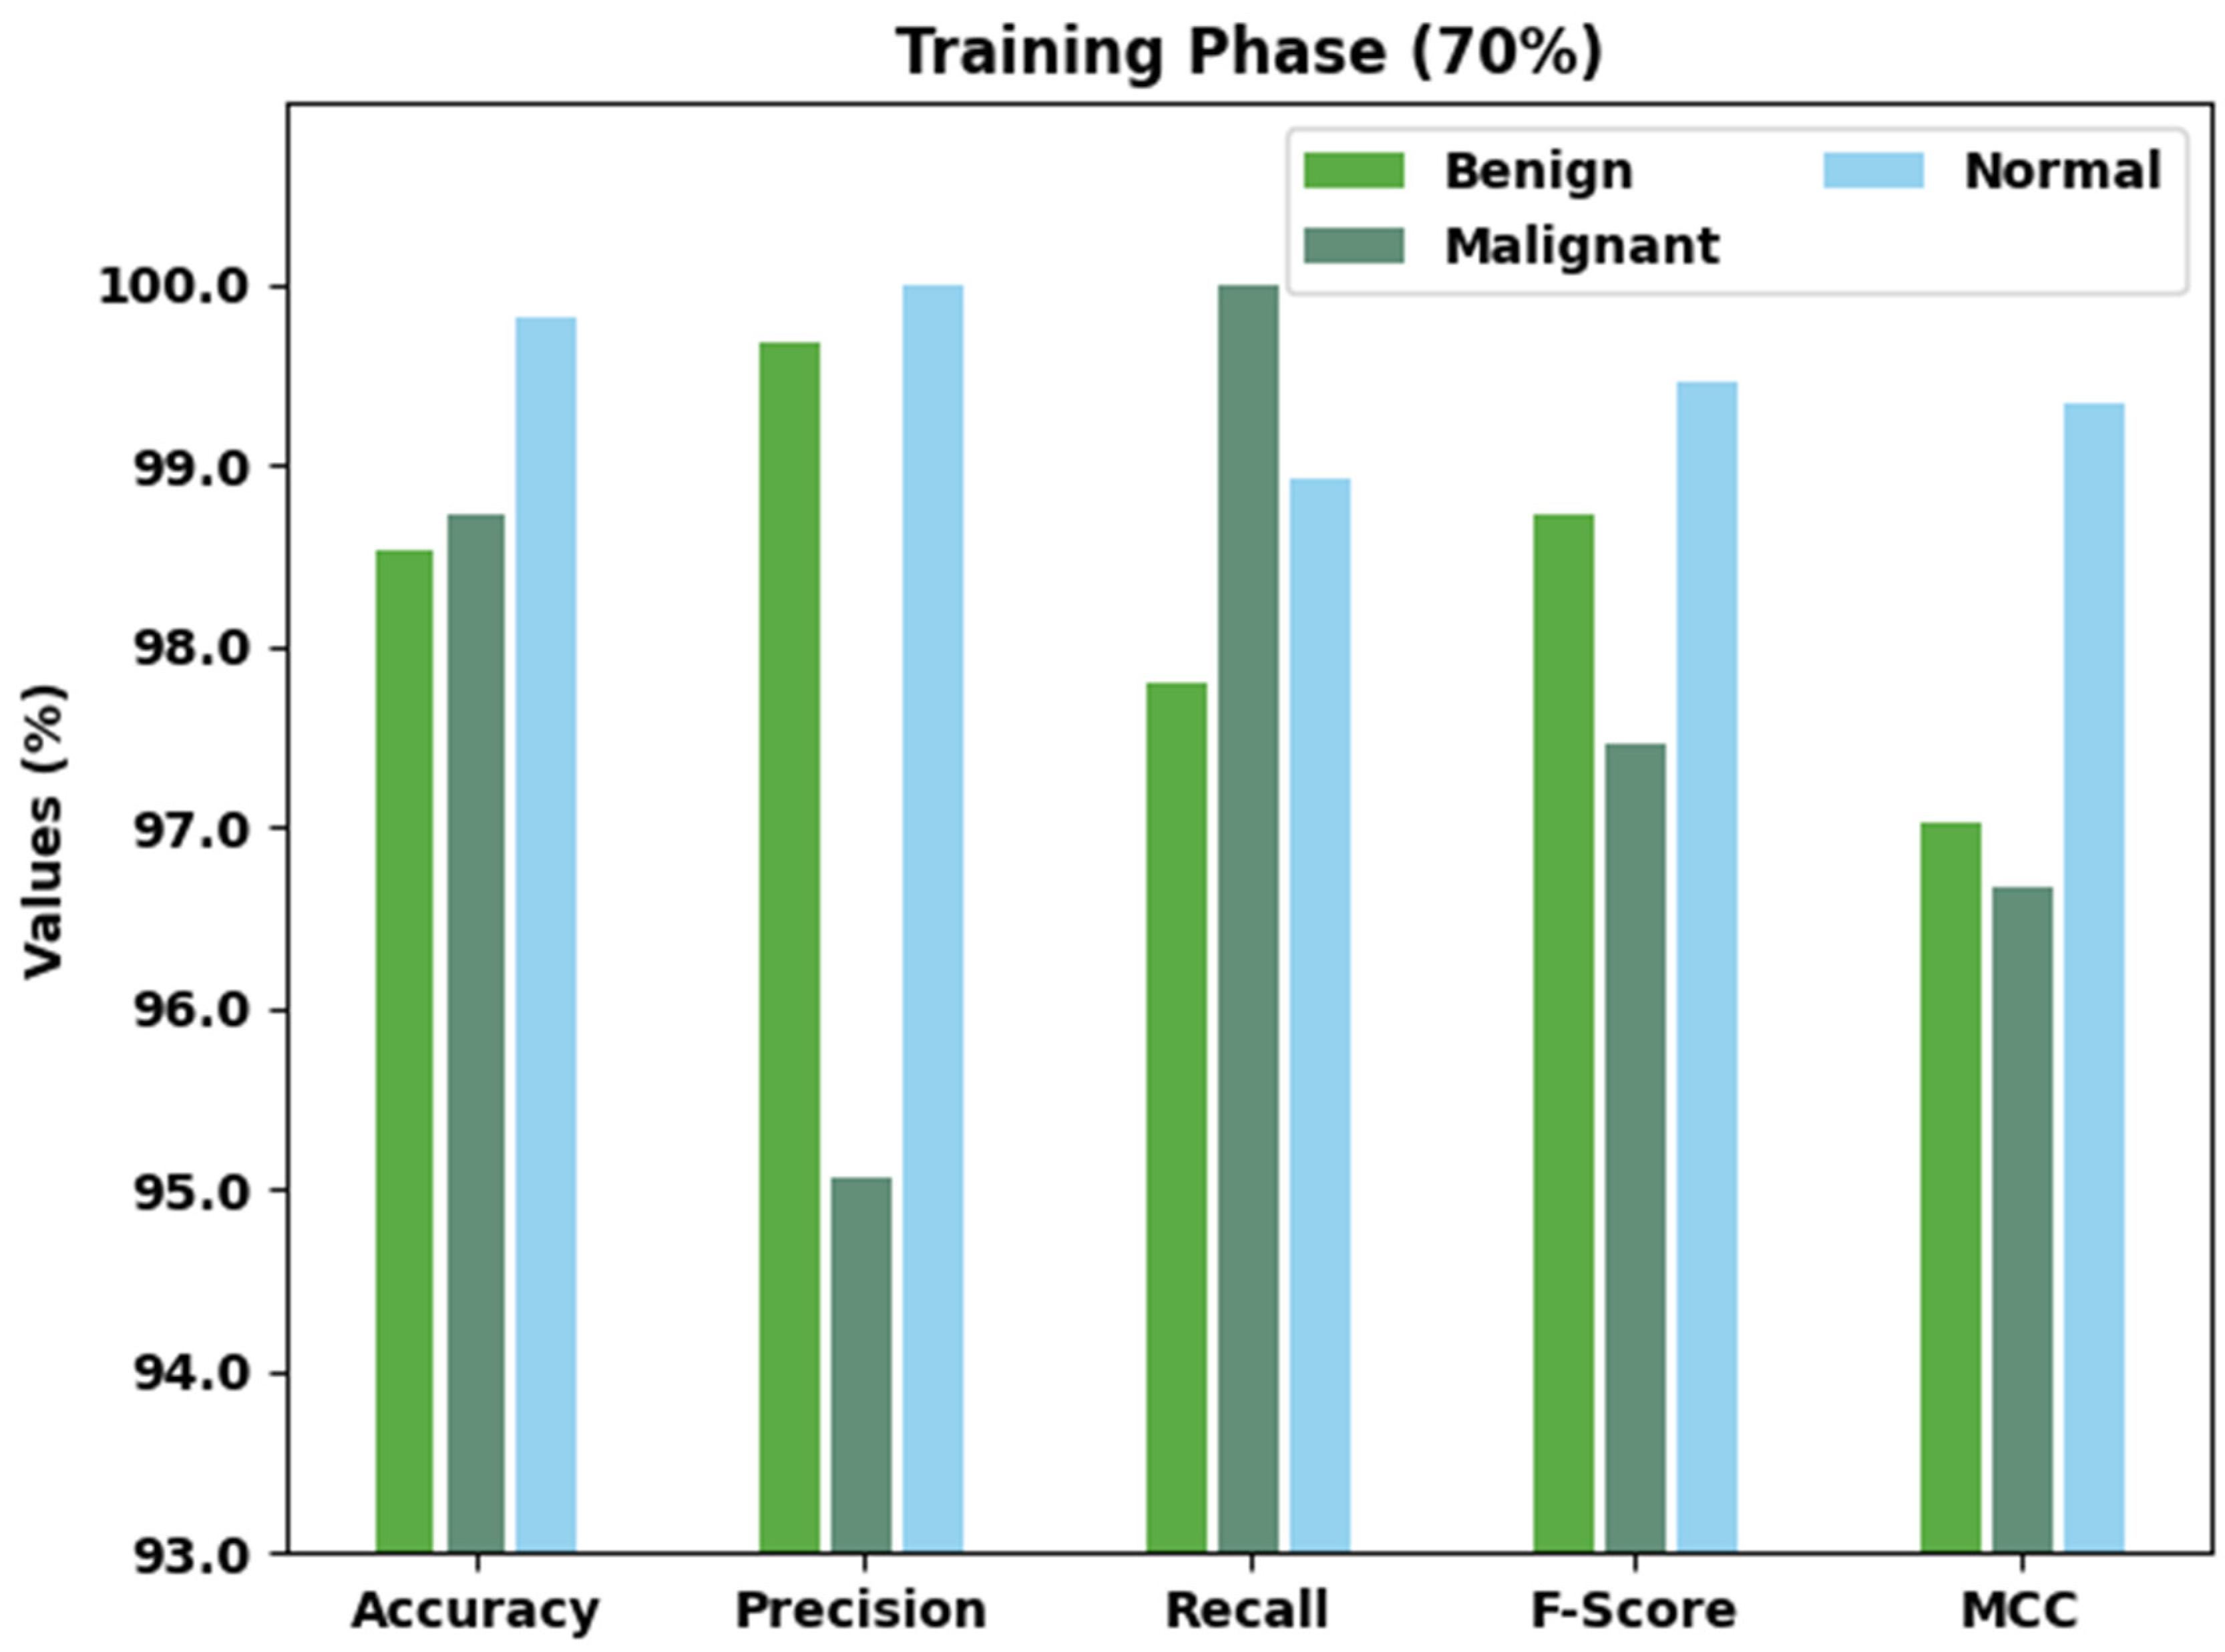
| Training Phase (70%) | |||||
|---|---|---|---|---|---|
| Class Labels | Accuracy | Precision | Recall | F-Score | MCC |
| Benign | 98.53 | 99.68 | 97.80 | 98.73 | 97.02 |
| Malignant | 98.72 | 95.07 | 100.00 | 97.47 | 96.67 |
| Normal | 99.82 | 100.00 | 98.92 | 99.46 | 99.35 |
| Average | 99.02 | 98.25 | 98.91 | 98.55 | 97.68 |
| Testing Phase (30%) | |||||
|---|---|---|---|---|---|
| Class Labels | Accuracy | Precision | Recall | F-Score | MCC |
| Benign | 99.57 | 100.00 | 99.16 | 99.58 | 99.15 |
| Malignant | 99.57 | 98.68 | 100.00 | 99.34 | 99.03 |
| Normal | 100.00 | 100.00 | 100.00 | 100.00 | 100.00 |
| Average | 99.72 | 99.56 | 99.72 | 99.64 | 99.39 |
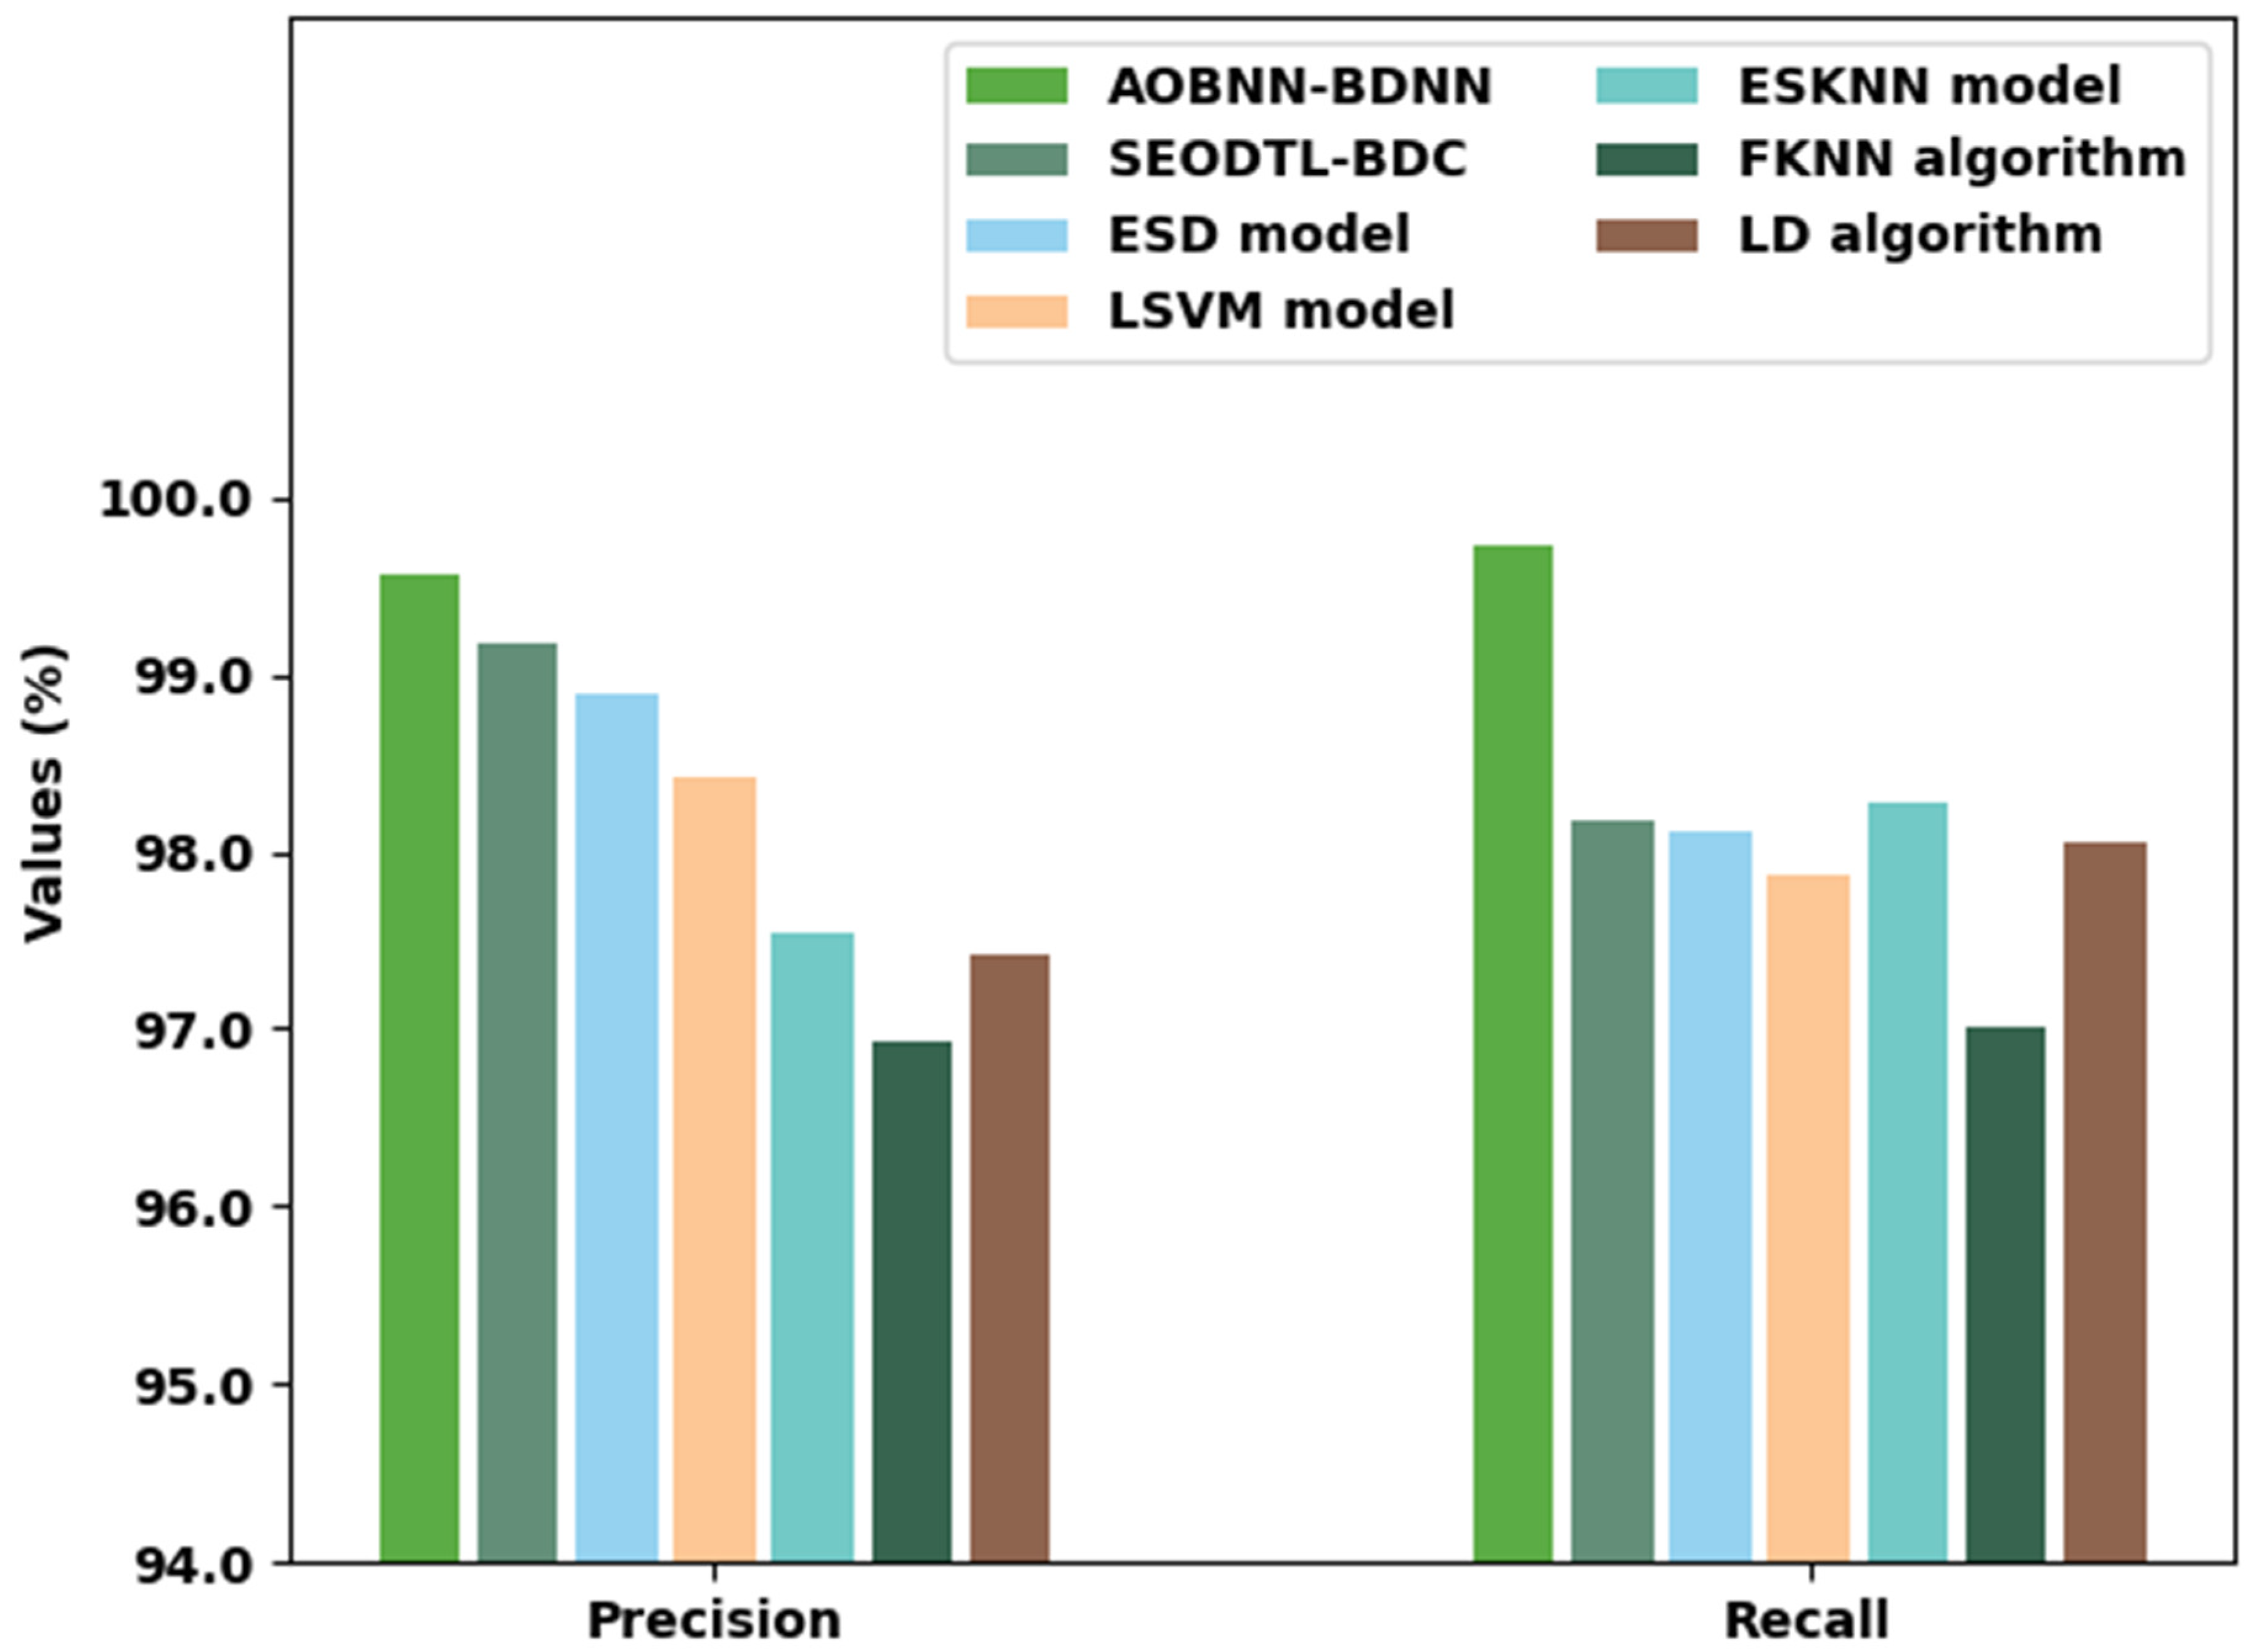
| Methods | Precision | Recall | Accuracy | F-Score |
|---|---|---|---|---|
| AOBNN-BDNN | 99.56 | 99.72 | 99.72 | 99.64 |
| SEODTL-BDC | 99.18 | 98.18 | 99.12 | 98.14 |
| ESD model | 98.89 | 98.11 | 99.07 | 98.88 |
| LSVM model | 98.41 | 97.87 | 98.73 | 98.29 |
| ESKNN model | 97.55 | 98.27 | 97.70 | 98.61 |
| FKNN algorithm | 96.93 | 97.00 | 97.42 | 96.93 |
| LD algorithm | 97.41 | 98.05 | 97.92 | 96.99 |
| Methods | Classifification Time (min) |
|---|---|
| AOBNN-BDNN | 1.01 |
| SEODTL-BDC | 1.18 |
| ESD model | 2.28 |
| LSVM model | 1.95 |
| ESKNN model | 2.80 |
| FKNN algorithm | 2.24 |
| LD algorithm | 1.75 |
Publisher’s Note: MDPI stays neutral with regard to jurisdictional claims in published maps and institutional affiliations. |
© 2022 by the authors. Licensee MDPI, Basel, Switzerland. This article is an open access article distributed under the terms and conditions of the Creative Commons Attribution (CC BY) license (https://creativecommons.org/licenses/by/4.0/).
Share and Cite
Obayya, M.; Haj Hassine, S.B.; Alazwari, S.; K. Nour, M.; Mohamed, A.; Motwakel, A.; Yaseen, I.; Sarwar Zamani, A.; Abdelmageed, A.A.; Mohammed, G.P. Aquila Optimizer with Bayesian Neural Network for Breast Cancer Detection on Ultrasound Images. Appl. Sci. 2022, 12, 8679. https://doi.org/10.3390/app12178679
Obayya M, Haj Hassine SB, Alazwari S, K. Nour M, Mohamed A, Motwakel A, Yaseen I, Sarwar Zamani A, Abdelmageed AA, Mohammed GP. Aquila Optimizer with Bayesian Neural Network for Breast Cancer Detection on Ultrasound Images. Applied Sciences. 2022; 12(17):8679. https://doi.org/10.3390/app12178679
Chicago/Turabian StyleObayya, Marwa, Siwar Ben Haj Hassine, Sana Alazwari, Mohamed K. Nour, Abdullah Mohamed, Abdelwahed Motwakel, Ishfaq Yaseen, Abu Sarwar Zamani, Amgad Atta Abdelmageed, and Gouse Pasha Mohammed. 2022. "Aquila Optimizer with Bayesian Neural Network for Breast Cancer Detection on Ultrasound Images" Applied Sciences 12, no. 17: 8679. https://doi.org/10.3390/app12178679
APA StyleObayya, M., Haj Hassine, S. B., Alazwari, S., K. Nour, M., Mohamed, A., Motwakel, A., Yaseen, I., Sarwar Zamani, A., Abdelmageed, A. A., & Mohammed, G. P. (2022). Aquila Optimizer with Bayesian Neural Network for Breast Cancer Detection on Ultrasound Images. Applied Sciences, 12(17), 8679. https://doi.org/10.3390/app12178679