Abstract
Chatter detection in robotic milling is a difficult issue due to the complex dynamic behavior of robots. In this paper, a novel approach to detecting chatter in the robotic milling process is proposed. The method of improved complete ensemble empirical mode decomposition with adaptive noise is introduced for decomposing the milling vibration signals into a series of intrinsic mode functions (IMFs). The effective IMFs are chosen according to the correlation between the original signals and each IMF. Signal reconstruction is conducted using the selected IMFs. The weighted refined composite multiscale dispersion entropy is extracted from the reconstructed signals in order to characterize the chatter states. Then, a classification model is established for chatter detection. Experimental results prove that the proposed method is feasible for chatter detection in the robotic milling process under different robot configurations and machining parameters.
1. Introduction
Industrial robots are essential for manufacturing. Robotic machining is a promising technique and attracts increasing interest [1,2,3,4]. In particular, robot milling is a suitable way to deal with large parts thanks to the high dexterity and wider working space of robots. However, the rigidity of industrial serial robots is much lower than conventional machine tools [5]. Chatter is more likely to occur in the robotic milling process.
When chatter occurs, the machined surface becomes rougher and the machining accuracy cannot be guaranteed [6]. Chatter has been regarded as a bottleneck that significantly limits the spread of robotic milling techniques. In the past few decades, the existing body of research has concentrated on revealing the mechanism of chatter generation during robotic milling. Pan et al. [7] suggested that mode coupling chatter is an important form of chatter during robotic milling. Cordes et al. [8] reported that chatter is caused by the regeneration effect.
However, the reasons for chatter in robotic milling can be regarded as a complicated interaction behavior containing regeneration effects and mode coupling effects [9]. Investigators have proposed several methods aimed at offline chatter suppression, such as optimizing processing parameters [10,11] and optimizing configuration [12,13]. Nevertheless, it is almost impossible to quantify the dynamic characteristics of a robot system precisely due to the existence of multiple flexible bodies. The results of offline chatter suppression may not be effective. Therefore, it is necessary to conduct online detection of chatter in robotic milling, and subsequently, a vibration control method can be carried out [14,15,16].
The issue of chatter detection in the conventional machining process has attracted a lot of interest [17,18]. However, significant differences can be found in dynamic properties between the milling process with robots and conventional machine tools. In robotic milling, the configurations of robots can apparently influence the generation of chatter, so chatter has time-varying characteristics along a machining trajectory. Existing studies in the field of chatter detection mainly focus on milling with conventional machine tools, which may be not applicable for chatter detection in robotic milling.
Until now, far too little attention has been paid to chatter detection in the robotic machining process. Cen et al. [19] developed a novel approach for real-time chatter monitoring using discrete wavelet transform. The chatter fault threshold was determined based on the standard deviation of the wavelet signals. Tao et al. [20] proposed a new method for chatter detection in robotic drilling combining the notch filter and local maximum synchrosqueezing transform (LMSST). Chen et al. [21] used entropy features extracted from adaptive variational mode decomposition (VMD) for chatter detection in robotic milling. Wang et al. [22] proposed a chatter detection model based on VMD, information entropy, and SVM.
However, there are some deficiencies in the existing works. Firstly, fast and reliable detection of chatter still remains a challenge. Secondly, fixed thresholds of chatter indicators are commonly set for detecting chatter [19,23,24,25,26]. In practice, cutting parameters and robot configurations may be different with the change in machining conditions. The applicability of using a manual setting threshold for variable machining conditions requires further validation.
Taking into consideration the time-varying characteristics of chatter, time-frequency analysis methods show advantages in online chatter detection. Typical time-frequency domain analysis methods, such as VMD methods [21,27], suffer the complicated process of parameter optimization. Ensemble empirical mode decomposition (EEMD) [25,28,29] has the shortcoming of residual noise and difficulty in averaging operations with different numbers of IMFs. To overcome the shortcomings of EEMD and improve the decomposition performance, several improved methods based on EEMD have been proposed [30,31,32]. Among them, the improved complete ensemble empirical mode decomposition with adaptive noise (ICEEMDAN) method has a number of attractive features, including less residual noise, less spurious modes, and more physical meanings. Recently, the ICEEMDAN method has proven to be feasible for fault diagnosis [33,34].
A set of IMFs can be obtained from the ICEEMDAN method. Signal reconstruction can be conducted using IMFs. However, the reconstructed signals cannot be directly used for chatter detection. Appropriate features should be extracted and used as chatter indicators. Fortunately, entropy, which is a measure of the uncertainty and irregularity of the data series, has been widely used as a chatter indicator [35,36,37,38]. Specifically, dispersion entropy (DE) is another algorithm for evaluating and quantifying the randomness and complexity of one-dimensional time series, which is highly sensitive to signal changes [39,40]. The above entropy features are commonly extracted under single-scale entropy. However, due to the strong nonstationary characteristics in vibration signals, the vibration modes are distributed among multi-scale. Therefore, useful information about chatter will be lost when only single-scale entropy is extracted. To address this issue, the refined composite multiscale dispersion (RCMDE) method has been proposed for estimating the complexity of time series under multi-scale [41].
In this work, the ICEEMDAN method is introduced for decomposing the milling vibration signals into a series of IMFs. Signal reconstruction is performed using IMFs, which are highly correlated with original signals. Weighted refined composite multiscale dispersion entropy (wRCMDE) is extracted from obtained reconstructed signals and acts as the chatter indicator. Then, a classification model is established for chatter detection. The remainder of this paper is organized as follows: In Section 2, the theoretical basis and framework for the chatter detection system are given. In Section 3, the experimental setup for robotic milling is presented, and an analysis of the vibration signals is performed. In Section 4, the proposed method is verified, and in Section 5, conclusions are drawn.
2. Theoretical Basis and Framework for the Chatter Detection System
2.1. Improved Complete Ensemble Empirical Mode Decomposition with Adaptive Noise (ICEEMDAN)
The ICEEMDAN method, which is based on the EMD decomposition principle, can further reduce the residual noise in the intrinsic mode functions (IMFs) and improve the decomposition effect. Considering the original signal, x, the main idea of the ICEEMDAN method can be expressed as follows [31]:
Step 1: White Gaussian noise is added to the original signal, x, and X1(i) = x + β0E1(w(i)) (i = 1, 2, 3, …, N) indicates the first set of the realization of the signal-plus-noise, where w(i) denotes the noise, Ek(·) denotes the kth mode obtained from EMD, and β0 = ε0 σ(x)/σ(E1(w(i))) means a desired signal–to–noise ratio (SNR) at first decomposition. Then, the first residue, s1, can be calculated by:
where M(·) denotes the local mean of the signal and ⟨·⟩ denotes the action of averaging throughout the realizations.
Step 2: The first mode can be calculated by:
I1 = x − s1.
Step 3: For k ≥ 2, constructing the kth set of signal-plus-noise as Xk(i) = sk−1 + βk−1Ek(w(i)), where βk−1 = ε0 σ(x)/σ(sk−1). Therefore, the kth residue, sk, can be estimated as:
Step 4: The kth mode can be calculated by:
Ik = sk−1 − sk
Step 5: Repeat the process for the next k, beginning at Step 3.
2.2. Weighted Refined Composite Multiscale Dispersion Entropy (wRCMDE)
2.2.1. Dispersion Entropy (DisEn)
Considering the given time series {u(i), i = 1, 2, 3, …, L} with length, L, DisEn can be calculated as follows:
Step 1: Each element, u(i), is mapped into c classes. To be more specific, u(i) is first normalized to {y(i), i = 1, 2, 3, …, L}, y(i) ∊ [0, 1] using the normal cumulative distribution function, and y(i) is transformed into an integer from 1 to c using:
Step 2: Defining embedding vectors as:
where m is the embedding dimension and τ is the time delay. Each embedding vector corresponds to a dispersion pattern, , where . The total number of possible dispersion patterns is cm.
Step 3: The relative probability of is calculated by:
Step 4: DisEn can be calculated by:
DisEn is a statistical measurement that reflects the complexity of the time series. In general, the more complexity a time series has, the larger the DisEn value.
2.2.2. Multiscale Dispersion Entropy (MDE)
To overcome the shortcoming of unreasonable results when using DisEn, MDE is proposed for further characterizing the randomness of the time series.
MDE is calculated as follows:
Step 1: The “coarse-graining” process is applied to the time series {u(i), i = 1, 2, 3, …, L}, which is given by:
where s denotes the scale factor and [·] indicates the rounding operation.
Step 2: The DisEn is calculated for each ‘‘coarse-grained” time series under the same parameters with different scale factors, s.
2.2.3. Weighted Refined Composite Multiscale Dispersion Entropy (wRCMDE)
To overcome the shortcoming of inaccurate results when using MDE for short signals, RCMDE is proposed, which is calculated as follows [41]:
Step 1: The “coarse-graining” process of RCMDE can be expressed by:
Step 2: For each scale factor, s, the DisEn of all of the obtained time series is calculated, and the RCMDE is given by:
Furthermore, kurtosis of the time series, KT(u), is given by:
is used for weighting the RCMDE. Therefore, the defined wRCMDE is calculated by:
Step 3: s = s + 1; repeating steps (2) and (3) under the same parameters until s = sm, where sm is the largest scale factor.
2.3. Framework for the Chatter Detection System for Robotic Milling
The framework for the proposed chatter detection system is shown in Figure 1. It consists of three steps:
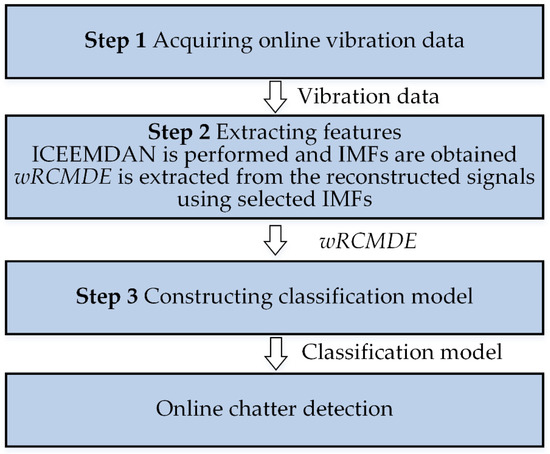
Figure 1.
The framework for the proposed chatter detection system.
Step 1: Acquiring online data
Extensive experiments is conducted to collect the vibration signals in robotic milling under variable robot configurations and cutting parameters.
Step 2: Extracting features
The ICEEMDAN method is performed on the vibration signals, and a set of IMFs is obtained. The effective IMFs are selected according to the correlation between the original signals and each IMF. Subsequently, the wRCMDE is extracted from the reconstructed signals using the selected IMFs.
Step 3: Constructing classification model
Based on the extracted wRCMDE features, the classification model can be constructed and trained for chatter detection in robotic milling.
3. Experimental Verification and Analysis
3.1. Robotic Milling System and Cutting Parameters
The experimental setup is illustrated in Figure 2. In the present study, milling tests, under variable robot configurations and cutting parameters, were performed on a robotic milling system. The system consisted of a Comau industrial robot. An electric spindle (Jäger, F120-H824) acted as the spindle unit. The vibration signals were measured using a PCB 356A15 acceleration sensor and recorded by a computer. The sampling rate was 5120 Hz. Φ 10 mm milling tools and aluminum alloy workpieces were used for tests. Two configurations were chosen for the experimental verification, as illustrated in Figure 3. The milling parameters are given in Table 1. The feed speed was fixed at 2 mm/s. It is noted that the different tests are defined as configuration−n−ae−ap.
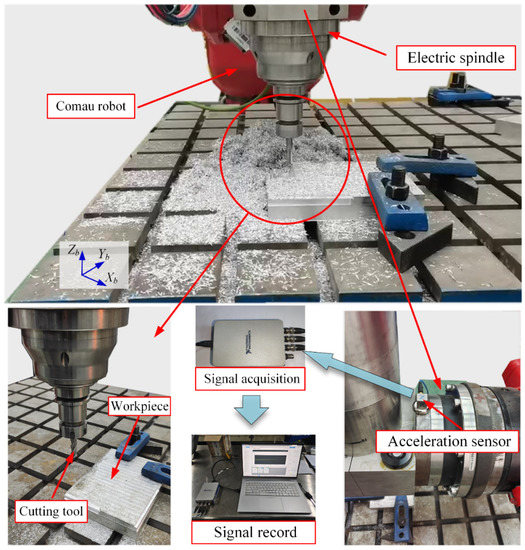
Figure 2.
Robotic milling system.
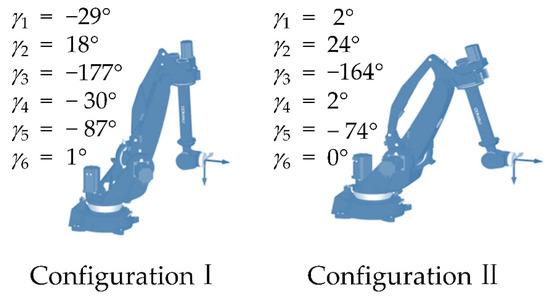
Figure 3.
Robot configurations chosen for experimental verification.

Table 1.
Milling parameters and the chatter state.
3.2. Vibration Signal Analysis
The frequency domain features can be clearly revealed by exploiting fast Fourier transform (FFT) [42]. In this work, vibration signals in the machining direction are used for the subsequent analysis. Generally speaking, in the stable cutting process, the spectrum peaks of FFT results mainly appear at the spindle rotation frequency (SRF), which is defined as n/60, and its integer multiples. When chatter occurs, the spectrum peaks will appear at chatter frequencies. The representative FFT results are shown in Figure 4. Test No. 7 (I−3000−5−3) is unstable because several peaks of the spectrum can be seen in the low-frequency range (16.25/140.9/165.3/177.2 Hz), and the peaks of the spectrum are not integer multiples of SRF. Test No. 10 (I−6000−5−2) is unstable because obvious peaks of the spectrum appear at 2076 and 2110 Hz. Test No. 12 (II−3000−1−8) is unstable because the peaks of the spectrum clearly appear at 2062 Hz. Test No. 14 (II−3000−5−1) is stable because only SRF and its integer multiples can be seen in the frequency domain plots.
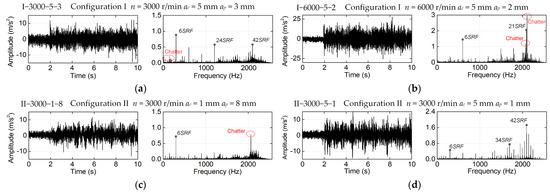
Figure 4.
The original vibration signals (left), the FFT results of original vibration signals (right): (a) Test No. 7: I−3000−5−3; (b) Test No. 10: I−6000−5−2; (c) Test No. 12: II−3000−1−8; (d) Test No. 14: II−3000−5−1.
4. Results and Discussion
4.1. Features Extraction
Several parameters should be manually set before performing ICEEMDAN. The parameter ε0 affects the desired SNR. According to [31], ε0 should be set as 0.2. Then, the parameter N determines the averaging number. If N is large, too many averaging operations need to be conducted, which is a time cost. If N is small, reasonable results cannot be obtained. For fast detection of chatter, we used N = 5. A set of IMFs can be obtained from the ICEEMDAN. Further, only IMFs which are highly correlated with the original signals contain useful information about chatter. Therefore, correlation analyses between original signals and each IMF needed to be conducted. The IMFs with correlation coefficients greater than 0.1 were taken into consideration and used to reconstruct the original vibration signals.
Next, the wRCMDE could be extracted from the reconstructed signals. Further, it was critical that some parameters were predetermined. The number of classes, c, was the first parameter of focus. When c is too small, two data points with large differences in amplitude may be classified into the same class, which leads to underestimating the irregularity of the signal. Conversely, when c is too large, the estimation results are easily disturbed by noise and the robustness is poor. To obtain an ideal estimation result, c was set to 5 in this paper based on the existing research [40]. The embedding dimension, m, was the second parameter to be considered. With the decrease in the embedding dimension, m, the embedding vectors become shorter, and more embedding vectors can be obtained, which cannot accurately reflect the overall dynamic changes in the signals. However, fewer embedding vectors would be obtained with an increase in m, which may result in the loss of detailed information for the time series. According to [43], m was set to 5 in this paper. Commonly, τ is set as 1 in practice. The largest scale factor, sm, is usually set at sm ≥ 10 [43]. However, unstable estimation results would be observed if s was too large [44]. Consequently, we chose sm = 15.
The wRCMDE was extracted from the reconstructed signals corresponding to all of the robotic milling tests. The typical wRCMDE values under different robot configurations and cutting parameters are shown in Figure 5. It can be seen from Figure 5 that the wRCMDE values showed a downward trend with the increase in the scale factor. It is worth noting that the wRCMDE values obtained from the chatter state were larger than those obtained from the chatter-free state when the scale factor was s ≤ 4. Therefore, wRCMDE values obtained at s ≤ 4 were chosen as the features for constructing the chatter detection model.
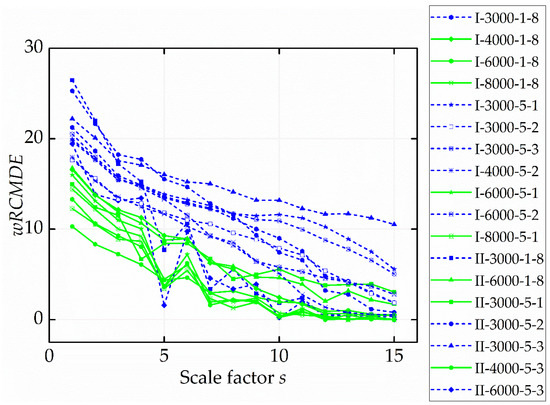
Figure 5.
wRCMDE extracted from the reconstructed signals with different scale factors. Green lines indicate a chatter-free state, and blue dashed lines indicate a chatter state.
4.2. Classification Models Construction
In this paper, classification models were developed using the “classification learner” toolkit provided by MATLAB. Several classical classification learner models were trained, including support vector machine (SVM), k-nearest neighbor (KNN), and decision tree. A total of 540 groups of wRCMDE samples for the two chatter states (chatter and chatter-free) were selected as training samples. The wRCMDE samples were be normalized first, and 5-fold cross-validation was adopted to modify the classification accuracy.
During the training of each classification model, the kernel parameters were optimized based on the training accuracy. The training accuracy of the selected models is listed in Table 2. The SVM model with the Gaussian kernel function was chosen as the final classification model.
Table 2.
Training accuracy of classification models.
Furthermore, the SVM models based on ICEEMDAN and RCMDE (ICEEMDAN-RCMDE), ICEEMDAN and MDE (ICEEMDAN-MDE), EEMD and wRCMDE (EEMD-wRCMDE), EEMD and RCMDE (EEMD-RCMDE), and EEMD and MDE (EEMD-MDE) were also constructed for comparison. It can be seen from Table 3 that the proposed model (named ICEEMDAN-wRCMDE) showed superiority over the other methods.
Table 3.
Training accuracy of different methods.
Further, to show the performance details of the constructed SVM model based on ICEEMDAN-wRCMDE, the parallel coordinates plot, the receiver operating characteristic (ROC) plot, and the confusion matrix are presented in Figure 6, Figure 7 and Figure 8, respectively.
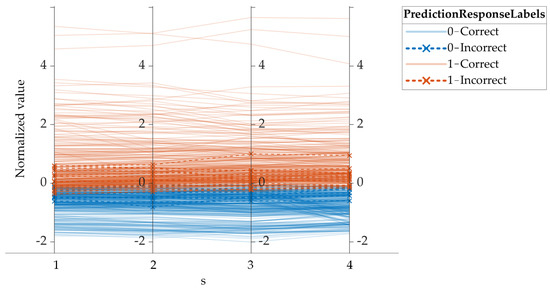
Figure 6.
The parallel coordinates plot of the constructed SVM model.
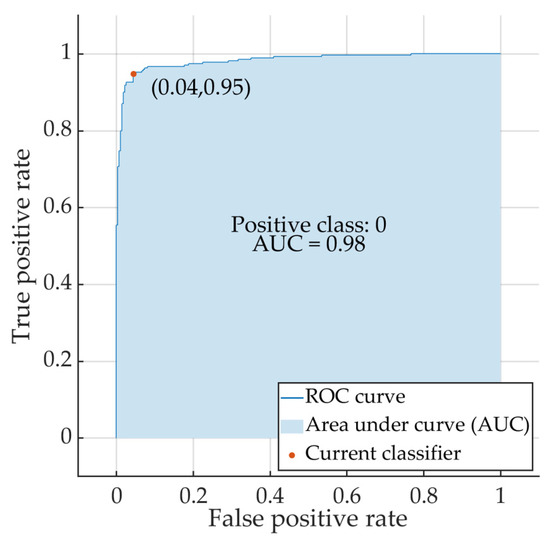
Figure 7.
The ROC plot of the constructed SVM model.
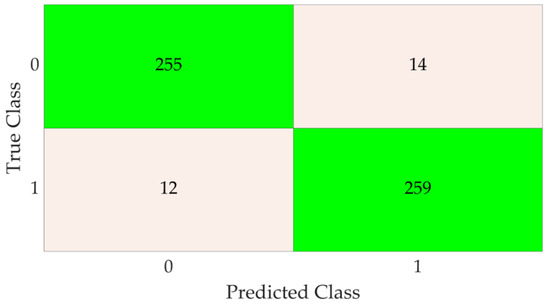
Figure 8.
The confusion matrix of the constructed SVM model.
4.3. Classification Performance
During the chatter detection process, the signals used for processing each time contain 1024 sample points. To verify the effectiveness of the proposed method, chatter detection was conducted by checking the classification results over time. Meanwhile, the vibration signals were filtered to eliminate the SRFs and processed using the short-time Fourier transform (STFT) to illustrate the time–frequency spectrogram. The original vibration signals, chatter classification results, and time–frequency spectrograms of each experiment are shown in Figure 9 and Figure 10. It is noted that label 1 denotes a chatter state and label 0 denotes a chatter-free state. The test groups in Figure 9 come from the experiments listed in Table 1. Furthermore, the test groups in Figure 10 are additional experiments that differ from those listed in Table 1.
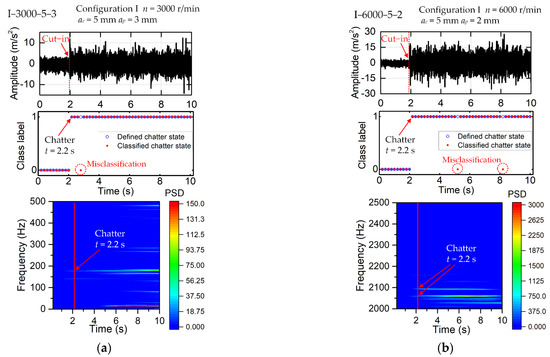
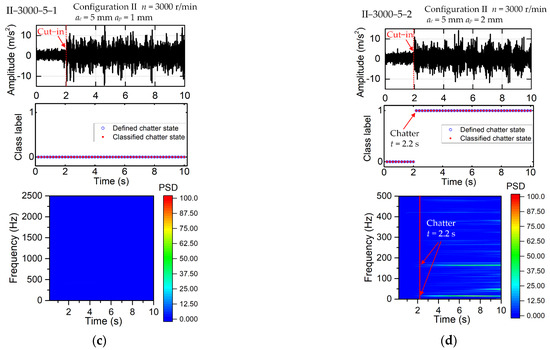
Figure 9.
Detection results for: (a) I−3000−5−3; (b) I−6000−5−2; (c) II−3000−5−1; (d) II−3000−5−2.
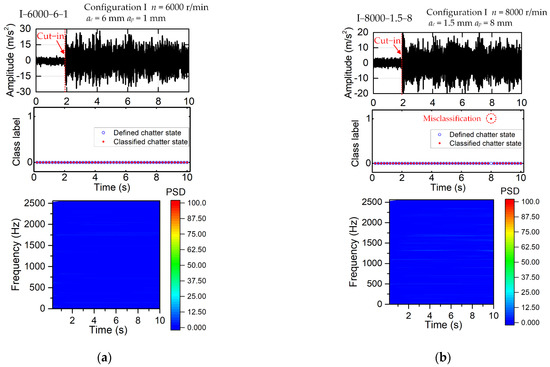
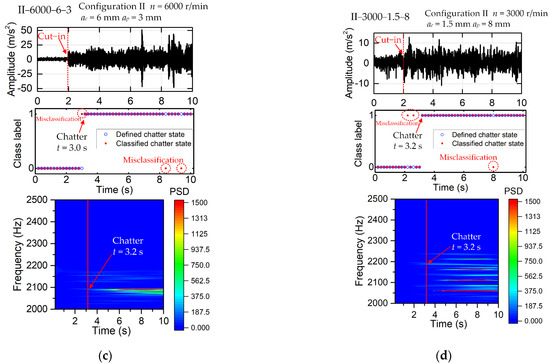
Figure 10.
Detection results for: (a) I−6000−6−1; (b) I−8000−1. 5−8; (c) II−6000−6−3; (d) II−3000−1.5−8.
It can be seen from Figure 9 and Figure 10 that the proposed method can realize fast and reliable chatter detection with different robot configurations and cutting parameters. Only intermittent false results can be observed, which does not affect the final decision of the chatter state and is acceptable for practice.
Concerning the influence of the acceleration sensor position and location on the raw data acquisition, additional experiments were conducted. Configuration III denotes another robot configuration (γ1 = −10°, γ2 = 22°, γ3 = −164°, γ4 = −10°, γ5 = −74°, γ6 = 1.5°). The position of two acceleration sensors is shown in Figure 11a, where acceleration sensor 1 is mounted on the spindle and acceleration sensor 2 is mounted on the robot end. The comparison of time-domain signals obtained from the two sensors is shown in Figure 11b. As can be seen, the vibration signals obtained from acceleration sensor 1 show larger amplitudes than acceleration sensor 2, due to acceleration sensor 1 being located closer to the cutting area. Furthermore, as can be seen from Figure 12, the results of the wRCMDE values are similar to those in Figure 5; this indicates that the acceleration sensor position and location have little effect on the proposed chatter detection method.
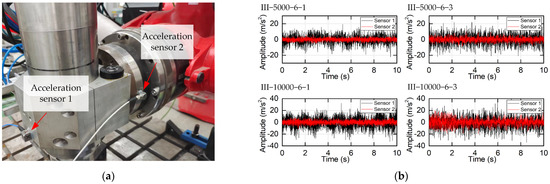
Figure 11.
(a) Position of two acceleration sensors; (b) Comparison of time-domain signals.
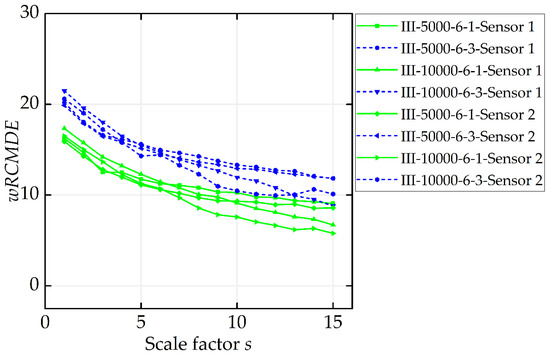
Figure 12.
wRCMDE with different scale factors. Green lines indicate a chatter-free state, and blue dashed lines indicate a chatter state.
5. Conclusions
A novel approach to detecting chatter in the robotic milling process is proposed. The ICEEMDAN method was used to decompose the milling vibration signals into a series of IMFs. Based on the correlations between the original signals and each IMF, the effective IMFs were obtained. Signal reconstruction was conducted using the obtained effective IMFs. Weighted refined composite multiscale dispersion entropy was extracted from the obtained reconstructed signals to characterize the chatter states. Then, a classification model based on SVM was established for chatter detection. Extensive case studies prove that the proposed method is feasible for chatter detection in the robotic milling process under different robot configurations and cutting parameters.
Author Contributions
Conceptualization, B.Y. and K.G.; data curation, K.G.; formal analysis, B.Y. and J.S.; funding acquisition, K.G.; investigation, B.Y. and K.G.; methodology, B.Y.; project administration, J.S.; resources, J.S.; software, B.Y. and K.G.; supervision, K.G.; validation, B.Y.; Visualization, J.S.; Writing—original draft, B.Y.; Writing—review and editing, K.G. and J.S. All authors have read and agreed to the published version of the manuscript.
Funding
This research was funded by the National Natural Science Foundation of China, grant number 51975335 and grant number 52175419.
Institutional Review Board Statement
Not applicable.
Conflicts of Interest
The authors declare no conflict of interest.
References
- Liao, Z.; Wang, Q.; Xie, H.; Li, J.; Zhou, X.; Hua, P. Optimization of robot posture and workpiece setup in robotic milling with stiffness threshold. IEEE-ASME Trans. Mechatron. 2022, 27, 582–593. [Google Scholar] [CrossRef]
- Zhang, Y.; Guo, K.; Sun, J.; Sun, Y. Method of postures selection for industrial robot joint stiffness identification. IEEE Access 2021, 9, 62583–62592. [Google Scholar] [CrossRef]
- Zaeh, M.F.; Schnoes, F.; Obst, B.; Hartmann, D. Combined offline simulation and online adaptation approach for the accuracy improvement of milling robots. CIRP Ann. 2020, 69, 337–340. [Google Scholar] [CrossRef]
- Zhang, Y.; Guo, K.; Sun, J. Investigation on the milling performance of amputating clamping supports for machining with industrial robot. Int. J. Adv. Manuf. Technol. 2019, 102, 3573–3586. [Google Scholar] [CrossRef]
- Hao, D.; Wang, W.; Liu, Z.; Yun, C. Experimental study of stability prediction for high-speed robotic milling of aluminum. J. Vib. Control 2020, 26, 387–398. [Google Scholar] [CrossRef]
- Zhou, C.; Guo, K.; Sun, J. Sound singularity analysis for milling tool condition monitoring towards sustainable manufacturing. Mech. Syst. Signal Process. 2021, 157, 107738. [Google Scholar] [CrossRef]
- Pan, Z.; Zhang, H.; Zhu, Z.; Wang, J. Chatter analysis of robotic machining process. J. Mater. Process. Technol. 2006, 173, 301–309. [Google Scholar] [CrossRef]
- Cordes, M.; Hintze, W.; Altintas, Y. Chatter stability in robotic milling. Robot. Comput.-Integr. Manuf. 2019, 55, 11–18. [Google Scholar] [CrossRef]
- Yuan, L.; Pan, Z.; Ding, D.; Sun, S.; Li, W. A review on chatter in robotic machining process regarding both regenerative and mode coupling mechanism. IEEE-ASME Trans. Mechatron. 2018, 23, 2240–2251. [Google Scholar] [CrossRef]
- Cen, L.; Melkote, S.N. CCT-based mode coupling chatter avoidance in robotic milling. J. Manuf. Process. 2017, 29, 50–61. [Google Scholar] [CrossRef]
- Sun, L.; Zheng, K.; Liao, W.; Liu, J.; Feng, J.; Dong, S. Investigation on chatter stability of robotic rotary ultrasonic milling. Robot. Comput.-Integr. Manuf. 2020, 63, 101911. [Google Scholar] [CrossRef]
- Guo, Y.; Dong, H.; Ke, Y. Stiffness-oriented posture optimization in robotic machining applications. Robot. Comput.-Integr. Manuf. 2015, 35, 69–76. [Google Scholar] [CrossRef]
- Lin, Y.; Zhao, H.; Ding, H. Posture optimization methodology of 6R industrial robots for machining using performance evaluation indexes. Robot. Comput.-Integr. Manuf. 2017, 48, 59–72. [Google Scholar] [CrossRef]
- Yang, B.; Guo, K.; Sun, J. Towards metamaterial rods with amplitude-dependent band gaps: A superelastic alloy-based approach. Mech. Syst. Signal Process. 2022, 166, 108459. [Google Scholar] [CrossRef]
- Guo, K.; Zheng, D.; Li, J. Optimal Bounded Ellipsoid Identification With Deterministic and Bounded Learning Gains: Design and Application to Euler-Lagrange Systems. IEEE Trans. Cybern. 2021, 1–14. [Google Scholar] [CrossRef]
- Xu, Y.; Guo, K.; Sun, J.; Li, J. Design, modeling and control of a reconfigurable variable stiffness actuator. Mech. Syst. Signal Process. 2021, 160, 107883. [Google Scholar] [CrossRef]
- Zhu, L.; Liu, C. Recent progress of chatter prediction, detection and suppression in milling. Mech. Syst. Signal Process. 2020, 143, 106840. [Google Scholar] [CrossRef]
- Wang, W.; Wan, M.; Zhang, W.; Yang, Y. Chatter detection methods in the machining processes: A review. J. Manuf. Process. 2022, 77, 240–259. [Google Scholar] [CrossRef]
- Cen, L.; Melkote, S.N.; Castle, J.; Appelman, H. A method for mode coupling chatter detection and suppression in robotic milling. J. Manuf. Sci. Eng. 2018, 140, 081015. [Google Scholar] [CrossRef]
- Tao, J.; Qin, C.; Xiao, D.; Shi, H.; Ling, X.; Li, B.; Liu, C. Timely chatter identification for robotic drilling using a local maximum synchrosqueezing-based method. J. Intell. Manuf. 2020, 31, 1243–1255. [Google Scholar] [CrossRef]
- Chen, Q.; Zhang, C.; Hu, T.; Zhou, Y.; Ni, H.; Wang, T. Online chatter detection in robotic machining based on adaptive variational mode decomposition. Int. J. Adv. Manuf. Technol. 2021, 117, 555–577. [Google Scholar] [CrossRef]
- Wang, Y.; Zhang, M.; Tang, X.; Peng, F.; Yan, R. A kMap optimized VMD-SVM model for milling chatter detection with an industrial robot. J. Intell. Manuf. 2022, 33, 1483–1502. [Google Scholar] [CrossRef]
- Yan, S.; Sun, Y. Early chatter detection in thin-walled workpiece milling process based on multi-synchrosqueezing transform and feature selection. Mech. Syst. Signal Process. 2022, 169, 108622. [Google Scholar] [CrossRef]
- Chen, D.; Zhang, X.; Zhao, H.; Ding, H. Development of a novel online chatter monitoring system for flexible milling process. Mech. Syst. Signal Process. 2021, 159, 107799. [Google Scholar] [CrossRef]
- Wan, S.; Li, X.; Chen, W.; Hong, J. Investigation on milling chatter identification at early stage with variance ratio and Hilbert–Huang transform. Int. J. Adv. Manuf. Technol. 2018, 95, 3563–3573. [Google Scholar] [CrossRef]
- Cao, H.; Zhou, K.; Chen, X.; Zhang, X. Early chatter detection in end milling based on multi-feature fusion and 3σ criterion. Int. J. Adv. Manuf. Technol. 2017, 92, 4387–4397. [Google Scholar] [CrossRef]
- Yang, K.; Wang, G.; Dong, Y.; Zhang, Q.; Sang, L. Early chatter identification based on an optimized variational mode decomposition. Mech. Syst. Signal Process. 2019, 115, 238–254. [Google Scholar] [CrossRef]
- Cao, H.; Zhou, K.; Chen, X. Chatter identification in end milling process based on EEMD and nonlinear dimensionless indicators. Int. J. Mach. Tools Manuf. 2015, 92, 52–59. [Google Scholar] [CrossRef]
- Fu, Y.; Zhang, Y.; Zhou, H.; Li, D.; Liu, H.; Qiao, H.; Wang, X. Timely online chatter detection in end milling process. Mech. Syst. Signal Process. 2016, 75, 668–688. [Google Scholar] [CrossRef]
- Yeh, J.R.; Shieh, J.S.; Huang, N.E. Complementary ensemble empirical mode decomposition: A novel noise enhanced data analysis method. Adv. Adapt. Data Anal. 2010, 2, 135–156. [Google Scholar] [CrossRef]
- Colominas, M.A.; Schlotthauer, G.; Torres, M.E. Improved complete ensemble EMD: A suitable tool for biomedical signal processing. Biomed. Signal Process. Control 2014, 14, 19–29. [Google Scholar] [CrossRef]
- Lv, Y.; Yuan, R.; Wang, T.; Li, H.; Song, G. Health degradation monitoring and early fault diagnosis of a rolling bearing based on CEEMDAN and improved MMSE. Materials 2018, 11, 1009. [Google Scholar] [CrossRef]
- Li, R.; Ran, C.; Zhang, B.; Han, L.; Feng, S. Rolling Bearings Fault Diagnosis Based on Improved Complete Ensemble Empirical Mode Decomposition with Adaptive Noise, Nonlinear Entropy, and Ensemble SVM. Appl. Sci. 2020, 10, 5542. [Google Scholar] [CrossRef]
- Han, H.; Cho, S.; Kwon, S.; Cho, S. Fault Diagnosis Using Improved Complete Ensemble Empirical Mode Decomposition with Adaptive Noise and Power-Based Intrinsic Mode Function Selection Algorithm. Electronics 2018, 7, 16. [Google Scholar] [CrossRef]
- Liu, C.; Zhu, L.; Ni, C. Chatter detection in milling process based on VMD and energy entropy. Mech. Syst. Signal Process. 2018, 105, 169–182. [Google Scholar] [CrossRef]
- Zhang, Z.; Li, H.; Meng, G.; Tu, X.; Cheng, C. Chatter detection in milling process based on the energy entropy of VMD and WPD. Int. J. Mach. Tools Manuf. 2016, 108, 106–112. [Google Scholar] [CrossRef]
- Liu, X.; Wang, Z.; Li, M.; Yue, C.; Liang, S.Y.; Wang, L. Feature extraction of milling chatter based on optimized variational mode decomposition and multi-scale permutation entropy. Int. J. Adv. Manuf. Technol. 2021, 114, 2849–2862. [Google Scholar] [CrossRef]
- Li, K.; He, S.; Li, B.; Liu, H.; Mao, X.; Shi, C. A novel online chatter detection method in milling process based on multiscale entropy and gradient tree boosting. Mech. Syst. Signal Process. 2020, 135, 106385. [Google Scholar] [CrossRef]
- Rostaghi, M.; Azami, H. Dispersion entropy: A measure for time-series analysis. IEEE Signal Process. Lett. 2016, 23, 610–614. [Google Scholar] [CrossRef]
- Gan, X.; Lu, H.; Yang, G. Fault diagnosis method for rolling bearings based on composite multiscale fluctuation dispersion entropy. Entropy 2019, 21, 290. [Google Scholar] [CrossRef]
- Azami, H.; Rostaghi, M.; Abásolo, D.; Escudero, J. Refined composite multiscale dispersion entropy and its application to biomedical signals. IEEE Trans. Biomed. Eng. 2017, 64, 2872–2879. [Google Scholar] [PubMed]
- Zhou, C.; Yang, B.; Guo, K.; Liu, J.; Sun, J.; Song, G.; Zhu, S.; Sun, C.; Jiang, Z. Vibration singularity analysis for milling tool condition monitoring. Int. J. Mech. Sci. 2020, 166, 105254. [Google Scholar] [CrossRef]
- Zheng, J.; Pan, H.; Yang, S.; Cheng, J. Generalized composite multiscale permutation entropy and Laplacian score based rolling bearing fault diagnosis. Mech. Syst. Signal Process. 2018, 99, 229–243. [Google Scholar] [CrossRef]
- Minhas, A.S.; Kankar, P.K.; Kumar, N.; Singh, S. Bearing fault detection and recognition methodology based on weighted multiscale entropy approach. Mech. Syst. Signal Process. 2021, 147, 107073. [Google Scholar] [CrossRef]
Publisher’s Note: MDPI stays neutral with regard to jurisdictional claims in published maps and institutional affiliations. |
© 2022 by the authors. Licensee MDPI, Basel, Switzerland. This article is an open access article distributed under the terms and conditions of the Creative Commons Attribution (CC BY) license (https://creativecommons.org/licenses/by/4.0/).