Abstract
During micro-scale tracer flow in porous media, the permeability and fluid velocity significantly affect the fluid dispersion properties of the media. However, the relationships between the dispersion coefficient, permeability, and fluid velocity in core samples are still not clearly understood. Two sets of experiments were designed to study the effects of tracer fluid flow velocity and porous medium permeability on the dispersion phenomenon in a core environment, using natural and sand-filled cores, respectively. From experimental data-fitting by a mathematical model, the relationship between the dispersion coefficient, flow velocity, and permeability was identified, allowing the analysis of the underlying mechanism behind this phenomenon. The results show that a higher volumetric flow rate and lower permeability cause a delay in the tracer breakthrough time and an increase in the dispersion coefficient. The core experimental results show that the dispersion coefficient is negatively correlated with the permeability and positively correlated with the superficial velocity. The corresponding regression equations indicate linear relations between the dispersion coefficient, core permeability, and fluid velocity, resulting from the micron scale of grain diameters in cores. The combination of high velocity and low permeability yields a large dispersion coefficient. The effects of latitudinal dispersion in porous media cannot be ignored in low-permeability cores or formations. These findings can help to improve the understanding of tracer flow in porous media, the design of injection parameters, and the interpretation of tracer concentration distribution in inter-well tracer tests.
1. Introduction
The inter-well tracer test is one of the most mature and advanced testing techniques in reservoir development at present [1]. Formation heterogeneity properties, such as waterflooding channel permeability and fracture network volume, can be obtained from tracer concentration interpretation [2]. Conservative tracers do not interact or alter during the transport, thus their concentration is not affected by processes other than dilution, dispersion, and partial redirection. Hydrodynamic dispersion, including mechanical dispersion and molecular diffusion, plays an important role in the tracer concentration distribution [3]. It is necessary to study the dispersion effect on tracer flow to improve formation heterogeneity characterization by inter-well tracer tests [4].
Hydrodynamic dispersion is one of the mixing effects that occur in laminar flow through a porous medium [5,6]. It is a macroscopic phenomenon determined by the interaction of molecular diffusion and advection processes, resulting in the development of a transition zone between miscible fluids with two different components [7]. This phenomenon, which was first discovered in groundwater, is now widely encountered in many fields, such as chemical engineering, materials science, hydrology, and petroleum engineering.
Hydrodynamic dispersion can be regarded as an attribute of the porous system, or as the spreading behavior of a solute during its transportation [8]. The dispersion process may be described with reference to a model system consisting of a cylindrical tube filled with homogeneous sand grains initially saturated with fresh water. At the start of the experiment—i.e., t = 0—water containing a type of tracer was injected into the porous medium. The produced tracer concentration was measured as a function of time t at a point located at a distance L downstream of the injection point, yielding the so-called breakthrough curve. Assuming that no dispersion occurs, the breakthrough curve should show a step change—i.e., a sharp front moving at the average velocity—which is determined by Darcy’s law. However, due to the existence of hydrodynamic dispersion, the observed breakthrough curve is actually S-shaped, with a part of the tracer-containing water being ahead of the position where the average flow velocity is reached and a transition zone occurring between the tracer concentrations due to hydrodynamic dispersion.
Since the 1950s, many scholars have observed, analyzed, and summarized a large number of tracer dispersion experiments in the laboratory and proposed various models to describe the solute dispersion process in porous media. By the 1960s, a more systematic description of dispersion in porous media had been formulated. In theory, the hydrodynamic dispersion approximation follows Fick’s law of material diffusion in free solutions. An advection-dispersion equation was established for solute transport based on this theory [3]. With increased research on miscible and chemical flooding, the effects of adsorption and other factors on solute transport have been incorporated, allowing the establishment of equations describing the dispersion phenomenon under different conditions [9,10], which can be solved using numerical techniques [11].
The main cause of the dispersion phenomenon is purely mechanical and is therefore different from that of molecular diffusion caused by concentration differences. The primary mechanism is the resistance caused by the friction between the fluid and the complex microstructure of the porous medium, which causes the fluid to pass through different pores at different velocities [12]. The dispersion coefficient is a parameter that characterizes the ability of a fluid to disperse in a porous medium at a certain flow rate [13]. It is significantly correlated with the parameters that describe the structure of a porous medium (such as porosity [14], pore size [15,16], pore uniformity [17], and tortuosity [18]) and the characteristics of particles (such as particle uniformity [19], shape (curvature) [20,21], and size [22,23]). Generally, dispersion is a phenomenon caused by differences in velocity due to the different structures in porous media, and the dispersion coefficient is considered to have a close relationship with the structures of the porous medium and the velocity of the fluid.
To further elucidate the relationship between the porous medium and the dispersion coefficient, Van der Meer et al. (1984) [24] proposed a correlation for a single solid phase considering the dispersion coefficient as a sole function of liquid superficial velocity. Galvin et al. (2006) [25] investigated the steady-state segregation and dispersion of a binary system of particles in a liquid-fluidized bed, illustrating that the dispersion coefficient exhibits a positive linear relationship with interstitial fluid velocity. Zhao (2007) [26] conducted core displacement experiments on sandstone, using a light volatile oil to displace crude oil. The results showed that the calculated dispersion coefficient was positively correlated with the core permeability on a semi-logarithmic scale. In 2010, Hua [27] conducted experiments on the relationship between the dispersion and flow conductivity in a horizontal fracture. The results showed that the dispersion in the Darcy flow was negatively correlated with the permeability coefficient. Qi et al. (2017) [28] used a particle tracking method based on a capillary network model, as well as the method of moments in conjunction with percolation theory to establish a three-dimensional percolation network model to determine the relationship between the dispersion coefficient and the permeability. The results showed that the dispersion coefficient was negatively correlated with the permeability if the hydraulic radii were constant and vice versa if they were variable. Khan et al. (2017) [29] utilized different dispersion correlations to describe the intermixing and segregation behavior for the binary particle species differing in density in terms of axial particle concentration profile. Moreover, Khan et al. (2020) [30] reported a model for dispersion coefficient along the line of definition for diffusion coefficient incorporating the mean free path of collision and interstitial fluid velocity as the characteristic velocity of collision. A summary of some of the main findings since the 1950s regarding the relationship between the dispersion coefficient and velocity is shown in Table 1.

Table 1.
Main research findings on the relationship between the dispersion coefficient, structure of porous media, and fluid velocity.
The aforementioned research on the mechanism of dispersion phenomenon shows that there are different relationships between the dispersion coefficient, the structure of the particles (grains), and the fluid velocity. Moreover, there are few studies on the permeability–dispersion relationship, and they are all focused on soil or packed bed rather than porous media. Thus far, the relationships between the dispersion coefficient, permeability, and fluid velocity in core samples are not clearly understood.
To fill this gap, the present study applies two types of core samples to conduct experiments, exploring the influence of permeability and velocity on dispersion coefficients. Two sets of displacement experiments are conducted in natural and sand-filled cores, respectively, to obtain the tracer breakthrough concentrations. The experimental results will then be fitted using a correlation to ascertain the relationship between the dispersion coefficient and the fluid velocity and permeability. Finally, the underlying mechanisms behind these relations are discussed.
2. Materials and Method
2.1. Tracer Evaluation
The tracer thiocyanate ion (SCN−) was selected for the experiments. Its traceability was evaluated as follows (Table 2): First, the background concentrations of the tracer in the rock samples and the formation water were measured to ensure that these materials were free of SCN−. Second, the compatibility of SCN− with the formation water was determined by placing the SCN− solution in an incubator at the formation temperature (50 °C) for 10 days. The results of this observation showed that no precipitation occurred over the 10-day period, and the concentrations measured on days 3 and 10 were 49.5 and 49.0 mg/L, respectively, which represent rates of change in concentration of 1% and 2%, respectively. These results indicate that the SCN− is compatible with the formation water.
Table 2.
Tracer evaluation results.
Finally, a static adsorption test was performed. A total of 500 mL of 50 mg/L SCN− solution was prepared, 150 mL of which was added to a triangle bottle along with 50 g of crushed rock sample. After stirring well, the bottle mouth was sealed and the bottle was shaken gently at the formation temperature for 48 h, before removing the supernatant and centrifuging. The concentration of the tracer was sampled and analyzed from the centrifuged solution. The result was 48.9 mg/L—i.e., an adsorption ratio of 2.2%. From these experimental measurements, it was concluded that SCN− meets the requirements of the core flooding experiments under the selected experimental temperature.
2.2. Experimental Setup and Procedure
A schematic of the experimental setup for the tracer transport experiments is shown in Figure 1. The main experimental components included a constant flux pump, core holder, pressure gauge, tracer fluid tank, and formation water tank. The core sample (either natural or sand-filled) was placed in the core holder. The core was then saturated with water using a vacuum pump to ensure no air bubbles were present. A flask was used to collect the produced liquid. Finally, an oven was used to heat the core to determine its porosity.
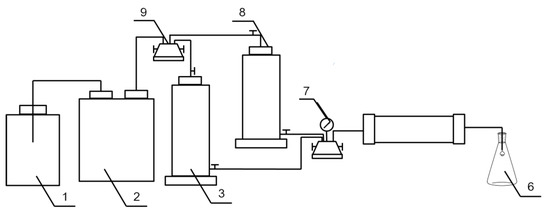
Figure 1.
Schematic diagram of the experimental setup for tracer transport in cores: 1: Driving fluid pump; 2: constant flux pump; 3: tracer fluid tank; 4 and 9: six-way valves; 5: core holder; 6: collection flask; 7: pressure gauge; 8: formation water tank.
Two sets of core displacement experiments were designed. The first set consisted of high-velocity (0.04 cm3/s) and low-velocity (0.02 cm3/s) displacement experiments performed on natural cores (Nos. 1–3) from the same formation and block. The second set consisted of four sand-filled cores (Nos. 4–7) with similar permeabilities subject to displacement experiments with different velocities (0.02, 0.03, 0.05, and 0.08 cm3/s). The permeabilities of cores Nos. 1–3 were 1570, 610, and 230 mD, respectively. The permeabilities of cores Nos. 4–7 were between 574 and 699 mD, representing the typical permeability range of inter-well waterflooding channels in eastern oilfields in China. The fluid velocities in the experiments were selected based on the equivalent water injection velocities calculated from the injection rate.
The experimental procedure for each group of experiments was as follows:
(1) A water displacement test was conducted to make sure there are no leaks in the system.
(2) A steady water displacement was carried out using a constant flux pump in order to calculate the absolute permeability of the core using the data from the pressure gauge and the injection flow rate.
(3) Once the absolute permeability was determined, the tracer, 50 mg/L SCN− solution, was injected at a constant flow rate. In total, two pore volumes (PV) of tracer were injected.
(4) Once the displacement experiments were completed, the core was heated in an oven and its porosity was determined.
3. Experimental Results and Discussion
3.1. Experimental Results
After the completion of the displacement experiment, the concentration of the produced tracer solution was measured. Figure 2 illustrates the tracer breakthrough concentrations from the natural cores (Nos. 1–3) for the high- and low-velocity displacement experiments. Figure 3 shows the tracer breakthrough concentration from the sand-filled cores (No. 4–7) at different displacement velocities.
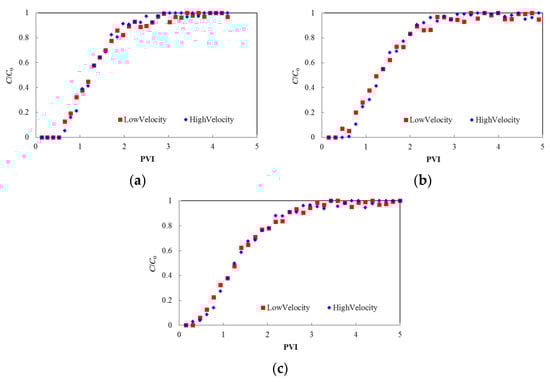
Figure 2.
Tracer concentration ratio versus pore volume injected (PVI) at different flow rates in the natural cores (low rate = 0.02 cm3/s; high rate = 0.04 cm3/s): (a) core No. 1 (1570 mD), (b) core No. 2 (610 mD), and (c) core No. 3 (230 mD).
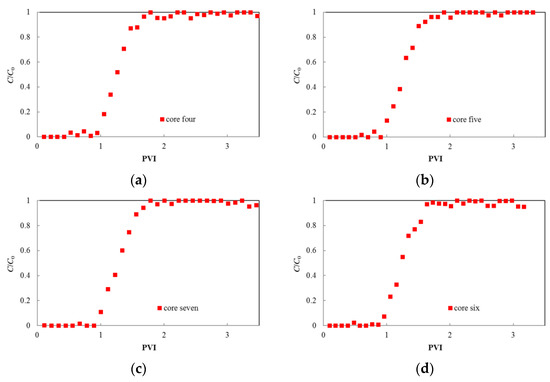
Figure 3.
Tracer concentration ratio versus pore volume injected (PVI) at different flow rates in the sand-filled cores: (a) 0.02 cm3/s; (b) 0.03 cm3/s, (c) 0.05 cm3/s, and (d) 0.08 cm3/s.
3.2. Results Analysis
Based on the results obtained from the displacement experiments, the core dispersion coefficient was obtained by fitting the breakthrough concentration using the analytical solution Equation (A12) (see Appendix A) [3]. For the natural cores, Figure 4 and Figure 5 show the fitting results for the low-velocity and high-velocity displacement experiments, respectively. For the sand-filled cores, Figure 6 shows the fitting results at different displacement velocities.
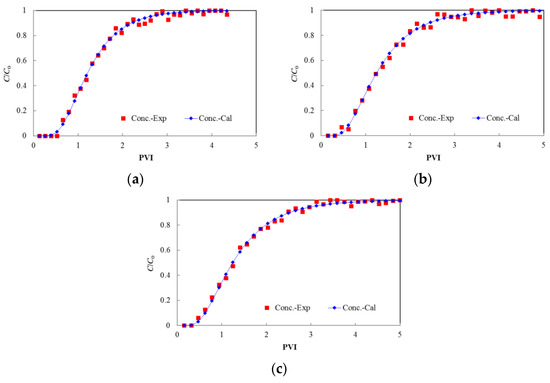
Figure 4.
Data fitting for tracer concentration ratio versus pore volume injected (PVI) at low flow rate (0.02 cm3/s) in natural cores: (a) core No. 1 (1570 mD), (b) core No. 2 (610 mD), and (c) core No. 3 (230 mD).
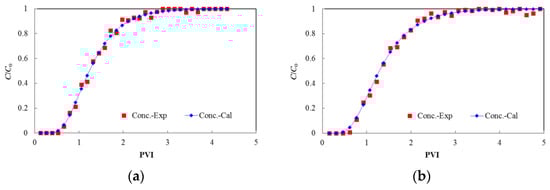
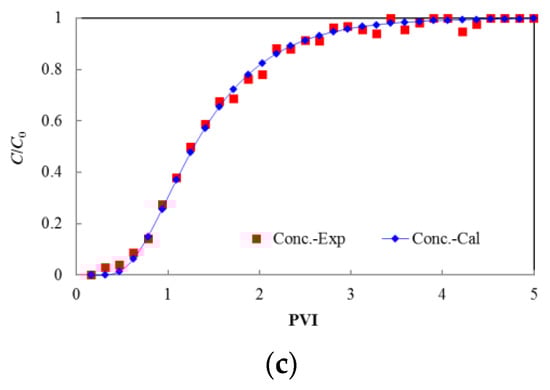
Figure 5.
Data fitting for tracer concentration ratio versus pore volume injected (PVI) at high flow rate (0.04 cm3/s) in natural cores: (a) core No. 1 (1570 mD), (b) core No. 2 (610 mD), and (c) core No. 3 (230 mD).
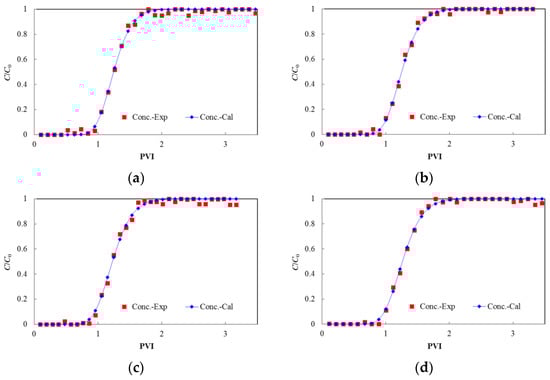
Figure 6.
Data fitting for tracer concentration ratio versus pore volume injected (PVI) at different flow rates in sand-filled cores: (a) 0.02 cm3/s; (b) 0.03 cm3/s, (c) 0.05 cm3/s, and (d) 0.08 cm3/s.
Table 3 and Table 4 present the experimental parameters for the natural and sand-filled cores, respectively, including core porosity, length, permeability, flow rate, and velocity, as well as the dispersion coefficient values obtained by fitting.
Table 3.
Experimental parameters and fitted dispersion coefficient for the natural cores.
Table 4.
Experimental parameters and fitted dispersion coefficient for the sand-filled cores.
As shown in Table 3, the interpreted dispersion coefficient increased slightly with the decrease in core permeability. As shown in Table 4, the interpreted dispersion coefficient increased from 0.004 to 0.023 cm2/s with the increase in flow rate from 0.02 to 0.08 cm3/s. Therefore, dispersion coefficient has a negative correlation with core permeability and a positive correlation with flow velocity. To examine whether the relationships are the same as for those with large particle sizes, including liquid-fluidized bed and Perspex tube, specific regression equations and the underlying mechanisms are studied in the next section.
3.3. Discussion
3.3.1. Equations of Dispersion Coefficient in Cores
The dispersion coefficient values in Table 3 and Table 4 demonstrate that the coefficient is positively correlated with superficial velocity, while it is negatively correlated with core permeability. Based on these results, the dispersion coefficient as functions of injection velocity for the natural and sand-filled cores are plotted in Figure 7 and Figure 8, respectively. The linear relations between the dispersion coefficient, the velocity, and the permeability are obtained through calculation, as follows:
where DN and DA are the dispersion coefficients of the natural and sand-filled cores, respectively (cm2/s); K is the core permeability (mD); and u is the tracer superficial velocity. These figures confirm the trends observed in Table 3 and Table 4.
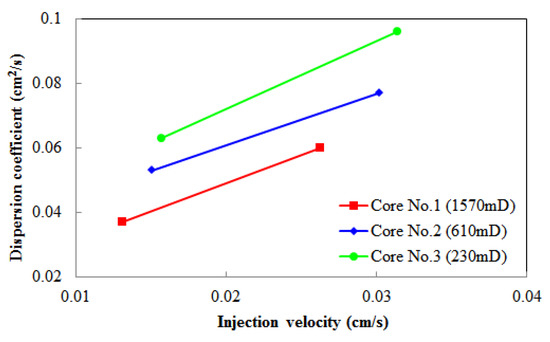
Figure 7.
Dispersion coefficient versus injection (superficial) velocity in natural cores.
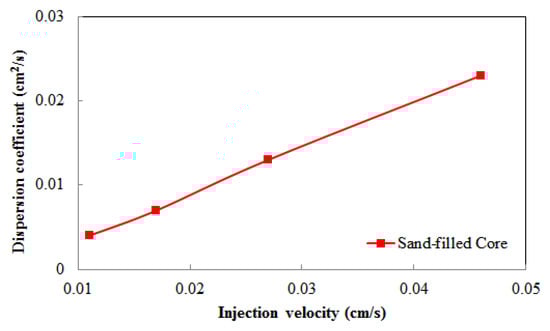
Figure 8.
Dispersion coefficient versus injection (superficial) velocity in sand-filled cores.
The results of this work reveal a linear relationship between the dispersion coefficient and fluid velocity as shown in Equations (1) and (2), inconsistent with the previous findings of the nonlinear relationship [35,36,37,38]. The cause of this difference can be attributed to the grain shape and fluid velocity. As Pugliese and Poulsen [36] demonstrated, the closer a particle is to a spherical shape, the more significant the nonlinear relationship between the dispersion coefficient and the velocity of water flow. As the grain diameters in core samples are in the scale of micrometers and the grain shape is close to spherical, it is reasonable to approximate the grains as spheres and obtain a linear relationship.
3.3.2. Mechanisms of the Relations
To find the mechanisms of the relationships between the dispersion coefficient, permeability, and fluid velocity, two types of porous media were constructed as shown in Figure 9, which represent lower permeability (small pore sizes, Figure 9a) and higher permeability (large pore sizes, Figure 9b), respectively.
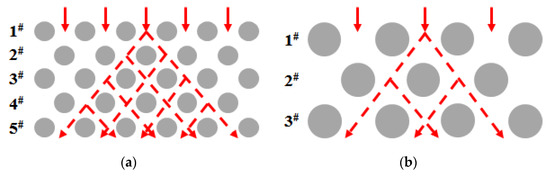
Figure 9.
Schematic diagram of structures of porous media: (a) small pore sizes, (b) large pore sizes.
When tracers flow through the porous media, as shown in Figure 9, there are two main controlling factors, namely longitudinal and latitudinal dispersion [14,19]. Due to hydrodynamic retention, some of the tracers stay in the first layer while the rest continue on to the second layer, which is referred to as longitudinal dispersion. Additionally, due to the pore structure of the porous medium, the width of tracer liquid becomes twice that of the grain size in the second layer, resulting in dispersion in the latitudinal direction.
The relationship between dispersion coefficient and permeability can be explained using Figure 9. In the five-layer example illustrated here, at a given injection velocity, the width of tracer liquid becomes five times the grain size in the medium with small pore size (Figure 9a) but three times the grain size in the medium with a large pore size (Figure 9b) along the same flow distance. The difference in width is due to the difference in the average pore sizes at different permeabilities. Meanwhile, the pore structure of the lower-permeability core is more heterogeneous and small-scale breakthrough will occur, which results in an earlier breakthrough, slower rise in concentration, and larger dispersion coefficient.
The relationship between the dispersion coefficient and injection velocity can also be explained using Figure 9. When the permeability is fixed, the higher the superficial velocity, the greater the pressure gradient, and the smaller the fluid-activated pores—i.e., the fluid flows preferentially into the low-permeability pores. Along a given flow distance, the width of the tracer liquid becomes five times the grain size at high velocity (i.e., small pore size medium, Figure 9a) but three times the grain size at low velocity (i.e., large pore size medium, Figure 9b) due to the difference in the average size of flow pores at different velocities. Therefore, when a small volume of displacement fluid is injected, a tracer will be produced at the outlet, corresponding to the so-called “channeling effect” in the pore network. Meanwhile, as the injection rate increases, it may strengthen some of the microscopic heterogeneous features that actually exist inside the core, resulting in a small amount of intrusion and hence an earlier breakthrough, a slower concentration increase, and a larger dispersion coefficient. Therefore, in the core displacement experiments, the small sizes of flow pores at high velocities result in more complex flow paths within porous media and thereby experience stronger dispersion.
The work in this paper demonstrates that there are different dispersion coefficients resulting from different porous media size and tracer interstitial velocity. It can improve inter-well tracer test not only in injection parameters design, but also in tracer concentration interpretation. Firstly, the injection velocity in a project should be optimized, because the economic benefit can be reduced if the velocity is too low; on the other hand, the mixing effect can be amplified if the velocity is too high. Secondly, it is more suitable to use the dispersion coefficient of the high permeability layer, rather than that corresponding to the average reservoir permeability.
4. Conclusions
In this paper, the effects of velocity and permeability on the dispersion coefficient in cores were investigated. Two sets of core flooding experiments were conducted on natural and sand-filled cores, respectively. The relations between the dispersion coefficient, velocity, and permeability were obtained through fitting the experimental results with an analytical model. The main conclusions drawn from the results presented herein are as follows:
(1) The core experimental results show that the dispersion coefficient is negatively correlated with the permeability and positively correlated with the superficial velocity. Low permeability and high heterogeneity result in large latitudinal dispersion and high dispersion coefficient. If the superficial velocity is high, the pressure drop along the core is large. This causes the fluid to enter the small pores, resulting in large dispersion coefficient. The combination of high velocity and low permeability yields a large dispersion coefficient. The effects of latitudinal dispersion in porous media cannot be ignored in low-permeability cores or formations.
(2) The interpretation results show that the dispersion coefficient increased from 0.063 to 0.037 cm2/s with the decrease in core permeability from 230 to 1570 mD at the flow rate of 0.02 cm3/s. The dispersion coefficient increased from 0.004 to 0.023 cm2/s with the increase in flow rate from 0.02 to 0.08 cm3/s. The corresponding regression equations indicate linear relations between the dispersion coefficient, core permeability, and fluid velocity, resulting from the micron scale of the grain diameters in the cores.
Author Contributions
Conceptualization, Y.Y., T.L.; Methodology, T.L.; Experiments, Y.L. (Yanyue Li), Y.L. (Yuqi Li); Mathematical modelling and solution, Z.Y., M.Z., P.D.; Analysis, Z.Y., P.D.; Writing—original draft preparation, Y.L. (Yanyue Li), Y.L. (Yuqi Li), R.W.; Writing—review and editing, Y.Y., Z.Y., X.Z., J.L. All authors have read and agreed to the published version of the manuscript.
Funding
This work was supported by National Key Research and Development Plan (No.2018YFB0605500) and the Science Foundation of China University of Petroleum (2462019YJRC013, 2462020YXZZ003 and 2462020XKJS02).
Institutional Review Board Statement
Not applicable.
Informed Consent Statement
Not applicable.
Data Availability Statement
Not applicable.
Conflicts of Interest
The authors declare no conflict of interest.
Nomenclature
| C | tracer concentration in aqueous solution (mg/L) |
| C0 | tracer concentration in injected solution (mg/L) |
| D | dispersion coefficient (cm2/s) |
| DL | longitudinal dispersion coefficient (cm2/s) |
| DN | dispersion coefficients of the natural cores (cm2/s) |
| DA | dispersion coefficients of the sand-filled cores (cm2/s) |
| u | tracer interstitial velocity (cm/s) |
| α | adjustable parameter in dispersion relationship |
| β | exponential parameter in dispersion relationship |
| x | flow distance (cm) |
| t | time (s) |
| t’ | modified time |
| K | core permeability (mD) |
| Φf | flow porosity |
| Φ | porosity |
| ρr | rock density (g/cm3) |
| So | oil saturation |
| Swc | bound water saturation |
| a | Langmuir isothermal adsorption coefficient |
| s | Laplace variable |
Appendix A. Mathematical Model and Analytical Solution of Tracer Flow in Porous Media
The governing equation of tracer flow at the pore level may be expressed as [3]:
where D is the dispersion coefficient (cm2/s), C is tracer concentration in aqueous solution (mg/L), u is interstitial velocity (cm/s), x is flow distance (cm), Φf is flow porosity, Φ is porosity, So is oil saturation, Swc is bound water saturation, a is the Langmuir isothermal adsorption coefficient, and ρr is the rock density (g/cm3).
To obtain the analytical solution for the tracer flow equation at the pore scale, the modified time, t’, is introduced as follows:
Consequently, the mathematical model for tracer flow at the pore level may be simplified as:
where C0 is the tracer concentration in injected solution (mg/L).
Using the method of Laplace transform allows the mathematical model for tracer flow at the pore scale to be expressed as follows:
where s is the Laplace variable.
Equation (A8) is an ordinary differential equation (ODE) with a general solution as follows:
where and .
Considering the initial and boundary conditions (Equations (A9) and (A10)) allows the analytical solution to be obtained in Laplace space.
where and .
Through an inverse Laplace transform, the analytical solution in the time domain may be expressed as follows:
References
- Serres-Piole, C.; Preud’homme, H.; Moradi-Tehrani, N.; Allanic, C.; Jullia, H.; Lobinski, R. Water tracers in oilfield applications: Guidelines. J. Pet. Sci. Eng. 2012, 98–99, 22–39. [Google Scholar] [CrossRef]
- Cao, V.; Schaffer, M.; Taherdangkoo, R.; Licha, T. Solute Reactive Tracers for Hydrogeological Applications: A Short Review and Future Prospects. Water 2020, 12, 653. [Google Scholar] [CrossRef]
- Liu, T.J.; Liu, W.X.; Diwu, P.X.; Hu, G.X.; Xu, T.; Li, Y.Q.; You, Z.J.; Qiao, R.W.; Wang, J. Modeling Tracer Flow Characteristics in Different Types of Pores: Visualization and Mathematical Modelling. Comp. Model. Eng. Sci. 2020, 123, 1205–1222. [Google Scholar] [CrossRef]
- Kamali, F.; Hussain, F. Field-scale simulation of CO2 enhanced oil recovery and storage through SWAG injection using laboratory estimated relative permeabilities. J. Pet. Sci. Eng. 2017, 156, 396–407. [Google Scholar] [CrossRef]
- Hussain, F.; Cinar, Y.; Bedrikovetsky, P. Comparison of Methods for Drainage Relative Permeability Estimation from Displacement Tests; SPE Improved Oil Recovery Symposium: Tulsa, OK, USA, 2010. [Google Scholar]
- Zou, S.; Hussain, F.; Arns, J.; Guo, Z.; Arns, C.H. Computation of relative permeability from in-situ imaged fluid distributions at the pore scale. SPE J. 2018, 23, 737–749. [Google Scholar] [CrossRef]
- Liu, T.J.; Jiang, B.Y.; Liu, R.; Zhang, X.H.; Xie, X.Q. Reservoir characteristics of chromatographic effect of tracer flow in porous medium. J. Chongqing Univ. 2013, 36, 58–63. [Google Scholar]
- Tatomir, A.; McDermott, C.; Bensabat, J.; Class, H.; Edlmann, K.; Taherdangkoo, R.; Sauter, M. Conceptual model development using a generic Features, Events, and Processes (FEP) database for assessing the potential impact of hydraulic fracturing on groundwater aquifers. Adv. Geosci. 2018, 45, 185–192. [Google Scholar] [CrossRef]
- Xu, J.P.; Wang, L.Z.; Zhu, K.Q. Concentration distribution and variation in a polymer-flooding reservoir. J. Tsinghua Univ. 2002, 04, 455–457. [Google Scholar]
- Fan, Y.; Liu, C.Q. Two-dimensional Transport of solute in porous media and its numerical solution. Acta Petrolei Sinica. 1988, 1, 75–85. [Google Scholar]
- Liu, T.J.; Diwu, P.X.; Liu, R.; Jiang, L.W.; Jiang, B.Y. Fast Algorithm of Numerical Solutions for Strong Nonlinear Partial Differential Equations. Adv. Mech. Eng. 2014, 6, 1–5. [Google Scholar] [CrossRef]
- Zhang, P.Y. Penetration Migration of Suspended Particles in Porous Media: Pore Structure and Particle Scale Effects. Ph.D. Thesis, Beijing Jiaotong University, Beijing, China, 2016. [Google Scholar]
- Yang, J.Z. Experimental study indoor of diffusion coefficient of dispersion coefficient. Geotech. Investig. Survey 1985, 1, 55–59. [Google Scholar]
- Ma, X.Y.; Kang, X.B.; Wang, Z.M.; Wang, X.; Shi, X.D. Cl- Transport in Saturated Soils under Different Pore Conditions. Res. Explor. Lab. 2018, 37, 30–33+67. [Google Scholar]
- Huang, K.L. Research on the Scale Effect of Hydrodynamic Dispersion in Porous Media-Current Status and Prospect. Hydrogeol. Eng. Geo. 1991, 03, 25–26+31. [Google Scholar]
- Zou, L.Z.; Pan, J.; Yang, C.B.; Zhang, H.Y. Present situation on the study of scale effect of hydraulic parameter in aquifer. J. Changchun Univ. Earth Sci. 1994, 1, 66–69. [Google Scholar]
- Wang, F. A Study on the Hydrodynamic Diffusion and Scale Effect of Loose Rock Mass Pore Media. Master’s Thesis, Southwest Jiaotong University, Chengdu, China, 2015. [Google Scholar]
- Xu, Y.L. Experimental Study of Contaminant Transport and the Velocity Dependence of Dispersion in Porous Media. Master’s Thesis, Hefei University Technology, Hefei, China, 2017. [Google Scholar]
- Rao, D.Y.; Bai, B. Study on the factors affecting dispersity of porous media by SPH simulation in solute transport. J. Hydraul. Eng. 2019, 50, 824–834. [Google Scholar]
- Witt, K.J.; Brauns, J. Permeability allisotropy due to particle shape. J. Waterw. 1983, 109, 1181–1187. [Google Scholar]
- Shinohara, K.; Oida, M.; Golman, B. Effect of particle shape on angle of internal friction by triaxle compression test. Powder Technol. 2000, 107, 131–136. [Google Scholar] [CrossRef]
- Delgado, J.M.P.Q. A critical review of dispersion in packed beds. Heat Mass Transf. 2006, 42, 279–310. [Google Scholar] [CrossRef]
- Rouse, P.C.; Fannin, R.J.; Shuttle, D.A. Influence of roundness on the void ratio and strength of uniform sand. Geotechnique 2008, 58, 227–231. [Google Scholar] [CrossRef]
- Van der Meer, A.P.; Blanchard, C.M.R.J.P.; Wesselingh, J.A. Mixing of particles in liquid fluidized beds. Chem. Eng. Res. Des. 1984, 62, 214–222. [Google Scholar]
- Galvin, K.P.; Swann, R.; Ramirez, W.F. Segregation and Dispersion of a Binary System of Particles in a Fluidized Bed. AICHE J. 2006, 52, 3401–3410. [Google Scholar] [CrossRef]
- Zhao, G.J. Markov Process Describes Dispersion Phenomena in Porous Medium. Master’s Thesis, Northeast Petrology University, Daqing, China, 2007. [Google Scholar]
- Hua, F. Experimental Study of Dispersion Coefficient and Scale Effect in Single Horizontal Fracture. Master’s Thesis, Hefei University Technology, Hefei, China, 2010. [Google Scholar]
- Qi, T.; Li, M. Study of the relationship between dispersion coefficients and permeability by percolation network model. Chin. J. Hydrodyn. 2017, 32, 477–483. [Google Scholar]
- Khan, M.S.; Mitra, S.; Ghatage, S.V.; Doroodchi, E.; Joshi, J.B.; Evans, G.M. Segregation and dispersion studies in binary solid-liquid fluidised beds: A theoretical and computational study. Powder Technol. 2017, 314, 400–411. [Google Scholar] [CrossRef]
- Khan, M.S.; Evans, G.M.; Nguyen, A.V.; Mitra, S. Analysis of particle dispersion coefficient in solid-liquid fluidised beds. Powder Technol. 2020, 365, 60–73. [Google Scholar] [CrossRef]
- Taylor, G.I. Dispersion of soluble matter in solvent flowing slowly through a tube. Proc. R. Soc. 1953, 219, 186–203. [Google Scholar]
- Home, R.N.; Rodriguez, F. Dispersion in tracer flow in fractured geothermal systems. Geophys. Res. Lett. 1983, 10, 289–292. [Google Scholar]
- Simpson, E.S. Velocity and the Longitudinal Dispersion Coefficient in Flow through Porous Media; Dewiest: San Diego, CA, USA, 1969; pp. 109–200. [Google Scholar]
- Ebach, E.A.; White, R.R. Mixing of fluids flowing through beds of packed solids. Am. Inst. Chem. Eng. 1958, 4, 161–169. [Google Scholar] [CrossRef]
- Sahimi, M.; Hughes, B.D.; Scfiven, L.E.; Davis, H.T. Dispersion in flow through porous media-One phase flow. Chem. Eng. Sci. 1986, 41, 2103–2122. [Google Scholar] [CrossRef]
- Pugliese, L.; Poulsen, T.G. Estimating solute dispersion coefficients in porous media at low pore water velocities. Soil Sci. 2014, 179, 175–181. [Google Scholar] [CrossRef]
- Kumar, A.; Kumar, D.J.; Kumar, N. Analytical solutions to one-dimensional advection–diffusion equation with variable coefficients in semi-infinite media. J. Hydrol. 2009, 118, 539–549. [Google Scholar] [CrossRef]
- Kumar, D.J.; Kumar, A.; Kumar, A.; Yadav, R.R. Analytical solutions for temporally and spatially dependent solute dispersion of pulse type input concentration in one-dimensional semi-infinite media. J. Hydro-Environ. Res. 2009, 2, 254–263. [Google Scholar]
Publisher’s Note: MDPI stays neutral with regard to jurisdictional claims in published maps and institutional affiliations. |
© 2021 by the authors. Licensee MDPI, Basel, Switzerland. This article is an open access article distributed under the terms and conditions of the Creative Commons Attribution (CC BY) license (https://creativecommons.org/licenses/by/4.0/).