Article

Mapping and Analyzing the Evolution of the Butangbunasi Landslide Using Landsat Time Series with Respect to Heavy Rainfall Events during Typhoons

1
Department of Geoinformatics—Z_GIS, University of Salzburg, Schillerstrasse 30, 5020 Salzburg, Austria
2
Department of Geography and Geology, University of Salzburg, Hellbrunner Strasse 34, 5020 Salzburg, Austria
3
Centre for Interdisciplinary Mountain Research, University of Lausanne, Chemin de’l Institut, 1967 Bramois, Switzerland
4
Disaster Prevention Education Center, National Cheng Kung University, No.1, University Road, Tainan City 701, Taiwan
*
Author to whom correspondence should be addressed.
Appl. Sci. 2020, 10(2), 630; https://doi.org/10.3390/app10020630
Submission received: 10 December 2019 / Revised: 10 January 2020 / Accepted: 13 January 2020 / Published: 15 January 2020
(This article belongs to the Special Issue Mapping and Monitoring of Geohazards)

Abstract

:
Large rainfall-induced landslides are among the most dangerous natural hazards in Taiwan, posing a risk for people and infrastructure. Thus, better knowledge about the evolution of landslides and their impact on the downstream area is of high importance for disaster mitigation. The aim of this study is twofold: (1) to semi-automatically map the evolution of the Butangbunasi landslide in south-central Taiwan using satellite remote sensing data, and (2) to investigate the potential correlation between changes in landslide area and heavy rainfall during typhoon events. Landslide area, as well as temporary landslide-dammed lakes, were semi-automatically identified using object-based image analysis (OBIA), based on 20 Landsat images from 1984 to 2018. Hourly rainfall data from the Taiwan Central Weather Bureau (CWB) was complemented with rainfall data from Climate Hazards Group Infrared Precipitation with Station data (CHIRPS) to examine the potential relationship between landslide area changes and rainfall as a triggering factor. The OBIA mapping results revealed that the most significant landslide extension happened after typhoon Morakot in 2009. We found a moderate positive relationship between the landslide area change and the duration of the heavy rainfall event, whereas daily precipitation, cumulative rainfall and mean intensity did not present strong significant correlations.

Graphical Abstract

1. Introduction

The mountains of Taiwan, with the highest peaks rising to almost 4000 m a.s.l., are characterized by fractured rock formations, high relief and steep stream gradients. These mountains, particularly the central mountain range (CMR), influence the tracks and intensity of typhoon events [1]. During summer and autumn, Taiwan is regularly affected by typhoons (tropical cyclones), three to four per year on average, which bring heavy rainfall [2]. Some studies indicate that the number of typhoons hitting Taiwan increased after the year 2000, also resulting in heavier precipitation in recent years [3,4]. Heavy rainfall is the main landslide triggering factor in Taiwan [5]. The rainfall events are usually associated with typhoons, which account for almost 50% of the island’s total rainfall [6,7]. Studies have found relationships between long-duration and moderate intensity rainfall events and large and deep-seated landslides [8], sediment yield and debris flows [5,9].
Large, rapid landslides and debris flows frequently lead to fatalities. Major endeavors are necessary to protect people and settlements in areas at risk, and to implement prevention and early warning measures [10,11,12,13]. In general, as well as in Taiwan, such catastrophic landslides also cause severe damages to infrastructure, and efforts both in time and money are needed to recover and maintain the transportation infrastructure such as roads and bridges [14,15,16,17]. Beyond the direct landslide hazard, large landslides can initiate natural hazard cascades by damming rivers and inducing catastrophic flash floods and debris flows [18,19,20]. The large amount of mobilized debris that originates from landslides significantly affects the drainage system, for example, resulting in an increase in erosion and sediment discharge in rivers, and changes in channel size and shape [5,21,22]. According to Chen et al. [9] about 384 Mt y−1 of sediment is transported into the ocean in Taiwan, whereby the high proportion of large landslides significantly contributes to this high annual sediment yield.
In August 2009, typhoon Morakot caused a record-breaking cumulative rainfall (more than 2000 mm in three days), which led to debris flows and mudflows, flooding in coastal areas, and massive landslides [23,24]. The rainfall also triggered one of the most famous and fatal landslides in Taiwan, the Xiaolin landslide [25,26,27,28]. The Butangbunasi landslide [29,30,31] is another example of a large rainfall-triggered landslide in Taiwan. Reactivation and extension of this landslide have been resulting in repeated sediment delivery to the Laonong River, especially during torrential rainfall. The river course has been frequently affected, leading to the formation of a landslide-dammed lake several times during the past three decades [29,32,33,34,35,36]. The magnitude of the Butangbunasi landslide is even significantly larger than of the disastrous Xiaolin landslide [29]. A deeper knowledge of the evolution of landslides and their triggering factors is crucial for hazard mitigation [37,38]. Therefore, mapping and analyzing the evolution of such large landslides over time helps to better understand their reactivation rates and their impact on downstream areas.
Remote sensing plays a key role in studying landslides and provides an adequate and cost-effective source to derive information about landslide distribution and types [39,40,41,42]. The use of remote sensing data also helps to investigate the potential impacts of landslides such as the damming of rivers, particularly in difficult to access and remote mountain regions [43]. The value of remote sensing for landslide studies becomes more and more evident with the increasing amount of freely available Earth observation (EO) data, which provides remarkable opportunities to map and monitor landslides over time [44,45,46].
Object-based image analysis (OBIA) provides a suitable methodological framework for efficient landslide mapping, as well as landslide change analysis [47,48]. By working on the object-level instead of the pixel-level, OBIA allows considering spectral, spatial, textural, morphometric and hierarchical properties for the classification of landslides [49,50,51]. Moreover, it is argued that using OBIA yields better classification accuracies than pixel-based classifications [51,52,53,54,55]. Several studies employed OBIA for landslide mapping and landslide change detection in Taiwan [32,49,53,56,57,58,59], but none of them used time series of images for investigating the evolution and reactivation of an active large landslide.
The aim of this study is to analyze the evolution of the Butangbunasi landslide in south-central Taiwan using OBIA and time series of freely available Landsat images and to investigate the potential correlation between changes in landslide area and heavy rainfall events during selected typhoon (including tropical storm) events.

2. Materials and Methods
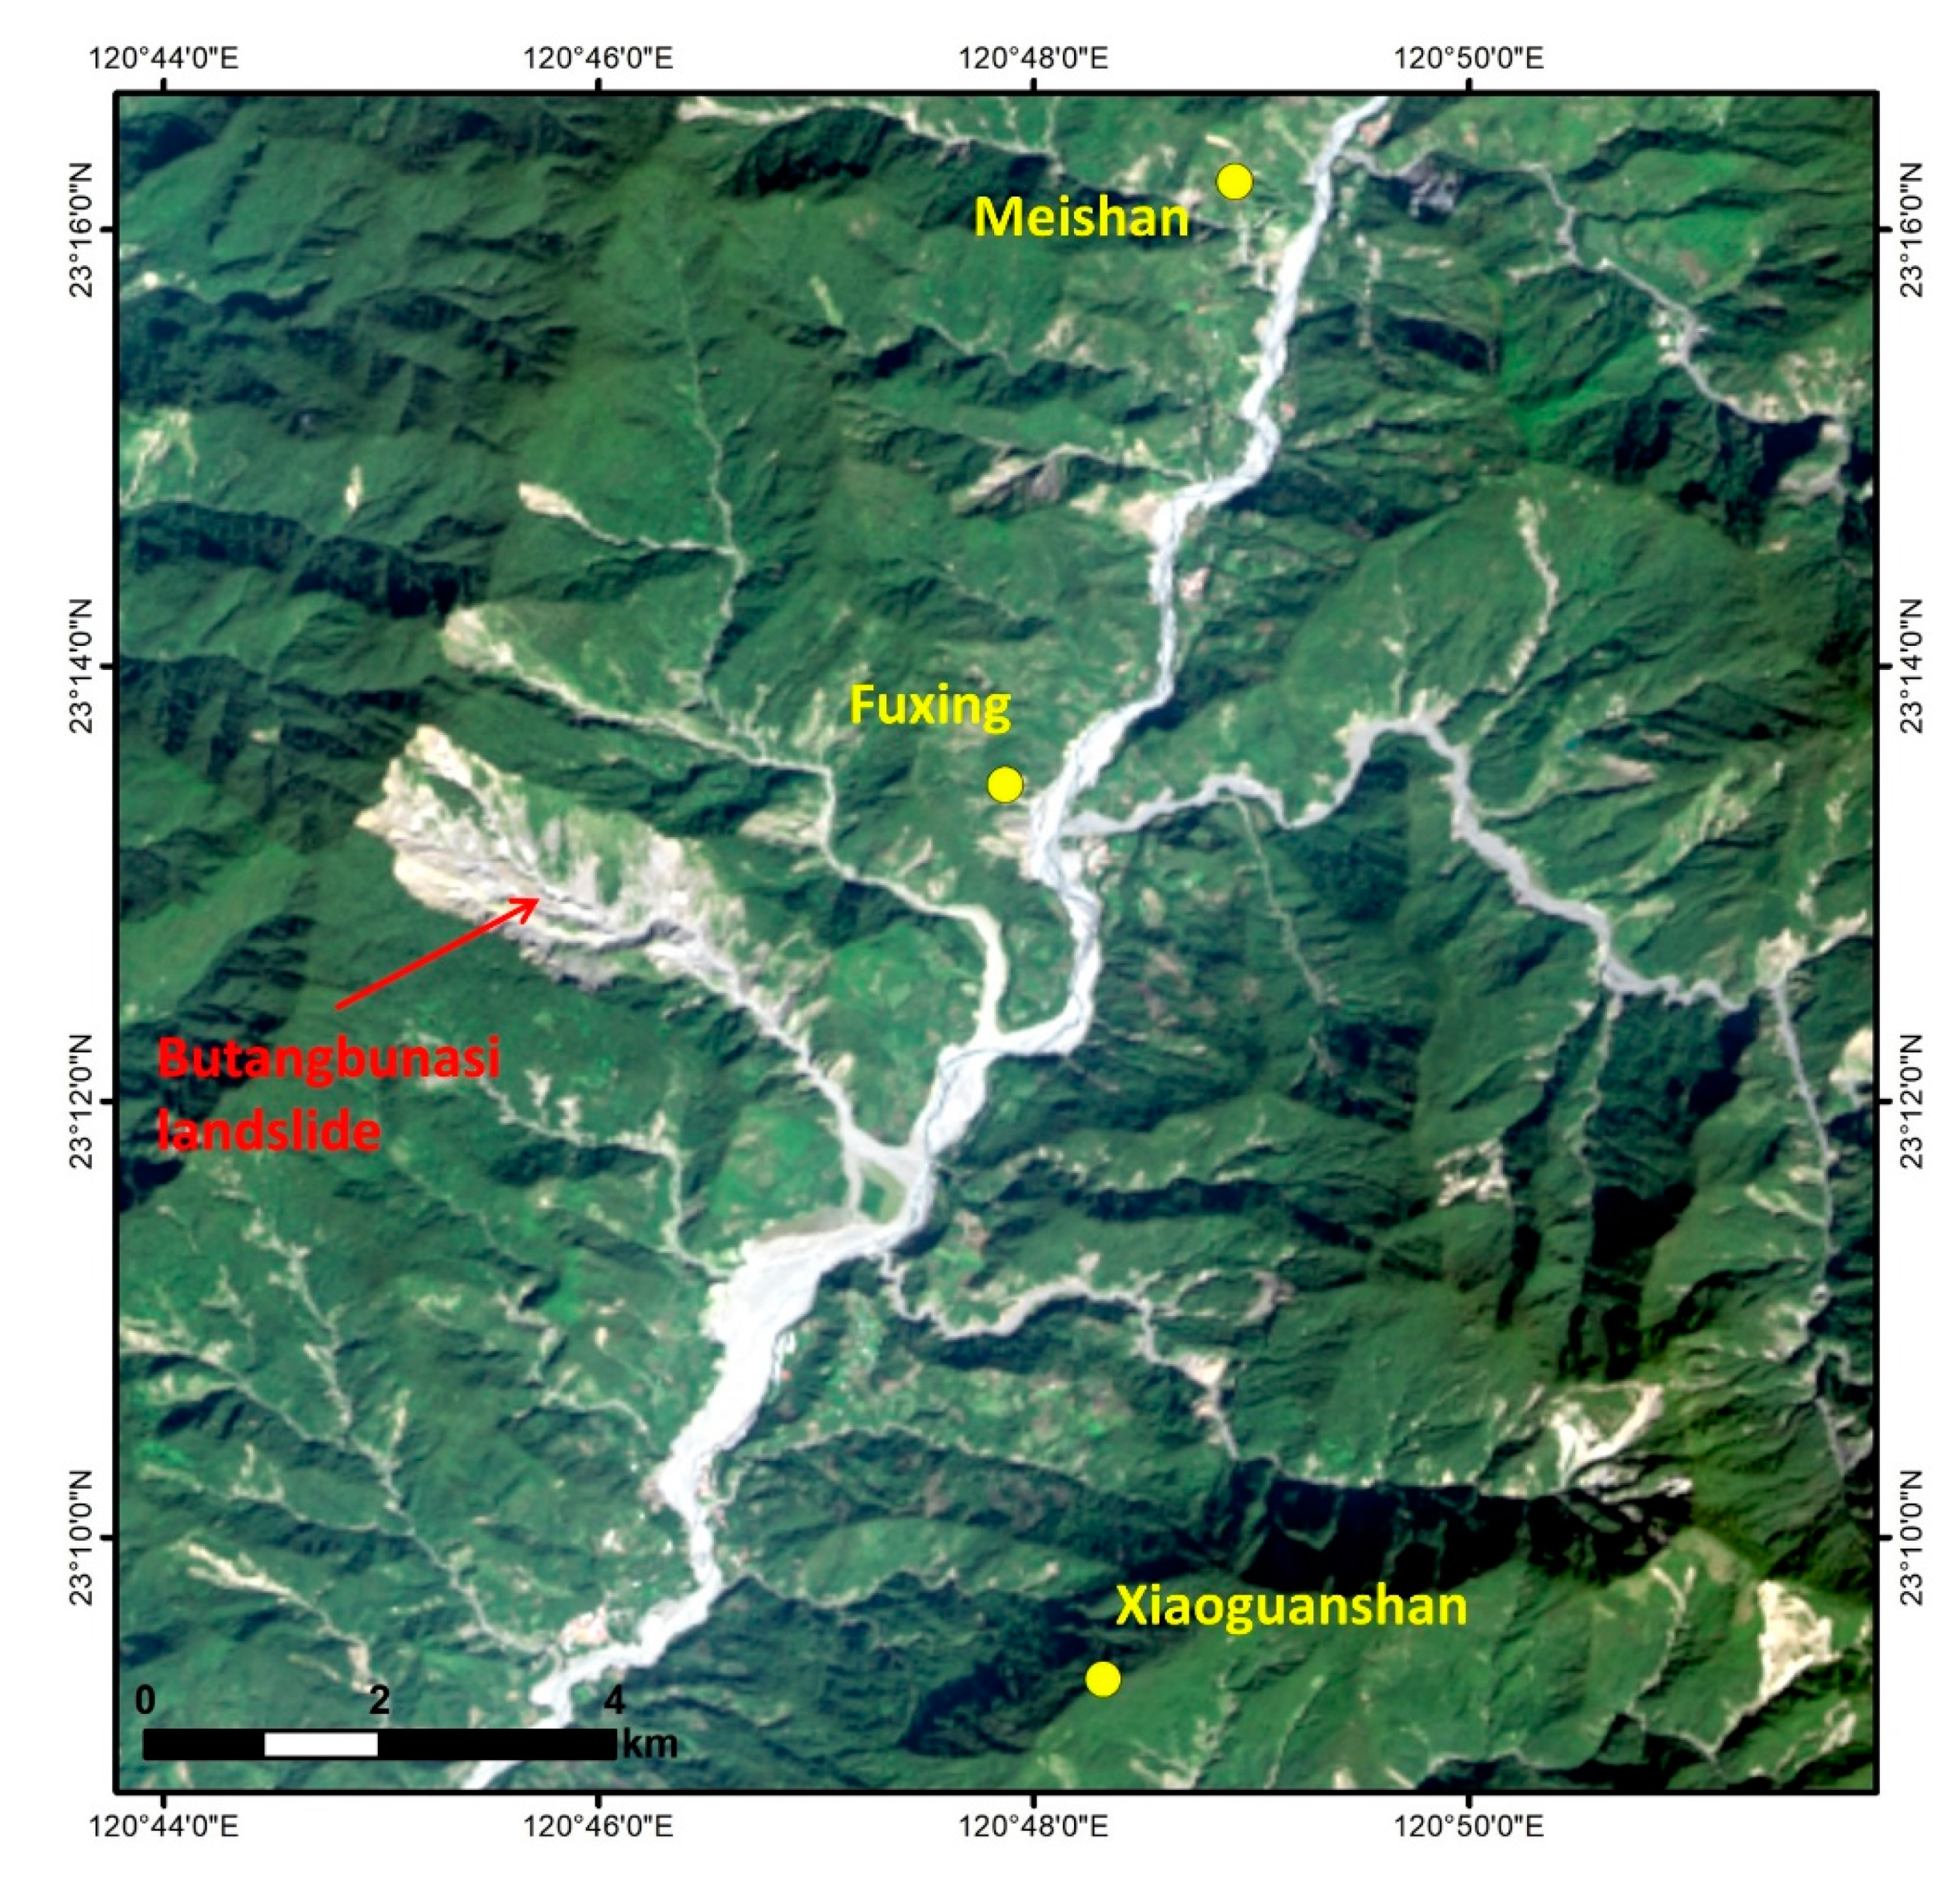
2.1. Study Area

For this study, we selected the Butangbunasi landslide, which is located in the Taoyuan District of Kaohsiung City, south-central Taiwan (R.O.C.; Figure 1). The study area comprised of two geological strata, the Changchihkeng formation, which is composed of sandstone and shale, and the Tangenshan formation, which consists of massive sandstones and is characterized by joints that can form precipitous scarps and deep ravines [29]. The area experiences between 2000 and 4000 mm of annual rainfall within a subtropical monsoon climate [34]. Reactivation and extension of this large landslide area have been taking place since the 1980s and have been resulting in repeated pulses of sediment delivered to the Laonong River, especially during torrential rainfall brought by typhoons.
The accumulation of debris and sediments affects the river course and can lead to the damming of the river as it happened several times in the past. The main landslide area is difficult to access and hardly visible from the Laonong River valley, where major construction efforts are needed to maintain and rebuild the transportation infrastructure such as roads and bridges. Figure 2 gives an impression of the Butangbunasi landslide.

2.2. Data

2.2.1. Optical Satellite Data

We used time series of optical satellite data, i.e., Landsat 5, Landsat 7 and Landsat 8 imagery (20 images overall) with 30 m spatial resolution, from 1984 to 2018 to semi-automatically map the evolution of the Butangbunasi landslide (Table 1). In particular, we selected the first cloud-free image of the area of interest available after a typhoon (including tropical storm) event that shows a noticeable change in the landslide area compared to pre-event images. This was done based on a visual inspection of the Landsat database and considering the historical hurricane/typhoon tracks of the National Oceanic and Atmospheric Administration (NOAA) Office for Coastal Management [60]. In addition, all major hurricanes crossing Taiwan within a radius of 100 km around the Butangbunasi landslide, which reached category H3 or above according to the Saffir–Simpson hurricane wind scale (SSHWS), were identified and the respective post-event Landsat imagery added to the database. The Landsat 5 scene from 1984 is the first available image for the study area and served as a starting point for the analysis. The Landsat 8 scene from 2018 does not follow a specific typhoon event but was used as the final image for the analysis to see if any changes in landslide area are also identified following a period without a heavy rainfall event. Moreover, this image temporally coincides with the field visit in November 2018 (cf. Figure 2c).
All Landsat scenes were downloaded as Level-1 products from the EarthExplorer user interface of the United States Geological Survey (USGS). In order to increase the comparability across the Landsat imagery captured by different Landsat sensors and/or at different times, a top-of-atmosphere (TOA) calibration was performed on all satellite images [61]. To do so, the apparent reflectance function implemented in the ArcGIS Desktop version 10.7 was applied. The algorithm uses sun elevation, satellite position, acquisition date and sensor properties such as gain and bias settings for each spectral band [62]. In this way, the spectral differences between images from different dates and sensors were decreased. In addition to the Landsat images, the derived slope layer from the Advanced Land Observing Satellite (ALOS) Palsar digital elevation model (DEM; 12.5 m spatial resolution), acquired in 2008, was used as ancillary data to support the landslide mapping.

2.2.2. Typhoon and Rainfall Data

The International Best Track Archive for Climate Stewardship (IBTrACS) data repository [63] compiles the hurricane/typhoon best-track position and intensity from different data sources and makes them available in one consolidated archive. We obtained the fourth version of this data in shapefile format to extract the spatial information corresponding to 19 typhoon events that had an impact on the landslide area or had a SSHWS category three (H3) or higher within a 100 km radius from the Butangbunasi landslide (Table 2).
As for the rainfall data, Taiwan’s Central Weather Bureau (CWB) provides the open Typhoon Database [64], which compiles various sources of information relevant to the study and the monitoring of typhoon events in the western North Pacific. Among their data sources, CWB has made station weather data available, which includes hourly precipitation for each typhoon event for all the automatic rain gauge stations in Taiwan. For this study, we identified the three closest stations to the Butangbunasi landslide, all located within the Laonong River basin, which are summarized in Table 3. The locations of the three selected CWB stations are shown in Figure 3. Since station C1V210 was upgraded to a new weather station coded C0V210, which continues the data registration, we will refer to it as a single station called Fuxing.
Since the entire study period was not covered by the CWB rain gauge station data available on the Typhoon Database, we also collected data from the CHIRPS (Climate Hazards Group Infrared Precipitation with Station data) dataset. CHIRPS combines information from the Tropical Rainfall Measuring Mission (TRMM) 3B42 product, the NOAA Climate Forecast System (CFS) and other precipitation data sources to provide daily precipitation in grid format at a resolution of 0.05°, for latitudes between 50° S and 50° N [65,66]. We accessed the data through the Google Earth Engine, where we obtained the mean rainfall in the area of interest for the 19 typhoon events selected for analysis. For each event, we obtained the daily precipitation on the day the typhoon passed closest to the Butangbunasi landslide area.

2.3. Semi-Automated Landslide Mapping

For semi-automatically mapping the Butangbunasi landslide area on each Landsat image, OBIA was used. The analyses were conducted using the eCognition (Trimble) software. We defined a set of knowledge-based classification rules for mapping the landslide area per image. Since images from 20 different points in time were used, efforts were made to design a transferable classification routine that could be applied to all images without or with only minor adaptations of the classification thresholds (Table 4). The classification rules were developed based on the Landsat 5 image from 1984 and then transferred to the other images.
As a first step, the normalized difference vegetation index (NDVI) and the modified soil-adjusted vegetation index (MSAVI), as well as a brightness layer were calculated. Next, we applied the multiresolution segmentation [67] for creating image objects as a basis for the classification. The multiresolution segmentation in eCognition is a bottom-up region merging technique. It starts with single pixel objects and merges them stepwise to larger objects based on local homogeneity criteria that describe the similarity of adjacent image objects [67]. The scale parameter and homogeneity criteria (shape vs. color weighting, compactness vs. smoothness weighting) determine the maximum allowed heterogeneity and control the average size and shape of the resulting image objects. The segmentation parameters (Table 4) were selected based on an expert-guided trial and error approach and a visual assessment of resulting image objects.
The knowledge-based classification primarily relied on the usage of the calculated spectral indices. The main indication for mapping the landslide area was the absence of vegetation, which leads to a distinctive spectral contrast between the landslide-affected area and its surroundings, especially in densely vegetated regions [49,58,68]. This change in land cover related to landslide occurrence can be well represented with spectral indices such as the NDVI [51]. The same classification parameters were applied to all Landsat 5 images, except the March 2008 image, where the thresholds for the NDVI and MSAVI were slightly adapted. The reason for this was that this image is the only one acquired in spring, i.e., before the rainy season, and the seasonal variation leads to a slightly different spectral reflection. Minor adaptations were also needed for the Landsat 7 and Landsat 8 images, while the same classification rules and thresholds were used per sensor.
Since the DEM used in this study only represents one point in time, the topographic signature of the landslide at different dates cannot be accurately represented by the DEM data [49]. Thus, the DEM and the slope were mainly used as ancillary data to avoid the classification of obvious false positives, for example, debris accumulation areas with low slopes at low elevations in the Laonong river bed.
Finally, a few true but unwanted positives such as landslides on slopes not belonging to the Butangbunasi landslide area were manually removed, and small landslide objects in shadow areas that were obviously missed were manually added.
Some of the images revealed a temporary landslide-dammed lake where the debris from Butangbunasi reaches and blocks the Laonong River. The lake area was additionally mapped with OBIA by using relatively low NDVI and near-infrared values.
Finally, changes in landslide and lake area were calculated as the area change in the respective class between two successive images within the time series.

2.4. Accuracy Assessment of OBIA Results

To assess the classification accuracy, we compared the OBIA results to results from visual image interpretation. Reference data were exemplarily created based on three selected images, whereby one image from each Landsat sensor was used (Landsat 8 from 4 December 2016; Landsat 7 from 24 August 2008; Landsat 5 from 27 September 2000). Another criterion for the selection of these images was the presence of a lake close to the landslide area so that the accuracy of both classes could be assessed. Manual digitizing from the satellite imagery was carried out in ArcGIS 10.7 at a scale of 1:25,000. We assessed the classification accuracy based on the overlapping area between the manual and the OBIA mappings. Producer’s accuracies were computed by dividing the correctly classified area (overlap area) by the total area of the reference data (i.e., the manual mapping results), and user’s accuracies were obtained by dividing the correctly classified area by the total area mapped by OBIA [37,45,69]. The producer’s accuracy is the map accuracy from the point of view of the creator of the map (here: the producer of the OBIA classification). It is a measure of omission error (error of exclusion) [69]. The user’s accuracy is the accuracy from the point of view of a map user, not the map creator. It is a measure of commission error (error of inclusion) [69].

2.5. Analysis of Rainfall Data during Typhoon Events

Rainfall data registered during the selected typhoon and tropical storm events were analyzed to find potential relationships between the reactivation and evolution of the landslide area and heavy rainfall. From the CHIRPS data, we extracted daily precipitation for the date when the typhoon was closest to the landslide. For the CWB rain gauge station data, hourly precipitation data allowed us to identify rainfall events during the selected typhoons. We followed the definition of a rainfall event as explained in Chang et al. [5] and Chen et al. [8], where an event starts when there is more than 4 mm of rain registered in the gauge during an hour, and ends when the rain registered is lower than 4 mm for six consecutive hours. We calculated the duration, cumulative rainfall and intensity for each rainfall event. Rainfall duration is defined as the hours the event lasted; cumulative rainfall is the amount of precipitation registered during the entire rainfall event; rainfall intensity is the average amount of precipitation registered per hour during a rainfall event. The rainfall event with the highest duration and intensity within each typhoon event was selected for further analysis.

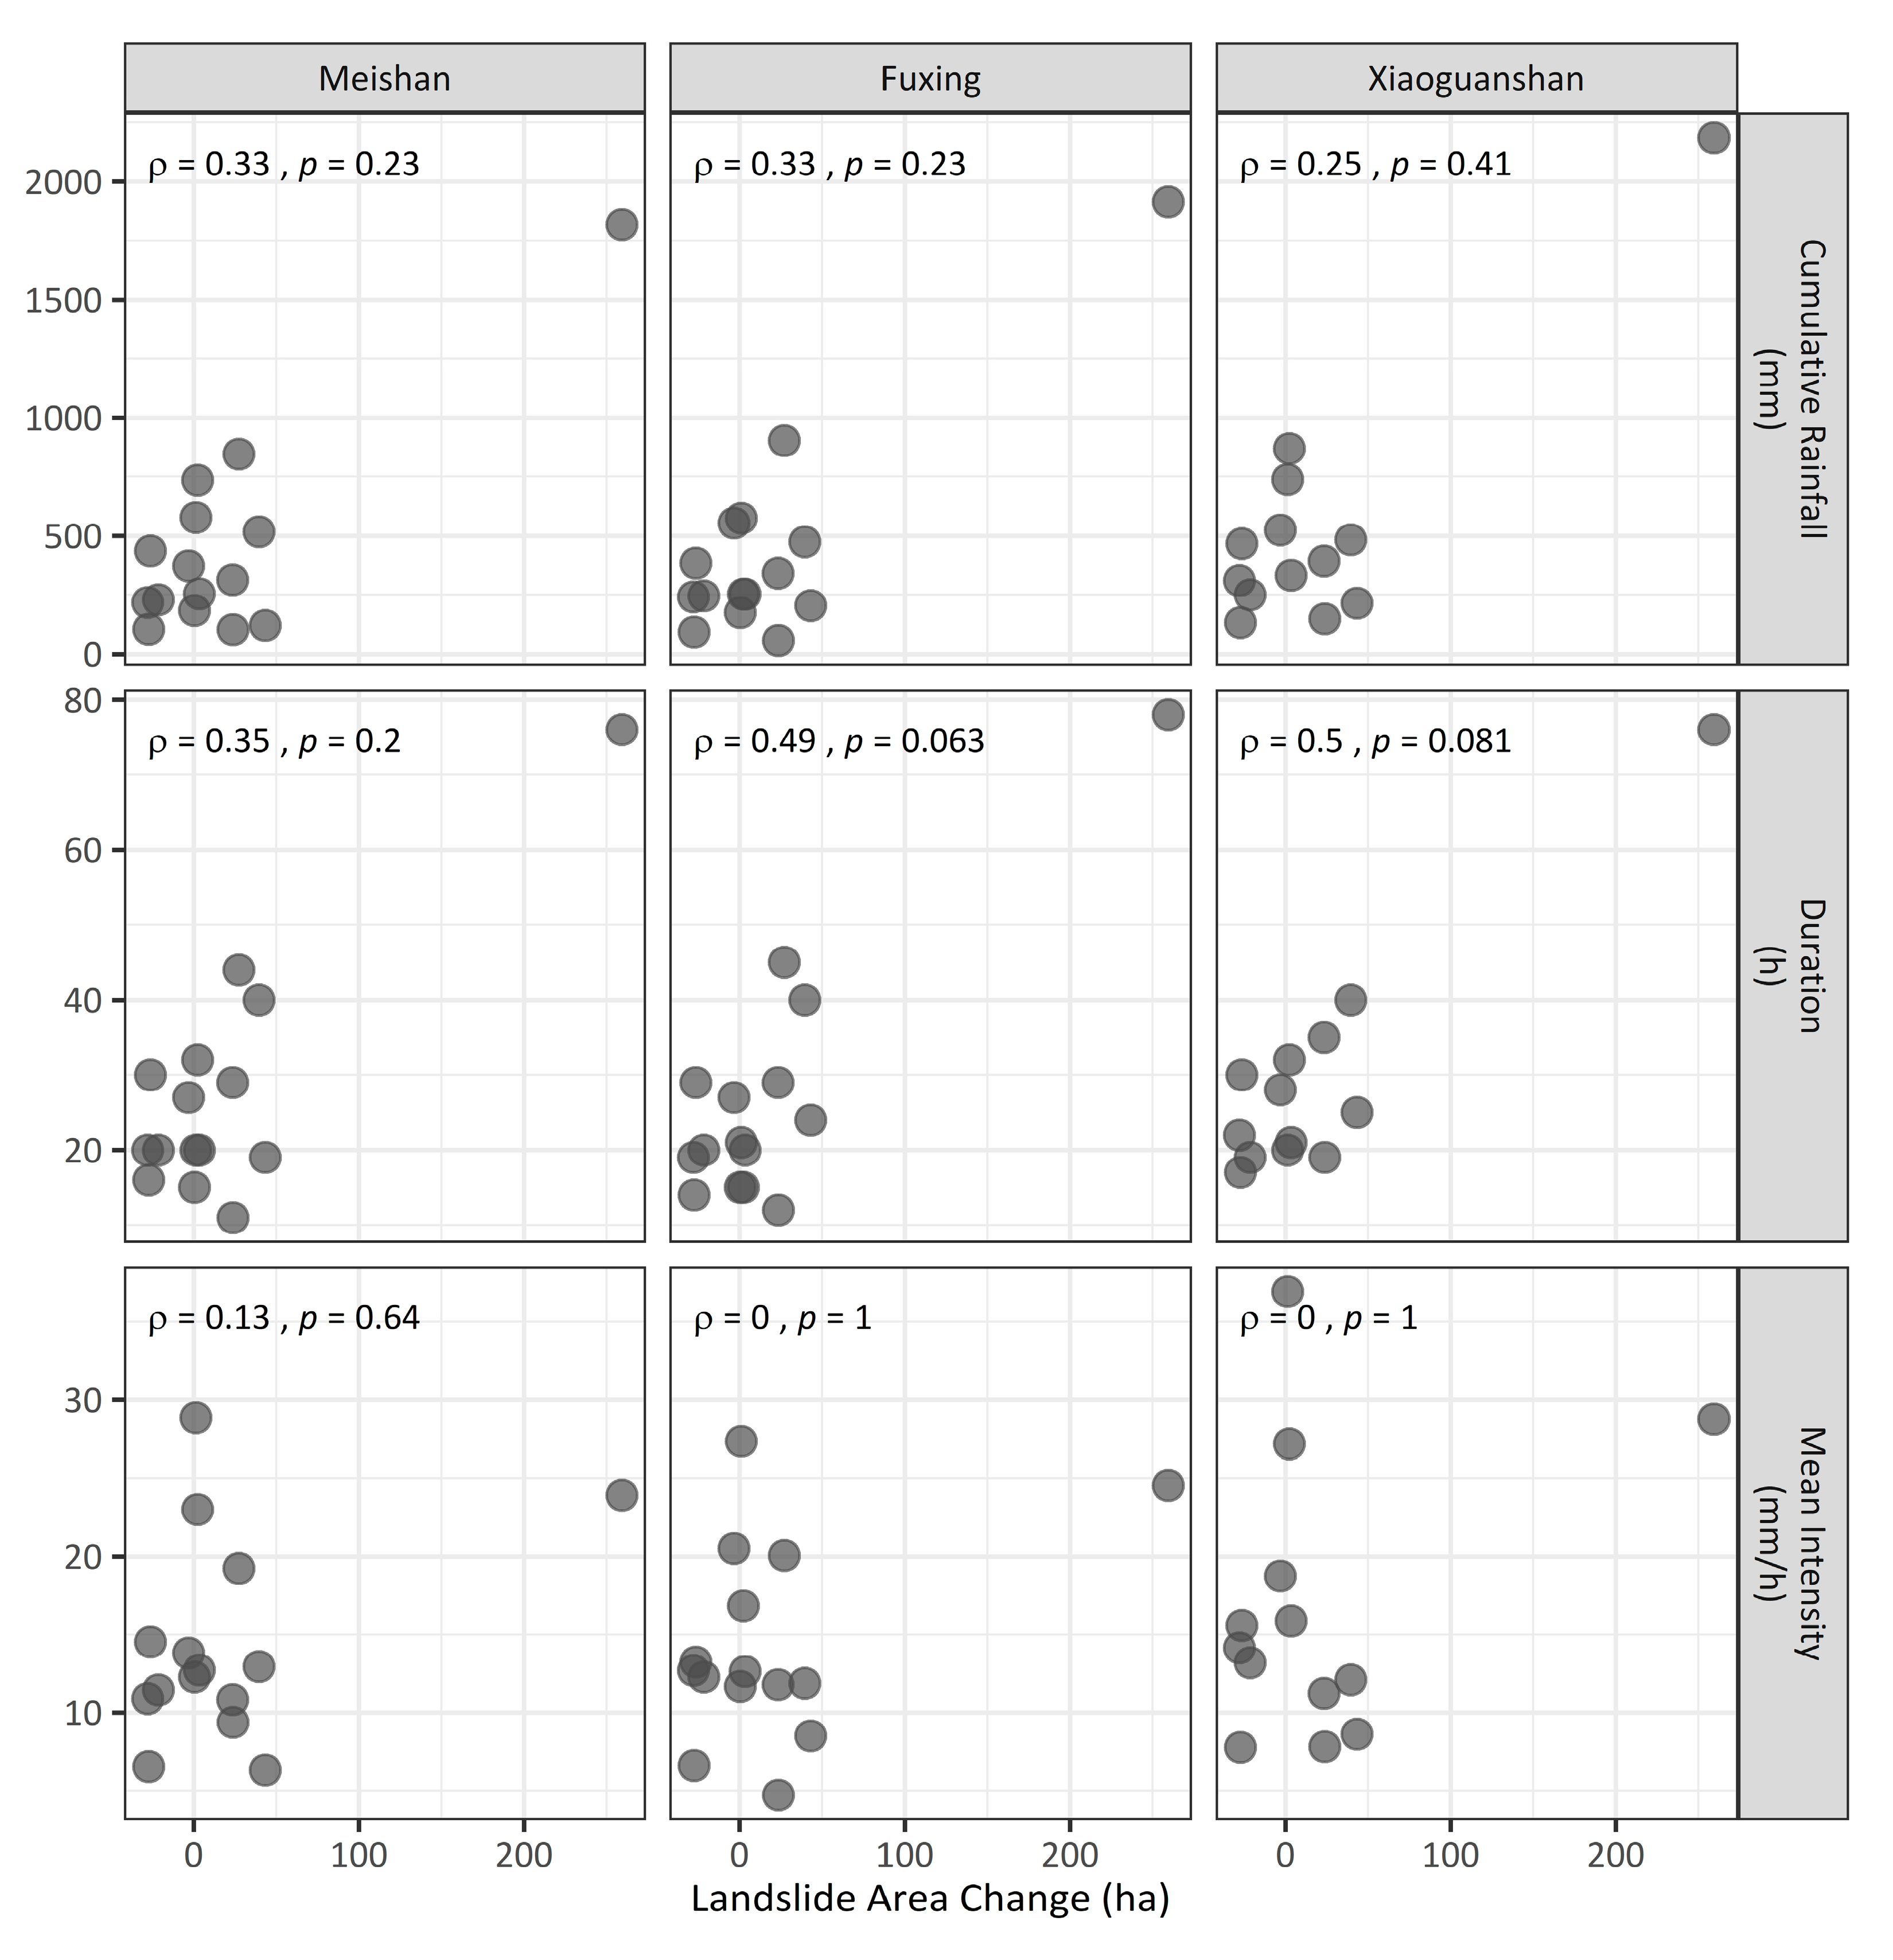
2.6. Correlation between the Change in Landslide Area and Rainfall

An exploratory analysis of the variables derived from the rainfall data, as well as of the landslide area change, showed a non-parametric distribution of the data with the presence of outliers. Hence, we tested for rank correlation after Spearman between the landslide area change and the derived rainfall parameters for each CWB rain gauge station and for the daily precipitation extracted from the CHIRPS data. The Spearman rank-order correlation coefficient (ρ) determines whether there is a monotonic relationship between variables, that is, two variables increasing or decreasing together, or as one increases, the other decreases. Unlike the Pearson correlation coefficient (p), which is a measure of the linear correlation between two variables, Spearman does not test for a linear relationship with a constant rate. The Spearman coefficient is more robust to outliers and appropriate for skewed distributions [70,71], as observed for our data. Finally, the correlation results were evaluated at a 90% confidence level [72].

3. Results

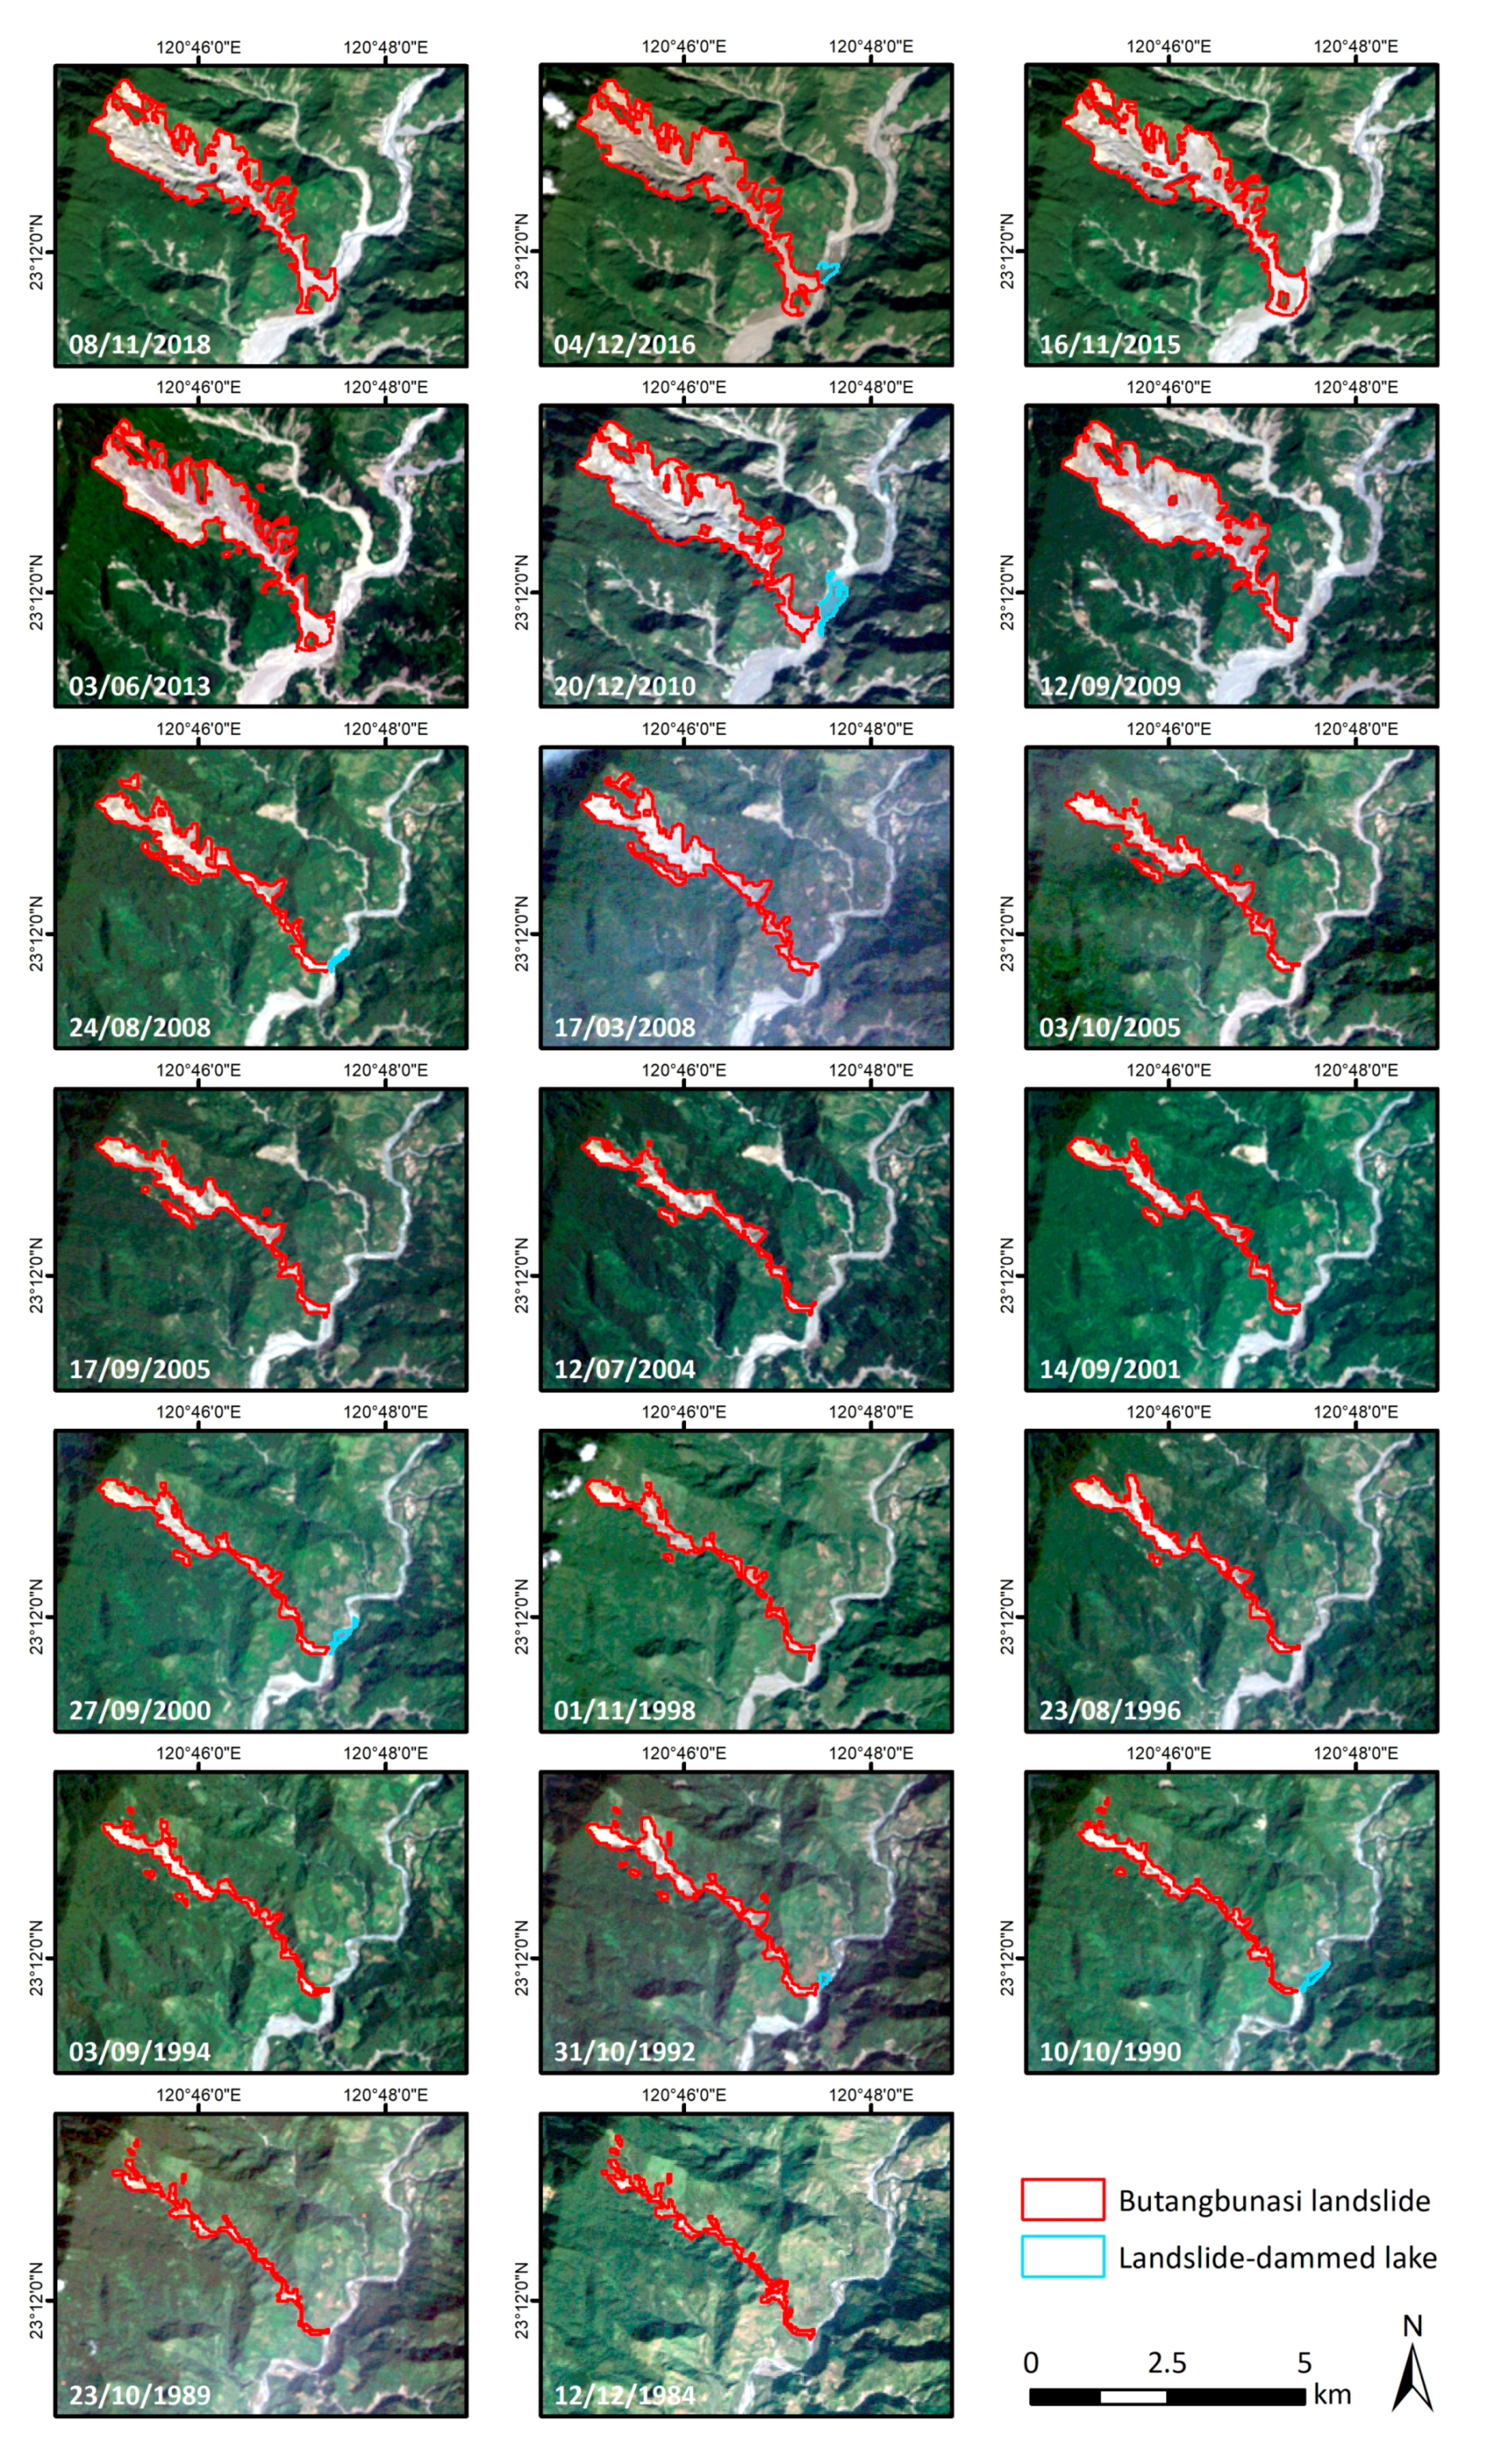
3.1. Semi-Automated Mapping Results

Figure 4 shows the OBIA landslide mapping results for each Landsat image. In addition to the Butangbunasi landslide area, we detected a temporary landslide-dammed lake at the confluence of the Butangbunasi tributary with the Laonong River on six images.
Each selected typhoon event was linked to the respective Landsat image date when the OBIA mapping of the landslide area was performed. Figure 5 shows the time series where landslide area evolution was tracked along with the preceding typhoon events. After typhoon Morakot in 2009, an abrupt increase in landslide area was identified, keeping a steady or even slightly decreasing trend for the following years. Section 3.3 provides additional information about the evolution of the Butangbunasi landslide and the temporary landslide-dammed lake in the Laonong river bed with respect to the heavy rainfall events.

3.2. Comparison of OBIA Results with Visual Interpretation

The accuracy of the semi-automated OBIA results was assessed by comparison to results from visual interpretation. Table 5 summarizes the results of the accuracy assessment.
Similar accuracy values were achieved for the OBIA classification among the selected images, whereby higher accuracies were reached for the landslide class compared to the lake class. Mixed pixels—or in our case mixed objects as a result of undersegmentation [73]—are an important issue in the identification and proportion estimation of classes in Landsat satellite scenes, since they cover more than one ground cover type and thus decrease the separability of classes [74]. We faced this problem especially in areas where small patches of vegetation within the landslide area exist or where revegetation leads to a sparse vegetation cover that influences the spectral reflectance on post-event images. This results in small differences in the OBIA landslide mapping compared to the visual interpretation. For the detected landslide-dammed lakes, classification uncertainties are mainly associated with mixed objects, partly shallow water areas with high sediment load or wet areas in the river bed.
When interpreting the accuracy values it has to be considered that results from visual expert interpretation, especially for natural phenomena such as landslides, cannot constitute an entirely ‘true’ reference, as their creation depends on various factors such as the data used or the expertise of the interpreter [49].

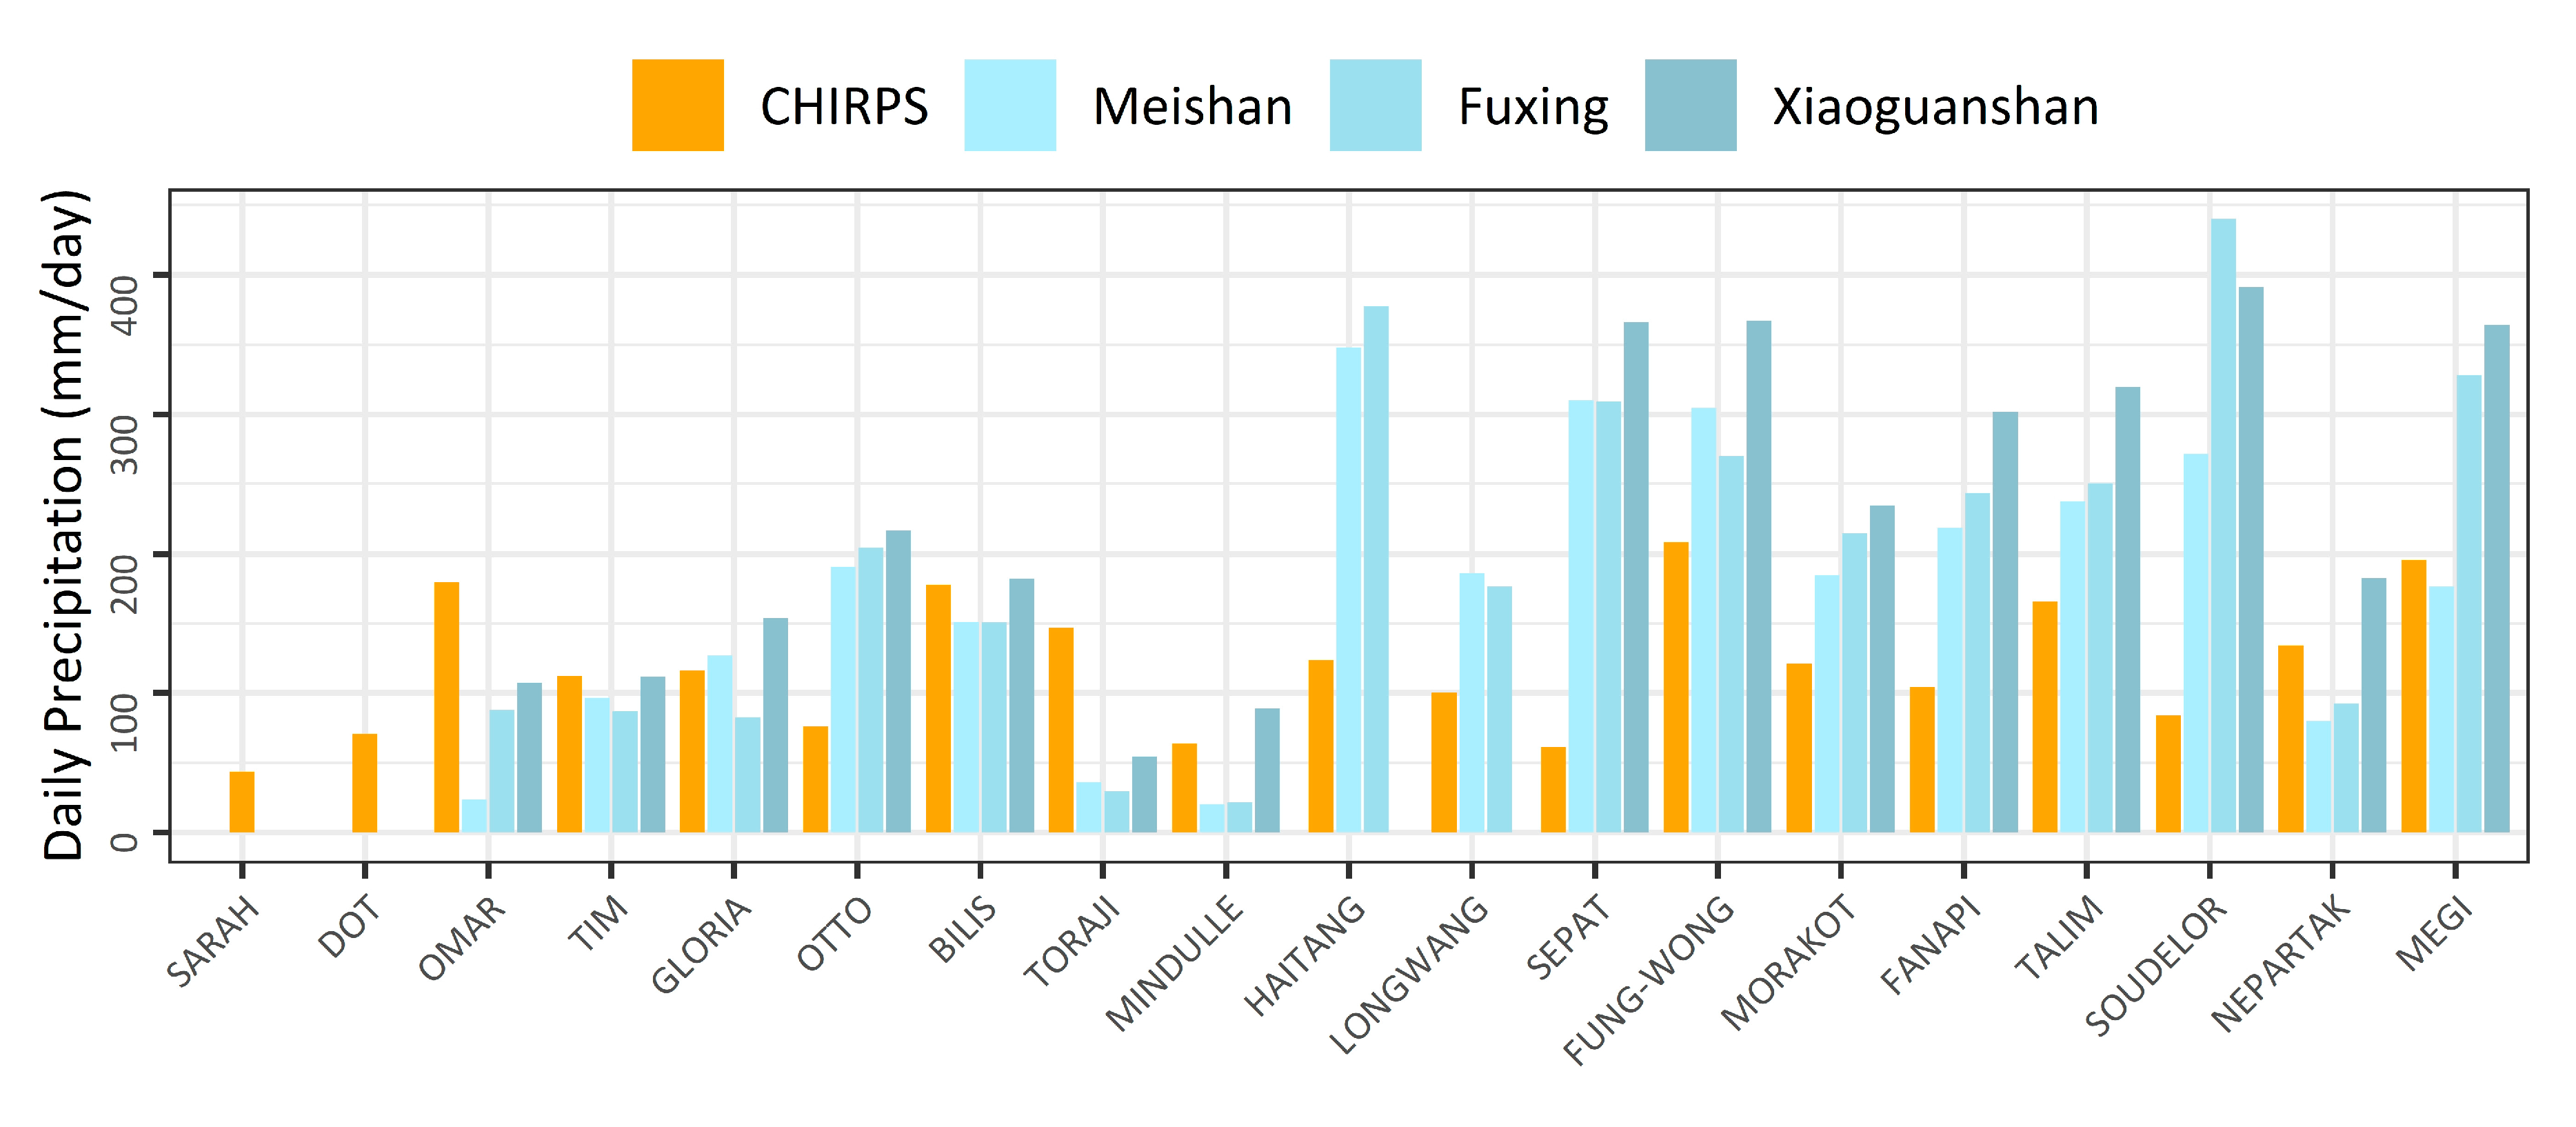
3.3. Rainfall Data Analysis for Each Typhoon Event

Two data sources of rainfall data were individually analyzed for this study. CHIRPS daily precipitation was obtained for the 19 typhoon events selected, where the highest daily precipitation registered on the day of the typhoon passing over Taiwan was 208 mm for typhoon Fung-Wong, while the lowest daily precipitation registered was 43.7 mm for typhoon Sarah. The mean daily precipitation for the selected events was 120 ± 48.2 mm. Nevertheless, a comparison of this satellite-derived data with rain gauge data from the CWB showed that the CHIRPS dataset under/overestimates the rainfall amount for different events (Figure 6). This observation is supported by the findings of Chen et al. [24], who found that remote sensing rainfall products underestimate rainfall compared to rain gauges for typhoon Morakot over Taiwan.
Given that the CHIRPS data are freely available and span the entire study period, we decided to include it in the study. However, the correlation results of the mapped landslide area with CHIRPS daily precipitation data should be interpreted carefully.
For the CWB station data, we analyzed rainfall event parameters derived from hourly precipitation records for three separate rain gauges. Several studies used spatial interpolation for the analysis of rainfall parameters in comparison to landslide area [8,75,76]. These studies investigate several landslide locations but do not focus on a detailed analysis of the progressive evolution of one major landslide. Given that spatial interpolation can introduce uncertainty to the resulting rain measurements [77] and that the rain gauges were located within a range of 2.8–8 km from the landslide area, we decided to analyze the three closest rain gauges separately.
The rain gauge data are available since 1992, and thus cover only 17 of the selected 19 typhoon events. In addition, rainfall data for the Longwang and Haitang typhoons were not available for station Xiaoguanshan. Cumulative rainfall, duration and mean intensity were derived for each rainfall event within the typhoon period for each station. Summary statistics of the derived parameters are presented in Table 6. In general, station Xiaoguanshan recorded the highest cumulative rainfall, duration and intensity during rainfall events, which could be explained by the altitude of the station, as well as its location downstream of the valley.
Table 7 presents the individual parameters per typhoon event next to the semi-automated mapping results. For every station, the maximum cumulative rainfall and duration correspond to typhoon Morakot, whereas the maximum intensity corresponds to typhoon Toraji, and the minimum duration corresponds to typhoon Nepartak. Minimum cumulative rainfall and intensity varied between typhoon events and stations.

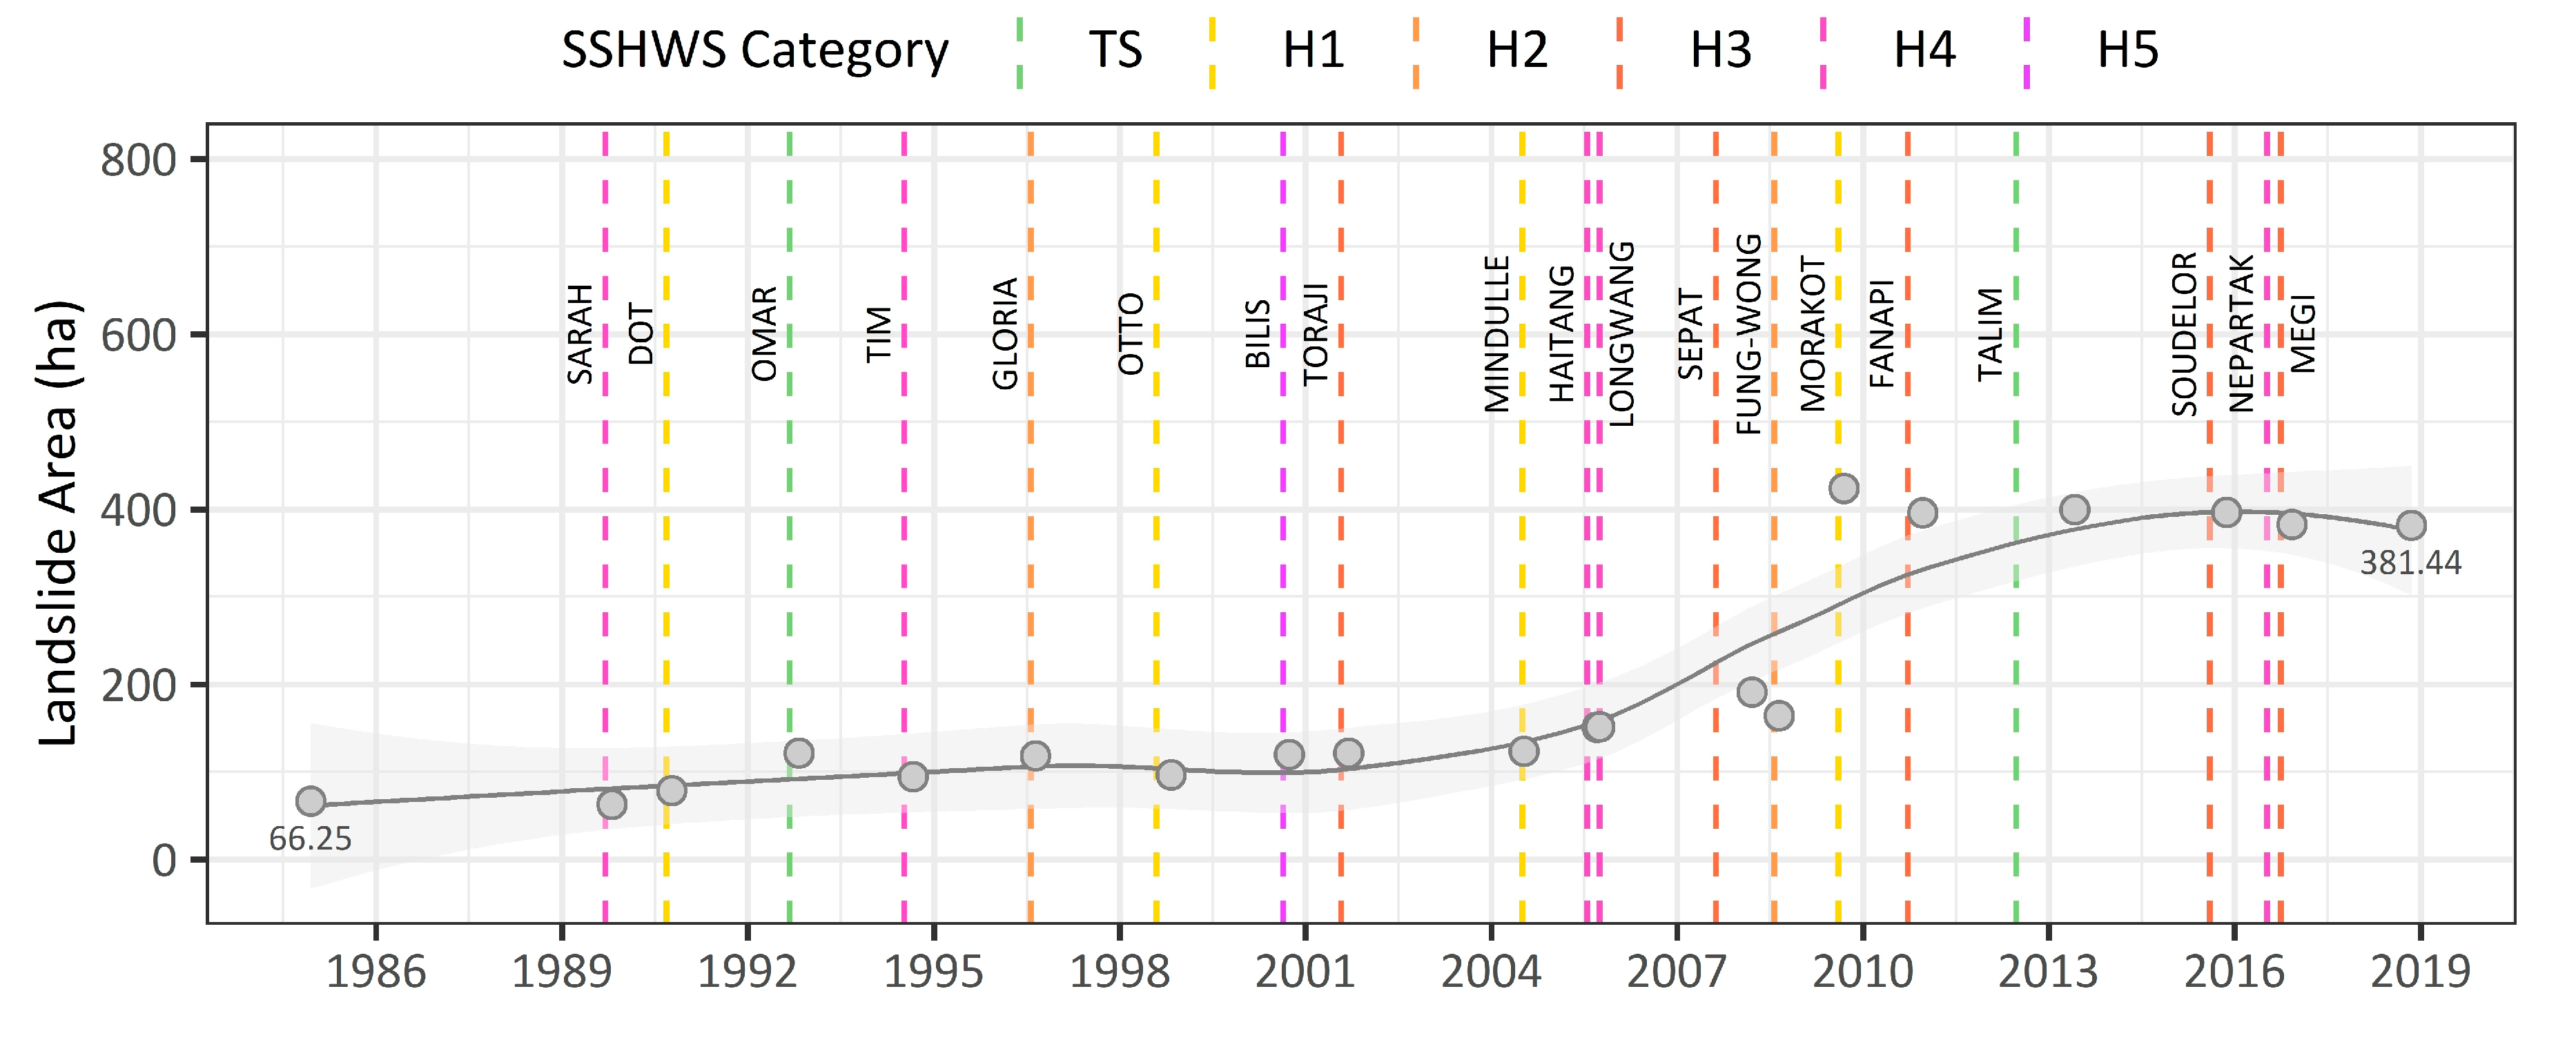
3.4. Relation between Landslide Area Change and Rainfall-Derived Parameters during Typhoon Events

No cloud-free satellite image was available between typhoons Megi and Nepartak (cf. Figure 5). Hence, the landslide area mapped for December 2016 could represent either of those events. To avoid any uncertainty, both typhoon events were removed from the correlation analysis.
CHIRPS daily precipitation data for the exact date when the typhoon passed over Taiwan were correlated with the landslide area change for 17 typhoon events. The results show that there was not enough evidence of a significant correlation between the variables (ρ = 0.186, p = 0.47).
For the CWB rain gauges, we tested for correlations between the landslide area change and the cumulative rainfall, duration and mean intensity of the rainfall events during 15 typhoon events for the stations Meishan and Fuxing, and for 14 typhoon events for the Xiaoguanshan station. Figure 7 shows the rainfall parameters per CWB station plotted against the landslide area change and the resulting Spearman’s rank correlation coefficients. Moderate positive correlations were found at a 90% confidence level between the landslide area change and the duration of the heavy rainfall event for stations Fuxing and Xiaoguanshan. This means, there is less than 10% chance that the found relationship was due to chance. Cumulative rainfall and mean intensity did not present strong significant correlations with the landslide area change. For the Meishan station, no significant correlation was found, which may be explained by the rain gauge location within a tributary valley.

4. Discussion

Semi-automated techniques can limit the subjectivity in landslide mapping and can contribute to improving the reproducibility of landslide maps [78]. OBIA is such a technique and provides a set of suitable tools to semi-automatically map the evolution of landslides with time series of satellite images. The developed OBIA workflow was designed to be transferable across images, whereby only minor modifications for each Landsat sensor were necessary. This reduces the analysis time and increases the transferability of the approach. We used spectral indices for the landslide classification supported by ancillary DEM data to avoid the classification of specific false positives. While a DEM was available for only one point in time for our analysis, using DEMs acquired after each triggering event would increase the classification accuracy and would also allow a volume change estimation. In practice, however, multi-temporal DEM data are rarely available. The semi-automated mapping led to reasonable results. However, the determined accuracy values need to be considered with care, since any reference data created by manual mapping includes a certain degree of uncertainty and subjectivity [45].
The Landsat archive offers multispectral imagery since the 1980s suitable to identify recurrent changes in the area of large landslides such as the Butangbunasi landslide. Even if the spatial resolution of 30 m does not allow to identify very small changes, trends over time can be well depicted. However, the exact timing of landslide extension/reactivation following typhoons or tropical storms remains difficult. We employed the first cloud-free Landsat image acquired after such an event, but in some cases, the time span between a rainfall event and image acquisition date was up to several months or even longer. The accuracy of the OBIA mapping probably also depends on the time elapsed between a landslide triggering event and the acquisition of the next satellite image [37]. A short delay would allow deriving more detailed information about the landslide reactivating, the revegetation time and the formation of landslide-dammed lakes. The time span of over two years between the last image used and the last identified typhoon is probably the reason for the slightly decreasing trend in landslide area since initial revegetation happens quite fast. Several studies investigated the vegetation recovery after the occurrence of landslides. For example, Lin et al. [79] estimated a vegetation recovery rate of approximately 60% two years after landslides and Chou et al. [80] found a vegetation recovery rate of approximately 90% six years after landslides in central Taiwan. The new generations of satellites, for example, freely available data such as Sentinel-2 or EO data from commercial data providers, already provide a higher temporal and spatial resolution for recent years. This offers great opportunities for improving studies similar to the presented one in the future when longer time series of very high resolution (VHR) images will be available.
Rainfall-triggered landslides are particularly frequent in areas heavily affected by typhoon events, such as Taiwan. Freely available rainfall data are essential to improve early-warning models, as new technologies and research opportunities emerge. In this study, we focused on two free and open rainfall data sources. The CHIRPS data are globally available since 1981, however, its coarse spatial and temporal resolution limits its usage for local studies. In addition, the CHIRPS data under/overestimate daily precipitation. In our case, rain gauge data available from the CWB typhoon database were a more suitable alternative. Our results indicate that the duration of the heavy rainfall event is the main parameter linked to the landslide area change, while cumulative rainfall and mean intensity did not show significant correlations with the extension of the Butangbunasi landslide. Further analyses should be performed to find a direct causation between the rainfall event duration and the landslide area change. However, the freely available CWB data are limited to those hours when the typhoon passed Taiwan, and hence a complete historical rainfall database cannot be analyzed together with these extreme events. Several parameters could be computed from such a database, as indicated by Guzzetti et al. [81], which could lead to a more robust evaluation of the relationship between rain events and landslide evolution.
Better knowledge about the reactivation of large landslides and the recurring impact on downstream areas is of high importance for disaster mitigation. Even if our results did not indicate a direct relationship between the extension of the Butangbunasi landslide and the strength of the typhoon event, it became evident that also comparatively small typhoons or tropical storms could cause landslide reactivation. This is, for example, of high relevance for implementing early warning measures. The repeated sediment delivery after rainfall events frequently impacts the rivers system, which can result in the formation of landslide-dammed lakes and debris flows, and eventually poses a risk for people, settlements and infrastructure downstream. Major efforts are taken to maintain the transportation infrastructure in the study area and to avoid the repeated damming of the river (Figure 8). In particular, the Southern Cross-Island Highway, which is a popular tourist route that crosses the CMR and that provides a connection to the remote Yushan National Park, was severely affected by typhoon Morakot and following events, and the associated debris and sediment from the Butangbunasi landslide [29,30]. Information about the evolution of the Butangbunasi landslide is thus also important for planning and implementing maintenance and reconstruction activities of roads and bridges.
In this study, we focused on one large landslide. By studying larger areas and relating spatio-temporal landslide hotspots to rainfall events brought by typhoons or tropical storms, more robust correlations between landslide extensions and triggering events might be found. Further research should also emphasize on the combination of OBIA and machine learning approaches for automated landslide time series analysis.

5. Conclusions

Large rainfall-induced landslides are among the most dangerous natural hazards in Taiwan, putting people and infrastructure at risk. Thus, better knowledge about the evolution of large landslides, their triggering factors and their potential to initiate cascading hazards is important in several respects.
Often insufficient information exists on landslide occurrence and reactivation intervals. Findings from the analysis of time series of satellite imagery, as provided for example by the Landsat missions, can provide useful information for supporting hazard mitigation and spatial planning. At the same time, the constantly increasing amount of satellite imagery at higher spatial and temporal resolutions implies the need for efficient and robust landslide (change) mapping methods. OBIA provides a suitable methodological framework for addressing these challenges. In this study, we semi-automatically mapped the evolution of the Butangbunasi landslide using Landsat time series data. The OBIA mapping results showed that the most significant landslide extension happened after typhoon Morakot in 2009. Freely available rainfall data were analyzed to find potential relationships between the reactivation and evolution of the landslide area and heavy rainfall during typhoon events. Our results indicate that the duration of the heavy rainfall event is the main parameter linked to the landslide area change, whereas daily precipitation, cumulative rainfall and mean intensity did not present strong significant correlations.
While landslides and associated hazards are a significant problem under present-day climate regimes, it is likely that climate change will lead to more frequent and extreme landslide-triggering events such as typhoons and tropical storms in Taiwan. Consequently, even more landslides may occur in the future. With this in mind, the relevance of studies that investigate and analyze the evolution of large landslides with respect to triggering events becomes even more important. Respective results can serve as input for hazard and risk analysis and the implementation of prevention and mitigation measures.

Author Contributions

Conceptualization: D.H.; methodology: D.H. and L.A.; validation: D.H. and L.A.; formal analysis: D.H., L.A. and Z.D.; investigation: D.H., L.A., G.P., T.-T.T. and A.-L.A.; data curation: D.H., L.A. and Z.D.; writing—original draft preparation: D.H., L.A. and Z.D.; writing—review and editing: D.H., L.A., Z.D., G.P., T.-T.T. and A.-L.A.; visualization: D.H. and L.A.; supervision: D.H.; project administration: D.H. and G.P.; funding acquisition: D.H. and G.P. All authors have read and agreed to the published version of the manuscript.

Funding

This research has been supported by the Austrian Academy of Sciences (ÖAW) through the project RiCoLa (Detection and analysis of landslide-induced river course changes and lake formation).

Acknowledgments

The authors would like to thank Chia-Yen Tsui for supporting field visits and for providing background information and UAV imagery. The used field photographs were taken by D. Hölbling, A.-L. Argentin and P. Zeil.

Conflicts of Interest

The authors declare no conflict of interest. The funders had no role in the design of the study; in the collection, analyses, or interpretation of data; in the writing of the manuscript, or in the decision to publish the results.

References

  1. Jang, W.; Chun, H.Y. The effects of topography on the evolution of typhoon saomai (2006) under the influence of tropical storm bopha (2006). Mon. Weather Rev. 2013, 141, 468–489. [Google Scholar] [CrossRef]
  2. Wu, C.-C.; Kuo, Y.-H. Typhoons Affecting Taiwan: Current Understanding and Future Challenges. Bull. Am. Meteorol. Soc. 1999, 80, 67–80. [Google Scholar] [CrossRef]
  3. Chen, C.J.; Lee, T.Y.; Chang, C.M.; Lee, J.Y. Assessing typhoon damages to Taiwan in the recent decade: Return period analysis and loss prediction. Nat. Hazards 2018, 91, 759–783. [Google Scholar] [CrossRef]
  4. Liang, A.T.Y.; Oey, L.; Huang, S.; Chou, S. Long-term trends of typhoon-induced rainfall over Taiwan: In situ evidence of poleward shift of typhoons in western North Pacific in recent decades. J. Geophys. Res. 2017, 122, 2750–2765. [Google Scholar] [CrossRef]
  5. Chang, C.W.; Lin, P.S.; Tsai, C.L. Estimation of sediment volume of debris flow caused by extreme rainfall in Taiwan. Eng. Geol. 2011, 123, 83–90. [Google Scholar] [CrossRef]
  6. Chen, J.-M.; Li, T.; Shih, C.-F. Tropical Cyclone- and Monsoon-Induced Rainfall Variability in Taiwan. J. Clim. 2010, 23, 4107–4120. [Google Scholar] [CrossRef]
  7. Tu, J.Y.; Chou, C. Changes in precipitation frequency and intensity in the vicinity of Taiwan: Typhoon versus non-typhoon events. Environ. Res. Lett. 2013, 8, 014023. [Google Scholar] [CrossRef]
  8. Chen, C.-W.; Oguchi, T.; Hayakawa, Y.S.; Saito, H.; Chen, H.; Yuichi, I.; Hayakawa, S.; Saito, H.; Chen, H. Relationship between landslide size and rainfall conditions in Taiwan. Landslides 2017, 14, 1235–1240. [Google Scholar] [CrossRef]
  9. Chen, C.-W.; Oguchi, T.; Hayakawa, Y.S.; Saito, H.; Chen, H.; Lin, G.-W.; Wei, L.-W.; Chao, Y.-C. Sediment yield during typhoon events in relation to landslides, rainfall, and catchment areas in Taiwan. Geomorphology 2018, 303, 540–548. [Google Scholar] [CrossRef]
  10. Alexander, D. Vulnerability to landslides. In Landslide Hazard and Risk; Glade, T., Anderson, M., Crozier, M.J., Eds.; John Wiley & Sons Ltd.: Hoboken, NJ, USA; Chichester, UK, 2005; pp. 175–198. [Google Scholar] [CrossRef]
  11. Piciullo, L.; Calvello, M.; Cepeda, J.M. Territorial early warning systems for rainfall-induced landslides. Earth-Sci. Rev. 2018, 179, 228–247. [Google Scholar] [CrossRef]
  12. Petley, D. Global patterns of loss of life from landslides. Geology 2012, 40, 927–930. [Google Scholar] [CrossRef]
  13. Sanchez, C.; Lee, T.-S.; Young, S.; Batts, D.; Benjamin, J.; Malilay, J. Risk factors for mortality during the 2002 landslides in Chuuk, Federated States of Micronesia. Disasters 2009, 33, 705–720. [Google Scholar] [CrossRef] [PubMed]
  14. Tsai, F.; Hwang, J.H.; Chen, L.C.; Lin, T.H. Post-disaster assessment of landslides in southern Taiwan after 2009 Typhoon Morakot using remote sensing and spatial analysis. Nat. Hazards Earth Syst. Sci. 2010, 10, 2179–2190. [Google Scholar] [CrossRef] [Green Version]
  15. Guthrie, R.H.; Evans, S.G. Work, persistence, and formative events: The geomorphic impact of landslides. Geomorphology 2007, 88, 266–275. [Google Scholar] [CrossRef]
  16. Chen, S.-C.; Huang, B.-T. Non-structural mitigation programs for sediment-related disasters after the Chichi Earthquake in Taiwan. J. Mt. Sci. 2010, 7, 291–300. [Google Scholar] [CrossRef] [Green Version]
  17. Liu, C.-N.; Dong, J.-J.; Chen, C.-J.; Lee, W.-F. Typical landslides and related mechanisms in Ali Mountain highway induced by typhoon Morakot: Perspectives from engineering geology. Landslides 2012, 9, 239–254. [Google Scholar] [CrossRef]
  18. Chen, S.C.; Hsu, C.L.; Wu, T.Y.; Chou, H.T.; Cui, P. Landslide dams induced by typhoon Morakot and risk assessment. In Proceedings of the 5th International Conference on Debris-Flow Hazards Mitigation: Mechanics, Prediction and Assessment, Padua, Italy, 14–17 June 2011; pp. 653–660. [Google Scholar]
  19. Li, H.-C.; Hsieh, L.-S.; Chen, L.-C.; Lin, L.-Y.; Li, W.-S. Disaster investigation and analysis of Typhoon Morakot. J. Chin. Inst. Eng. 2014, 37, 558–569. [Google Scholar] [CrossRef]
  20. Prasicek, G.; Hölbling, D.; Argentin, A.-L.; Friedl, B. Detection and analysis of River course changes and lake formation--The RiCoLa Project. In Proceedings of the EGU General Assembly Conference Abstracts, Vienna, Austria, 23–28 April 2017; Volume 20, p. 7768. [Google Scholar]
  21. Hovius, N.; Stark, C.P.; Hao-Tsu, C.; Jiun-Chuan, L. Supply and removal of sediment in a landslide-dominated mountain belt: Central Range, Taiwan. J. Geol. 2000, 108, 73–89. [Google Scholar] [CrossRef]
  22. Dadson, S.J.; Hovius, N.; Chen, H.; Dade, W.B.; Hsieh, M.-L.; Willett, S.D.; Hu, J.-C.; Horng, M.-J.; Chen, M.-C.; Stark, C.P.; et al. Links between erosion, runoff variability and seismicity in the Taiwan orogen. Nature 2003, 426, 648. [Google Scholar] [CrossRef]
  23. Wu, C.-C.; Ming-Jen, Y. Preface to the Special Issue on “Typhoon Morakot (2009): Observation, Modeling, and Forecasting”. TAO Terr. Atmos. Ocean. Sci. 2011, 22, I. [Google Scholar] [CrossRef] [Green Version]
  24. Chen, S.; Hong, Y.; Cao, Q.; Kirstetter, P.-E.; Gourley, J.J.; Qi, Y.; Zhang, J.; Howard, K.; Hu, J.; Wang, J. Performance evaluation of radar and satellite rainfalls for Typhoon Morakot over Taiwan: Are remote-sensing products ready for gauge denial scenario of extreme events? J. Hydrol. 2013, 506, 4–13. [Google Scholar] [CrossRef]
  25. Wu, L.; Liang, J.; Wu, C.-C. Monsoonal influence on Typhoon Morakot (2009). Part I: Observational analysis. J. Atmos. Sci. 2011, 68, 2208–2221. [Google Scholar] [CrossRef]
  26. Lee, H.S.; Yamashita, T.; Hsu, J.R.C.; Ding, F. Integrated modeling of the dynamic meteorological and sea surface conditions during the passage of Typhoon Morakot. Dyn. Atmos. Ocean. 2013, 59, 1–23. [Google Scholar] [CrossRef]
  27. Tsou, C.-Y.; Feng, Z.-Y.; Chigira, M. Catastrophic landslide induced by typhoon Morakot, Shiaolin, Taiwan. Geomorphology 2011, 127, 166–178. [Google Scholar] [CrossRef] [Green Version]
  28. Wu, C.-H.; Chen, S.-C.; Feng, Z.-Y. Formation, failure, and consequences of the Xiaolin landslide dam, triggered by extreme rainfall from Typhoon Morakot, Taiwan. Landslides 2014, 11, 357–367. [Google Scholar] [CrossRef] [Green Version]
  29. Lin, C.H.; Lin, M.L. Evolution of the large landslide induced by Typhoon Morakot: A case study in the Butangbunasi River, southern Taiwan using the discrete element method. Eng. Geol. 2015, 197, 172–187. [Google Scholar] [CrossRef]
  30. Lo, C.M.; Weng, M.C.; Lin, M.L.; Lee, S.M.; Lee, K.C. Landscape evolution characteristics of large-scale erosion and landslides at the putanpunas stream, Taiwan. Geomat. Nat. Hazards Risk 2018, 9, 175–195. [Google Scholar] [CrossRef]
  31. Lo, C.M. Evolution of deep-seated landslide at Putanpunas stream, Taiwan. Geomat. Nat. Hazards Risk 2017, 8, 1204–1224. [Google Scholar] [CrossRef] [Green Version]
  32. Dabiri, Z.; Hölbling, D.; Abad, L.; Prasicek, G.; Argentin, A.-L.; Tsai, T.-T. An Object-Based Approach for Monitoring the Evolution of Landslide-dammed Lakes and Detecting Triggering Landslides in Taiwan. ISPRS Int. Arch. Photogramm. Remote Sens. Spat. Inf. Sci. 2019, XLII-3/W8, 103–108. [Google Scholar] [CrossRef] [Green Version]
  33. Hölbling, D.; Dabiri, Z.; Tsai, T.T.; Prasicek, G.; Tsui, C.Y.; Schäffer, L.; Argentin, A.-L.M.; Abad, L. Mapping the Evolution of the Butangbunasi Landslide, Taiwan, using Landsat Time Series. In Proceedings of the 27th IUGG General Assembly, Montréal, QC, Canada, 8–18 July 2019. [Google Scholar]
  34. Capart, H.; Hsu, J.P.C.; Lai, S.Y.J.; Hsieh, M.-L. Formation and decay of a tributary-dammed lake, Laonong River, Taiwan. Water Resour. Res. 2010, 46. [Google Scholar] [CrossRef] [Green Version]
  35. Cheng, H.-Y. Confluence Morphodynamics with Tributary Influx and Lake Formation: Field Survey and Experiments; National Taiwan University: Taipei, Taiwan, 2011. [Google Scholar] [CrossRef]
  36. Huang, Y.-R. Assessment of Natural Dam Occurrence Caused by Debris Flow; National Cheng Kung University: Tainan, Taiwan, 2015. [Google Scholar] [CrossRef]
  37. Hölbling, D.; Betts, H.; Spiekermann, R.; Phillips, C. Identifying Spatio-Temporal Landslide Hotspots on North Island, New Zealand, by Analyzing Historical and Recent Aerial Photography. Geosciences 2016, 6, 48. [Google Scholar] [CrossRef] [Green Version]
  38. Crosta, G.B.; Frattini, P. Distributed modelling of shallow landslides triggered by intense rainfall. Nat. Hazards Earth Syst. Sci. 2003, 3, 81–93. [Google Scholar] [CrossRef] [Green Version]
  39. Metternicht, G.; Hurni, L.; Gogu, R. Remote sensing of landslides: An analysis of the potential contribution to geo-spatial systems for hazard assessment in mountainous environments. Remote Sens. Environ. 2005, 98, 284–303. [Google Scholar] [CrossRef]
  40. Casagli, N.; Cigna, F.; Bianchini, S.; Hölbling, D.; Füreder, P.; Righini, G.; Del Conte, S.; Friedl, B.; Schneiderbauer, S.; Iasio, C.; et al. Landslide mapping and monitoring by using radar and optical remote sensing: Examples from the EC-FP7 project SAFER. Remote Sens. Appl. Soc. Environ. 2016, 4, 92–108. [Google Scholar] [CrossRef] [Green Version]
  41. Joyce, K.E.; Belliss, S.E.; Samsonov, S.V.; McNeill, S.J.; Glassey, P.J. A review of the status of satellite remote sensing and image processing techniques for mapping natural hazards and disasters. Prog. Phys. Geogr. 2009, 33, 183–207. [Google Scholar] [CrossRef] [Green Version]
  42. Delaney, K.B.; Evans, S.G. The 2000 Yigong landslide (Tibetan Plateau), rockslide-dammed lake and outburst flood: Review, remote sensing analysis, and process modelling. Geomorphology 2015, 246, 377–393. [Google Scholar] [CrossRef]
  43. Bozzano, F.; Mazzanti, P.; Perissin, D.; Rocca, A.; De Pari, P.; Discenza, M. Basin scale assessment of landslides geomorphological setting by advanced InSAR analysis. Remote Sens. 2017, 9, 267. [Google Scholar] [CrossRef] [Green Version]
  44. Fiorucci, F.; Giordan, D.; Santangelo, M.; Dutto, F.; Rossi, M.; Guzzetti, F. Criteria for the optimal selection of remote sensing optical images to map event landslides. Nat. Hazards Earth Syst. Sci. 2018, 18, 405–417. [Google Scholar] [CrossRef] [Green Version]
  45. Hölbling, D.; Eisank, C.; Albrecht, F.; Vecchiotti, F.; Friedl, B.; Weinke, E.; Kociu, A. Comparing manual and semi-automated landslide mapping based on optical satellite images from different sensors. Geosciences 2017, 7, 37. [Google Scholar] [CrossRef] [Green Version]
  46. Behling, R.; Roessner, S.; Golovko, D.; Kleinschmit, B. Derivation of long-term spatiotemporal landslide activity—A multi-sensor time series approach. Remote Sens. Environ. 2016, 186, 88–104. [Google Scholar] [CrossRef]
  47. Lu, P.; Stumpf, A.; Kerle, N.; Casagli, N. Object-oriented change detection for landslide rapid mapping. IEEE Geosci. Remote Sens. Lett. 2011, 8, 701–705. [Google Scholar] [CrossRef]
  48. Hölbling, D.; Füreder, P.; Antolini, F.; Cigna, F.; Casagli, N.; Lang, S. A Semi-Automated Object-Based Approach for Landslide Detection Validated by Persistent Scatterer Interferometry Measures and Landslide Inventories. Remote Sens. 2012, 4, 1310–1336. [Google Scholar] [CrossRef] [Green Version]
  49. Hölbling, D.; Friedl, B.; Eisank, C. An object-based approach for semi-automated landslide change detection and attribution of changes to landslide classes in northern Taiwan. Earth Sci. Inform. 2015, 8, 327–335. [Google Scholar] [CrossRef] [Green Version]
  50. Aksoy, B.; Ercanoglu, M. Landslide identification and classification by object-based image analysis and fuzzy logic: An example from the Azdavay region (Kastamonu, Turkey). Comput. Geosci. 2012, 38, 87–98. [Google Scholar] [CrossRef]
  51. Martha, T.R.; Kerle, N.; Jetten, V.; van Westen, C.J.; Kumar, K.V. Characterising spectral, spatial and morphometric properties of landslides for semi-automatic detection using object-oriented methods. Geomorphology 2010, 116, 24–36. [Google Scholar] [CrossRef]
  52. Moosavi, V.; Talebi, A.; Shirmohammadi, B. Producing a landslide inventory map using pixel-based and object-oriented approaches optimized by Taguchi method. Geomorphology 2014, 204, 646–656. [Google Scholar] [CrossRef]
  53. Eisank, C.; Hölbling, D.; Friedl, B.; Chen, Y.-C.; Chang, K.-T. Expert knowledge for object-based landslide mapping in Taiwan. Southeast. Eur. J. Earth Obs. Geomat. 2014, 3, 347–350. [Google Scholar]
  54. Barlow, J.; Franklin, S.; Martin, Y. High Spatial Resolution Satellite Imagery, DEM Derivatives, and Image Segmentation for the Detection of Mass Wasting Processes. Photogramm. Eng. Remote Sens. 2006, 72, 687–692. [Google Scholar] [CrossRef] [Green Version]
  55. Keyport, R.N.; Oommen, T.; Martha, T.R.; Sajinkumar, K.S.; Gierke, J.S. A comparative analysis of pixel- and object-based detection of landslides from very high-resolution images. Int. J. Appl. Earth Obs. Geoinf. 2018, 64, 1–11. [Google Scholar] [CrossRef]
  56. Lahousse, T.; Chang, K.T.; Lin, Y.H. Landslide mapping with multi-scale object-based image analysis-a case study in the Baichi watershed, Taiwan. Nat. Hazards Earth Syst. Sci. 2011, 11, 2715–2726. [Google Scholar] [CrossRef]
  57. Plank, S.; Hölbling, D.; Eisank, C.; Friedl, B.; Martinis, S.; Twele, A. Comparing object-based landslide detection methods based on polarimetric SAR and optical satellite imagery—A case study in Taiwan. In Proceedings of the 7th International Workshop on Science and Applications of SAR Polarimetry and Polarimetric Interferometry, POLinSAR, Frascati, Italy, 26–30 January 2015; pp. 1–5. [Google Scholar]
  58. Rau, J.-Y.; Jhan, J.-P.; Rau, R.-J. Semiautomatic object-oriented landslide recognition scheme from multisensor optical imagery and DEM. IEEE Trans. Geosci. Remote Sens. 2014, 52, 1336–1349. [Google Scholar] [CrossRef]
  59. Rau, J.-Y.; Jhan, J.P.; Lo, C.F.; Lin, Y.S. Landslide Mapping Using Imagery Acquired By a Fixed-Wing UAV. ISPRS Int. Arch. Photogramm. Remote Sens. Spat. Inf. Sci. 2012, XXXVIII-1, 195–200. [Google Scholar] [CrossRef] [Green Version]
  60. NOAA (National Oceanic and Atmospheric Administration): Office for Coastal Management Historical Hurricane Tracks. Available online: https://coast.noaa.gov/hurricanes/ (accessed on 25 November 2019).
  61. Liang, S.; Fang, H.; Chen, M. Atmospheric correction of Landsat ETM+ land surface imagery. I. Methods. IEEE Trans. Geosci. Remote Sens. 2001, 39, 2490–2498. [Google Scholar] [CrossRef]
  62. Flood, N. Continuity of reflectance data between landsat-7 ETM+ and landsat-8 OLI, for both top-of-atmosphere and surface reflectance: A study in the australian landscape. Remote Sens. 2014, 6, 7952–7970. [Google Scholar] [CrossRef] [Green Version]
  63. Knapp, K.R.; Kruk, M.C.; Levinson, D.H.; Diamond, H.J.; Neumann, C.J. The international best track archive for climate stewardship (IBTrACS). Bull. Am. Meteorol. Soc. 2010, 91, 363–376. [Google Scholar] [CrossRef]
  64. CWB (Central Weather Bureau) Typhoon Database. Available online: https://rdc28.cwb.gov.tw/ (accessed on 25 November 2019).
  65. Funk, C.; Peterson, P.; Landsfeld, M.; Pedreros, D.; Verdin, J.; Shukla, S.; Husak, G.; Rowland, J.; Harrison, L.; Hoell, A.; et al. The climate hazards infrared precipitation with stations—A new environmental record for monitoring extremes. Sci. Data 2015, 2, 150066. [Google Scholar] [CrossRef] [Green Version]
  66. Retalis, A.; Tymvios, F.; Katsanos, D.; Michaelides, S. Downscaling CHIRPS precipitation data: An artificial neural network modelling approach. Int. J. Remote Sens. 2017, 38, 3943–3959. [Google Scholar] [CrossRef]
  67. Baatz, M.; Schäpe, A. Multiresolution Segmentation: An optimization approach for high quality multi-scale image segmentation. In Angewandte Geographische Informationsverarbeitung XII; Strobl, J., Blaschke, T., Griesebner, G., Eds.; Wichmann: Berlin/Heidelberg, Germany, 2000; pp. 12–23. [Google Scholar]
  68. Behling, R.; Roessner, S.; Segl, K.; Kleinschmit, B.; Kaufmann, H. Robust automated image co-registration of optical multi-sensor time series data: Database generation for multi-temporal landslide detection. Remote Sens. 2014, 6, 2572–2600. [Google Scholar] [CrossRef] [Green Version]
  69. Congalton, R.G. A review of assessing the accuracy of classifications of remotely sensed data. Remote Sens. Environ. 1991, 37, 35–46. [Google Scholar] [CrossRef]
  70. Mukaka, M.M. Statistics Corner: A guide to appropriate use of Correlation coefficient in medical research. Malawi Med. J. 2012, 24, 69–71. [Google Scholar]
  71. Weaver, K.F.; Morales, V.C.; Dunn, S.L.; Godde, K.; Weaver, P.F. An Introduction to Statistical Analysis in Research: With Applications in the Biological and Life Sciences; Wiley: Hoboken, NY, USA, 2017; ISBN 9781119301103. [Google Scholar]
  72. Dahiru, T. p-value, a true test of statistical significance? A cautionary note. Ann. Ibadan Postgrad. Med. 2008, 6, 21–26. [Google Scholar] [CrossRef] [PubMed] [Green Version]
  73. Costa, H.; Foody, G.M.; Boyd, D.S. Using mixed objects in the training of object-based image classifications. Remote Sens. Environ. 2017. [Google Scholar] [CrossRef] [Green Version]
  74. Merickel, M.B.; Lundgren, J.C.; Shen, S.S. A spatial processing algorithm to reduce the effects of mixed pixels and increase the separability between classes. Pattern Recognit. 1984. [Google Scholar] [CrossRef]
  75. Chen, C.-W.; Saito, H.; Oguchi, T. Rainfall intensity–duration conditions for mass movements in Taiwan. Prog. Earth Planet. Sci. 2015, 2, 14. [Google Scholar] [CrossRef] [Green Version]
  76. Quesada-Román, A.; Fallas-López, B.; Hernández-Espinoza, K.; Stoffel, M.; Ballesteros-Cánovas, J.A. Relationships between earthquakes, hurricanes, and landslides in Costa Rica. Landslides 2019. [Google Scholar] [CrossRef]
  77. Tao, T.; Chocat, B.; Liu, S.; Xin, K. Uncertainty Analysis of Interpolation Methods in Rainfall Spatial Distribution–A Case of Small Catchment in Lyon. J. Water Resour. Prot. 2009, 1, 136–144. [Google Scholar] [CrossRef] [Green Version]
  78. Guzzetti, F.; Mondini, A.C.; Cardinali, M.; Fiorucci, F.; Santangelo, M.; Chang, K.-T. Landslide inventory maps: New tools for an old problem. Earth-Sci. Rev. 2012, 112, 42–66. [Google Scholar] [CrossRef] [Green Version]
  79. Lin, W.T.; Chou, W.C.; Lin, C.Y.; Huang, P.H.; Tsai, J.S. Vegetation recovery monitoring and assessment at landslides caused by earthquake in Central Taiwan. For. Ecol. Manag. 2005. [Google Scholar] [CrossRef]
  80. Chou, W.-C.; Lin, W.-T.; Lin, C.-Y. Vegetation recovery patterns assessment at landslides caused by catastrophic earthquake: A case study in central Taiwan. Environ. Monit. Assess. 2008, 152, 245. [Google Scholar] [CrossRef]
  81. Guzzetti, F.; Peruccacci, S.; Rossi, M.; Stark, C.P. Rainfall thresholds for the initiation of landslides in central and southern Europe. Meteorol. Atmos. Phys. 2007, 98, 239–267. [Google Scholar] [CrossRef]
Figure 1. (a) Location of the study area in south-central Taiwan (R.O.C.; background data: © ESRI); and (b) the Butangbunasi landslide shown on a SPOT-5 satellite image from 9 September 2013.
Applsci 10 00630 g001
Figure 2. The Butangbunasi landslide area. (a) Unmanned aerial vehicle (UAV) image of the upper part of the Butangbunasi landslide. The image was taken on 13 June 2017. (b) UAV image of the temporary landslide-dammed lake at Butangbunasi and parts of the debris fan. The image was acquired on 29 April 2011. (c) Photograph of the Butangbunasi landslide from 15 November 2018. The photograph was taken from the Laonong river valley looking towards Butangbunasi; the actual landslide area is further up the tributary. The Butangbunasi debris fan, the former lake area, and the former landslide-dam area are indicated.
Applsci 10 00630 g002
Figure 3. Locations of the three selected CWB rain gauge stations shown on the Landsat image from 8 November 2018.
Applsci 10 00630 g003
Figure 4. Object-based image analysis (OBIA) landslide mapping results for Butangbunasi. The evolution of the landslide area from 1984 to 2018 is shown per Landsat image. Additionally, a landslide-dammed lake was detected on six of the images (2016, 2010, August 2008, 2000, 1992 and 1990).
Applsci 10 00630 g004
Figure 5. Time series of the Butangbunasi landslide area evolution and the dates of each typhoon event. The SSHWS category corresponds to the maximum category reached by the typhoon when crossing Taiwan. The mapped areas for the images corresponding to 12 December 1984 and 8 November 2018 are indicated. A locally estimated scatterplot smoothing (LOESS) curve (confidence interval 95%) is fitted to the time series for illustration purposes.
Applsci 10 00630 g005
Figure 6. Comparison of daily precipitation for Climate Hazards Group Infrared Precipitation with Station (CHIRPS; orange) and CWB (blue palette) data for the selected 19 typhoon events.
Applsci 10 00630 g006
Figure 7. Spearman correlation results between the Butangbunasi landslide area change and rainfall event parameters calculated for three CWB stations for selected typhoon events.
Applsci 10 00630 g007
Figure 8. (a) Recently reconstructed road next to Butangbunasi. The photograph was taken on 8 April 2014. (b) Road construction and maintenance work at Butangbunasi. The photograph was taken on 28 June 2011. (c) Excavation work at the lower part of the Butangbunasi debris fan in the Laonong river bed. The photograph was taken on 15 November 2018.
Applsci 10 00630 g008
Table 1. Landsat satellite images for the study area.
SensorAcquisition DateScene ID
Landsat 88 November 2018LC81170442018312LGN00
Landsat 84 December 2016LC81170442016339LGN01
Landsat 816 November 2015LC81170442015320LGN01
Landsat 803 June 2013LC81170442013154LGN01
Landsat 520 December 2010LT51170442010354BKT00
Landsat 512 September 2009LT51170442009255BKT00
Landsat 524 August 2008LT51170442008237BKT00
Landsat 517 March 2008LT51170442008077BKT00
Landsat 53 October 2005LT51170442005276BJC00
Landsat 517 September 2005LT51170442005260BKT02
Landsat 512 July 2004LT51170442004194BKT02
Landsat 714 September 2001LE71170442001257EDC00
Landsat 727 September 2000LE71170442000271SGS00
Landsat 51 November 1998LT51170441998305BJC00
Landsat 523 August 1996LT51170441996236CLT00
Landsat 53 September 1994LT51170441994246CLT00
Landsat 531 October 1992LT51170441992305BJC00
Landsat 510 October 1990LT51170441990283BJC00
Landsat 523 October 1989LT51170441989296BJC00
Landsat 512 December 1984LT51170441984347HAJ00
Table 2. Selected typhoon and tropical storm events for the study.
NameYearDate and Time 1Maximum SSHWS Category 2SSHWS Category 1 Distance to Butangbunasi Landslide (km) 1
Megi201627 September 2016 12:00H3H174
Nepartak20168 July 2016 03:00H4H158
Soudelor20158 August 2015 00:00H3H278
Talim201220 June 2012 12:00TSTS151
Fanapi201019 September 2010 06:00H3H116
Morakot20097 August 2009 18:00H1TS108
Fung-Wong200828 July 2008 00:00H2H264
Sepat200718 August 2007 00:00H3H346
Longwang20052 October 2005 00:00H4H285
Haitang200518 July 2005 03:00H4H3106
Mindulle20041 July 2004 12:00H1H181
Toraji200129 July 2001 18:00H3H380
Bilis200022 August 2000 15:00H5H447
Otto19984 August 1998 06:00H1H148
Gloria199626 July 1996 09:00H2H287
Tim199410 July 1994 12:00H4H470
Omar19924 September 1992 15:00TSTS56
Dot19907 September 1990 15:00H1H133
Sarah198911 September 1989 18:00H4H251
Note: 1 Variables selected from the closest point in the typhoon track to the centroid of the Butangbunasi landslide area; 2 Maximum Saffir–Simpson hurricane wind scale (SSHWS) category reached by the typhoon when passing over Taiwan. H = Hurricane, TS = Tropical Storm.
Table 3. Selected Central Weather Bureau (CWB) rain gauge stations.
Station CodeStation NameOperation PeriodLatitudeLongitudeElevation (m a.s.l.)Distance to Butangbunasi Landslide (km) 1
C1V200Meishan21 January 1992–Present23.2684120.82368708.3
C1V210Fuxing21 January 1992–8 March 201323.2224120.80597003.3
C0V210Fuxing18 April 2013–Present23.2224120.80617343.3
C1V220Xiaoguanshan22 January 1992–Present23.1542120.813617816.8
Note: 1 Distance calculated to the centroid of the Butangbunasi landslide area.
Table 4. Segmentation and classification parameters used for object-based landslide mapping.
DataParameters for Multiresolution SegmentationBands for SegmentationClassification Parameters
Landsat 5 (1984, 1989, 1990, 1992, 1994, 1996, 1998, 2004, September 2005, October 2005, August 2008, 2009, 2010)Scale parameter: 10;
Shape criterion: 0.1;
Compactness criterion: 0.4
blue, green, red, nir, brightnessMean NDVI < 0.5
Mean MSAVI < 0.7
Mean brightness > 20
Mean slope > 10°
Mean DEM > 650 m
Landsat 5 (March 2008)Scale parameter: 10;
Shape criterion: 0.1;
Compactness criterion: 0.4
blue, green, red, nir, brightnessMean NDVI < 0.4
Mean MSAVI < 0.6
Mean brightness > 20
Mean slope > 10°
Mean DEM > 650 m
Landsat 7 (2000, 2001)Scale parameter: 10;
Shape criterion: 0.1;
Compactness criterion: 0.4
blue, green, red, nir, brightnessMean NDVI < 0.6
Mean MSAVI < 0.75
Mean brightness > 20
Mean slope > 10°
Mean DEM > 650 m
Landsat 8
(2013, 2015, 2016, 2018)
Scale parameter: 150;
Shape criterion: 0.1;
Compactness criterion: 0.4
blue, green, red, nir, brightnessMean NDVI < 0.4
Mean MSAVI < 0.55
Mean brightness > 8000
Mean slope > 10°
Mean DEM > 650 m
Table 5. OBIA and manual mapping (MM) results, the difference between OBIA and manual mapping results, overlapping area and producer’s and user’s accuracy for each of the three selected Landsat images.
Landsat ImageClassOBIA Mapping (ha)Manual Mapping (ha)Difference OBIA—MM (%)Overlap Area (ha)Producer’s Accuracy (%)User’s Accuracy (%)
4 December 2016 (Landsat 8)Landslide382.30401.87−4.87357.0988.8693.41
Lake8.388.241.686.4478.1976.91
24 August 2008 (Landsat 7)Landslide164.19189.04−13.15155.9282.4894.96
Lake3.564.40−18.962.8665.0380.25
27 September 2000 (Landsat 5)Landslide119.75117.871.60101.4786.0984.73
Lake6.886.0413.774.3271.5062.85
Table 6. Summary statistics for rainfall parameters derived from rain gauges at three CWB stations.
Cumulative Rainfall (mm)Duration (h)Intensity (mm/h)
MFXMFXMFX
Mean419.39423.01514.2526.325.927.913.9714.3716.97
SD425.41440.16508.4716.016.515.36.246.088.33
Min69.0056.50132.0077106.314.717.76
Max1818.501914.002185.5076787628.8627.3436.93
Count171715171715171715
Note: CWB station symbols: M = Station Meishan, F = Station Fuxing, X = Station Xiaoguanshan.
Table 7. Landslide mapping results and derived rainfall parameters for each typhoon event.
Typhoon EventLandslide Area (ha)Landslide Area Change (ha)Lake Area (ha)CHIRPSCWB Stations
Daily Precipitation (mm/d)MeishanFuxingXiaoguanshan
C (mm)D (h)I (mm/h)C (mm)D (h)I (mm/h)C (mm)D (h)I (mm/h)
Megi382.3−13.588.38195.64229.502110.93448.502517.94491.502519.66
Nepartak134.0569.0079.8677.50711.07170.001017.00
Soudelor395.88−3.17-84.06373.002713.81554.002720.52525.002818.75
Talim399.053.42-163.54254.502012.73252.502012.63333.002115.86
Fanapi395.63−27.9420.97104.06217.602010.88241.101912.69311.202214.15
Morakot423.56259.38-120.971818.507623.931914.007824.542185.507628.76
Fung-Wong164.19−26.393.56208.01436.003014.53384.002913.24467.003015.57
Sepat190.5839.52-61.25517.504012.94474.504011.86483.504012.09
Longwang151.060.48-99.95184.001512.27175.101511.67---
Haitang150.5827.30-123.62846.504419.24903.004520.07---
Mindulle123.282.31-63.88736.003223.00252.501516.83869.503227.17
Toraji120.971.22-145.66577.102028.86574.102127.34738.502036.93
Bilis119.7523.416.88177.59314.102910.83341.602911.78393.003511.23
Otto96.34−21.45-75.87229.102011.46245.502012.28250.501913.18
Gloria117.823.72-116.11103.00119.3656.50124.71148.50197.82
Tim94.08−27.38-111.92104.50166.5392.60146.61132.00177.76
Omar121.4543.203.33179.54119.80196.31204.20248.51215.10258.60
Dot78.2515.815.3170.67---------
Sarah62.44−3.81-43.65---------
Note: C = Cumulative rainfall, D = Duration, I = Mean Intensity.

