Article

Low Thermal Conductivity Materials and Very Low Heat Power: A Demanding Challenge in the Detection of Flaws in Multi-Layer Wooden Cultural Heritage Objects Solved by Pulse-Compression Thermography Technique

1
Department of Industrial and Information Engineering and Economics, University of L’Aquila, 67100 L’Aquila, Italy
2
Department of Informatics, Modeling, Electronics and Systems Engineering, University of Calabria, Via P. Bucci, Arcavacata, 87036 Rende, Italy
3
Individual Company of Restoration (Gianfranco Gargiulo), Via Tiberio 7b, I-80073 Capri, Italy
4
Department of Engineering, Polo Scientifico Didattico di Terni, University of Perugia, 05100 Terni, Italy
5
Department of Biology, Ecology and Earth Science, University of Calabria, Via P. Bucci, Arcavacata, 87036 Rende, Italy
*
Author to whom correspondence should be addressed.
Appl. Sci. 2020, 10(12), 4233; https://doi.org/10.3390/app10124233
Submission received: 19 May 2020 / Revised: 12 June 2020 / Accepted: 16 June 2020 / Published: 20 June 2020
(This article belongs to the Special Issue Infrared Imaging and NDT)

Abstract

:
An inlay sample with artificial defects was inspected via the pulse-compression thermography (PuCT) technique. The sample belongs to the cultural heritage field, and it was realized by a professional restorer based on his long-time experience, imitating historical art crafting styles. The tesserae composing the inlay were not treated by any protective paints, so that external thermal stimuli may cause physical/mechanical alterations of the cell walls, with consequent colour changes, cracks, and eventually damage to its surface. To avoid any alteration of the sample, the PuCT technique was used for inspecting the inlay sample as it allows the heating power to be very low, while assuring enough thermal contrast for the defects to be detected after the exploitation of the pulse-compression algorithm. Even if a maximum ΔT slightly exceeding 1 °C was detected during the PuCT test of the inlay sample, it is shown that this is enough for detecting several defects. Further, image processing based on the Hilbert transform increases defect detection and characterization. In addition, a novel normalization technique, i.e., a pixel-by-pixel data normalization with respect to the absorbance estimated by considering a characteristic value of the compression peak, is introduced here for the first time. The proposed normalization enhances the defect detection capability with respect to the standard pixel-by-pixel amplitude visualization. This has been demonstrated for two experimental setups, both exploiting the same LED chips system as heating source but different thermal camera sensors, i.e., one in the mid-infrared spectrum, the other in the far infrared one. Thus, the present work is also the first small-scale test of a future portable system that will include low-power LED chip feed in DC by metal-oxide-semiconductor field-effect transistor (MOSFET) devices, and a handy far-infrared camera.

1. Introduction

In recent decades, strong efforts have been put into the research of innovative techniques in the field of physics and chemistry applied to cultural heritage (CH) for diagnostic and conservations, based on both the applications of new materials and investigation methods. The main challenge in the CH field is obtaining the greatest quantity of information without provoking any damage to the inspected yet irreplaceable good, i.e., finding an efficient method for diagnostics without modifying their aesthetical appearance. Physical features concerning defects present in such types of objects are obtained using a variety of diagnostic techniques, among which infrared thermography (IRT) is one of the most effective for gathering information about the inner structure of the samples [1].
In particular, optical techniques, such as holographic interferometry (HI), decorrelation, shearography, electronic speckle pattern interferometry (ESPI) and IRT, were used in [2] for artwork diagnostics, while some of these were applied in combination with post-processing algorithms to improve the defect detectability in different CH samples [3,4,5,6,7,8]. Moreover, processing methods working in the infrared spectrum have been described and applied by Vrabie et al. [9], Gavrilov et al. [10,11], Bendada et al. [12] and Sfarra et al. [13]. In this scenario, a novel strategy based on modulating the heat source via a pseudo-random binary excitation was used in [14] to reduce the risk associated with the use of high-power heating source. The goal of the work was to develop an automatic scheme for detecting faults in the captured images. An efficient scheme based on wavelet subspace decomposition was used, which helped in the identifying of otherwise invisible weaker faults. A new contrast enhancement metric was developed to demonstrate the quantitative efficiency of the algorithm.
Subsequently, Buctha et al. applied the lock-in technique to shearography [15], Sfarra et al. [16] described the potentialities of infrared vision to explore sub-surface defects in polychromatic statues, and Peeters et al. studied CH objects in different sub-spectral infrared bands by using macroscopic reflection mode Fourier transform infrared (MA-rFTIR) [17].
Palomar et al. performed active IRT analysis of two stained-glass windows, considering also the possibility to apply the method on in situ characterization [18], while Stamatopoulou et al. [19] inspected the N. Kessanlis “Erotica” photosensitized cement with the aim of developing an integrated methodology for a full-field investigation of complex contemporary artworks.
More relevant to the work here introduced, Laureti et al. [20] used the pulse-compression thermography (PuCT) technique, using low power light-emitting diode (LED) chips, whose emission was modulated via a pseudo-noise sequence. This approach minimized the heat radiated onto a painted surface while assuring high inspection capabilities. Hyperspectral imaging was employed to detect surface and subsurface features, such as pentimenti and facial contours. The best results obtained by both techniques and post-processing methods (principal and independent component analyses) were fused together. In [21], PuCT and hypercolorimetric multispectral imaging (HMI) were combined for the diagnostic study of historical heritage, providing information on the whole structure of the artworks, identifying surface degradation, different layers, and wood defects and their location within the inner layers of the object. It should be noted that Bodnar et al. [22] proposed for the first time the use of pseudo-noise excitation and the auto regressive moving average (ARMA) system identification method for the detection of detachments in mural paintings.
Other research works concerning the application of non-destructive testing (NDT) in various types of wood pieces assembled together can be found in [23,24].
Such a non-exhaustive and brief review is aimed at helping the reader understand how important the IRT is for the conservation of artefacts, being either painted or unpainted.
In the present research work, IRT is applied on a wood inlay exploiting PuCT. The challenge here is to use a low-power excitation via LED chips to inspect a sample with low thermal conductivity, there being no doubt that wood is a thermal insulator, especially when dry, and a natural anisotropy material. The wooden material’s natural insulating capacity inhibits the transmission of heat. Sometime, pockets of trapped air may be generated at the consecutive interfaces of multi-layer wooden materials, which were here exacerbated, becoming defects in terms of size, since they resemble natural splitting. This type of defect, along with others, was produced in the inlay sample described in Section 3.
During the IRT inspection of insulating materials, a non-expert in the field may incorrectly think that the higher the ΔT induced at the sample’s surface, the higher the capability of defect detection. In fact, the defect detection capability, that is related to the signal-to-noise-ratio (SNR), is not directly proportional to the absolute ΔT, but it strongly depends on how, and when, this ΔT is achieved.
In active IRT [1], an artificial thermal stimulus is employed to induce a thermal contrast, allowing the subsurface defects to be detected. In general, the time of observation is inversely proportional to the thermal diffusivity value, while the loss of thermal contrast is inversely proportional to the cube of the defect depth [25,26]. In more detail, thermal waves are introduced to explain the heat propagation within a sample, and they behave like evanescent ones, i.e., their amplitude decreases exponentially during propagation. The higher the frequency of the waves, the larger the exponential attenuation, and the faster the propagation of the velocity. Therefore, an optimal design of the excitation heating signal must consider the physical and geometrical characteristics of the sample, so as to maximize the inspection capabilities.
However, this optimization process is constrained: both an extended yet constant or a brief high-power heating stimulus may lead to a modification of the original wood’s nature. This unwanted thermal modification affects both the color and the chemical composition of wood. In terms of color, thermal modifications affect key support components of the wood, such as lignin, cellulose and hemicellulose. Color is a very important wood property, because its homogeneity determines the appearance of the final product [27]. For this reason, such characteristics must be preserved over time and during IRT inspections, which should fall into the non-destructive category.
In this framework, a good trade-off, for detecting subsurface defects in a multi-layer component without compromising the aesthetic beauty of the artefact itself, is the use of the PuCT technique, introduced in 2018 by some of the present authors as an efficient IRT scheme for inspecting painted cultural heritage objects [28].

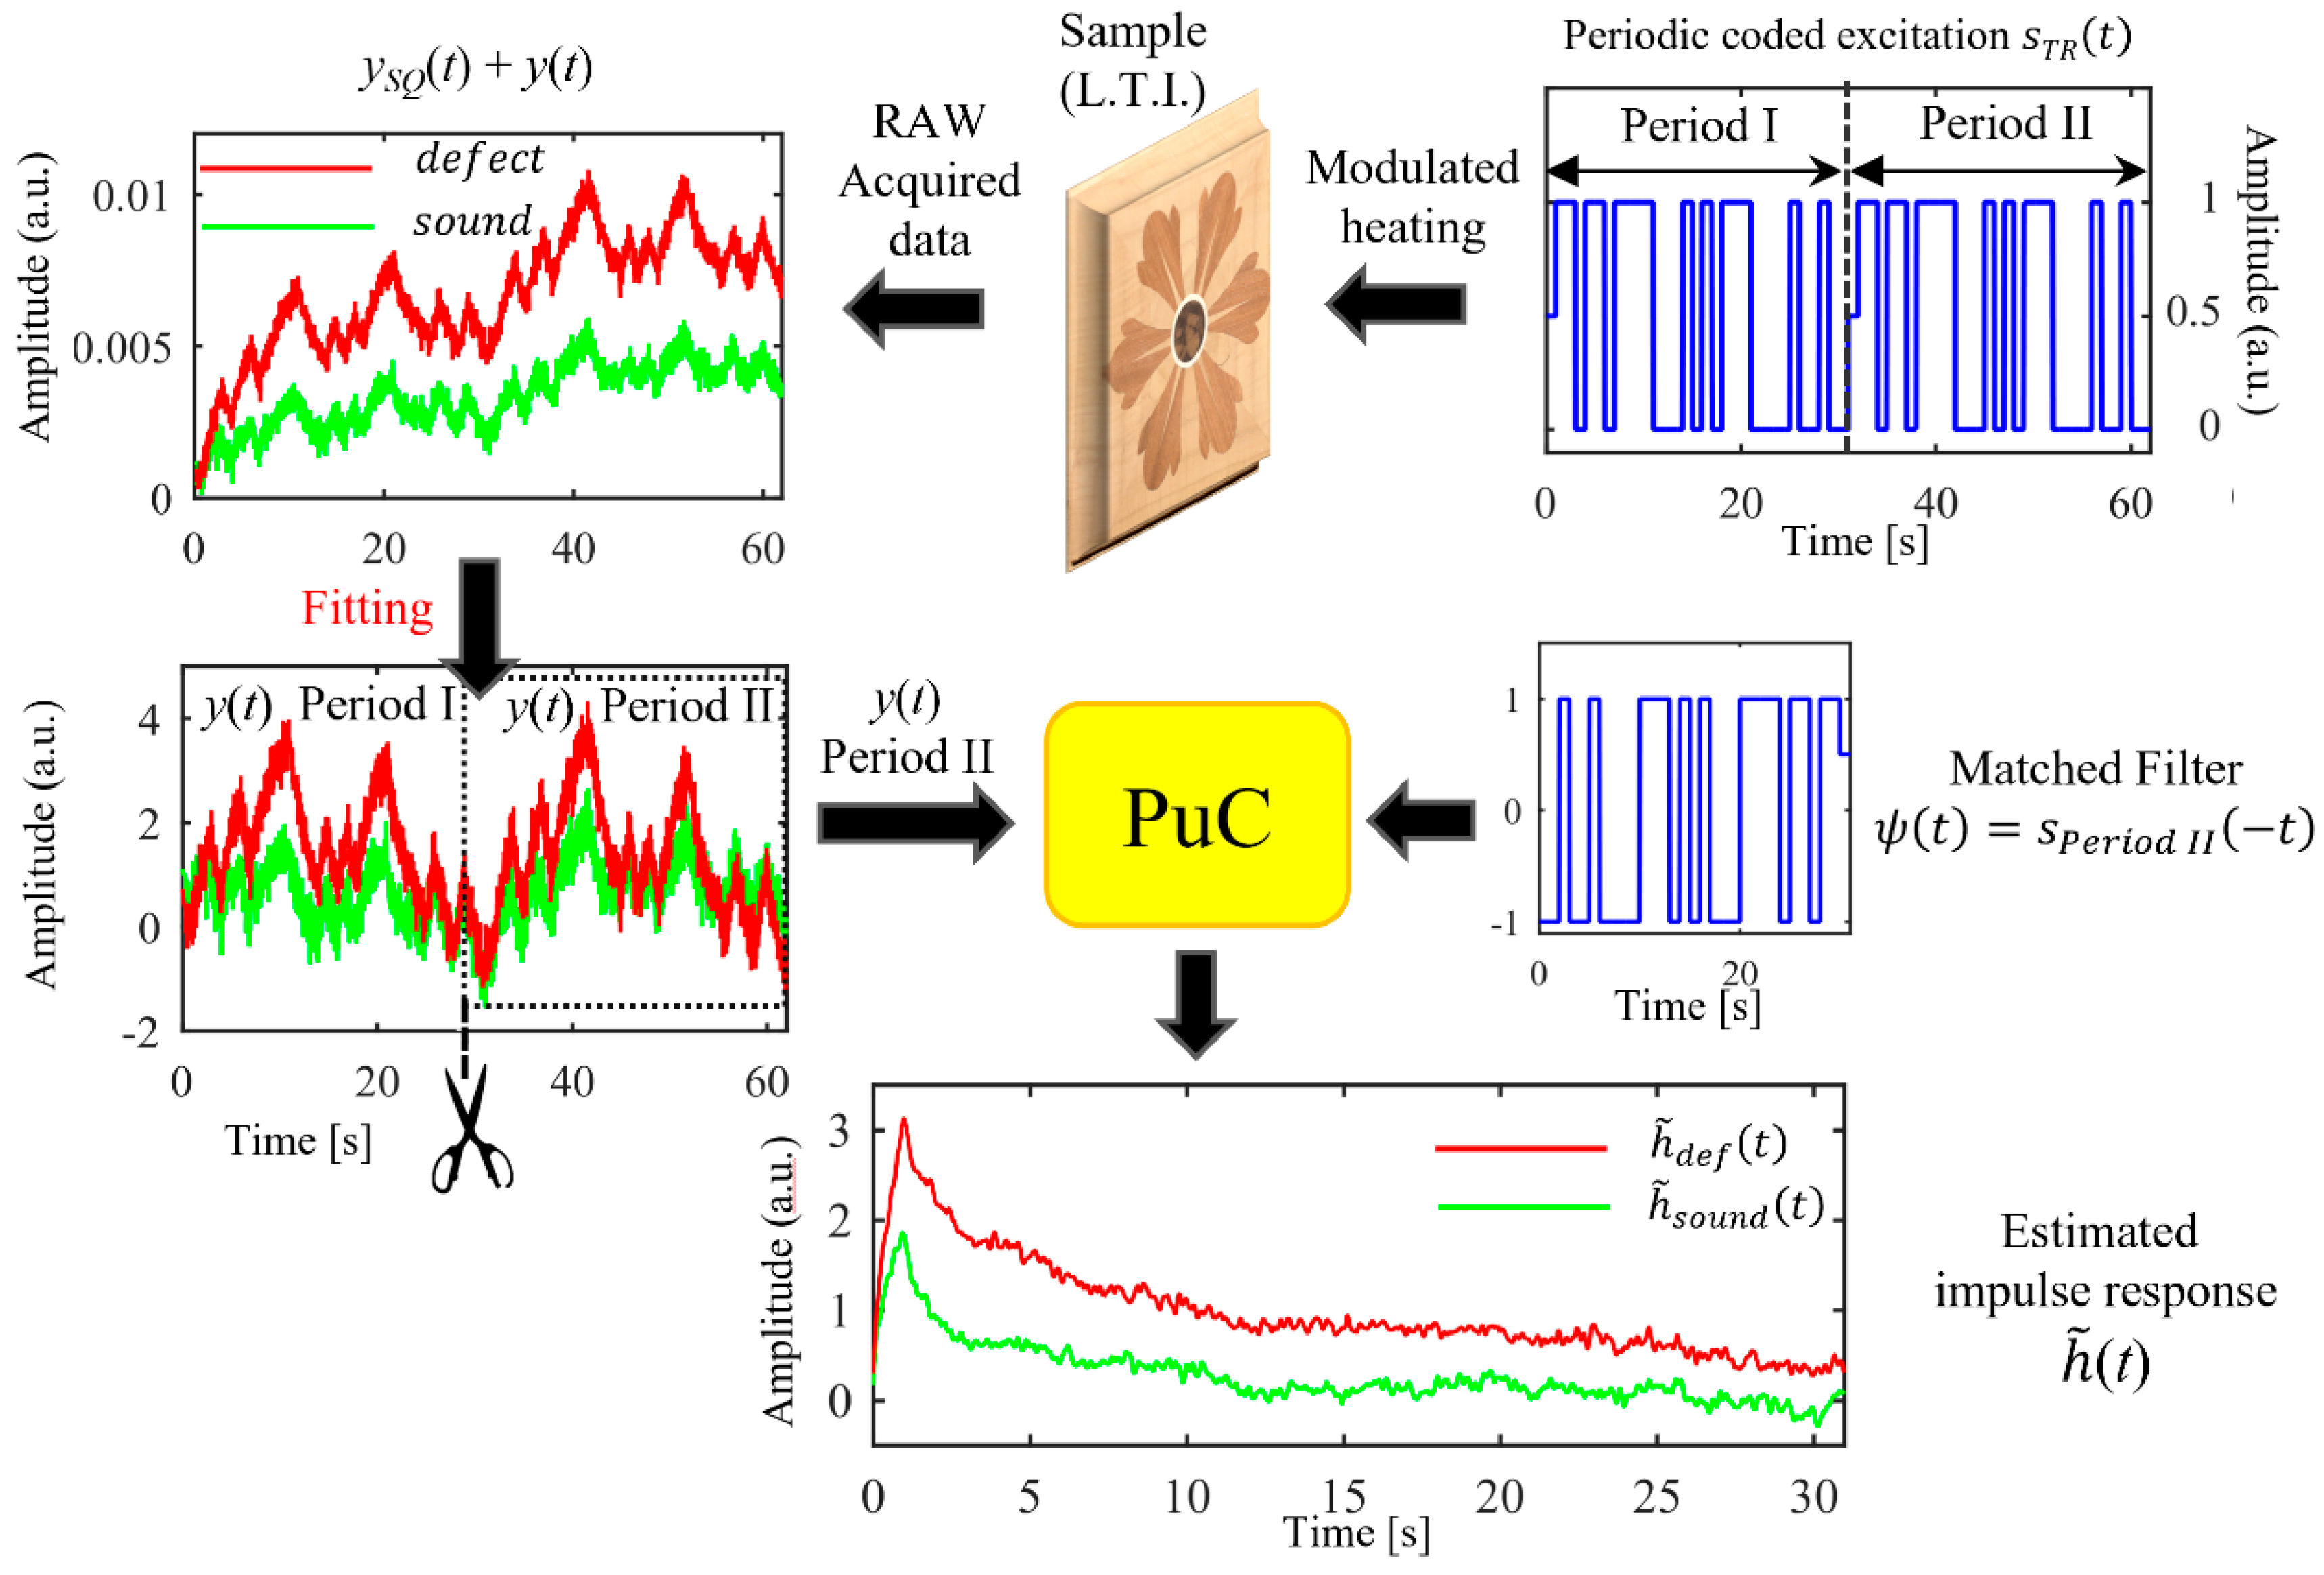
2. Pulse-Compression Thermography (PuCT)

Historically, pulse-compression (PuC) was introduced in radio detection and ranging (RADAR), and later applied in acoustic, SONAR and several NDT techniques, including IRT, an example being PuCT [20,21,28,29,30,31,32,33,34,35,36,37]. In this paper, the PuCT is used for minimizing the temperature increment ΔT of the sample surface while assuring enough SNR at the same time.
By adopting the system theory approach, the PuC is a measurement technique for characterizing a linear time-invariant (LTI) system by estimating its impulse response. The peculiarity of this approach, with respect to the more traditional ones, e.g., using a short-pulse or a step excitation, is that coded signals are employed to modulate the heat source. This in turn introduces high control of both the delivered power and the excitation bandwidth, so that these can be chosen to both optimize the defect detection and minimize the temperature increment of the sample.
The basic theory underlying PuC is introduced below, together with a step-by-step guide for replicating the experimental activity, highlighting also the differences with respect to standard active IRT excitation schemes. For a thorough overview of the PuC, the reader is referred to the above-cited research.
As the starting point to introduce the PuC algorithm, it should be considered that pulsed-thermography (PT) [38] is the most common yet effective approach used in active IRT. High-power flash lamps are used in PT for exciting the sample, provoking a quick change of the sample’s surface temperature. The flash duration is significantly shorter than the typical heat diffusion time duration within the sample, so that the heating is quasi-instantaneous, while the cooling trend is regulated by the local thermal properties of the inspected sample, i.e., specific heat, density and thermal conductivity [39,40].
By adopting again the system theory approach, the pulsed excitation is a good approximation of the Dirac Delta function δ ( t ) , thus an impulse response h ( t ) is directly obtained for each ( j x , j y ) pixel captured via an infrared (IR) camera as time elapses. The presence of defects/anomalies can be inferred either via frequency and/or time domain analysis. In other words, the LTI system is completely described by its impulse response h ( t ) , thus the sample under test (SUT) is completely characterized by measuring the set of its { h ( j x , j y , t ) } . PT is thus a very powerful, reliable and simple (perhaps expensive) method for inspecting a huge variety of samples. However, the main drawback in applying PT for inspecting artworks and CH goods is that the achieved SNR level is directly related to the flash lamp power. In common NDT applications, PT is carried out by using systems of high-power flash lamps, which are commonly capable of providing several kJ of energy within a few millisecond (ms), meaning that a potential thermal shock can be provoked onto the CH sample’s surface [21,28]. Furthermore, if the flash power is increased more than enough to ensure the needed SNR, non-linear phenomena can be originated, a fact that must be completely avoided when dealing with CH items. Moreover, the onset of a non-linear behavior limits the use of PT data to build prognostic models that can be useful for further analysis. For these reasons, it is highly desired to unlink the final SNR from the heat source peak power and spread the overall amount of energy over a longer time interval. One can argue that this can be achieved by using step-heating or lock-in, another two conventional active IRT techniques, but such methods are not able (lock-in) or good enough (step-heating) to retrieve the SUT’s impulse response (the provided information is limited). This fact highlights another challenge in IRT inspection of CH items: these items are usually hand-made, multi-layer, complex structures, built-up with inhomogeneous materials and with an inherent variation of the local properties (color, material, curvature, etc.). To evaluate the presence of flaws, cracks, alterations, etc., one must be able to distinguish between true defects and the intrinsic variability of the structure. Hence, gathering as much information as possible is of utmost importance in CH inspection, as is avoiding any physical alteration of the item.
In this framework, the use of coded modulated heating stimuli in combination with the PuC algorithm, i.e., PuCT, showed promise for achieving the desired SNR while inferring a high number of features from the impulse response analysis. The desired SNR is achieved by just increasing the time duration T of the coded heating stimuli, meaning that (i) low-power heat sources such as LED chips can be used, and (ii) the low temperature increment ΔT can be maintained (the overall amount of energy is spread over a longer time with respect to PT). The desired information is retrieved by exploiting the PuC algorithm.
Practically, PuC relies on the existence of a pair of signals { s ( t ) ,     ψ ( t ) } , such that their convolution (denoted with “ ”) δ ˜ ( t ) , well-approximates the δ ( t ) . See Equation (1):
s ( t ) ψ ( t ) = δ ˜ ( t ) A δ ( t ) ,
wherein s ( t ) is a coded signal having time duration T and bandwidth B, ψ ( t ) is the so-called matched filter and A is a constant proportional to the energy of s ( t ) .
If s ( t ) is employed for modulating the heat source emission state, i.e., any on/off emission state, and y ( t ) = h ( t ) s ( t ) is the output signal captured by the IR camera, an estimate h ˜ ( t ) of the impulse response h ( t ) is retrieved by convolving y ( t ) with ψ ( t ) . This procedure is carried out for each point x–y of the captured thermograms, thus resulting in a collection of N x × N y impulse responses h ˜ ( j x , j y , t ) , where N x and N y are the amount of collected pixels along the x–y directions respectively. The overall PuC process is shown in Equation (2) for a single pixel of the acquired thermograms, wherein the presence of Additive White Gaussian Noise (AWGN) e ( t ) is also considered:
h ˜ ( t ) = y ( t ) ψ ( t ) = h ( t ) s ( t ) ψ ( t ) = A δ ˜ ( t ) + e ( t ) ψ ( t ) = e ˜ ( t ) = h ( t ) δ ˜ ( t ) + e ˜ ( t ) A h ( t ) + e ˜ ( t ) .
e ( t ) is here assumed as being uncorrelated to the ψ ( t ) . If this condition holds, then the instantaneous power of the noise after PuC also increases by a factor A, i.e., V a r ( e ˜ ( t ) ) ~ A   V a r ( e ( t ) ) [41]. This gives an insight into the SNR intrinsic gain mechanism of the PuC: while the estimated impulse response amplitude is multiplied by a factor A, the equivalent noise amplitude is multiplied by a factor A , hence the SNR gain in the reconstructed impulse response is proportional to A itself, i.e., to the excitation energy. Therefore, an arbitrary SNR gain can be achieved by tuning B and T. However, there are some drawbacks in employing PuC. B is limited by the SUT and the measurement system and T is limited by practical constraints, like limited measurement time, as well as physical ones, i.e., in IRT, the longer the measurement time is, the longer the unwanted effect of lateral diffusion is. Further, due to the limited values of T and B, “side-lobes” are always present in δ ˜ ( t ) , so that h ˜ ( t ) could exhibit some mathematical noise [29,30]. With the aim of mitigating the extent of the side-lobes, different strategies have been proposed in the literature, which differentiate depending on the coded excitation used, i.e., whether it is a frequency modulated chirp signal or a phase modulated one. In the former case, the use of window functions for smoothing the amplitude of the matched filter and/or the coded input signal, or the use of a tailored ψ ( t ) designed according to the Wiener filter theory, is highly beneficial [29,30,37,42,43,44]. In the latter case, periodic excitation or a pair of twin sequences can be used [45].
In both cases, it can be demonstrated that the maximum SNR is obtained when ψ ( t ) = s ( t ) [41], where s ( t ) is the time-reversal of the input signal s ( t ) .
Further, it must be noted that a suitable coded signal for PuC is usually a bipolar one, having no DC component present, i.e., zero or close to zero mean, a good example being PuC-based ultrasonic inspections performed via piezo transducers [31,44]. Conversely, the difficulty in realizing a bipolar heating source for IRT application leads to an actual excitation signal y T R ( t ) :
y T R ( t ) = h ( t ) s ( t ) + h ( t ) s S Q ( t ) + e ( t ) = y ( t ) + y S Q ( t ) + e ( t ) .
Comparing Equations (2) and (3), the contribution of y S Q ( t ) from y ( t ) must be removed before applying the PuC algorithm. This can be done by using an optimized non-linear fitting function [29].
In this work, a Legendre pseudo-noise binary sequence was selected and employed as the coded signal s ( t ) modulating the LED system’s heat emission. Legendre sequences are known for allowing an almost perfect reconstruction of the δ ( t ) when used in cyclic convolution mode. The mathematical details of such sequences, as well as the pros of the cyclic convolution process, can be found in Hutchins et al. [45] and Ricci et al. [46].
The various steps of the here-employed PuCT procedure are listed below, and graphically summarized in Figure 1 for two acquired pixels on thermogram, over a sound and a defected area, respectively.
(1)
The sample is excited via a periodic (two periods) Legendre sequence-modulated heating stimulus of order 31, each bit having a duration of 1 s, leading to an overall duration of the stimuli T = 62 s;
(2)
Thermograms are acquired for an overall time interval T;
(3)
The step-heating removal procedure (Fitting) is applied pixelwise to the y T R ( t ) = y S Q ( t ) + y ( t ) of the acquired thermogram sequence for obtaining y ( t ) ;
(4)
The PuC algorithm is performed by convolving only the second period of y ( t ) with ψ ( t ) , thus retrieving h ˜ ( j x , j y , t ) , as for Equation (2). Note that ψ ( t ) is just the time reversal of a single period of the periodic Legendre sequence.

3. Material and Methods

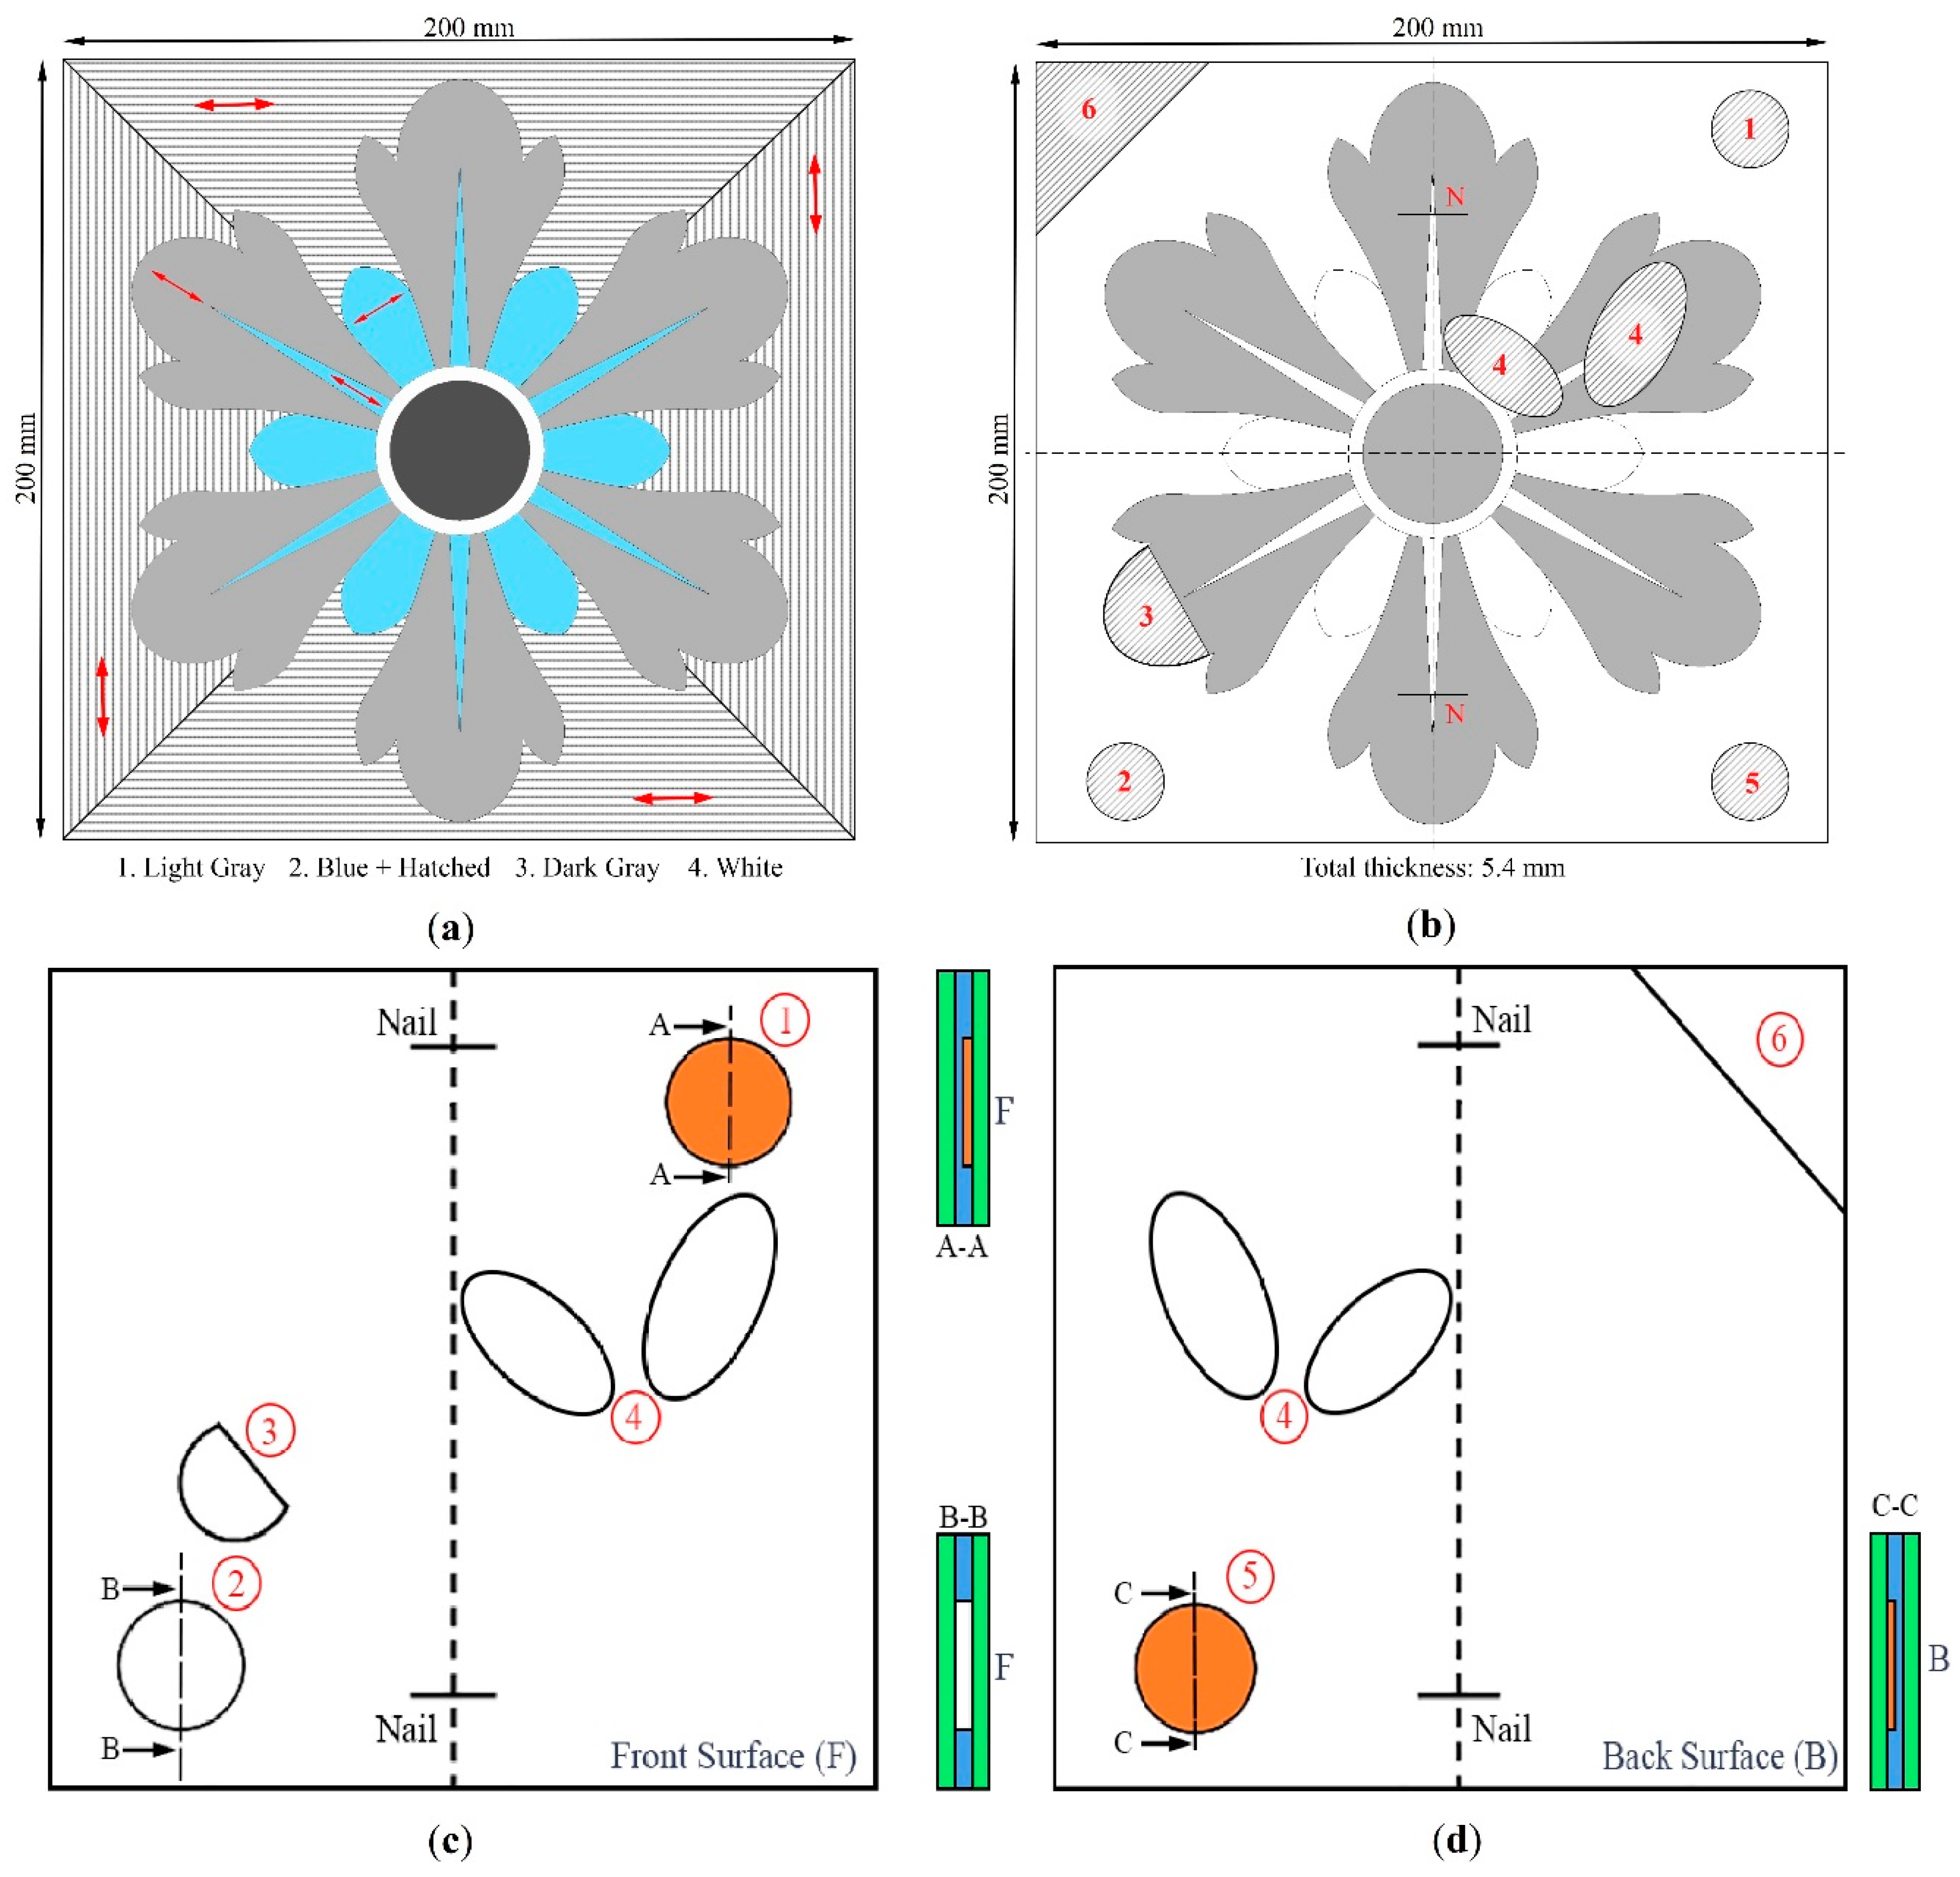
3.1. Sample Realization

The realization of the inlay sample shown in Figure 2 followed a very complex procedure. A series of machinery and power tools were used. In particular, a jigsaw (Dremel, Mt. Prospect, IN, USA model: scroll station 1800-1/5, CE), a wire and thick planer (Jet, La Vergne, TN, USA, model: jpt 310, CE), a cross-cut saw (Compa Tech, Carpi, Italy, model: 300 jet, CE), a band saw (Minimax, San Marino, Republic of San Marino, model: s/45, CE), a drill press (Woodman Taladro Columna, Melbourne, Australia, model: DP-250A 186, CE), and a drill (Hitachi, Tokyo, Japan, model: dv18dcl2, CE) were used for manufacturing the wooden sample. The sample was realized following an ancient technique, called “element by element” [47], and a detailed preparatory drawing was needed for its realization. In addition, a rabbit glue helped to hold in place the temporary support paper pieces, while a stronger glue was employed for the mahogany veneer and the inlay. The dimensions of the realized wood item were 200 mm × 200 mm × 5.4 mm. Concerning the artificial defects, two nails were added in the middle layer; a stucco made of diluted strong glue and chopped vegetable charcoal was used to realize a subsurface flaw simulating a splitting; and a pine wood, filling the function of support, was selected by the restorer. Three holes were made: (i) a through-thickness hole named “2” in Figure 2b,c, (ii) hole having a diameter of 14 mm affecting half the thickness of the middle layer facing the front side, filled by stucco and named “1” in Figure 2b, and (iii) a hole having the same diameter but this time affecting half the thickness of the middle layer facing the back side, named “5” in Figure 2d. At the geometrical center of the sample, a flower (height: 170 mm) was drawn by using four types of wood (blond walnut, mahogany, maple and root of soft walnut). The restorer considered the directions of the consecutive wood grains (marked by arrows in Figure 2a) as is usual in inlay works. Figure 2a,b consider only the fabricated (i.e., splittings, voids and the inclusion of iron and stucco) and natural (i.e., subsurface knots, referred to as “4” in Figure 2b–d) defects, while Figure 2c,d provide their locations with respect to the front (i.e., the tessellatum layer) and the back side, respectively. Defect 2 affects the whole middle layer (Figure 2c), that is, the core (thickness: 4 mm), of the sample and is put between two external skins layers (thickness: 0.7 mm, each). The external skin layers are shown in Figure 2c,d in green, while the middle layer is depicted in a blue color. The size of the nails was 14 mm × 1.6 mm, each. A non-stick paper helped the realization of splitting 3 (Figure 2b,c) and splitting 6 (Figure 2d), which can be considered as surface and subsurface flaws respectively, with respect to the tessellatum layer.

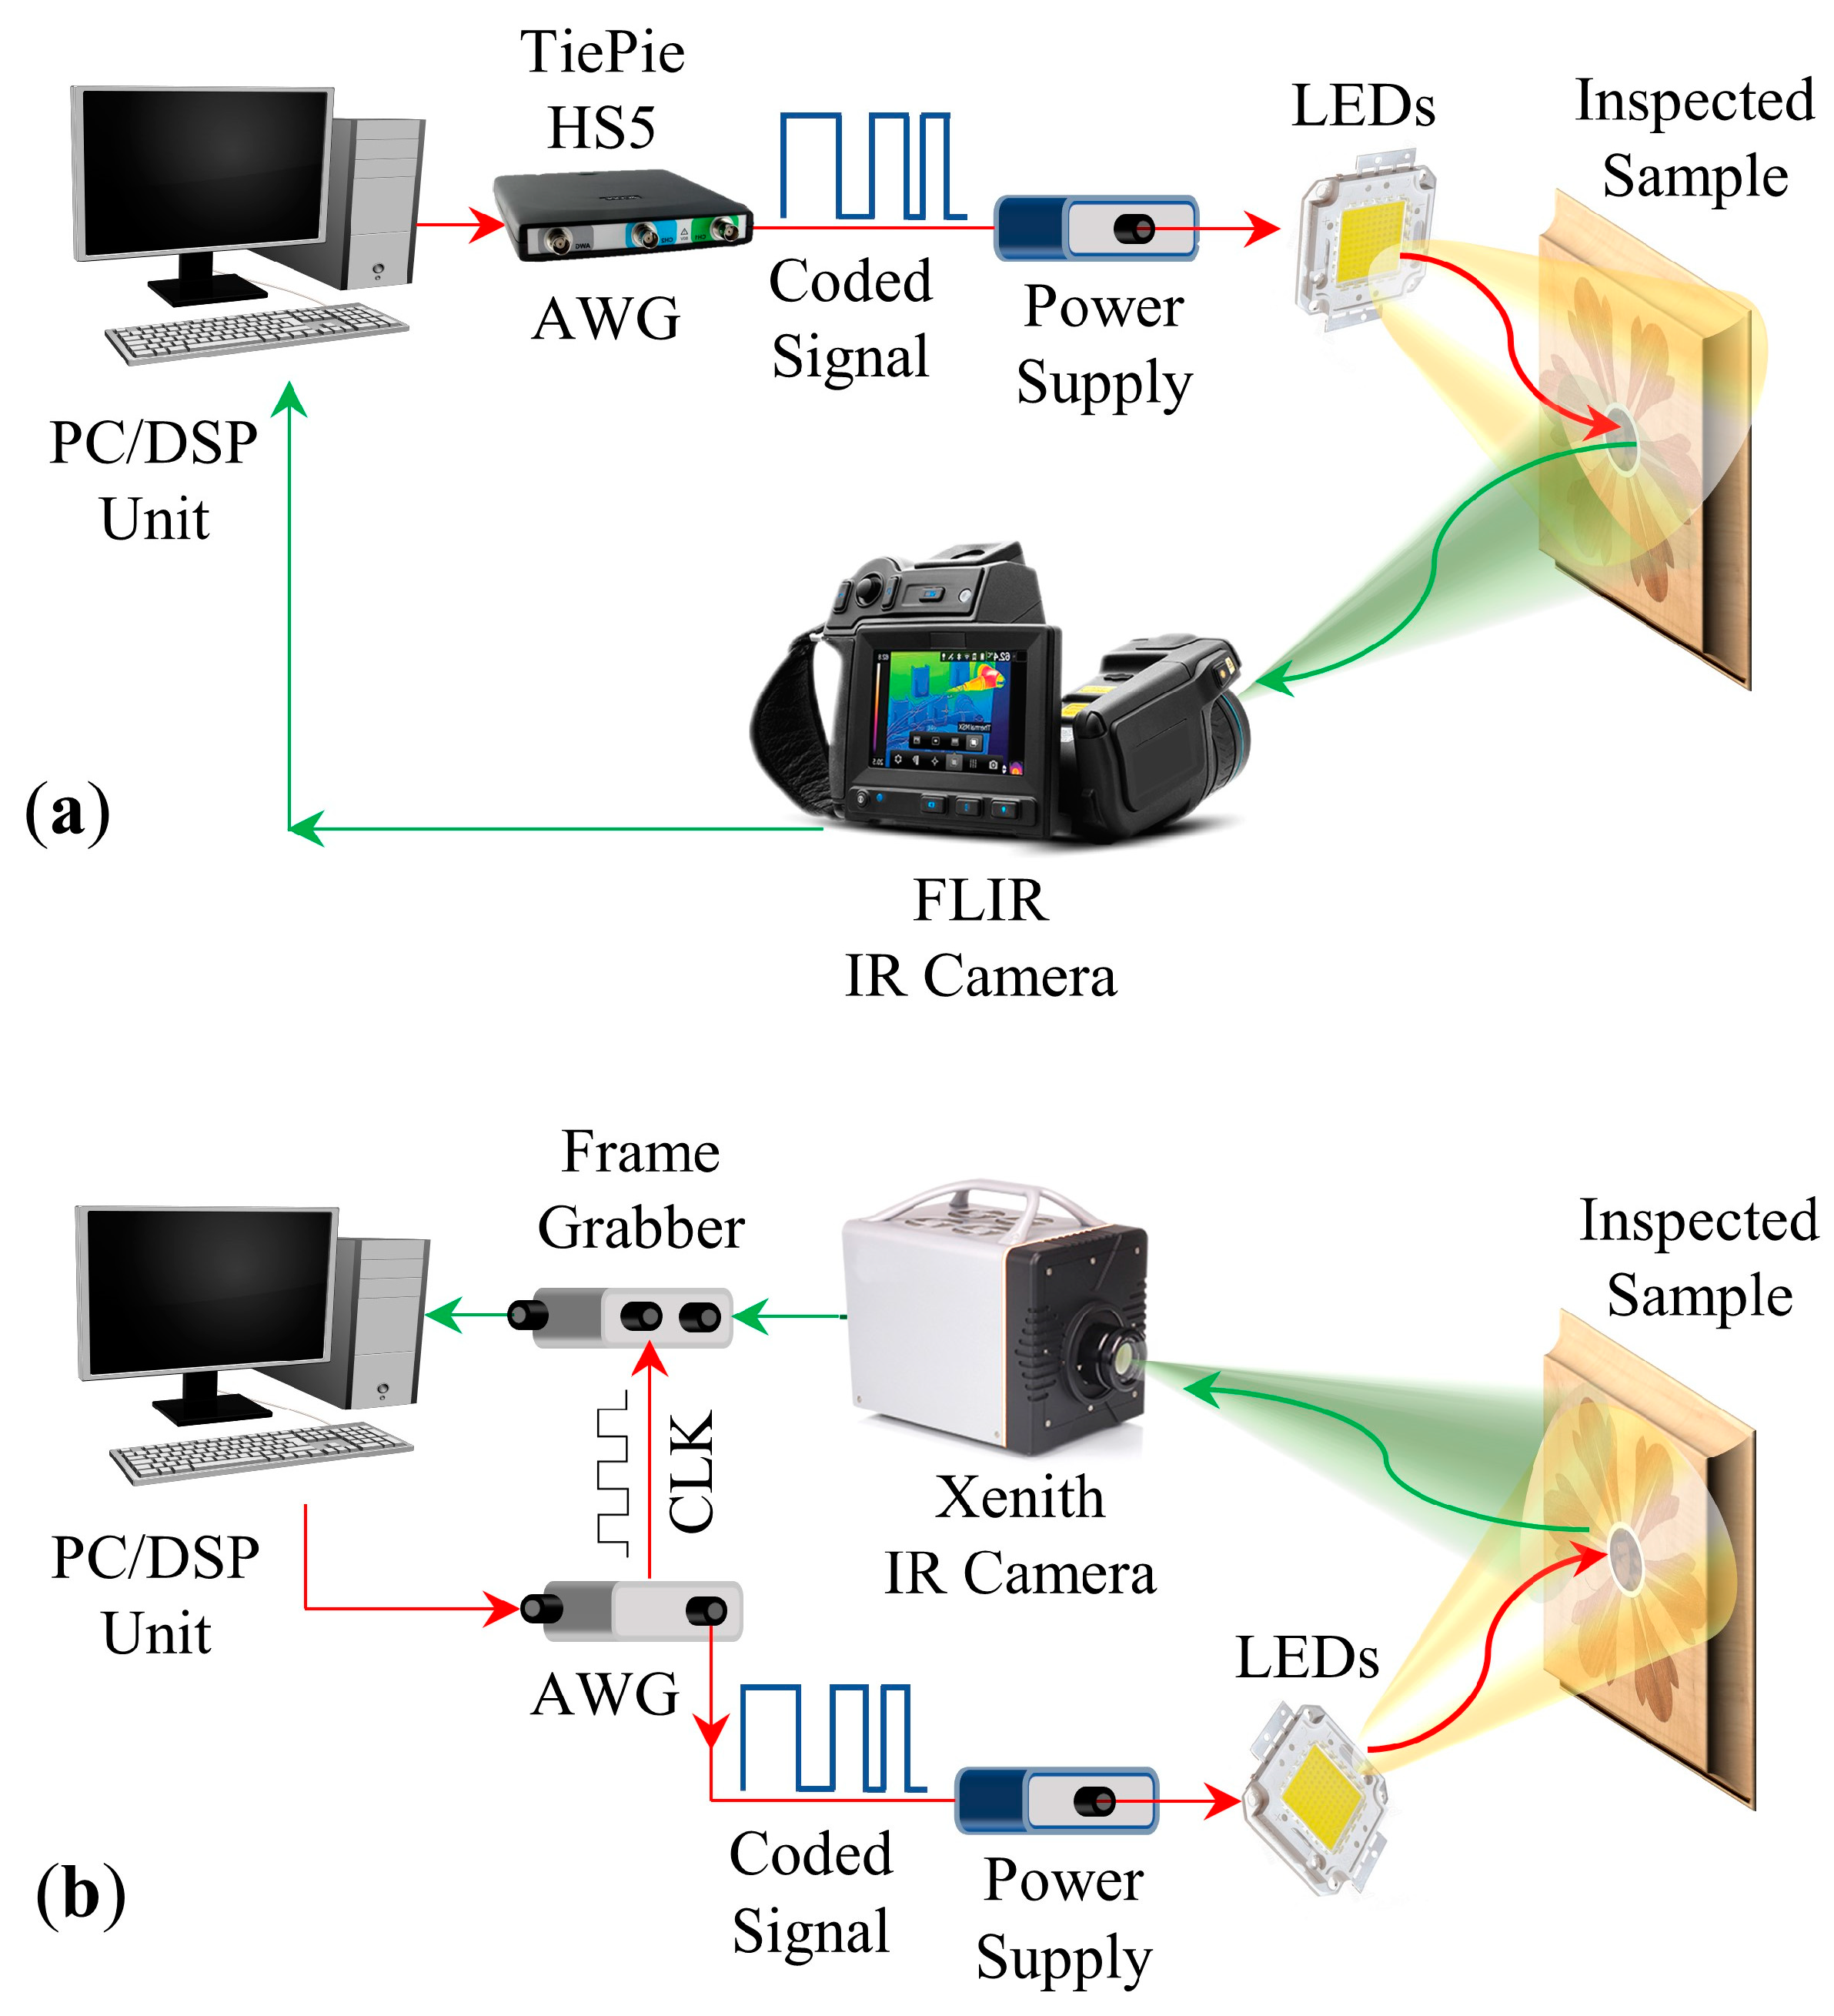
3.2. Experimental Setups

Two experimental PuCT setups have been used for inspecting the wood sample. Both setups employed the same LED chips and power supply, the main difference being the IR camera used.
The first experimental setup is shown in Figure 3a. This made use of an uncooled FLIR Systems T660 (Wilsonville, OR, USA) camera (640 × 480 pixels) in the far-infrared, connected to a PC/Digital Signal Processing (DSP) unit via USB connection. A TiePie HS5 HandyScope (TiePie Engineering, Sneek, Netherlands) was employed as an arbitrary waveform generator (AWG) to get the coded signal excitation and feed a TDK Lambda GEN 750 W power supply (TDK Corporation, Tokyo, Japan), which in turn powered the LED chips with an nominal maximum power of 400 W. The camera was placed in reflection mode, i.e., at the same side of the LED chips, and thermograms were recorded at 30 FPS. The distance between the camera/LED chips and the sample was about 800 mm. This setup was used for both measuring the surface temperature increment during the provided coded stimuli, and to perform PuCT measurements.
The other setup is shown in Figure 3b. It is the same as the above-described setup, but a National Instrument PCI-6711 AWG board (National Instruments company, Austin, TX, USA) and a National Instrument 1433 Camera Link Frame Grabber were used to connect the IR camera to the PC/DSP unit and to manage the TDK Lambda GEN 750W power supply. The mid-IR camera was a Xenics Onca-MWIR-InSb IR (320 × 256 pixels). The thermograms were acquired at 40 FPS. An ad-hoc developed LabVIEWTM virtual instrument managed the signal generation/acquisition of both setups.

4. Discussion

Figure 4 shows some typical characteristics of raw thermograms acquired during the application of the employed Legendre pseudo-noise thermal excitation. Figure 4a reports the temperature trends, i.e., the y T R ( t ) curves, corresponding to three different points of the SUT collected by using the setup shown in Figure 3a, that is, the FLIR T660 camera. It can be noted that the heat power was so small that a maximum ΔT of 1 °C was achieved after 62 s of excitation for all the three considered pixels. The temperature gently rose as time elapsed, thus avoiding any possible risk to the SUT. Some defects can be barely detected by analyzing the raw thermograms, but low values of image SNR were reached.
In contrast, Figure 5 shows the results obtained after the implementation of the PuC procedure detailed in Figure 1. After PuC, the “equivalent” temperature rise is quick and significantly larger than in the raw data case (see Figure 4b). This ensured the higher SNR and defect detection capability, as evident in Figure 5c and Figure 6, where some selected thermograms obtained after PuC at different time instants are reported. The defect “2”, the splitting “B”, the wood grain and the subsurface knots are visible.
To compare the two experimental setups, and thus the use and effectivity of a long-wave (setup (a) and a middle-wave (setup (b) IR camera, Figure 7 and Figure 8 depict the PuCT results obtained by processing the raw data collected with setups (a) and (b), using the same excitation parameters and LED chips system.
Although very similar results were obtained, the use of the middle-wave IR camera results in a better discrimination between outer and inner structures. The subsurface defects, the knots and the wood grain appear with more contrast by using setup (b), and the inlay pattern disappears almost completely as the time elapses. Conversely, the inlay pattern is always well evident using setup (a). From these preliminary results, we cannot conclude whether this is due to the spectral bandwidth or to the type of sensor used (bolometers for the FLIR T660 vs photodiodes for the Xenics), or that this is related to the type of sensor cooling, but is just a practical observation that corroborates other unpublished tests on historical paintings and wall paintings made with the same setups.
Moreover, Figure 5, Figure 6, Figure 7 and Figure 8 show that the darker parts of the inlay increase in temperature more than the lighter ones (see the picture of the sample in Figure 1 and Figure 3). This is something expected for a heat stimulus provided by a light source where the color is related to the absorbance, and this is why the inlay drawing is clearly visible at the maximum temperature rise after PuC, i.e., around t = 1.5 s. Although on one hand this can make surface defects easier to identify, it may hamper the detection of defects, inhomogeneities and voids buried at deeper depths within the inner structure, that could be overshadowed by the surface pattern.
To tackle this problem, the Hilbert transform, introduced in [35], was applied pixelwise to extract the time-phase feature pixelwise in [21]. The same analysis was repeated here for the inlay data. Time-phase is quasi-insensitive to local variations of surface emissivity due to different colors, materials, thicknesses, etc., which is analogous to the phase in pulsed phase thermography (PPT) or lock-in thermography. Hence, it can help achieve a better detection of subsurface defects.
Figure 9 reports the time-phase thermograms obtained by applying the Hilbert transform to the PuCT data depicted in Figure 5, Figure 6, Figure 7 and Figure 8. The time-phase feature allows the inlay surface pattern (i.e., in first approximation, the surface emissivity pattern) to be effectively compensated, making the inner layers of the structure more evident. This fact is noticed in the better definition of the wood grain, and in the greater contrast of the artificial defects and wood knots with respect to the background. Even if barely visible, the defect “1” (Figure 2b), can now be recognized, as indicated by the red arrows in Figure 9. Instead, there is no evidence of the remaining defects, the nails, or of the splitting “6” (Figure 2b).
However, the Hilbert transform must be applied pixelwise to extract the time-phase feature, thus increasing the computational burden of the PuCT. For this reason, another approach has been tried to mitigate the effect of the surface inlay pattern. The pivot of the proposed approach is the normalization of the equivalent temperature trends after PuC, by considering the temperature rise in the very first moment, which in turn can be considered directly proportional to the absorbance of the surface. The result of this process is summarized in Figure 10, where some thermograms after the here-introduced normalization are shown, corresponding with the same time instants analyzed in Figure 9.
The thermograms in Figure 10 are very similar to those shown in Figure 9, demonstrating that the proposed approach can be a valid alternative to the time-phase feature. Furthermore, in this case, the defect “2” can be recognized, and for Xenics data, i.e., setup (b), a hint of the splitting “6” seems visible.

5. Conclusions

Pulse-compression thermography has been shown to be a valuable technique for cultural heritage items and artworks inspection, as it is capable of contextually providing good defect detection, as well as a very low and smooth temperature increment, which is extremely important for such items. Two different setups were compared, using in one case a long-wave handy IR camera, and an active cooled middle-wave IR camera in the other. In addition, two different post-processing methods to enhance sub-surface defect detection were illustrated: time-phase and normalized temperature.
Both ensure a higher sensitivity for inner defects than the sole analysis of the equivalent temperature increase retrieved after pulse-compression. In conclusion, image processing can be further improved by using post-processing techniques, as well as by combining different features in unique imaging algorithms.

Author Contributions

Conceptualization, S.S., S.L., G.G. and M.R.; methodology of sample realization, G.G.; software, formal analysis and investigation H.M., S.L., M.A.S., M.R.; writing—original draft preparation, S.S, S.L. and M.R.; funding acquisition, M.L.R., P.B. and M.R.; supervision, M.R. All authors have read and agreed to the published version of the manuscript.

Funding

This research was partially funded by Progetto S.I.L.A. (Sistema Integrato di Laboratori per l’Ambiente) Programma Operativo Nazionale Ricerca e Competitività per le Regioni della Convergenza—2007/2013—PONa3_00341.

Conflicts of Interest

The authors declare no conflict of interest.

References

  1. Maldague, X. Theory and Practice of Infrared Technology for Non-Destructive Testing; Wiley: Hoboken, NJ, USA, 2001; 704p. [Google Scholar]
  2. Schirripa Spagnolo, G.; Ambrosini, D.; Paoletti, D. Comparative study on the efficiency of some optical methods for artwork diagnostics. In Proceedings of the SPIE—The International Society for Optical Engineering—Laser Technique and Systems in Art Conservation, Munich, Germany, 22 October 2001; Volume 4402. [Google Scholar]
  3. Castellini, P.; Abaskin, V.; Achimova, E. Portable electronic interferometry device for the damages measurements in veneered wood artworks. J. Cult. Herit. 2008, 9, 225–233. [Google Scholar] [CrossRef]
  4. Ibarra-Castanedo, C.; Sfarra, S.; Ambrosini, D.; Paoletti, D.; Bendada, A.; Maldague, X. Subsurface defect characterization in artworks by quantitative pulsed phase thermography and holographic interferometry. QIRT J. 2008, 5, 131–149. [Google Scholar] [CrossRef]
  5. Ibarra-Castanedo, C.; Sfarra, S.; Ambrosini, D.; Paoletti, D.; Bendada, A.; Maldague, X. Diagnostics of panel paintings using holographic interferometry and pulsed thermography. QIRT J. 2010, 7, 85–114. [Google Scholar] [CrossRef]
  6. Sfarra, S.; Ibarra-Castanedo, C.; Theodorakeas, P.; Avdelidis, N.P.; Paoletti, A.; Paoletti, D.; Hrissagis, K.; Bendada, A.; Koui, M.; Maldague, X. Holographic interferometry (HI) and active infrared thermography (IRT) for the non-destructive assessment of esteemed hand-painted ceramic sample panels. In Proceedings of the NDT in Progress 2011—6th International Workshop of NDT Experts, Prague, Czech Republic, 10–11 October 2011. [Google Scholar]
  7. Sfarra, S.; Theodorakeas, P.; Ibarra-Castanedo, C.; Avdelidis, N.P.; Paoletti, A.; Paoletti, D.; Hrissagis, K.; Bendada, A.; Koui, M.; Maldague, X. Importance of integrated results of different non-destructive techniques in order to evaluate defects in panel paintings: The contribution of infrared, optical and ultrasonic techniques. In Proceedings of the SPIE—The International Society for Optical Engineering—O3A: Optics for Arts, Architecture, and Archaeology III, Munich, Germany, 6 June 2011; Volume 8084. [Google Scholar]
  8. Sfarra, S.; Theodorakeas, P.; Ibarra-Castanedo, C.; Avdelidis, N.P.; Paoletti, A.; Paoletti, D.; Hrissagis, K.; Bendada, A.; Koui, M.; Maldague, X. Evaluation of defects in panel paintings using infrared, optical and ultrasonic techniques. Insight Non-Destr. Test. Cond. Monit. 2012, 54, 21–27. [Google Scholar] [CrossRef] [Green Version]
  9. Vrabie, V.; Perrin, E.; Bodnar, J.-L.; Mouhoubi, K.; Detalle, V. Active IR thermography processing based on higher order statistics for non-destructive evaluation. In Proceedings of the 20th European Signal Processing Conference (EUSIPCO), Bucharest, Romania, 27–31 August 2012; pp. 894–898. [Google Scholar]
  10. Gavrilov, D.; Maeva, E.; Grube, O.; Vodyanoy, I.; Maev, R. Experimental comparative study of the applicability of infrared techniques for non-destructive evaluation of paintings. J. Am. Inst. Conserv. 2013, 52, 48–60. [Google Scholar] [CrossRef]
  11. Gavrilov, D.; Maeva, E.; Maev, R.G. Thermographic inspection in the service of art science: Theory, methods and considerations. Insight Non-Destruct. Test. Cond Monit. 2014, 56, 131–136. [Google Scholar] [CrossRef]
  12. Bendada, A.; Sfarra, S.; Ibarra-Castanedo, C.; Akhloufi, M.; Caumes, J.-P.; Pradere, C.; Batsale, J.-C.; Maldague, X. Subsurface imaging for panel paintings inspection: A comparative study of the ultraviolet, the visible, the infrared and the terahertz spectra. Opto-Electron. Rev. 2015, 23, 88–99. [Google Scholar] [CrossRef]
  13. Sfarra, S.; Theodorakes, P.; Ibarra-Castanedo, C.; Avdelidis, N.P.; Ambrosini, D.; Cheilakou, E.; Paoletti, D.; Koui, M.; Bendada, A.; Maldague, X. How to retrieve information inherent to old restorations made on frescoes of particular artistic value using infrared vision? Int. J. Thermophys. 2015, 36, 3051–3070. [Google Scholar] [CrossRef]
  14. Ahmad, M.Z.; Khan, A.A.; Mezghani, S.; Perrin, E.; Mouhoubi, K.; Bodnar, J.-L.; Vrabie, V. Wavelet subspace decomposition of thermal infrared images for defect detection in artworks. Infrared Phys. Technol. 2016, 77, 325–334. [Google Scholar] [CrossRef] [Green Version]
  15. Buchta, D.; Heinemann, C.; Pedrini, G.; Krekel, C.; Osten, W. Lock-in-shearography for the detection of transport-induced damages on artwork. In Proceedings of the SPIE—The International Society for Optical Engineering—Optics for Arts, Architecture, and Archaeology VI, Munich, Germany, 11 July 2017; Volume 10331. [Google Scholar]
  16. Sfarra, S.; Fernandes, H.C.; López, F.; Ibarra-Castanedo, C.; Zhang, H.; Maldague, X. Qualitative assessment via infrared vision of sub-surface defects present beneath decorative surface coatings. Int. J. Thermophys. 2018, 39, 13. [Google Scholar] [CrossRef]
  17. Peeters, J.; Van der Snickt, G.; Sfarra, S.; Legrand, S.; Ibarra-Castanedo, C.; Janssens, K.; Steenackers, G. IR reflectography and active thermography on artworks: The added value of the 1.5-3 μm band. Appl. Sci. 2018, 8, 50. [Google Scholar] [CrossRef] [Green Version]
  18. Palomar, T.; Agua, F.; Gómez-Heras, M. Comparative assessment of stained-glass windows materials by infrared thermography. Int. J. Appl. Glass Sci. 2018, 9, 530–539. [Google Scholar] [CrossRef]
  19. Stamatopoulou, E.; Karoglou, M.; Bakolas, A. Contemporary artworks created on photosensitized cement: Materials and conservation state of Nikos Kessanlis “Wall-Erotica”. J. Cult. Herit. 2019, in press. [Google Scholar] [CrossRef]
  20. Laureti, S.; Malekmohammadi, H.; Rizwan, M.K.; Burrascano, P.; Sfarra, S.; Mostacci, M.; Ricci, M. Looking through paintings by combining hyper-spectral imaging and pulse-compression thermography. Sensors 2019, 19, 4335. [Google Scholar] [CrossRef] [PubMed] [Green Version]
  21. Laureti, S.; Colantonio, C.; Burrascano, P.; Melis, M.; Calabrò, G.; Malekmohammadi, H.; Sfarra, S.; Ricci, M.; Pelosi, C. Development of integrated innovative techniques for paintings examination: The case studies of The Resurrection of Christ attributed to Andrea Mantegna and the Crucifixion of Viterbo attributed to Michelangelo’s workshop. J. Cult. Herit. 2019, 40, 1–16. [Google Scholar] [CrossRef]
  22. Bodnar, J.L.; Nicolas, J.L.; Candoré, J.C.; Detalle, V. Non-destructive testing by infrared thermography under random excitation and ARMA analysis. Int. J. Thermophys. 2012, 33, 2011–2015. [Google Scholar] [CrossRef]
  23. Sfarra, S.; Theodorakeas, P.; Černecký, J.; Pivarčiová, E.; Perilli, S.; Koui, M. Inspecting marquetries at different wavelengths: The preliminary numerical approach as aid for a wide-range of non-destructive tests. J. Nondestruct. Eval. 2017, 36, 6. [Google Scholar] [CrossRef]
  24. Tavakolian, P.; Sfarra, S.; Gargiulo, G.; Sivagurunathan, K.; Mandelis, A. Photothermal coherence tomography for 3-D visualization and structural non-destructive imaging of a wood inlay. Infrared Phys. Technol. 2018, 91, 206–213. [Google Scholar] [CrossRef]
  25. Cielo, P.; Maldague, X.; Déom, A.A.; Lewak, R. Thermographic non-destructive evaluation of industrial materials and structures. Mater. Eval. 1987, 45, 452–460. [Google Scholar]
  26. Allport, J.; McHugh, J. Quantitative evaluation of transient video thermography. In Review of Progress in Quantitative Non-Destructive Evaluation; Thompson, D.O., Chimenti, D.E., Eds.; Plenum Press: New York, NY, USA, 1988; pp. 253–262. [Google Scholar]
  27. Sikora, A.; František, K.; Gaff, M.; Vondrová, V.; Bubeníková, T.; Kubovskỳ, I. Impact of thermal modification on color and chemical changes of spruce and oak wood. J. Wood Sci. 2018, 64, 406–416. [Google Scholar] [CrossRef]
  28. Laureti, S.; Sfarra, S.; Malekmohammadi, H.; Burrascano, P.; Hutchins, D.A.; Senni, L.; Silipigni, G.; Maldague, X.P.V.; Ricci, M. The use of pulse-compression thermography for detecting defects in paintings. NDT E Int. 2018, 98, 147–154. [Google Scholar] [CrossRef] [Green Version]
  29. Silipigni, G.; Burrascano, P.; Hutchins, D.A.; Laureti, S.; Petrucci, R.; Senni, L.; Torre, L.; Ricci, M. Optimization of the pulse-compression technique applied to the infrared thermography nondestructive evaluation. NDT E Int. 2017, 87, 100–110. [Google Scholar] [CrossRef]
  30. Laureti, S.; Silipigni, G.; Senni, L.; Tomasello, R.; Burrascano, P.; Ricci, M. Comparative study between linear and non-linear frequency-modulated pulse-compression thermography. Appl. Opt. 2018, 57, D32–D39. [Google Scholar] [CrossRef] [PubMed]
  31. Laureti, S.; Khalid Rizwan, M.; Malekmohammadi, H.; Burrascano, P.; Natali, M.; Torre, L.; Rallini, M.; Puri, I.; Hutchins, D.; Ricci, M. Delamination Detection in Polymeric Ablative Materials Using Pulse-Compression Thermography and Air-Coupled Ultrasound. Sensors 2019, 19, 2198. [Google Scholar] [CrossRef] [PubMed] [Green Version]
  32. Malekmohammadi, H.; Laureti, S.; Burrascano, P.; Ricci, M. Comparison of optimisation strategies for the improvement of depth detection capability of Pulse-Compression Thermography. Quant. InfraRed Thermogr. J. 2020, 17, 26–39. [Google Scholar] [CrossRef]
  33. Wu, S.; Gao, B.; Yang, Y.; Zhu, Y.; Burrascano, P.; Laureti, S.; Ricci, M.; Wang, Y. Halogen optical referred pulse-compression thermography for defect detection of CFRP. Infrared Phys. Technol. 2019, 102, 103006. [Google Scholar] [CrossRef]
  34. Mulaveesala, R.; Tuli, S. Theory of frequency modulated thermal wave imaging for nondestructive subsurface defect detection. Appl. Phys. Lett. 2006, 89, 191913. [Google Scholar]
  35. Tabatabaei, N.; Mandelis, A. Thermal-wave radar: A novel subsurface imaging modality with extended depth-resolution dynamic range. Rev. Sci. Instrum. 2009, 80, 034902. [Google Scholar] [CrossRef] [Green Version]
  36. Mulaveesala, R.; Venkata Ghali, S. Coded excitation for infrared non-destructive testing of carbon fiber reinforced plastics. Rev. Sci. Instrum. 2011, 82, 054902. [Google Scholar] [CrossRef]
  37. Arora, V.; Mulaveesala, R. Pulse compression with gaussian weighted chirp modulated excitation for infrared thermal wave imaging. Prog. Electromagn. Res. Lett. 2014, 44, 133–137. [Google Scholar] [CrossRef] [Green Version]
  38. Avdelidis, N.P.; Almond, D.P.; Dobbinson, A.; Hawtin, B.C. Pulsed thermography: Philosophy, qualitative and quantitative analysis on certain aircraft applications. Insight Non-Destruct. Test. Monit. 2006, 48, 286–289. [Google Scholar] [CrossRef]
  39. Carslaw, H.; Jaeger, J. Conduction of Heat in Solids, 2nd ed.; Oxford Clarendon Press: Oxford, UK, 1959; p. 1959. [Google Scholar]
  40. Burgholzer, P. Thermodynamic Limits of Spatial Resolution in Active Thermography. Int. J. Thermophys. 2015, 36, 2328–2341. [Google Scholar] [CrossRef] [PubMed]
  41. Turin, G. An introduction to matched filters. IRE Trans. Inf. Theory 1960, 6, 311–329. [Google Scholar] [CrossRef] [Green Version]
  42. Burrascano, P.; Laureti, S.; Senni, L.; Ricci, M. Pulse Compression in Nondestructive Testing Applications: Reduction of Near Sidelobes Exploiting Reactance Transformation. IEEE Trans. Circuits Syst. I 2018, 99, 1–11. [Google Scholar] [CrossRef]
  43. Harput, S.; Arif, M.; McLaughlan, J.; Cowell, D.M.; Freear, S. The effect of amplitude modulation on subharmonic imaging with chirp excitation. IEEE Trans. Ultrason. Ferroelectr. Freq. Control. 2013, 60, 2532–2544. [Google Scholar] [CrossRef]
  44. Rizwan, M.K.; Senni, L.; Burrascano, P.; Laureti, S.; Goldammer, M.; Mooshofer, H.; Ricci, M.; Borgna, R.; Neri, S. Contextual Application of Pulse-Compression and Multi-frequency Distance-Gain Size Analysis in Ultrasonic Inspection of Forging. J. Nondestruct. Eval. 2019, 38, 72. [Google Scholar] [CrossRef]
  45. Hutchins, D.; Burrascano, P.; Davis, L.; Laureti, S.; Ricci, M. Coded waveforms for optimised air-coupled ultrasonic nondestructive evaluation. Ultrasonics 2014, 54, 1745–1759. [Google Scholar] [CrossRef] [Green Version]
  46. Ricci, M.; Senni, L.; Burrascano, P. Exploiting pseudorandom sequences to enhance noise immunity for air-coupled ultrasonic nondestructive testing. IEEE Trans. Instrum. Meas. 2012, 61, 2905–2915. [Google Scholar] [CrossRef]
  47. Hamilton Jackson, F. Intarsia and Marquetry—Handbook for the Designer and Craftsman; Sands and Company: London, UK, 1903; 265p. [Google Scholar]
Figure 1. Implementation of the Pulse-Compression Thermography (PuCT) procedure. A coded periodic signal s T R ( t ) modulates the on/off state of the LED chips, exciting the investigated sample. A non-linear fit function is applied to the output signal y S Q ( t ) + y ( t ) to remove the step heating contribution y S Q ( t ) and obtain the y ( t ) . The second period of the y ( t ) is then convolved (“PuC box”) with the matched filter ψ ( t ) to obtain an estimate of the sample’s impulse response h ˜ ( t ) .
Applsci 10 04233 g001
Figure 2. Inlay sample: (a) position of the defects beneath the front (tessellatum layer) side, (b) additional explanations of the position of some defects, (c) position of the defects beneath the rear side, (d) additional explanations of the position of the remaining defects.
Applsci 10 04233 g002
Figure 3. Pulse-compression thermography (PuCT) experimental setups: (a) the far-infrared and (b) mid-infrared experimental setups.
Applsci 10 04233 g003
Figure 4. Raw experimental data collected with FLIR T660, i.e. setup (a) in Figure 3: (a) raw image of the sample under test (SUT) with three pixels marked on it; (b) marked pixels’ raw acquired temperature trends over the whole excitation time: even in the case of pixel 2, in correspondence to a defect, the maximum ΔT of 1 °C was achieved in 62 s of excitation, whereas for a sound pixel it was generally less than 1 °C; (c) selected raw thermograms during the whole acquisition time: even if some defects are visible, the SNR is low.
Applsci 10 04233 g004
Figure 5. PuCT experimental data collected with FLIR T660, i.e. setup (a) in Figure 3: (a) PuCT image of the SUT with three pixels marked on it; (b) marked pixels’ equivalent temperature rise after PuC; (c) selected thermograms after PuC.
Applsci 10 04233 g005
Figure 6. Selected thermograms obtained after PuCT applied to experimental data collected with FLIR T660, i.e., setup (a).
Applsci 10 04233 g006
Figure 7. PuCT experimental data collected with Xenics Onca-MWIR-InSb, i.e., setup (b) in Figure 3: (a) selected pixels marked; (b) marked pixels’ equivalent temperature rise after PuC; (c) selected thermograms after PuC.
Applsci 10 04233 g007
Figure 8. Selected thermograms obtained after PuCT applied to experimental data collected with Xenics Onca-MWIR-InSb, i.e., setup (b).
Applsci 10 04233 g008
Figure 9. Selected thermograms imaging the timephase feature for PuCT data, from both setup (a) and setup (b).
Applsci 10 04233 g009
Figure 10. Selected thermograms imaging the normalized temperature for PuCT data, from both setup (a) and setup (b).
Applsci 10 04233 g010

