Cluster Analysis of IR Thermography Data for Differentiating Glass Types in Historical Leaded-Glass Windows

 , ,
, , 
 ,
, 
Abstract
1. Introduction
2. Materials and Methods
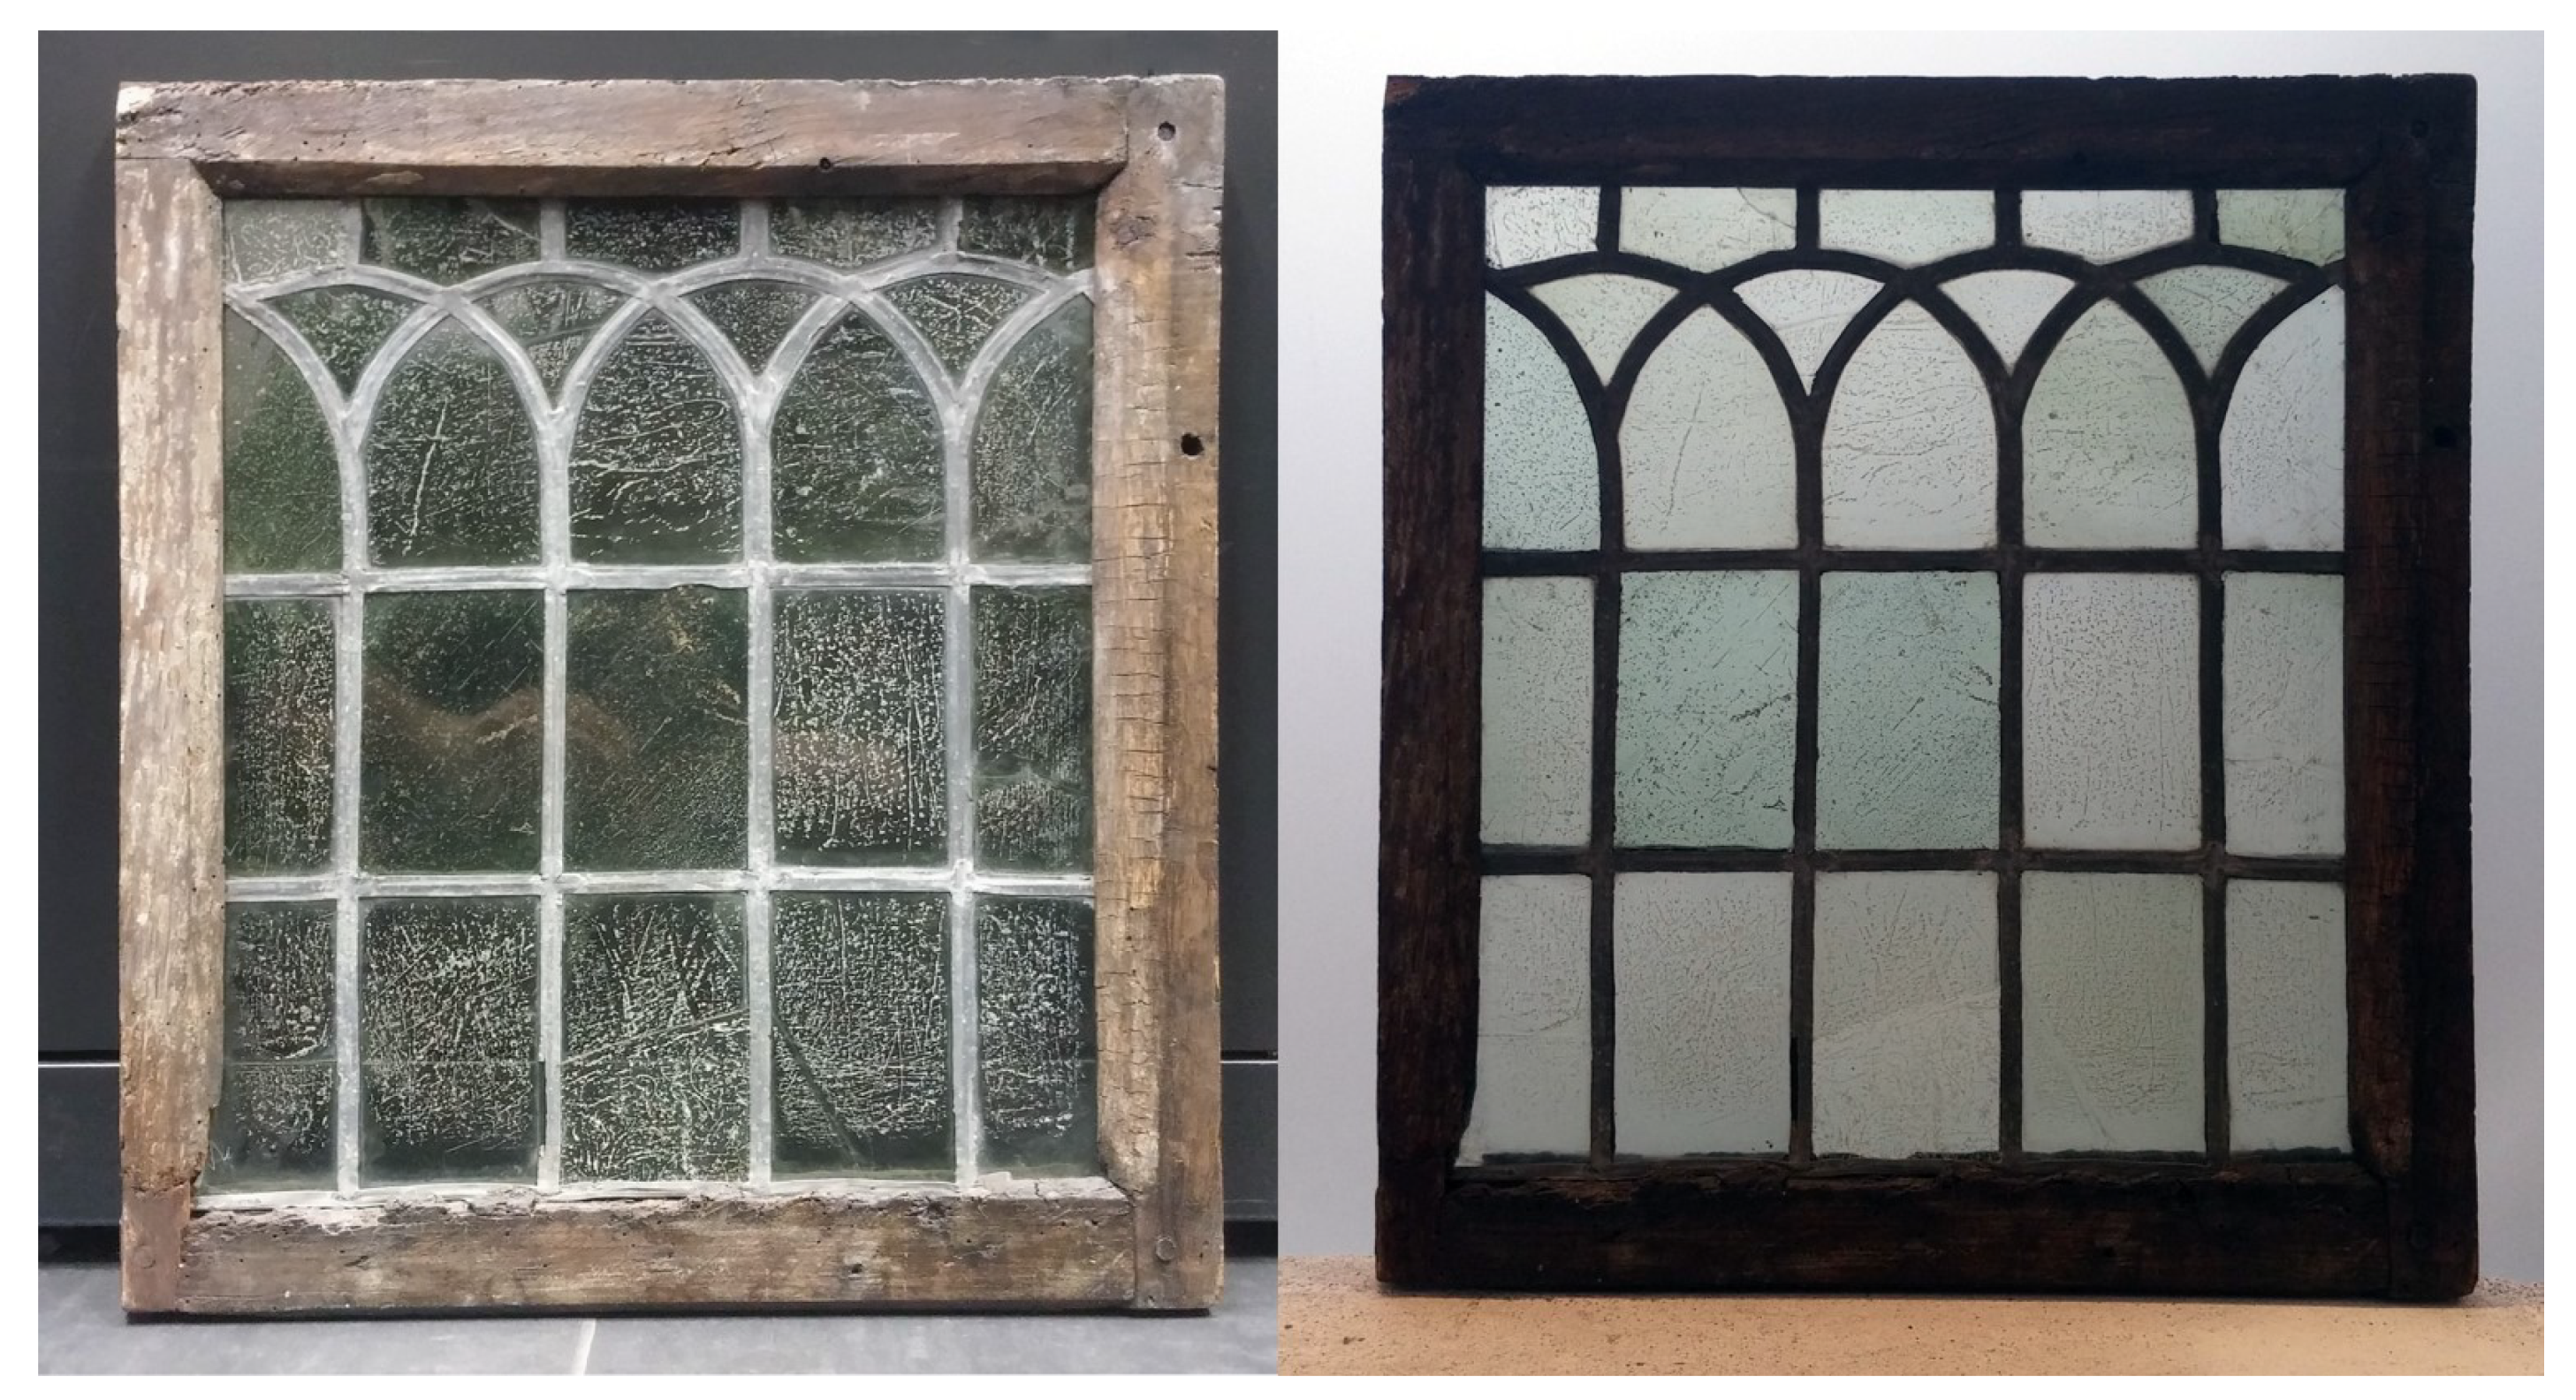
2.1. The Window
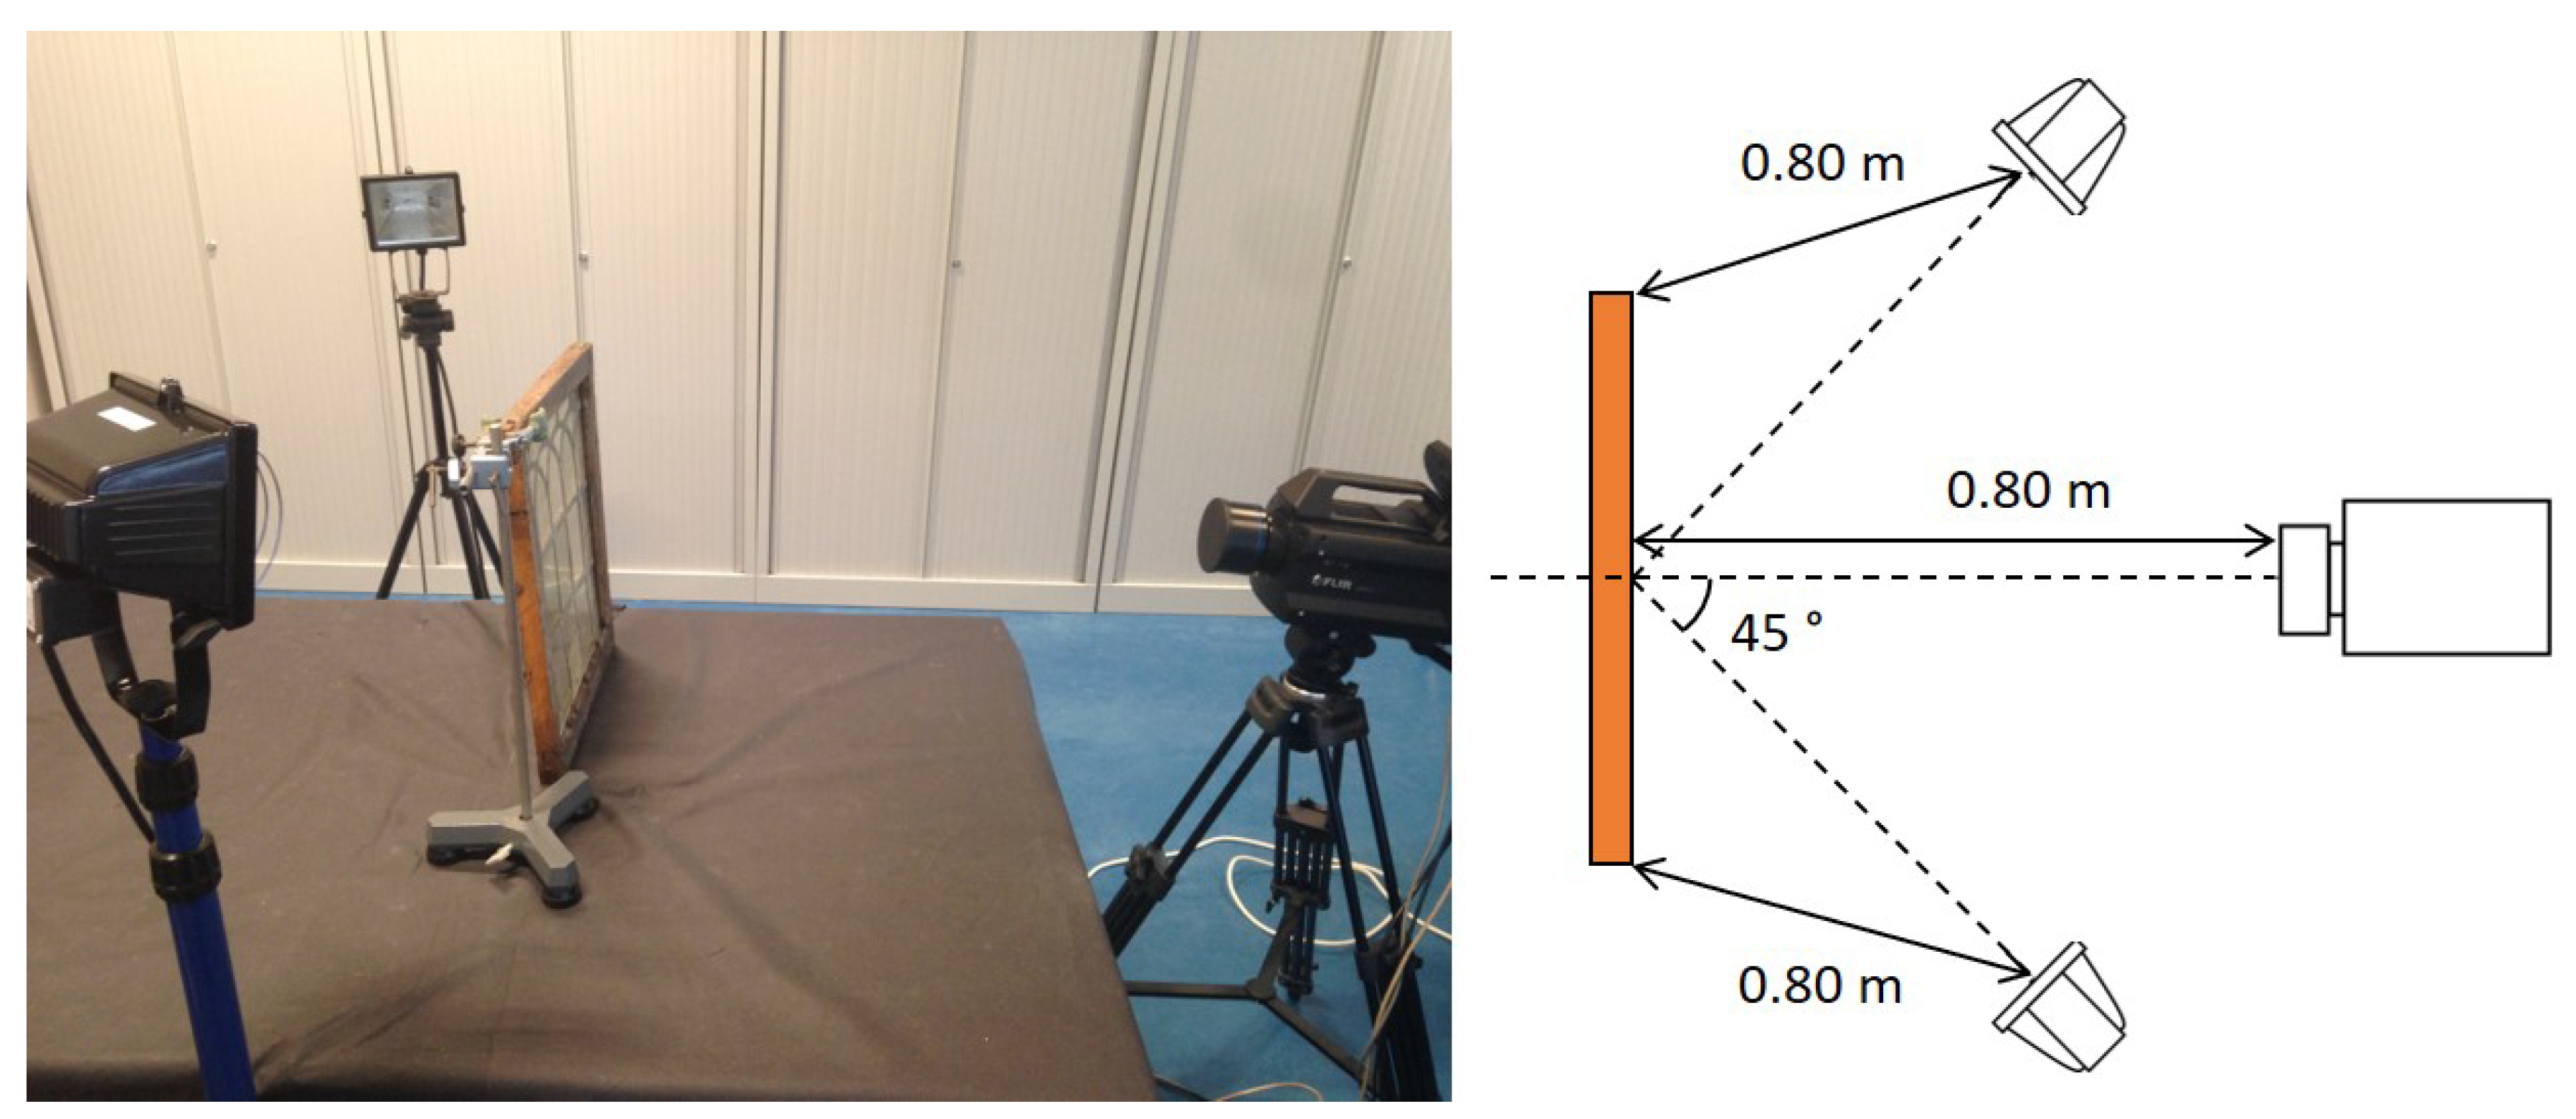
2.2. Experimental Set-Up and Instrumentation
2.3. Processing
3. Results and Discussion
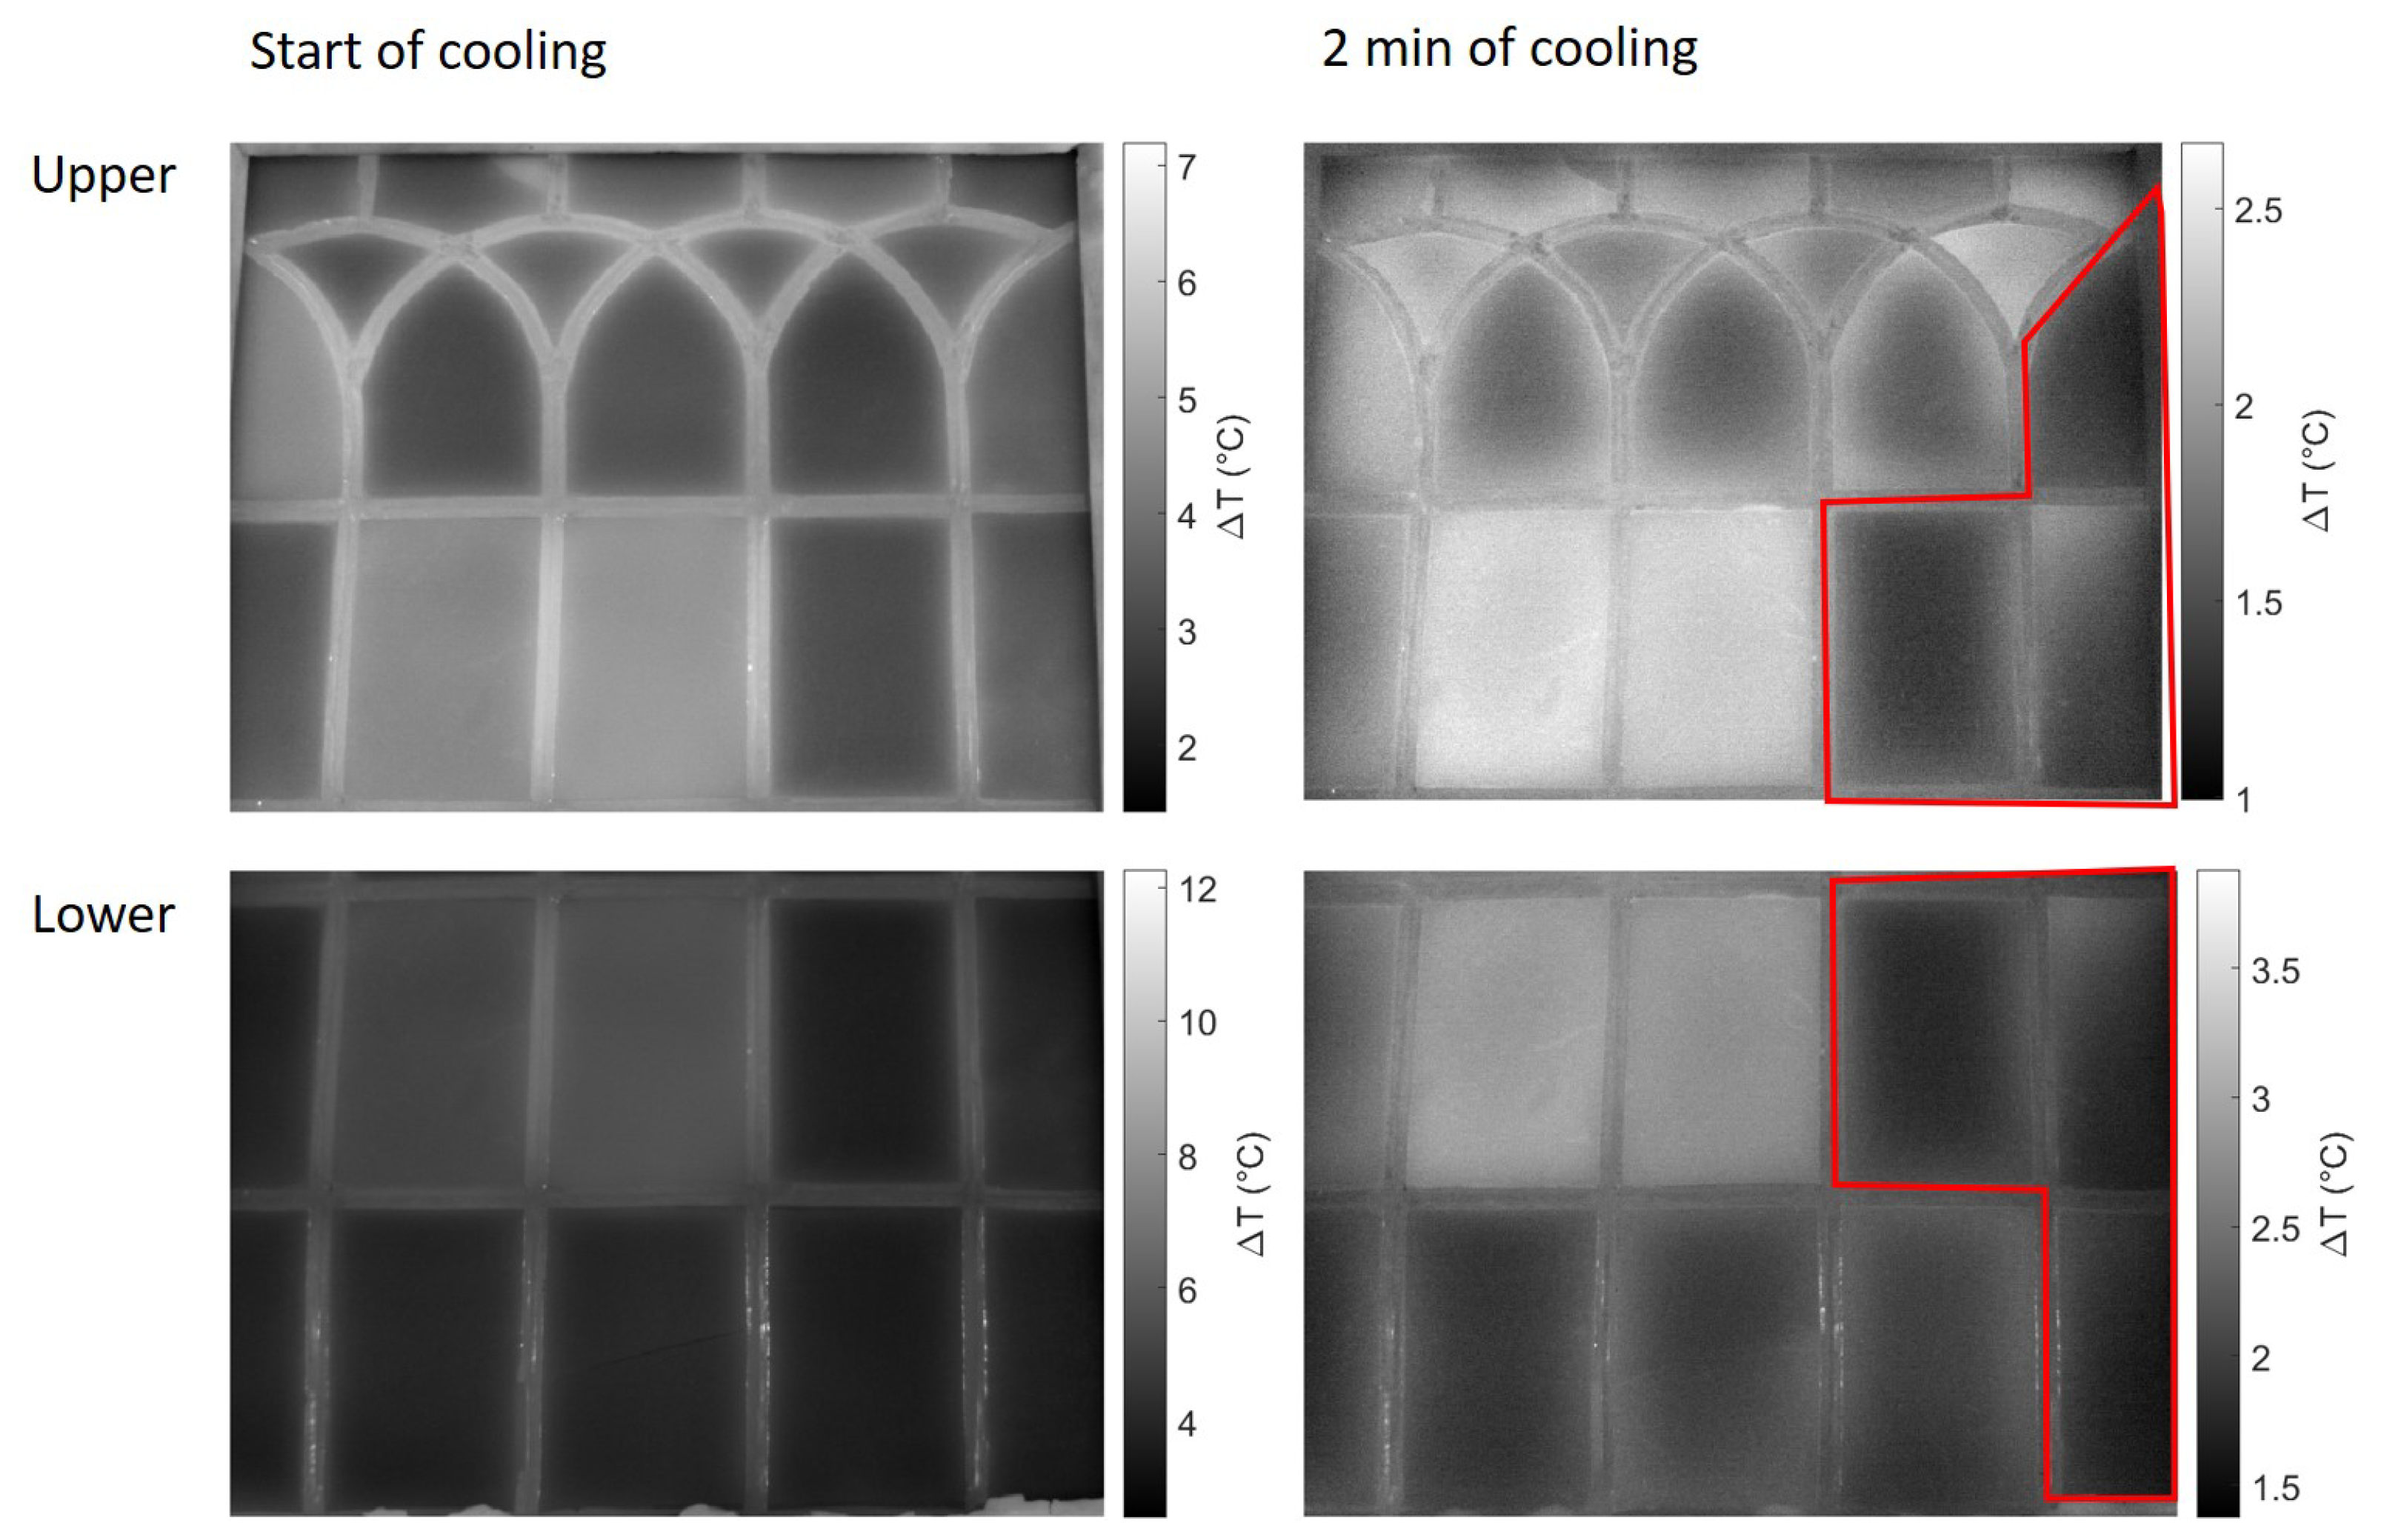
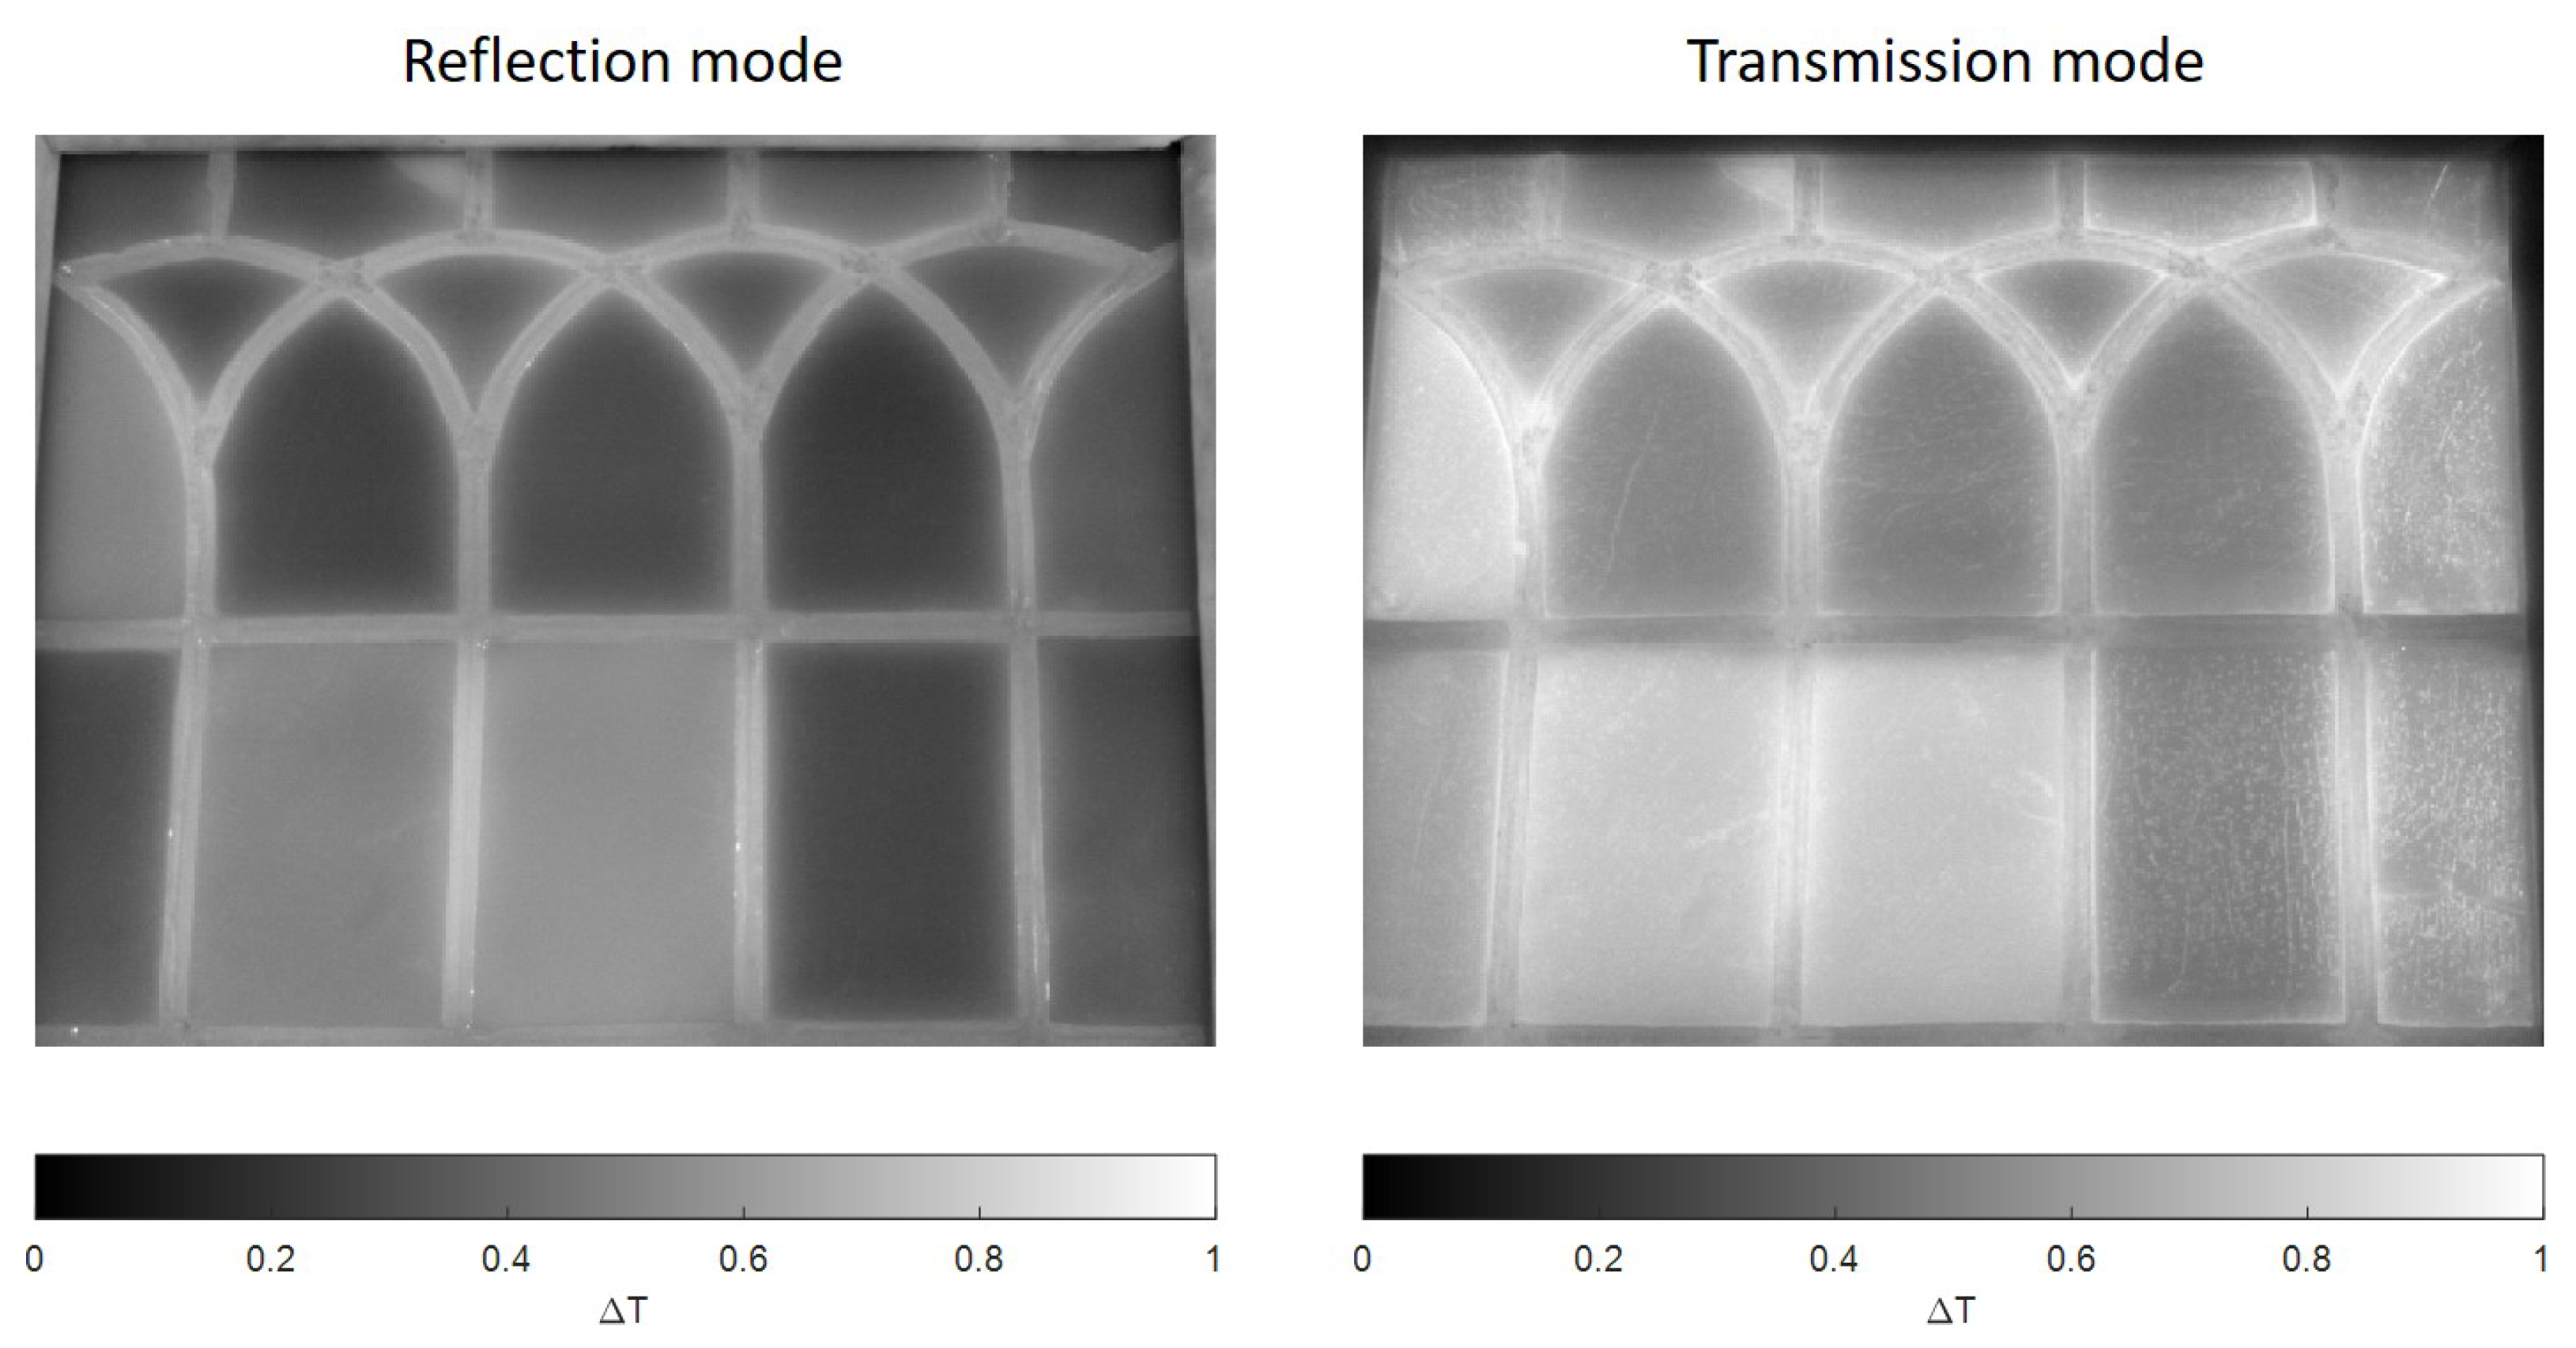
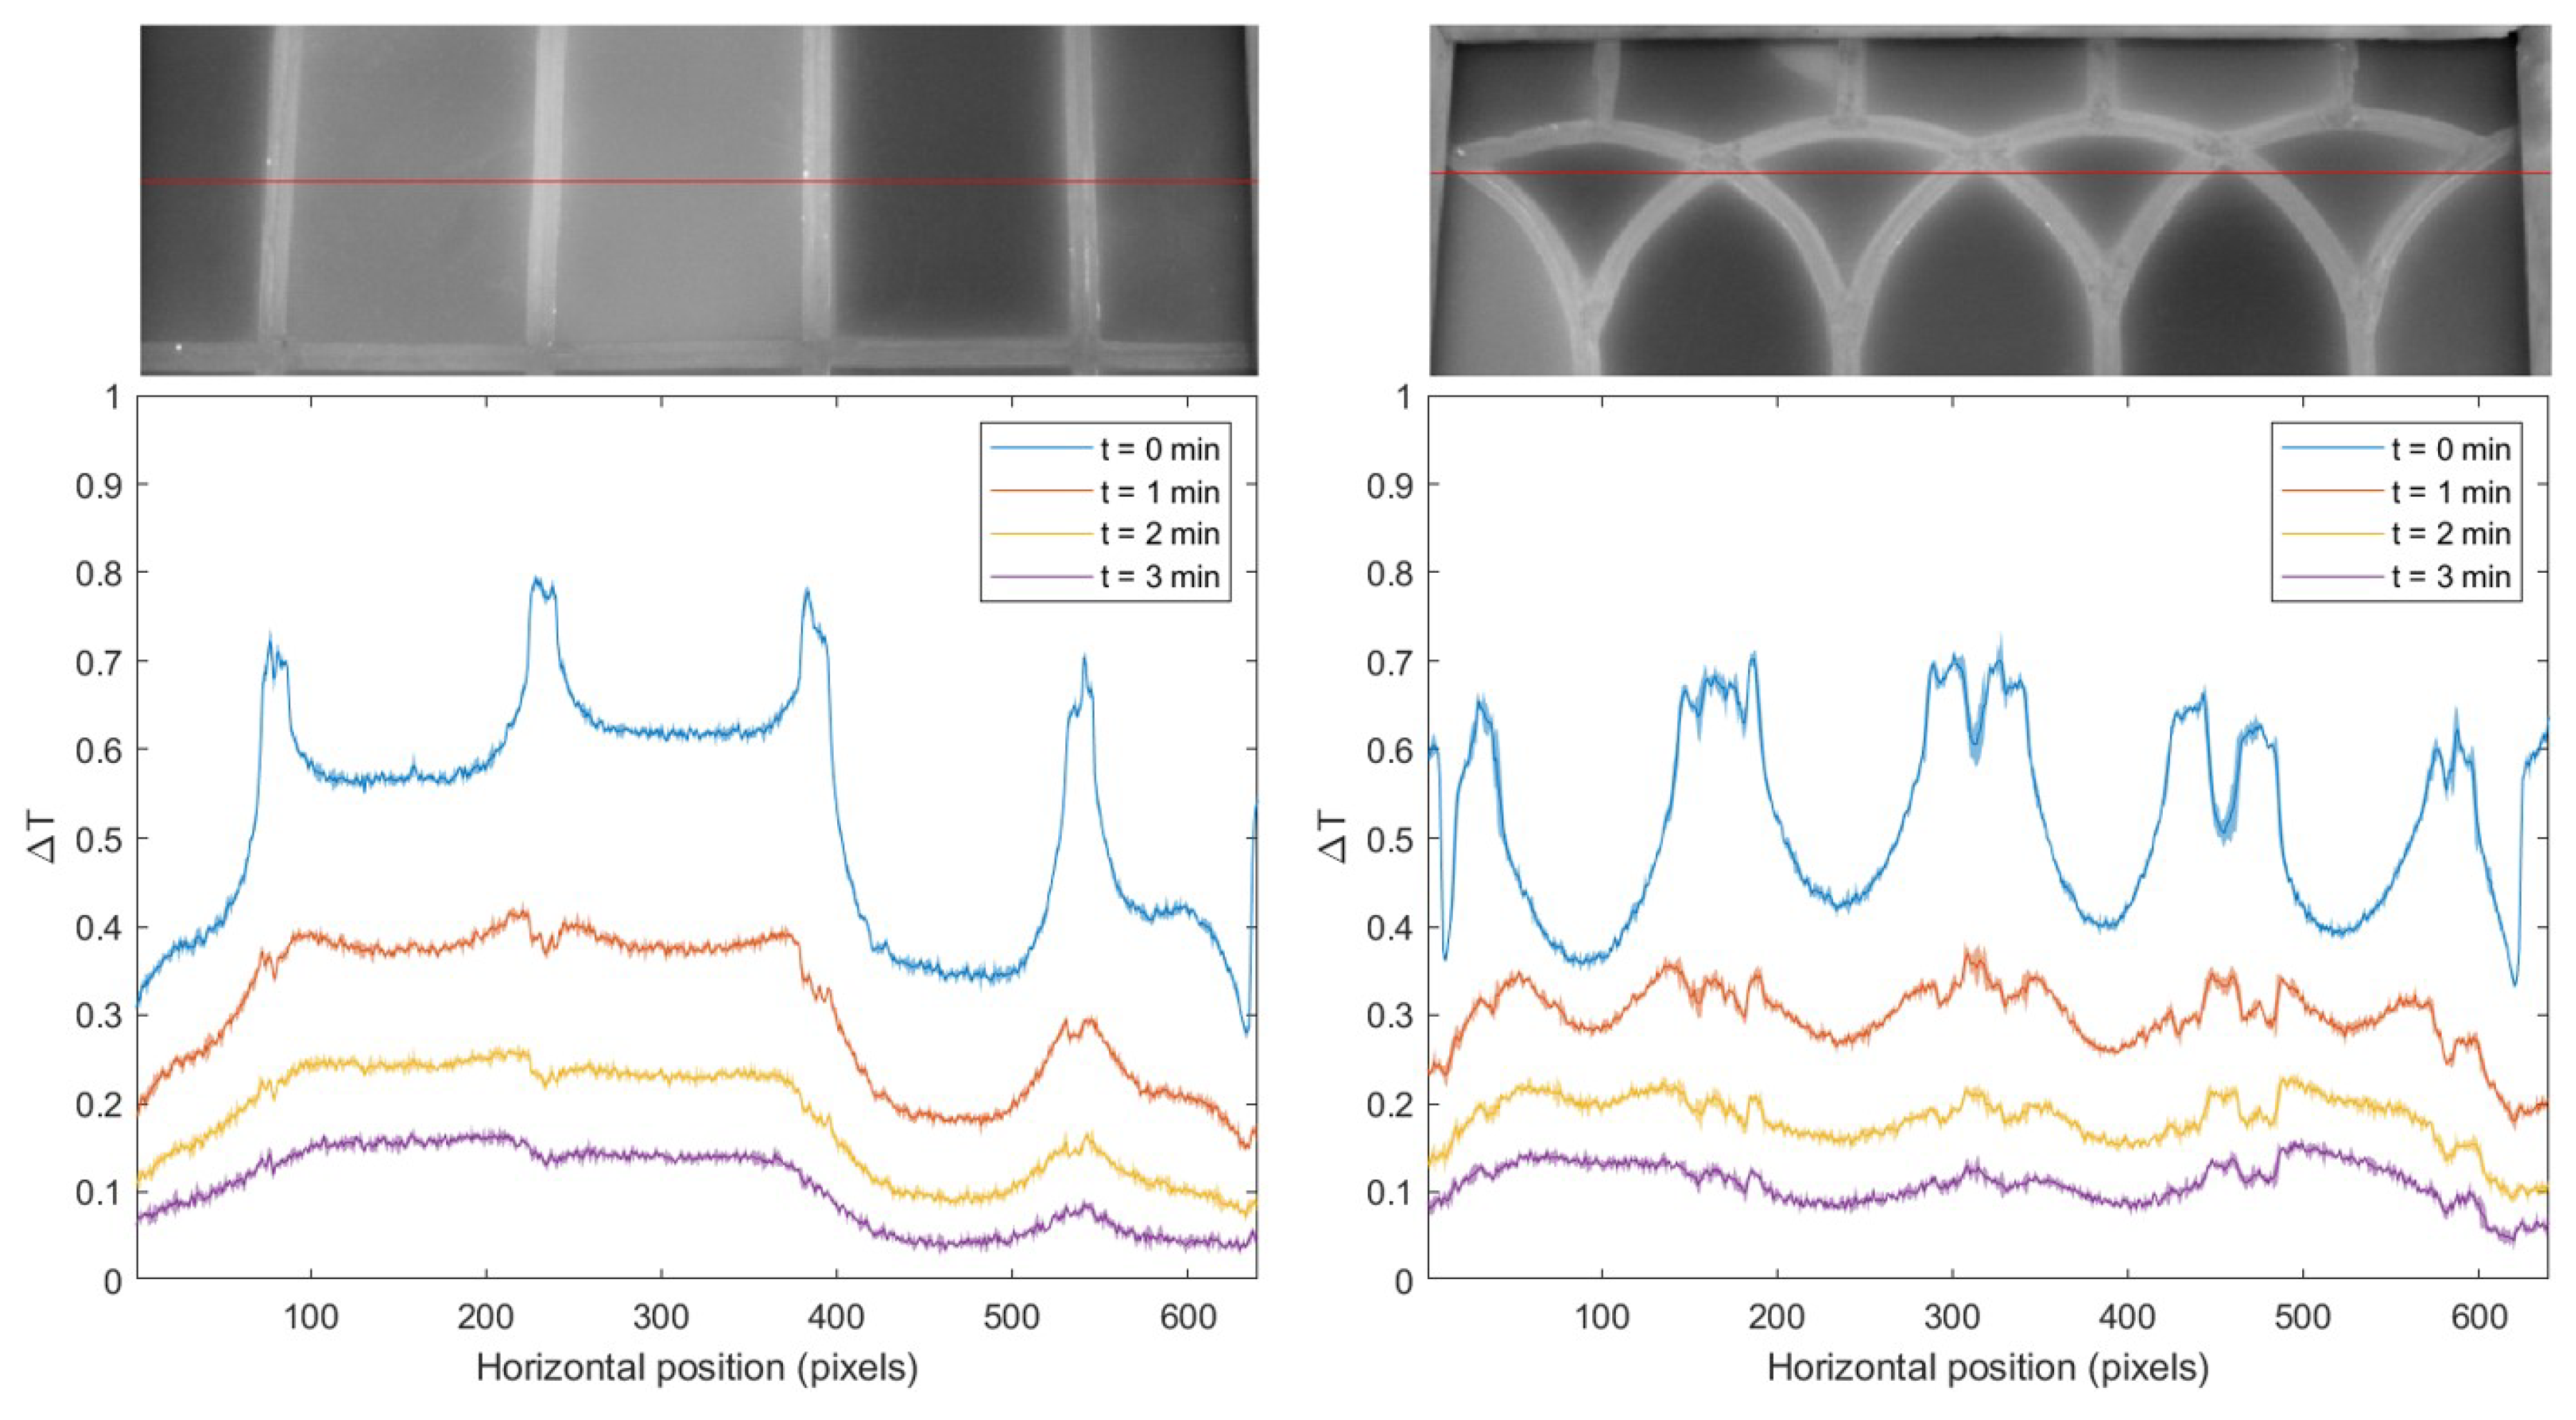
3.1. Thermograms
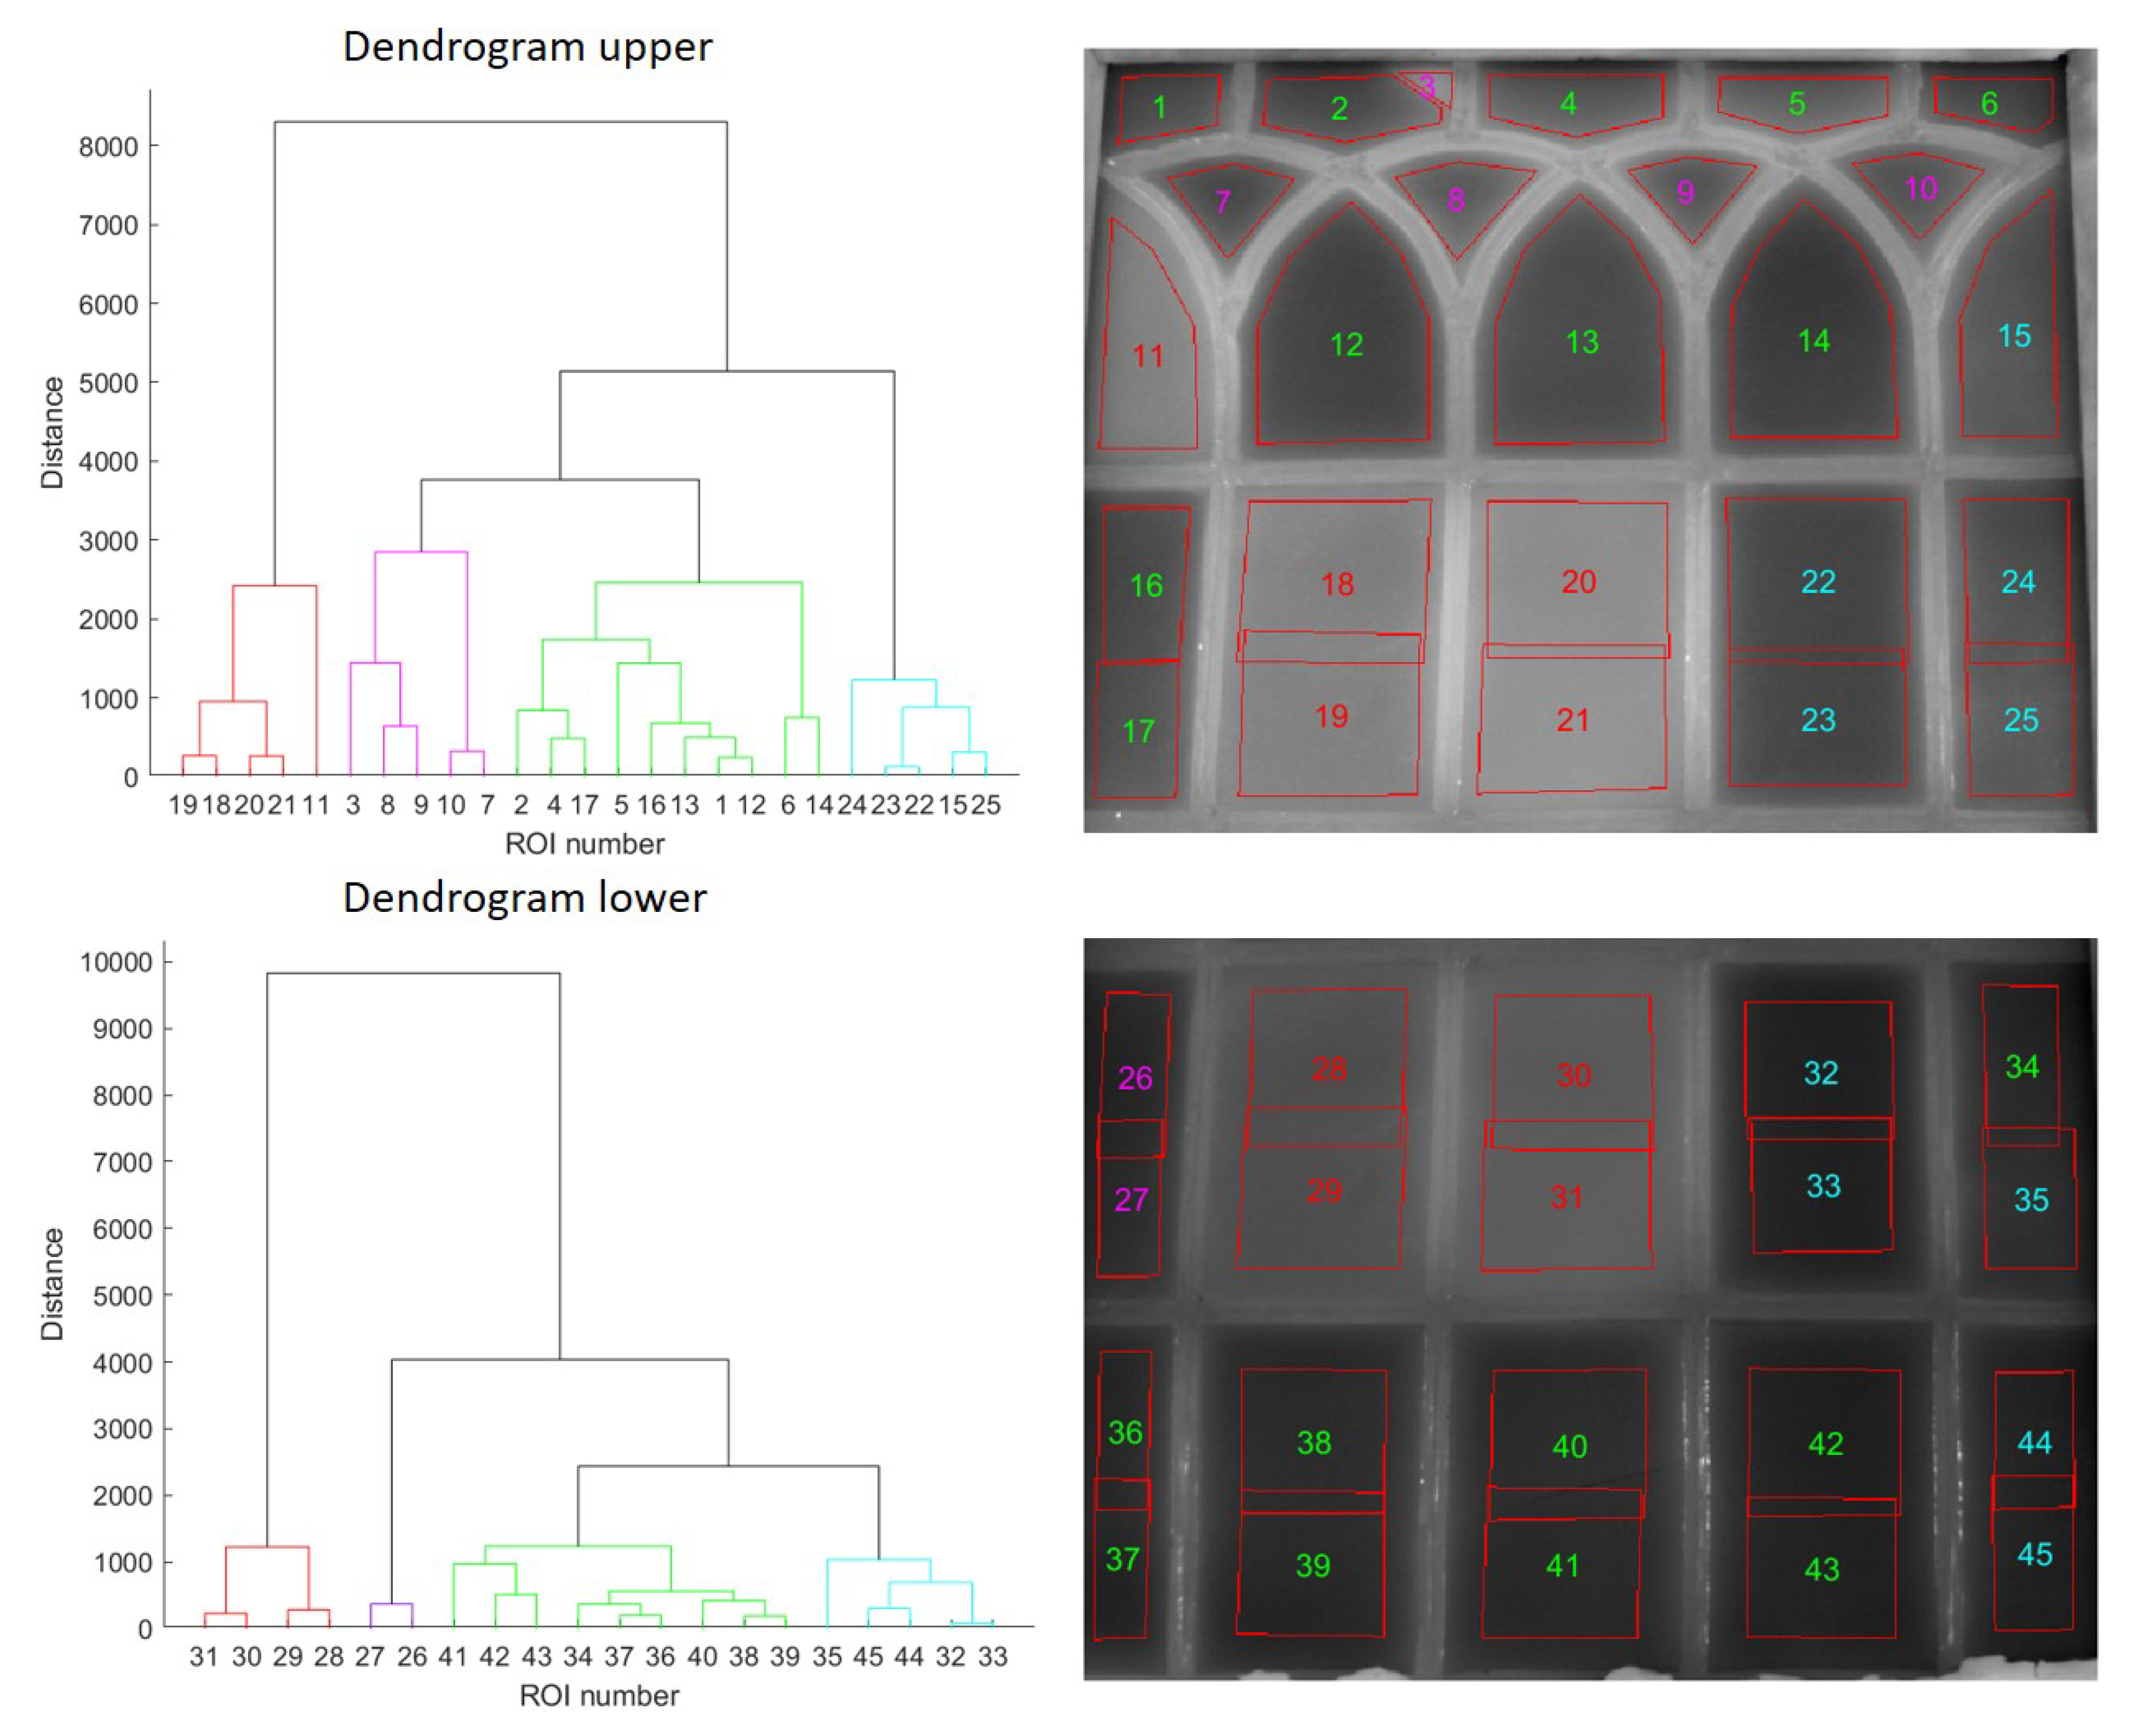
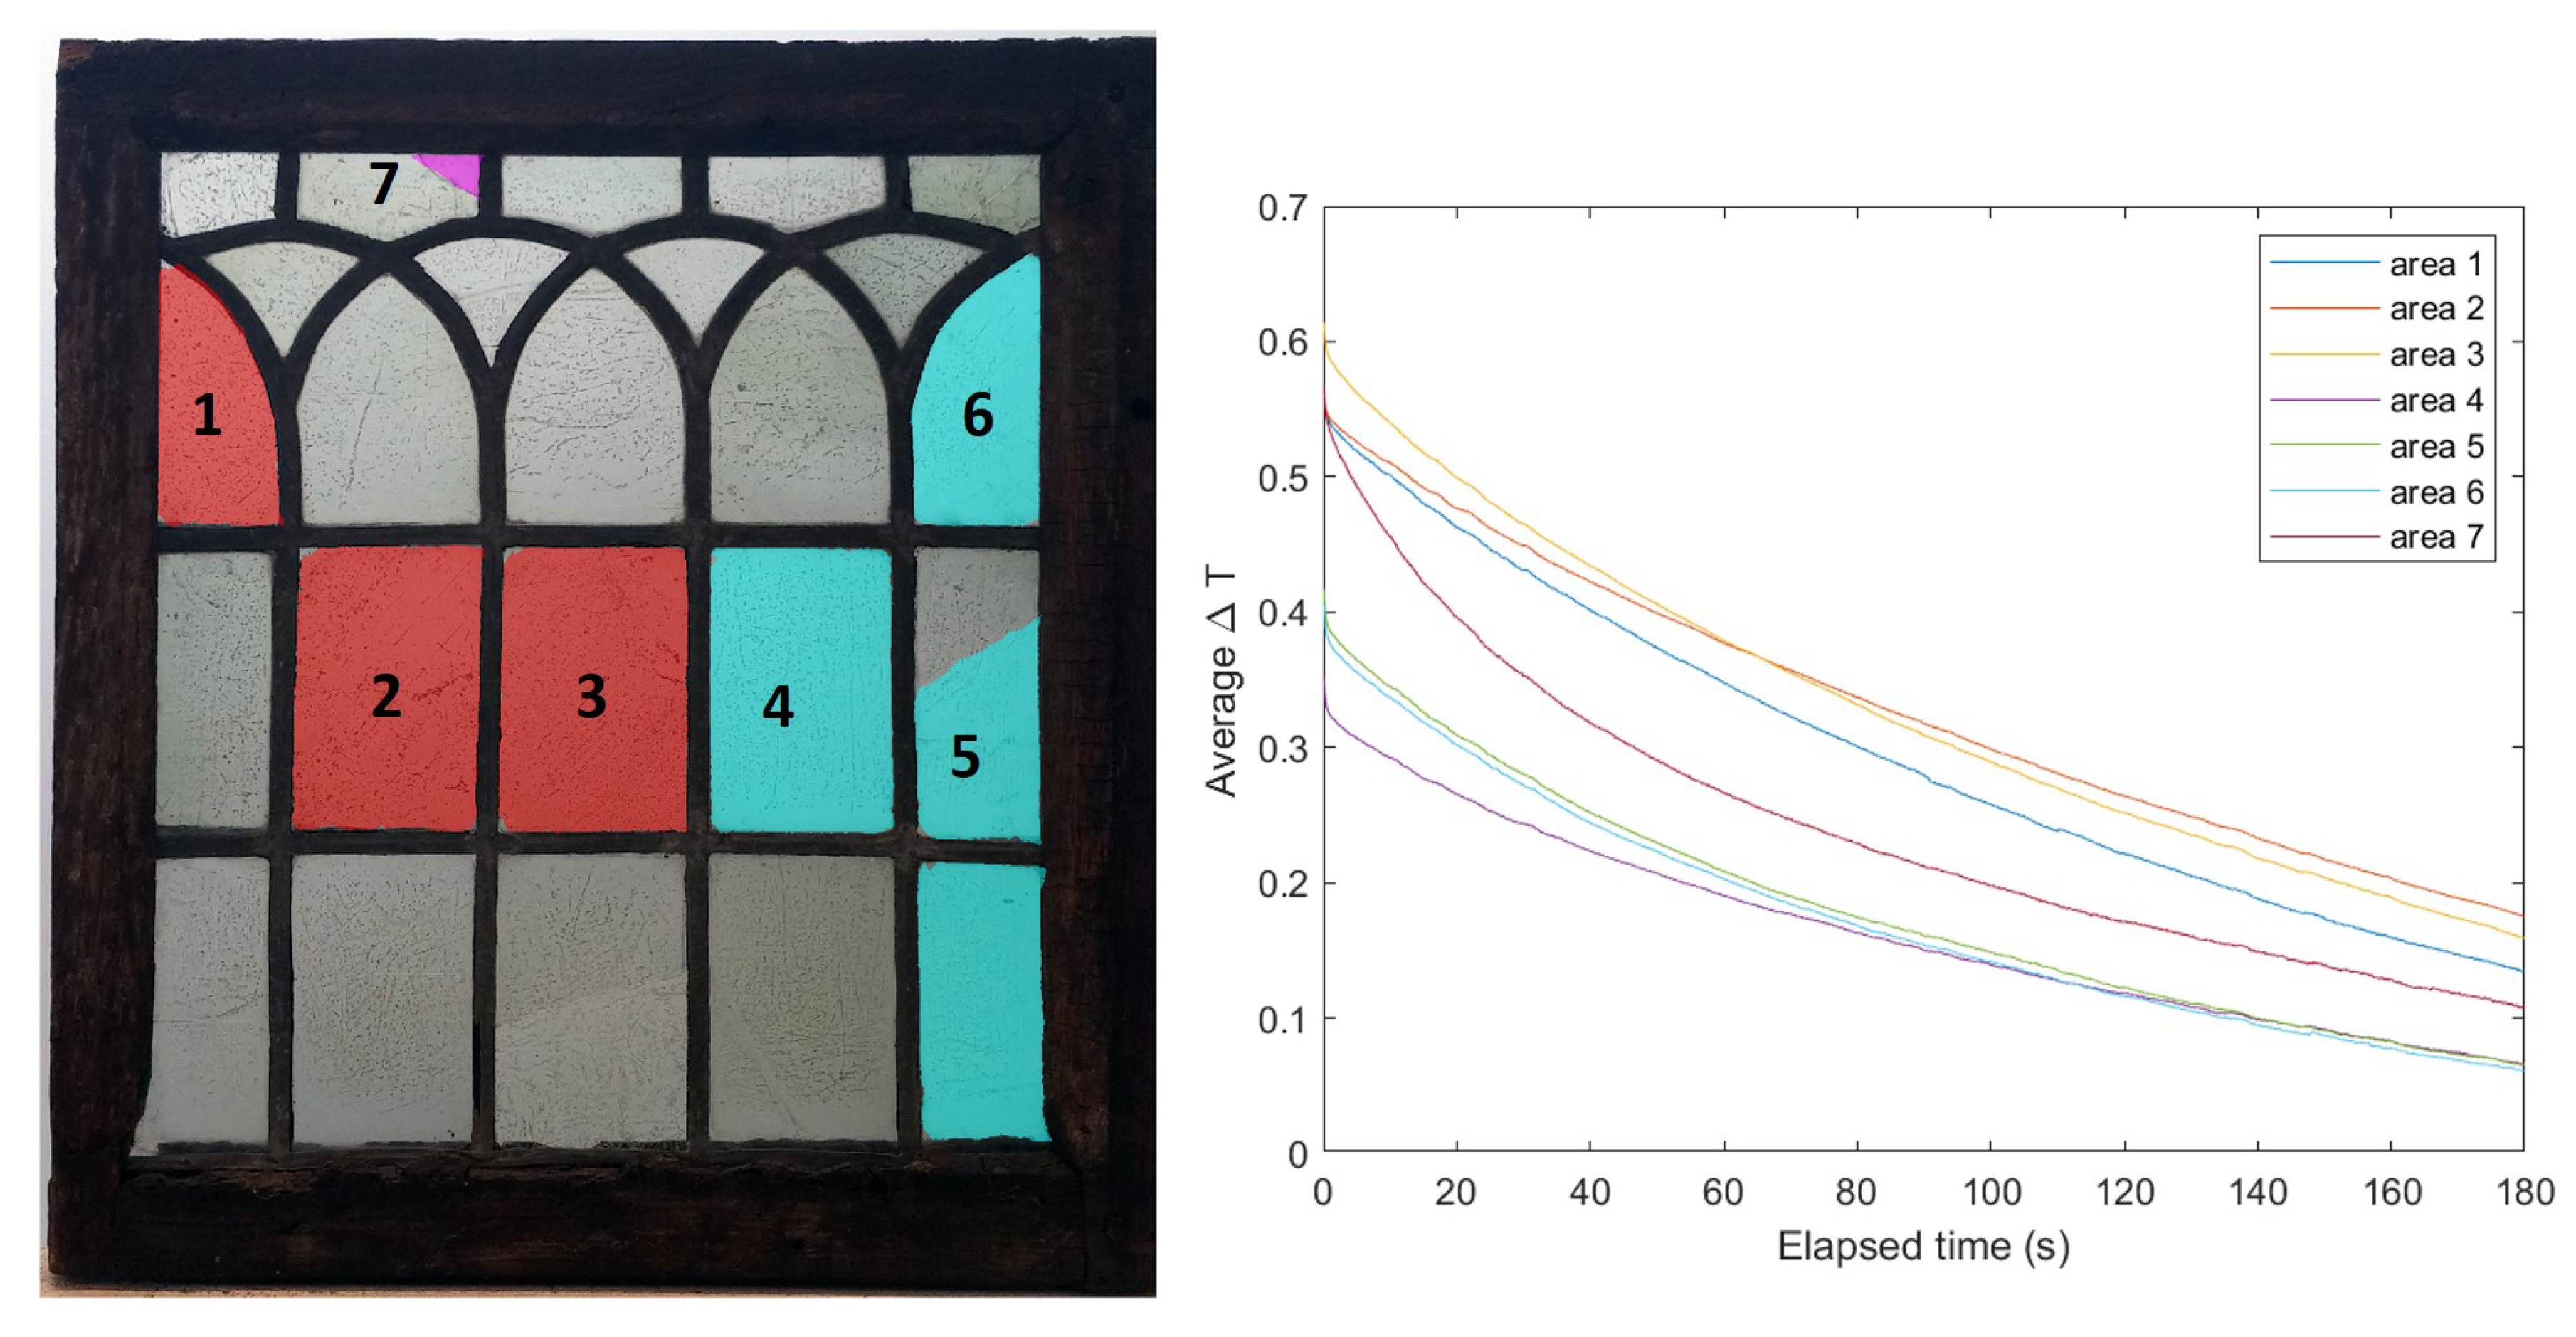
3.2. Clustering
4. Conclusions
Author Contributions
Funding
Acknowledgments
Conflicts of Interest
Abbreviations
| IRT | Infrared Thermography |
| MA-XRF | Macro X-ray Fluorescence |
| PCA | Principal Component Analysis |
| SEM-EDS | Scanning Electron Microscopy with energy dispersive X-ray detector |
| AFOV | Angular field of view |
| ROI | Region of Interest |
References
- Maldague, X.P.V.; Moore, P.O. Nondestructive Testing Handbook: Volume 3 Infrared and Thermal Testing, 3rd ed.; American Society for Nondestructive Testing, Incorporated: Columbus, OH, USA, 2001; ISBN 978-1-57117-044-6. [Google Scholar]
- Mercuri, F.; Orazi, N.; Paoloni, S.; Cicero, C.; Zammit, U. Pulsed Thermography Applied to the Study of Cultural Heritage. Appl. Sci. 2017, 7, 1010. [Google Scholar] [CrossRef]
- Gavrilov, D.; Maev, R.G.; Almond, D.P. A review of imaging methods in analysis of works of art: Thermographic imaging method in art analysis. Can. J. Phys. 2014, 92, 341–364. [Google Scholar] [CrossRef]
- Candore, J.C.; Bodnar, J.L.; Detalle, V.; Grossel, P. Non-destructive testing of works of art by stimulated infrared thermography. Eur. Phys. J. Appl. Phys. 2012, 57, 21002. [Google Scholar] [CrossRef]
- Blessley, K.; Young, C.; Nunn, J.; Coddington, J.; Shepard, S. The Feasibility of Flash Thermography for the Examination and Conservation of Works of Art. Stud. Conserv. 2010, 55, 107–120. [Google Scholar] [CrossRef]
- Miller, B.F. The Feasibility of Using Thermography to Detect Subsurface Voids in Painted Wooden Panels. J. Am. Inst. Conserv. 1977, 16, 27–35. [Google Scholar] [CrossRef]
- Avdelidis, N.P.; Koui, M.; Ibarra-Castanedo, C.; Maldague, X. Thermographic studies of plastered mosaics. Infrared Phys. Technol. 2007, 49, 254–256. [Google Scholar] [CrossRef]
- Yousefi, B.; Sfarra, S.; Sarasini, F.; Ibarra-Castanedo, C.; Xavier Maldague, X.P.V. Low-rank sparse principal component thermography (sparse-PCT): Comparative assessment on detection of subsurface defects. Infrared Phys. Technol. 2019, 98, 278–284. [Google Scholar] [CrossRef]
- Peeters, J.; Steenackers, G.; Sfarra, S.; Legrand, S.; Ibarra-Castanedo, C.; Janssens, K.; Van der Snickt, G. IR Reflectography and Active Thermography on Artworks: The Added Value of the 1.5–3 µm Band. Appl. Sci. 2018, 8, 50. [Google Scholar] [CrossRef]
- Zhang, H.; Sfarra, S.; Saluja, K.; Peeters, J.; Fleuret, J.; Duan, Y.; Fernandes, H.; Avdelidis, N.; Ibarra-Castanedo, C.; Maldague, X. Non-destructive Investigation of Paintings on Canvas by Continuous Wave Terahertz Imaging and Flash Thermography. J. Nondestruct. Eval. 2017, 36, 34. [Google Scholar] [CrossRef]
- Van der Snickt, G.; Legrand, S.; Caen, J.; Vanmeert, F.; Alfeld, M.; Janssens, K. Chemical imaging of stained-glass windows by means of macro X-ray fluorescence (MA-XRF) scanning. Microchem. J. 2016, 124, 615–622. [Google Scholar] [CrossRef]
- Legrand, S.; Van der Snickt, G.; Cagno, S.; Caen, J.; Janssens, K. MA-XRF imaging as a tool to characterize the 16th century heraldic stained-glass panels in Ghent Saint Bavo Cathedral. J. Cult. Herit. 2019, 40, 163–168. [Google Scholar] [CrossRef]
- Palomar, T.; Grazia, C.; Cardoso, I.P.; Vilarigues, M.; Miliani, C.; Romani, A. Analysis of chromophores in stained-glass windows using Visible Hyperspectral Imaging in-situ. Spectrochim. Acta Part A Mol. Biomol. Spectrosc. 2019, 223, 117378. [Google Scholar] [CrossRef] [PubMed]
- Perri, A.; Nogueira de Faria, B.E.; Teles Ferreira, D.C.; Comelli, D.; Valentini, G.; Preda, F.; Polli, D.; De Paula, A.M.; Cerullo, G.; Manzoni, C. Hyperspectral imaging with a TWINS birefringent interferometer. Opt. Express 2019, 27, 15956–15967. [Google Scholar] [CrossRef] [PubMed]
- Colomban, P. The on-site/remote Raman analysis with mobile instruments: A review of drawbacks and success in cultural heritage studies and other associated fields. J. Raman Spectrosc. 2012, 43, 1529–1535. [Google Scholar] [CrossRef]
- Colomban, P.; Tournié, A. On-site Raman identification and dating of ancient/modern stained glasses at the Sainte-Chapelle, Paris. J. Cult. Herit. 2007, 8, 242–256. [Google Scholar] [CrossRef]
- Machado, C.; Machado, A.; Palomar, T.; Alves, L.C.; Vilarigues, M. Debitus grisailles for stained-glass conservation: An analytical study. Conserv. Património 2019, in press. [Google Scholar] [CrossRef]
- Palomar, T.; Agua, F.; Gomez-Heras, M. Comparative assessment of stained-glass windows materials by infrared thermography. Int. J. Appl. Glass Sci. 2018, 9, 530–539. [Google Scholar] [CrossRef]
- Palomar, T.; Machado, C.; Agua, F.; Gomez-Heras, M. Thermographic analysis of glasses, enamels and grisailles from stained glass windows. In Proceedings of the 5th GLASSAC International Conference, Campus de Caparica, Portugal, 6–9 June 2017. [Google Scholar]
- Palomar, T.; Silva, M.; Vilarigues, M.; Cardoso, I.P.; Giovannacci, D. Impact of solar radiation and environmental temperature on Art Nouveau glass windows. Herit. Sci. 2019, 7, 82. [Google Scholar] [CrossRef]
- Micheletti, F.; Orsilli, J.; Melada, J.; Gargano, M.; Ludwig, N.; Bonizzoni, L. The role of IRT in the archaeometric study of ancient glass through XRF and FORS. Microchem. J. 2020, 153, 104388. [Google Scholar] [CrossRef]
- Melada, J.; Ludwig, N.; Micheletti, F.; Orsilli, J.; Gargano, M.; Bonizzoni, L. Flash Thermography Mapping of Degradation Patterns in Archaeological Glass. Proceedings 2019, 27, 5. [Google Scholar] [CrossRef]
- Kitamura, R.; Pilon, L.; Jonasz, M. Optical constants of silica glass from extreme ultraviolet to far infrared at near room temperature. Appl. Opt. 2007, 46, 8118–8133. [Google Scholar] [CrossRef] [PubMed]
- Krenzinger, A.; De Andrade, A.C. Accurate outdoor glass thermographic thermometry applied to solar energy devices. Sol. Energy 2007, 81, 1025–1034. [Google Scholar] [CrossRef]
- Larsen, S.F.; Hongn, M. Determining the infrared reflectance of specular surfaces by using thermographic analysis. Renew. Energy 2014, 64, 306–313. [Google Scholar] [CrossRef]
- Schalm, O.; Caen, J.; Janssens, K. Homogeneity, Composition and Deterioration of Window Glass Fragments and Paint Layers from Two Seventeenth-Century Stained Glass Windows Created by Jan de Caumont (~1580–1659). Stud. Conserv. 2010, 55, 216–226. [Google Scholar] [CrossRef]
- Jembrih-Simbürger, D.; Neelmeijer, C.; Schalm, O.; Fredrickx, P.; Schreiner, M.; De Vis, K.; Mäder, M.; Schryverse, D.; Caen, J. The colour of silver stained glass—Analytical investigations carried out with XRF, SEM/EDX, TEM, and IBA. J. Anal. At. Spectrom. 2002, 17, 321–328. [Google Scholar] [CrossRef]
- Janssens, K.; Vittiglio, G.; Deraedt, I.; Aerts, A.; Vekemans, B.; Vincze, L.; Wei, F.; De Ryck, I.; Schalm, O.; Adams, F.; et al. Use of Microscopic XRF for Non-destructive Analysis in Art and Archaeometry. X-ray Spectrom. 2000, 29, 73–91. [Google Scholar] [CrossRef]
- Yousefi, B.; Sfarra, S.; Ibarra-Castanedo, C.; Avdelidis, N.P.; Maldague, X.P.V. Thermography data fusion and nonnegative matrix factorization for the evaluation of cultural heritage objects and buildings. J. Therm. Anal. Calorim. 2019, 136, 943–955. [Google Scholar] [CrossRef]
- Davidson, S. Conservation and Restoration of Glass, 2nd ed.; Oddy, A., Linstrum, D., Baer, N.S., Eds.; Butterworth-Heinemann: Oxford, UK, 2003; ISBN 0-7506-43412. [Google Scholar]
- Aghabozorgi, S.; Shirkhorshidi, A.S.; Wah, T.Y. Time-series clustering—A decade review. Inf. Syst. 2015, 53, 16–38. [Google Scholar] [CrossRef]


© 2020 by the authors. Licensee MDPI, Basel, Switzerland. This article is an open access article distributed under the terms and conditions of the Creative Commons Attribution (CC BY) license (http://creativecommons.org/licenses/by/4.0/).
Share and Cite
Hillen, M.; Legrand, S.; Dirkx, Y.; Janssens, K.; Van der Snickt, G.; Caen, J.; Steenackers, G. Cluster Analysis of IR Thermography Data for Differentiating Glass Types in Historical Leaded-Glass Windows. Appl. Sci. 2020, 10, 4255. https://doi.org/10.3390/app10124255
Hillen M, Legrand S, Dirkx Y, Janssens K, Van der Snickt G, Caen J, Steenackers G. Cluster Analysis of IR Thermography Data for Differentiating Glass Types in Historical Leaded-Glass Windows. Applied Sciences. 2020; 10(12):4255. https://doi.org/10.3390/app10124255
Chicago/Turabian StyleHillen, Michaël, Stijn Legrand, Yarince Dirkx, Koen Janssens, Geert Van der Snickt, Joost Caen, and Gunther Steenackers. 2020. "Cluster Analysis of IR Thermography Data for Differentiating Glass Types in Historical Leaded-Glass Windows" Applied Sciences 10, no. 12: 4255. https://doi.org/10.3390/app10124255
APA StyleHillen, M., Legrand, S., Dirkx, Y., Janssens, K., Van der Snickt, G., Caen, J., & Steenackers, G. (2020). Cluster Analysis of IR Thermography Data for Differentiating Glass Types in Historical Leaded-Glass Windows. Applied Sciences, 10(12), 4255. https://doi.org/10.3390/app10124255