1. Introduction
There has been a renewed interest in the last decades concerning Switched Reluctance Motor (
SRM) drives for a wide range of applications. One of the applications in which several studies were made about the type of motor that is more adequate to be used, is related to the electric vehicles (
EV). From these studies, it was possible to see that the
SRM is a very interesting option for this kind of application [
1,
2,
3,
4]. Another application that was verified that this machine is indicated to be used due to their simplicity and robust design, is related to their use as generator, namely, to extract energy from the wind and ocean waves [
5,
6,
7,
8,
9,
10]. This machine is also very indicated to be used in applications associated with water pumps [
11,
12]. There are also other applications in which this machine can also be used as can be seen in the work [
13]. In fact, in most safety-critical applications a continuous drive operation (in normal or degraded mode) must be assured in the presence of a drive failure until a possible stop to repair. The interest in this motor is due to some important characteristics, such as high reliability level, high efficiency, simplicity of operation, and robust structure [
13]. In contrast to other motors, the
SRM has magnetic independence of the motor phases and withstands certain failure modes in motor windings or in the inverter circuitry without excessive degradation of its operation.
Electrical drives play, in general, a very important role in many industries and applications, being essential to detect and diagnose failures in a very early stage in order to avoid risk to human life, damage of the environment or high costs arising from downtime, among other problems. Using suitable detection and diagnosis methods it becomes possible to replace faulty devices or parts by on-line or standby redundant devices and/or apply fault-tolerant control strategies.
One of the characteristics of the
SRM is that it requires a power electronic converter [
9,
10,
11,
12,
13,
14,
15,
16,
17,
18]. Although the
SRM presents a very high reliability level, the same does not happen with the power converter [
19]. Normally the main problems of power converters are the failures in the power semiconductor devices. There are two possible failure modes associated with these components: open and short-circuit failures. In the case of an open-circuit failure, there will be a break in the excitation of the motor winding that is connected to such device. This can seriously affect the speed and torque of the motor. On the other hand, under short-circuit failure mode, the current through the motor winding connected to the power device under fault will increase to values that can irremediably damage that winding if proper precautions are not taken. To mitigate such problems, a fast-reliable detection and diagnosis of the power device under failure is normally necessary to minimize abnormal functioning and to avoid possible damages in the motor.
To overcome these problems a fault-tolerant power converter is required. Thus, several research papers have been addressed to this topic. In [
20,
21] it is proposed an asymmetric three-level neutral point diode clamped converter for the
SRM drive. However, this scheme does not handle with all types of failure modes. In [
22] another scheme is presented that also has fault-tolerant capability. In this scheme it is only required additional connections between the converter legs. However, it does not provide fault tolerance to short-circuit failures in the power devices. Other fault-tolerant topologies are presented in [
23,
24,
25]. However, they require extra transistors and/or an
SRM with extra connection windings per phase.
As mentioned before, one of the most important aspects related to fault-tolerant converters is the requirement of reliable fault detection and diagnosis methods [
26,
27,
28,
29]. The identification of a power device failure requires the use of advanced algorithms. It should be noted that often, such failures could be very difficult to detect. In case, for example, of a short-circuit failure, in some conditions, the current in the winding associated with the faulty device does not increase to accentuated values [
30]. The main developed fault detection methods have been based on sensing two variable types: voltage and current. Methods that are based on voltage sensors are presented in [
31,
32]. The first proposal is based on the analysis of the voltage patterns. For this analysis, it was used a method based on symmetry indexes. In these approaches, it is required the use of a voltage sensor for each of the windings. Other approaches based on voltage sensors have also been proposed. This is the case of the method presented in [
33] which requires an extra
DC-link current sensor. Regarding the methods based on current sensors, these have been considered more interesting. With the purpose to use the inherent current sensors associated with the motor windings, a method based on the average values of those currents was proposed in [
34]. In [
35] it was proposed a method to diagnose the
SRM drive through the use of Wavelet Packet Decomposition. Another approach based on the current sensor is proposed in [
36]. This allows for a real time diagnosis and is able to determine the location of the faulty power device. However, it requires a different power topology to include one or two current sensors, which are not linked to the current sensors associated with the motor windings.
As referred,
SRM machines and drives with fault-tolerant capability could be very important in several applications. One of the applications in which that capability is critical is on aircrafts since the security of the passengers and crew is at stake. So, a research about the use of an
SRM with fault-tolerant capability for an electromechanical actuator that moves a rudder or an aileron of an aircraft was presented in [
32]. In [
33] it is presented an
SRM configuration that is applicable for a fuel pump drive in an aircraft. In the work [
34] permanent magnet assist, segmented rotor, switched reluctance drive has been constructed, tested and shown to be a strong contender for aerospace applications. Another application in which high reliability is critical is the nuclear power plant. In this context, in [
35] was presented a fault-tolerant control strategy for the failure of the power converter of
SRM valve electric actuator used in nuclear power plants. The use of
SRM machines with fault tolerance capability can also be very important in electric vehicles [
36].
With the purpose to obtain a reliable SRM drive a new fault-tolerant power converter scheme associated with a fault detection and diagnosis algorithm for power devices is proposed in this paper. For the detection of a failure in the power semiconductors of the SRM drive, it is proposed a fast and reliable fault diagnosis algorithm. This algorithm can detect open or short-circuit failures in power semiconductors of the power converter. It also generates normalized indexes in order to be immune to load and speed conditions. Besides the fast response, the proposed algorithm also presents robustness to problems related to noise. Several simulation and experimental results will be presented to demonstrate the proposed fault-tolerant solution.
2. Impact and Mitigation of a Power Semiconductor Failure in the Switched Reluctance Motor Drive
For the switched reluctance motor, the power electronic converter is considered an essential device for its correct operation. In fact, a failure in one of the power semiconductors is able to produce high torque and speed variations and may lead to motor damages. Several topologies can be adopted for the power electronic converter in the
SRM drive, but in all of them, a failure in a power semiconductor will give rise to the problems already referred. In this work, it will be used a topology based on the asymmetrical half-bridge converter (
AHB) but with fault-tolerant capability.
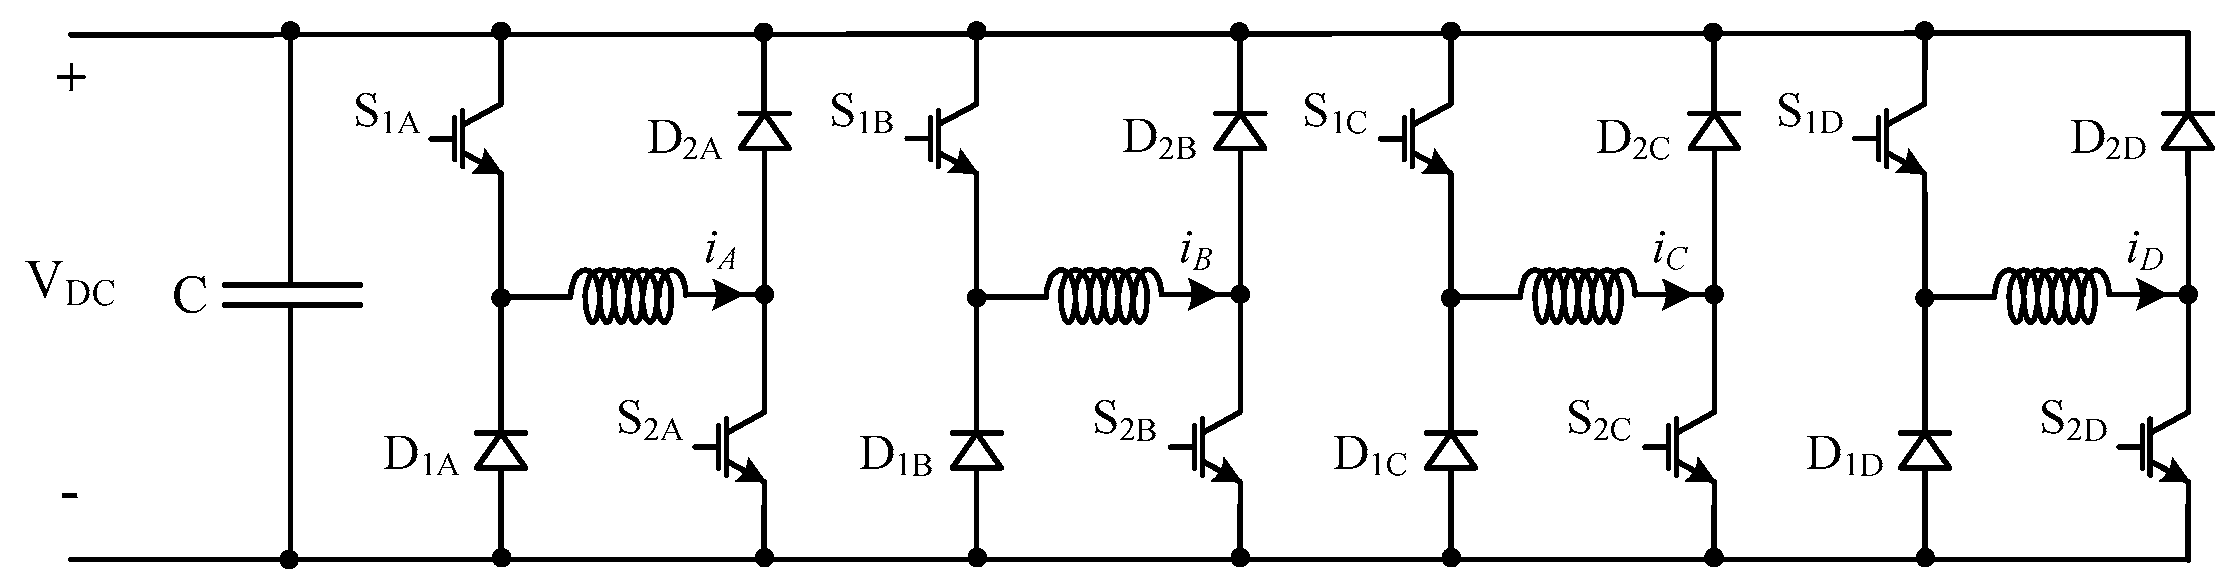
Figure 1 shows the power circuit of a classic
AHB topology applied to the 8 / 6
SRM. In this topology, associated with each phase bridge leg there are two fully controlled power semiconductors and two freewheeling diodes.
As mentioned before, a failure in one power device will affect the SRM drive operation. Usually, in each phase there are different possible failure modes associated with transistors. They are associated with open transistor failure, and to short-circuit transistor failure. These kinds of faults (open or short-circuit) could happen in the upper or lower transistor.
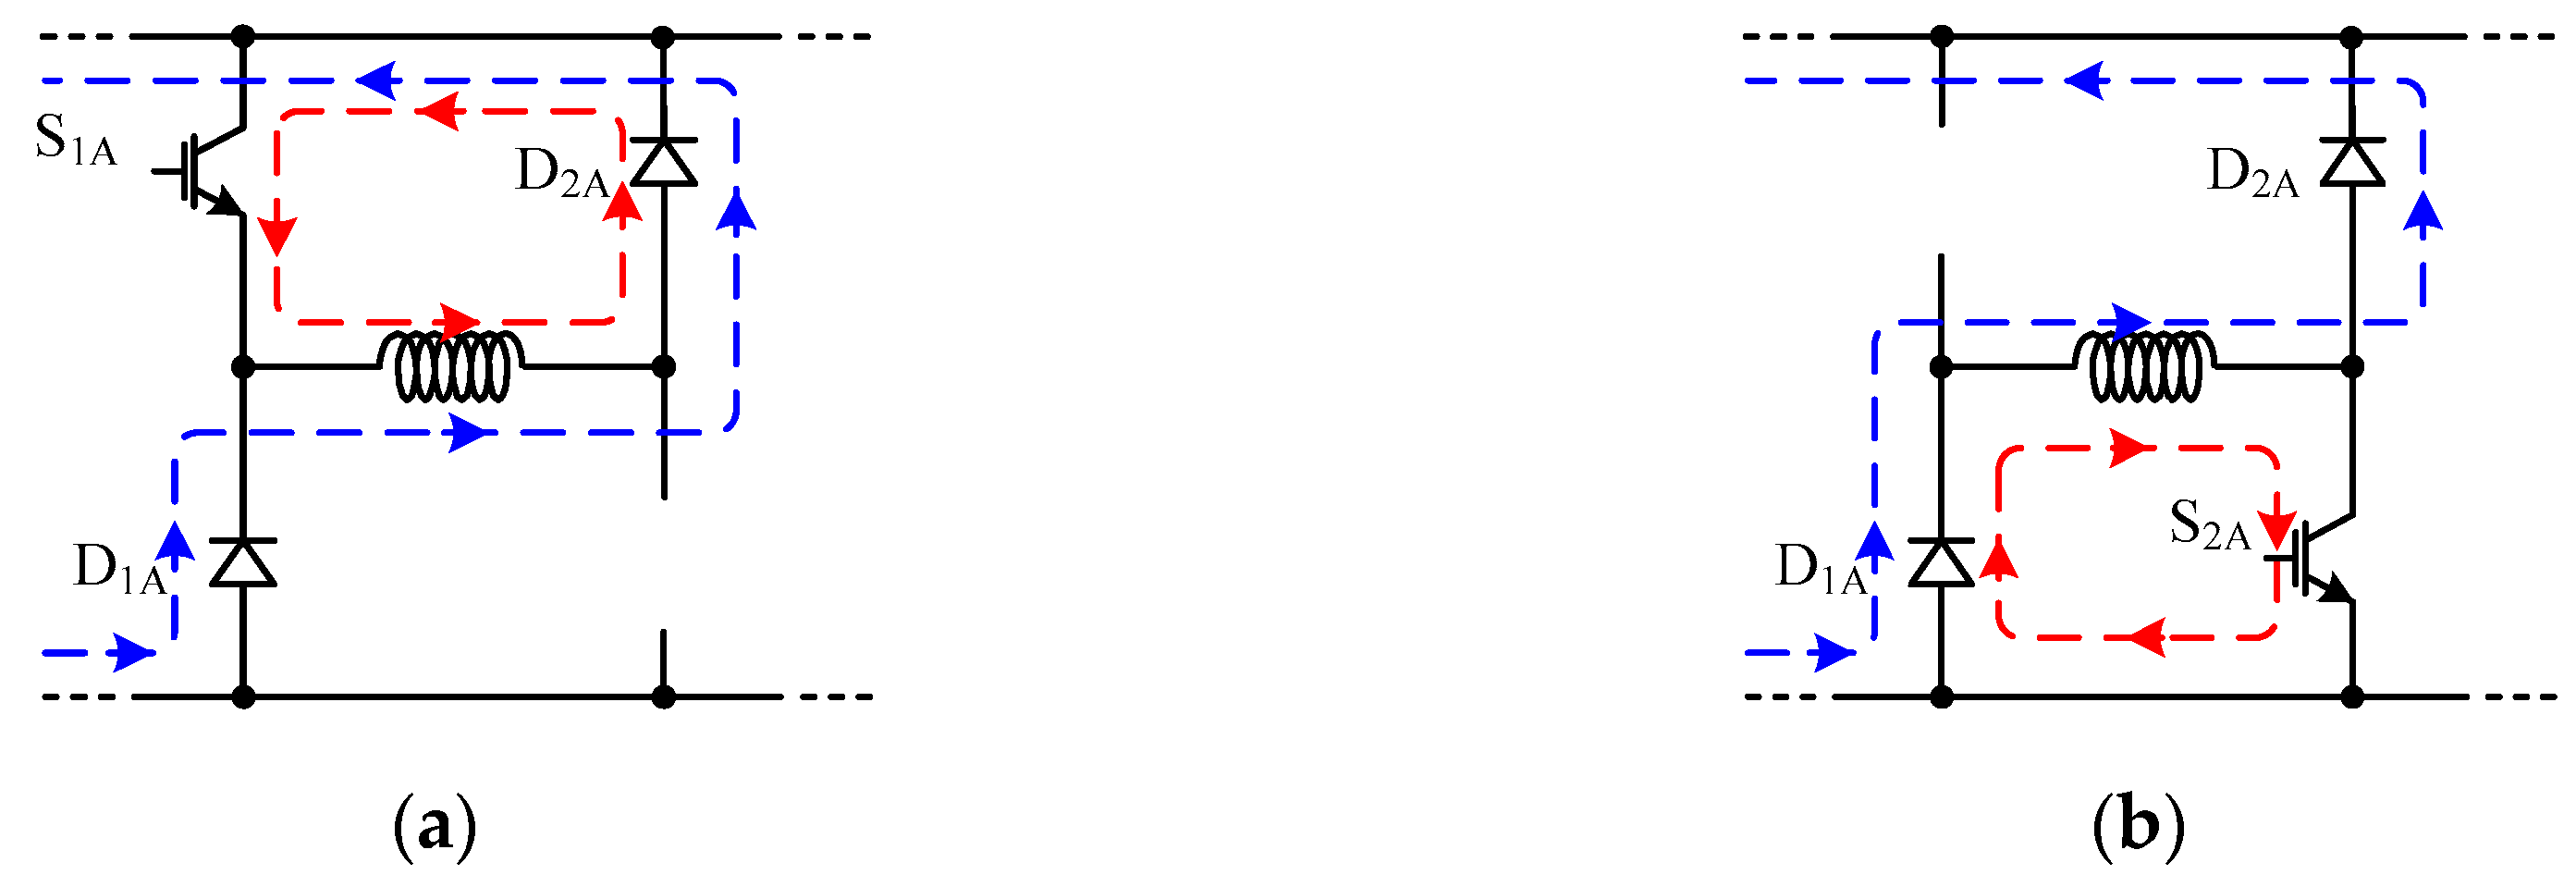
After an open-circuit failure in a power device, it will no longer be possible to excite the phase connected to the faulty leg.
Figure 2 shows an example of the possible current paths in case of an open-circuit failure in the power devices
S2A or
S1A. In
Figure 3 it is possible to see the winding currents of the 8 / 6
SRM when the converter operates with an open-circuit failure. These waveforms were obtained through the use of a current chopping control. In this figure is possible to see the absence of current in one of the phases caused by open-circuit failure. This failure has impacted on the average electromagnetic torque causing a significant reduction [
36].
The occurrence of a short-circuit failure in a power device will also affect the phase connected to the faulty leg. Considering this failure mode, it will no longer be possible to reverse the voltage at the winding terminals of the faulty phase, as shown in
Figure 4. This figure shows an example of the possible current paths in case of a short-circuit failure in the power devices
S2A or
S1A. Considering this failure mode, a large current may appear in the motor winding connected to the faulty bridge leg.
Figure 5 presents the motor winding currents of the 8/6
SRM after a short-circuit failure using the current chopping control. Through this figure is possible to see how large can be the current in the winding associated with the faulty bridge leg. This large amount of current depends on several factors, such as the turn-on and turn-off angles of the healthy devices and the machine speed. So, due to this fault, it will not be possible to apply a negative voltage to the winding connected to the switch under fault, not being possible a quick demagnetization of the winding, as required. Depending on the current amount and the faulty time duration, this can be a dangerous situation for the machine and power converter, putting under stresses its materials and components.
To mitigate the impact of power devices failure modes in the drive and
SRM, a fault-tolerant power converter is required. Thus, it is proposed in this paper a fault-tolerant circuit that can handle with open or short-circuit failures in power devices. This fault-tolerant topology can be seen in
Figure 4. This topology does not require extra power semiconductors and only uses solid state relays (
SSRs) to connect the faulty legs to other healthy phase in order to replace and isolate the faulty devices. It should be noted that the use of mechanical relays is possible, but they are usually not compatible with the operation of the
SRM drives, especially for high-speed operation. These devices take about 10 ms to perform any operation, which represent several periods without proper control in the phase winding. Instead of mechanical relays, the proposed solution uses
SSRs since they can withstand
PWM frequencies around 5 kHz, which represent switching times around 0.2 ms (50 times faster than mechanical relays). In the proposed fault-tolerant topology the
SSRs were designed to operate once after the fault diagnosis, remaining in that position.
Analyzing the topology presented in
Figure 4 it is possible to observe that an open or short-circuit failure in one of the power devices can be solved through the reconfiguration of the circuit. An example of this operation can be seen in
Figure 5, considering an open or short-circuit failure in the power device
S1A. In this situation the leg connected to the faulty power device is isolated and the similar legs connected to motor winding
C will also be used to control the current in winding
A. In this case, the power device
S1C will be used to control the current in two windings (
A and
C). In this way, it will be obtained fault-tolerant capability for these kinds of faults.
3. Proposed Fault Diagnosis Method
This section presents a fast and reliable method for the detection and diagnosis of a faulty power device. The proposed fault diagnosis method is based on the definition of indexes related to the pattern of the winding currents. For the definition of these indexes, it will be used a monitoring method based on a statistical process. The statistical method it based on the entropy feature introduced initially by Shannon [
37]. Although the concept of entropy was originally introduced in thermodynamics [
38], its concepts and relevant principles have been used in many other areas such as information theory [
39,
40,
41], biological diversity [
42], statistical mechanism, financial markets [
43], signal processing [
44] and pattern recognition [
45]. This statistic tool allows using a large number of data and measures the randomness or uncertainty of the system variables.
To implement the entropy feature approach for the identification of the faulty patterns, it is necessary to acquire first the motor winding currents through current sensors. For the identification of the patterns it will be used a set of samples related to each winding current. On the other hand, to obtain the time behavior of the patterns, it is used a sliding window. Thus, a data sample matrix
of the currents will be created (1), with n samples and
N variables.
The identification of the patterns will be made through the entropy feature of each column of the matrix
X. Many different types of entropy methods have been developed for different application areas [
46,
47]. Thus, from the data sample of each current signal of the matrix it will be computed the corresponding entropy at instant p determined by (2).
where
is a set of current phase variables with a data sample matrix with
n samples for each current phase and
k = A,
B,
C,
D is the index of each current phase.
After the computation of the entropy feature value for each current at instant
p it will be used normalized indexes (diagnostic variables) that are independent of the load and speed of the motor, in order to allow the diagnosis and identification of a faulty power device. These normalized indexes are defined as:
Through Equations (3) and (4) it is possible to obtain the symmetry/asymmetry index (
SI). However, several
SI will be defined in order to associate the current patterns with each power device, connected to each motor winding. For the machine under study (8/6
SRM) four
SI (
A,
B,
C, and
D) will be considered and four
SI indexes are defined in accordance with (5) (where
k = A,
B,
C,
D):
Since in (2) there is a logarithm of absolute of current value, if the currents are 0 then a computation problem could appear. Thus, in order to avoid this problem, it is considered a condition that if the current is 0 then it is computed the logarithm of absolute of eps value. This parameter is a constant value and equal to 2–52.
The different values of the diagnostic variables (SI index) will diagnose and identify the power device under failure. So, if there is a symmetry in the current patterns, then the four diagnostic variables will be, approximately, equal to one. If there is an asymmetry due to a short or open-circuit failure, then the diagnostic variables will be no longer near one. So, for an open-circuit failure, the diagnostic variable associated with the faulty power device will change from one to zero. The other diagnostic variables will also change, but for a positive value higher than one. In case of a short-circuit failure, the diagnostic variable associated with the faulty power device will change from one to a positive value higher than one. The other three diagnostic variables will change from one to a positive value lower than one.
Taking into account the defined diagnostic variables, it is possible to establish a decision table where the different failure conditions are characterized. In
Table 1 those characteristics are presented for the several conditions associated with the switches of phase
A.
Since the quantities provided by the diagnostic variables are very well defined and independent of the load and speed, it is quite easy to define threshold values associated with each failure mode. It should be noted that the proposed fault diagnosis method was only developed for the power semiconductors of the machine drive. However, asymmetries in the winding resistances could affect the choice of the threshold values. So, if the machine has a current control, then the current waveforms of the windings will be the same even when there are windings with different resistances. However, if there is not current control of the windings, then asymmetries in the current waveforms of the windings will appear. In this case, the current waveform associated with the winding with higher resistance will have lower amplitude. Since the method is based on the definition of indexes related to the pattern of the winding currents, then a difference between the diagnostic variables (SI index) will appear. However, since in the case of a fault in the power semiconductors will severely affect the current waveform of the winding associated with the leg under fault, then changes in the resistors by for example 20 % will not require to set up thresholds. In fact, those thresholds should be chosen considering winding resistances superior to 50%.
One of the limitations of the method is when their faults associated with all the phases. In this case, since the proposed method is based on the definition of indexes related to the pattern of the winding currents, and taking into consideration that in this situation all the current waveforms will be the same, all the diagnostic variables (SI index) will present the same value indicating that there is not a fault.
4. Simulation Analysis
This section is dedicated to simulating the proposed diagnostic method in order to confirm the theoretical assumptions presented in the previous section. The simulation studies and respective results were achieved using the software
Matlab/Simulink. It was adopted the four-phase 8/6
SRM model that is available at the
Simscape Simulink Library. The characteristics of the machine are presented in
Table 2. The proposed method was tested for different operating conditions of the
SRM considering different transistor failure modes and different devices.
The first simulation test was made for the proposed detection method considering an open-circuit failure mode under a 600 rpm motor speed. To verify the dynamic behavior of the fault detection method, the motor was operating initially with the drive in normal condition (without failures) and at
t = 1 s, where
t denotes time, an open-circuit failure in the upper transistor of phase
A (
S1A) was introduced.
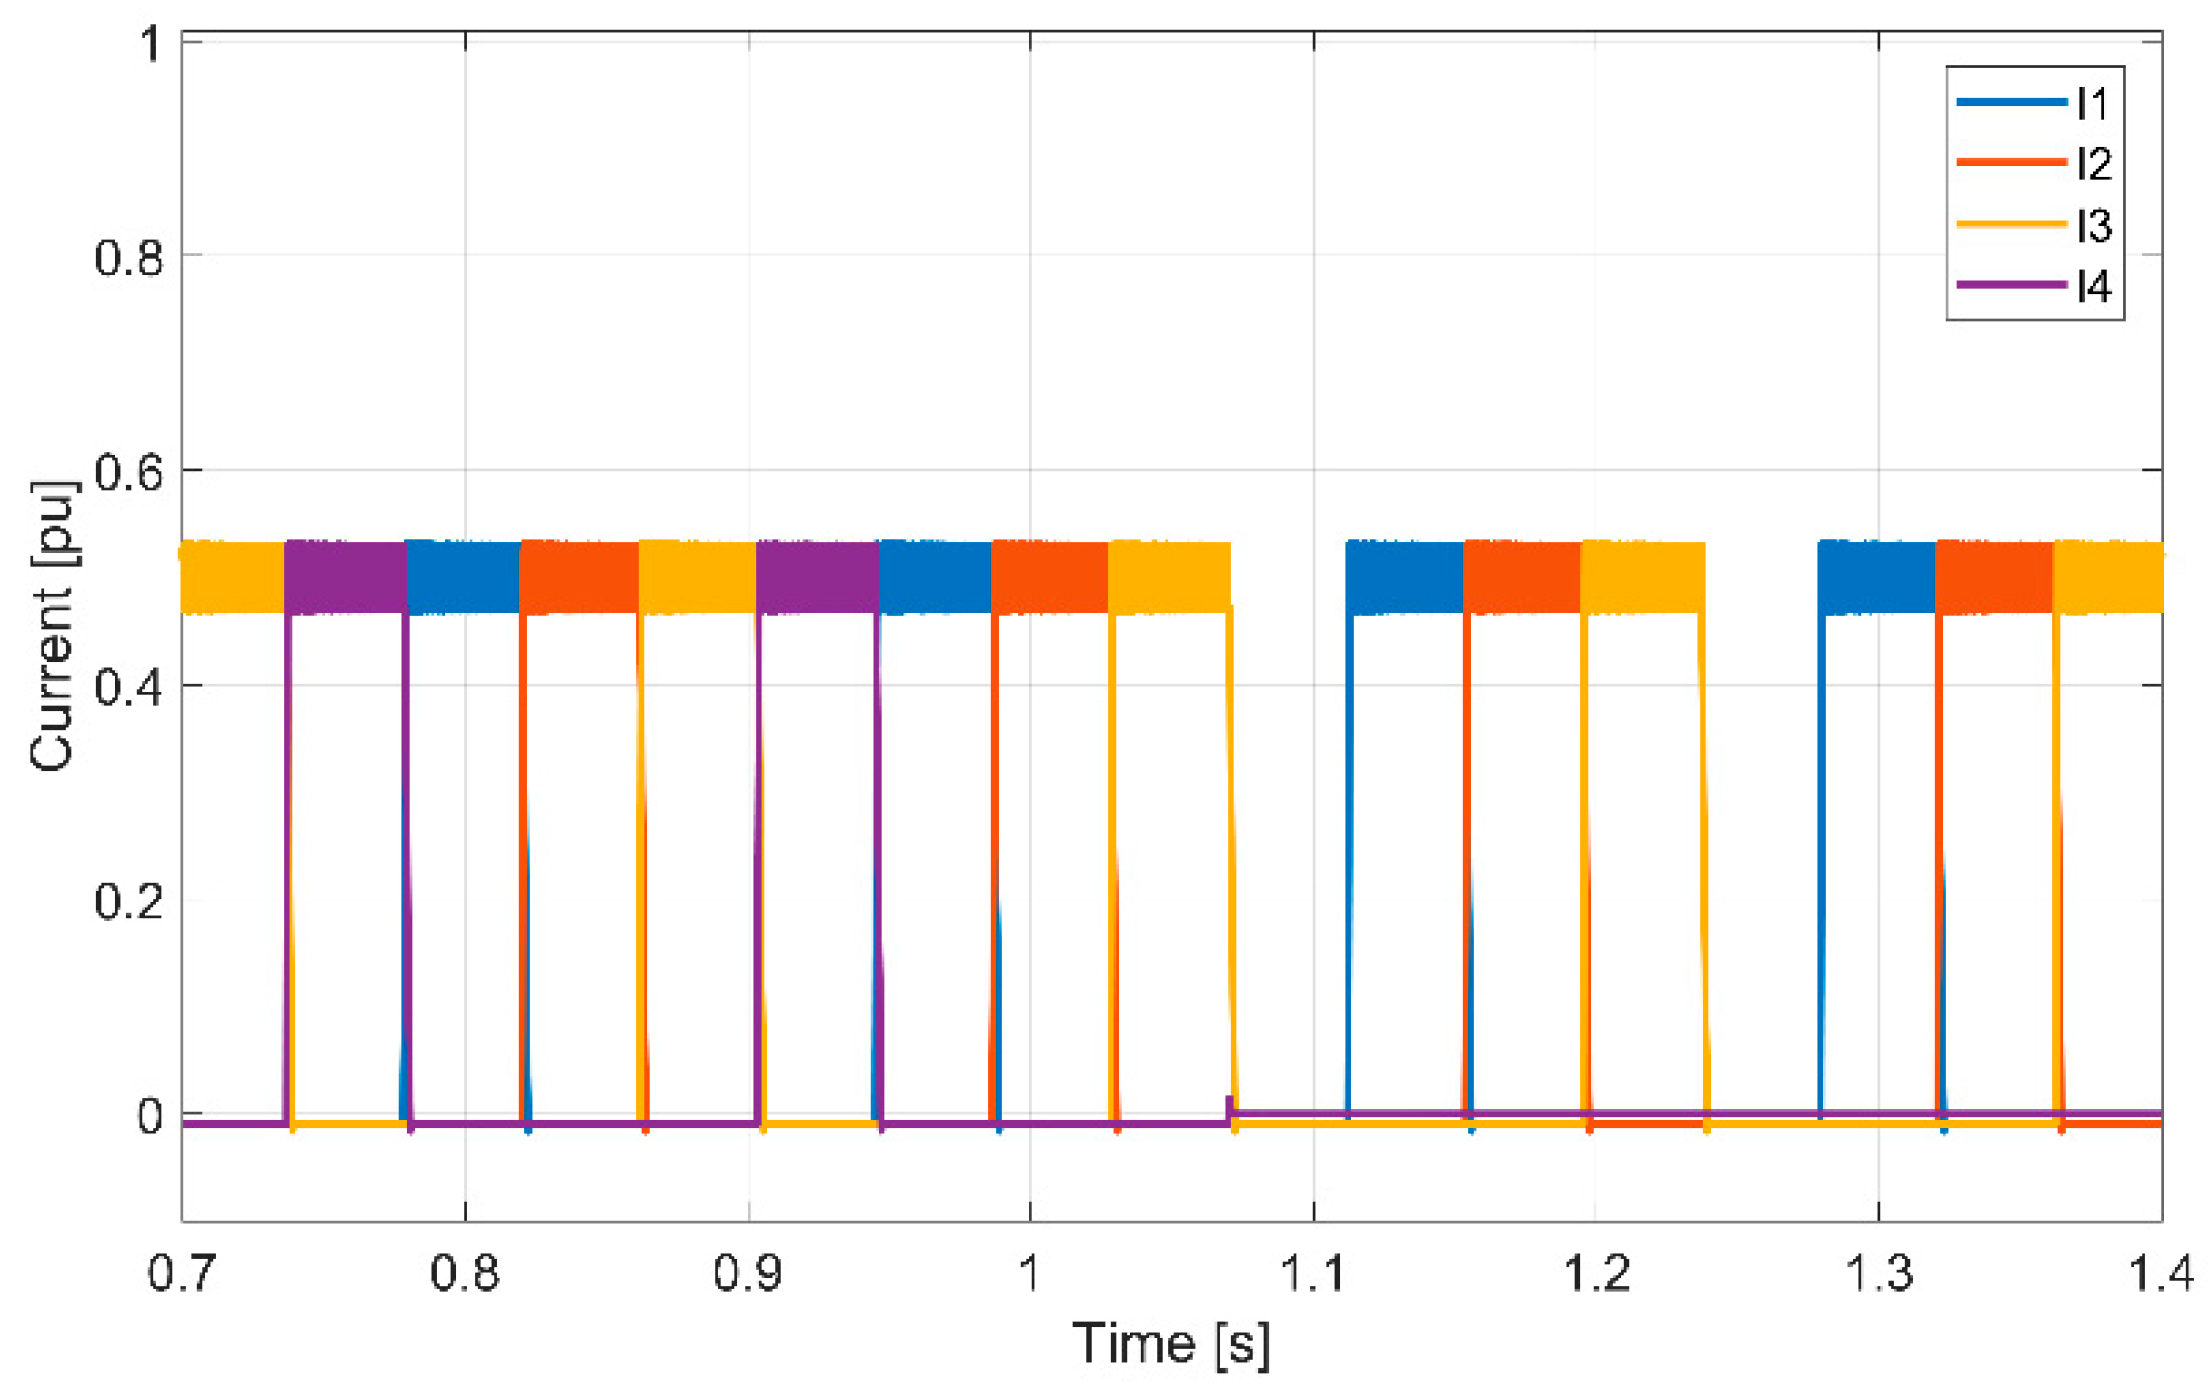
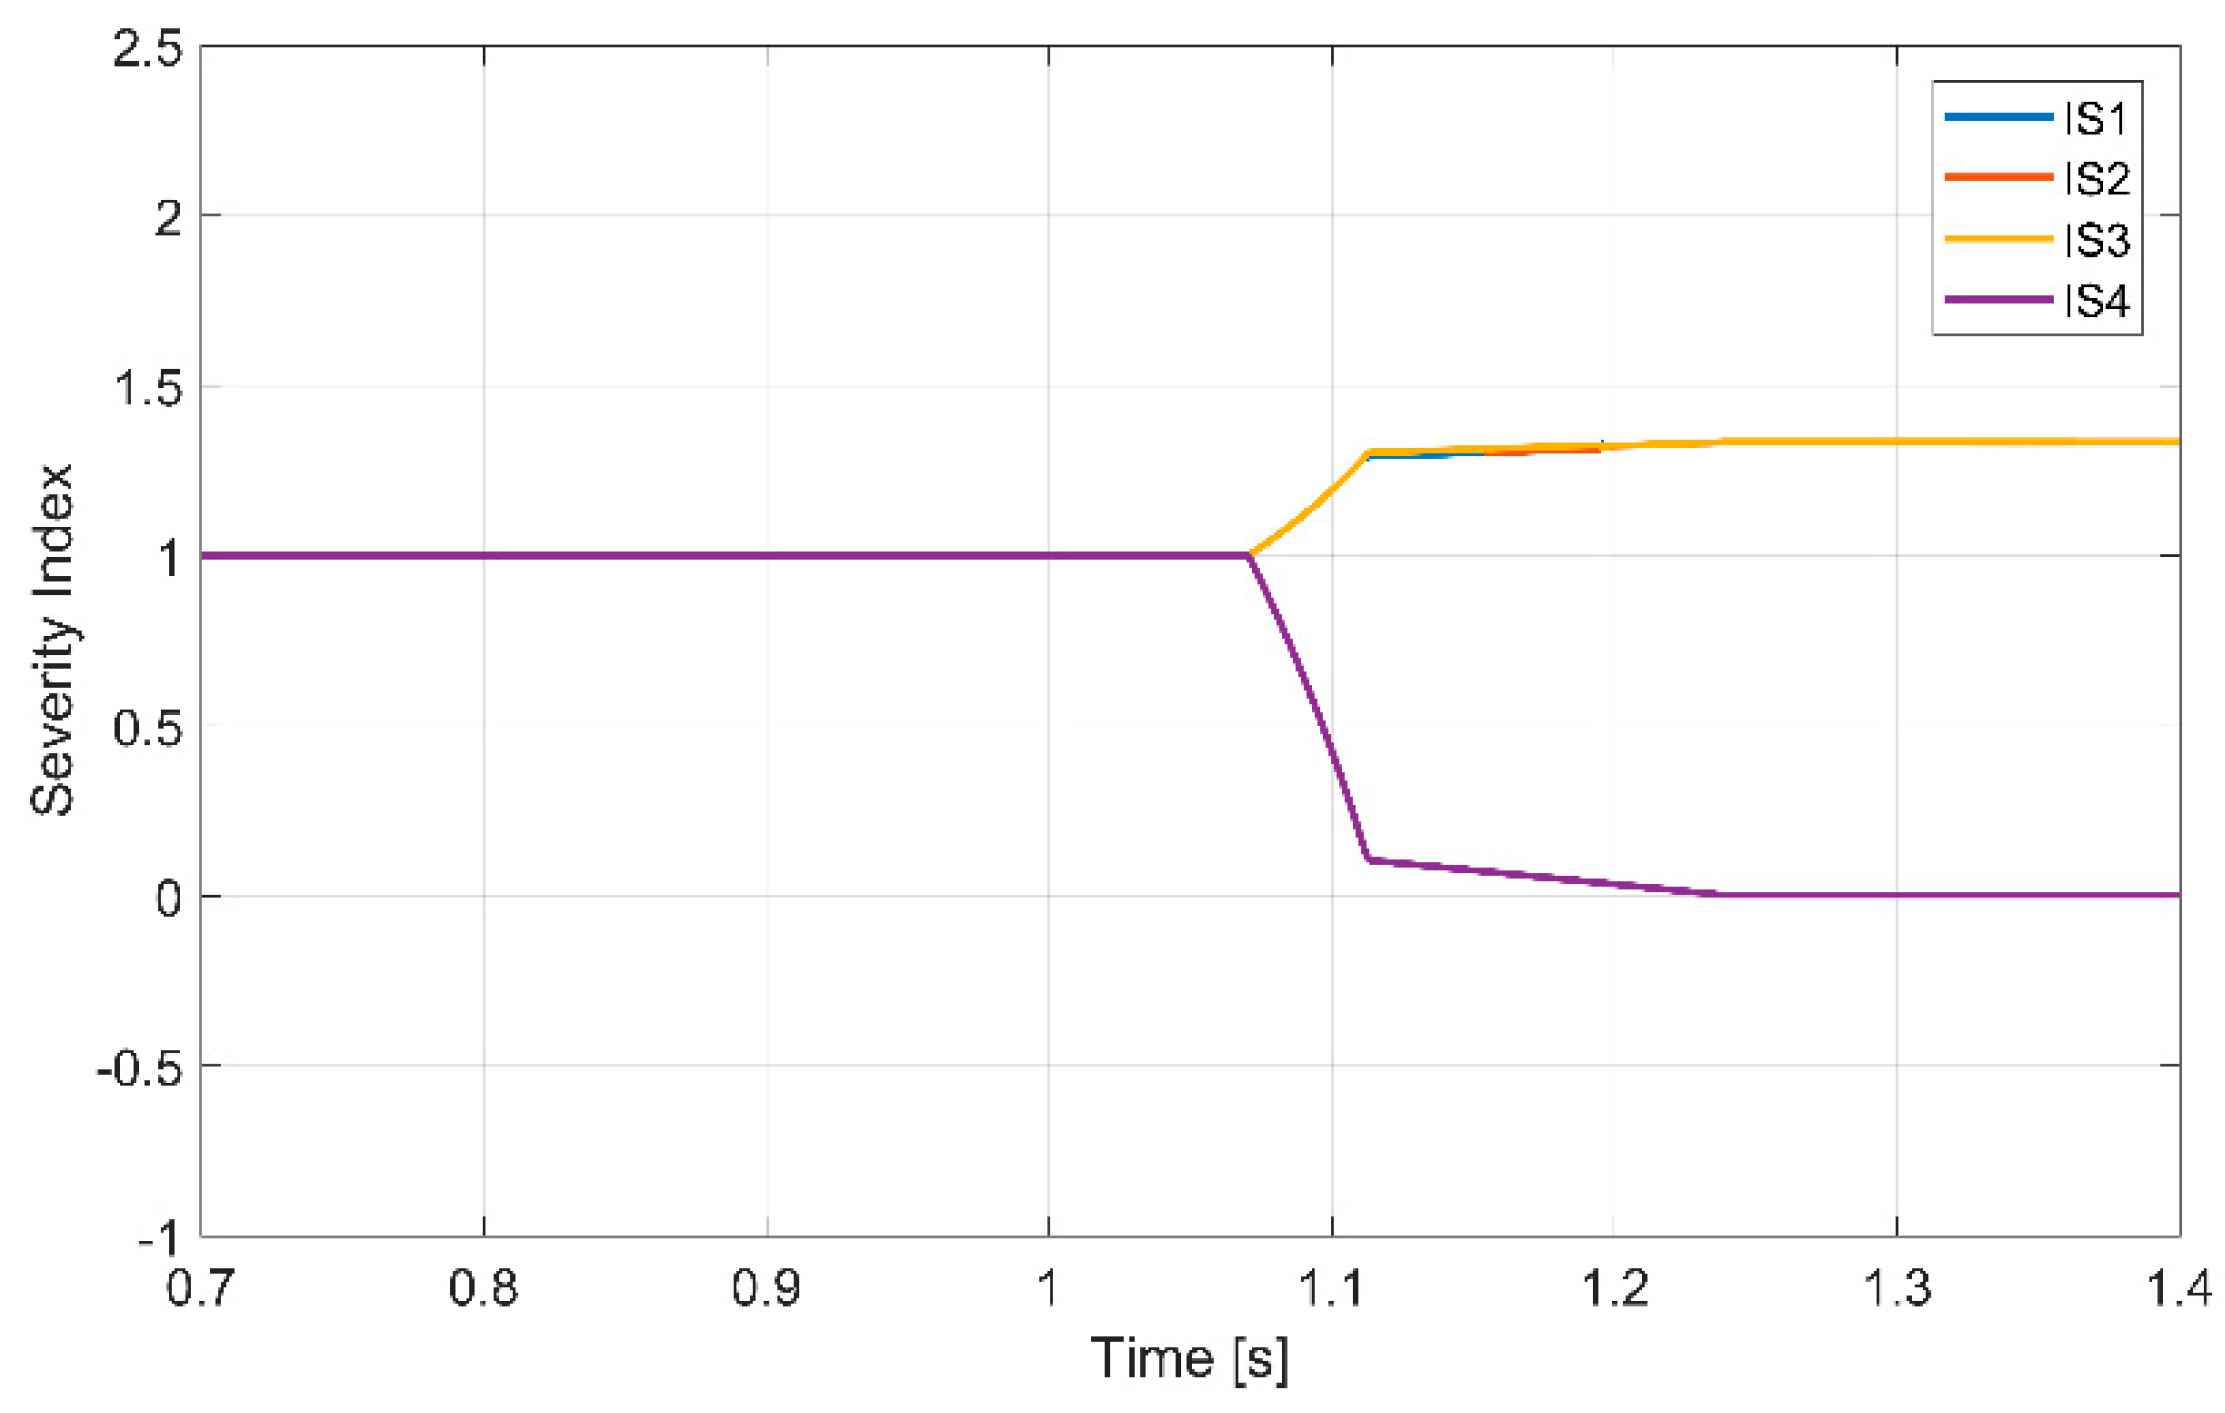
Figure 6 shows the motor winding currents before and after the failure. The corresponding result of the diagnostic variables generated by the proposed algorithm is presented in
Figure 7. As shown in this figure, after the fault the diagnostic variable associated with the motor phase connected to the leg of the open transistor will change immediately their value from one to zero. The other diagnostic variables will also change from one to a higher value (1.3). This confirms what was expected for the diagnostic variable behavior for this failure mode.
A test for the same fault but for an increased motor speed (600 rpm) was also realized. In this test, the fault happened in a different power device, more specifically the one associated with phase A (
S1A). The obtained result of the motor winding currents can be seen in
Figure 8. As in the previous case, the fault appeared at
t = 1 s. Analyzing the obtained result it is possible to verify that the result is similar with the previous case, although now the current frequencies are higher and the phase under fault is another one. In
Figure 9 is shown the obtained diagnostic variables regarding this specific test. From this result is possible to confirm that only the diagnostic variable associated with the leg under fault will present a higher change after the fault (from 1 to 0). The other diagnostic variables also show a change after the fault, but in an opposite direction and with a lower variation (from 1 to 1.3).
Another simulation test, considering again an open-circuit failure, was performed but in this case for 1200 rpm. In this case it was considered a failure in a different power device (
S1B).
Figure 10 shows the motor winding currents which resulted from this simulation test, where the motor was initially operated with the drive in normal condition and an open-circuit failure was introduced at
t = 1 s in power device
S1B. Due to the motor speed, the motor winding currents present a different shape. However, as can be seen in
Figure 11, the diagnostic variables present a similar behavior to the previous simulation test. The diagnostic variable associated with the leg under fault (
B in this case) will still maintain the value of one in normal condition, changing to zero after the failure. The other diagnostic variables will change from 1 to a higher value, more specifically to 1.3.
Finally, a test at nominal speed (2850 rpm) for an open switch fault was also realized. The power device under fault is now the one associated with phase
C (
S1C). The result of the motor winding currents for this test can be seen in
Figure 12. The waveform is similar than the previous cases, although in this case, the currents frequency is much higher. Regarding the diagnostic variables, the obtained result can be seen in
Figure 13. Analyzing this last figure, it is possible to verify that the behavior is similar than the previous ones, although in this case the variable that shows higher variation is the one associated with phase
C. It should be noticed that the change of the speed did not influence the diagnostic variables, since they presented always a similar behavior. In this way, the method is not affected by the speed of the machine. Another aspect that was possible to confirm is that a clear change of the diagnostic variable associated with the leg under fault was verified, allowing in this way to easily define a threshold value. Another easy way that allows one to identify the fault is that the variable under fault reduces their value (from one to zero) and the other ones will increase their value (becomes higher than one), clearly showing in this way which is the variable associated with the fault.
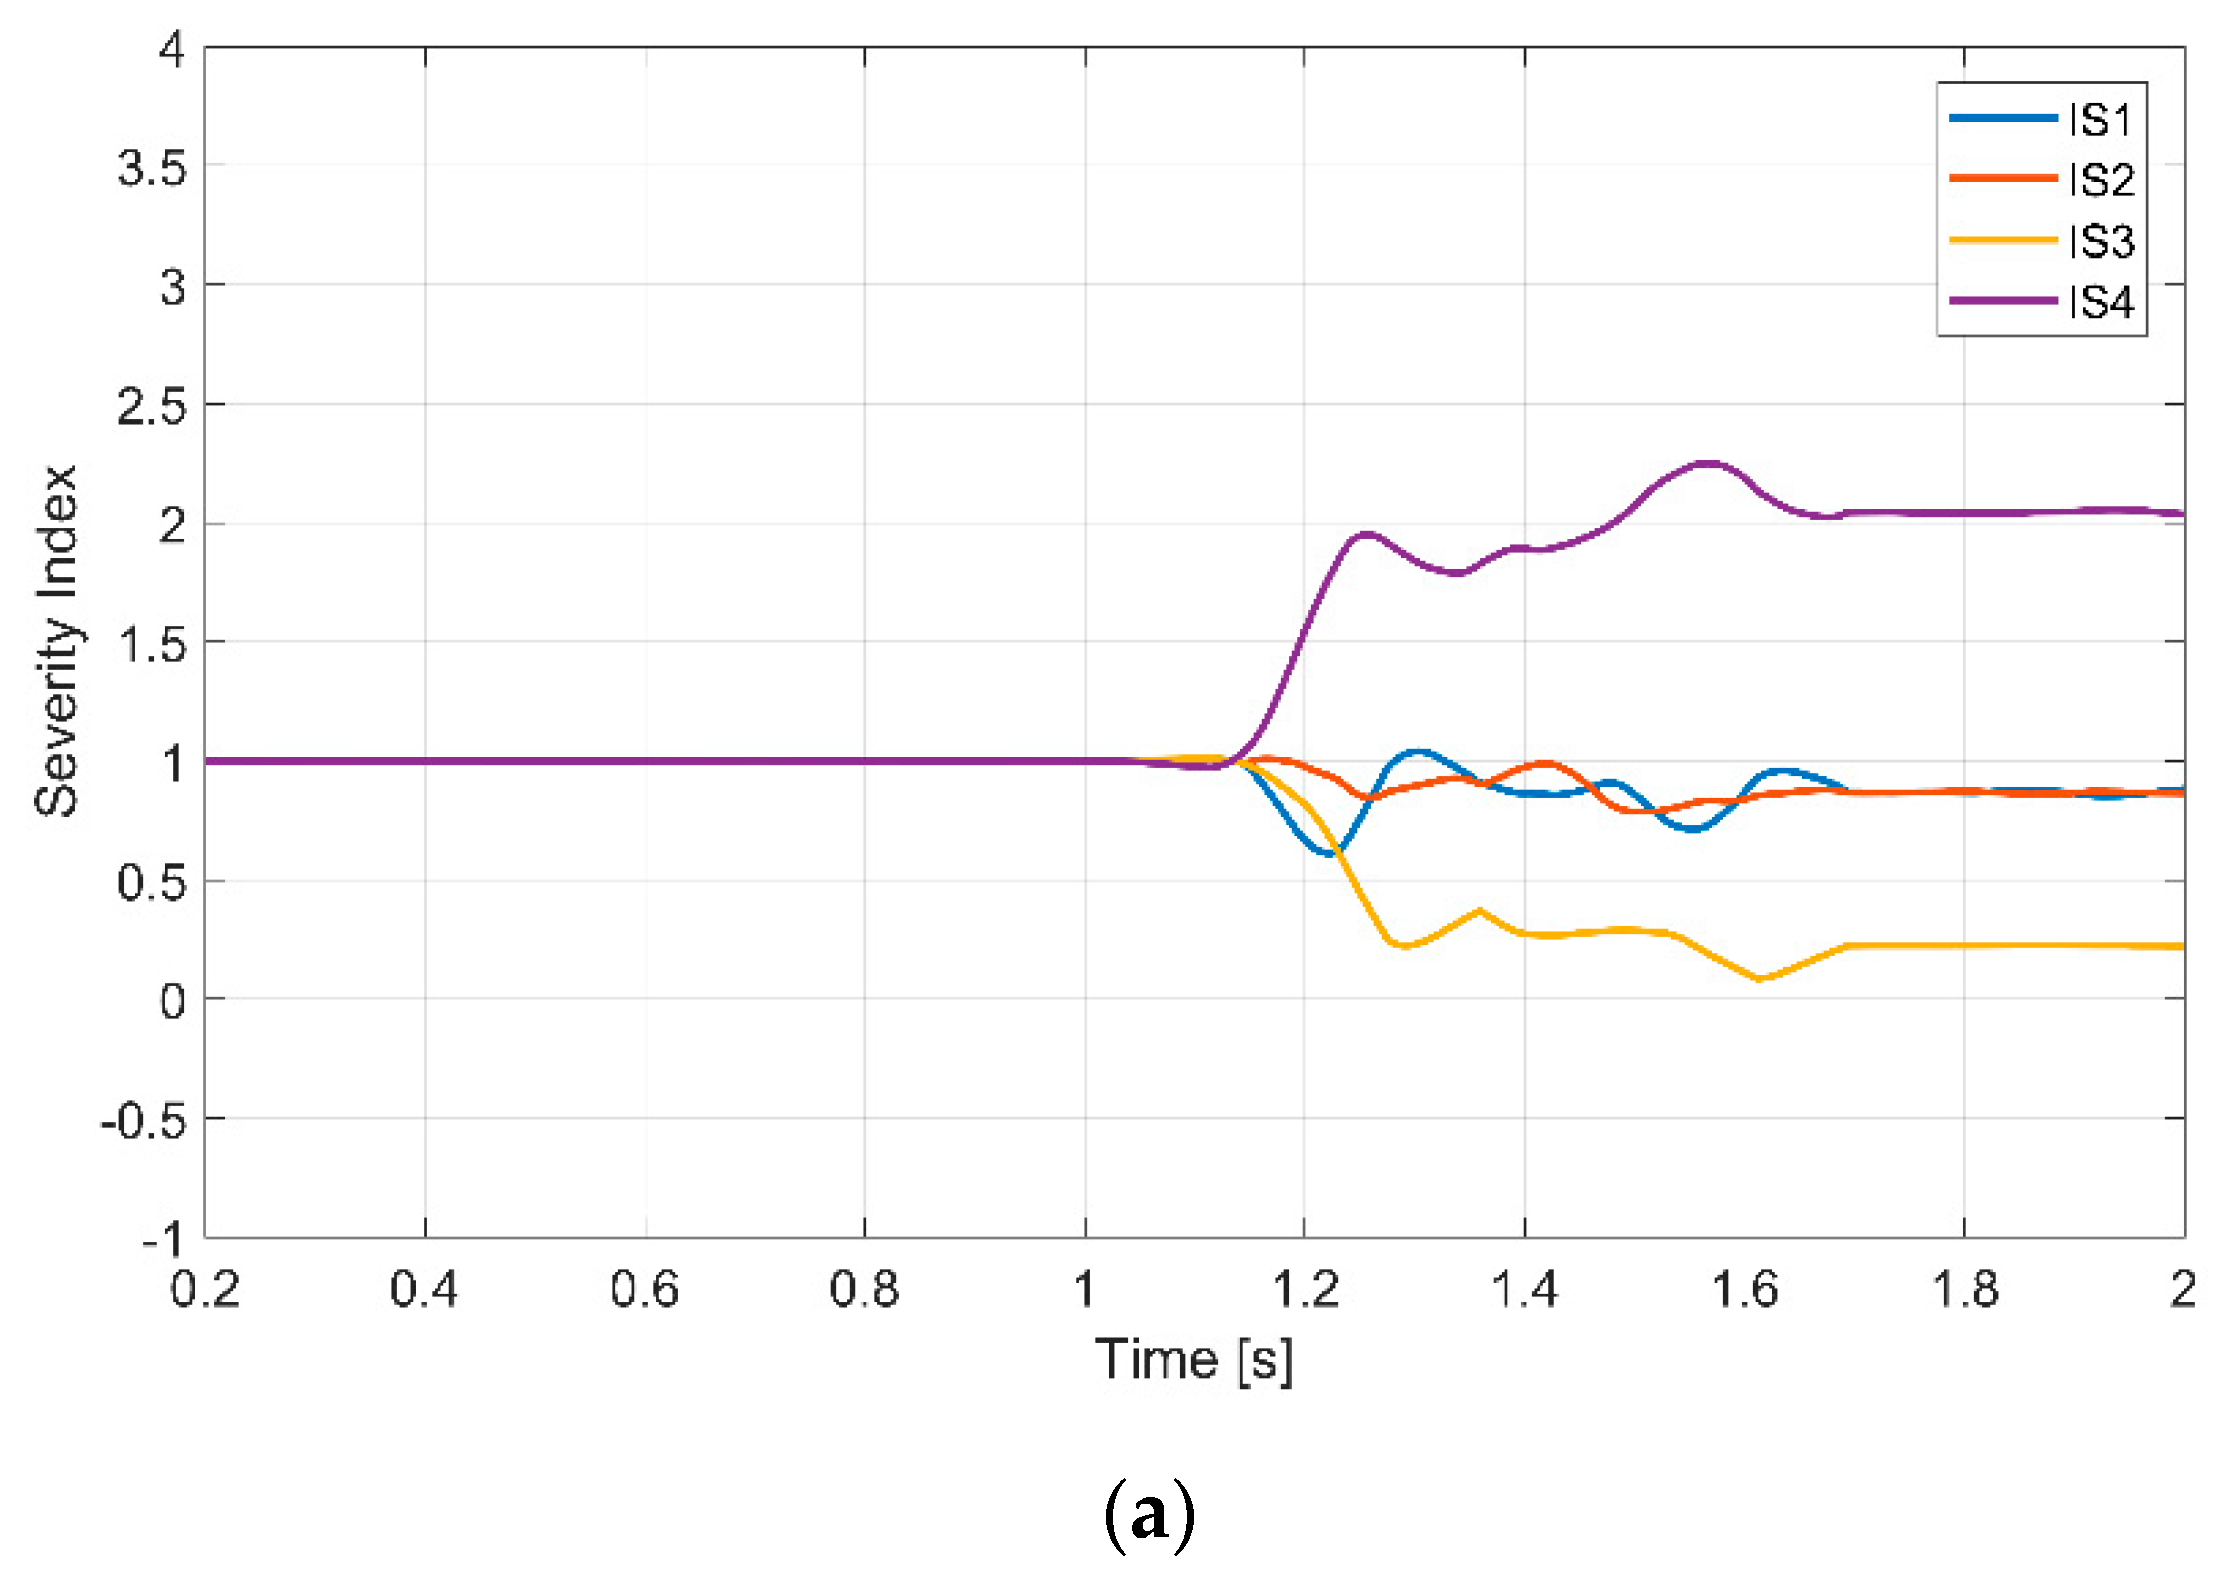
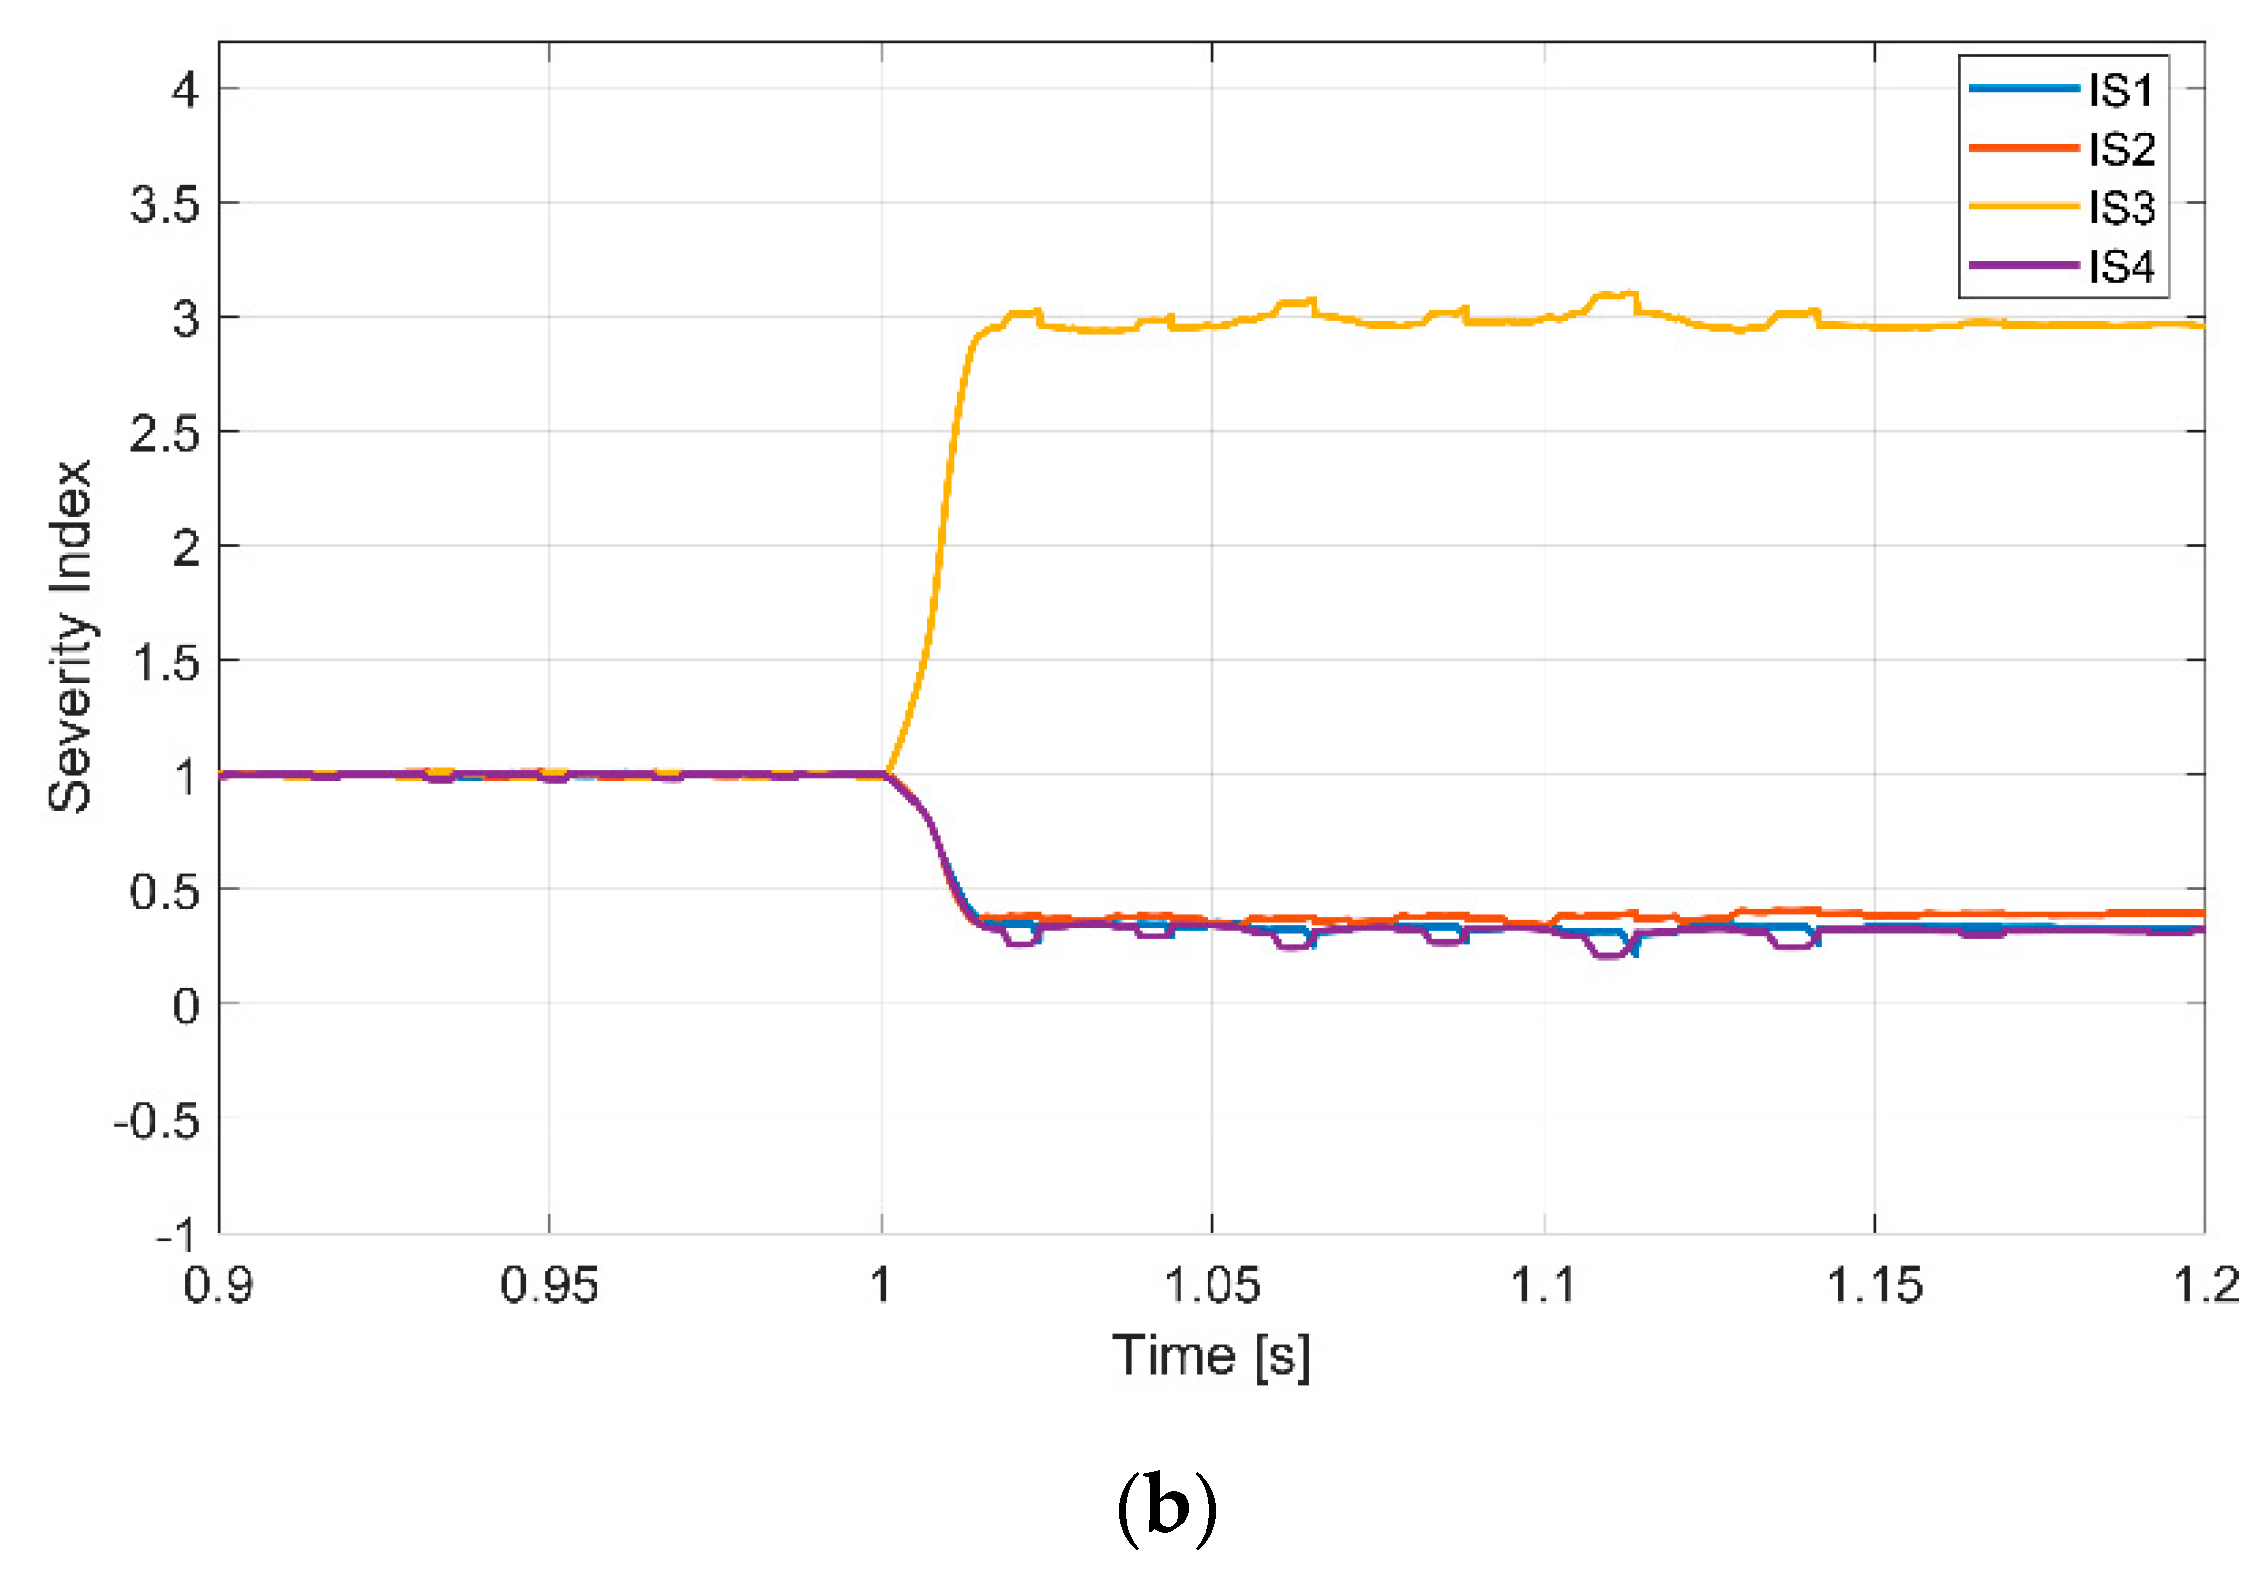
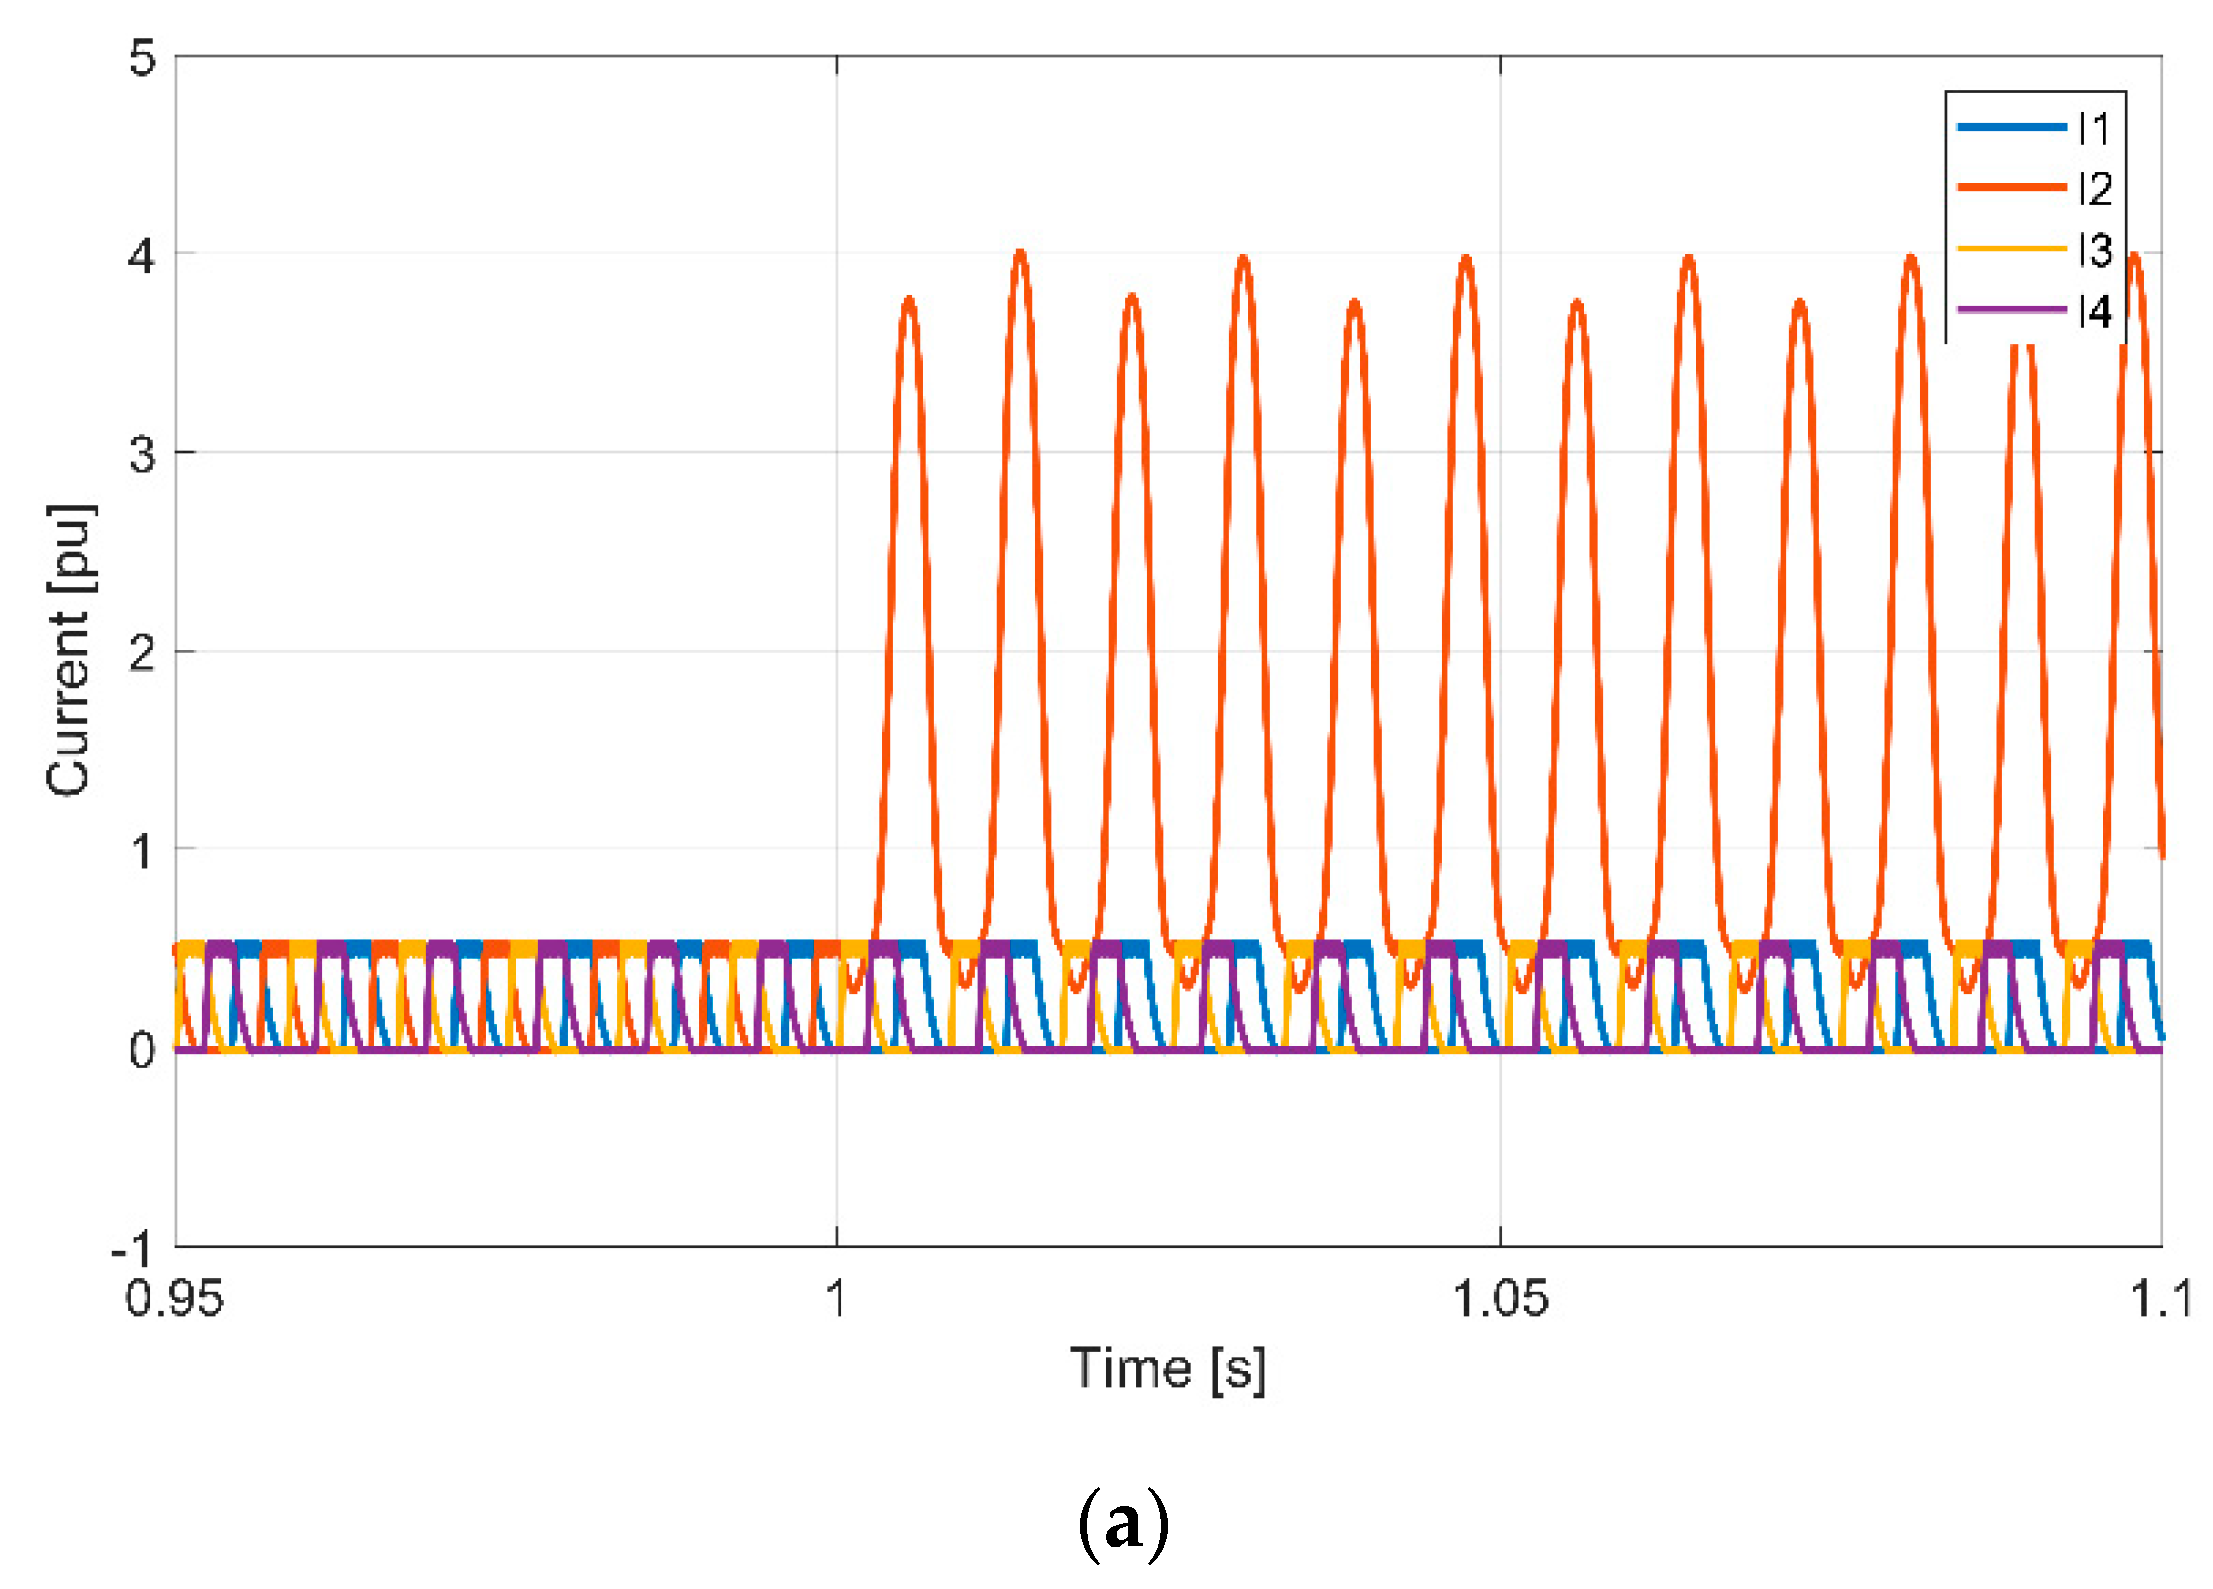
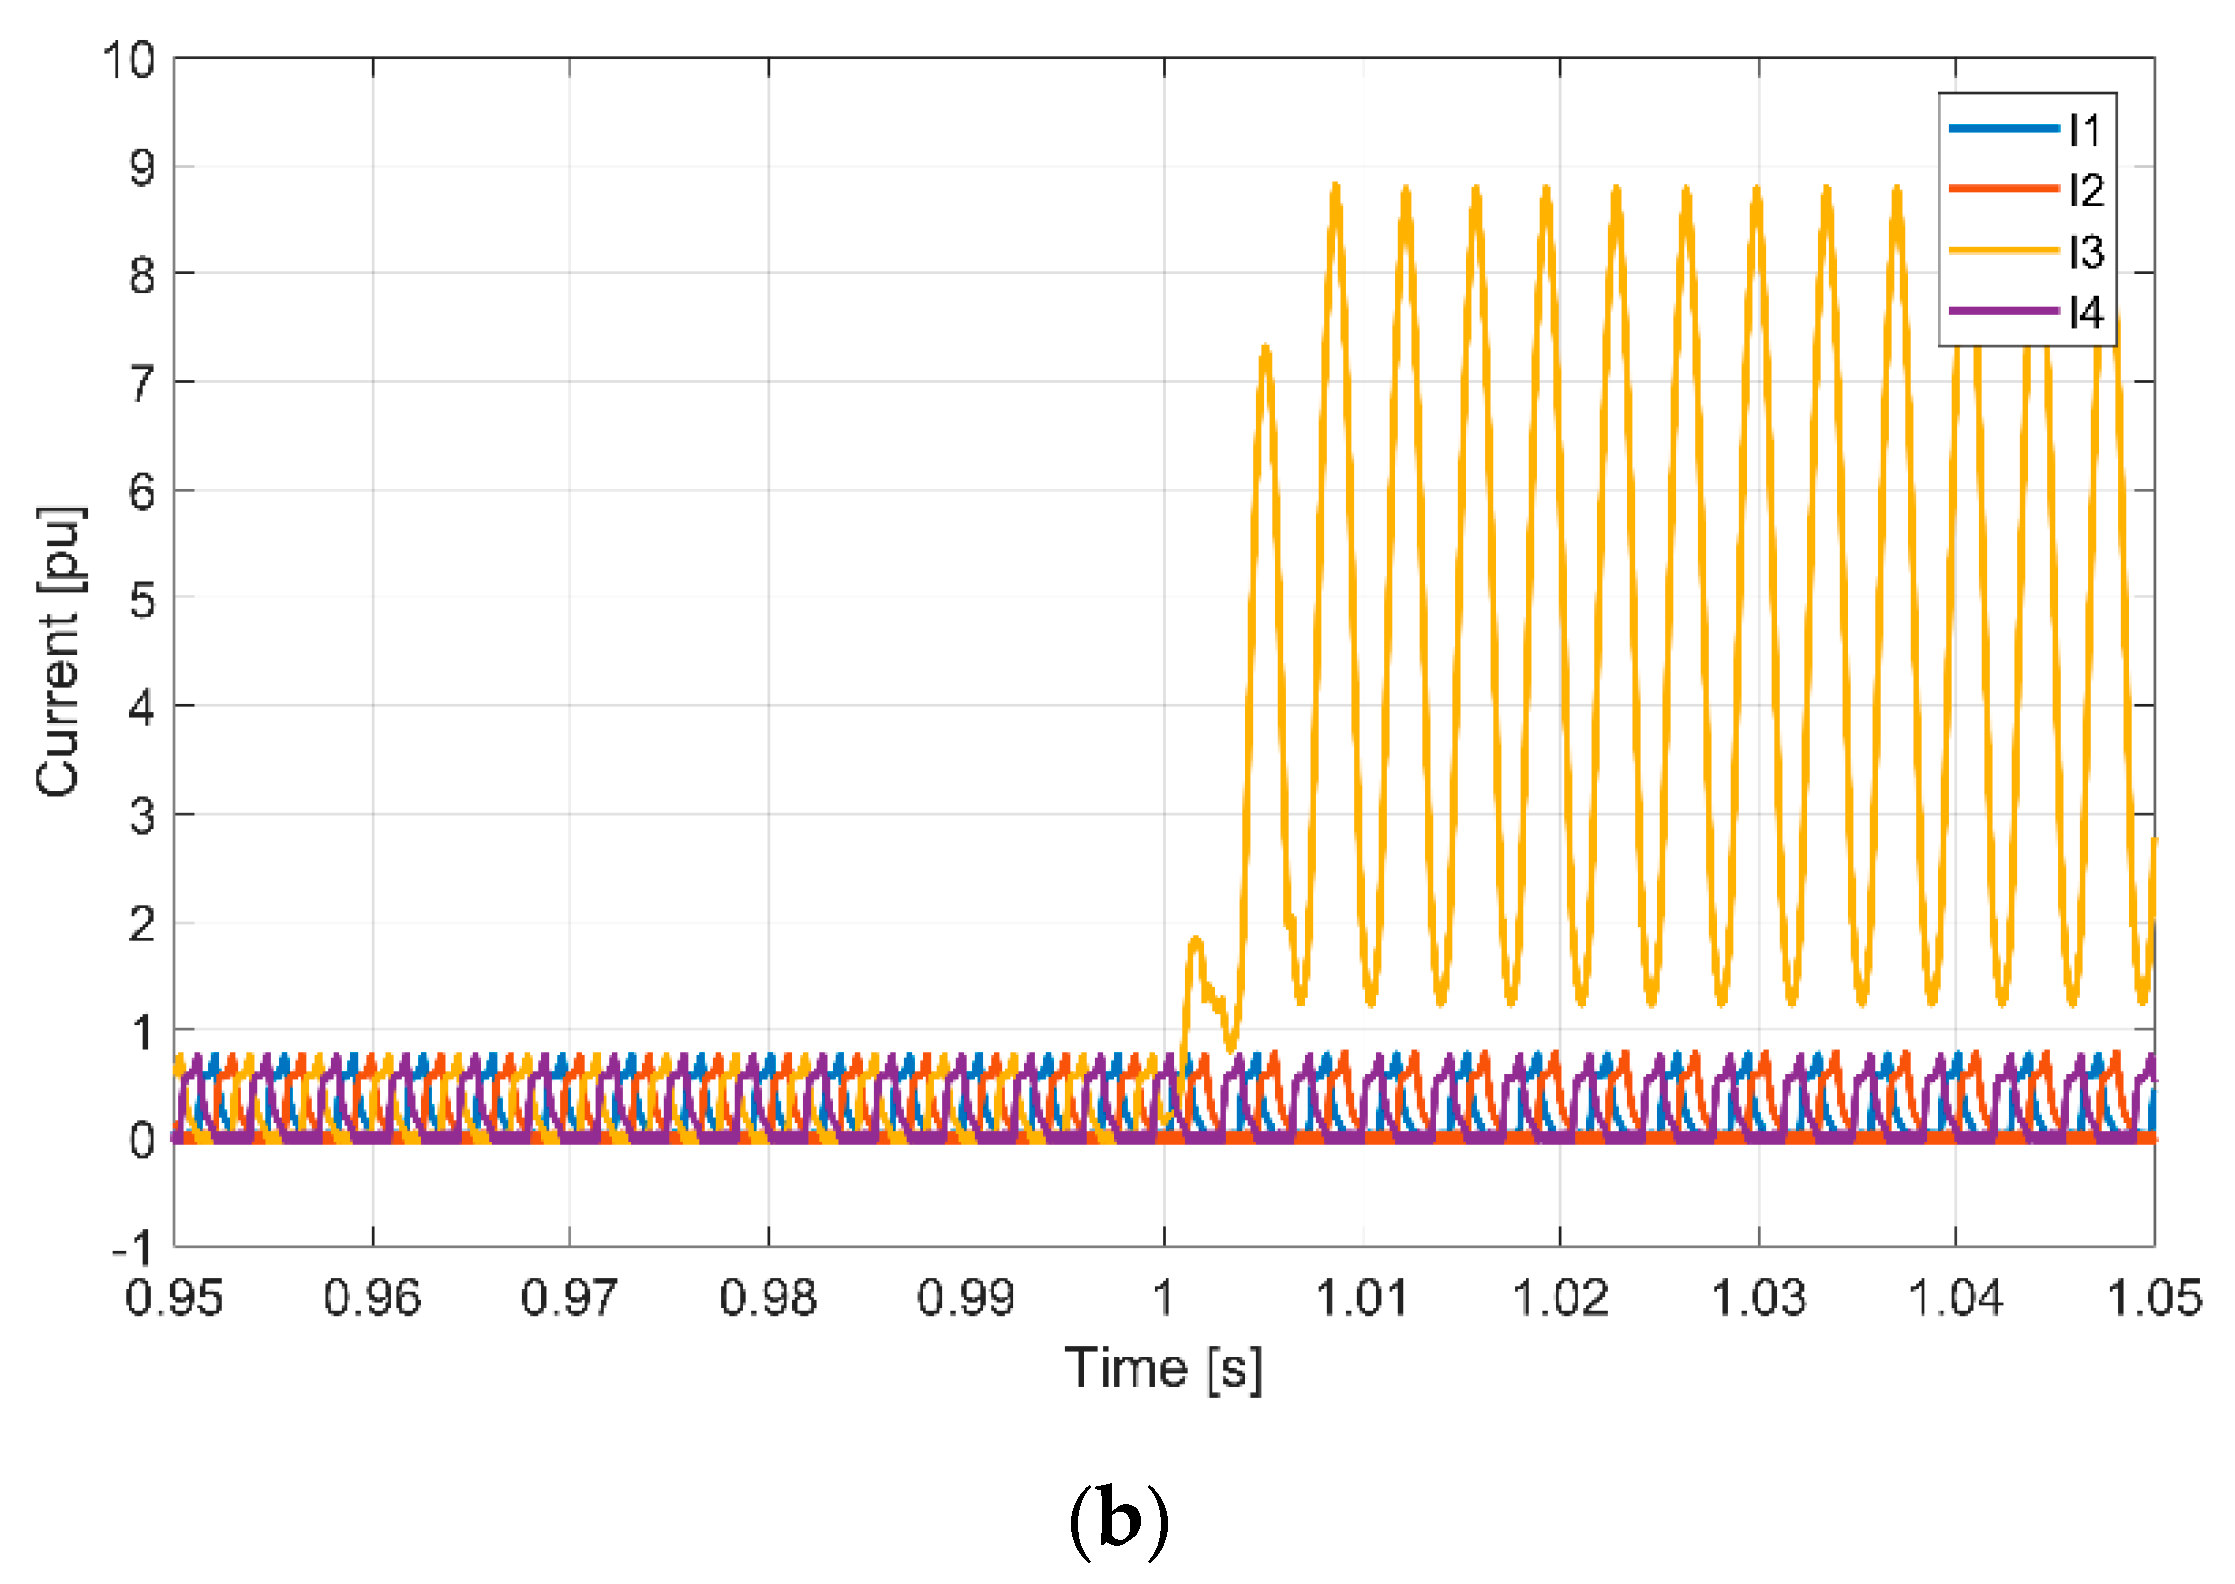
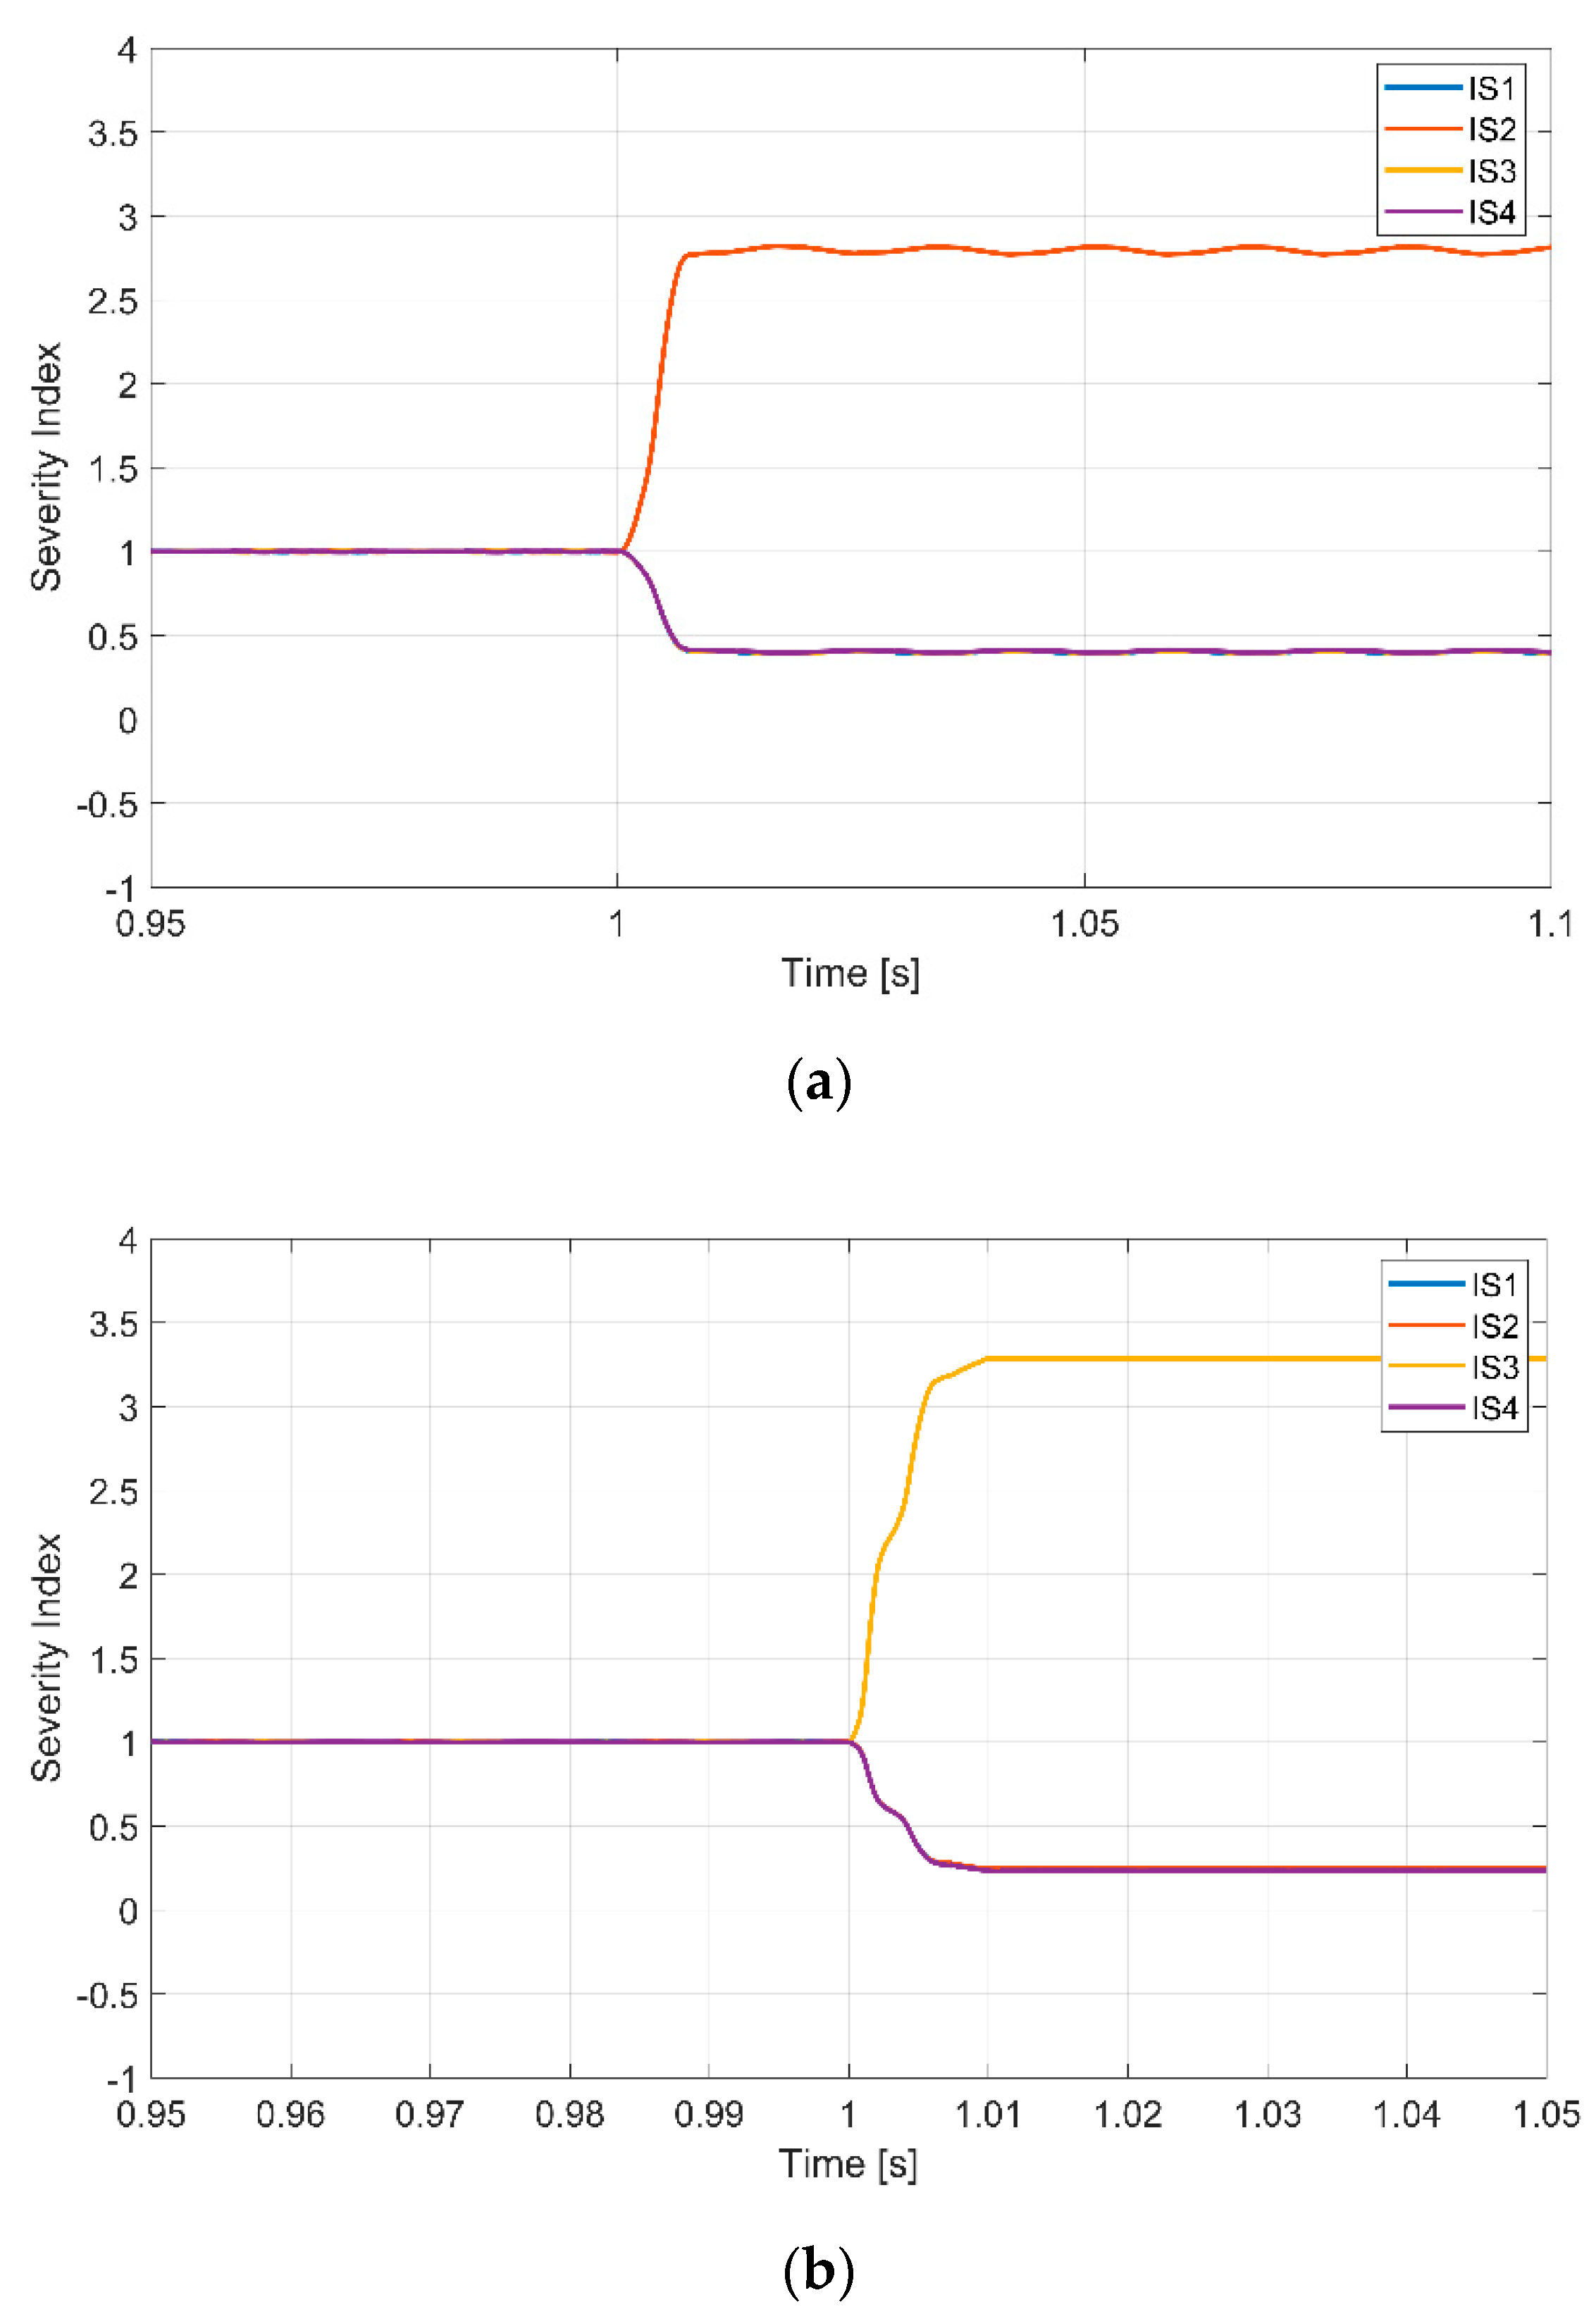
Simulation tests for a different fault, more specifically for short-circuit failure, were also performed. The first tests, considering this failure mode, were performed for low speed, more specifically at 60 rpm and 600 rpm. Thus, for both tests, initially, the motor was operated at normal condition and a short-circuit failure was introduced at t = 1 s in the power semiconductors S1A and S1C (for the 60 rpm and 600 rpm respectively).
The obtained winding currents for both tests can be seen in
Figure 14. As expected, in normal operation the winding currents are controlled and balanced. However, after the fault, the current in the winding connected to the faulty bridge leg will increase to very high values. The behavior of the correspondent diagnostic variables, considering this failure mode, can be seen in
Figure 15. Through these results, it is possible to verify that in normal condition all the variables are stable at the value of one. However, after this failure mode the variable associated with the faulty leg changes, increasing for higher values (2 and 2.9 for 60 rpm and 600 rpm). The other variables will also change their values, but in an opposed way (less than 1). Analysing these values and the values presented in
Table 1 (for a failure in a different power device), it is possible to confirm similar results.
Tests at higher speed for short-circuit failure, namely at 1200 rpm and 2850 rpm were also realized. As in the previous cases, initially the motor was operated at normal condition and a short-circuit failure was introduced at
t = 1 s in the power semiconductors
S1B and
S1C (for the 1200 rpm and 2850 rpm respectively). The result of the motor winding currents for those tests can be seen in
Figure 16. Through this figure is possible to verify that the waveforms are similar than the previous cases, although in this case the currents frequency is much higher. The corresponding diagnostic variables are presented in
Figure 17. From the analysis of the obtained diagnostic variables it is possible to verify that the behavior is similar than the previous ones. It should be noticed that the change of the speed did not influenced the diagnostic variables, since they presented always a similar behavior. In this way, even for this type of fault, the method is not affected by the speed of the machine. Another aspect that was possible to confirm is that a clear change of the diagnostic variable associated with the leg under fault was verified, allowing in this way to easily define a threshold value. It is also possible to verify that there is a typical pattern associated with this type of fault, namely, the variable under fault increases their value (becomes higher that one) and the other ones will decrease their values (become lower than one), clearly showing in this way which is the variable associated with the fault.
The processing time of the proposed method depends on the number of variables and the number of samples for each variable used in the sliding window. Another important factor that influence the processing time is the hardware used to compute the algorithm. The proposed method was simulated in a PC with the processor Intel Core i7-7700, CPU 2.80 GHz with installed 16 GB of RAM. Considering four currents and 155 samples for each current in the sliding window, it was obtained 72 µs to process those current data.
5. Experimental Results
The proposed fault diagnosis method was also verified through field tests using an experimental setup in which the characteristics of the motor can be seen in
Table 3. The drive was feed by a
DC power supply of 100 V. A current chopping control was used to control the motor. Hall-effect sensors were used for the acquisition of the motor winding currents. The performance of the fault diagnosis method was tested considering several condition modes, namely: healthy operation, open and short-circuit failure modes. All these conditions were also performed at different
SRM speeds.
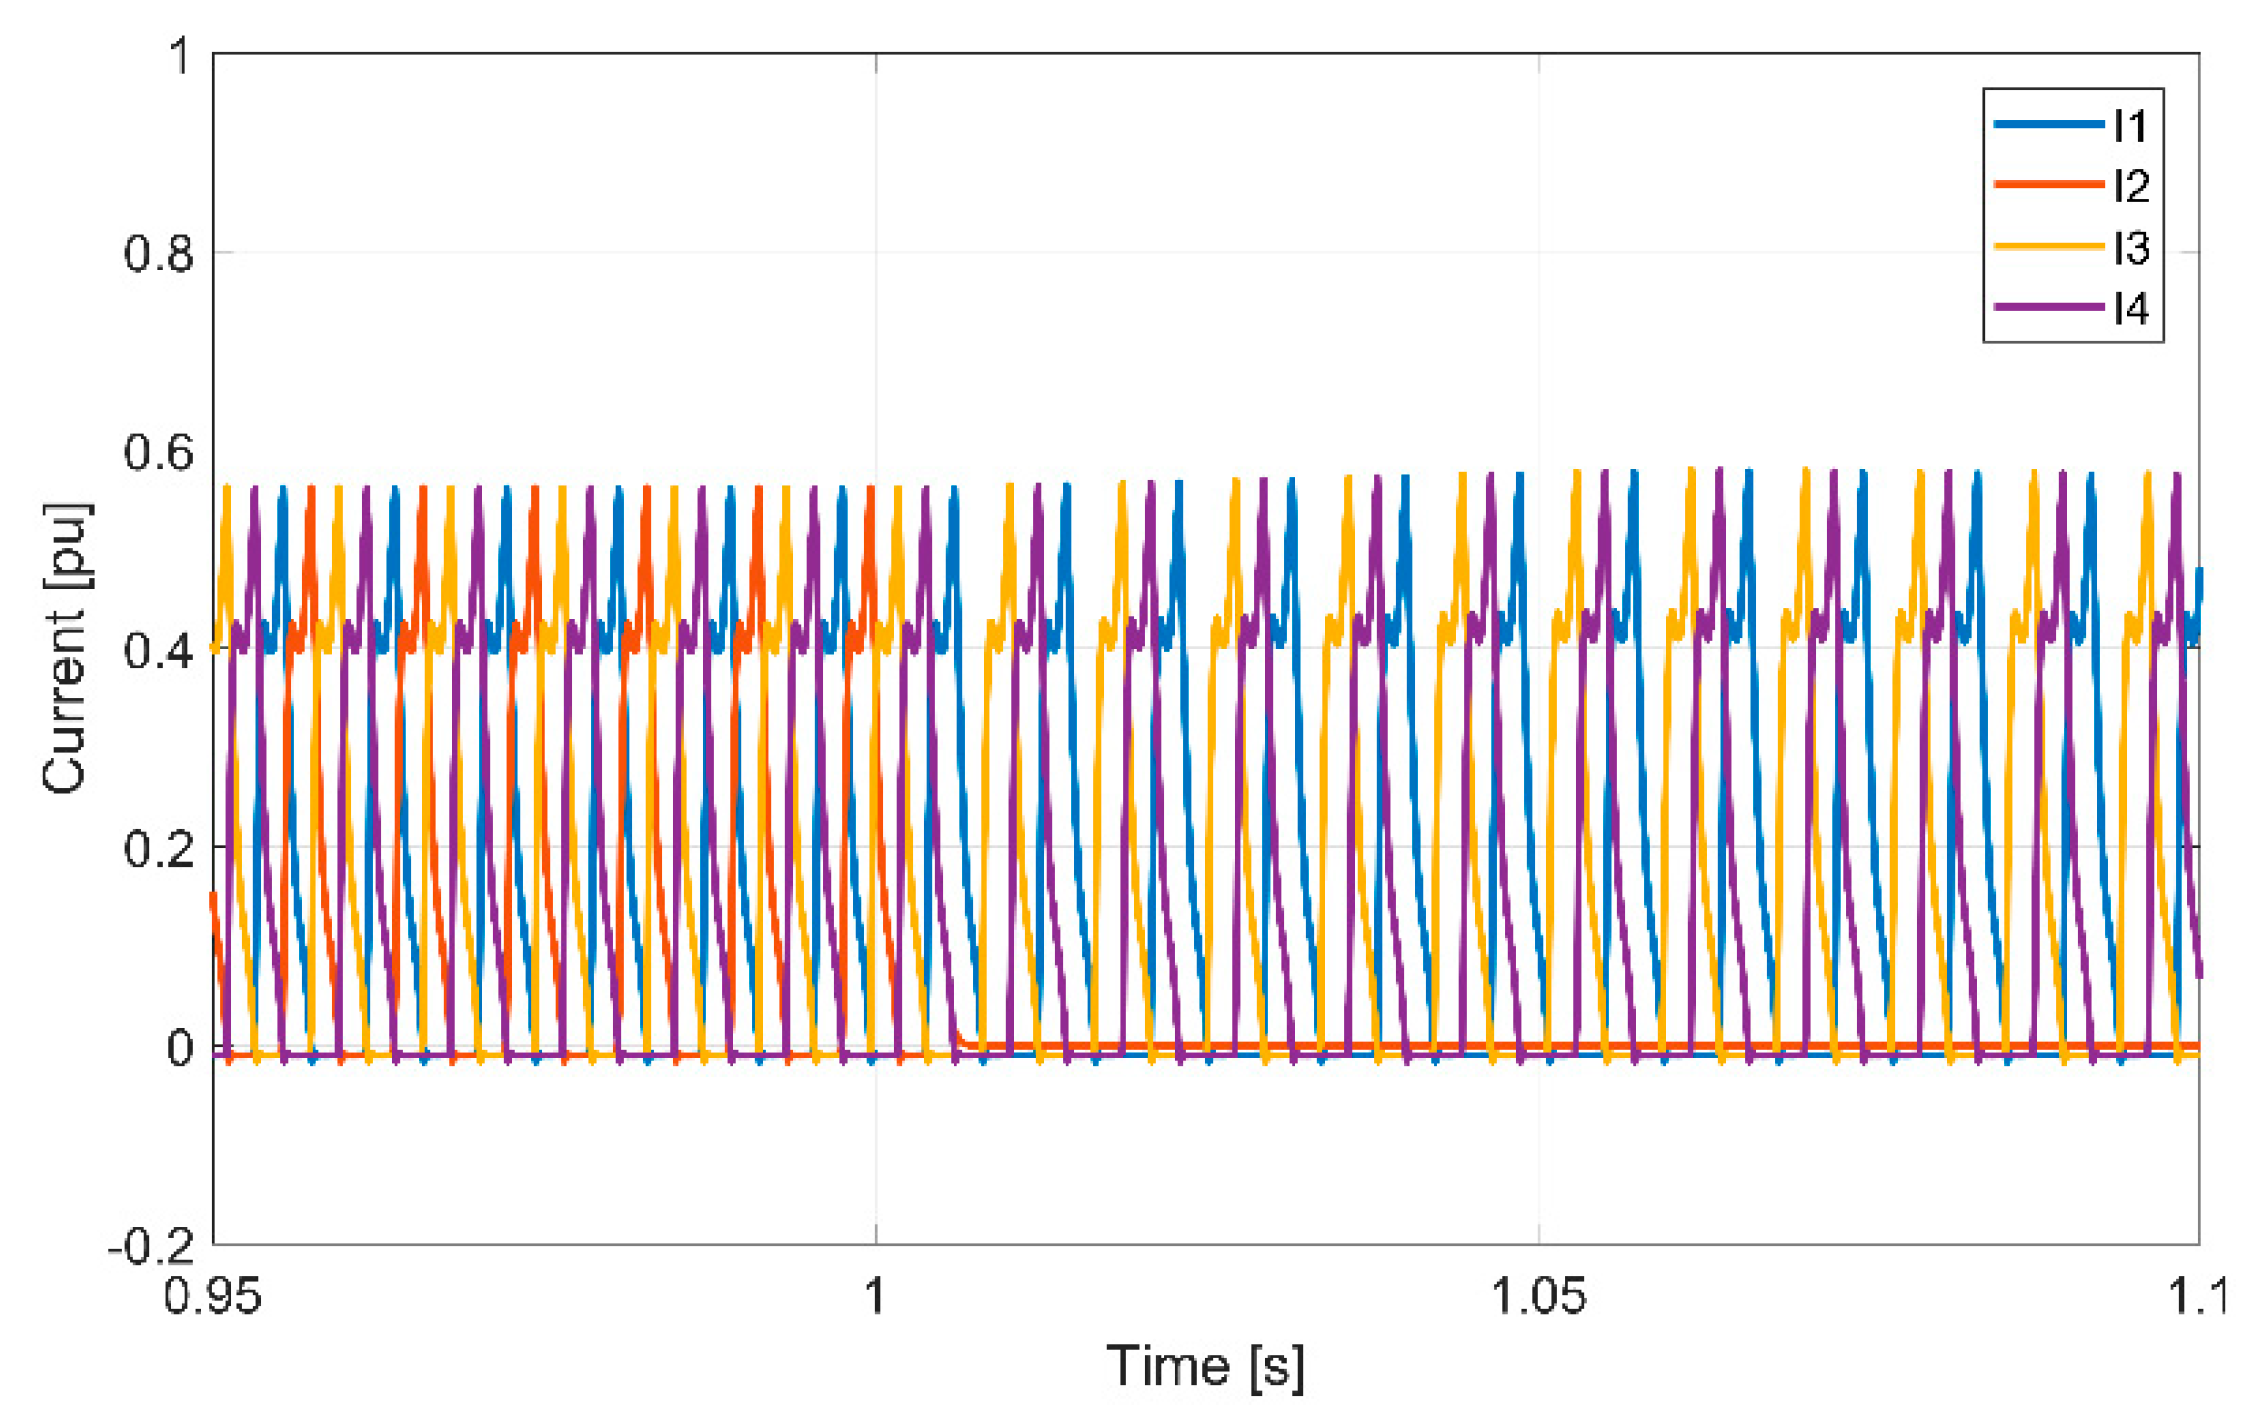
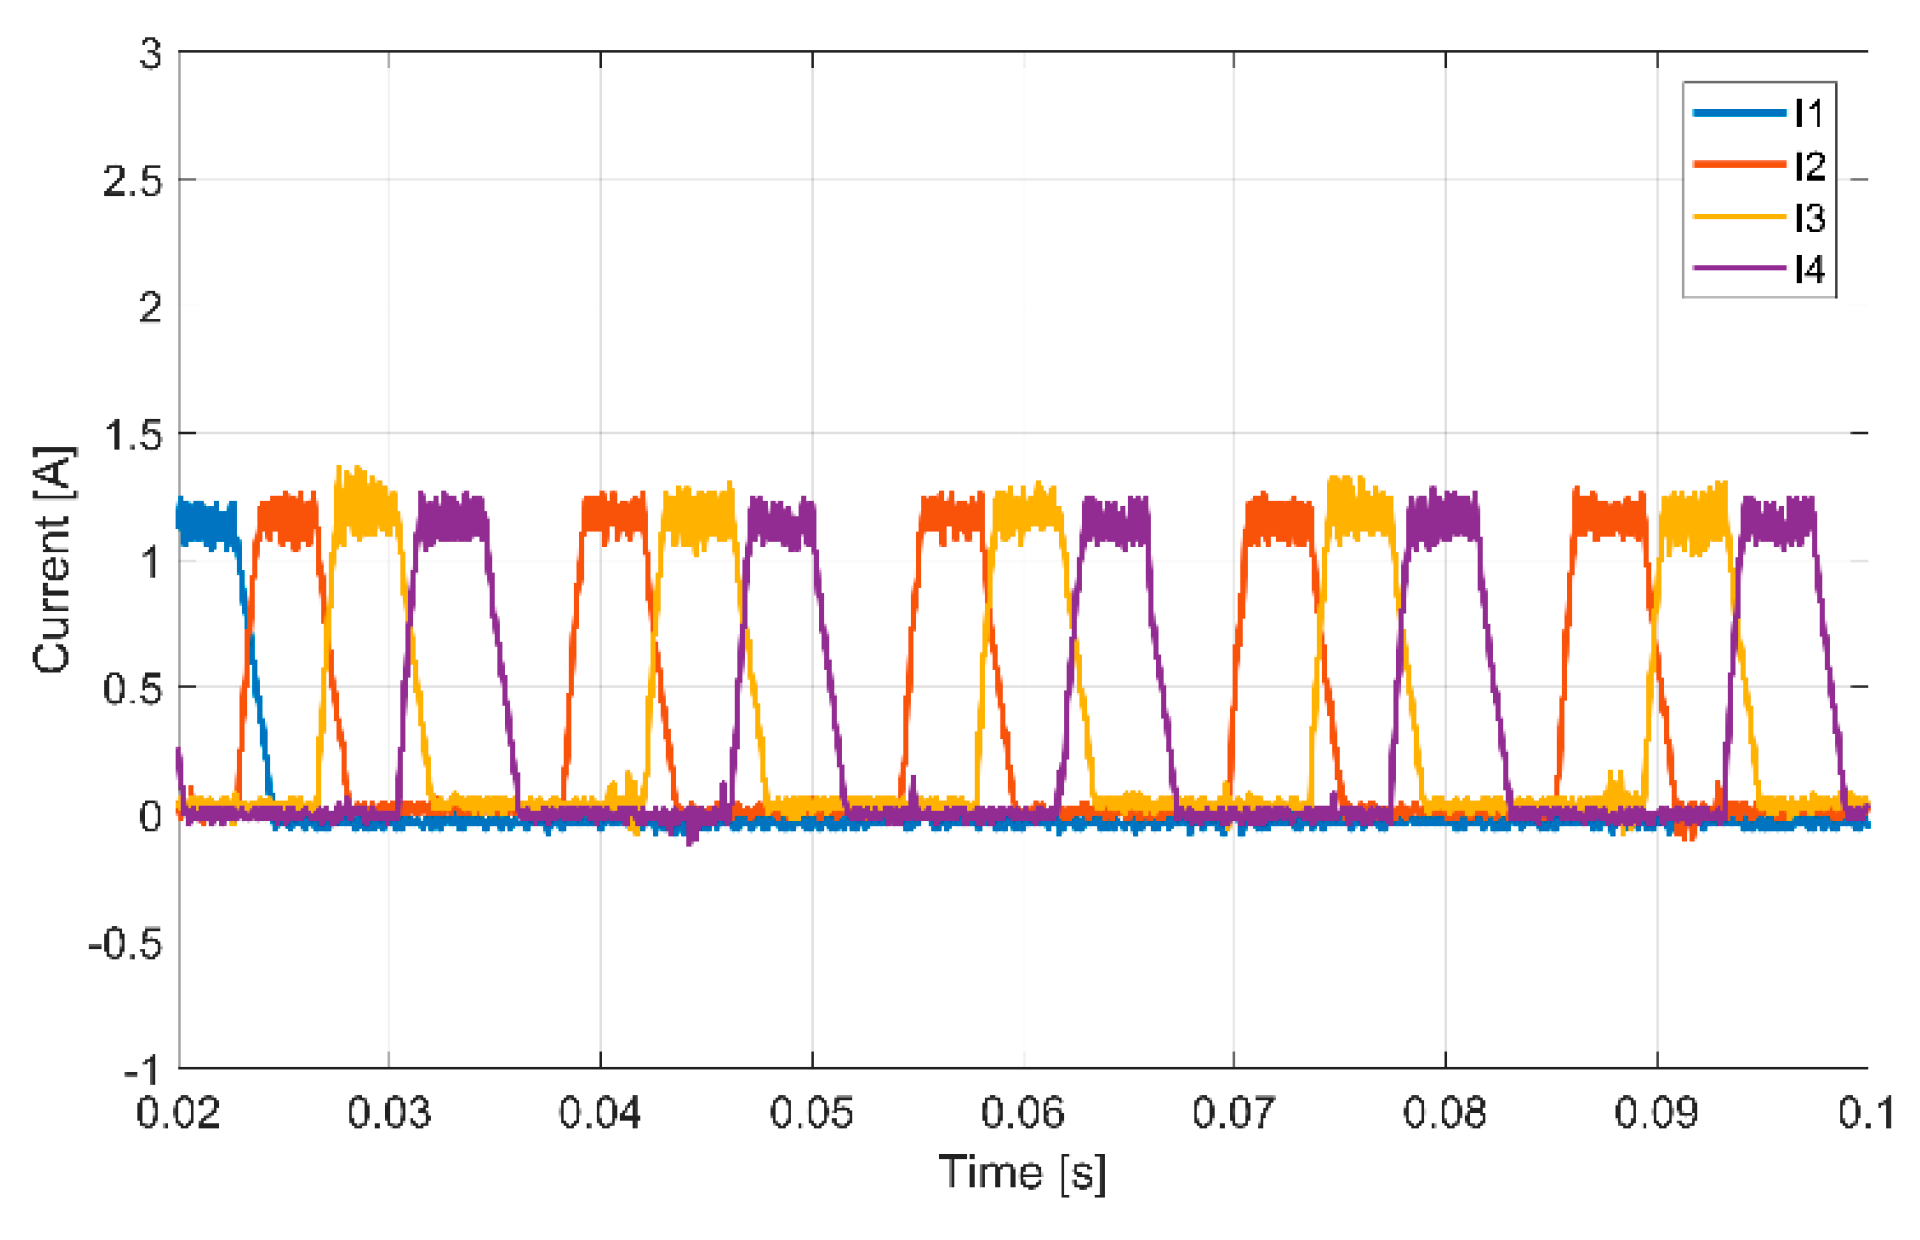
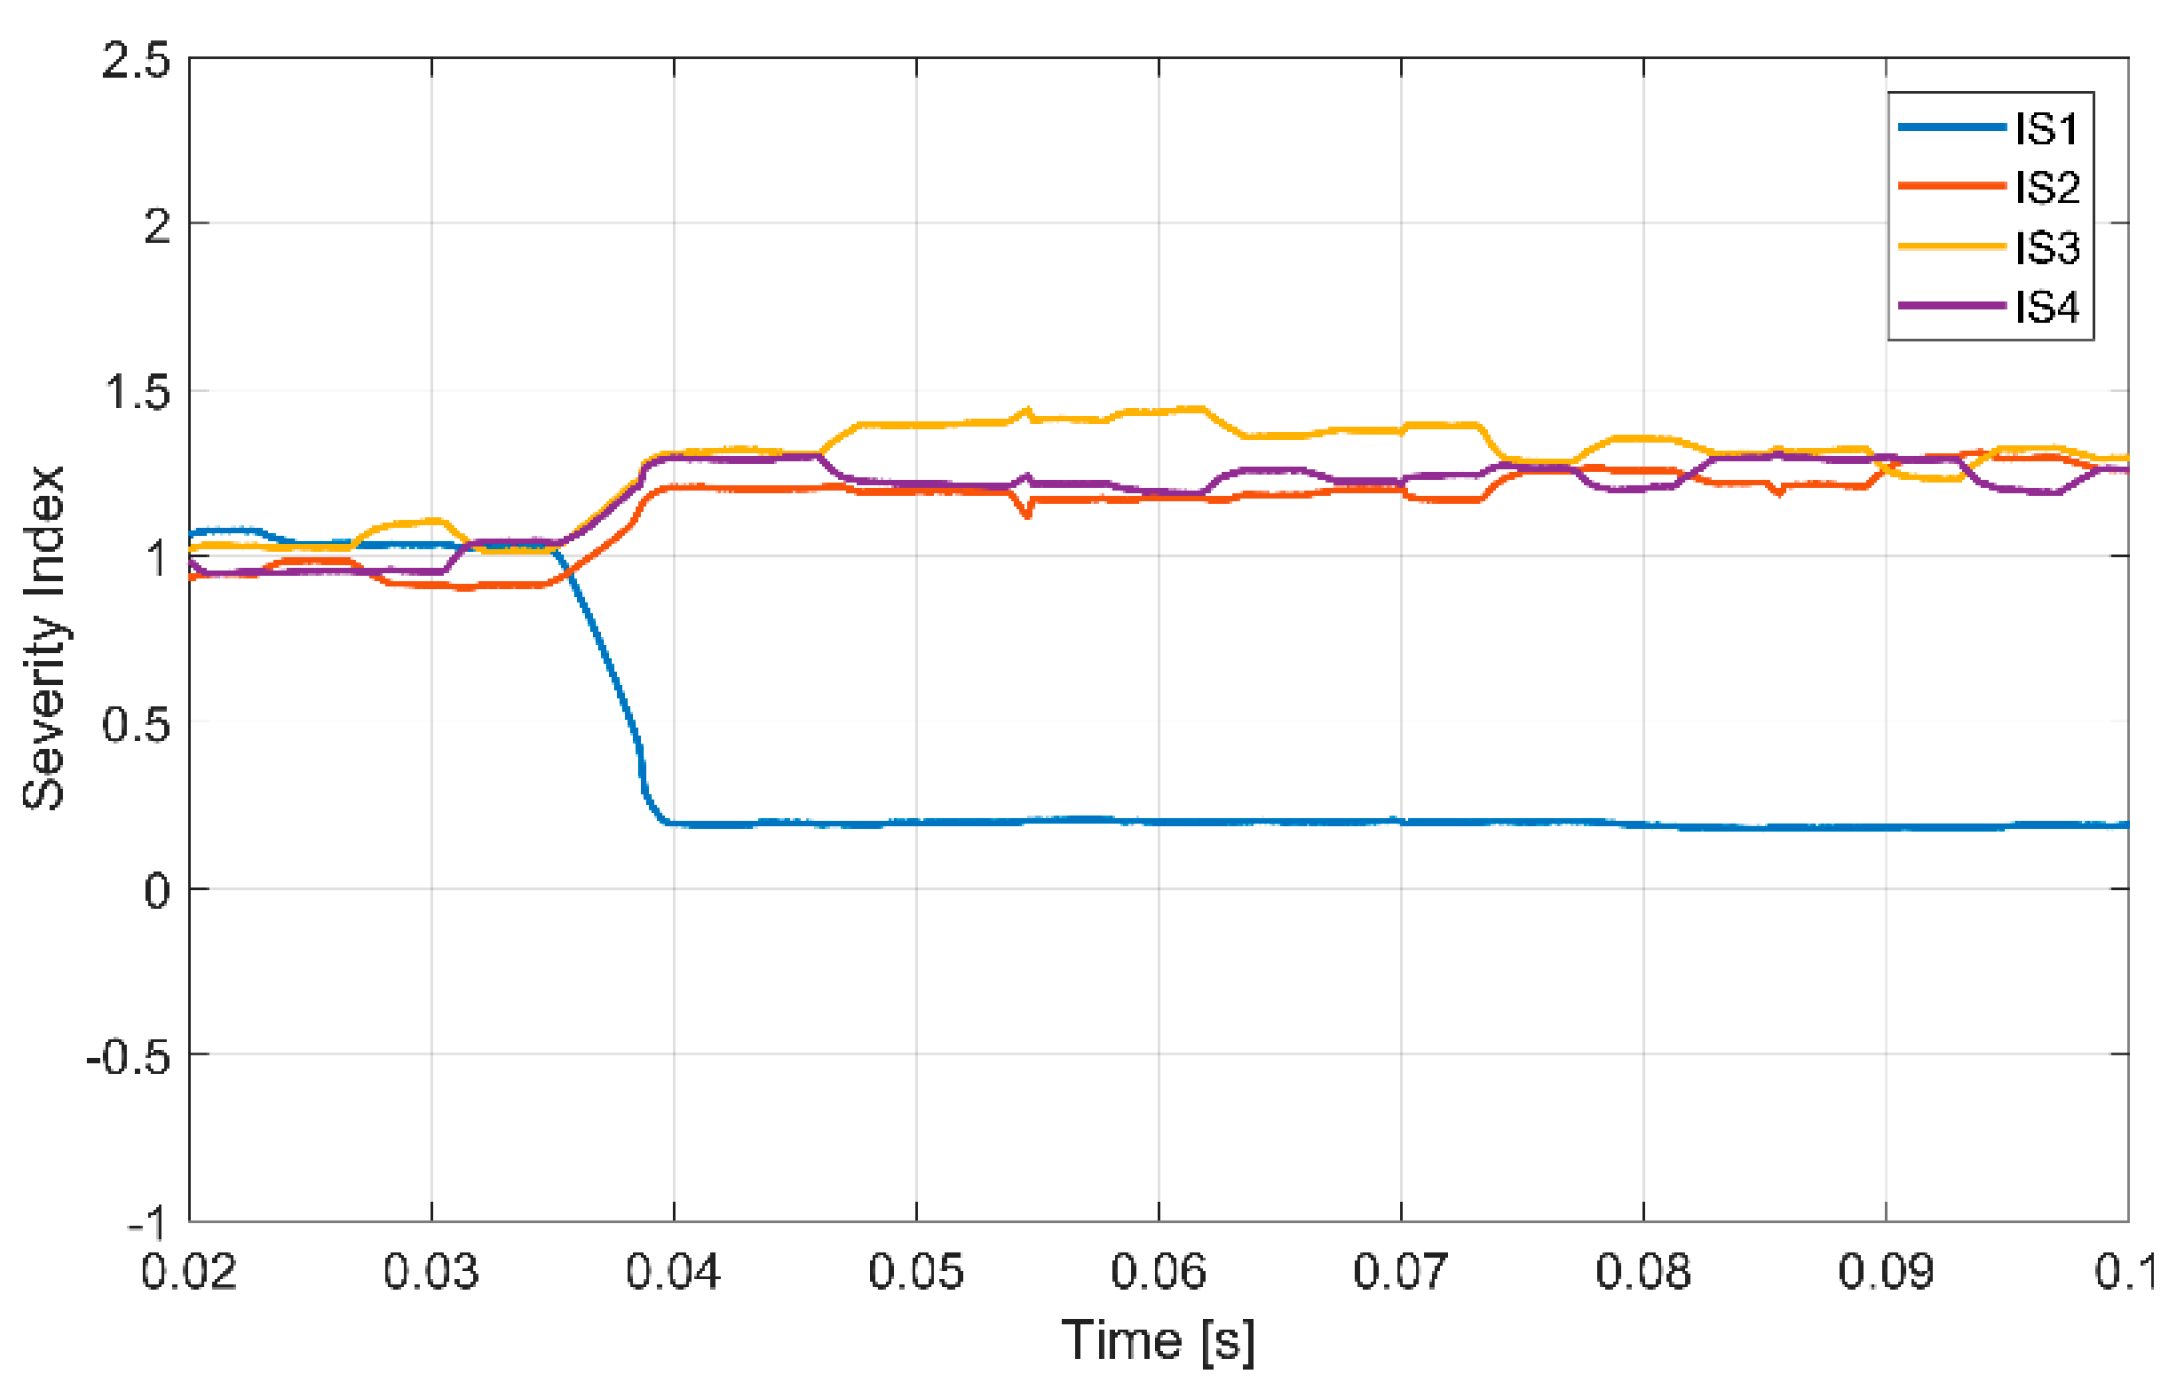
The first experimental test was made considering the drive in normal operation (without failure) and an open-circuit failure was introduced through the inhibition of the gate signal. This first experimental test was made at 600 rpm. The
SRM motor winding currents before and after the failure in the power device
S1A can be seen in
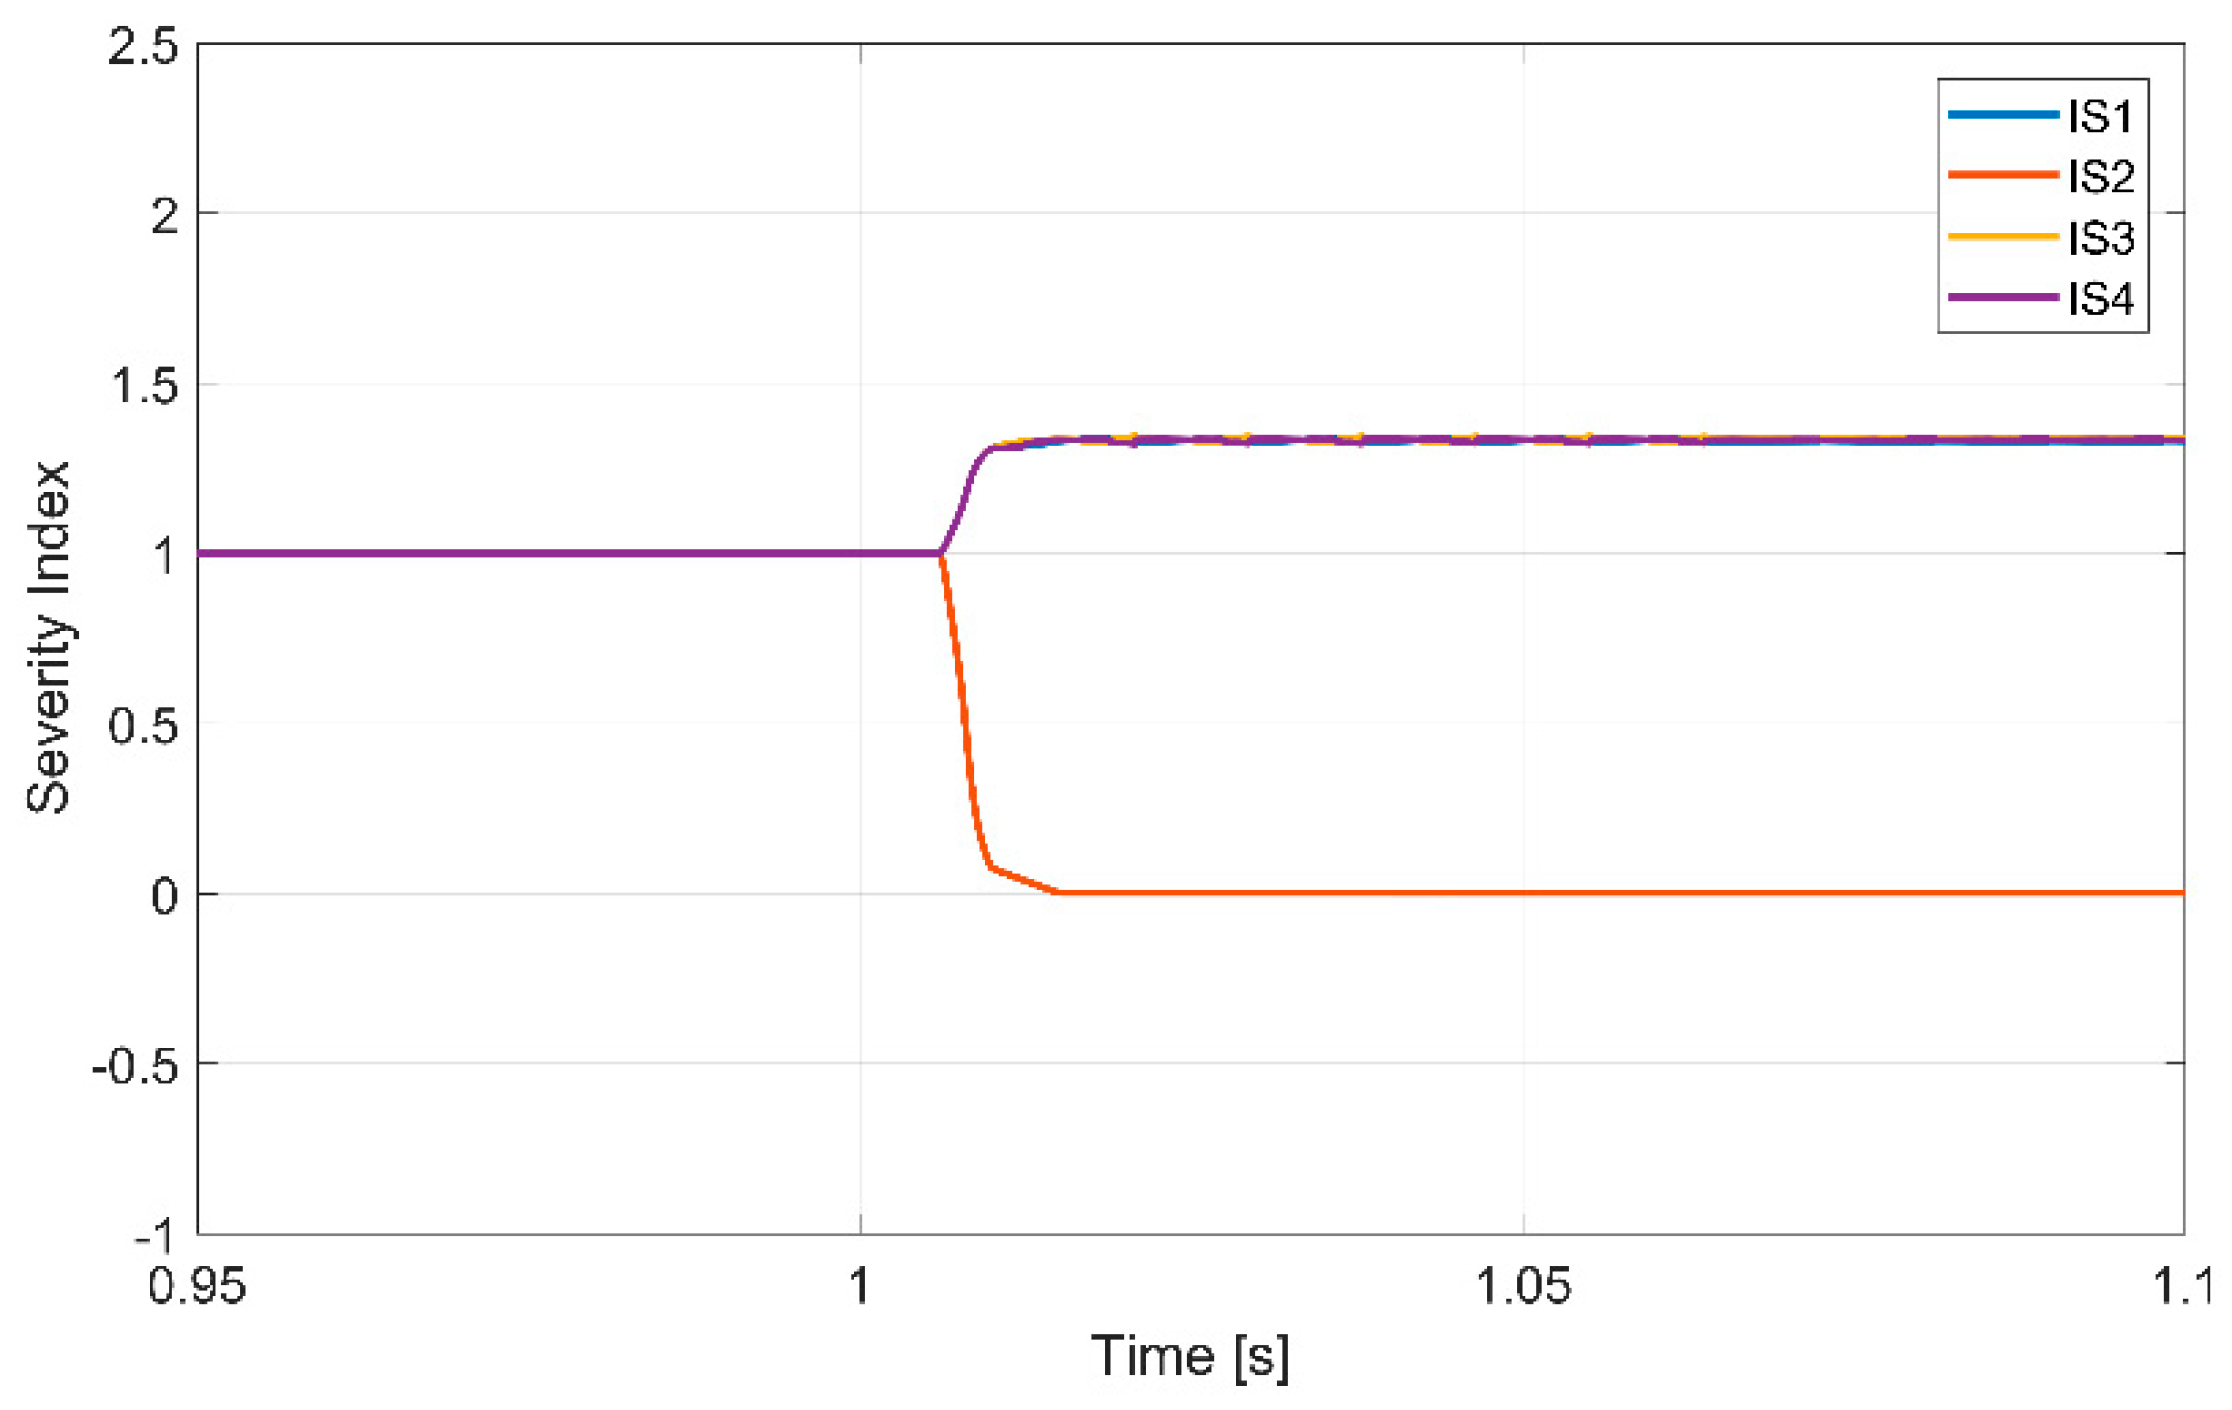
Figure 18. As expected, after the failure, the current in the phase connected to the faulty leg remains at zero value. It is also possible to see the increase of the excitation in the healthy phases in order to maintain the speed reference. The corresponding diagnostic variables are shown in
Figure 19. Through the analysis of this figure, it is possible to see that in normal operation all the diagnostic variables are nearly constant and with a value of one. However, after the open-circuit failure, they change immediately their values. In fact, the diagnostic variable related to the faulty leg changes to a final value near zero. The other diagnostic variables also change, but in this case to a final value of 1.3. This faulty pattern is in accordance with the conditions presented in
Table 1.
A similar experimental test, considering 1200 rpm was also performed. This experimental test is similar to the previous one, where the motor is operating in normal condition when an open-circuit failure suddenly occurs in the power device
S1B.
Figure 20 shows the
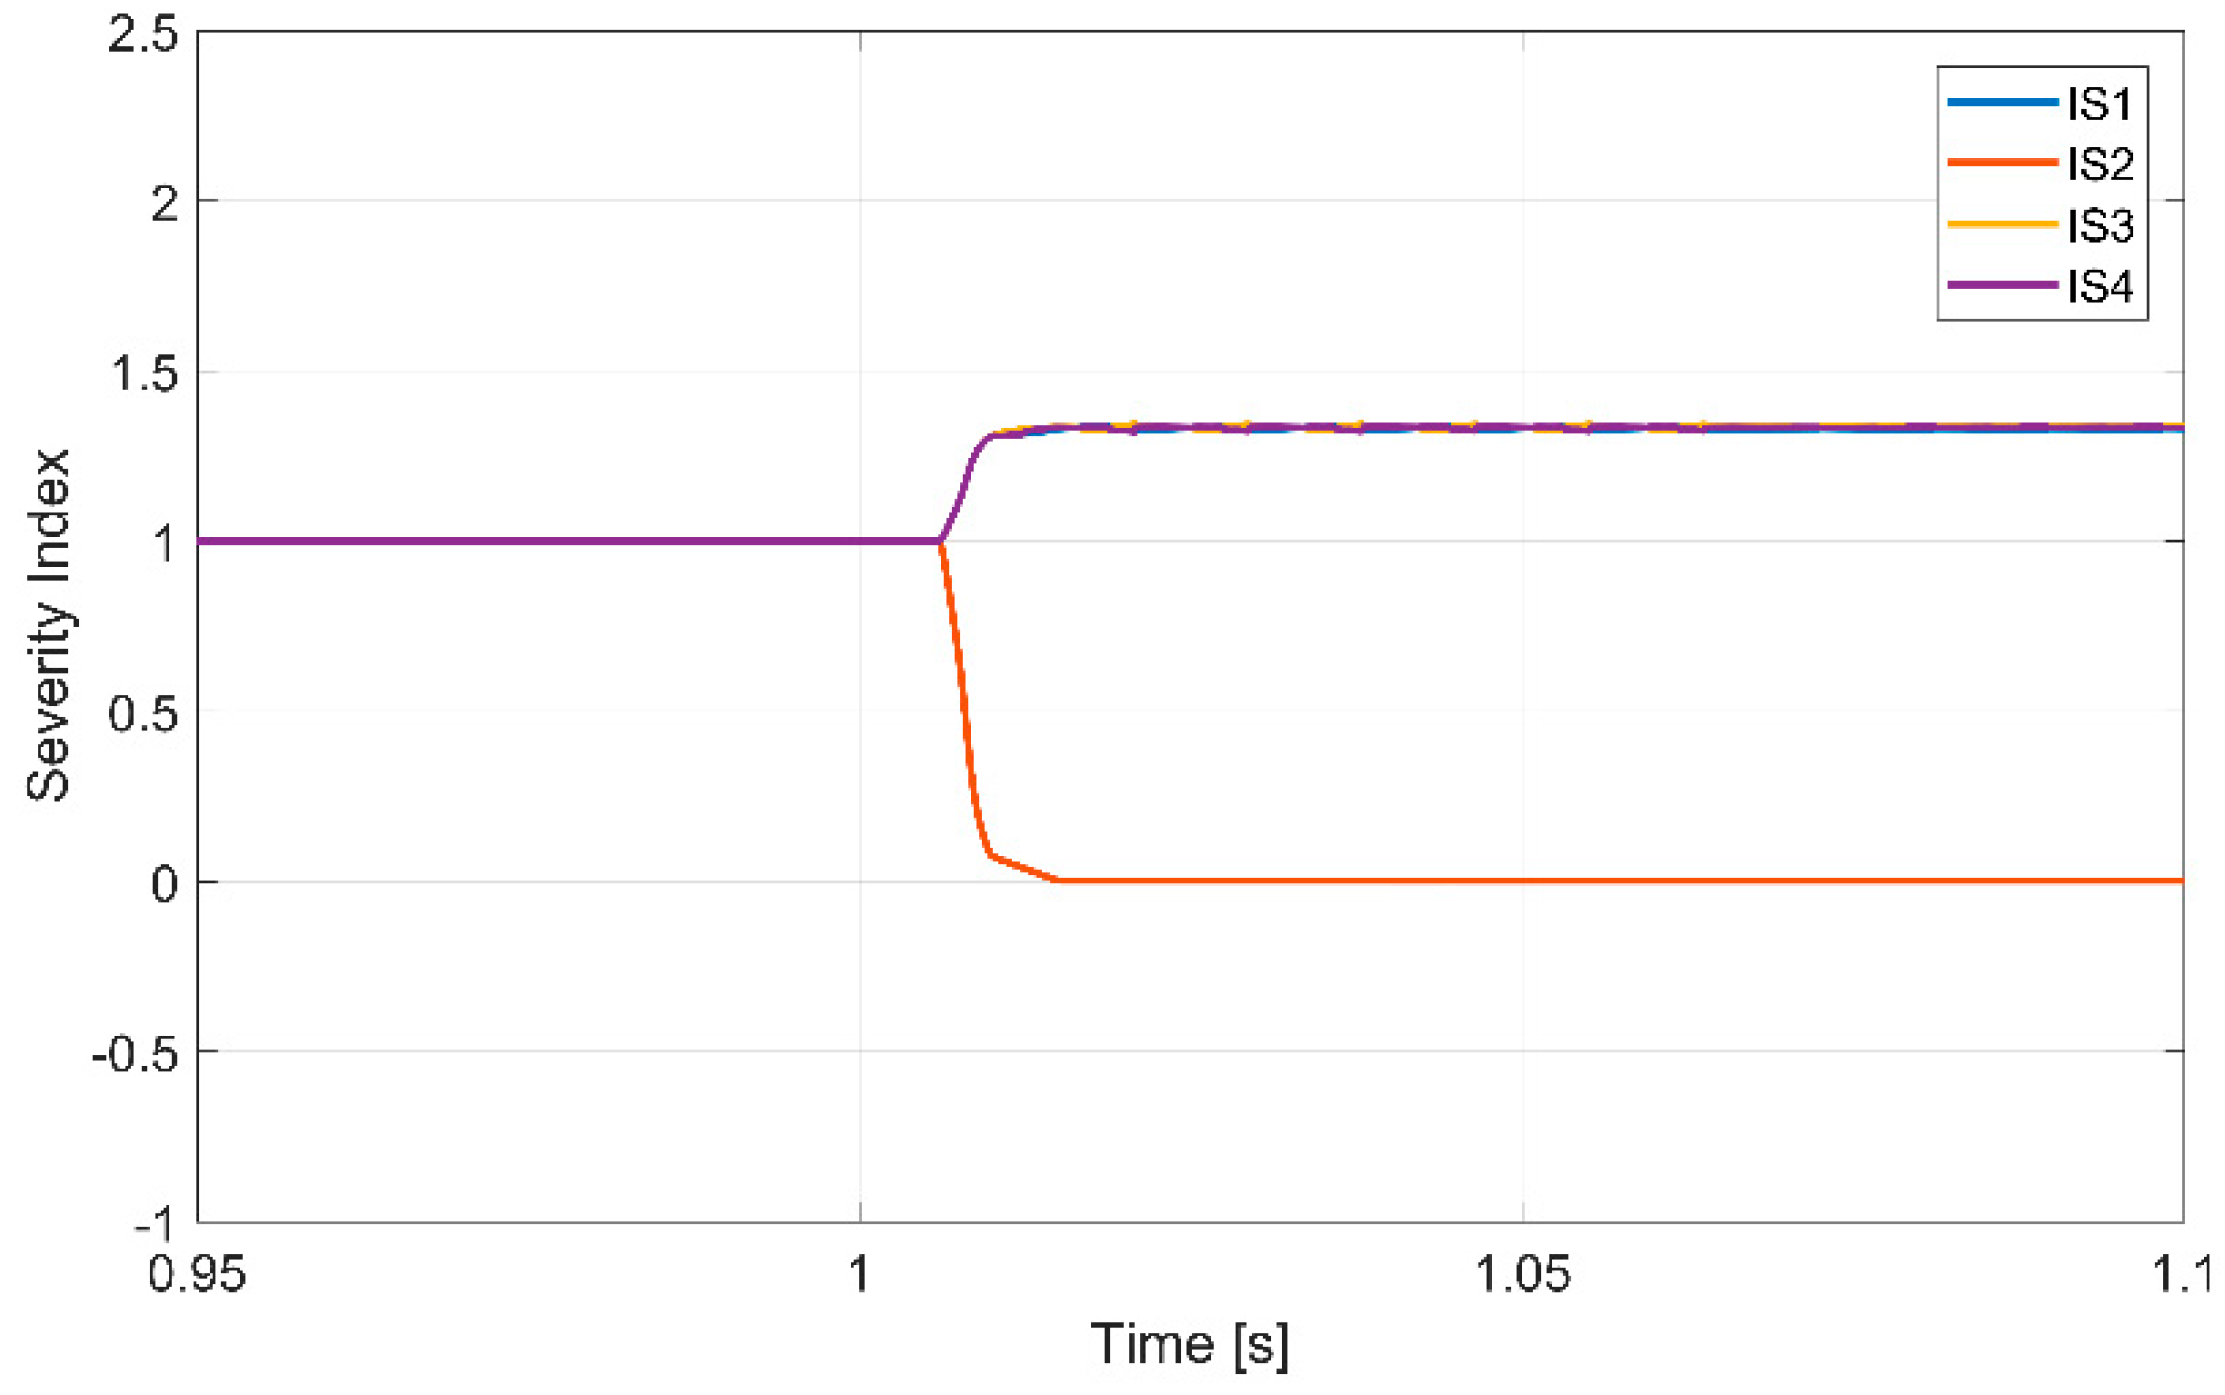
SRM winding currents before and after the failure. As expected, in this experimental test the amplitude of the currents is slightly larger when compared with the previous test due to higher speed operation. It is also possible to confirm that, after the fault, the current in the faulty phase remains always at zero value. The corresponding diagnostic variables are shown in
Figure 21. From this figure, it is possible to verify that the behavior of the diagnostic variables is identical to the one obtained in the previous test.
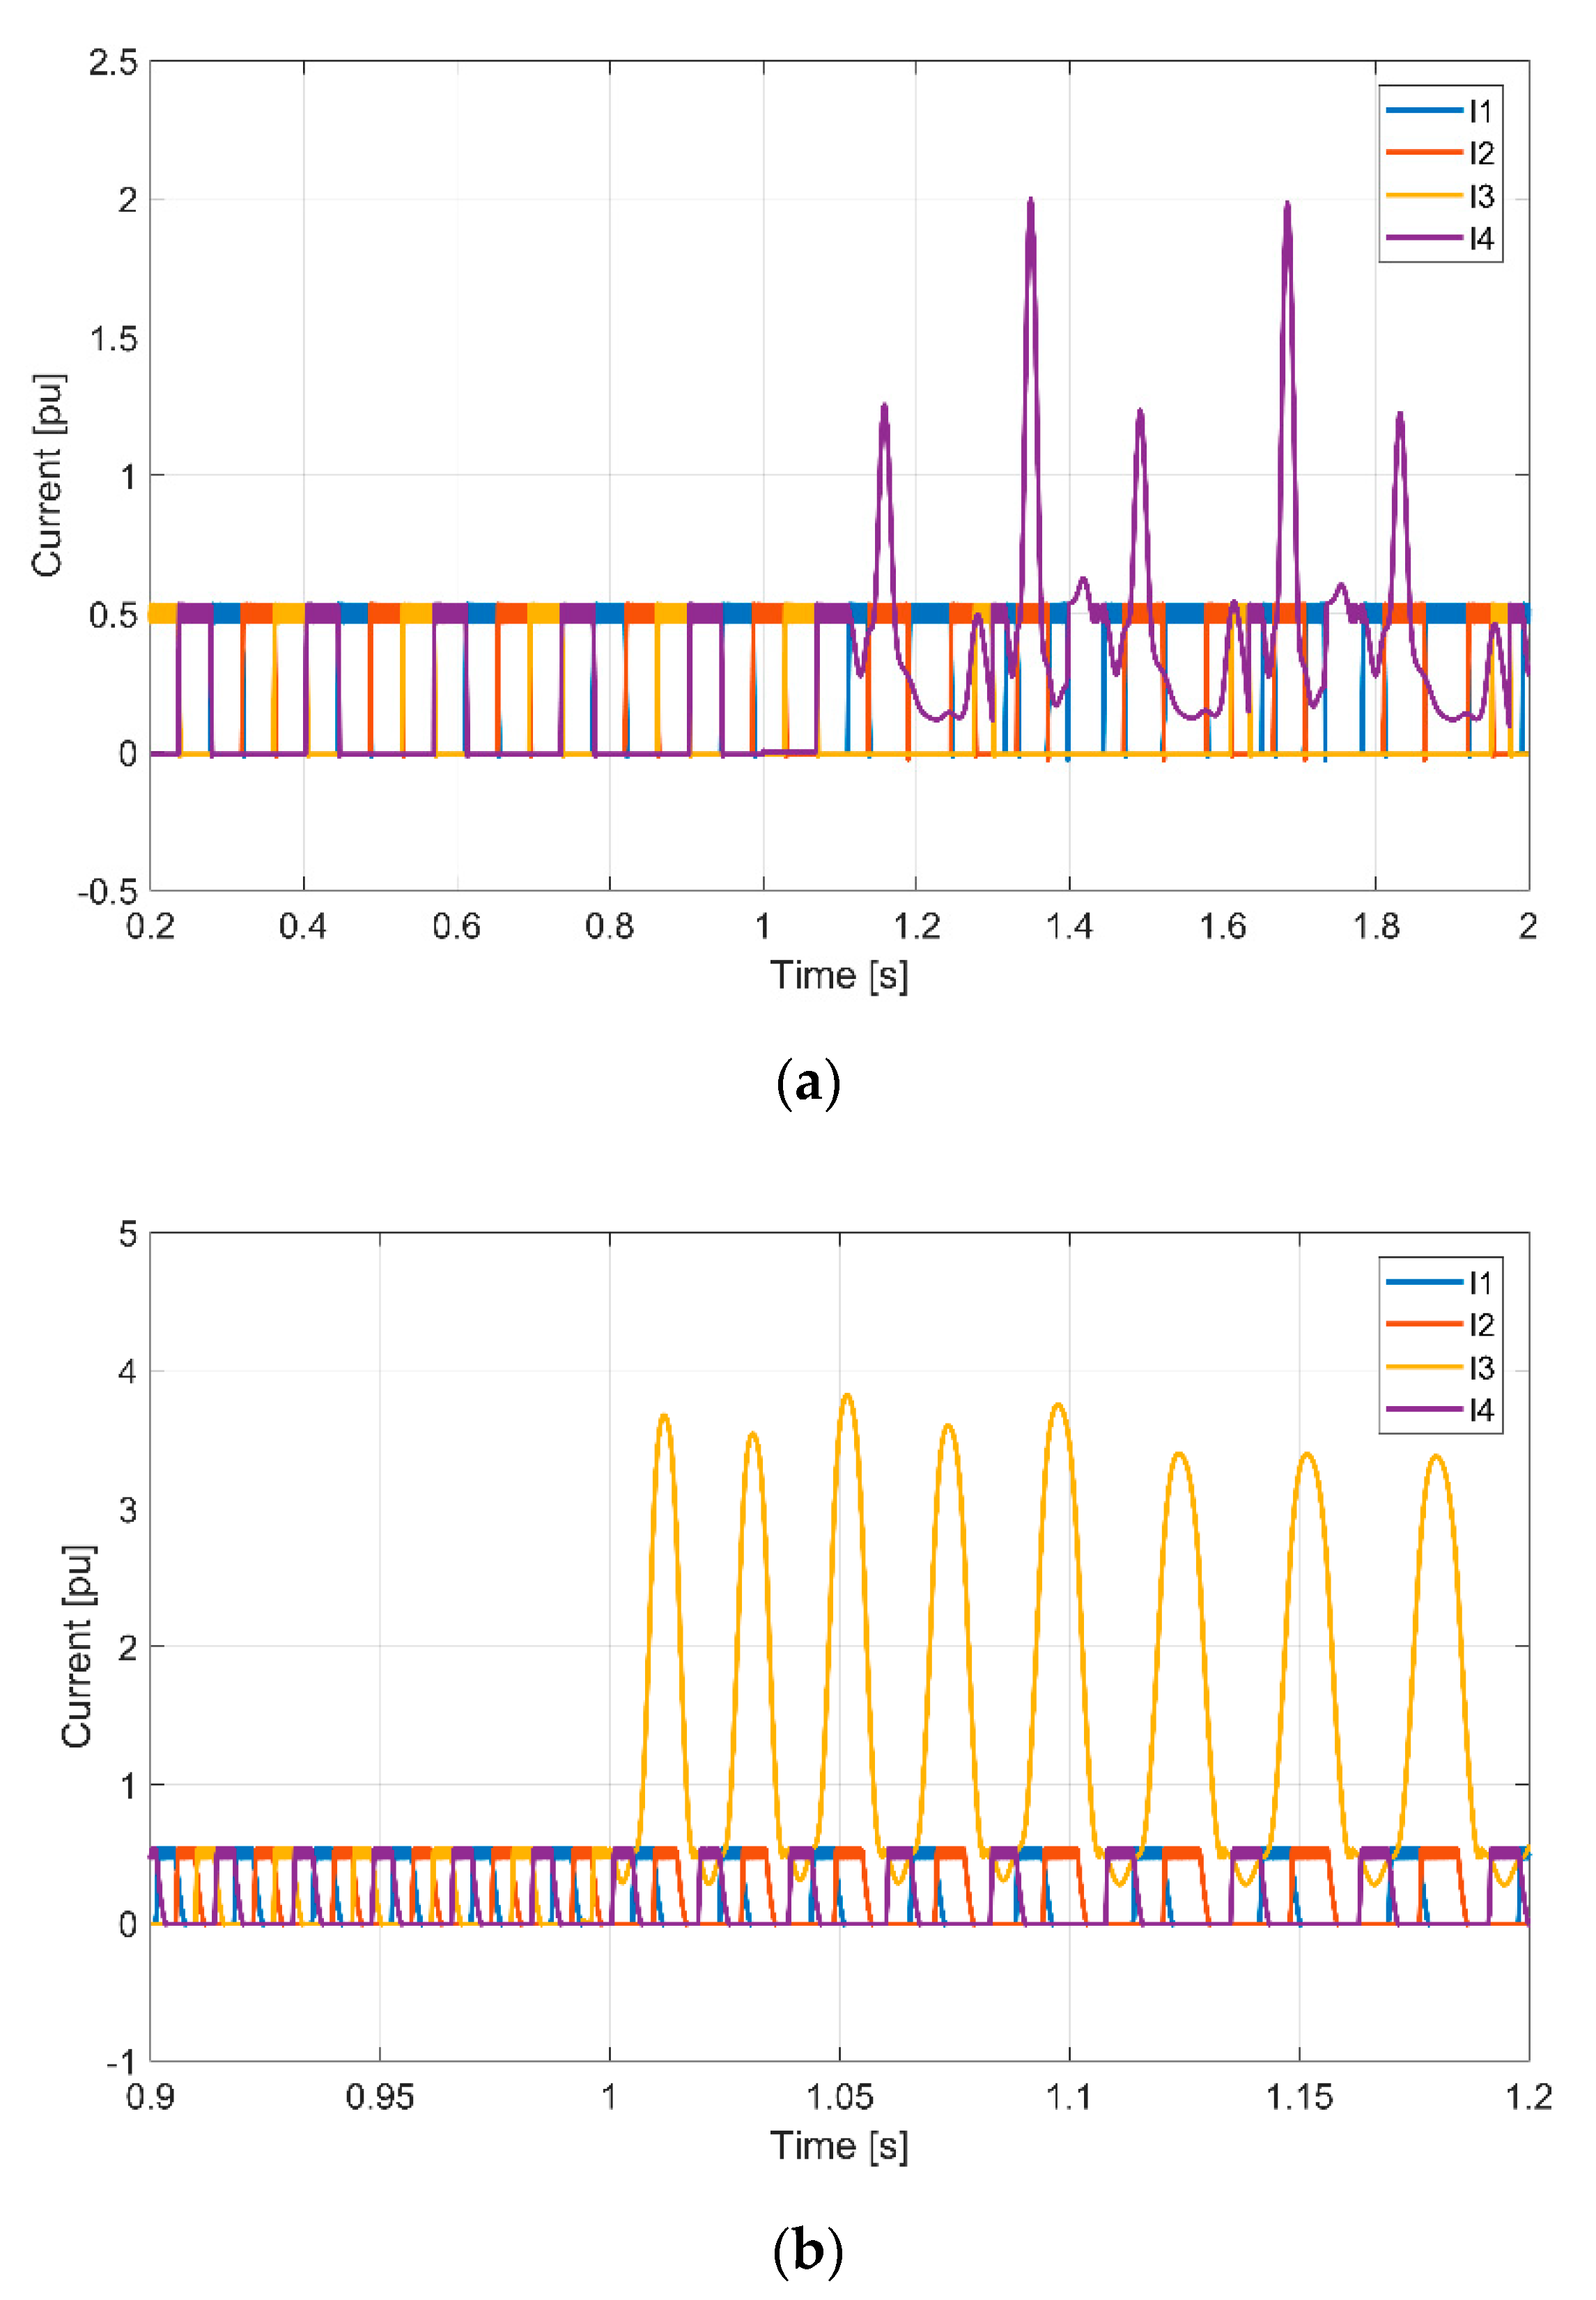
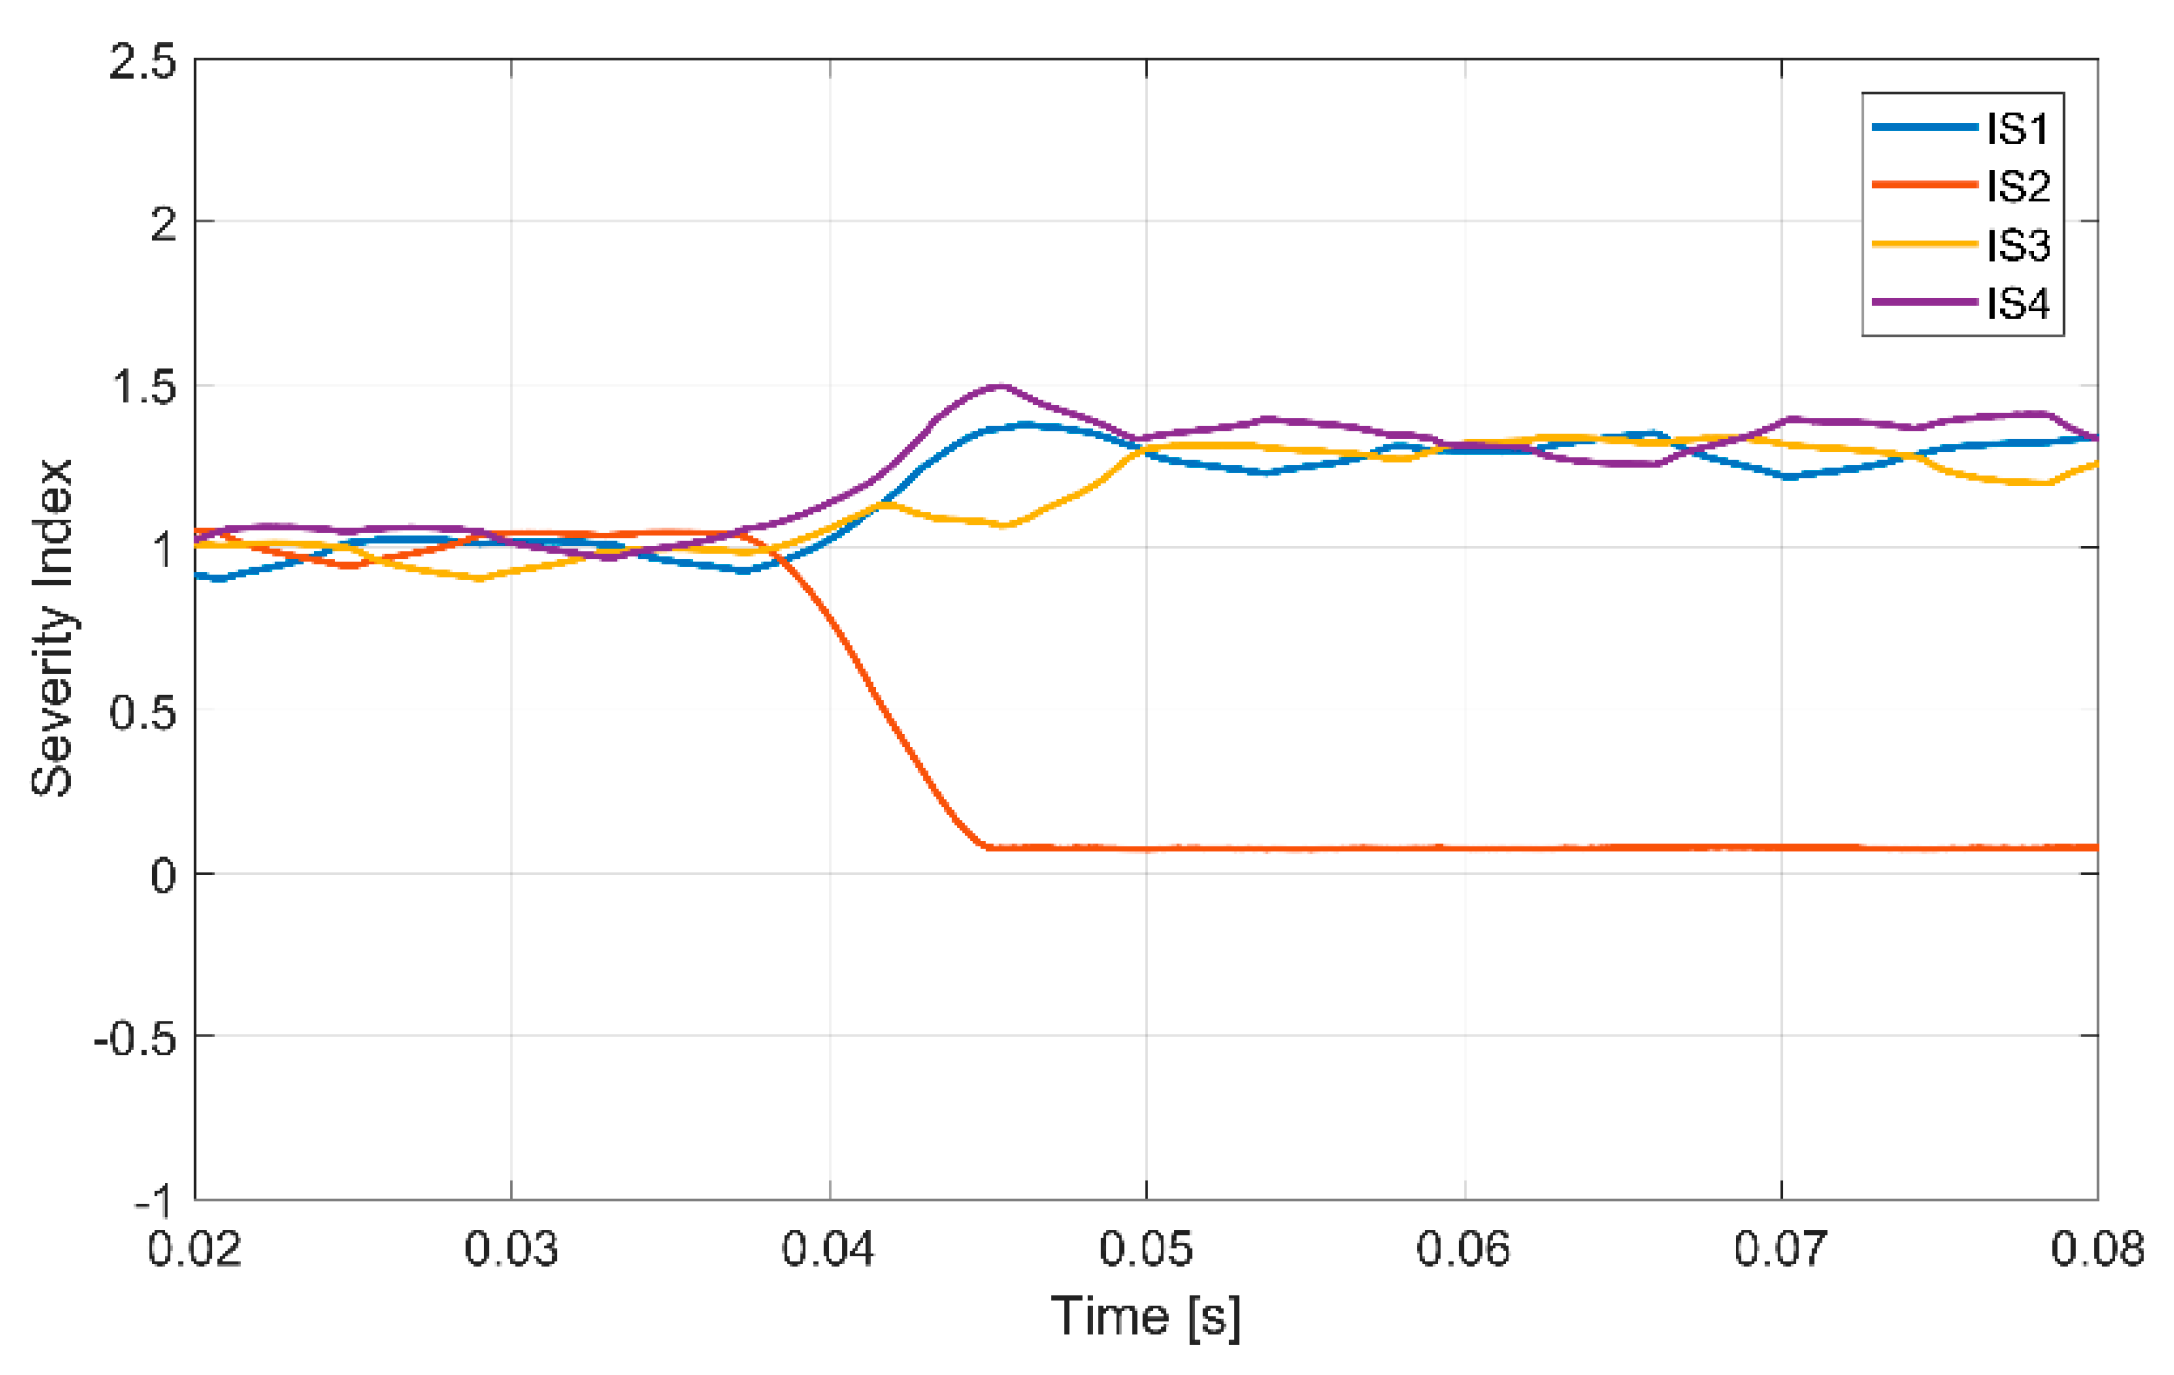
Experimental tests considering a short-circuit failure in power devices were also made. Thus, regarding this failure mode, a first test was made at 600 rpm. The results of an experimental test were the motor is operating in normal condition followed by a short-circuit failure in power device
S1C is presented in
Figure 22. From this figure is possible to see that initially, the currents are balanced, but after the short-circuit failure the current in the motor winding connected to the faulty leg increases uncontrollably. The behavior of the associated diagnostic variables can be seen in
Figure 23. As shown by this figure, during the normal operation the diagnostic variables are constant and with the value of one. However, after this failure these variables gradually change. In this situation the diagnostic variable associated with the faulty leg become higher and reach the value of 2.6. The other variables will become smaller, stabilizing at the value of 0.5. From this experimental test is possible to confirm that the obtained pattern of the diagnostic variables is different from the open-circuit failure mode, but in accordance with the conditions presented in
Table 1.

 ,
, 


