Abstract
A single-function product cannot meet various needs of different users when the product user or use environment changes. A transformable product with multiple functions can meet different needs of users. It is critical to determine product functions that a transformable product should have in the product design. However, it is a challenge to decide required functional components of a transformable product in the design process. A clustering method is proposed in this paper using undirected graphs for segmentations of needs in the time dimension. A need-based function model is built to form product function chains based on cost of the function transition distance between different function chains. Undirected graphs of the function chains are constructed according to the similarity of product functions. The interrelated subgraphs are then used to form multiple functions of a transformable product based on segmentations. A wheelchair is developed as an example to verify the proposed method. The method improves the design process of transformable products accurately and effectively.
1. Introduction
A product has to meet diverse requirements of various users in order to be competitive in the market. Although different products have been developed to meet different user needs, many products provide only a single function, which cannot fully utilize capacity of product resources such as material and space for a variety of user needs. There are products with multiple functions in the market. Some of these products perform different functions through the structural reconfiguration, and some provide multiple functions using a fixed structure. Because of the importance of multi-functional products, different methods have been proposed for design of multi-functional products, such as the reconfigurable design, adaptive design, modular design, and product family design. There are two kinds of reconfigurable design applications: one is the reconfiguration of manufacturing system resources to meet different design requirements [1,2,3,4], and the other is the reconfiguration of product function modules to form different design solutions [5,6,7]. The adaptive design was proposed by Gu et al. [8] to design products that can meet different needs in product design and applications. Design adaptability refers to the ability of the existing design to create new or modified design to meet changeable requirements. Product adaptability refers to the ability of the product to meet changing needs in applications [9]. The modular design is widely used to form a product by using independent function modules [10,11]. The module refers to a unit composed of a component or a group of components to perform a function of the product. Each module can be easily attached, detached, modified, relocated, and replaced for upgrading, modifying, recycling and reusing of the product [12,13]. Common modules of the product can be used as platforms [14,15]. The concept of the product platform can be used to design flexible products with similar common function modules to meet different customer needs [16,17].
These existing methods can effectively guide the design of multi-functional products. However, when there is a need for a product to change functions only through structural transformation without replacing components, the modular product will not be able to meet the requirement. A transformable product is necessary to meet the need. A product is called the transformable product that can change its physical structure to perform different functions or enhance existing functions. For example, the Osprey plane can be transformed between helicopter and aircraft, and Aquada can be formed as either a car or ship [18,19]. There are also many transformable products applied in the architecture and furniture industry [20,21,22]. Transformable products can often be smaller and lighter than equivalent single-state products or a set of single-function products [23]. Transformation is an action of changing the physical structure of a product in order to perform different functions or enhance an existing function. In order to effectively design transformable products, transformation design methods are required [24].
Comparing with a general product, the transformable product uses less material and space to meet different use requirements. It is critical to determine product functions that a transformable product should have in the product design. Although many approaches have been proposed for design of the transformable product, there is a lack of the effective way to identify all potential functions and select the appropriate set of functions for a transformable product. This paper reviews the related work of the design method of transformable products, and proposes a new method to decide required functional components of a transformable product in the design process. This paper focuses on the conceptual design stage of transformable products as the early stage of design determines 80% of product lifespan cost [25]. This paper proposes an effective approach to improve the design for transformable products. The approach integrates methods of needs clustering based on the time correlation, decision-making of the function chain similarity based on transition distances, and segmentation of graph representation.
We will first introduce the representation of users’ needs using a standard form. The needs are clustered according to the time dimension. Function chains of the needs are then established after clustering, and the transition distance between function chains is determined according to the cost measure. The similarity between function chains is obtained according to the transition distance, and final functions of the transformable product are determined based on the similarity. A wheelchair is developed to verify our proposed method. The proposed method improves the conceptual design process of transformable products. A mathematical model is developed to make the design process of transformable products accurately and effectively. The systematic design process enables the computer-aided design of transformable products.
2. Related Research
Different methods have been proposed for design of transformable products. Singh et al. [24] developed transformation products through induction and deduction using three principles and twenty facilitators. A proposed transformation principle provides a general direction to form a certain type of mechanical transformation. The transformation facilitator is a design structure to help create mechanical transformation. Weaver et al. [23,26] analyzed the transformation process of a large number of transformable systems. The use frequency of transformation principles and facilitators in each system is counted. Correlations between transformation principles and facilitators are decided for their use priority in the design process. Transformation principles and facilitators can also be used together with modified mind-maps, and other methods such as T cards, word trees, case-based automated design, and example design [27,28,29,30,31]. Son et al. [32,33] studied the human behavior influenced by transformable products to develop new tools for designers in conceptual design of transformable products. Difficulties that designers may encounter in designing transformable products were found, causes of the difficulties were analyzed, and the effective design process of transformable product was inferred [34]. A transformable product is normally designed based on following three considerations: (1) the product needs packaging for portability and deployment; (2) multiple functions are required in one system for the use convenience; (3) multiple-functions products with dissimilar configurations share common material and/or energy flow [27,28,29]. Four transformation indicators were proposed including sharing functions; adhering to a variable; accommodating a process; and storing [30]. The design solution can be improved to enhance quality, novelty, and feasibility by categorizing the problem context to decide whether a product is suitable for a transformable product or a single function product [31]. The above existing research involves many aspects of transformable products, but how to determine the final function of transformable products has not been solved.
As the transformable product is closely related to the need of users and use environments, a human–machine–environment system should be considered in the design of transformable products [35], as shown in Figure 1.
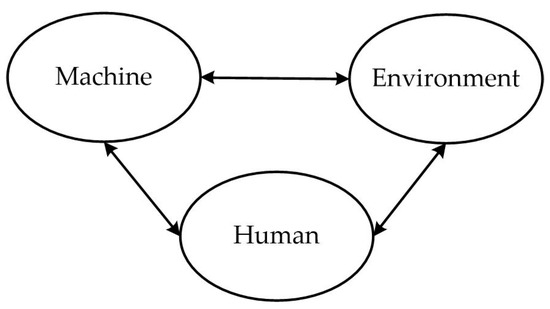
Figure 1.
A human–machine–environment system [36].
For design of a product that can be changed to meet needs of environments or function changes, Desouza et al. [37] proposed a method to let users participate in the design process. Hazelrigg et al. [38] simplified the design into two steps: generating all possible design concepts and selecting the best solution. In order to fully obtain possible solutions, all the user needs have to be considered. Needs can be acquired through user interviews, group discussions, and Big Data analysis [39,40]. Needs are then processed by designers in product design to meet the needs. A normalized expression of needs was used to translate users’ descriptions into design specifications [41]. An extension theory has been applied in product design to study possibility of function expanding using engineering laws and methods for innovation [42]. The extension theory can describe and analyze design using an extension matrix. Quality Function Deployment(QFD) is a multi-level deductive analysis method to transform customer requirements into design specifications, component characteristics, process requirements, and production requirements [43,44]. Axiomatic design divides design problems into four domains: user domain, function domain, structure domain, and process domain. User requirements, function requirements, design parameters, and process variables are applied in the design process. The mapping process from the user domain to function domain can guide the creativity of designers, the mapping process from a functional domain to physical domain can assist designers in conceptual design of transformable products [45,46,47]. Scenarios can be proposed for dynamic descriptions of user–system interactions [48]. Scenarios are usually narrated in the form of stories, including settings, actors, agent’s goals, scenario’s goals, plot, and timeframe [49]. Building scenarios based on needs can evolve functions of transformable products. Functional decomposition can recognize design problems. Through decomposition, designers can get a clear understanding of design problems and requirements. Many scholars have studied the process of functional decomposition from different perspectives [50,51,52]. A functional decomposition process is shown in Figure 2.
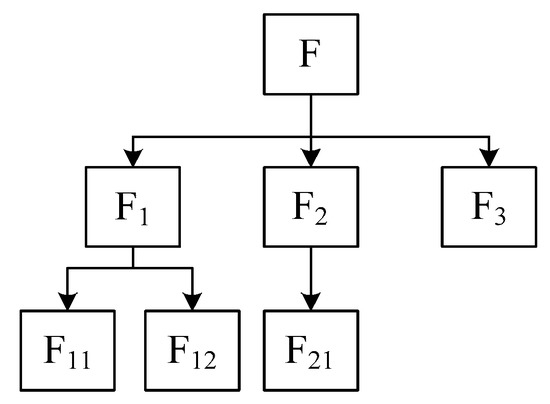
Figure 2.
Functional decomposition [52].
The lowest sub-functions can be arranged in a logical relationship to form a function chain, which reflects the process of realizing the functions [53]. Analyzing the similarity between function chains of single function products can determine whether they should be merged into function chains of transformable products. There are two forms of the function chain: serial and parallel chains, as shown in Figure 3.
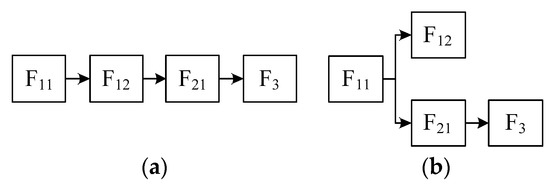
Figure 3.
Two forms of the function chain [53]. (a) serial function chain; (b) parallel function chain.
Although these methods are not specially used to design transformable products, they can greatly assist the design for needs acquisition and function design of transformable products.
3. Proposed Method
For a large number of user needs, the need correlation can be analyzed using the extension theory as follows:
User means people have the need. Scene is the scenario where the need exists. Time is when the need is required. Activity means actions to respond to the need. The current situation is the state of current activities at the time of the application. Expected situation means the expected activities at the time of the product application. Potential need sets of a basic product are represented by N = [N1, N2, …, Ni, …, Nm]. u1–u6 are specific descriptions of user, scene, time, activity, current situation, and expected situation. The importance of each need is determined by a comparing table [54] as shown in Table 1.

Table 1.
Comparison of the importance of each need.
According to the frequency of needs appearing in the matrix, the importance of needs can be decided and recorded as wi. For two needs with the high importance, the relationship between them will also be very important in the needs set. The sum of the two needs importance is used to express the weight of the two needs relationship. Dividing the sum by m − 1 is for the weight normalization, where m is the number of needs. The weight of the relationship between two needs is decided using Equation (1):
Different functions of a transformable product are applied in different time periods [1], such as 0, 1, 3, 6, and 10, can be used to indicate the degree of time dependency [55]. Transformable products meet different needs at different times, so needs should be clustered in the time dimension to facilitate the design of transformable products. The time correlation between potential needs can be expressed in levels of 0, 0.3, 0.6, and 1. As shown in Equation (2),
where represents that there is no intersection of two needs in the same time, mean that there is a partial intersection of two needs in the use time.
represent that the usage time of Nj is a true subset of the usage time Ni.
represents that Ni and Nj work at the same time.
The time related degree of all needs can be obtained by calculating the time correlation of each pair of two needs. According to Equations (1) and (2), the time independence between needs can be obtained using Equation (3):
where Max{} is the correction coefficient for values in the matrix easily distinguishable. According to Equation (3), the relationship matrix of needs can be established using Equation (4):
The graph theory uses a graph as its object of study to transform the relationship matrix into a graph [56]. According to the relationship matrix, we can draw a need-related undirected graph, in which nodes are needs and edges are the relationship between the needs. Segmentations of the undirected graph are decided by setting an appropriate threshold. Each interconnected subgraph forms a kind of need with the time dependence. Each kind of need corresponds to a potential state of the product. Function design is conducted for each product form to obtain a function chain of the product in each use state.
Function chains express sub-functions and their relationships. A directed graph can represent the logical relationship between nodes [56]. Function chains can be expressed by directed graphs, for example, G = (F, L), where F = {F1, F2, …, Fn}, L = {L1, L2, …, Ln}. G is a function chain, F is a set of sub-functions of function chain G, and L is a set of relationships among sub-functions. Figure 4a shows a directed graph of a function chain in which a product performs one function. In practice, a product function can be used many times. A chain of multiple functions is shown in Figure 4b.
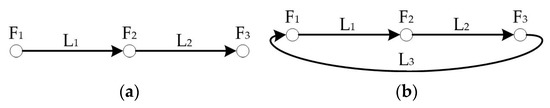
Figure 4.
Function chains (a) function chain that performs one function; (b) function chain that performs multiple functions.
When a product needs to perform multiple functions, it needs to be transited from one function chain to another. Much research has been done on the transition from one graph to another [57,58,59,60]. The cost of a transition is directly related to its suitability. The lower the cost of the transition, the higher the possibility that the two function chains can be converted to each other. The higher the similarity between the two function chains, the easier conversion of the chains. The transition from one function chain to another requires a series of operations, including the node converting, deleting, adding, and edge deletion and addition. Two function chains G1 and G2 are shown in Figure 5.
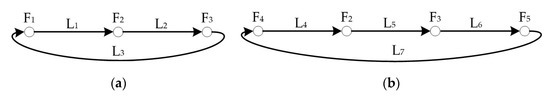
Figure 5.
Two function chains (a) function chain G1; (b) function chain G2.
The sum of costs of all operations from G1 to G2 is called the distance of transition from G1 to G2, expressed by Trans{G1, G2}. The similarity between G1 and G2 is expressed as Sim{G1, G2} using Equation (5):
where |Gi| is the total number of nodes and edges in G1 and G2. The distance of transition from G1 to G2 is calculated by Equation (6):
where con(Fi, Fj) converts node Fi to node Fj, del(Fi) deletes node Fi, add(Fi) adds node Fi, del(Li) deletes edge Li, and add(Li) adds edge Li.
The cost of deleting and adding one node or edge can be assigned as one unit currency. Because there may be some similarity between two nodes, the cost of converting nodes is designed as 1-Sim{Fi, Fj}. Sim{Fi, Fj} is the similarity between nodes Fi and Fj. The higher the similarity, the lower the cost of conversion. Semantic similarity computation has many applications in information retrieval, information extraction, word sense disambiguation, and machine translation [61,62]. In this paper, we use it to calculate similarity between two nodes based on the semantic similarity. All words are stored on a word tree according to the semantic relationship. The similarity of words can be calculated based on their distance in the word tree. The similarity of nodes is calculated by numbering them for their distance on the word tree using Equations (7)–(10) [63].
(1) If two words are not in the same tree.
(2) If two words are in the same tree.
where n is the total number of nodes in the branch layer, and k is the distance between two branches.
(3) When numbers are same and the end number is ‘=’.
(4) When numbers are same and the end number is ‘#’.
Using the semantic similarity calculation software of the synonym forest, we can calculate the similarity of two words according to the above definitions [64]. After calculating transition distances of function chains, the transition distances are weighted according to Equation (11):
where z is the number of function chains, divided by z − 1 to make the sum of the weights be 1. The weighted transition distance of two function chains is calculated by Equation (12):
where Max{} is the correction coefficient to make values in the matrix easily distinguishable.
For an undirected graph A = (G, W), where G = {G1, G2, ..., Gn}, W = {W1, W2, …, Wm}. G is a set of function chains, and W is a set of similarity between function chains. Using threshold value W0 removes edges less than W0 in the undirected graph and deletes independent nodes. A new subgraph A0 is generated. Interconnected nodes in subgraph A0 are the function chains of the transformable product. The connection between nodes indicates that the function chains represented by these nodes can be transformed each other. Each interconnected node represents a state of a transformable product, and these nodes form the concept of a transformable product. As it is difficult to map the functional domain to physical domain directly, physical components can be designed by refining functions in the mapping process, as shown in Figure 6.
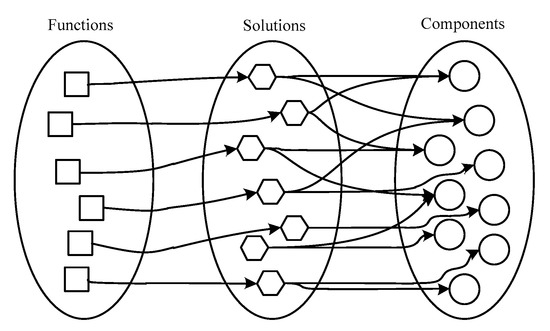
Figure 6.
Mapping of functions–solutions–components.
For a certain function, the solution to realize the function can be selected by designers firstly. Components for implementing the function are then determined. The number of identical components in each state represents the space and material savings of the transformable product. The effectiveness of the method can be evaluated according to the proportion of shared components, as shown in Equation (13):
where P is the proportion of shared components, NCT is the number of components in the transformable product, and NCSi is the number of components in the i-th state. The trend of technological evolutions is used to improve the level of idealization [65]. The calculation equation of idealization levels is as follows:
where I is the idealized level, is the sum of useful functions, is the sum of harmful functions, and is expenses including cost, space, consumed energy, noise, etc. In this paper, is the number of useful functions, is assumed as 0 because the harmful function should not be proposed in design, and is the number of components in the product.
Comparing the idealization level of a transformable product to multiple products with the same functions can effectively determine whether the function implementation has been improved. The idealization level of a transformable product divided by the idealization level of existing products is the change degree of the idealization level, as shown in Equation (15):
where C is the change degree of the idealization level, It is the idealization level of a transformable product, and Ie is the idealization level of existing products.
4. Case Study
A wheelchair is developed in a case study to verify our proposed method. The wheelchair is required to meet needs of people with walking difficulty due to illness, injury, or disability [66]. Different user groups or different usage environments may have different needs for the wheelchair. The collected user needs are listed in Table 2.
Table 2.
User needs for a wheelchair.
These needs are formalized for details as shown in Table 3.
Table 3.
User needs.
Table 4.
Comparisons for the importance of needs for a wheelchair.
Table 5.
Weight of needs.
Weights of needs in Table 5 were decided by using the method proposed in Table 1. All needs are compared by a pairwise method. For two needs, the more important one is listed in Table 4 after the comparison. The final weight of a need is decided by its appearance times in Table 4. Weights in Table 5 are normalized values; therefore, the total weights are 1. According to Equation (1), is calculated as shown in Equation (16):
Using Equation (3), the relationship matrix of needs is established as shown in Equation (17):
According to the relationship matrix, we can draw the needs-related undirected graph as shown in Figure 7.
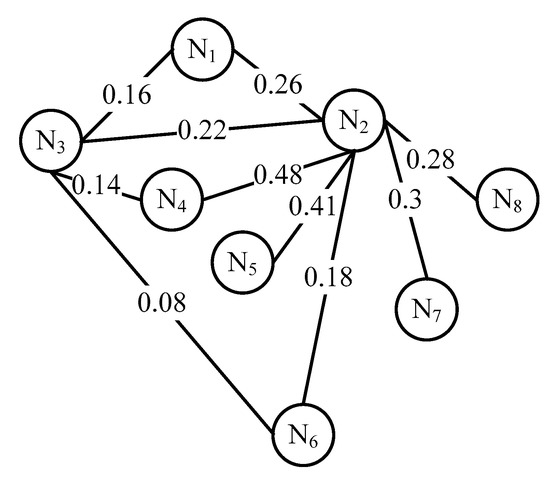
Figure 7.
Needs-related undirected graph.
Designers can choose different thresholds in different scenes based on the design requirements. For a given threshold value R = 0.4, the resulting segmentations of the graph are shown in Figure 8.
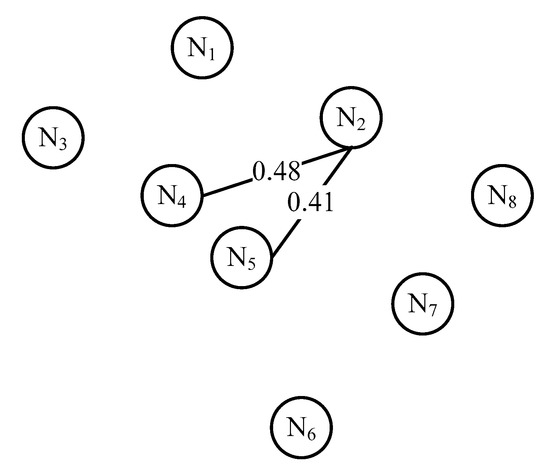
Figure 8.
Segmentations of needs-related undirected graph.
As shown in Figure 8, the needs are divided into six categories corresponding to six potential states, as shown in Table 6.
Table 6.
Scenario description of six states.
The product functions in the scenario are obtained through the description of the scenario. Function chains of the six states are obtained after the function decomposition as shown in Figure 9.
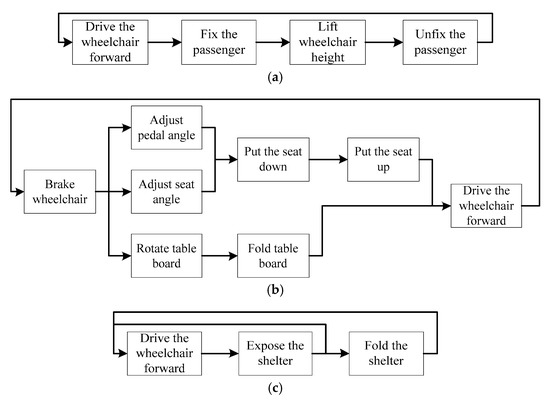
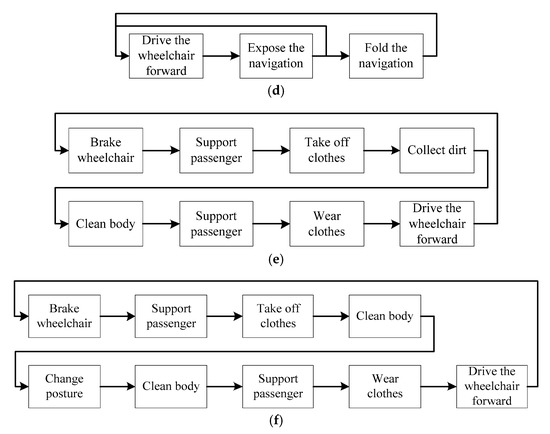
Figure 9.
Function chains of the six states. (a) function chain G1, (b) function chain G2, (c) function chain G3, (d) function chain G4, (e) function chain G5, (f) function chain G6.
According to Equations (7)–(10), transition distances between any two function chains can be obtained as shown in Equation (18):
Using Equation (5), the similarity of two functional chains is obtained as shown in Equation (19):
Based on Equation (11), weights of the distance between any two function chains are obtained as shown in Equation (20):
According to Equation (12), the weighted similarity is obtained as shown in Equation (21):
An undirected graph of the matrix in Equation (21) is then established as shown in Figure 10.
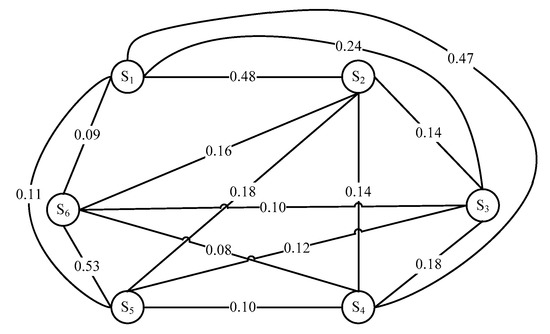
Figure 10.
The undirected graph of the weighted similarity.
For a given threshold value R = 0.4, the resulting segmentation of the graph is formed in Figure 11.
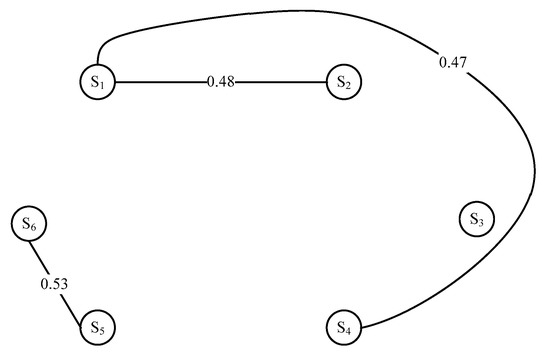
Figure 11.
Segmentations of the undirected graph based on the weighted similarity.
Therefore, two final concepts can be formed for the wheelchair based on two segments formed in Figure 11, and the first concept has three states S1, S2, and S4. Its function chain is shown in Figure 12.
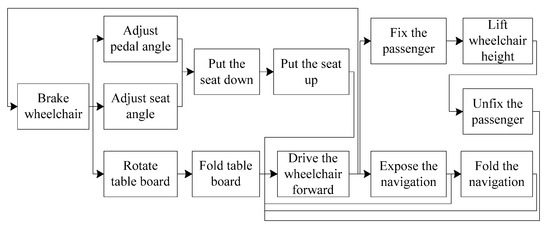
Figure 12.
Function chain of the first concept.
Following the mapping process in Figure 6, the relationship between functions and components of the first concept can be formed as shown in Table 7. Based on corresponding components to meet the required functions, a conceptual model of the wheelchair can be proposed. The computer-aided design(CAD) model of the first concept is shown in Figure 13.
Table 7.
Relationship between functions and components of the first concept.
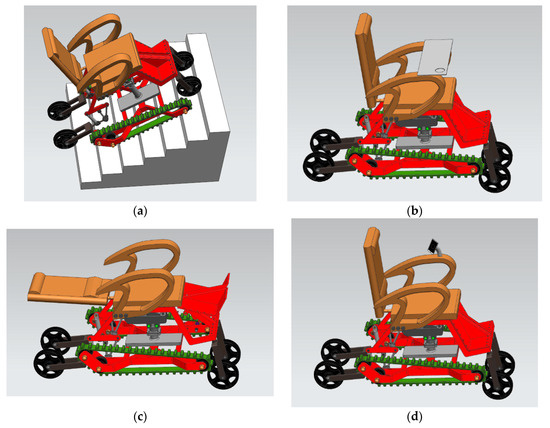
Figure 13.
The first conceptual design of the wheelchair. (a) in climbing state, (b) in working state, (c) in sleeping state, (d) in navigation state.
The second concept consists of S5 and S6, its function chain is shown in Figure 14.
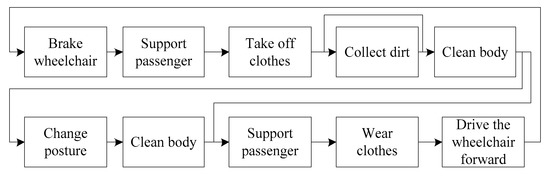
Figure 14.
Function chain of the second design concept.
According to the mapping relationship of functions–solutions–components in Figure 6, the relationship between functions and components of the second concept is mapped as shown in Table 8.
Table 8.
Relationship between functions and components of the second concept.
The CAD model of the second conceptual design is shown in Figure 15.
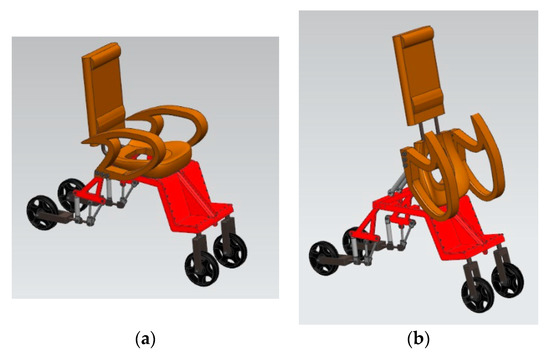
Figure 15.
The second design of the wheelchair. (a) in toilet state, (b) in bathing state.
According to Equation (13), the proportion of shared components in the first concept can be calculated as 70%. The proportion of shared components in the second concept can be calculated as 75%. More than half of the parts are reused, which saves a lot of material and space resources compared to the single-function wheelchairs. The number of useful functions and number of components are shown in Table 9.
Table 9.
Useful functions and related components in two concepts.
According to Equations (14) and (15), the change degree of the idealization level can be calculated as 1.43 in the first concept, and 1.33 in the second concept. The results show that our proposed method increases the level of the product idealization and conforms to the trend of technological system evolutions in the design for transformable products.
5. Discussion
A transformable product uses the less resource and space than single-function products. Methods were proposed in this paper to decide required functional components and conceptual design of transformable products. Although there are many methods proposed to decide the need and design of transformable products [27,28,29,30,31], the method proposed in this research improves the existing methods by providing an effective tool to assist designers in the design of transformable products. A mathematical model was established for the design process of transformable products accurately and effectively. It proposed the time correlation to cluster the needs, which is a quantitative clustering method that can better assist designers to cluster needs. Segmentations of needs were used to form scenarios of function chains. The transition distance was determined by the cost of transition between different function chains. By calculating the distance between function chains, the similarity between them are more objectively. A weighted undirected graph was built according to the transition distance. After the undirected graph segmentation, the connected subgraphs were used to form final design concepts of transformable products. The segmentation of graph makes the final concept more systematic. The case study verified our proposed method in the design of a transformable wheelchair. Compared to the existing wheelchairs on the market that can only drive passengers on the smooth road, two concepts of the proposed transformable wheelchair can meet various needs of operation functions. Although the number of the possible detailed constructions of wheelchairs is huge or infinite, the conceptual design of wheelchairs to meet transformable requirements is limited considering the available functional components and configurations. We used benchmarking and expert evaluations to generate concepts and select the feasible solution. The design results were evaluated by comparing the idealization level of transformable products with the existing products. The two concepts generated in the case study demonstrated effectiveness of the proposed method. The results show that our proposed method increases the level of the wheelchair idealization and conforms to the trend of technological system evolutions in the design for transformable products. In this paper, we evaluate results by comparing the idealization level of transformable products with the existing products. If the idealization level is improved by the proposed method, it shows that the method is effective. We are working on considering more factors to evaluate transformable products. The optional solution will be searched in the further work. It will consider not only the technical implementation but also expectations of the industry and users to evaluate transformable products. The method improves the conceptual design process of transformable products. However, the process is mainly a manual process which needs the design knowledge of designers. The current method is for the redesign of an existing product, not for development of new products. The design process is mainly a manual process that needs the design knowledge of designers. The further work will extend the method to the new product design. More factors will be considered to search an optional solution and evaluate design solutions. The method will include not only the technical implementation but also expectations of the industry and users. A software tool will be developed for the automatic design of transformable products. Further work will also apply the proposed method to different transformable products for the method improvement. Interfaces of transformable products will be considered. A machine learning method will be used to decide the change need of transformable products from one state to another.
Author Contributions
Conceptualization, J.Z., G.C., and H.Z.; methodology, J.Z., G.C., Q.P., and R.T.; writing—original draft preparation, J.Z.; writing—review and editing, Q.P., W.L., and J.Z.; supervision, G.C.; project administration, R.T.; funding acquisition, G.C. All authors have read and agreed to the published version of the manuscript.
Funding
This research was funded by the National innovation method work special project, Grant No. 2019IM020200, the Innovation Ability Promotion Project of Hebei Province, Grant No. 18961823H, the Support Scheme for 100 Outstanding Innovative Talents in Colleges and Universities in Hebei Province, Grant No. SLRC2017030, the Natural Science Foundation of China, Grant No. 51675159, the Central Government Guides Local Science and Technology Development Project, Grant No. 18241837G, and the Project Supported by Hebei Provincial Department of Education for Innovation Ability Training of Graduate Students, Grant No. cxzzbs2019033.
Conflicts of Interest
The authors declare no conflict of interest.
References
- Koren, Y.; Heisel, U.; Jovane, F.; Moriwaki, T.; Pritschow, G.; Ulsoy, G.; Van Brussel, H. Reconfigurable manufacturing systems. CIRP Ann. 1999, 48, 527–540. [Google Scholar] [CrossRef]
- ElMaraghy, H.A. Changeable and Reconfigurable Manufacturing Systems; Springer: London, UK, 2008. [Google Scholar]
- Musharavati, F. A method for optimizing the reconfiguration design task in manufacturing systems. In Proceedings of the 2011 International Conference on Industrial Engineering and Operations Management, Kuala Lumpur, Malaysia, 22–24 January 2011; pp. 603–609. [Google Scholar]
- Aguilar, A.; Roman-Flores, A.; Huegel, J.C. Design, refinement, implementation and prototype testing of a reconfigurable lathe-mill. J. Manuf. Syst. 2013, 32, 364–371. [Google Scholar] [CrossRef]
- Carbonari, L.; Callegari, M.; Palmieri, G.; Palpacelli, M.-C. A new class of reconfigurable parallel kinematic machines. Mech. Mach. Theory 2014, 79, 173–183. [Google Scholar] [CrossRef]
- Katz, R. Design principles of reconfigurable machines. Int. J. Adv. Manuf. Technol. 2007, 34, 430–439. [Google Scholar] [CrossRef]
- Bi, Z.M.; Lang, S.Y.T.; Verner, M.; Orban, P. Development of reconfigurable machines. Int. J. Adv. Manuf. Technol. 2008, 39, 1227–1251. [Google Scholar] [CrossRef]
- Gu, P.; Hashemian, M.; Nee, A.Y.C. Adaptable design. CIRP Ann. Manuf. Technol. 2004, 53, 539–557. [Google Scholar] [CrossRef]
- Gu, P.; Xue, D.; Nee, A.Y.C. Adaptable design: Concepts, methods, and applications. Proc. Inst. Mech. Eng. Part B J. Eng. Manuf. 2009, 223, 1367–1387. [Google Scholar] [CrossRef]
- Gershenson, J.K.; Prasad, G.J.; Zhang, Y. Product modularity: Definitions and benefits. J. Eng. Des. 2003, 14, 295–313. [Google Scholar] [CrossRef]
- Gershenson, J.K.; Prasad, G.J.; Zhang, Y. Product modularity: Measures and design methods. J. Eng. Des. 2004, 15, 33–51. [Google Scholar] [CrossRef]
- Jung, S.; Simpson, T.W. New modularity indices for modularity assessment and clustering of product architecture. J. Eng. Des. 2017, 28, 1–22. [Google Scholar] [CrossRef]
- Kashkoush, M.; Elmaraghy, H. Designing modular product architecture for optimal overall product modularity. J. Eng. Des. 2017, 28, 293–316. [Google Scholar] [CrossRef]
- Simpson, T.W.; Siddique, Z.; Jiao, J. Product Platform and Product Family Design, Methods and Applications; Springer: Berlin, Germany, 2006. [Google Scholar]
- Jiao, J.; Simpson, T.W.; Siddique, Z. Product family design and platform-based product development: A state of-the-art review. J. Intell. Manuf. 2007, 18, 5–29. [Google Scholar] [CrossRef]
- Saleh, J.H.; Mark, G.; Jordan, N.C. Flexibility: A multi-disciplinary literature review and a research agenda for designing flexible engineering systems. J. Eng. Des. 2009, 20, 307–323. [Google Scholar] [CrossRef]
- Palani-Rajan, P.K.; Van-Wie, M.; Campbell, M.I.; Wood, K.L.; Otto, K.N. An empirical foundation for product flexibility. Des. Stud. 2005, 26, 405–438. [Google Scholar] [CrossRef]
- BELL-BOEING V-22. Available online: https://www.skybrary.aero/index.php/V22 (accessed on 5 December 2019).
- Aquada. Available online: https://www.gibbsamphibians.com/platform/aquada/ (accessed on 5 December 2019).
- Liapi, K. Transformable structures: Design features and preliminary investigation. J. Archit. Eng. 2001, 7, 13–17. [Google Scholar] [CrossRef]
- Andjelkovic, V. Transformation principles in the architectural design of a contemporary house. Arch. Doct 2016, 4, 87–107. [Google Scholar]
- HOLMSUND. Available online: https://www.ikea.cn/cn/en/catalog/products/S09228206/ (accessed on 5 December 2019).
- Weaver, J.; Wood, K.; Crawford, R.; Jensen, D. Transformation design theory: A meta-analogical framework. J. Comput. Inf. Sci. Eng. 2010, 10, 031012. [Google Scholar] [CrossRef]
- Singh, V.; Skiles, S.M.; Krager, J.E.; Wood, K.L.; Jensen, D.; Sierakowski, R. Innovations in design through transformation: A fundamental study of transformation principles. J. Mech. Des. 2009, 131, 081010. [Google Scholar] [CrossRef]
- Dowlatshahi, S. Product design in a concurrent engineering environment: An optimization approach. Int. J. Prod. Res. 1992, 30, 1803–1818. [Google Scholar] [CrossRef]
- Weaver, J. Transformer Design: Empirical Studies of Transformation Principles, Facilitators, and Functions. Master’s Thesis, University of Texas at Austin, Austin, TX, USA, 2008. [Google Scholar]
- Singh, V.; Walther, B.; Krager, J.; Putnam, N.; Koraishy, B.; Wood, K.L.; Jensen, D. Design for Transformation: Theory, Method and Application. In Proceedings of the ASME International Design Engineering Technical Conference & Computers and Information in Engineering Conference, Las Vegas, NV, USA, 4–7 September 2007; pp. 447–459. [Google Scholar]
- Weaver, J.; Wood, K.L.; Jensen, D. Transformation Facilitators: A Quantitative Analysis of Reconfigurable Products and Their Characteristics. In Proceedings of the International Design Engineering Technical Conferences, Brooklyn, NY, USA, 3–6 August 2008; pp. 351–366. [Google Scholar]
- Singh, V. Design for Transformation: Design Principles and Approach with Concept Generation Tools and Techniques. Master’s Thesis, University of Texas at Austin, Austin, TX, USA, 2007. [Google Scholar]
- Camburn, B.A.; Guillemette, J.; Crawford, R.H.; Jensen, D.J.; Wood, J.J.; Wood, K.L. When to transform? Development of indicators for design context evaluation. In Proceedings of the International Design Engineering Technical Conferences and Computers and Information in Engineering Conference (ASME 2010), Montreal, QC, Canada, 15–18 August 2010; pp. 249–266. [Google Scholar]
- Camburn, B.; Wood, K.; Crawford, R.; Robbens, J.; Jensen, D.; Patel, A. Advances in transformational design: Correlating context evaluation to quality feasibility and novelty. In Proceedings of the International Design Engineering Technical Conferences and Computers and Information in Engineering Conference (ASME 2012), Chicago, IL, USA, 12–15 August 2012; pp. 447–460. [Google Scholar]
- Son, J. Mechanical Transformation to Support Design for Environmentally Significant Behaviour. Master’s Thesis, University of Toronto, Toronto, ON, Canada, 2012. [Google Scholar]
- Son, J.; Shu, L.H. The mechanical transformation and environmentally conscious behavior. AI EDAM 2014, 28, 193–203. [Google Scholar] [CrossRef][Green Version]
- HaeBin, L. Difficulties in Transformable Design and Its Implications. Master’s Thesis, UNIST, Ulsan, Korea, 2016. [Google Scholar]
- Li, S. Introduction to Interaction Design, 1st ed.; Tsinghua University Press: Beijing, China, 2009. [Google Scholar]
- Liu, X. Research on Key Technologies of Situated Design for Innovative Process. Ph.D. Thesis, Hebei University of Technology, Tianjin, China, 2007. [Google Scholar]
- DeSouza, K.C.; Awazu, Y.; Jha, S.; Dombrowski, C.; Papagari, S.; Baloh, P.; Kim, J.Y. Customer-driven innovation. Res. Technol. Manag. 2008, 51, 35–44. [Google Scholar] [CrossRef]
- Hazelrigg, G.A. A framework for decision-based engineering design. J. Mech. Des. 1998, 120, 653–658. [Google Scholar] [CrossRef]
- Song, W. Requirement management for product-service systems: Status review and future trends. Comput. Ind. 2017, 85, 11–22. [Google Scholar] [CrossRef]
- Wang, Z.; Chen, C.-H.; Zheng, P.; Li, X.; Khoo, L.P. A novel data-driven graph-based requirement elicitation framework in the smart product-service system context. Adv. Eng. Inform. 2019, 42, 100983. [Google Scholar] [CrossRef]
- Lowdermilk, T.; Rich, J. The Customer-Driven Playbook: Converting Customer Feedback into Successful Products; O’Reilly Media, Inc.: Sebastopol, CA, USA, 2017. [Google Scholar]
- Cai, W. Extension theory and its application. Chin. Sci. Bull. 1999, 44, 1538–1548. [Google Scholar] [CrossRef]
- Terninko, J. Step-by-Step QFD: Customer-Driven Product Design, 2nd ed.; Routledge: New York, NY, USA, 1997. [Google Scholar]
- Zheng, P.; Xun, X.; Sheng, Q.X. A weighted interval rough number based method to determine relative importance ratings of customer requirements in QFD product planning. J. Intell. Manuf. 2019, 30, 3–16. [Google Scholar]
- Suh, N.P. Axiomatic Design, Advances and Applications; Oxford university press: Oxford, UK, 2001. [Google Scholar]
- Tang, D.; Zhang, G.; Dai, S. Design as integration of axiomatic design and design structure matrix. Robot. Comput. Integr. Manuf. 2009, 25, 610–619. [Google Scholar] [CrossRef]
- Farid, A.M.; Luis, R. An axiomatic design of a multiagent reconfigurable mechatronic system architecture. IEEE Trans. Ind. Inform. 2015, 11, 1142–1155. [Google Scholar] [CrossRef]
- Eilouti, B. Scenario-based design: New applications in metamorphic architecture. Front. Archit. Res. 2018, 7, 530–543. [Google Scholar] [CrossRef]
- Carroll, J.M. Five reasons for scenario-based design. In Proceedings of the 32nd Hawaii International Conference on System Sciences, Maui, HI, USA, 5–8 January 1999. [Google Scholar]
- Suh, N.P. The Principles of Design; Oxford University Press on Demand: Oxford, UK, 1990. [Google Scholar]
- Otto, K.; Wood, K. Product Design: Techniques in Reverse Engineering and New Product Development; Prentice-Hall: Upper Saddle River, NJ, USA, 2001. [Google Scholar]
- Pahl, G.; Beitz, W. Engineering Design: A Systematic Approach, 2nd ed.; Springer: Berlin, Germany, 2007. [Google Scholar]
- Stone, R.B.; Wood, K.L.; Crawford, R.H. A heuristic method for identifying modules for product architectures. Des. Stud. 2000, 21, 5–31. [Google Scholar] [CrossRef]
- Ulrich, K.T. Product Design and Development, 2nd ed.; Tata McGraw-Hill Education: Boston, MA, USA, 2004. [Google Scholar]
- Liu, W.; Tan, R.; Cao, G.; Zhang, Z.; Huang, S.; Liu, L. A proposed radicality evaluation method for design ideas at conceptual design stage. Comput. Ind. Eng. 2019, 132, 141–152. [Google Scholar] [CrossRef]
- Bollobás, B. Modern Graph Theory; Springer: New York, NY, USA, 1998. [Google Scholar]
- Gao, X.; Xiao, B.; Tao, D.; Li, X. A survey of graph edit distance. Pattern Anal. Appl. 2010, 13, 113–129. [Google Scholar] [CrossRef]
- Neuhaus, M.; Horst, B. Automatic learning of cost functions for graph edit distance. Inf. Sci. 2007, 177, 239–247. [Google Scholar] [CrossRef]
- Čech, P. Matching UML class models using graph edit distance. Expert Syst. Appl. 2019, 130, 206–224. [Google Scholar] [CrossRef]
- Cortés, X.; Donatello, C.; Hubert, C. Learning edit cost estimation models for graph edit distance. Pattern Recognit. Lett. 2019, 125, 256–263. [Google Scholar] [CrossRef]
- Montani, S.; Leonardi, G.; Quaglini, S.; Cavallini, A.; Micieli, G. A knowledge-intensive approach to process similarity calculation. Expert Syst. Appl. 2015, 42, 4207–4215. [Google Scholar] [CrossRef]
- Zhang, S.; Zheng, X.; Hu, C. A survey of semantic similarity and its application to social network analysis. In Proceedings of the 2015 IEEE International Conference on Big Data, Santa Clara, CA, USA, 29 October–1 November 2015. [Google Scholar]
- Tian, J.; Zhao, W. Words Similarity Algorithm Based on Word Tree in Semantic Web Adaptive Learning System. J. Univ. Inf. Sci. Ed. 2010, 28, 602–608. [Google Scholar]
- Semantic Similarity Computing and Programming Based on Synonym Forest. Available online: http://download.csdn.net/download/huandaohack/4557989 (accessed on 5 December 2019).
- Zhang, H. Innovative Design-Systematic Innovation Based on TRIZ; Machinery Industry Press: Beijing, China, 2017. [Google Scholar]
- Wheelchair. Available online: http://wikipedia.moesalih.com/Wheelchair (accessed on 5 December 2019).


© 2020 by the authors. Licensee MDPI, Basel, Switzerland. This article is an open access article distributed under the terms and conditions of the Creative Commons Attribution (CC BY) license (http://creativecommons.org/licenses/by/4.0/).