1. Introduction
The textile sector generates substantial waste streams, including cotton-rich cutting residues, spinning waste, contaminated fibers, mixed textile waste, and wastewater treatment sludge. More than 92 million tons of textile waste are generated globally each year, while low-value disposal routes contribute to environmental impacts [
1]. In Pakistan, a recent survey-based study estimated annual textile waste generation at approximately 270,125 metric tons, including about 19,305 tons from Karachi [
2], highlighting the need for improved waste-management and valorization strategies. Textile wastewater presents an additional burden because dyeing effluents may contain heavy metals, pigments, and chlorinated organic compounds that adversely affect aquatic environments [
3]. Although circular-economy research in textiles has expanded, practical and technically validated valorization pathways for difficult industrial residues, particularly sludge and mixed processing wastes, remain limited [
4].
Textile manufacturing generates two distinct waste streams, textile cotton waste (TCW) and textile wastewater sludge (TWS), arising from different production stages and requiring different management approaches. In a recent study, TCW, which is generated during cotton processing, spinning, fabric production, cutting, and finishing and mainly consists of short fibers, lint, yarn waste, fabric off-cuts, and fibrous dust, was converted into a high-fixed-carbon solid material [
5]. In contrast, TWS is produced during physicochemical and biological treatment of textile effluents, concentrating suspended solids, dyes, salts, organic matter, metals, and treatment chemicals into dewatered sludge. Its variable, process-specific composition and typically high moisture, ash, salts, dye residues, and metal content can hinder direct combustion and complicate safe disposal [
6]. Given these management challenges, the complementary characteristics of TCW and TWS provide a basis for their combined valorization. At the collection point, TCW and TWS contain approximately 10% and 85% moisture, respectively, highlighting the need for sludge pretreatment before combined valorization through drying, milling, pelletization, and thermal upgrading [
7]. Unlike domestic wastewater sludge, the process-specific composition of TWS can result in low calorific value and a high ash content; however, blending with biomass or other organic wastes may improve fuel quality, combustion performance, and handling characteristics [
8].
Thermal treatment can reduce sludge volume and recover energy, with performance influenced by blend chemistry, ash content, and combustion conditions. Thermal analysis of dyeing sludge–textile waste blends identified three co-combustion stages, confirming that textile waste alters sludge conversion pathways [
9]. The study of textile dyeing sludge and waste biochar showed clear co-combustion synergy between 530 °C and 700 °C, demonstrating that during co-combustion, the total SO
2 emission can be reduced greatly, while the total NO emission can be increased. The reduction in SO
2 emissions is likely associated with sulfur retention in the ash through reactions with alkaline and alkaline-earth minerals, whereas the increase in NO emissions may result from enhanced conversion of fuel-bound nitrogen under improved combustion conditions and higher temperatures. This indicates that sulfur and nitrogen emissions can move in opposite directions when combustion performance is improved [
10]. The same principle applies to the research on the production of sewage sludge briquettes, as sludge is required to be mixed with a lignocellulosic material, and combustion properties, pollutant emissions, and residue safety need to be assessed to determine the fuel quality [
11]. The present study applies this integrated concept to TCW and TWS generated within the same industrial context, enabling a localized waste-to-energy pathway.
The main environmental issue of any sludge-derived solid fuel is emission behavior. Textile wastewater sludge can contain sulfur, nitrogen, chlorine, metals, and inorganic salts resulting from dyeing and finishing processes and wastewater treatment, which can lead to increased SO
2, NO
x, CO, and ash-related risks during combustion. Trace H
2S may also occur under localized oxygen-deficient or incomplete combustion conditions, despite the overall presence of oxygen. The heteroatoms in textile dyeing sludge, particularly N, S, and Cl, are a major technical challenge for sludge energy recovery, according to recent chemical-looping combustion research on this type of sludge [
12]. Studies of sulfur migration further show that waste-textile addition can alter, rather than merely dilute, sulfur conversion pathways and associated H
2S and SO
2 formation [
13]. Similarly, direct measurements from landfill-gas cogeneration have shown that actual emissions of CO
2, CO, NO
x, SO
2, and particulate matter may differ from inventory-reported values, highlighting the importance of direct emission monitoring in waste-derived energy systems [
14].
Ash quality is equally important because combustion transfers part of the inorganic risk to the solid residue. Textile wastewater sludge may contain trace metals such as Cr, Cu, Ni, Zn, As, Hg, Cd, and Pb, which can concentrate in fly and bottom ash during thermal treatment [
15]. Incorporating sewage sludge by-products into thermal treatment products has been seen to stabilize heavy metals, and a recent environmental comparison of sewage sludge pyrolysis and incineration showed that thermal treatment by-products can be mobility and environmentally burdened if the by-product is ignored [
16]. XRF and AAS have been used in bottom ash studies and have proven to be practical tools for correlating ash chemistry with environmental safety [
17]. Therefore, TCW–TWS pellets should be evaluated not only for combustion performance but also for ash composition, heavy-metal risks, and safe disposal or reuse.
Environmental performance alone is insufficient to establish practical feasibility; LCA and TEA are needed to assess carbon intensity, production cost, energy value, and scale-up potential [
18]. Wastewater-sludge valorization can recover biofuels and other products but may involve operational, economic, and environmental trade-offs [
19]. Energy recovery from sludge can also reduce landfill dependence and support circular-economy objectives, particularly when fuel upgrading is applied [
20]. Integrated LCA–TEA approaches have similarly been used to assess the environmental and economic viability of sludge co-conversion with other biomass feedstocks [
21]. Therefore, TCW–TWS pellet studies should evaluate combustion performance alongside energy cost, carbon intensity, production cost, coal-substitution potential, annual savings, and payback period. In this context, economic feasibility can be assessed through alternative production scenarios, particularly binder-based and binder-free pathways, because binder addition may improve pellet integrity while increasing production costs, whereas binder-free formulations may offer cost advantages by eliminating external binder requirements.
Previous studies have largely addressed textile waste, sludge treatment, pelletization, combustion, ash safety, LCA, and economics separately. Despite growing interest in textile circularity, evidence remains limited for integrated recovery pathways that evaluate whole-system performance beyond general claims of circularity [
22] From a clean-technology perspective, converting TCW and TWS into solid biofuel pellets supports waste minimization, resource recovery, fossil-fuel substitution, and reduced environmental impacts in industrial applications.
The goal of this study is to evaluate the environmental and economic feasibility of converting TCW and TWS into solid biofuel pellets. The scientific novelty lies in the co-pelletization of these two distinct industrial textile waste streams and their integrated environmental and economic assessment, which has not been comprehensively addressed in previous studies. The assessment combines controlled combustion testing, oxygen-normalized and mass-based emission analysis, ash and heavy-metal characterization, cradle-to-gate carbon intensity, and equal-energy economic comparison with imported bituminous coal. This integrated approach assesses combined TCW–TWS biofuel pellets within a single industrial waste-to-energy pathway and identifies a practical TWS blending range of 20–40% based on emission performance, ash-related risks, carbon reduction, and economic feasibility.
2. Materials and Methods
2.1. Study Design and Methodological Framework
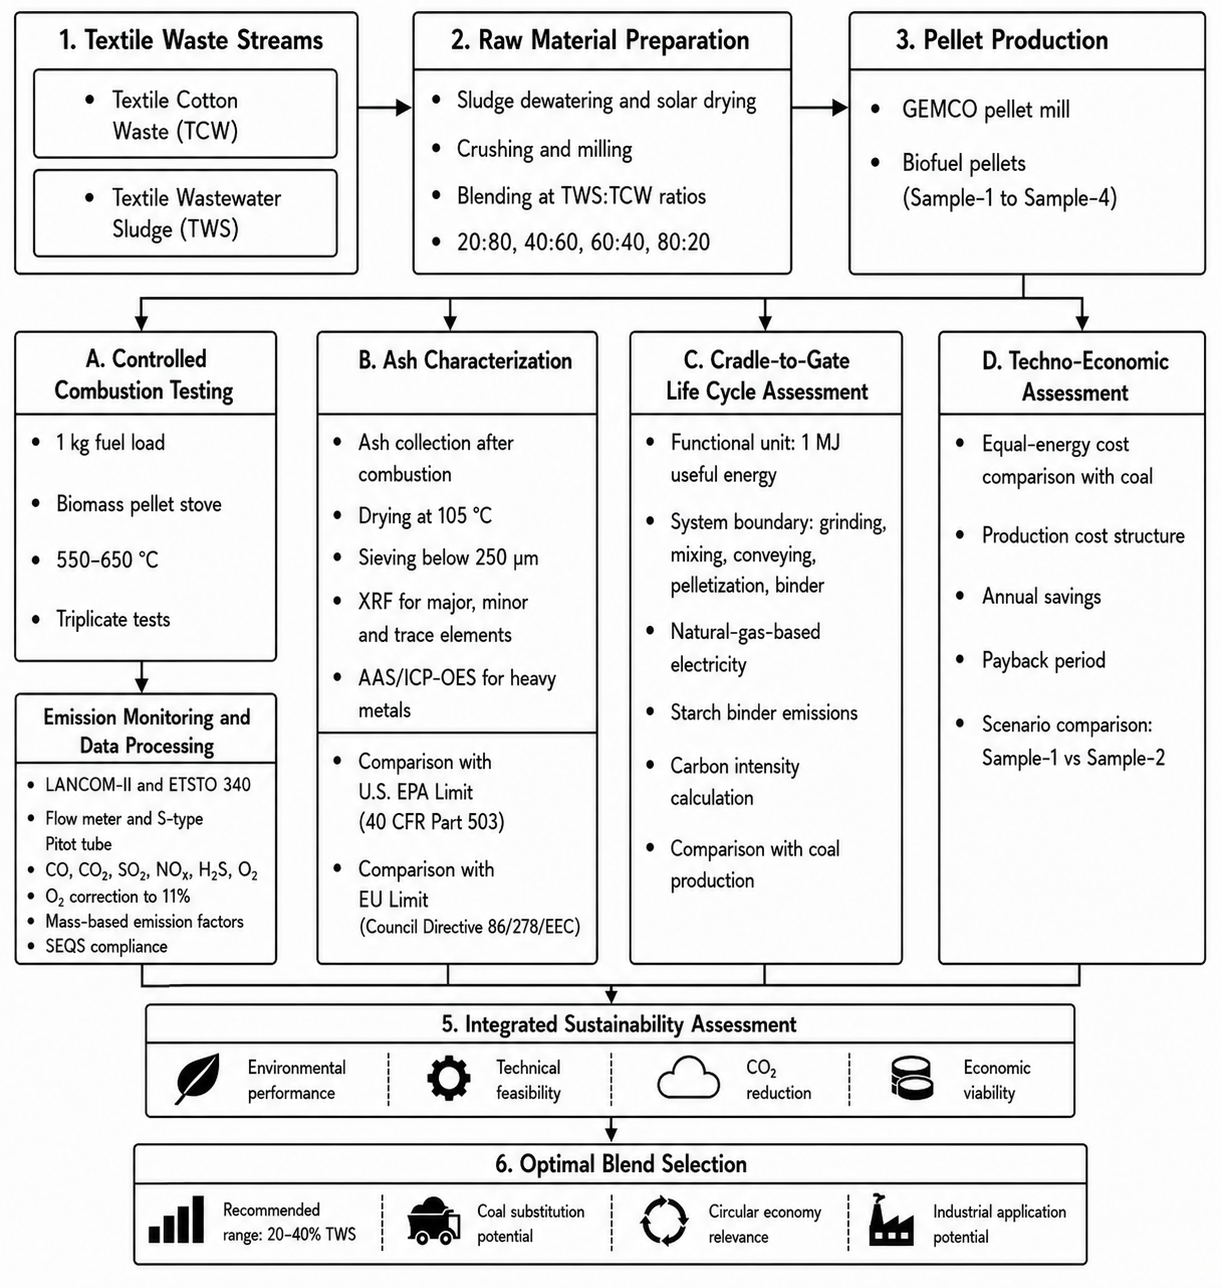
An integrated framework was used to evaluate biofuel pellets derived from textile cotton waste (TCW) and textile wastewater sludge (TWS), as illustrated in
Figure 1. First, TCW and TWS were collected, pretreated, blended at selected ratios, and pelletized. The pellets were then characterized for fuel properties and combusted under controlled conditions. Flue-gas emissions were evaluated using oxygen-normalized concentrations and mass-based emission factors, while ash was characterized for elemental composition and heavy-metal-related risks. A cradle-to-gate carbon assessment quantified pellet production emissions, and a techno-economic analysis estimated production costs, coal-substitution savings, and payback. Finally, the environmental performance, energy characteristics, and economic feasibility of the selected pellet formulation were compared with imported bituminous coal on an equal-energy basis. The calculation equations were based on mass and energy balances, unit conversions, and engineering economic principles. The required experimental data were obtained from the present study, whereas external parameters, such as emission factors and specific equations, were adopted from the cited references, where applicable.
2.2. Raw Material Collection and Preparation
The waste materials, TCW and TWS, were collected from AL-RAHIM TEXTILE INDUSTRIES, Nooriabad, Sindh, Pakistan. TCW originated from textile cutting and weaving operations, whereas TWS was recovered from the centrifuge output of the on-site effluent treatment plant treating textile process wastewater. At collection, TCW and TWS contained approximately 10% and 85% moisture, respectively. TWS was sun-dried in thin layers for approximately 6 days to about 10% moisture. Before pelletization, dried TWS was gently granulated and TCW was pre-shredded, followed by sequential screening through 5 and 3 mm meshes to obtain a particle size of ≤3 mm. The prepared feedstocks were stored in airtight containers under low-humidity conditions to minimize moisture reabsorption and variation.
The materials were blended on a mass basis at TWS ratios of 20:80, 40:60, 60:40, and 80:20, designated as Sample-1 to Sample-4, respectively, as summarized in
Table 1. The blends were pelletized using a flat-die pellet mill to produce 8 mm diameter pellets and stored under dry conditions before combustion testing. Sample-1 contained 5 wt.% corn starch as a biodegradable binder to improve interparticle adhesion, pellet compactness, and handling durability. No external binder was required for the other formulations because their higher TWS contents provided sufficient binding during pelletization.
Sample-1 was selected for the life-cycle assessment as the most favorable environmental case within the tested matrix, as it had the lowest TWS fraction and showed the lowest combustion emission factors under the tested stove conditions. This should not be interpreted as a universally optimal composition, because the preferred blend may vary with sludge characteristics, local emission limits, fuel prices, and available abatement technologies. Sample-2 was retained as a binder-free scale-up economic scenario because the 40:60 TWS blend exhibited sufficient natural binding. Thus, Sample-1 represented the low-emission binder-based pathway, whereas Sample-2 represented the lower-cost binder-free pathway.
2.3. Combustion Experimental Setup and Operating Protocol
Combustion experiments were conducted using a biomass pellet stove under controlled laboratory conditions. The combustion system consisted of a primary combustion chamber, a forced-draft air supply system, an exhaust outlet, and a vertically mounted stack for flue-gas sampling. Each experimental trial used a fixed fuel load of 1.0 kg of pellets. The burn cycle was divided into ignition, steady-state combustion, and burnout phases. Emission measurements were recorded during the steady-state combustion phase to reduce the influence of unstable ignition and late-stage burnout conditions. The combustion chamber temperature during operation was maintained within approximately 550–650 °C. In this study, the term fixed air supply condition refers to maintaining the same forced-draft fan setting and primary air inlet position for all pellet formulations. Before the experimental runs, the air control setting was adjusted to achieve stable combustion and was then kept unchanged throughout all tests. No further adjustment of fan speed or air inlet opening was made during the steady-state emission-measurement period. The measured flue-gas O
2 concentration ranged from approximately 8 to 11%, reflecting differences in combustion behavior among pellet formulations under the same air control setting. Stack-gas velocity was measured separately for each formulation and used to calculate normalized velocity and dry flue-gas volume, as reported in
Table 2. All blends were tested in triplicate to improve repeatability and to reduce random experimental variation.
2.4. Stack Configuration, Flow Measurement and Dry Flue-Gas Volume Calculation
A vertically mounted stainless-steel stack was used for emission testing in order to minimize turbulence and sampling error. The sampling arrangement followed the general guidance of ISO 19867-1:2018 [
23] for emission measurement from solid fuel combustion systems. The stack was 52 mm in inner diameter (which is equal to 0.052 m), and 2 m was the height from the stove outlet. The stack configuration was such as to provide a straight stack length of at least 8D (upstream) and 2D (downstream) from the sampling location (where D is the stack diameter). The sampling points were set to two flanged sampling points 90° apart for representative sampling. During testing, the stack-gas temperature was approximately 210 °C (483 K). Gas velocity was measured using a certified electronic flow meter together with an S-type Pitot tube and normalized to standard temperature conditions. The dry flue-gas volume per kilogram of fuel was determined by Equation (1) [
24,
25]:
where V
dry is the dry flue-gas volume per kilogram of fuel (Nm
3/kg), t is the combustion time (s) and m
f is the burnt fuel mass (kg). A fuel mass of 1.0 kg was used for each test. Detailed stack-area, velocity normalization, and volumetric flow calculations are provided in
Supplementary Section S1.
2.5. Emission Monitoring, Calibration and Quality Assurance
In order to enhance accuracy and to provide a cross-check, two certified analyzers were employed for monitoring flue-gas emissions. Combustion gases were measured by using a LANCOM-II Digital Flue Gas Analyzer (Make: LANCOM; Model: LANCOM-II; Serial No.: 298997). The analyzer covered the following measurement ranges: CO 0–2000 ppm, CO
2 0–25% vol, SO
2 0–2000 ppm, NO 0–1000 ppm, NO
2 0–100 ppm, H
2S 0–200 ppm, and O
2 0–25% vol. Emissions were also monitored and cross-checked using a portable flue-gas analyzer of the type TESTO 340 (Serial No.: 60968702). Before testing, all the emission monitoring instruments were calibrated by the ISO Accreditation Laboratory, namely Alpha Calibration Pvt. Ltd. Calibration was done under controlled laboratory conditions at a temperature of 23 ± 2 °C and a relative humidity of 50 ± 10%. Calibration gases used included BRISTOL Certified, ISO 17025/NIST [
26] traceable gases. High-purity nitrogen/synthetic air was used for zero calibration of both analyzers prior to each test session. A Certified Electronic Flow Meter from TSI Trust Science Innovation USA (NIDT-Air Products) was used to measure the velocity and volumetric flow rate of the stack gas. Calibration data showed accurate performance of about ±0.1–0.2 L/min over the flow range tested from 1 to 10 L/min. Using the calibrated flow meter and S-type Pitot tube together, the stack-gas velocity was determined, and subsequently dry flue-gas volume and mass-based emission factors were calculated.
2.6. Oxygen Normalization and Emission Factor Calculation
CO
2, CO, SO
2, NO, NO
2, H
2S, and O
2 were monitored. NO
x was determined from NO and NO
2 and reported as NO
2 equivalent. To account for oxygen dilution and excess air, measured dry-gas concentrations were normalized to 11% O
2 using Equation (2) [
24]:
where
C11%O2 is the concentration at an 11% oxygen condition,
Cmeasured is the measured dry gas concentration and O
2 is the measured oxygen concentration in the flue gas. The number 21 is the concentration of oxygen in the air. After ppm-to-mass conversion, mass-based emission factors were calculated using Equation (3) [
23,
24]:
where
Cm is the mass concentration (mg/Nm
3) and
Vdry is the dry flue-gas volume (Nm
3/kg fuel). The CO
2 emission factor was calculated from the CO
2 mass concentration and dry flue-gas volume. Detailed NO
x aggregation, ppm-to-mass conversion, and intermediate emission-factor calculations are provided in
Supplementary Section S2.
2.7. Ash Sampling, Elemental Characterization and Heavy-Metal Risk Assessment
The ash from the TCW–TWS pellets was gathered after each burn cycle from complete combustion. All ash samples were left to cool to room temperature in a laboratory under contamination-free conditions. Cooled ash was oven dried at 105 °C to remove moisture, homogenized and sieved to less than 250 µm for analysis.
X-ray Fluorescence Spectroscopy (XRF) was used to determine the elemental composition of the ash using an Energy Dispersive X-ray Fluorescence (EDXRF) spectrometer (EDX-8100). Major and trace elements analyzed by XRF were Fe, Ca, Si, P, S, Mn, Sr, Cr, Zn, Cu, Ni, Ba, Rb and Zr. To ensure good homogeneity and analytical consistency, finely ground ash samples were pelletized using hydraulic pressure before being measured by EDXRF. According to the manufacturer’s guideline for a light-element matrix, the approximate lower detection limits of the EDX-8100 for the relevant elements evaluated in this study were 1 ppm for Fe, Ca, Mn, and Ba and 0.1 ppm for Sr, Br, Rb, and Zr. These values represent manufacturer-specified guideline detection limits. Heavy metals were acid-digested and quantified by Atomic Absorption Spectrometry (AAS) and/or Inductively Coupled Plasma Optical Emission Spectrometry (ICP-OES) due to their environmental significance. About 0.5 g of the ash was digested using concentrated nitric acid (HNO
3) and hydrochloric acid (HCl) under controlled heating. The digested solution was filtered, diluted with deionized water to a known volume and analyzed for Hg, As, Cd, Pb, Cr, Cu, Ni and Zn using calibrated multi-element standards. Elemental and heavy-metal analyses were conducted as single determinations for each representative sample. Measured concentrations of heavy metals were compared with regulatory limits for land application of biosolids set by the U.S. EPA [
27] to ensure environmental compliance and assess ash safety. The routine gravimetric ash-content equation is provided in
Supplementary Section S3.
2.8. Cradle-to-Gate Life-Cycle Assessment Framework
A screening-level cradle-to-gate carbon assessment was performed for the practically favorable formulation under the tested conditions (Sample-1) to estimate the upstream greenhouse gas (GHG) emissions associated with pellet production. The assessment followed the general principles and framework of ISO 14040 and ISO 14044 [
27,
28]; however, it should not be interpreted as a full ISO-compliant cradle-to-grave life-cycle assessment. Instead, it provides an indicative environmental screening of the pellet production stage. The functional unit was defined as 1 MJ of useful energy to enable comparison between the developed biofuel pellets and conventional coal on an equivalent energy basis. The environmental impact assessment focused on Global Warming Potential (GWP), expressed as kg CO
2 equivalent.
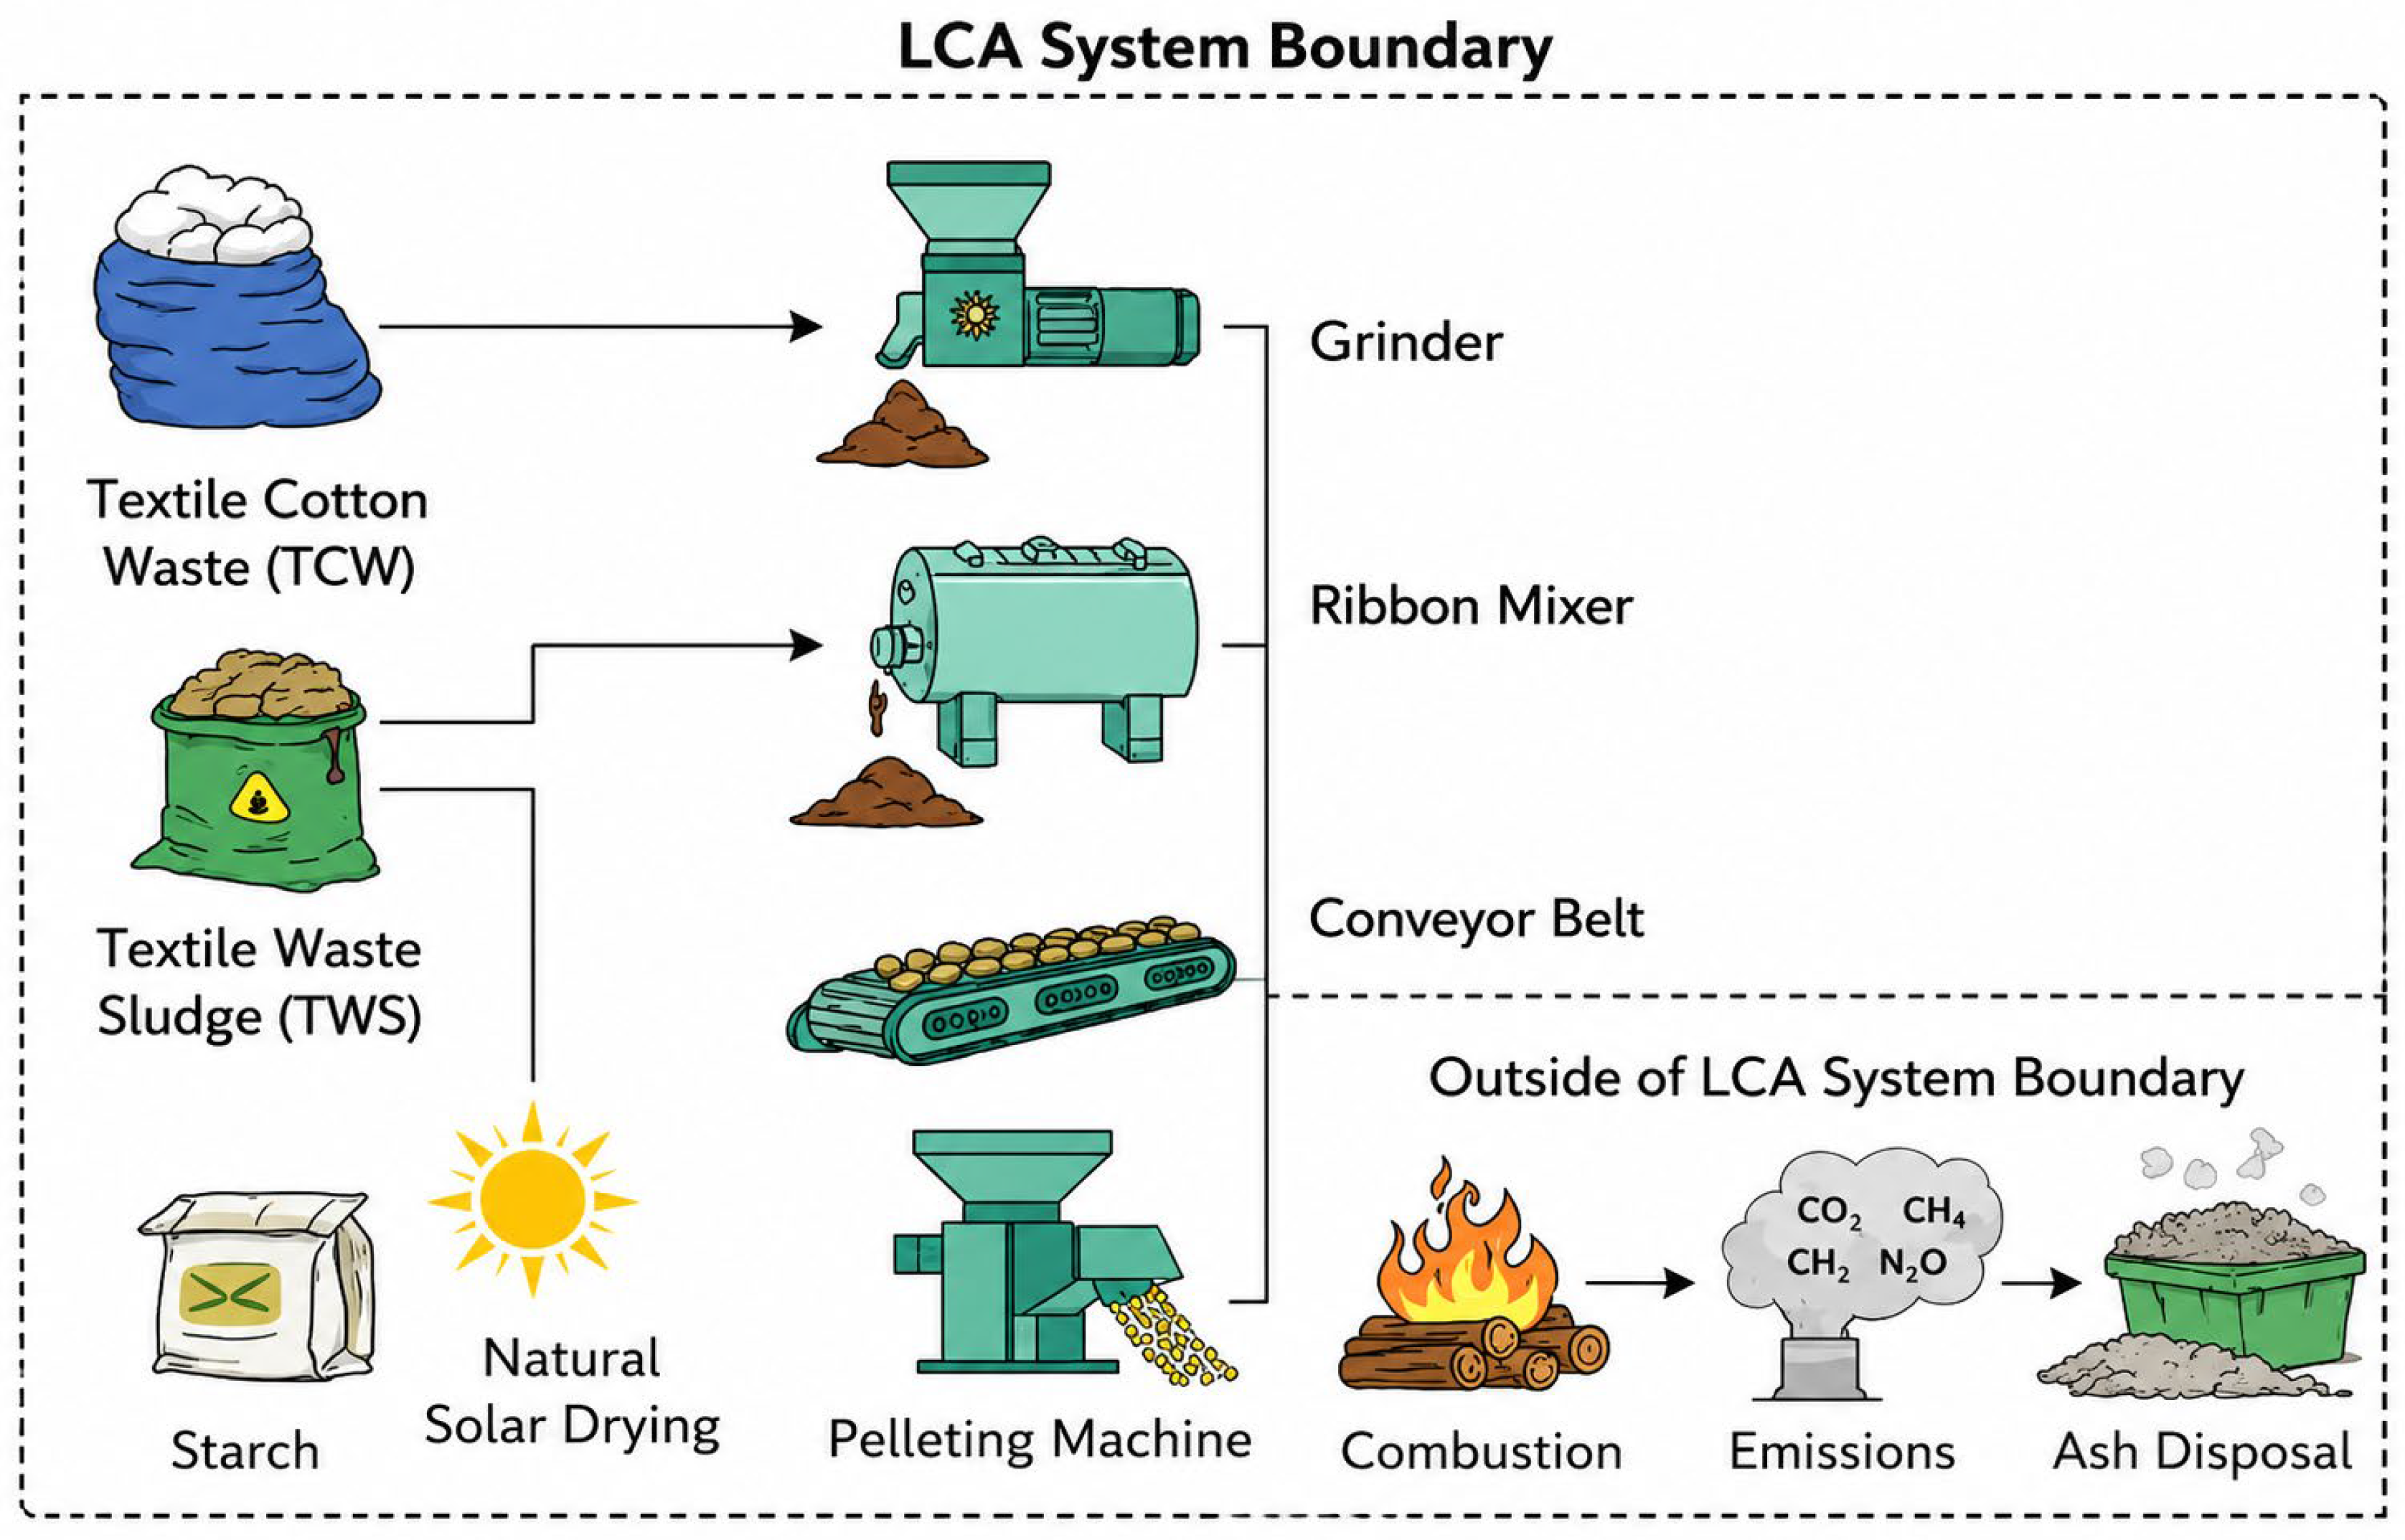
The system boundary, illustrated in
Figure 2, included grinding, natural solar drying of textile wastewater sludge, mixing, conveying, pelletization, and starch binder production. Combustion-phase emissions and ash disposal were placed outside the cradle-to-gate system boundary because combustion emissions were experimentally quantified and discussed separately in this study, while the objective of the present assessment was limited to upstream GHG emissions associated with pellet production.
Textile cotton waste (TCW) and textile wastewater sludge (TWS) were treated as industrial by-products using a cut-off allocation approach. TCW is generated as an unavoidable by-product during weaving and towel shearing operations, whereas TWS is continuously produced during the routine operation of a textile wastewater treatment plant as sludge cake requiring disposal. Both materials are generated as part of normal textile manufacturing and wastewater treatment operations regardless of whether pellet production is undertaken. Therefore, no upstream environmental burdens associated with their original generation were assigned to the pellet system. Only the additional processing required to convert these by-products into biofuel pellets was included in the assessment. Transportation emissions were considered negligible because the feedstocks were generated, processed, and utilized within the same industrial facility.
Accordingly, comparisons with coal presented in this study should be interpreted as indicative screening-level results within the defined cradle-to-gate boundary rather than definitive cradle-to-gate environmental comparisons.
The overall global warming potential (GWP) was calculated using Equation (4) [
28,
29]:
Electricity for pellet production was supplied by a natural-gas generator with a measured gas-consumption rate of 0.28 m
3/kWh. The natural-gas emission factor used was 0.05444 kg CO
2 per standard cubic foot (SCF) from the Environmental Protection Agency of the United States [
27]. Sample-1 contained 5 wt.% starch; a starch production emission factor of 1.1 kg CO
2e/kg starch was adopted from the BAFA dataset in Climatiq [
30]. The total cradle-to-gate carbon footprint per kilogram of pellet was calculated using Equation (5) [
28,
29]:
The cradle-to-gate carbon intensity per unit energy was calculated using Equation (6) [
29]:
For indicative comparison, an upstream coal-production intensity of 16.22 g CO
2/MJ was adopted from Yang, Dou et al. [
31]. Comparisons with coal should therefore be interpreted as screening-level results within the defined cradle-to-gate boundary. The percentage reduction relative to coal was determined by the use of Equation (7) [
29]:
Calculations for specific energy consumption (SEC), natural-gas consumption, emission-factor conversion, binder emission, and energy-unit conversion are provided in
Supplementary Section S4.
2.9. Techno-Economic Assessment and Equal-Energy Cost Analysis
The techno-economic assessment was done to compare TCW–TWS biofuel pellets and imported bituminous coal on an equal-energy basis. The reference fuel used was China imported bituminous coal. The coal price was USD 116/ MT (or USD 0.116/kg), and the gross calorific value of the coal was 5768 kcal/kg. The moisture and ash content of the reference coal was 7.8% and 16.4%, respectively. The gross calorific value of the binder-based Sample-1 pellet was 3377 kcal/kg, and the gross calorific value of the binder-free Sample-2 scenario was 2968 kcal/kg.
Following established techno-economic assessment approaches for bioenergy and waste-derived fuel systems [
18,
21], the comparison was conducted using energy-equivalent fuel quantities, unit fuel costs, cost savings, and simple payback indicators. The energy-equivalent biofuel cost was calculated as
The percentage saving relative to coal was calculated as
Saving per kilogram of coal replaced was calculated as [
18,
21]
The simple payback period was determined as [
18]
Two economic scenarios were analyzed. The formulation with 20:80 TWS:TCW (Sample-1) was binder-based, and the formulation with 40:60 TWS:TCW (Sample-2) was binder-free. The same equal-energy approach was used for both scenarios and coal with the aim of making an economic comparison based on energy delivered not just on coal mass. Detailed energy-ratio derivations, equivalent pellet-mass calculations, cost-per-million-kcal calculations, and daily/monthly/annual saving conversions are provided in
Supplementary Section S5.
2.10. Pellet Production Cost Estimation
Pellet production cost included energy, labor, binder, depreciation and maintenance, and TCW raw-material costs, minus the avoided sludge-disposal credit. Total capital investment was USD 9392 for a production capacity of 200 kg/h. Two operators were required, each with a monthly salary of USD 178.89. A 26-working-day month was assumed. For Sample-1, starch was used at 5 wt.% at USD 0.358/kg. Equipment life was assumed to be 5 years, corresponding to 20% annual depreciation, while the annual maintenance cost was USD 537 based on the recommended parts-replacement schedule. TCW represented 80% of Sample-1 feedstock at USD 0.018/kg. The avoided TWS disposal cost was USD 0.054/kg, based on the actual industrial rate paid for the disposal of textile wastewater sludge at a landfill site during the study period.
The final net production cost was calculated as [
18,
21]
The same cost framework was applied to Sample-1 and the binder-free Sample-2 scenario. Detailed component equations for electricity cost, monthly and annual production, binder cost, depreciation, fixed cost, TCW cost, and sludge-disposal credit are provided in
Supplementary Section S6.
All combustion data was presented on a dry basis and reduced to 273 K and 1 atm. Emission concentrations measured were first converted to 11% O2, then to mass concentrations, and finally to mass-based emission factors per kg of fuel. NOx was reported on a NO2 equivalent basis. Elements of ash and heavy metals were measured in mg/kg or ppm and compared to U.S. EPA regulations. To facilitate equitable comparisons between pellets and coal, results from both the life cycle and economic perspectives were normalized to 1 MJ of useful energy, whereas the results from the economic perspective were also expressed on an equal-energy basis.
4. Discussion
The combustion results show that TCW–TWS pellets are a viable solid fuel, and the textile wastewater sludge content definitely influenced the combustion behavior. The combustion time was found to be shortest in Sample-1 with 20% TWS and 80% TCW (26 min) and highest in Sample-4 with 80% TWS (44 min), and the dry flue-gas volume was found to be maximum in Sample-4 with 80% TWS (21.96 Nm
3 kg
−1) and minimum in Sample-1 (14.74 Nm
3 kg
−1). This trend indicates that the pellets with the presence of sludge burned slower and produced more flue gas, which is attributed to the higher ash, mineral and inorganic content in TWS. This result is consistent with Ansari et al. [
7], who found that the quality of TCW–TWS pellets is significantly influenced by the feedstock conditioning, blending, pellet size and torrefaction conditions. Gadhi et al. [
6] also found that textile sludge can be processed to make fuel pellets, and the combustible value is better when mixed with another fuel with higher combustible value. It was found that the textile waste causes the dyeing-sludge combustion to undergo light volatile, heavy volatile, and char-burning stages, and it favors a longer combustion time observed for the sludge-rich samples [
9]. In addition, a thermal conversion study conducted by Tujjohra et al. [
5] demonstrated that cotton-rich textile waste exhibits a high thermal conversion potential, further emphasizing the stability of the TCW-rich blends. The 20-40% TWS range seems to be more appropriate for stable combustion, whereas the 60-80% TWS range extends combustion duration and gas production.
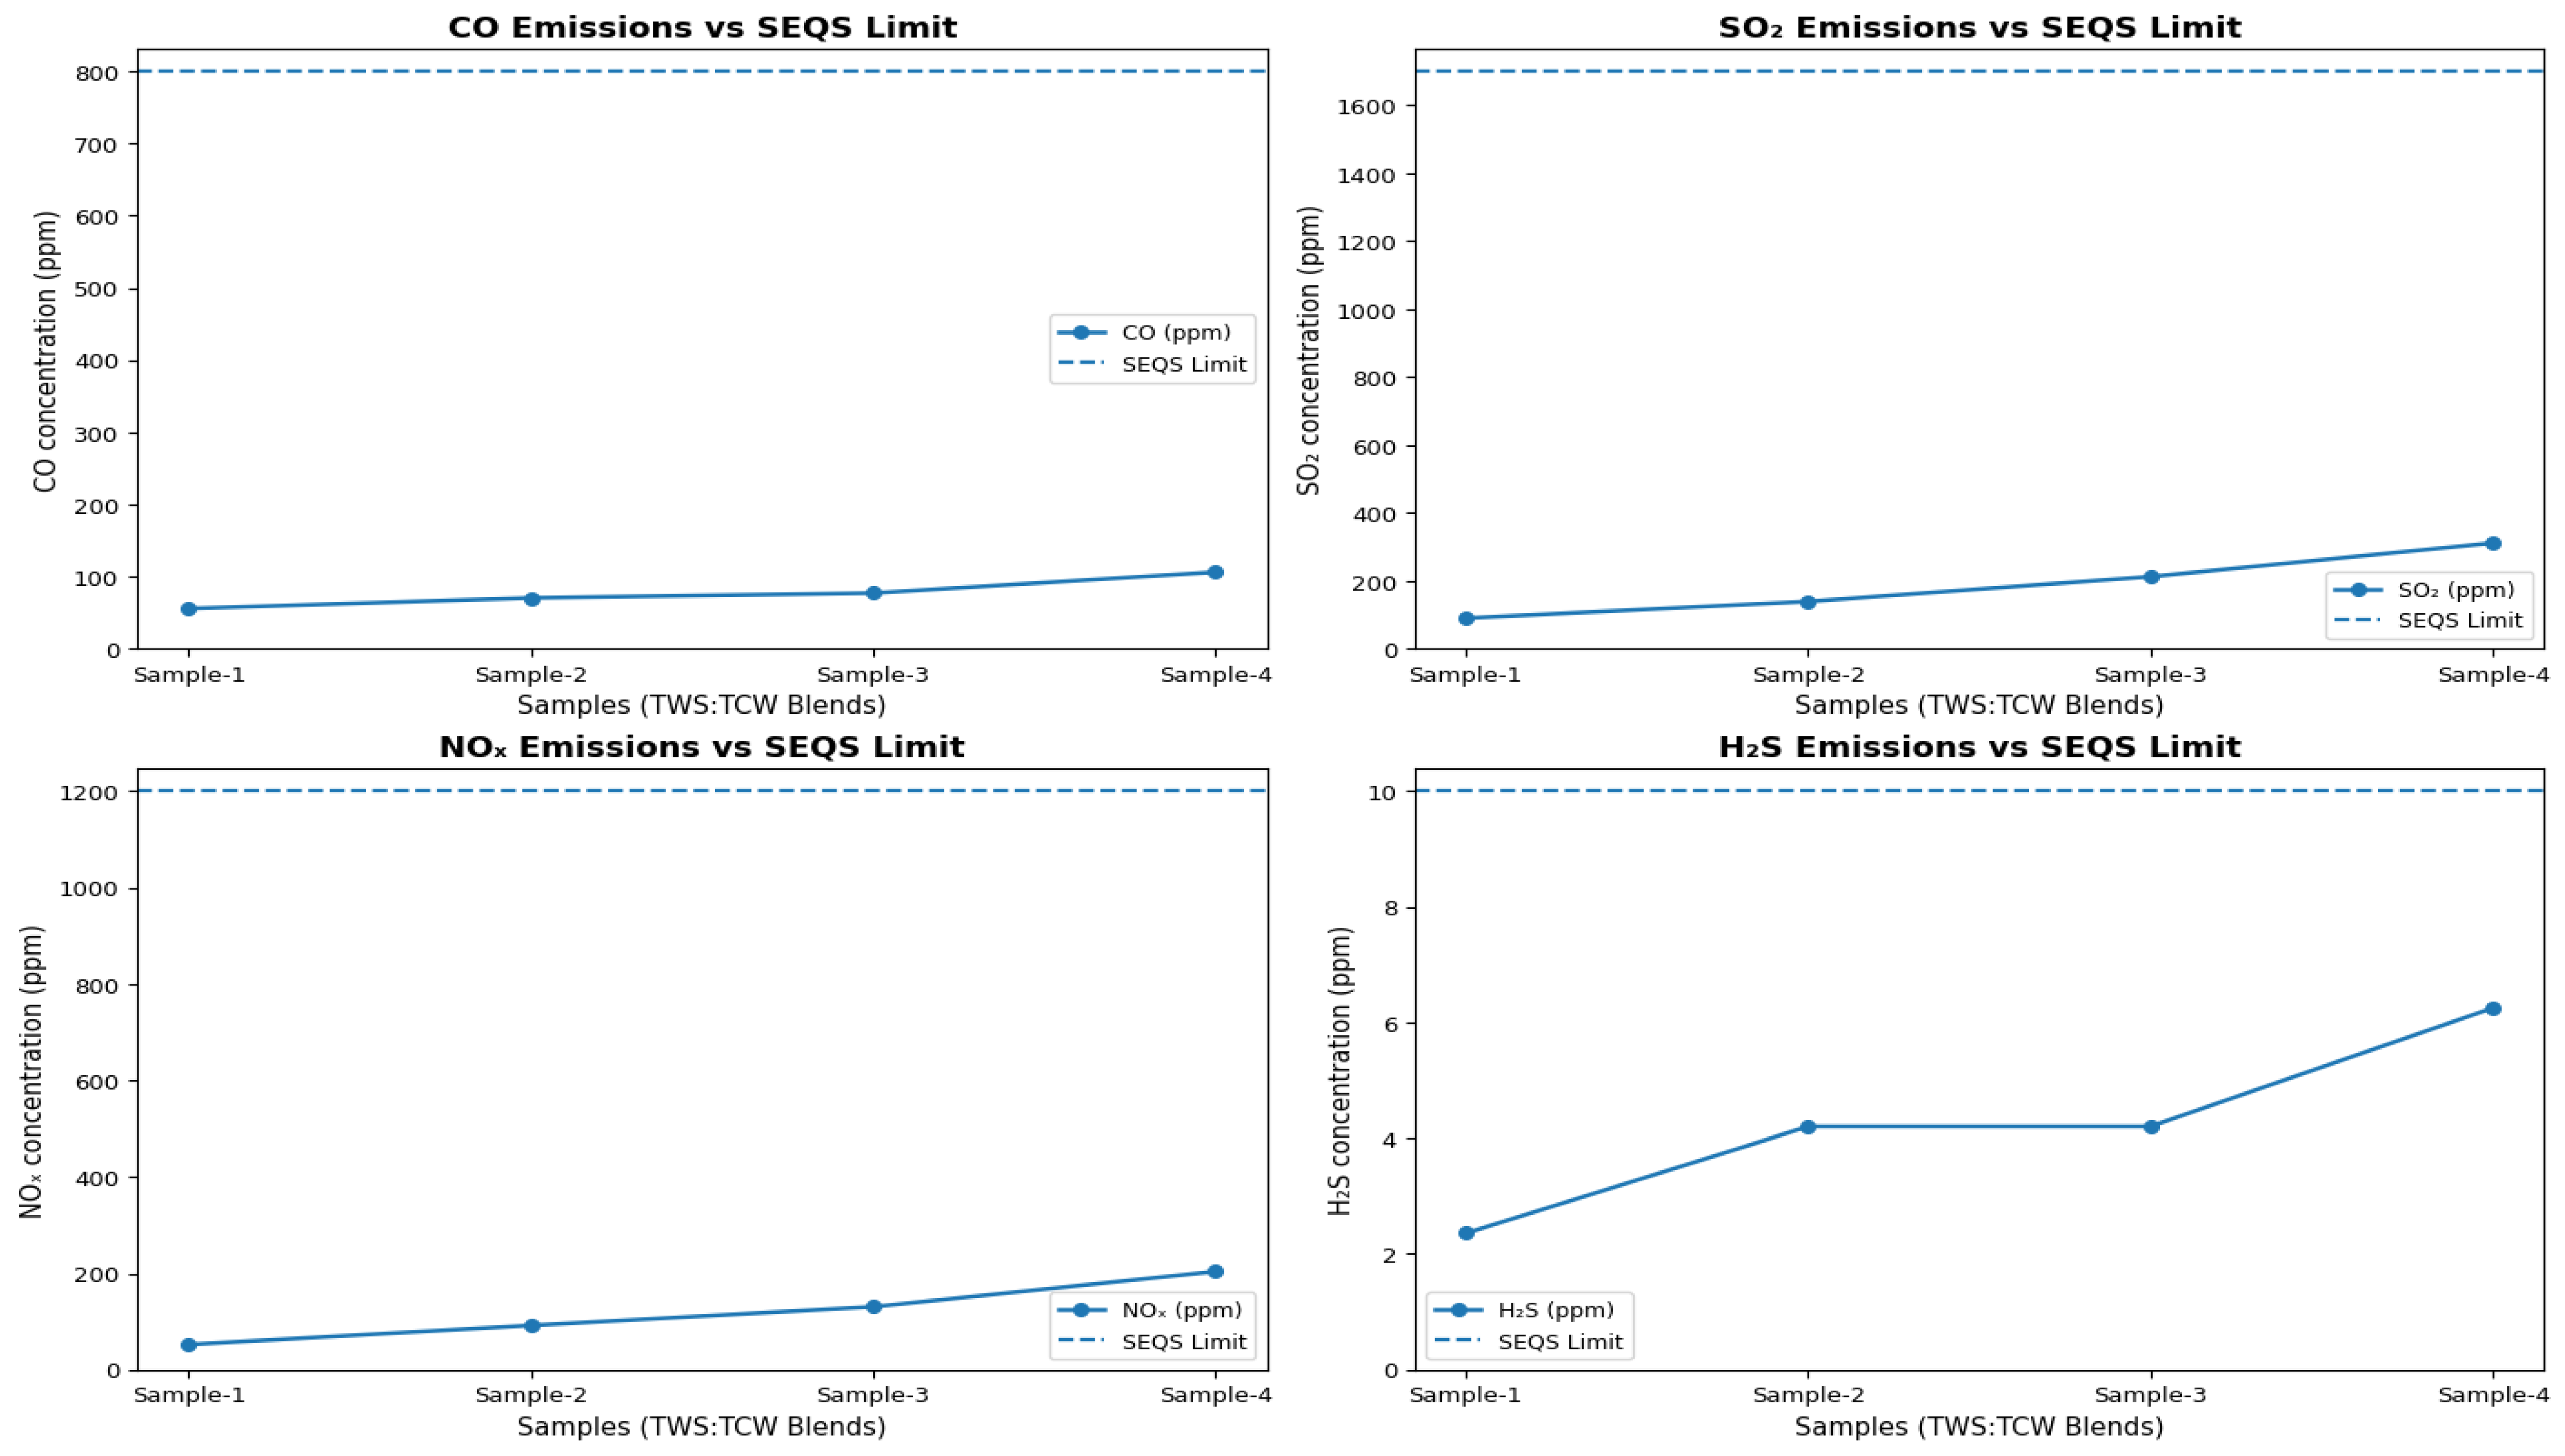
The emission profile indicates that with an increase in sludge content, the emissions of most pollutants, particularly SO
2 and NO
x, have increased. CO concentration rose from 1.03 g kg
−1 in Sample-1 to 2.92 g kg
−1 in Sample-4, indicating that combustion was less complete at higher levels of TWS. The sulfur- and nitrogen-bearing compounds in TWS were found to be the key contributors to the formation of acid gases and NO
x as the concentrations of SO
2 and NO
x increased significantly from 3.81 g kg
−1 to 19.56 g kg
−1 and 1.57 g kg
−1 to 9.18 g kg
−1, respectively. However, the concentration of H
2S was still significantly lower than that of SO
2, increasing from 52.9 mg kg
−1 to 208.7 mg kg
−1, indicating that the combustion environment was largely oxidizing. The researchers Jiang et al. [
12] pointed out that nitrogen, sulfur, and chlorine pollutants are significant issues during the combustion of textile dyeing sludge. Huang et al. [
10] also found that there is a co-combustion synergy between the textile dyeing sludge and waste biochar, but S and N emissions do not always go down together. Khan et al. [
32] also observed that textile sludge has bioenergy potential; however, before industrial application, the behavior of pollutants and residues must be assessed to evaluate the potential for thermal conversion. All oxygen-normalized emissions in the present results were below SEQS limits, but Sample-1 and Sample-2 were more environmentally balanced by complying with lower SO
2 and NO
x formation.
The ash findings add to the environmental acceptability of the pellets, as no hazardous enrichment was seen in the tested pellet ash. The XRF analysis revealed that ash was rich in Fe, Ca and Si. The concentration of Fe increased with the sample from 32,400 mg kg
−1 in Sample-1A to 67,300 mg kg
−1 in Sample-4A, and the concentration of Si increased from 4900 mg kg
−1 to 17,000 mg kg
−1, indicating that the sludge was a major source of the mineral-rich fraction of ash. Ca was also detected in all the pellet ash samples, where the concentration was found to be between 13,300 and 25,200 mg kg
−1, indicating that TCW contributed to the alkaline ash fraction. Heavy-metal results were more significant for safety: Cr, Cu, Ni, Zn, Hg, As, Cd and Pb were all below U.S. EPA and EU limits values; Cd and Pb were not detected in pellet ash; and Hg was detected in raw sludge at 0.047 mg kg
−1 but not in final pellet ash. The safe heavy-metal profile in the present study is a strong finding, as the sludge co-combustion ash may be ecologically hazardous if heavy metals concentrate in the residue, as indicated by Yu et al. [
15]. Lee et al. [
16] also emphasized the need to consider end-of-life effects of by-products in thermal sludge studies. Debrah and Dinis [
17] demonstrated the need for ash characterization, as it can lead to a secondary risk if it is not disposed of properly. Liu et al. [
33] also found that pollutant emissions and the migration of metals can be affected by sludge co-combustion. The conclusion of these studies is that TCW–TWS pellet ash is not hazardous within the limits tested but should be agronomically validated for land application.
The cradle-to-gate assessment indicates a lower upstream carbon intensity for Sample-1 than the referenced coal-production value within the defined screening-level system boundary. Total upstream emissions were 0.0938 kg CO
2e kg
−1 pellet, of which 0.0388 kg CO
2e kg
−1 was associated with natural-gas-based electricity generation and 0.0550 kg CO
2e kg
−1 with starch binder production. This indicates that starch binder production contributed more to upstream GHG emissions than process electricity. Generowicz et al. [
34] also identified the production stage as a major environmental hotspot in the life cycle of waste-derived products, with electricity consumption during processing contributing substantially to environmental impacts. With a GCV of 3377 kcal kg
−1, equal to 14.13 MJ kg
−1, the base-case pellet carbon intensity was 6.64 g CO
2e MJ
−1. This was lower than the referenced upstream coal-production intensity of 16.22 g CO
2e MJ
−1 reported by Yan et al. [
31], corresponding to an indicative base-case reduction of approximately 59%. Under the ±20% sensitivity scenarios, the pellet carbon intensity ranged from 5.86 to 7.42 g CO
2e MJ
−1, corresponding to an indicative reduction range of approximately 54.3–63.9% relative to the upstream coal reference. These comparisons are limited to the defined upstream system boundary and should not be interpreted as comprehensive cradle-to-grave environmental comparisons. Osman et al. [
18] highlighted the importance of life-cycle assessment and techno-economic analysis for bioenergy systems, as process inputs can alter the actual sustainability outcomes. Similarly, Mohamed et al. [
21] reported the importance of integrated environmental evaluation for sewage sludge and biomass co-pyrolysis. Hammar et al. [
35] also demonstrated that circular textile pathways need to be evaluated using well-defined system boundaries. Thus, the current screening-level assessment indicates a potential upstream carbon benefit under the defined boundary while also identifying starch binder production as an important hotspot and an opportunity for both cost and carbon reduction.
The techno-economic results revealed that the pellets were still competitive even after making the correction to lower calorific value. Coal had a GCV of 5768 kcal kg
−1 and cost 0.116 USD kg
−1, while Sample-1 had a GCV of 3377 kcal kg
−1 and cost 0.042 USD kg
−1. As Sample-1 was lower in energy density, 1708 kg of pellets was required for replacing 1000 kg of coal energy. Despite this equal-energy conversion, the cost of the fuel still fell from 116.00 USD for coal to 72.43 USD for Sample-1, which resulted in a saving of 43.57 USD or a base-case saving of 37.6% of the energy cost for coal. The unit price of energy also fell, from 20.11 USD/Mkcal (coal) to 12.56 USD/Mkcal (Sample-1). Across the evaluated economic sensitivity scenarios, the equal-energy saving for Sample-1 ranged from approximately 21.8% to 50.0%, indicating that the economic advantage remained positive but varied with coal price, pellet production cost, and the realization of the avoided sludge-disposal benefit. This is due to the cost structure: starch binder cost was approximately 43%, energy 20%, labor 19% and depreciation 11% of the production cost. Sample-2 was more economically viable due to the largest cost driver being the binder. Sample-2 had a lower GCV of 2968 kcal kg
−1 and, therefore, 1.943 kg of it was required to be equivalent to 1 kg of coal, but the cost of Sample-2 was 0.0101 USD kg
−1 (no binder), which brought the equal-energy cost to 0.0196 USD kg
−1 coal equivalent and savings to an indicative value of approximately 83.1% under the evaluated conditions. These findings are consistent with previous studies demonstrating that the viability of waste-derived fuels should be assessed through both fuel performance and economic feasibility [
6,
7,
18,
21]. Similarly, recent biogas research has shown that the practical implementation of renewable-energy projects depends on integrating economic feasibility with environmental, infrastructural, and site-specific considerations [
36].
The results support the choice of a most practical blending range of 20–40% TWS. Considering all the aspects mentioned above, Sample-1 was environmentally superior, as it had the lowest emission factors, safe ash, and lowest SO
2 and NO
x levels and cradle-to-gate carbon intensity of 6.6 g CO
2e MJ
−1. Sample-2 was economically better due to the fact that there was an elimination of the binder, which decreased production cost and increased equal-energy savings to almost 83.1%. This compromise is in line with the current research on the circular economy, which indicates that waste valorization must be a compromise between environmental safety, process performance and adoption cost. Shamsuzzaman et al. [
37] found that the research on textile waste management focuses on the circular-economy approach, and there is a lack of measurable evidence of the performance of the system for recovery. Similarly, Saha et al. [
4] reported that circular textile research requires more than just sustainability statements at the technology level. Biyada and Urbonavičius [
1] noted that the challenge of textile waste circularity is ongoing. Chang and Shen [
8] also reported that converting textile wastewater sludge into solid recovered fuel represents a waste-to-energy pathway. TCW–TWS pellets therefore represent a practical solution to textile waste disposal by reducing reliance on coal, supporting compliance with emission regulations, maintaining acceptable ash quality, decreasing upstream GHG intensity, and enabling relatively rapid cost recovery. TCW–TWS pellets represent a practical solution to the problem of textile waste disposal, reducing the reliance on coal, ensuring compliance with emissions regulations, ensuring proper ash quality, decreasing GHG intensity upstream, and ensuring quick cost recovery.
5. Conclusions and Implications
This study indicates the potential environmental and economic feasibility of converting textile cotton waste (TCW) and textile wastewater sludge (TWS) into solid biofuel pellets for partial coal substitution. A key contribution of this study is the co-pelletization of two distinct textile waste streams and their integrated assessment through combustion performance, emissions, ash and heavy-metal characterization, screening-level carbon assessment, and equal-energy economic comparison. Blend composition strongly influenced performance: cotton-rich formulations showed better combustion behavior and lower emissions, whereas higher TWS fractions increased combustion duration and SO2 and NOx emissions. Under the tested conditions, all pellet blends remained within SEQS emission limits, while ash analysis showed no detectable Cd or Pb and measured heavy metals remained below the U.S. EPA and EU limits used for comparison.
The 20:80 TWS pellet achieved a base-case screening-level cradle-to-gate carbon intensity of 6.64 g CO2e MJ−1, with a sensitivity range of 5.86–7.42 g CO2e MJ−1. Equal-energy analysis indicated base-case fuel-cost savings of 37.6% for the binder-based 20:80 pellet and approximately 83.1% for the binder-free 40:60 pellet relative to imported coal. For the 20:80 pellet, scenario analysis showed that the equal-energy saving remained positive, ranging from approximately 21.8% to 50.0% under the tested variations in coal price, pellet production cost, and sludge-disposal credit. Overall, a TWS content of 20–40% represents a practically favorable range under the tested conditions, balancing emission performance, ash-related risks, carbon reduction, and economic feasibility.
Further pilot-scale and industrial boiler trials are required to confirm pellet durability, storage behavior, combustion-system compatibility, long-term emissions, and ash management. Future work should also address ash leaching, binder optimization, scale-up of binder-free production, and cradle-to-grave life-cycle assessment.






 ,
,