Abstract
This paper explores the historical inundation of the city of Dera Ghazi Kkan (Punjab, Pakistan) in 1909. The rich documentation about this episode available—including historic news reports, books and maps—is used to reconstruct the historical dynamics between an urban settlement and the river morphodynamics in the Indus alluvial plain. Map and document-based historical regressive analysis is complemented with the examination of images obtained through different Remote Sensing techniques, including the use of new algorithms specifically developed for the study of topography and seasonal water availability which make possible to assess long-term changes in the Indus River basin. This case of study provides an opportunity to examine: (1) how historical hydrological dynamics are reflected in RS produced images; (2) the implications of river morphodynamics in the interpretation of settlement patterning; and (3) the documented socio-political responses to such geomorphological change. The results of this analysis are used to consider the long-term dynamics that have influenced the archaeo/cultural landscapes of the Indus River basin. This assessment provides critical insights for: (1) understanding aspects of the formation, preservation of representation of the archaeological record; (2) identifying traces of morphodynamics and their possible impact over the cultural heritage; and (3) offering insights into the role that recent historical documents can have in the interpretation of RS materials. This paper should be read in conjunction with the paper by Cameron Petrie et al. in the same issue of Geosciences, which explores the Survey of India 1” to 1-mile map series and outlines methods for using these historical maps for research on historical landscapes and settlement distribution.
1. Introduction
The floodplain of the Indus River is one of the largest and most dynamic alluvial landscapes in the world [1,2]. Geomorphological and climatic factors create a landscape characterised by strong seasonality, continuous changes in river course, and active processes of erosion and deposition of alluvial sediments. In that context, human settlement and economic activities present a complex relationship with the fluvial environment [3,4,5]. The Indus River basin, which includes the Indus River and its main tributaries, has the potential for high agro-pastoral productivity capable of sustaining large populations, including urban centres, and it hosted the first urban settlements in the South Asian Subcontinent, which were established in the third millennium BC. The region has been intensively occupied during different periods, and it is now home to dense clusters of human population and remains one of the most productive agricultural areas in South Asia. Nonetheless, the river and its floodplain are highly active, and have strong potential to be a disturbing force for settlements and the economic dynamics of the area.
In spite of this, the Indus floodplain presents abundant traces of intense and continuous human activity in the past [6,7]. However, erosion and sedimentation processes typical of these changing floodplains have undoubtedly influenced the preservation and interpretation of the archaeological remains of this cultural heritage.
Despite their historical interest, areas that are subject to continuous transformation have been a barrier to Remote Sensing (RS) applications for the study of past landscape dynamics. Indeed, RS was initially applied for archaeological research in areas of long-term soil stability in the Middle East and northern Europe [8] and they have had a high impact in areas of where traces of past are fossilised into the present landscapes [9]. Tropical rainforests and arid areas, where fossilised landscapes can be well preserved have also revealed considerably insights into landscape dynamics in the past thanks to improvements in RS [10,11,12]. In contrast, active floodplain environments such as that of those of the Indus River Basin that are densely occupied in the present day and also areas of intense agricultural activity have been much less explored due to obvious problems of visibility and alteration. Works developed on those areas have integrated historical data within the RS approach in order to overcome some of those problems [13,14,15].
In the large Indus region, RS has been extensively used to locate rivers that have disappeared and their relationship to ancient and historical settlements. In that context, RS has been used often as a support of geoarchaeological and archaeological surveys. The Yamuna—Sultej interfluve in northwestern India, and in particular the arid area occupied by the nowadays ephemeral Ghaggar-Hakra river, has been the focus of most of the research, both historically and recently [16,17,18,19,20]. The desert areas of Cholistan and Rajasthan, which lie on the east side of the Indus River basin are one area where RS has strong potential for exploring predominant aridity areas [21,22]. Notably less analysis has been carried out on the central part of the Punjab River System in Pakistan or along the Indus River itself [23,24].
This paper focuses on the analysis of the morphodynamics of a section of the Indus River during a short period of time. The study case presented here was carried out as part of the WaMStrIn project, which builds on the TwoRains project. Both projects are directed to understand the long-term settlement dynamics in the larger Indus River basin. The Indus River basin is characterised by extremely dynamic fluvial processes, and thus far the work of the TwoRains project has focussed on the eastern part of the Indus River basin, which is a large area characterised by historical and ongoing hydrological changes [25,26,27].
The research presented here aims to address the relationship between river morphodynamics and human settlement within a much more active part of the Indus River basin. The Area of Interest (AOI), around the city of Dera Ghazi Khan (DG Khan), has been selected in order to analyse a human settlement situated in an extremely active river environment. The chronological focus of the study is the nineteenth and twentieth centuries AD, a period for which historical documentation allows the reconstruction of both the history of the settlement and the changes in the river landscapes in considerable detail. The selection of this chronological span makes it possible to explore the approaches to integrating recent historical datasets, and this paper acts as a companion piece in the same issue that explores the potential for historic maps for the detection of archaeological sites [28].
This paper will assess the use of historical documents in the interpretation of RS data and settlement patterns. Firstly, it describes and demonstrates a method for extracting and georeferencing the historical data related to the settlement and river dynamics of the study area in order to obtain a regressive landscape reconstruction. Secondly, it applies different RS techniques and obtain images of the study area surface to compare with the historical landscape. These data are then analysed to address: (1) how well know historical processes are reflected in RS, and; (2) how the historical data can provide valuable information for the analysis of the cultural heritage beyond its specific chronological framework.
2. Study Case: Dera Ghazi Khan and the River Indus
Today, the city of DG Khan is the capital of a homonymous district at the south-west edge of the Pakistani province of Punjab. DG Khan district includes part of the alluvial plains at the west of the Indus River and extends towards the foothills and uplands of the Sulaiman Mountains (Figure 1).
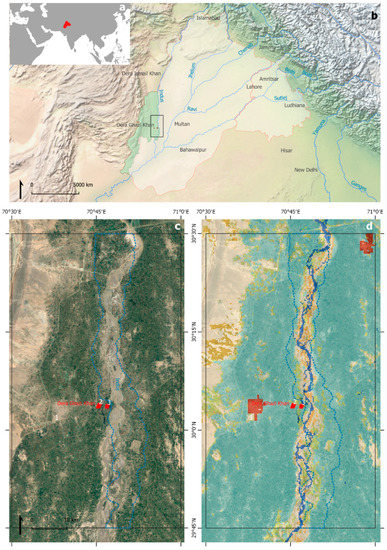
Figure 1.
Situation and context of the AOI: (a,b) DG Khan district in the context of the moderns Punjab Province (Pakistan) and Punjab State (India); (c) actual aspect of the AOI and situation of the DG Khan modern city (1), historical town (3) and nineteenth century British cantonment (2). The dotted line represents the active floodplain of the Indus as it was in 1907; (d) actual land-cover classification (GLOBCOVER V. 2.3, 2009) show the area occupied almost entirely by irrigated croplands, except in the riverbed and mountain slopes.
The modern settlement was founded in its current location in 1911 as a consequence of a flood that destroyed the historical town in 1909. The original position of this earlier version of the city was 15 km to the east, and lay within the modern active floodplain of the Indus. The original city was founded in the fifteenth century AD, as one of the regional centres named after prominent members of the Dodai tribe that had recently stablished its control of the west bank of the Indus. DG Khan maintained its role as political centre of the area under different rulers and was incorporated into the British administration in the mid-nineteenth century, in the wake of the Anglo-Sikh wars [29,30]. Under British colonial rule, DG Khan was the capital of the district and a cantonment for colonial troops and civil administration was established on the western side of the old town (Figure 1 num. 2). After the flood of 1909, the newly built city assumed the role of regional administrative and economic centre.
On the west bank of the Indus where DG Khan is situated, there are two interrelated dynamics (Figure 2): (1) the Indus River has a strong seasonal character due to its seasonal floods and continuously moves its main channels across a wide floodplain in a regular basis (Figure 2: a.2–3 and b.2–3); and (2) ephemeral torrents descend from Sulaiman mountains and cross the piedmont zone at their base before joining the Indus River (Figure 2: a.1–2). The water and the sediments deposited by the Indus and hill torrents have been exploited historically for agropastoral purposes in the area, which has an arid climate that in other circumstances would not allow the cultivation of some crops at productive levels.
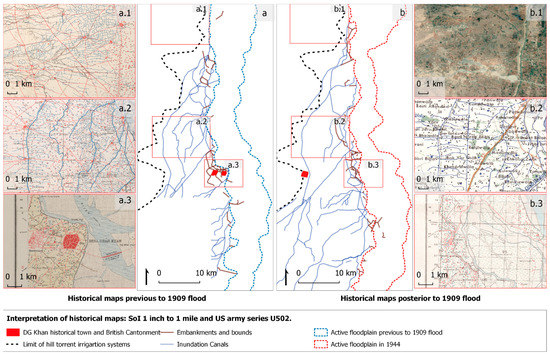
Figure 2.
General overview of the AOI before (a) and after (b) the 1909 flood, according to the information contained in the SoI 1” to 1-mile maps (for more details see Section 3 and Figure 5). The maps contain information of the historical landscape morphology: (a.1,b.1) irrigation systems based on hill-torrents; (a.2,b.2) inundation canals in the old floodplain; (a.3,b.3) active floodplain, earthworks and canals around DG Khan. No maps edited before the flood were available for the South-West sector of the AOI (see Figure 5). SoI maps Image courtesy of UL, Cambridge.
Despite continuous efforts to control the river’s water levels, major floods continued to happen on a regular basis in the Indus valley. Almost 9000 causalities and large economic damage were calculated for the period between 1950 and 2011 [31]. One of the more recent major floods in the Indus basin occurred in 2010 (Figure 3). Mirroring what happened 100 years before in DG Khan, much literature [32,33,34,35,36] has addressed its causes (both natural and anthropic) and consequences (in economic terms, health, for future risk planning, and so on), although few of these works uses historical data previous to the 1950’s.
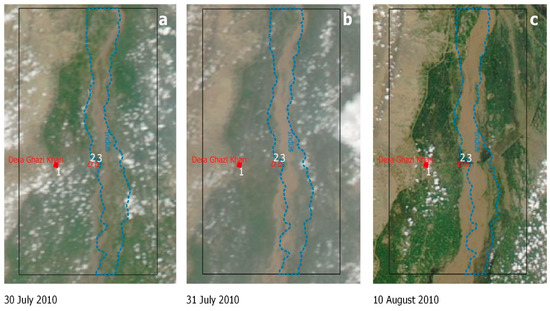
Figure 3.
Images of the AOI obtained by the satellite MODIS during the flood event of summer 2010 [37], showing the progression of the water in three moments of the episode in which the clouds allowed to visualize the AOI: 30th (a) and 31st (b) of July and 10th of August 2010 (c). Blue dotted line represents the active floodplain in 1907. Many Satellite-derived products were produced to study this event [38,39,40]. The images show how the water occupies most of the early twentieth C. floodplain.
3. Materials and Methods
3.1. Historical Sources
The documents produced by the British colonial authorities provide a unique testimony of the flood episode in 1909. In the process of developing colonial rule, the British authorities undertook a huge and systematic collection of data to describe the acquired territories, including the compilation of detailed District Gazetteers and the systematic mapping of the area by the Survey of India [28]. That effort served the practical need of providing information to officials appointed to administer a territory and people about which they often had limited previous knowledge. This process was also linked to the intellectual context of nineteenth century Europe, where there was a general ambition to describe, measure and classify the physical world.
The District Gazetteers are an example of this intended systematic collection of data on particular administrative areas [41]. The 1893–1897 edition of the Dera Ghazi Khan district Gazetteer [42] has been consulted for this research. The changes in the watercourses and their effect on settlements and cultivated lands were a major concern for the DG Khan district authorities. The reports collected in the District Gazetteer contain a detailed account of flood episodes and the engineering works that were developed in response during the nineteenth century. Other documents were produced by administrators, engineers and geologists [43]. The consequences of the 1909 and 1910 floods were described, including some photos, in an article that appeared in 1910 in The Times of India Illustrated Weekly Supplement [44] (Figure 4).
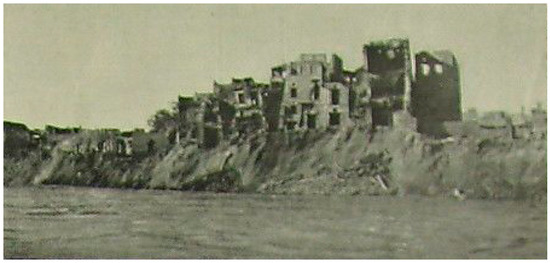
Figure 4.
Image of DG Khan in process of abandonment in 1910 [44].
Shortly after the flood, DG Khan was analysed in detail by a former Superintending Engineer of the Punjab Irrigation. The resulting document [45] provides first hand evidence of the works developed between 1897 and 1909, including several sketches, together with a general discussion about the causes and development of the flood.
All this documentation has been analysed in order to investigate different aspects of interest, in particular: (1) references to geomorphological processes; (2) references to dates and character of earlier flood episodes; and (3) descriptions of the engineering works developed in relation to floods. The information obtained has been georeferenced whenever possible.
The documents used here were produced between 1870 and 1912 (Figure 5, Table 1). They describe ongoing processes as they were perceived by representatives of institutions with a direct knowledge of the area. Hence, they provide a unique first-hand description of physical changes in the river environment concerning the episode that is the object of this study. Beyond the direct description of local conditions, the knowledge of the river’s morphodynamics reflects the conception and technical limitations of the society in which they have been produced [3,43]. The reconstruction based on these sources has an approximative character in terms of topographic georeferentiation, but many of the described features can be identified in detail through the 1” to 1-mile maps.
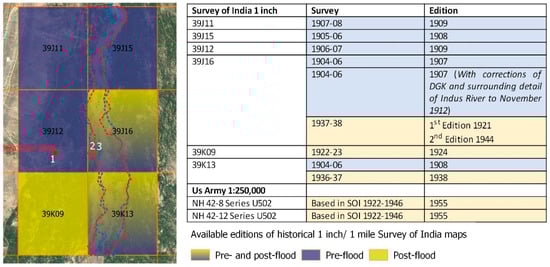
Figure 5.
Editions of the SoI 1” to 1-mile maps used for this study and its geographical and temporal coverage. The whole area is also covered by two maps from the US Army Map Service, Series U502 (1955).

Table 1.
Summary of references to the riverine dynamics during the nineteenth century recorded by the British colonial authorities.
3.2. Historical Map Analysis
A second type of documents are the cartographic material produced by the Survey of India (SoI). The processes involved in the creation of the SoI and the characteristics of the materials produced are presented in another paper presented in this volume [28].
For the work presented here, several editions of the SoI map series were employed. These include those sheets that show the old and new cities of DG Khan and the areas immediately to the south and north (Figure 5). The AOI measures around 80 km N-S and 40 km E-W. The large scale (1” to 1-mile; 1:63,360) and accuracy of the SoI maps provide a unique source for the study of the area in the years before and after the 1909 flood. These maps were provided (as scanned 600 dpi tif files) by the University Library, University of Cambridge.
Georeferenciation of these maps has been carried out following the process described by the authors in a paper published in this same volume [28]. Ground control points (GCPs) were obtained using the high-resolution images available through QGIS world imagery map services. The areas analysed have undergone substantial changes during recent decades, which has resulted in a significant reduction in the number and distribution of reliable GCPs in comparison to other Indus valley areas. Very few reliable GCPs were identified in the area occupied by the Indus river channels. Only 6 to 8 GCPs have been used for each of the maps presented here. Given the low number of GCPs for the area rectification procedures used a first-degree polynomial, which provided medium RMSE value of 27 m. The evaluation of the map accuracy has been possible through comparison with canals and settlements present in modern images. Canals preserved today prove that the maps were very accurate in the representation of those elements. Also, main settlements and roads are drawn accurately, but the accuracy of the positioning of single farms and footpaths on the maps are more difficult to assess.
The earliest series of SoI 1” to 1-mile maps of the DG Khan area were produced between 1907 and 1909 from data collected in 1904–1908, immediately before the 1909 flood. In 1912 a new edition of the maps of the area of DG Khan was produced specifically to document the changes in the river and the effects of the flooding. There was an even later edition produced in 1944 based on survey data of 1937–1938 for the same area. Post-flood editions of the SoI 1” to 1-mile series produced between the 1920s and 1940s, are available for only other two maps. The post-flood image has been completed with the georeferentiation of the 1950’s maps produced by the US army, which are based on the Survey of India 1920s–1940s editions (Figure 2: b.2; Figure 4).
3.3. RS Approach
3.3.1. Declassified Data and Satellite Historical Photographs
High-resolution satellite images provided by QGIS 3.2 Imagery Web Services were used to provide a current view of the AOI. A declassified KH4B CORONA image from 1972 has been acquired [46] and georeferenced. Declassified CORONA data have been proved extremely useful in archaeological research [22,47], as the image series provides a unique view of past cultural landscapes before recent landscape changes. Unfortunately, the only scene available at the USGS collections covering our AOI has much of the DG Khan area towards the edge of the scene, and therefore is highly affected by image panoramic distortion [48]. As a result, the rectified image should be considered as informative, but not of sufficient quality for data extraction.
3.3.2. Multispectral Satellite Imagery
Several recently published algorithms [25] have been applied to the Landsat 5 long-term archive to boost the detection of palaeorivers and related geomorphological traits: (1) Normalised Difference Seasonal Vegetation Index (NDSVI), which provides information about the amount of inter-seasonal variability of vegetation and allows the user to select between the following techniques according to the most adequate environmental factors; (2) Seasonal Multi-Temporal Vegetation Indices (SMTVI), which produces an image of long-term vegetation health, which can be related to subsurface features; and (3) multi-temporal seasonal spectral defragmentation techniques, which include Principal Component Analysis (PCA) and Tasselled Cap Transformation (TCT) to allow the exploration of multispectral datasets in different environmental conditions. Details about these algorithms and the code employed to implement them have been previously published [25] (see the Supplementary Material for the version used here). Landsat 5 have been selected because is the longest Earth Observation missions currently available, covering the period between 1984 and 2013.
Another source of information has been the images acquired by MODIS Satellite during the 2010 flood. This satellite monitored the advance of that flood through the Indus River basin on a daily basis, providing an interesting example of flood progression (Figure 3).
3.3.3. Microtopographic Data
Multi-Scale Relief Model (MSRM) ([26], see the Supplementary Material for the version used here) was employed to extract microtopographic information at variable scales using ALOS data (Figure 6). The new 30 m/cell ALOS digital terrain model (DTM) was selected as it offers much-improved topography in comparison to similar freely available global DTMs such as SRTM and ASTER GDEM. This mission is relatively recent (2004–2011), reflecting the current relief of the AOI.
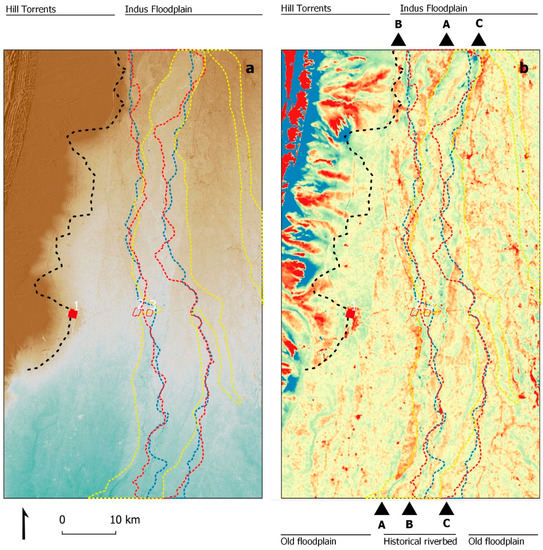
Figure 6.
General view of the relief analysis: (a) ALOS DEM; (b) derived MSRM. Blue represents relative lower areas and red higher areas. Dotted lines represent the limit of hill torrents irrigation systems (black), and the active floodplain in 1907 (blue) and 1944 (red) (see Figure 2). In this area can be identified the actual Indus West levees (A) and historical levees West (B) and East (C). Old floodplains occupy the area between the Suleyman mountain hill-torrent deposits (W) and Indus tributaries (E). Inactive floodplain is irrigated by inundation channels. The micro-topographic analysis show depressions and old river channels occasionally flood. Like the previously mentioned 2010 event (yellow dotted line).
Palaeorivers and associated features such as levees, oxbow lakes and bluff lines even when inactive leave subtle topographic marks that are reflected in DTMs. These micro-topographies are very variable in size, which renders them undetectable by current micro-topographic visualization techniques. MSRM provides a multi-scale rendering of small topographic differences and presents an ideal technique to investigate morphological remains from ancient rivers.
4. Results
4.1. Historical Landscape Reconstruction
The information contained in the historical documents [42,44,45] reveals how the 1909 flood was the culmination of a long process (Table 1). During the nineteenth century, the colonial administration had to deal with a landscape that was undergoing continuous change, with floods seasonally covering part of the administrated territory. They also had to take control of a network of artificial weirs and canals build to regulate floods and use the river water and sediments for agriculture. Despite the presence of these infrastructures, and the multiple improvements undertook during the second half of the nineteenth century (Figure 7 and Figure 8), the historical sources reported at least twelve major flood episodes between 1787 and 1909, which were considered catastrophic or potentially catastrophic for DG Khan. In response the management strategies focused in the building of new embankments and the extension and maintenance of the ones that were already extant.
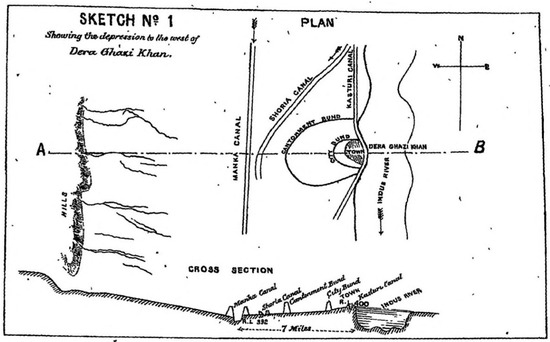
Figure 7.
Sketch of the city flood-protection system at the end of the nineteenth century [42].
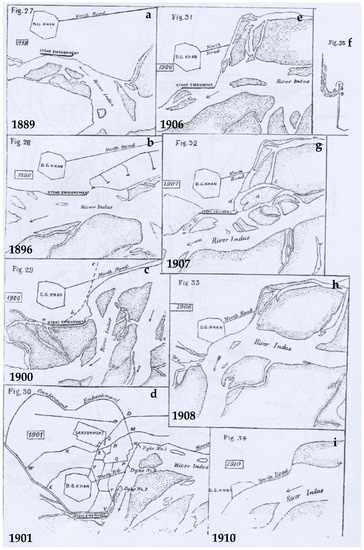
Figure 8.
(a–i): Sketches showing the movement of the river between 1888 and 1910 [45]. (d) shows the protection system planned in 1901, which was already half lost in the 1907 SOI map. Note that the images are orientated West with North at right.
The Gazetteer acknowledges that the original city of DG Khan was originally built on a river island, with the remains of a channel still visible in the west side of the town where the cantonment was built:“Four hundred years ago, when the city of Dera Ghazi Khan was founded the river basin was travelling eastwards, and the city is said to have been built on an island or chakkar, the creek of the west of which has long ago silted up, though parts of it are traceable in slight depressions” ([42], p. 6). In fact, Charles Masson reportedly crossed the Indus around 3–4 miles from DG Khan in 1826. An old channel of the river can be spotted in this area (Figure 6C). Between the river and the city, Masson described an “…an immense assemblage of date groves and gardens amid which the large, populous and commercial town of Déra Ghází Khân is situated.” [49], which indicates that the river floodplain had been inactive for some time in the areas surrounding the town.
The west paleochannel reported in the Gazetteer was not clearly indicated on the SoI 1” to 1-mile map produced in 1907 (39/J/16/1907), but it appears in the map edited after the flood (39/J/16/1944). A channel in this area can be spotted in the satellite derivates as a depressed area in the microtopographic image (Figure 6A). It could be argued that the earliest map reflects a mindset whereby the aim of stopping the water from encroaching on the city had been successful, despite the fact that in this map, the stone embankment that had been built in 1888 was already lost (Figure 8). The 1907 map, in fact, depicts a channel turning east precisely where it meets the embankments built north of the town. It is interesting to note that a small body of water is depicted in 1907 precisely in the place where in the 1912 modified map shows that the channel has broken the embankment (Figure 9 and Figure 10a,b). This example is indicative of how maps can produce a static ‘frozen in time’ picture of a constantly changing landscape.
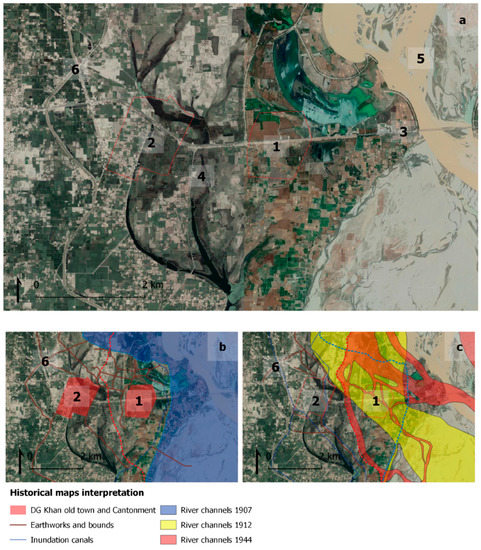
Figure 9.
(a) Detail of the area of the old DG Khan city in a high-resolution satellite image. Below, superposition of the features extracted from the SoI 1” to 1-mile; (b) before the flood (1907 edition) and; (c) after (1912 and 1944 editions). The features have been extracted directly from the maps, showing its topographic reliability. That is particularly visible in the right part of the image, less affected by the river movements, where (6) part of the earthwork morphology has been preserved by canals and the modern road network. The accuracy of the elements preserved in today’s landscape provides a high confidence in the location of disappeared elements. The numbers indicate different areas discussed in detail in the following section: (1) the old walled DG Khan; (2) the British cantonment; (3) the modern N-70 bridge; (4) depression between the old city and cantonment and; (5) the main Indus channel. In the maps (b,c) the river bed according the different SoI editions is superimposed.
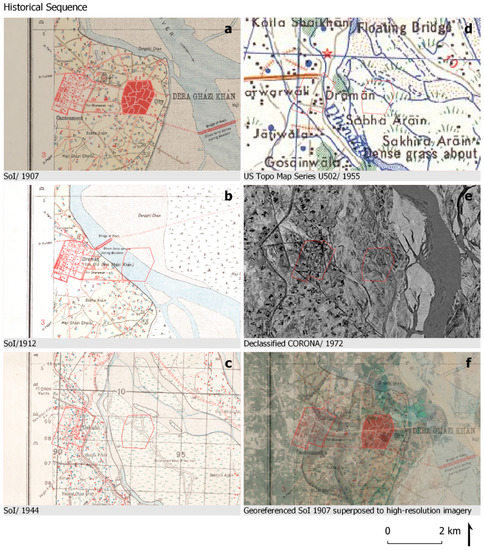
Figure 10.
Detail of the area were DG Khan was placed until 1909 in different historical documents: SoI 1” to 1-mile, editions of (a) 1907, (b) 1912 and (c) 1944; (d) US Army Map Service, Series U502 of 1955; (e) declassified CORONA of 1972 and (f) present day high-resolution satellite image. SoI maps images courtesy of UL, Cambridge.
The works to protect both city and cantonment form the floods are described in the Gazetteer, which includes an engineer’s report and sketches of the works (Figure 7), and more details are given in Bellasis work (Figure 8). Both canals and levees are represented in the SoI 1” to 1-mile maps, which show part of the plans described by Bellasis that were part of the respond to the 1901 flood (compare Figure 8d and Figure 9b and Figure 10a). Those plans were in fact never fully completed and part of the system was already covered by the water when the map was draw [45].
In 1912 a second edition of the 1907 SoI 1” to 1-mile map was produced specifically to incorporate the changes in the area of DG Khan (Figure 10b). This map shows a channel of the river crossing the area of the city and does not show any traces of the old town, although most of the cantonment is still visible. The map doesn’t cover the area where the new city was being built at that time, and the map legend doesn’t mention if new surveys had been undertaken in order to re-draw the map or if it was an approximate modification. Furthermore, the map produced in 1944 (Figure 10c) shows the 1912 location of the channel, even though it was dry at that time, and none traces of the old town. The area seems occupied by high grass and other dry channels. That situation is reflected also in the 1950s US version of this map (Figure 10d), and it is also how the area appears in the 1972 CORONA image (Figure 10e). Since then, important works related to road infrastructure, mainly the N-70 road bridge over the Indus, have further modified the area (Figure 9a num. 3 and Figure 10f).
4.2. Remote Sensing Analyses
4.2.1. Dera Ghazi Khan Old Town
Examination of cartographic material produced after 1909 does not show any traces of the old town of DG Khan (Figure 9 num.1 and Figure 10a–d). Satellite images, covering the period from 1972 to the present, show that the area formerly occupied by the old town is now dedicated to agricultural fields, with some roads and channels (Figure 9 and Figure 10e,f)). In fact, the present-day high-resolution images, or historical CORONA shows no remains of the old town or its shape in the landscape. However, part of the cantonment is visible, since some roads and field borders follow the lines defined by the cantonment streets depicted in the SoI maps.
The analysis of long-term multi-spectral images of the area shows that the surface of the old city does not present a unique differentiated signature. The embankment of the N-70 Road bridge and associated infrastructures had a clear impact, however, dividing the area between north and south, with very different dynamics (Figure 9 num.3). In the PCA and TCT analysis (Figure 11c–f), the surface of the old city is not distinguishable from the surrounding area. Only in the SMTVI image, is there a clearly distinctive signature in the north-west quarter of the old city (Figure 11a,g). This signature apparently comes from high values in band 1 (Jan–Feb), as it is the only area in the riverbed where that happens. Unusually high values in band 1 correlate with lower areas in other parts of the AOI, but here there is an exception of this trend, since this area is surrounded by lower areas. On the other bands, the area presents the same signature than that of the areas close to the north side of N70 road embankment (Figure 11c–f). In that sense, it seems that the area is flooded occasionally by water stopped by the embankment.
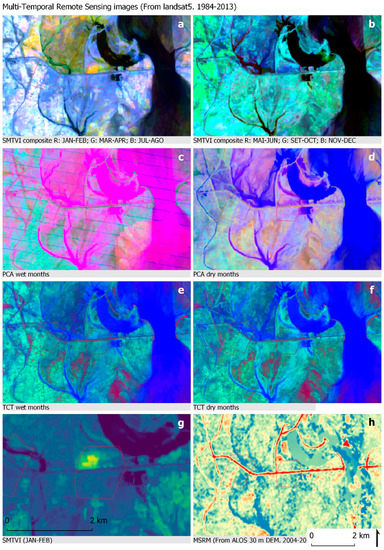
Figure 11.
Detail of the area were DG Khan was situated until 1909 in Multi-Temporal RS products: SMTVI (a) wet and (b) dry months; PCA (c) wet and (d) dry months; TCT (e) wet and (f) dry months; (g): Detail of the area occupied by the old DG Khan town, with an anomaly in the Northeastern sector visible in the months of January-February. MSRM (h) image of the same area. Blue represents relative lower areas and red higher areas.
In the MSRM, the N-70 embankment is also a prominent feature (Figure 11h). Depressions related to channels of the river Indus are visible in both East (Figure 9 num.4) and West (Figure 9 num.5) sides of the old town, enhancing the original image of a river island for the city placement. The lower East area extends until at least the middle of the old town and a lower area is also present on the South-Western corner, leaving the North-Western quarter again as the only observable elevated area (Figure 11h).
4.2.2. River Channels
Today, the old site DG Khan lies within the Indus active floodplain. Its west limit is defined by an elevated bluff line that is clearly distinguishable in the relief, as it shows the MSRM image (Figure 6 and Figure 11h), and can be delineated in the multispectral images as well (Figure 11a–d). This line follows the riverbed as it was draw in early twentieth century maps of the area north of DG Khan old town. South of the old town, the modern bluff line is a few kilometers (2–4 depending on the point) to the west of where it was draw in the early twentieth century maps.
Within the riverbed, the N-70 road bridge has had a major effect on the river movements on this area, which is clearly visible in multi-temporal and multi-spectral image composites. As observed by the first available Landsat 5 images (1984), the bridge and associated embankments were already built (Figure 11). In the Corona image of 1972, this section of the river has a very different aspect, and many elements represented in the 1944 SoI map were still visible (Figure 10).
The superposition of the channels identified in the historical cartography shows that over time almost the entire modern floodplain has been occupied by Indus channels (Figure 9 num.5 and Figure 12). This is particularly telling considering that the SoI maps and the CORONA image that are available only provide information for 4 particular moments, and the longest recent series of remote sensing imagery covers a relatively short period of time (1984–2013 for Landsat 5, that can be complemented by more recent data). In general, the continuous superposition of channels occupies parts of the older ones. Channels identified in multispectral images, both active and non-active, are the product of this processes and have a very recent origin, regardless that they might partially follow the same tracks that channels documented in older maps and photographs had occupied before.
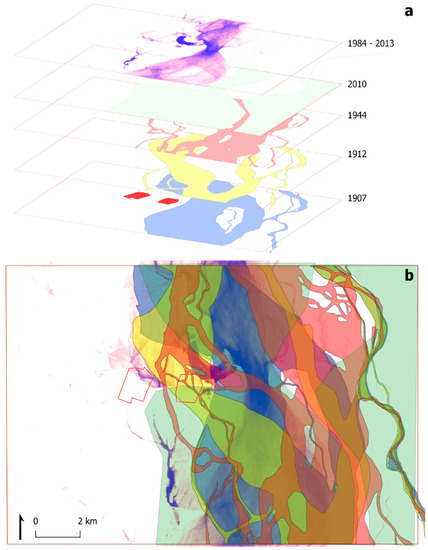
Figure 12.
(a) active channels of the Indus documented in different historical moments. SoI 1” to 1-mile editions of 1907, 1912 and 1944. It have been add the extension of the 2010 flood extracted from MODIS (see Figure 3) and the surface water occurrence layer from Global Surface Water Explorer [50,51]; In the image below (b) the different documented historical extensions of the Indus riverbed are superimposed in a single map.
Similar circumstances have affected the topography, which broadly reflected in the actual main active channels. In that sense it is interesting to note the depressions East and West of the old DG Khan site, visible in the SoI maps (Figure 10). They were part of the geomorphology of the area documented in the early twentieth century and they have been intermittently active until nowadays. The erosion of the areas formerly occupied by the old town and the cantonment is visible in the presence of lower areas within the limits of the old settlements (Figure 11h).
5. Discussion and Conclusions
5.1. Integrating Remote Sensing and Recent Historical Data in the Study of Human Settlement and Riverine Dynamics
The regressive analysis of late nineteenth and early twentieth century cartographic and historical sources provide reliable information to place with accuracy distinct landscape features of interest, including: the old DG Khan historical town (Figure 9 num.; Figure 10f), the nineteenth century British cantonment (Figure 9 num. 2), the canal systems (Figure 9 num. 7, build embankments and the road network (Figure 9 num. 6). Moreover, the movement of the Indus channels and other geomorphological features can be partially reconstructed using the same sources (Figure 2, Figure 5 and Figure 9 num. 4–5). Since all of these features have disappeared from the modern landscape, this approach provides a view over the historical landscape that would be impossible to obtain otherwise.
More importantly, for the objectives of this work, this dataset can be compared with Remote Sensing products. The georeferenciation techniques applied here allow to overlay the information contained in the maps over multispectral satellite data-derived products. If we consider the resolution, georeferenciation errors are imperceptible when compared to the 30 m/pixel satellite images used here or even the most common high-resolution satellite imagery (e.g., Google satellite, Bing, and similar services). In addition, the chronological proximity of these maps to the other historical accounts is another highly valuable feature provided by the use of the SoI maps. Since the authors of the analysed reports and the cartographers were describing the same territory, many features described can be identified in the maps, accurately located, and compared with the satellite images. The result is a multi-layer impression that reflects more than 100 years of landscape history and in which the complementarity of the different sources used is boosted.
5.1.1. DG Khan Old Town
In a general overview, the area formerly occupied by the old town (Figure 9 num.1) shows in the RS derivates and historical imagery analysed in this paper a similar aspect than the surrounding riverine environments, with any element that could indicate the presence of a settlement in the past (Figure 10 and Figure 11). A possible exception has been obtained using the enhanced RS approaches. SMTVI and MSRM have uncovered a differentiable signature in the northwestern quarter of the former old city, while the rest of the area has the same aspect of the neighbouring riverbed sectors. The possibility that this signature is related to the old town cannot be dismissed, as for example, the consequence of an area less affected by erosion. Despite that, the possibility that it might also be related to the soil use or the impact of modern infrastructure seems more probable. Therefore, archaeological data from the terrain would be necessary to verify possible hypothesis. This highlights the need to incorporate ground truth in the form of archaeological survey in RS-based archaeological research.
5.1.2. River Channels
The analysis of the river channels complements the view built up by the study of the historical dynamics (Figure 9 num. 4–5). The combined historical sources show how in around 100 years, water has covered almost all the active floodplain in one moment or another (Figure 12). Moreover, channels of the river can move towards parts of the inactive floodplains. The movement of the active floodplain can also be detected in several points of the study area, in particular to the south of DG Khan. RS images reflects essentially the dynamics of the river during the acquisition of the measurements used in the analysis (1984–2013 for Landsat and 2004–2011 for ALOS). Channels detected through RS have punctual coincidences with the historical channels, but this is not necessarily related to the details of the historical channel morphology.
5.1.3. The Value of Historical Sources and Cartographic Material in RS Approaches
Historical documents, in particular the SoI 1” to 1-mile maps, are the only dataset that provide temporal information about the most significant historical landscape features and morphology, which are present in RS data as an accumulation of features that are difficult to differentiate. Some landscape elements are not-visible through analysis derived from images acquired during the last 30 years, and others can only be interpreted with the support of the old maps. The Indus River probably represent an extreme case of strong geomorphological and anthropic dynamics, even in the context of the Indus basin. But it also reflect landscape dynamics that, to a minor degree, are widespread around the areas influenced by this river and major tributaries. Furthermore, those dynamics are at a fundamental level the types of geomorphologic processes that formed the landscapes of the Indus floodplain, and are likely to have continually affected it during the proto-historic and historic phases during which humans have occupied the plain.
Nonetheless, it is important to recognise that the SoI maps have limitations. Although they extend our temporal window, they are limited to providing information about the moment in which the data was acquired, as illustrated by the difference between the editions of the SoI maps. They do not present a continuous view of landscape changes but a set of temporal slices determined by the interests of the agency producing them. In this regard, they might have been and probably were many more geomorphological changes between these editions that we have not been able to reconstruct. Map-based historical landscape analysis is also dependent on the availability, selective criteria and quality of the maps [28]. Finally, it is relatively exceptional for systematic and accurate historical mapping to cover a period that goes before the late nineteenth and twentieth centuries.
Satellite-based sources have proved their high-potential to analyse the landscapes of the Indus and beyond and to extract reliable information on their long-term landscape dynamics [25]. These are an outstanding instrument for exploratory work and to guide fieldwork. The case developed in this paper is an example of how regressive analysis based on recent historical data can enhance RS analysis, by providing information about disappeared features and complementing the interpretation of other sources. This is critical for addressing part of the problematics that highly transformed areas but also identify RS-detected features that have a modern origin. In the case of the Indus, the inclusion of materials like the SoI maps, the district Gazetteers and other similar historical sources need to be systematically integrated in RS workflows [28].
5.2. River Morphodynamics, Settlement Patterns and Archaeological Record in a Long-Term Perspective
The reconstruction of DG Khan’s old town and its relationship with the morphodynamics of the Indus river provide data for the study of the history of this area during the last 200 years. However, this example is also significant for the study of past landscape dynamics. Similar geomorphological dynamics, even if influenced by climate change and other factors, can be assumed for the study area throughout the Holocene. Despite the obvious problems involved in extrapolating interpretations extracted from very specific geographical and temporal frameworks, small-scale analyses are an important mechanism for understanding the parameters in play for large-scale dynamics. Elsewhere we have addressed the nature of the map sources and their potential for types of analysis performed here, but in a larger scale for the detection of archaeological sites [28,52]. The specific case of DG Khan presented here allows us to address in more detail the significance of historical morphodynamics as one of the many interpretation filters that can be used when observing the available prehistoric settlement distribution maps of the Indus basin. In the extant site distribution tables and maps [53], large areas of Punjab appear to have been largely unpopulated in terms of archaeological data, at least for the protohistoric periods, but also to some extend the historic periods. Our data underlines that five thousand years of very active river geomorphology could have had an important influence on the number of sites that have been available to document using our current recording methods in combination with the patterns of the known site distributions in Punjab.
River morphodynamics have had in the case of DG Khan a double impact: firstly, in the development of the settlement, starting from the original placement on a river island, and continuing to be a central factor in the urban development, abandonment and final movement of the town to a new place. The second impact is on the preservation of the old town as an archaeological site. The results presented here (Section 4) provide a very interesting picture in which we have three settlements—the historical town, the cantonment and the new town—where we have historical evidence of both synchronic and non-synchronic moments of occupation within a single historical period, but only the new town is visible in the present landscape.
The concealing of a relatively large settlement in a short period of time, not only as an inhabited place but also as a potential archaeological site capable of being physically explored -at least through most RS techniques available-represents a clear example of how the preservation of historical features in the area presents often a random character. Indus archaeologists have long been aware of the potential for the river action to result in a significant loss/occultation of archaeological sites, including big urban sites, which impact both surface analysis and RS. The potential for settlement and/or site loss closely related to riverine dynamics thus necessitates a good understanding of river morphodynamics when studying historic and protohistoric settlement patterns. The challenges must be addressed in two main levels: first to understand the processes of creation and abandonment of the settlements, and; secondly, to understand the processes that created the archaeological record available to archaeological research. The impact of those questions acquires an important role for RS, as it is now often the first step from which archaeological survey projects are developed. We are not only considering here the punctual potential effects that river morphodynamics might have in the abandonment of some sites and the covering of earlier inhabited or cultivated areas, but also its long-term effects on cultural heritage. We might consider DG Khan as an exceptional case, and of course most of the similar settlements documented in the SoI maps were not abandoned during the same period. From an historical perspective, however, the circumstances documented in colonial DG Khan history are processes that have been operating across a wide geographic area and during a long period of time. An illustrative example is the situation of Mohenjo Daro, a large archaeological site in the lower Indus river basin where substantial works have been carried out on flood defences in recent years in response to the concern about the erosion caused by the river approximation to an archaeological site preserved for 4500 years [6,54].
The analysis of DG Khan flood evidence shows that our understanding of surface river channels, both active and dry, is largely dependent on the dynamics active during the short period of time before the image—whether they be maps or RS - are obtained. Just taking into account the case of 1909 DG Khan we can document channels on the east, west, and actually crossing the area of the city in several moments within a short period of time, that would be impossible to differentiate in historical sedimentary terms. Moreover, the subsoil can potentially contain remains of multiple previous episodes from previous unknown chronologies. In DG Khan, the triangle of surface evidences of palaeochannels, buried alluvial sediments, and proximity to human settlements might be not as straightforward as we might suppose at first glimpse.
5.3. Historical Social Responses to River Morphodynamics
In the specific case of DG Khan, two consecutive main actions were decided and executed in the context of the colonial administration. Both imply the mobilization of intellectual, technical and economic resources controlled by the colonial administrators and had been decisive for the processes studied here: In the first place, since the foundation of the cantonment, and after the flood in 1858, there is a strong effort in the protection of the town, with the building of new embankments and the improvement of those already in place. The turning point was, apparently, the entering of the water in the old town in 1909. The second action was to move the town to a new location, safe from river movements. In consequence, although the end of the historical town was forced by the river geomorphology, it was, at the same time, a planned dismantlement (with the removal of construction and other types of material) by a central power which probably influenced the fact that the old settlement was almost invisible just a few years later. The response of DG Khan inhabitants makes us wonder to what point construction techniques and habitation patterns and practices in the past were influenced by similar river morphodynamics. When studying past settlement in similar landscapes it is, therefore, worth considering a type of habitation characterised by a high degree of mobility. One of the consequences of this mobility can be the multiplication of sites that were only inhabited for relatively shorts periods of time. These can include both short-term semi-nomadic sites and permanent settlements that can be occupied for various generations before their abandonment and re-location caused by river movements and flooding.
It is interesting to note how the new town was created following an orthogonal grid, representing the urbanism promoted by late nineteenth century European rationalism. To address the disturbing effects of the floods, European expertise was imported on landscape management and, on a middle-term perspective reinforced the colonial system, contributing to the ideological justification and increasing the control over the economic organisation, largely depending on the river soil productivity [3,43]. That results in landscapes in which the colonial footprint is increasingly evident over time. That process provides a good example of how internal historical processes -in our case the consolidation of European imperialism- are determinant factors in shaping responses to what we define as natural hazards. The analysis of historical study cases like the one exposed here can contribute as a support of comparative analysis, like the ones developed during the last decade in the Indus valley [55].
Strategies developed by human societies inhabiting Indus alluvial plains adapt the constructed social landscape to the geomorphological conditions and, at the same time, respond to the particular historical socio-political and cultural environment. Monitoring of the river conditions, the building of hydraulic infrastructure, and mobility summarises the basic elements of the management systems documented in the nineteenth century Indus valley [43], and they are not far from current approaches to flood management [31,34,36,40,56]. It is only to be expected that these were part of the landscape management strategies of past societies inhabiting this type of environment.
In first place, different traditional information transmission methods were reported during the nineteenth century [43], and similar methods could have been in use for a long time. The well stablished trade networks documented in the Indus basin since Prehistory [57] could have carried critical information together with the goods documented within the archaeological record. Landscape, hydrological and geomorphological knowledge could have historical significance in a short-term perspective, anticipating floods and undertaking actions to avoid or mitigate damage, but also in a long-term perspective, determining, e.g., where to stablish a new settlement. The role played by traditional knowledge about water management is very difficult to assess without a larger body of ethnographic and historical literature and some works have been developed in that direction the Indus valley [58].
The second set of strategies, hydraulic works, were at the centre of the British colonial system in Punjab [3] and they were object of debate since the beginning [4,43]. The main practical approach included the building of inundation canals and artificial levees to contain and divert the excess of water during flooding episodes. Both have been previously used in the Indus basin. Already in the proto-historical period hydraulic works are known in the urban centres [57,59]. Had either been used in the countryside it is a debated question with no data available [60]. The scale of the works developed during the British colonial rule, however, have no precedents [4]. The previous works were integrated into the new systems or abandoned. As a result, few elements of the systems existent before the late nineteenth century are preserved. The analysis of DG Khan is an example of how channels and embankments are continuously re-adapted and can leave few traces when abandoned. It was also the main strategy adopted since 1858 and until the 1909 flood.
The third group contemplates different forms of mobility. The movement of the whole DG Khan settlement was the decision adopted in 1909–1910, resulting in a new settlement. The possibility of moving entire settlements in a dangerous location to a safer place was not unknown on the Indus region. Historical accounts of early nineteenth century reported the extension of temporary settlement. For example, in relation to the Sindh, Richard Burton wrote in 1849: “most villages could be razed to the ground, transported to the requisite distance, and re-erected in a week, at an expense of probably a couple of rupees per house” [43]. Few years earlier, in 1842, Mountstuart Elphinstone wrote in relation to the Indus river: “the labourers have temporary huts erected, and cultivated” and “and the villages are only temporary, with a few exceptions” [61]. Mobile strategies have been proposed for the interpretation of prehistoric settlement patterns related to irregular water availability in semi-arid areas of Western India [22,60,62]. The setup of temporary agricultural plots and semisedentary husbandry were other well-known traditions in the Indus basin nineteenth century. The role played by semi-nomadic pastoralism in the pre-colonial Sindh [43] and Punjab [3] could be read in terms of that perspective. In contrast, the colonial administration promoted permanent forms of agriculture and settlement [43].
How different societies combined these strategies through time is a significant factor in the processes of formation of the archaeological record and in the interpretation of settlement patterns. The historical moment that defined both the 1909 flood episode and the historical documentation related is characterised by the European Imperialism, in its British version in the case of the Indian subcontinent. The role of the colonial authorities is prominent in the available documentation and the actions and interests of other local and regional actors are much less documented. Special local contributions for the embankments are mentioned in the Times of India Illustrated [44] and the active destruction of new embankments by local farmers is reported in other areas of British India and there were claims that it happened as well in DG Khan [43,45], but the complexity of the local social and economic interests and conflicts are largely ignored in the documentation or presented exclusively from the British colonial authorities point of view. There is already a significant research on how strategies related to hydrological dynamics shaped the colonial Punjabi landscape between 1842 and 1947, its role in the larger context of the Indian subcontinent and its impact until the present [3,4,43]. Much less research is available for previous periods, a necessary step to understand the long-term dynamics that shaped the Indus basin landscape.
Supplementary Materials
For access the code used for the analysis of Multispectral satellite imagery follow this link: https://github.com/wamstrin/Orengo_Petrie_2017_RS/blob/patch-1/version_Garcia_etal_geosciences. For access the code used to create the Multi-Scale Relief Model (MSRM) follow this link: https://github.com/wamstrin/Orengo_Petrie_2018_MSRM/blob/patch-1/version_Garcia_etal_geosciences.
Author Contributions
Conceptualization, A.G.; methodology, A.G. & H.A.O.; software, A.G., H.A.O. & F.C.C.; formal analysis, A.G.; investigation, A.G.; resources, A.G., H.A.O., F.C.C., A.S.G., C.A.P.; data curation, A.G.; writing—original draft preparation, A.G.; writing—review and editing, A.G., H.A.O., F.C.C., A.S.G. & C.A.P.; visualization, A.G.; supervision, H.A.O., C.A.P.; project administration, A.G.; funding acquisition, A.G.
Funding
WaMStrIn project (A.G.) has received funding from the European Union’s Horizon 2020 research and innovation programme under the Marie Skłodowska-Curie grant agreement No. 746446. The TwoRains project (H.A.O., A.S.G. & C.A.P) has been primarily funded by the European Research Council under the European Union’s Horizon 2020 research and innovation program (grant agreement no. 648609), but has also received support from DST/UKIERI, the British Academy and the McDonald Institute for Archaeological Research. The Marginscapes project (F.C.C.) has been funded by the European Union’s Horizon 2020 Research and Innovation programme under the Marie Sklodowska-Curie grant agreement No. 794711. HAO work has been funded by the Ramón y Cajal program, Spanish Ministry of Science, Innovation and Universities.
Acknowledgments
The authors would like to thank the heads of the Department of AIHC and Archaeology at Banaras Hindu University and the Department of Archaeology at the University of Cambridge who have provided their support to the TwoRains, WaMStrIn and Marginscapes projects. We would especially like to thank the staff of the Map Room and Imaging Services at the University Library at the University of Cambridge for providing access to and high-resolution copies of the Survey of India 1” to 1-mile maps in their collection.
Conflicts of Interest
The authors declare no conflict of interest.
References
- Meadows, A.; Meadows, P. (Eds.) The Indus River: Biodiversity, Resources, Humankind; OUP Pakistan: Karachi, Pakistan, 1999; ISBN 978-0-19-577905-9. [Google Scholar]
- Dong, S.; Bandyopadhyay, J.; Chaturvedi, S. Environmental Sustainability from the Himalayas to the Oceans: Struggles and Innovations in China and India; Springer: Cham, Switzerland, 2017. [Google Scholar]
- Agnihotri, I. Ecology, land use and colonisation: The canal colonies of Punjab. Indian Econ. Soc. Hist. Rev. 1996, 33, 37–58. [Google Scholar] [CrossRef]
- Hill, C.V. River of Sorrow: Environment and Social Control in Riparian North India, 1770–1994/Christopher V. Hill; Association for Asian Studies: Ann Arbor, MI, USA, 1997. [Google Scholar]
- Schuldenrein, J.; Wright, R.P.; Mughal, M.R.; Khan, M.A. Landscapes, soils, and mound histories of the Upper Indus Valley, Pakistan: New insights on the Holocene environments near ancient Harappa. J. Archaeol. Sci. 2004, 31, 777–797. [Google Scholar] [CrossRef]
- Jansen, M.; Mulloy, M.; Urban, G. Forgotten Cities on the Indus: Early Civilization in Pakistan from the 8th to the 2nd Millennium BC; Verlag Philipp von Zabern: Mainz, Germany, 1991. [Google Scholar]
- Mughal, M.R. A Preliminary Review of Archaeological Surveys in Punjab and Sindh: 1993–95. South Asian Stud. 1997, 13, 241–249. [Google Scholar] [CrossRef]
- Crawford, O.G.S. A Century of Air-photography. Antiquity 1954, 28, 206–210. [Google Scholar] [CrossRef]
- Orengo, H.A.; Knappett, C. Toward a Definition of Minoan Agro-Pastoral Landscapes: Results of the Survey at Palaikastro (Crete). Am. J. Archaeol. 2018, 122, 479. [Google Scholar] [CrossRef]
- Menze, B.H.; Ur, J.A.; Sherratt, A.G. Detection of Ancient Settlement Mounds: Archaeological Survey Based on the SRTM Terrain Model. Photogramm. Eng. Remote Sens. 2006, 72, 321–327. [Google Scholar] [CrossRef]
- Chase, A.F.; Chase, D.Z.; Weishampel, J.F.; Drake, J.B.; Shrestha, R.L.; Slatton, K.C.; Awe, J.J.; Carter, W.E. Airborne LiDAR, archaeology, and the ancient Maya landscape at Caracol, Belize. J. Archaeol. Sci. 2011, 38, 387–398. [Google Scholar] [CrossRef]
- Evans, D.H.; Fletcher, R.J.; Pottier, C.; Chevance, J.-B.; Soutif, D.; Tan, B.S.; Im, S.; Ea, D.; Tin, T.; Kim, S.; et al. Uncovering archaeological landscapes at Angkor using lidar. Proc. Natl. Acad. Sci. USA 2013, 110, 12595–12600. [Google Scholar] [CrossRef]
- Pournelle, J.R. Marshland of Cities: Deltaic Landscapes and the Evolution of Early Mesopotamian Civilization; University of California: San Diego, CA, USA, 2003. [Google Scholar]
- Hritz, C. Tracing Settlement Patterns and Channel Systems in Southern Mesopotamia Using Remote Sensing. J. Field Archaeol. 2010, 35, 184–203. [Google Scholar] [CrossRef]
- Orengo, H.A.; Krahtopoulou, A.; Garcia-Molsosa, A.; Palaiochoritis, K.; Stamati, A. Photogrammetric re-discovery of the hidden long-term landscapes of western Thessaly, central Greece. J. Archaeol. Sci. 2015, 64, 100–109. [Google Scholar] [CrossRef]
- Yashpal, S.B.; Sood, R.K.; Agarwal, D.P. Remote sensing of the lost Saraswati river. Proce. Indian Acad. Sci. (Earth Planet. Sci.) 1980, 89, 317–337. [Google Scholar]
- Ramasamy, S.M.; Bakliwal, P.C.; Verma, R.P. Remote sensing and river migration in Western India. Int. J. Remote Sens. 1991, 12, 2597–2609. [Google Scholar] [CrossRef]
- Gupta, A.K.; Sharma, J.R.; Sreenivasan, G. Using satellite imagery to reveal the course of an extinct river below the Thar Desert in the Indo-Pak region. Int. J. Remote Sens. 2011, 32, 5197–5216. [Google Scholar] [CrossRef]
- Rajani, M.B.; Rajawat, A.S. Potential of satellite based sensors for studying distribution of archaeological sites along palaeo channels: Harappan sites a case study. J. Archaeol. Sci. 2011, 38, 2010–2016. [Google Scholar] [CrossRef]
- Dave, A.K.; Courty, M.-A.; Fitzsimmons, K.E.; Singhvi, A.K. Revisiting the contemporaneity of a mighty river and the Harappans: Archaeological, stratigraphic and chronometric constraints. Quat. Geochronol. 2019, 49, 230–235. [Google Scholar] [CrossRef]
- Balbo, A.L.; Rondelli, B.; Cecília Conesa, F.; Lancelotti, C.; Madella, M.; Ajithprasad, P. Contributions of geoarchaeology and remote sensing to the study of Holocene hunter–gatherer and agro-pastoral groups in arid margins: The case of North Gujarat (Northwest India). Quat. Int. 2013, 308–309, 53–65. [Google Scholar] [CrossRef]
- Conesa, F.C.; Madella, M.; Galiatsatos, N.; Balbo, A.L.; Rajesh, S.V.; Ajithprasad, P. CORONA Photographs in Monsoonal Semi-arid Environments: Addressing Archaeological Surveys and Historic Landscape Dynamics over North Gujarat, India. Archaeol. Prospect. 2015, 22, 75–90. [Google Scholar] [CrossRef]
- Giosan, L.; Clift, P.D.; Macklin, M.G.; Fuller, D.Q.; Constantinescu, S.; Durcan, J.A.; Stevens, T.; Duller, G.A.T.; Tabrez, A.R.; Gangal, K.; et al. Fluvial landscapes of the Harappan civilization. Proc. Natl. Acad. Sci. USA 2012, 109, E1688–E1694. [Google Scholar] [CrossRef]
- Wright, R.; Hritz, C. Satellite Remote Sensing Imagery: New Evidence for Sites and Ecologies in the Upper Indus. In South Asian Archaeology 2007; BAR International Series: Oxford, UK, 2013; pp. 315–321. [Google Scholar]
- Orengo, H.A.; Petrie, C.A. Large-Scale, Multi-Temporal Remote Sensing of Palaeo-River Networks: A Case Study from Northwest India and its Implications for the Indus Civilisation. Remote Sens. 2017, 9, 735. [Google Scholar] [CrossRef]
- Orengo, H.A.; Petrie, C.A. Multi-scale relief model (MSRM): A new algorithm for the visualization of subtle topographic change of variable size in digital elevation models. Earth Surf. Process. Landf. 2018, 43, 1361–1369. [Google Scholar] [CrossRef]
- Singh, R.N.; Green, A.S.; Ranjan, L.M.; Alam, A.; Petrie, C.A. Between the Hinterlands: Preliminary Results from the TwoRains Survey in Northwest India 2017. Man Environ. 2018, in press. [Google Scholar]
- Petrie, C.A.; Orengo, H.A.; Green, A.S.; Walker, J.S.; Garcia, A.; Conesa, F.C.; Singh, R.N.; Knox, J.R. Mapping archaeology by mapping an empire: Using historical maps to reconstruct ancient settlement landscapes in modern India & Pakistan. Geosciences 2018, in press. [Google Scholar]
- Singh, M. The British Indian Empire: Military Geography and Emergence of New Military Landscapes in Punjab. Shabd–Braham Int. Res. J. Indian Lang. 2017, 5, 32–35. [Google Scholar]
- Akhtar, S. The Historical and Archeological Significance Dera Ghazi Khan District through Ages. Archaeol. Anthropol. Open Access 2018, 2, 4. [Google Scholar] [CrossRef]
- Akhtar, A. Indus Basin Floods: Mechanisms, Impacts, and Management; Asian Development Bank: Mandaluyong City, Philippines, 2013; p. 67. [Google Scholar]
- Webster, P.J.; Toma, V.E.; Kim, H.-M. Were the 2010 Pakistan floods predictable? Geophys. Res. Lett. 2011, 38. [Google Scholar] [CrossRef]
- Gaurav, K.; Sinha, R.; Panda, P.K. The Indus flood of 2010 in Pakistan: A perspective analysis using remote sensing data. Nat. Hazards 2011, 59, 1815. [Google Scholar] [CrossRef]
- Hashmi, H.N.; Siddiqui, Q.T.M.; Ghumman, A.R.; Kamal, M.A. A critical analysis of 2010 floods in Pakistan. Afr. J. Agric. Res. 2012, 7, 1054–1067. [Google Scholar]
- Kirsch, T.D.; Wadhwani, C.; Sauer, L.; Doocy, S.; Catlett, C. Impact of the 2010 Pakistan Floods on Rural and Urban Populations at Six Months. PLoS Curr. 2012, 4. [Google Scholar] [CrossRef]
- Tariq, M.A.U.R.; van de Giesen, N. Floods and flood management in Pakistan. Phys. Chem. Earth Parts A/B/C 2012, 47–48, 11–20. [Google Scholar] [CrossRef]
- Daily Images of the 2010 Flood Episodes Are Available in NASA Worldview Web Service. Available online: https://worldview.earthdata.nasa.gov/?p=geographic&l=MODIS_Terra_CorrectedReflectance_TrueColor,Graticule(hidden),Reference_Labels(hidden),Coastlines(hidden)&t=2018-11-14-T00%3A00%3A00Z&z=3&v=51.000945871291805,5.956715959569404,110.8720396212918,39.14421595956941 (accessed on 14 November 2018).
- See, e.g., The Cartographic Material about Pakistan Collected by the UN Program UNOSAT. Available online: http://www.unitar.org/unosat/maps/PAK (accessed on 14 November 2018).
- Heavy Rains and Dry Lands Don’t Mix: Reflections on the 2010 Pakistan Flood. Available online: https://earthobservatory.nasa.gov/Features/PakistanFloods (accessed on 14 November 2018).
- Amarnath, G.; Rajah, A. An evaluation of flood inundation mapping from MODIS and ALOS satellites for Pakistan. Geomat. Nat. Hazards Risk 2016, 7, 1526–1537. [Google Scholar] [CrossRef]
- Scholberg, H. The District Gazetteers of British India. A Bibliography; Bibliotheca Asiatica; [Poststr. 4]; Inter Documentation: Zug, Switzerland, 1970; Volume 3. [Google Scholar]
- Gazetter of the Dera Ghazi Khan District, 1893–1897; Reprint; Sang-e-Meel Publications: Lahore, Pakistan, 1990.
- Weil, B. The Rivers Come: Colonial Flood Control and Knowledge Systems in the Indus Basin, 1840s–1930s. Environ. History 2006, 12, 3–29. [Google Scholar] [CrossRef]
- Times of India. The Passing of Dera Ghazi Khan; Times of India: Bombay, India, 1910. [Google Scholar]
- Bellasis, E.S. Punjab Rivers and Works; E. & F.N. Spon, Ltd.: London, UK, 1912. [Google Scholar]
- Declassified Satellite Imagery—1 | The Long Term Archive. Available online: https://lta.cr.usgs.gov/declass_1 (accessed on 14 November 2018).
- Casana, J.; Cothren, J. Stereo analysis, DEM extraction and orthorectification of CORONA satellite imagery: Archaeological applications from the Near East. Antiquity 2008, 82, 732–749. [Google Scholar] [CrossRef]
- Scollar, I.; Galiatsatos, N.; Mugnier, C. Mapping from CORONA: Geometric Distortion in KH4 Images. Photogramm. Eng. Remote Sens. 2016, 82, 7–13. [Google Scholar] [CrossRef]
- Masson, C. Narrative of Various Journeys in Balochistan, Afghanistan, and the Panjab: Including a Residence in Those Countries from 1826 to 1838/Charles Masson; Richard Bentley: London, UK, 1842. [Google Scholar]
- Global Surface Water Explorer. Available online: https://global-surface-water.appspot.com/ (accessed on 15 November 2018).
- Pekel, J.-F.; Cottam, A.; Gorelick, N.; Belward, A.S. High-resolution mapping of global surface water and its long-term changes. Nature 2016, 540, 418–422. [Google Scholar] [CrossRef] [PubMed]
- Green, A.S.; Singh, R.N.; Alam, A.; Garcia, A.; Greene, L.M.; Conesa, F.C.; Orengo, H.A.; Ranjan, A.; Petrie, C.A. Re-discovering dynamic ancient landscapes: Archaeological survey of features from historical maps in northwest India and their implications for the large-scale distribution of settlements throughout South Asia. Remote Sens. 2018. in preparation. [Google Scholar]
- Possehl, G.L. Indus Age: The Beginnings; Oxford & IBH Publihing Co.: New Delhi, India, 1999; ISBN 81-204-1296-6. [Google Scholar]
- Centre, U.W.H. Archaeological Ruins at Moenjodaro. Available online: https://whc.unesco.org/en/list/138/ (accessed on 14 November 2018).
- Miller, H.M.-L. Surplus in the indus Civilization. In Surplus: The Politics of Production and the Strategies of Everyday Life; University Press of Colorado: Boulder, CO, USA, 2015; pp. 97–120. [Google Scholar]
- Munir, B.A.; Iqbal, J. Flash flood water management practices in Dera Ghazi Khan City (Pakistan): A remote sensing and GIS prospective. Nat. Hazards 2016, 81, 1303–1321. [Google Scholar] [CrossRef]
- Wright, R.P. The Ancient Indus: Urbanism, Economy, and Society, Case Studies in Early Societies; Cambridge University Press: Cambridge, UK, 2010. [Google Scholar]
- Miller, H.M.-L. Water supply, labor requirements, and land ownership in Indus floodplain agricultural systems. In Agricultural Strategies; The Cotsen Institute of Archaeology Press: Los Angeles, CA, USA, 2006; pp. 92–128. [Google Scholar]
- Jansen, M. Water supply and sewage disposal at Mohenjo-Daro. World Archaeol. 1989, 21, 177–192. [Google Scholar] [CrossRef]
- Petrie, C.A.; Singh, R.N.; Bates, J.; Dixit, Y.; French, C.A.I.; Hodell, D.A.; Jones, P.J.; Lancelotti, C.; Lynam, F.; Neogi, S.; et al. Adaptation to Variable Environments, Resilience to Climate Change: Investigating Land, Water and Settlement in Indus Northwest India. Curr. Anthropol. 2017, 58, 1–30. [Google Scholar] [CrossRef]
- Elphinstone, M. An Account of the Kingdom of Caubul, and Its Dependencies, in Persia, Tartary, and India (1842); Richard Bentley: London, UK, 1842. [Google Scholar]
- Conesa, F.C.; Devanthéry, N.; Balbo, A.L.; Madella, M.; Monserrat, O. Use of Satellite SAR for Understanding Long-Term Human Occupation Dynamics in the Monsoonal Semi-Arid Plains of North Gujarat, India. Remote Sens. 2014, 6, 11420–11443. [Google Scholar] [CrossRef]


© 2018 by the authors. Licensee MDPI, Basel, Switzerland. This article is an open access article distributed under the terms and conditions of the Creative Commons Attribution (CC BY) license (http://creativecommons.org/licenses/by/4.0/).