A Risk-Based Approach to Shelter Resilience following Flood and Typhoon Damage in Rural Philippines


Abstract
1. Introduction
1.1. Background
1.2. Research Aims
2. Methodology
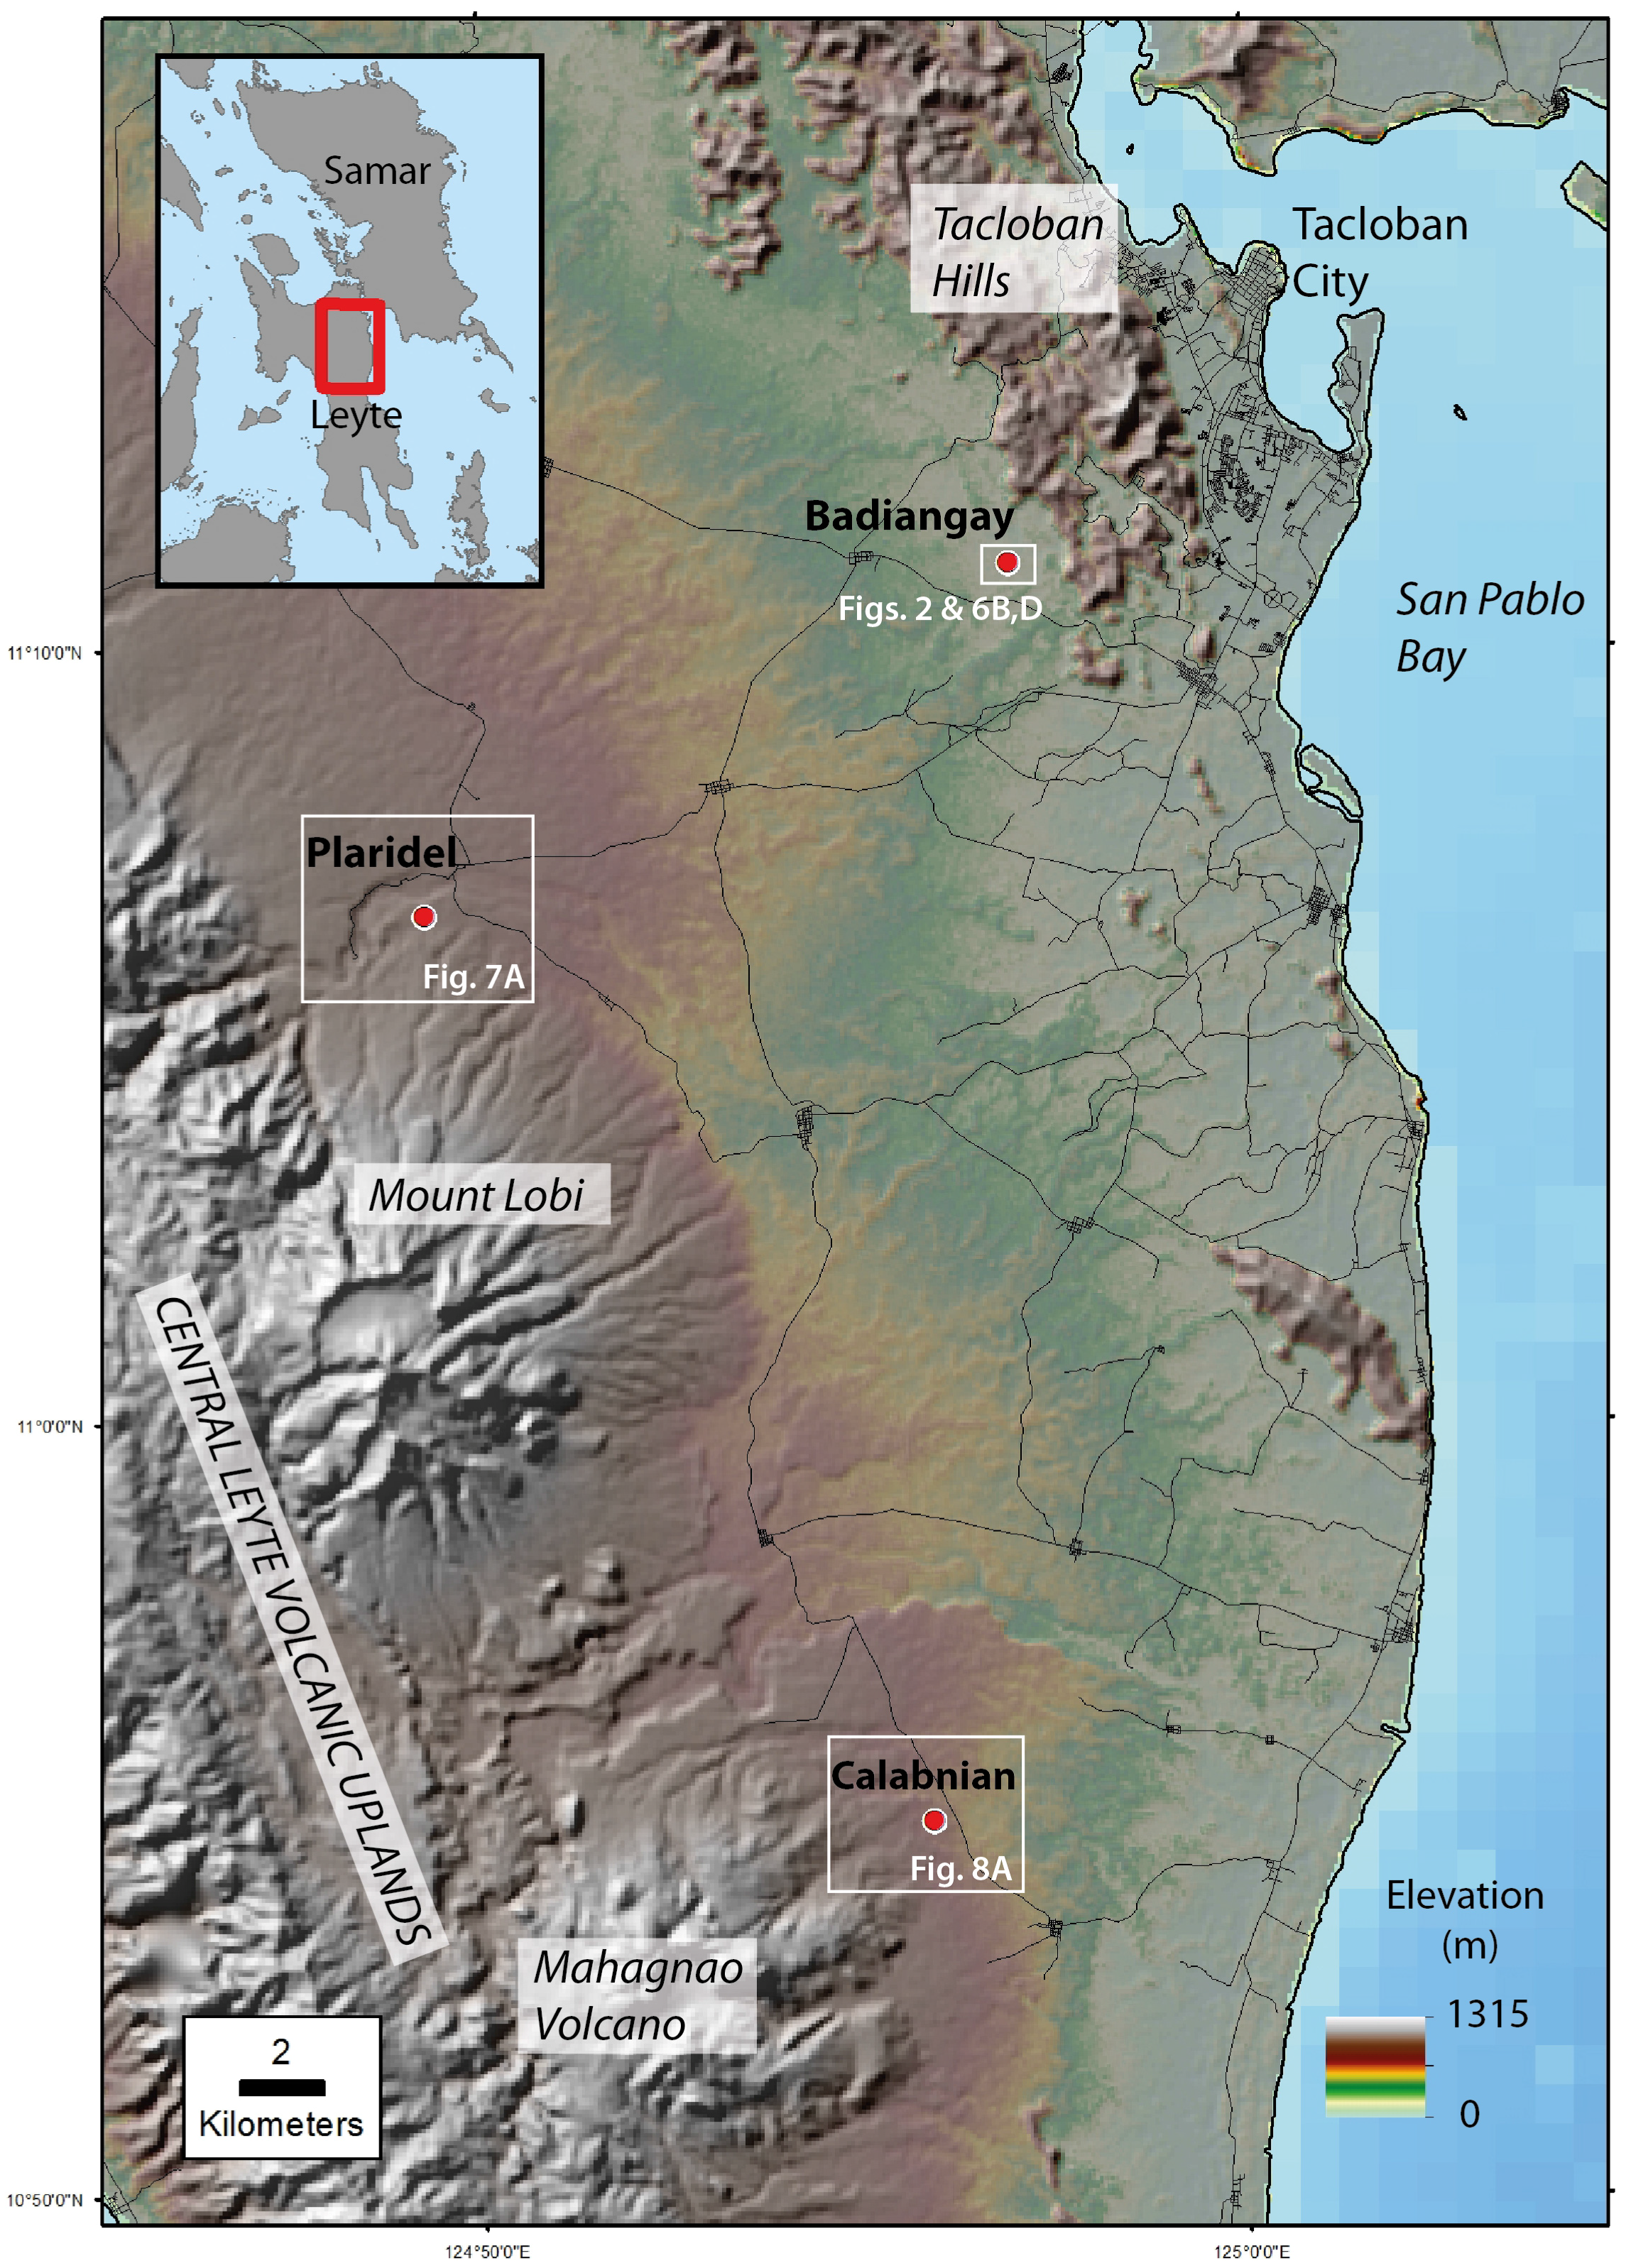
The Case Studies
3. Results
3.1. Profiling the Hazards
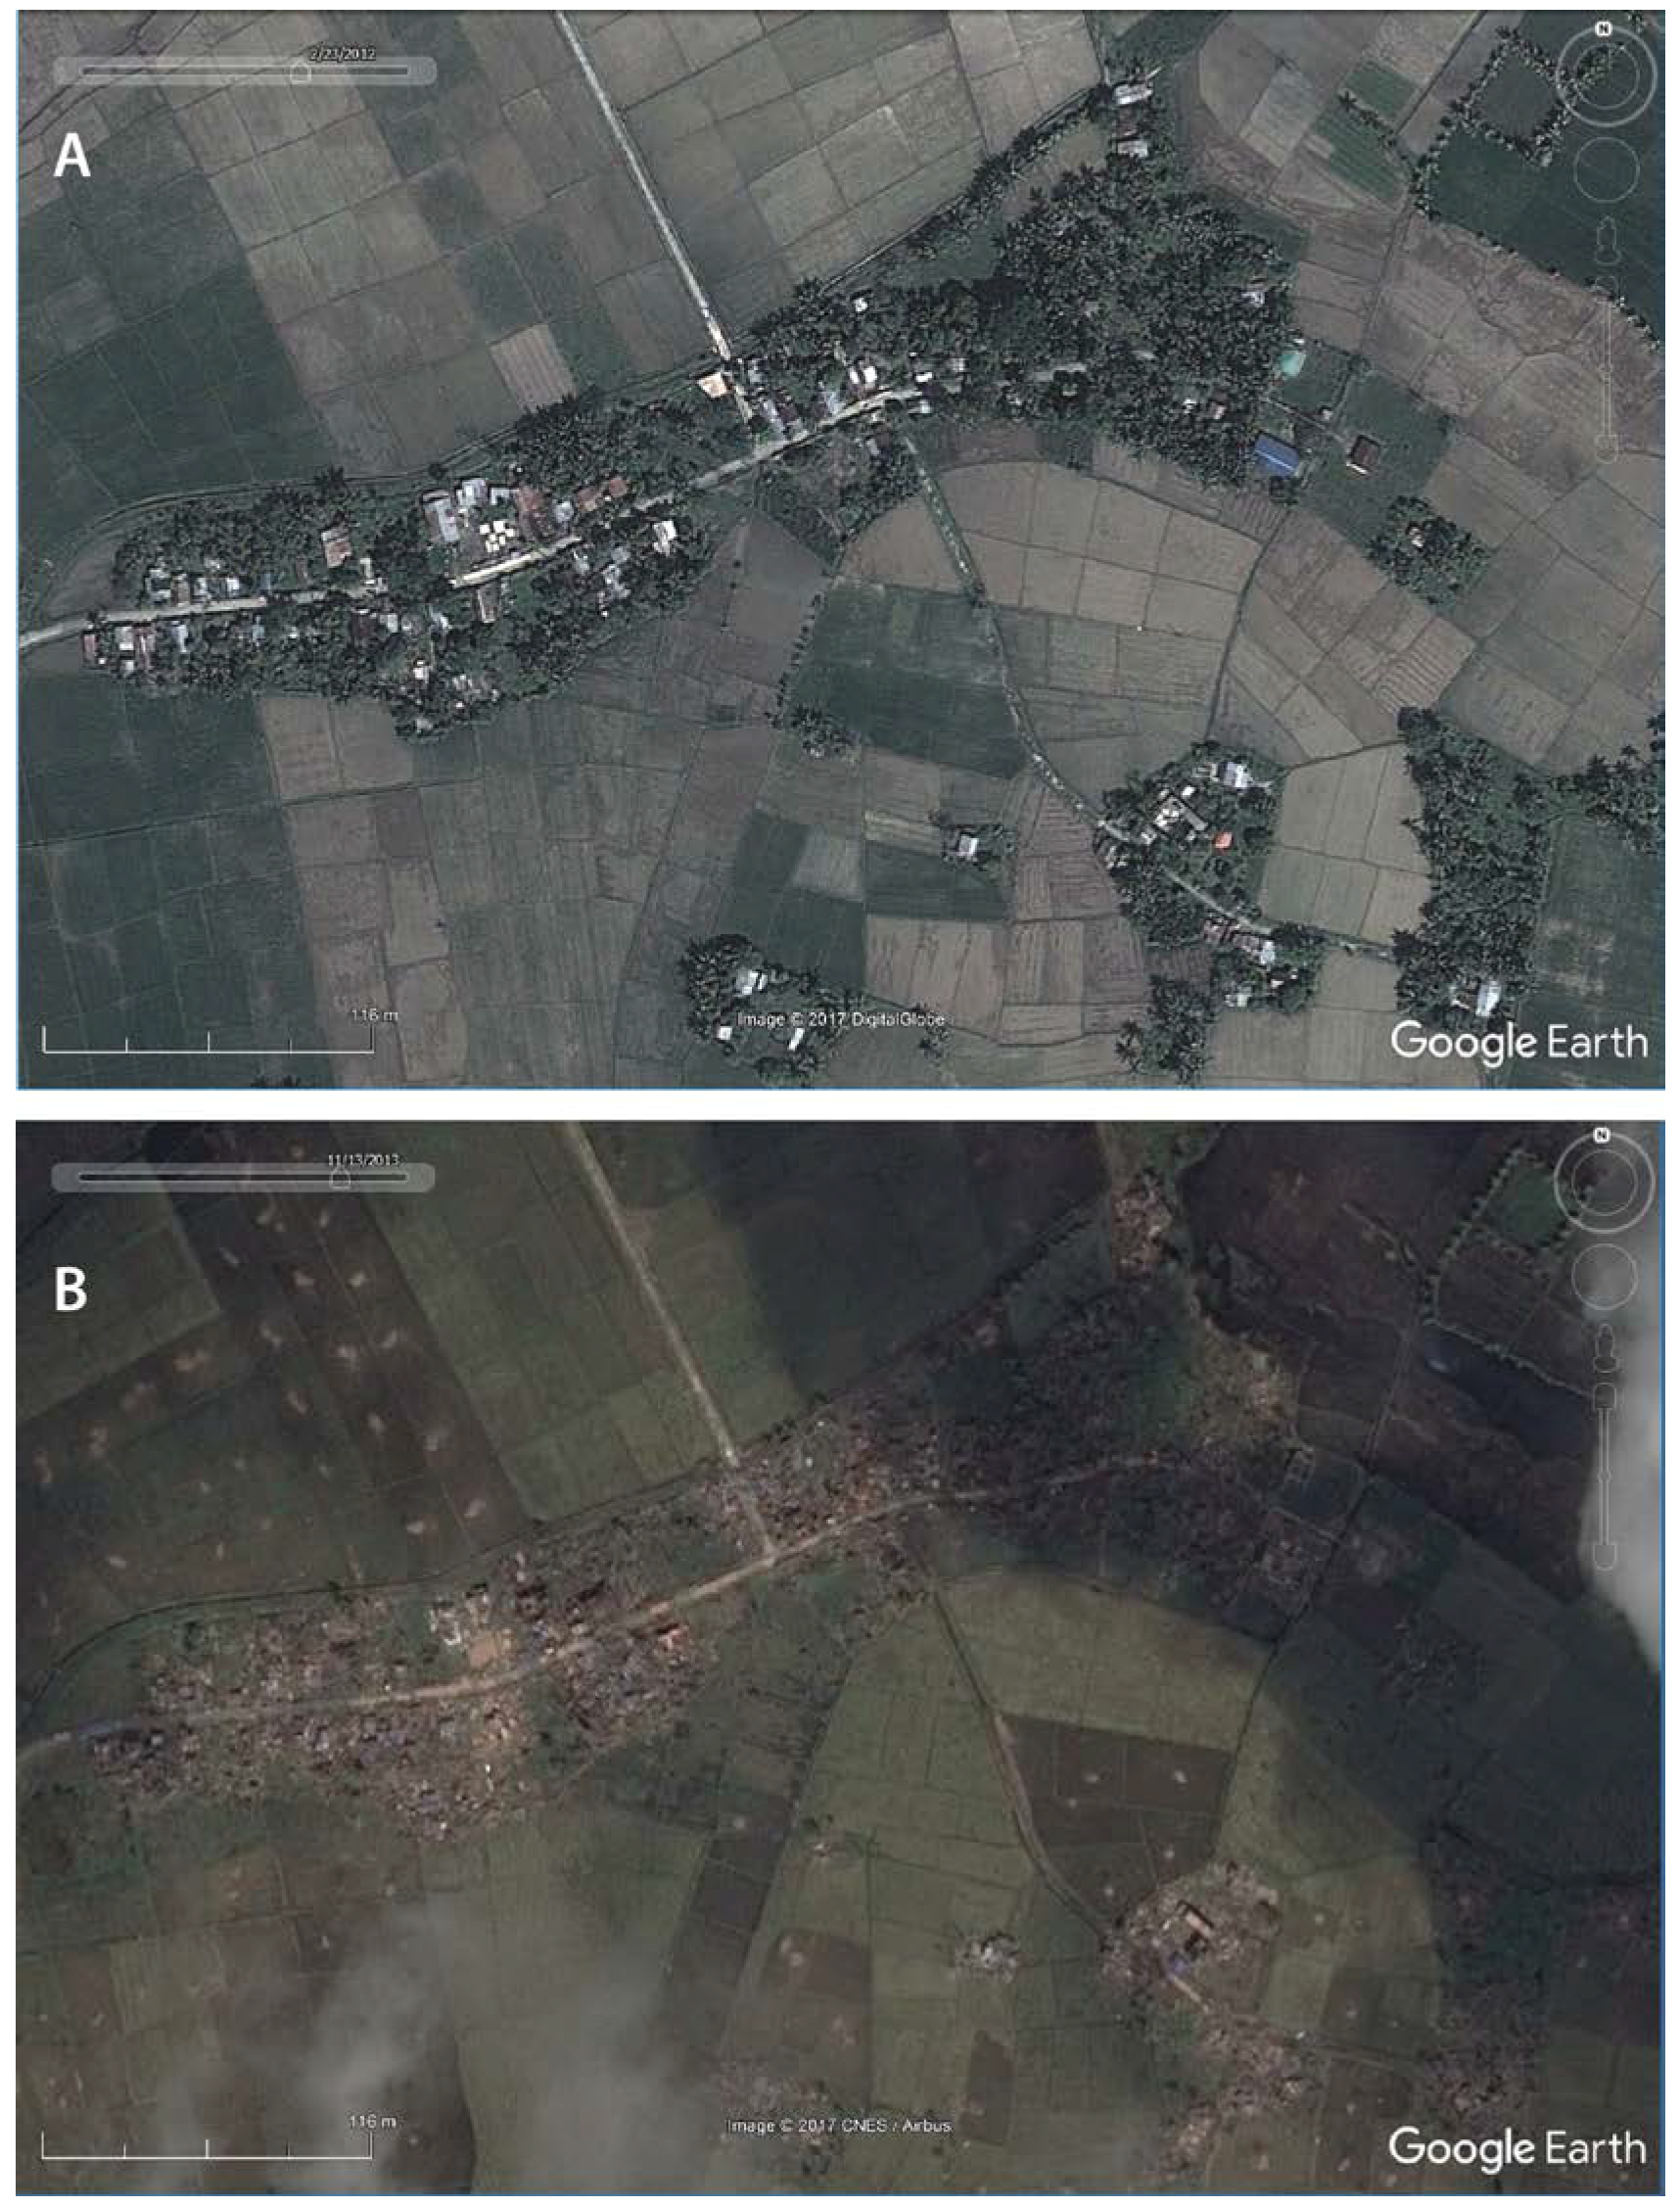
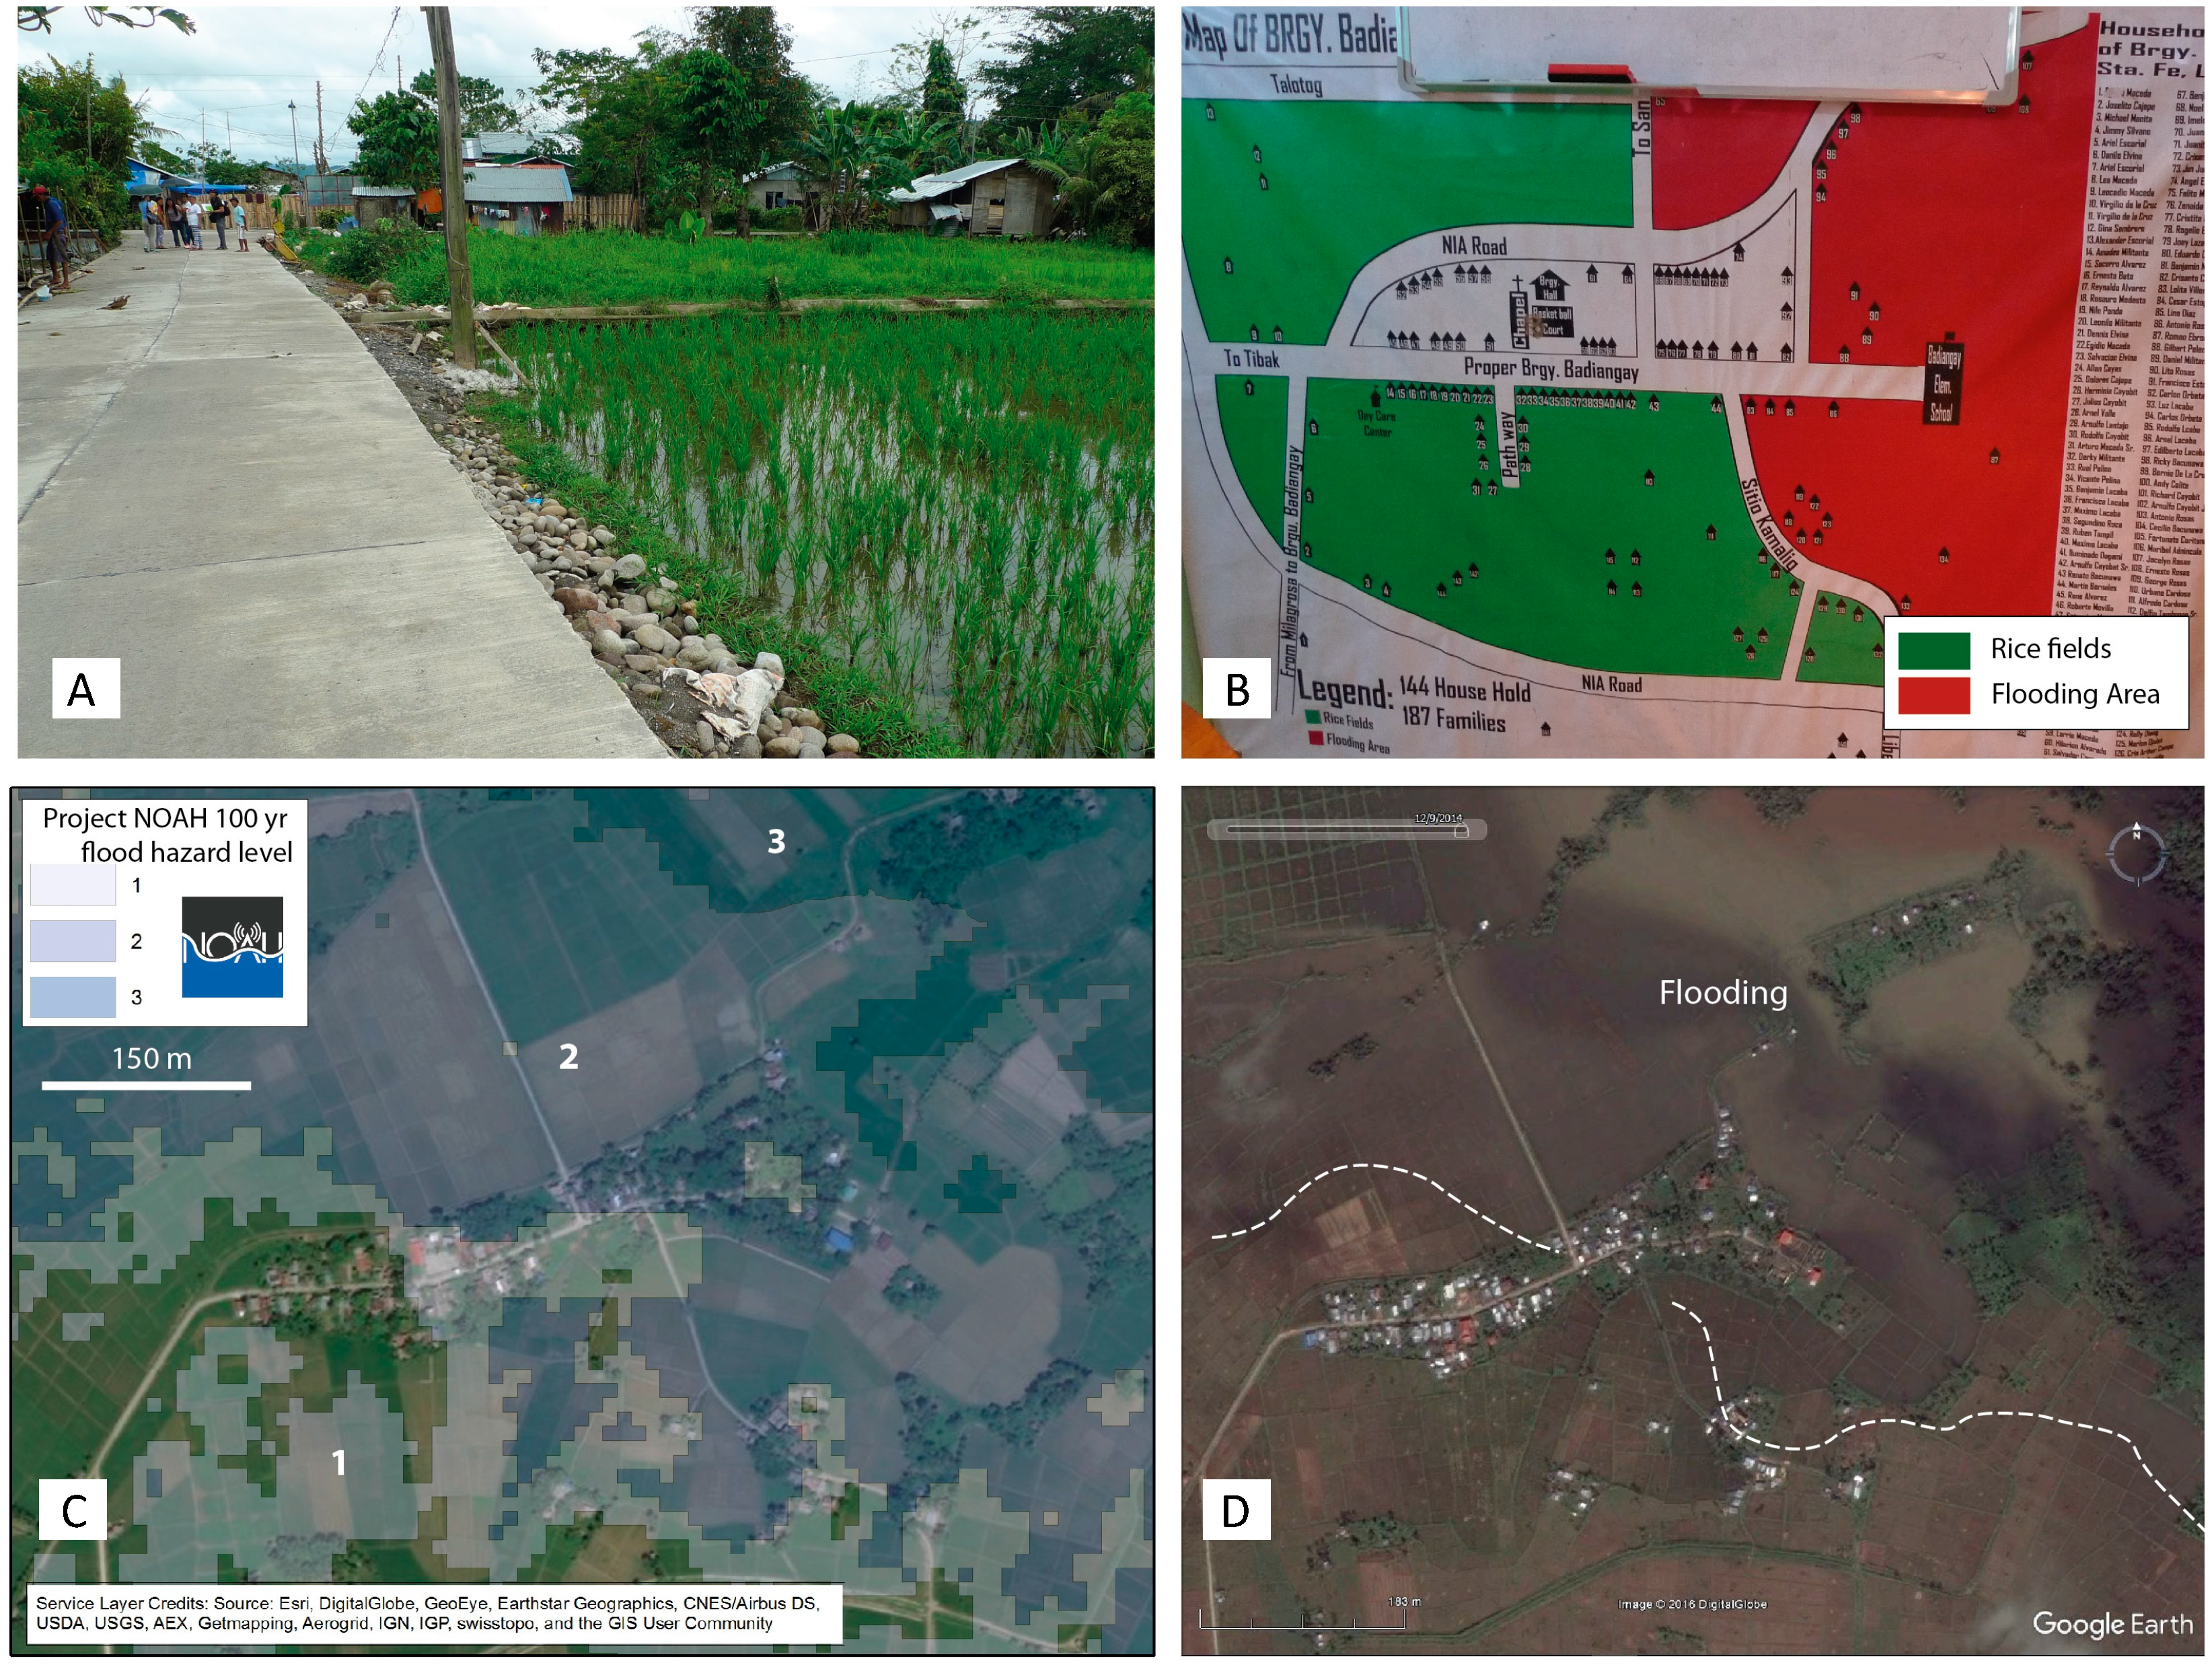
3.1.1. Badiangay
3.1.2. Plaridel
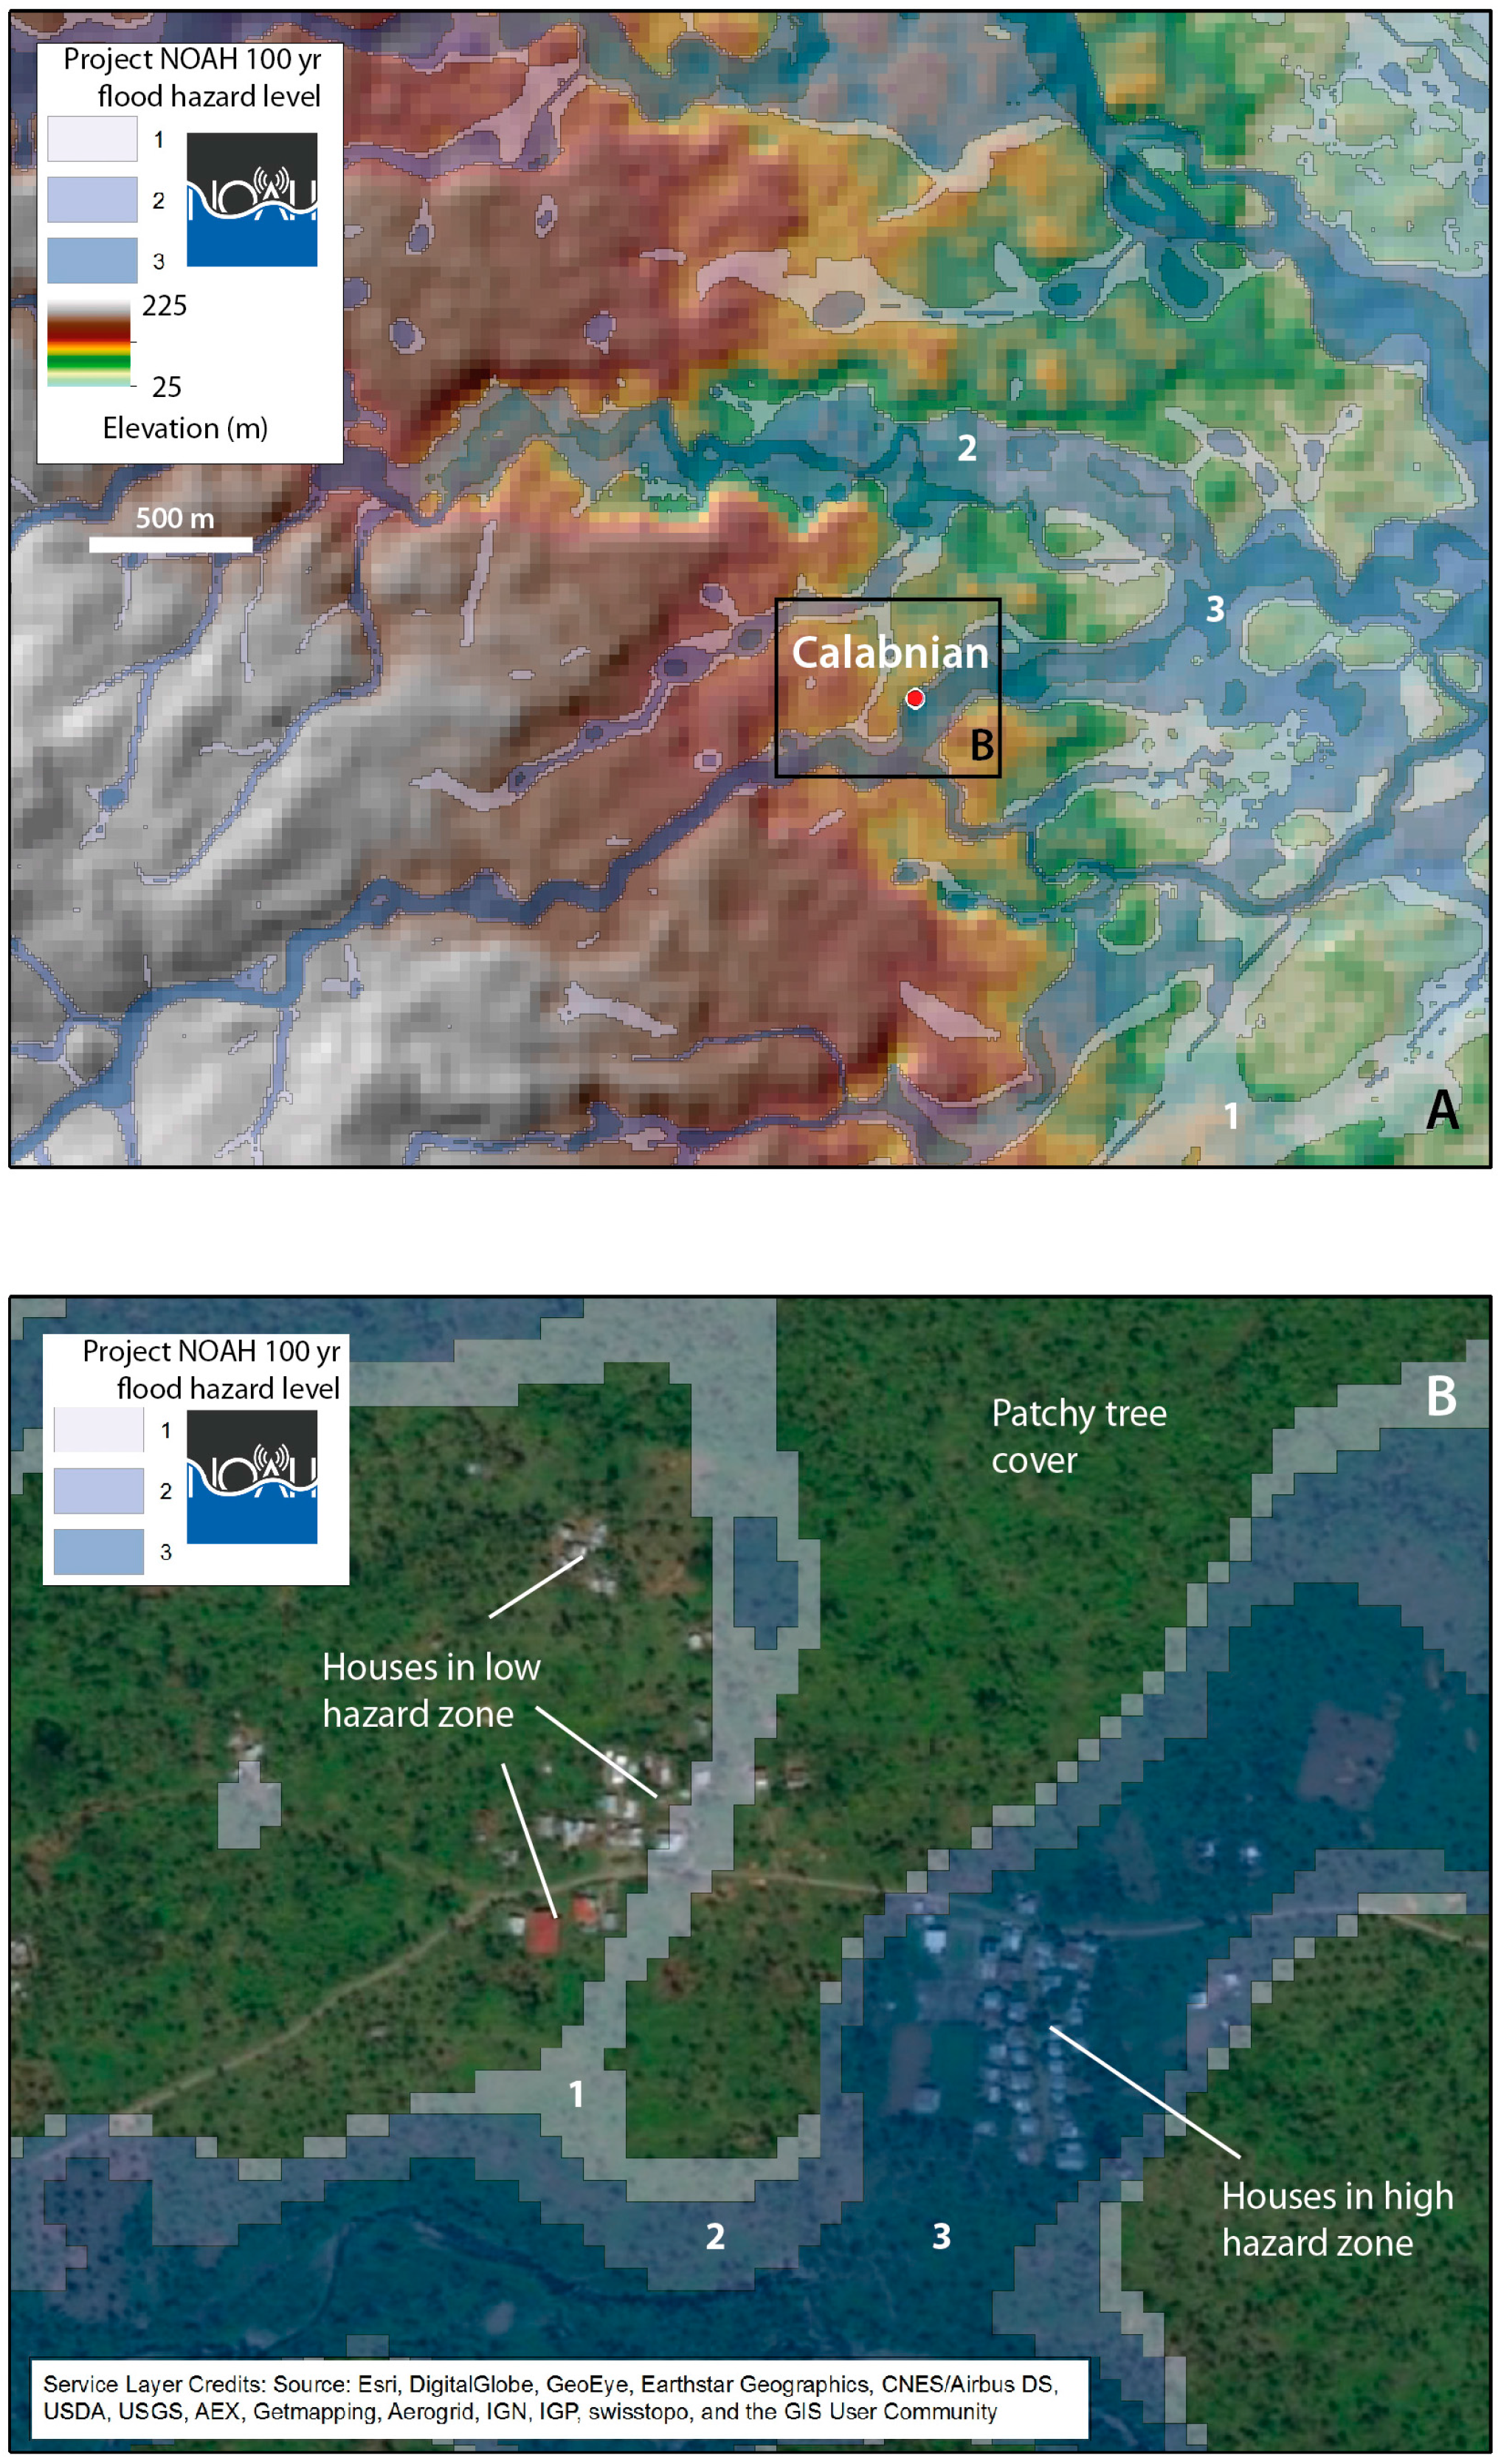
3.1.3. Calabnian
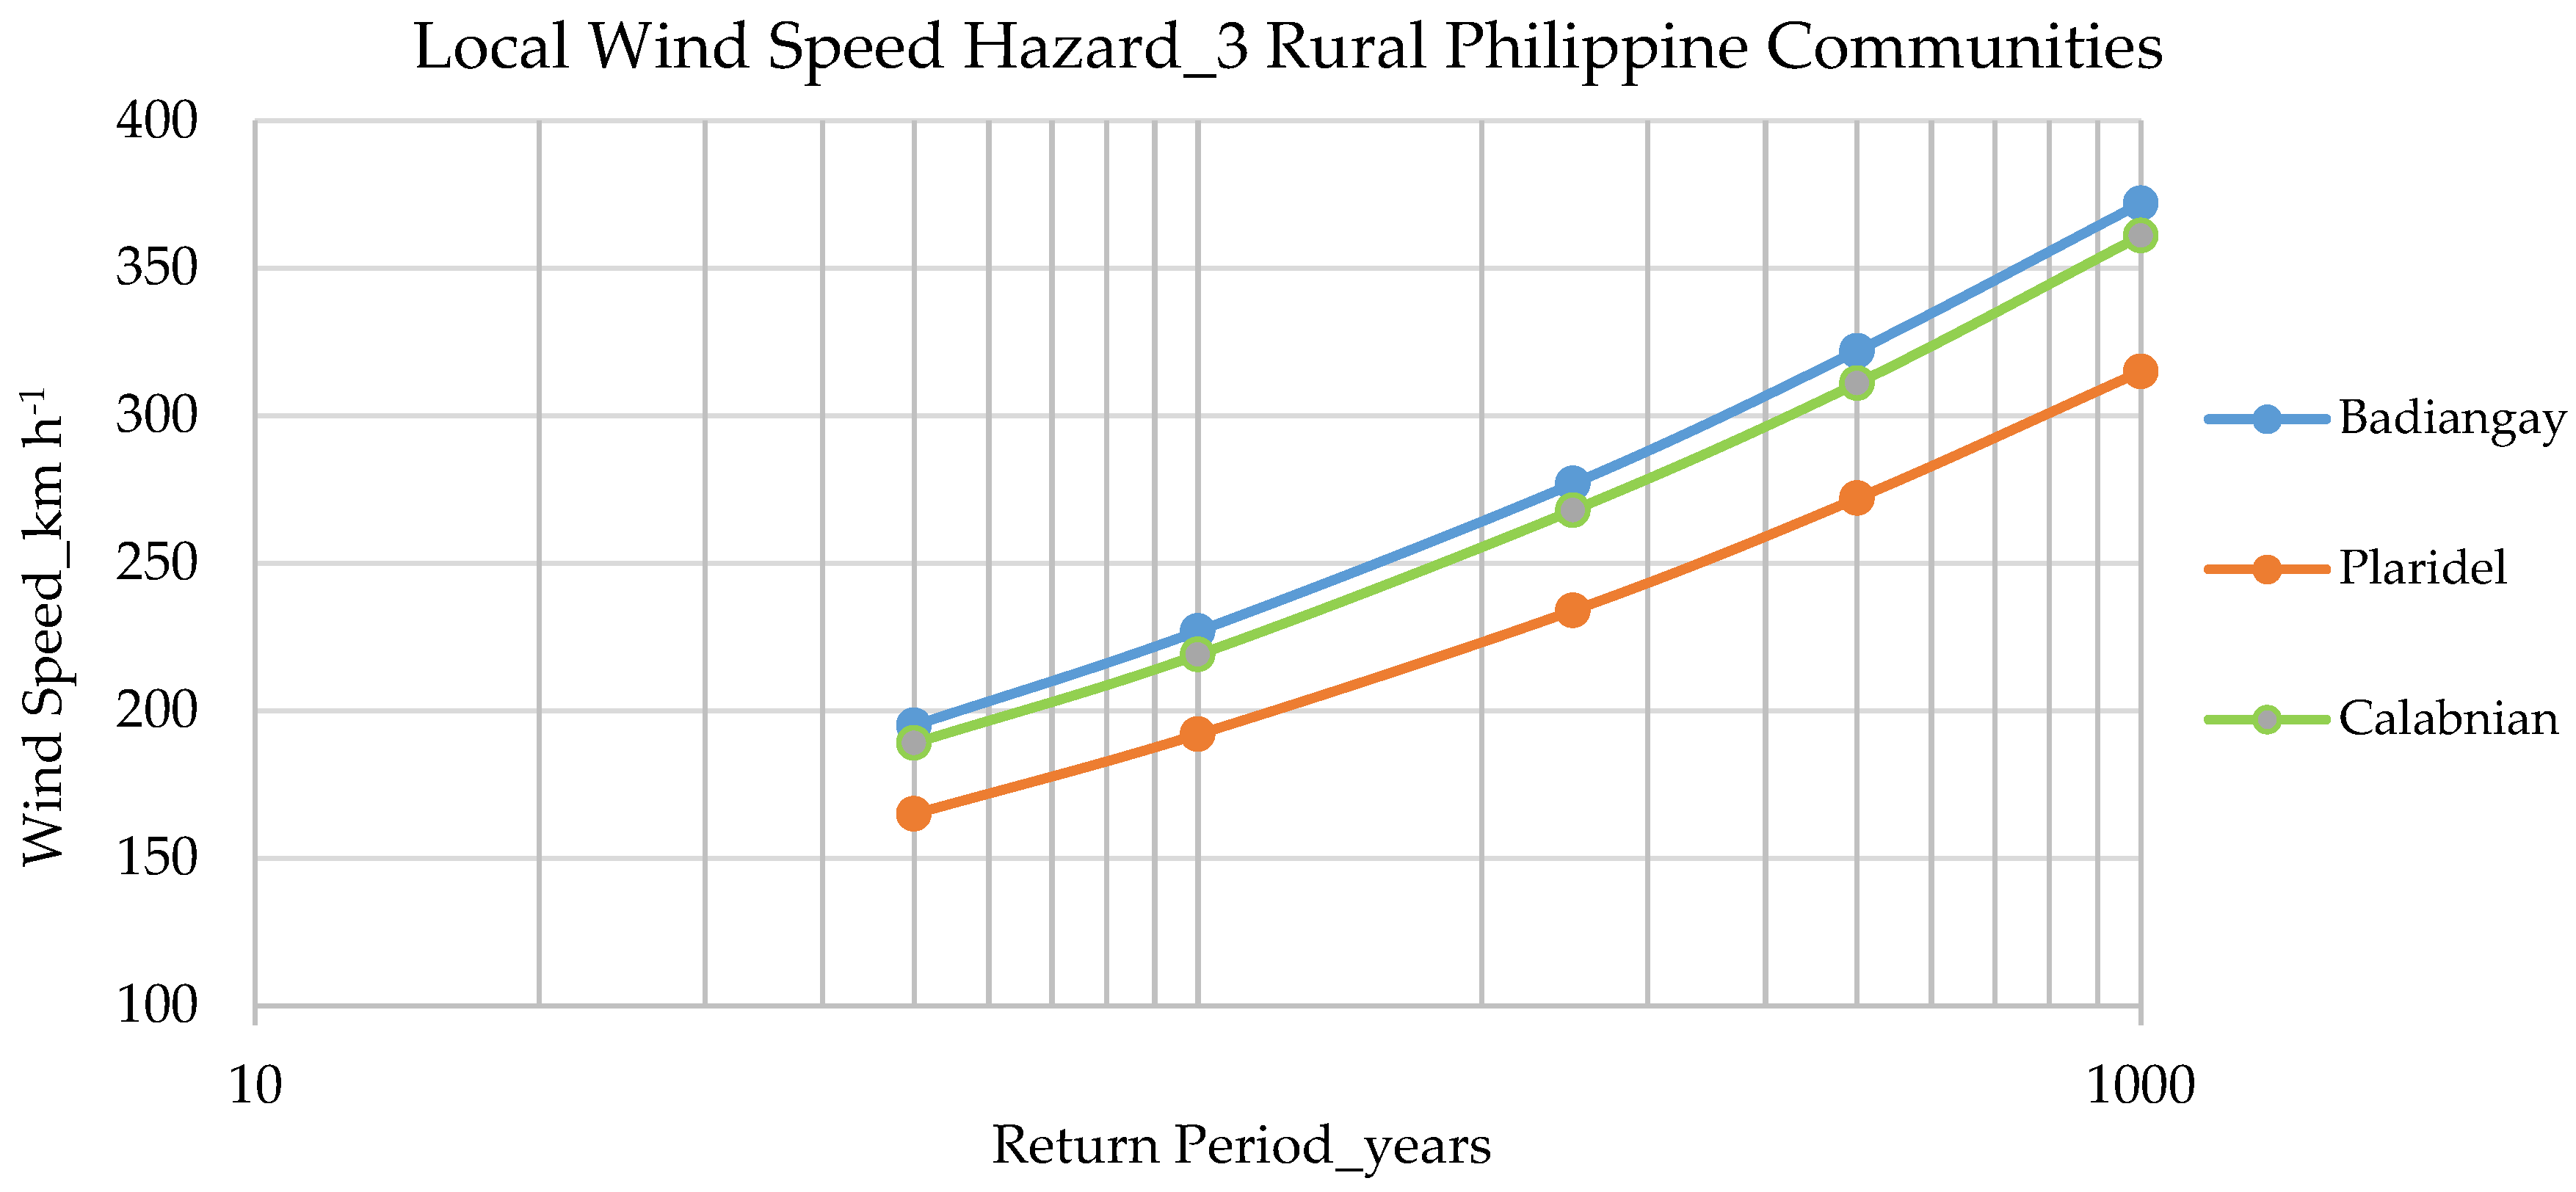
3.1.4. Wind and Flood Hazard: Site Comparison
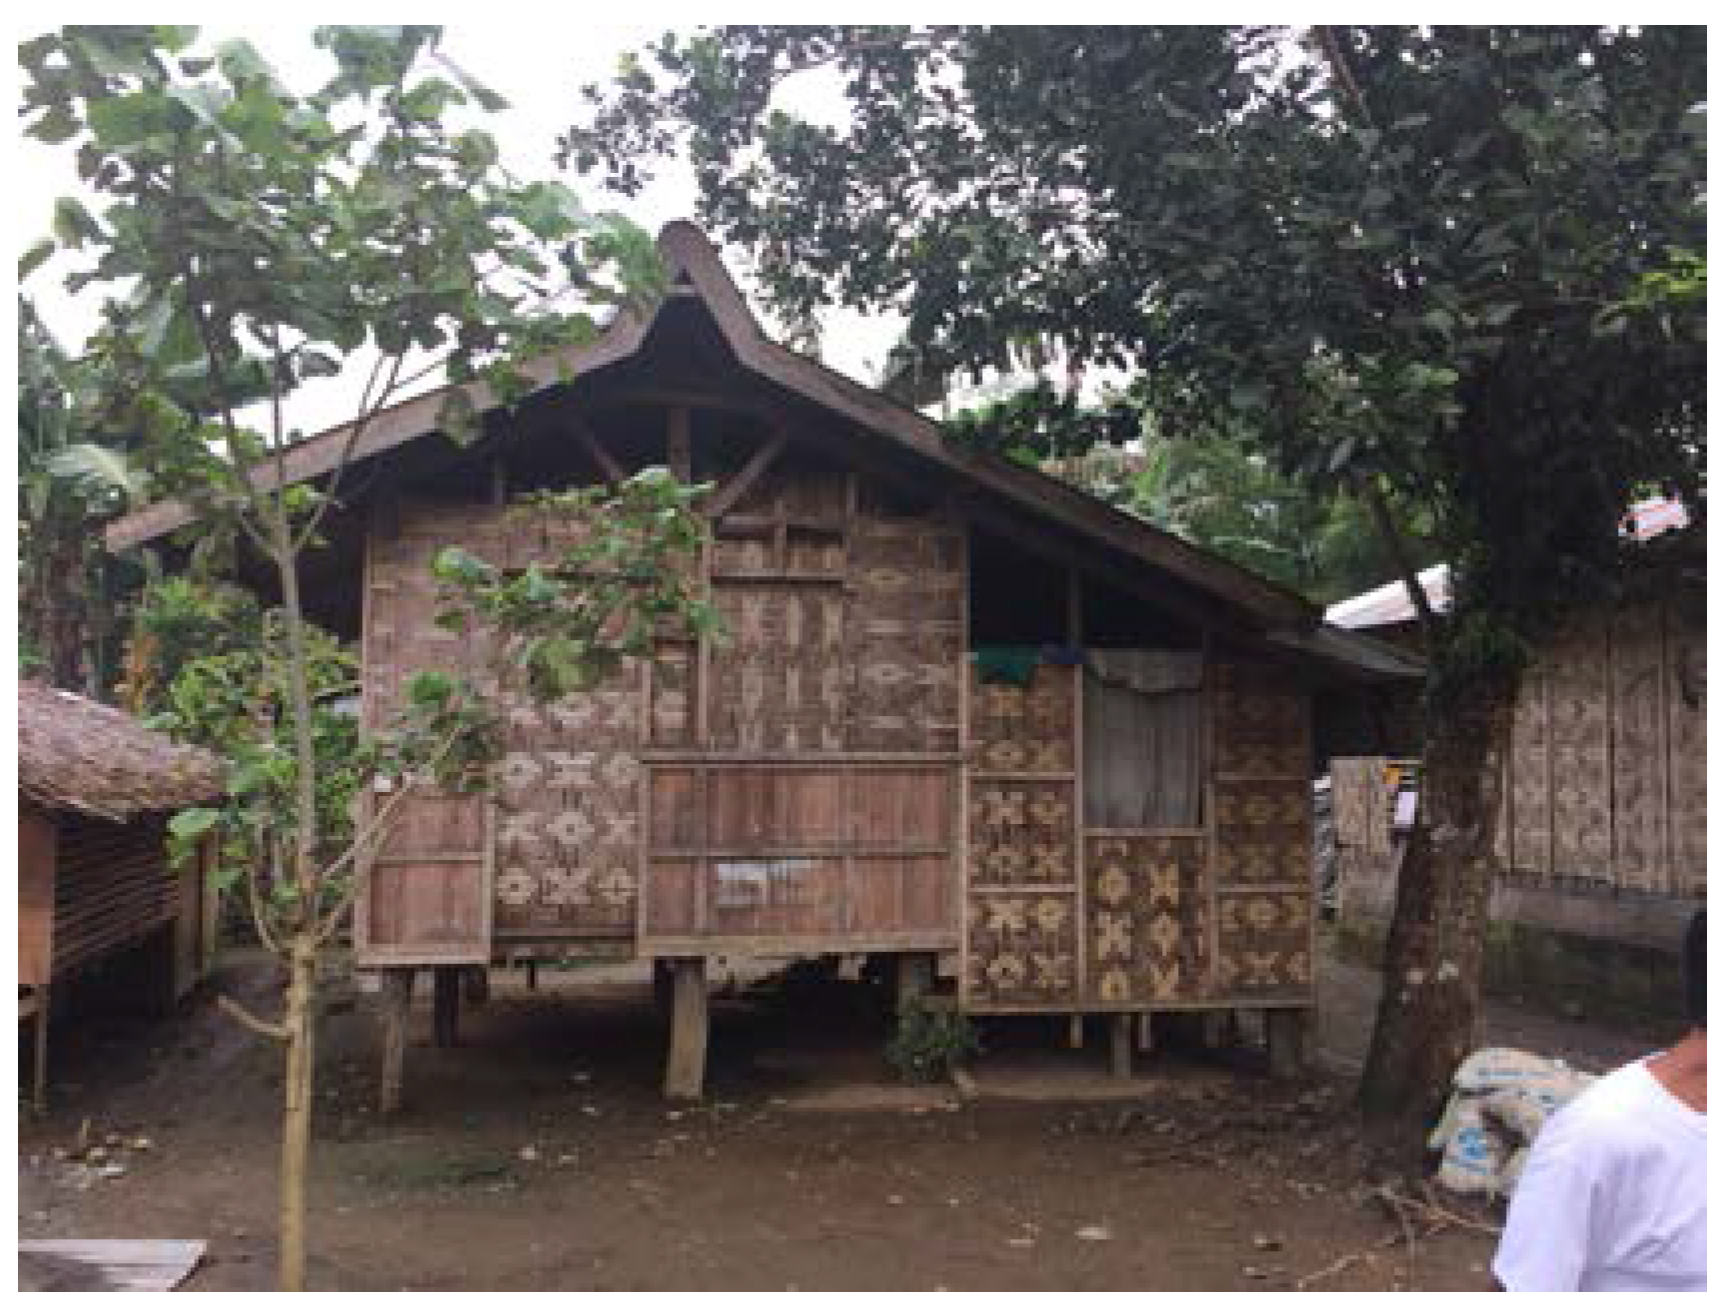
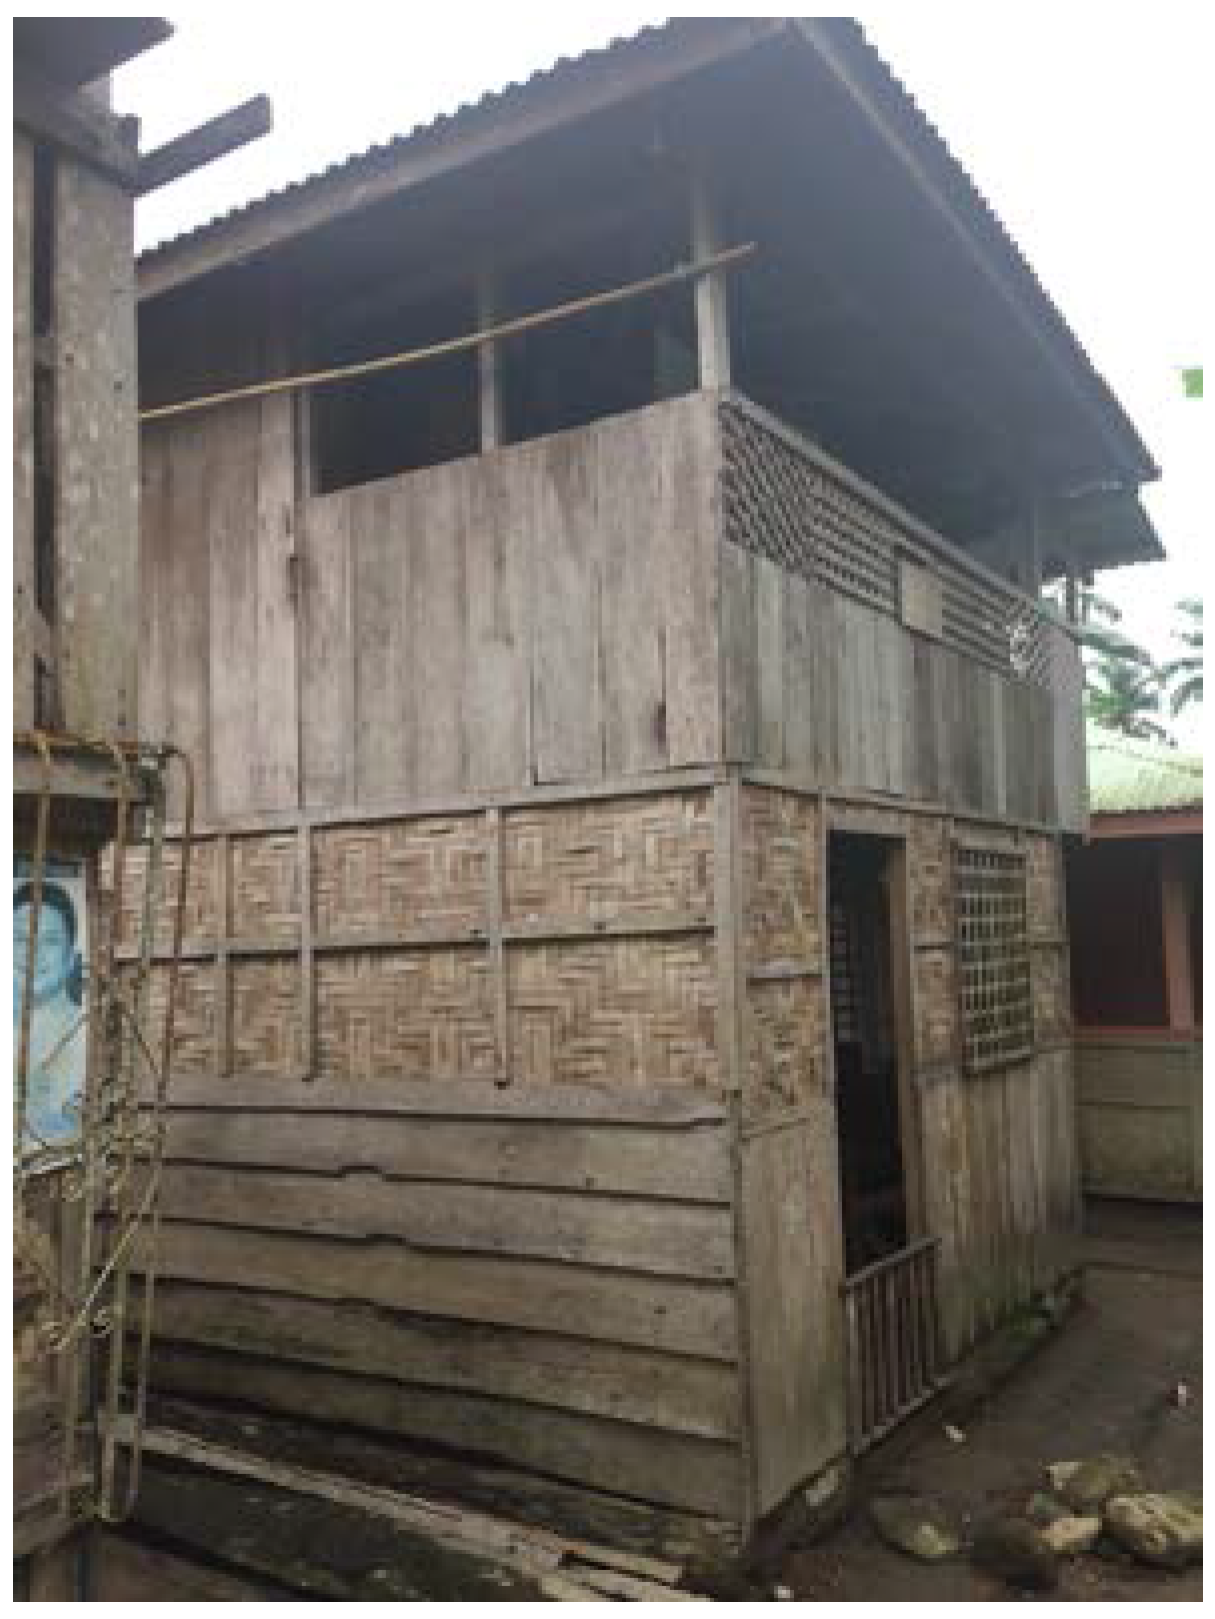
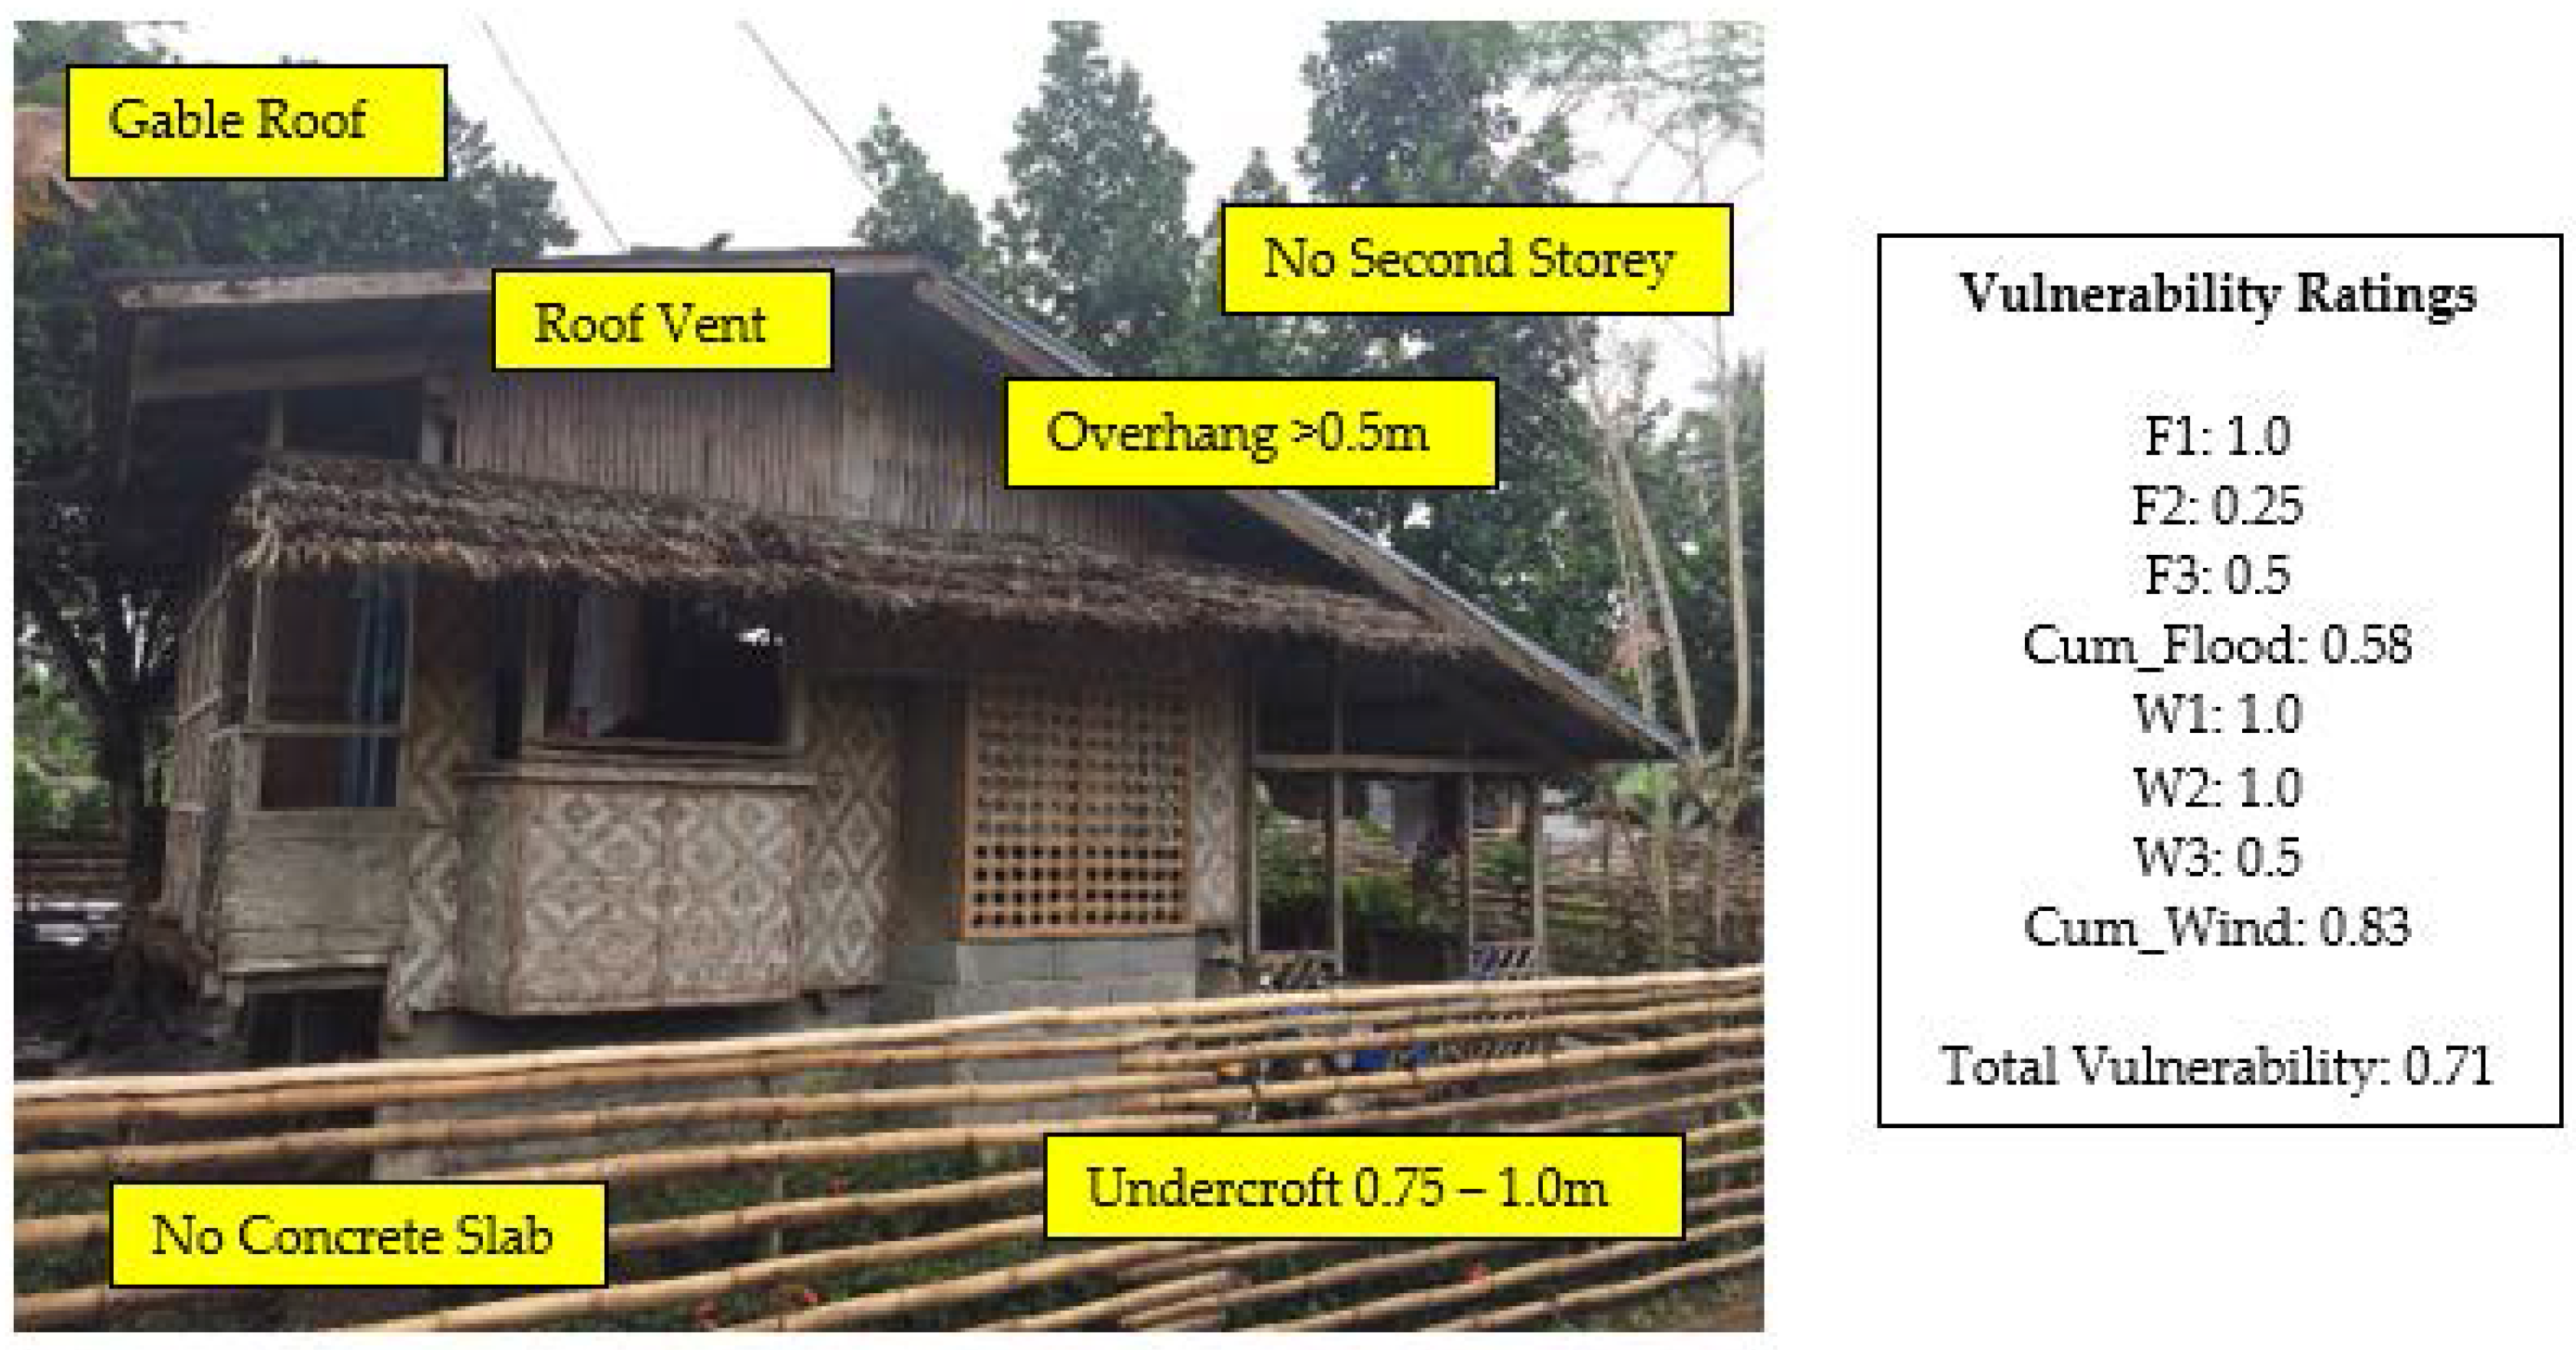
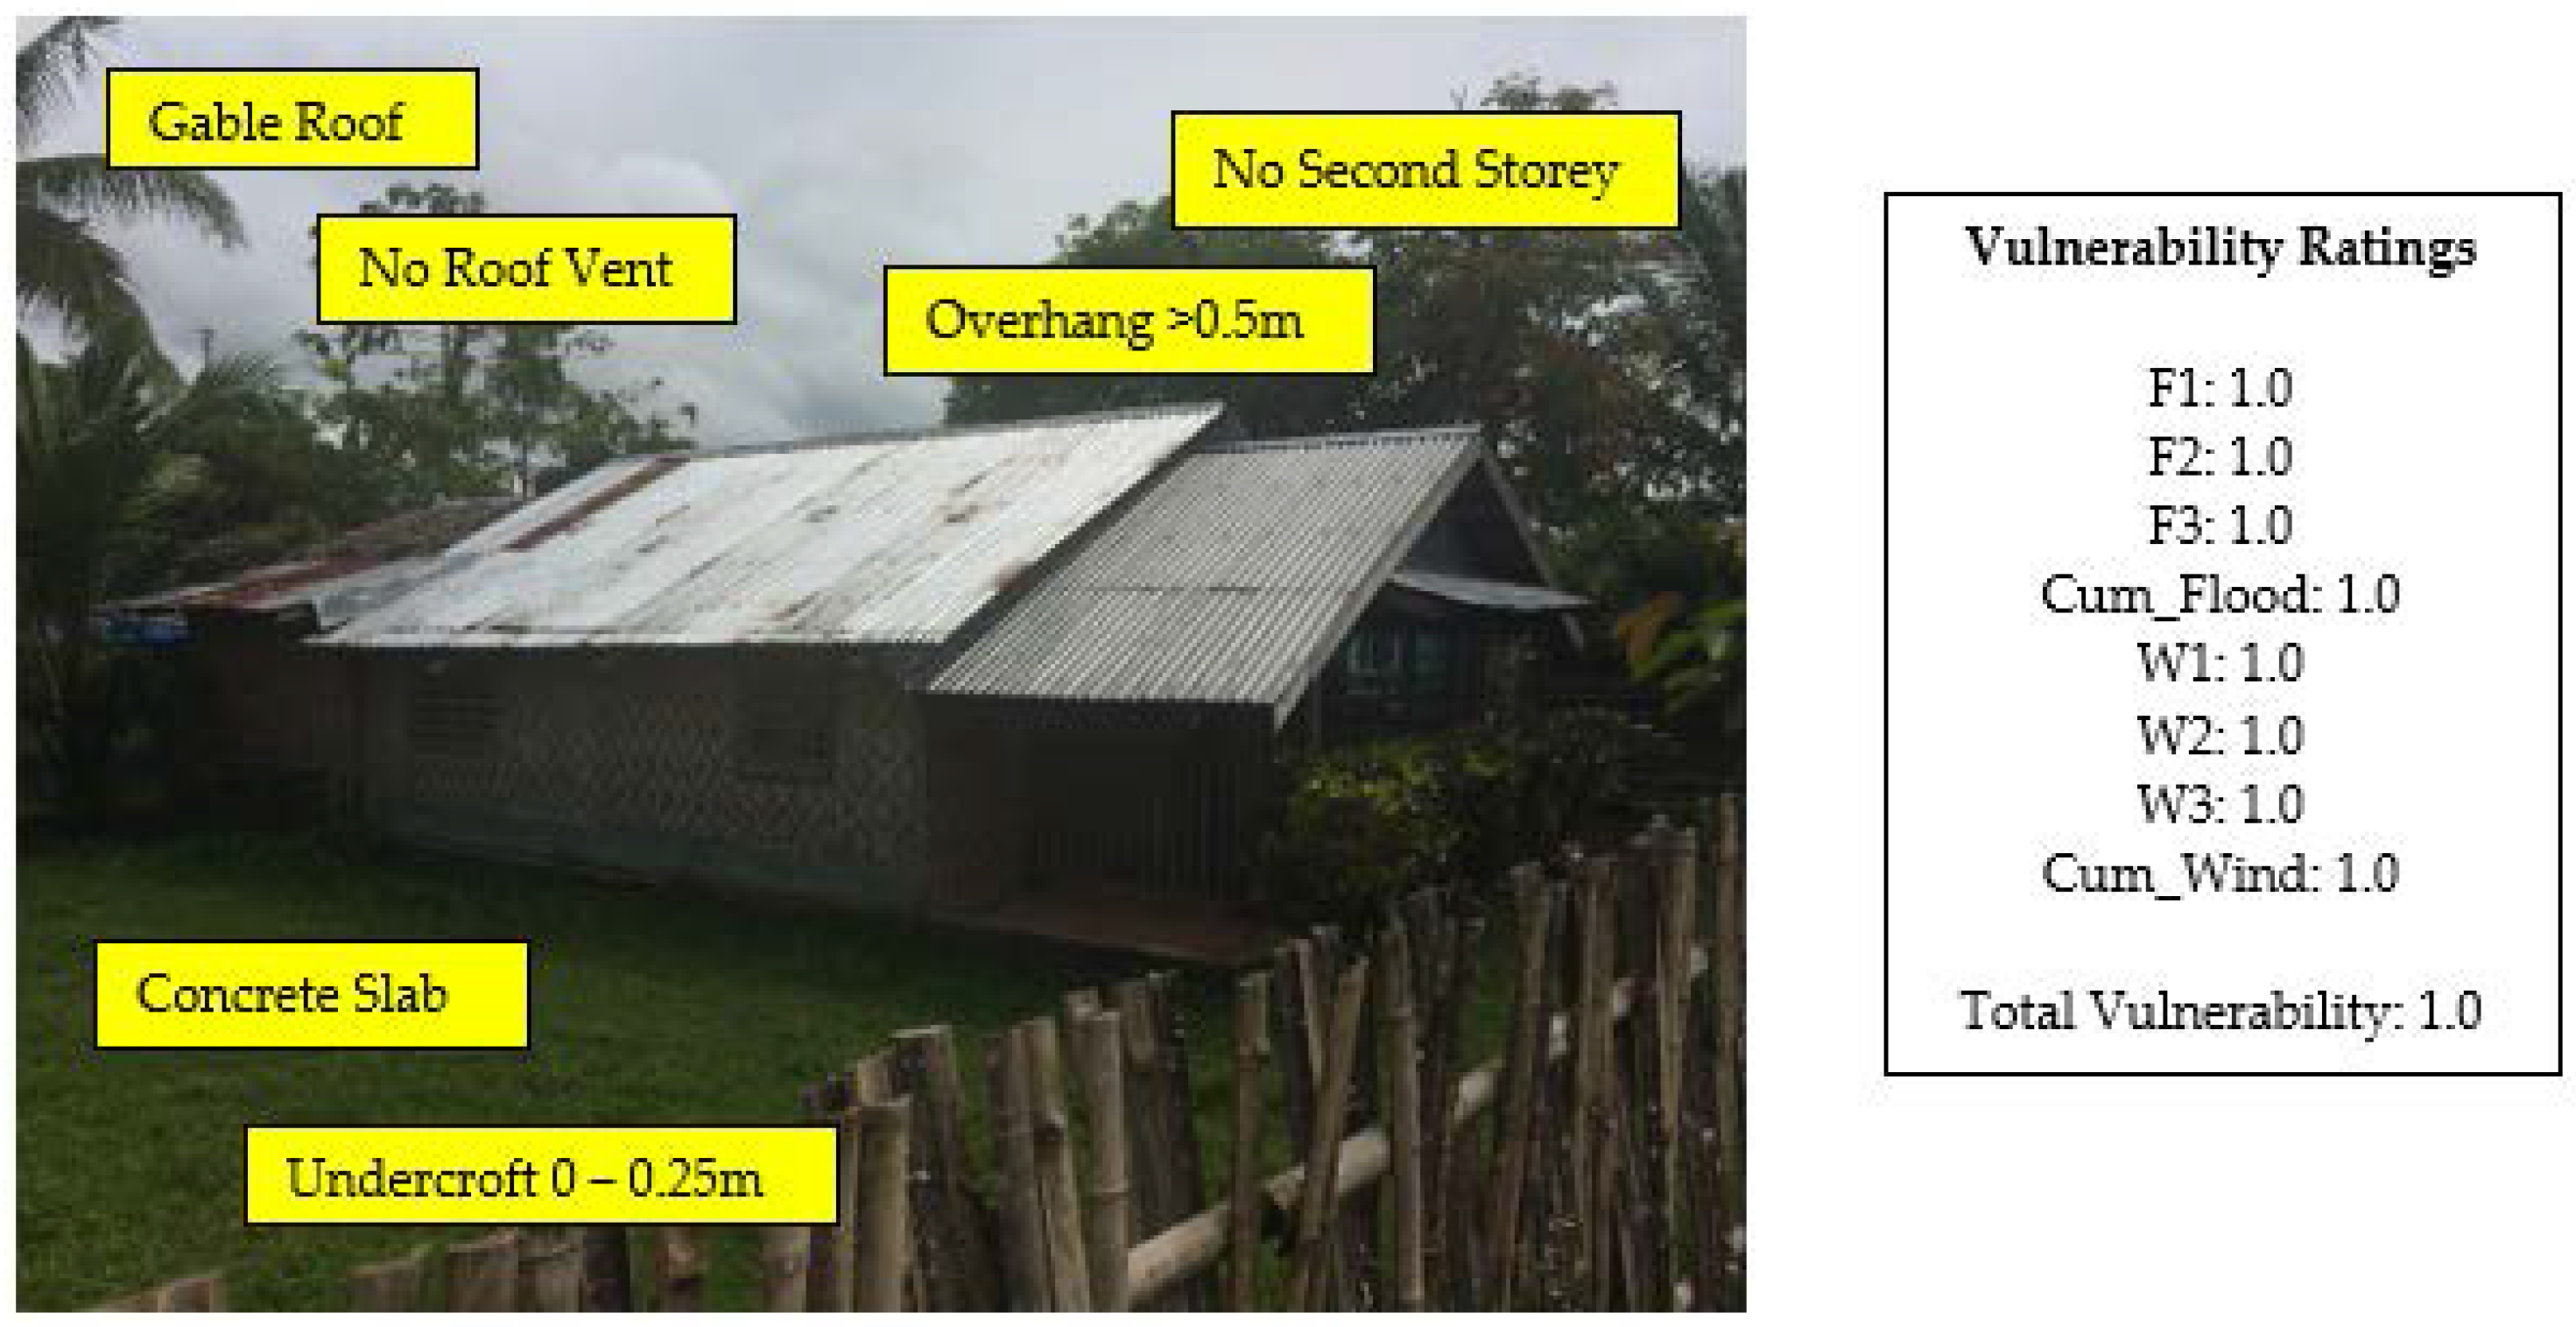
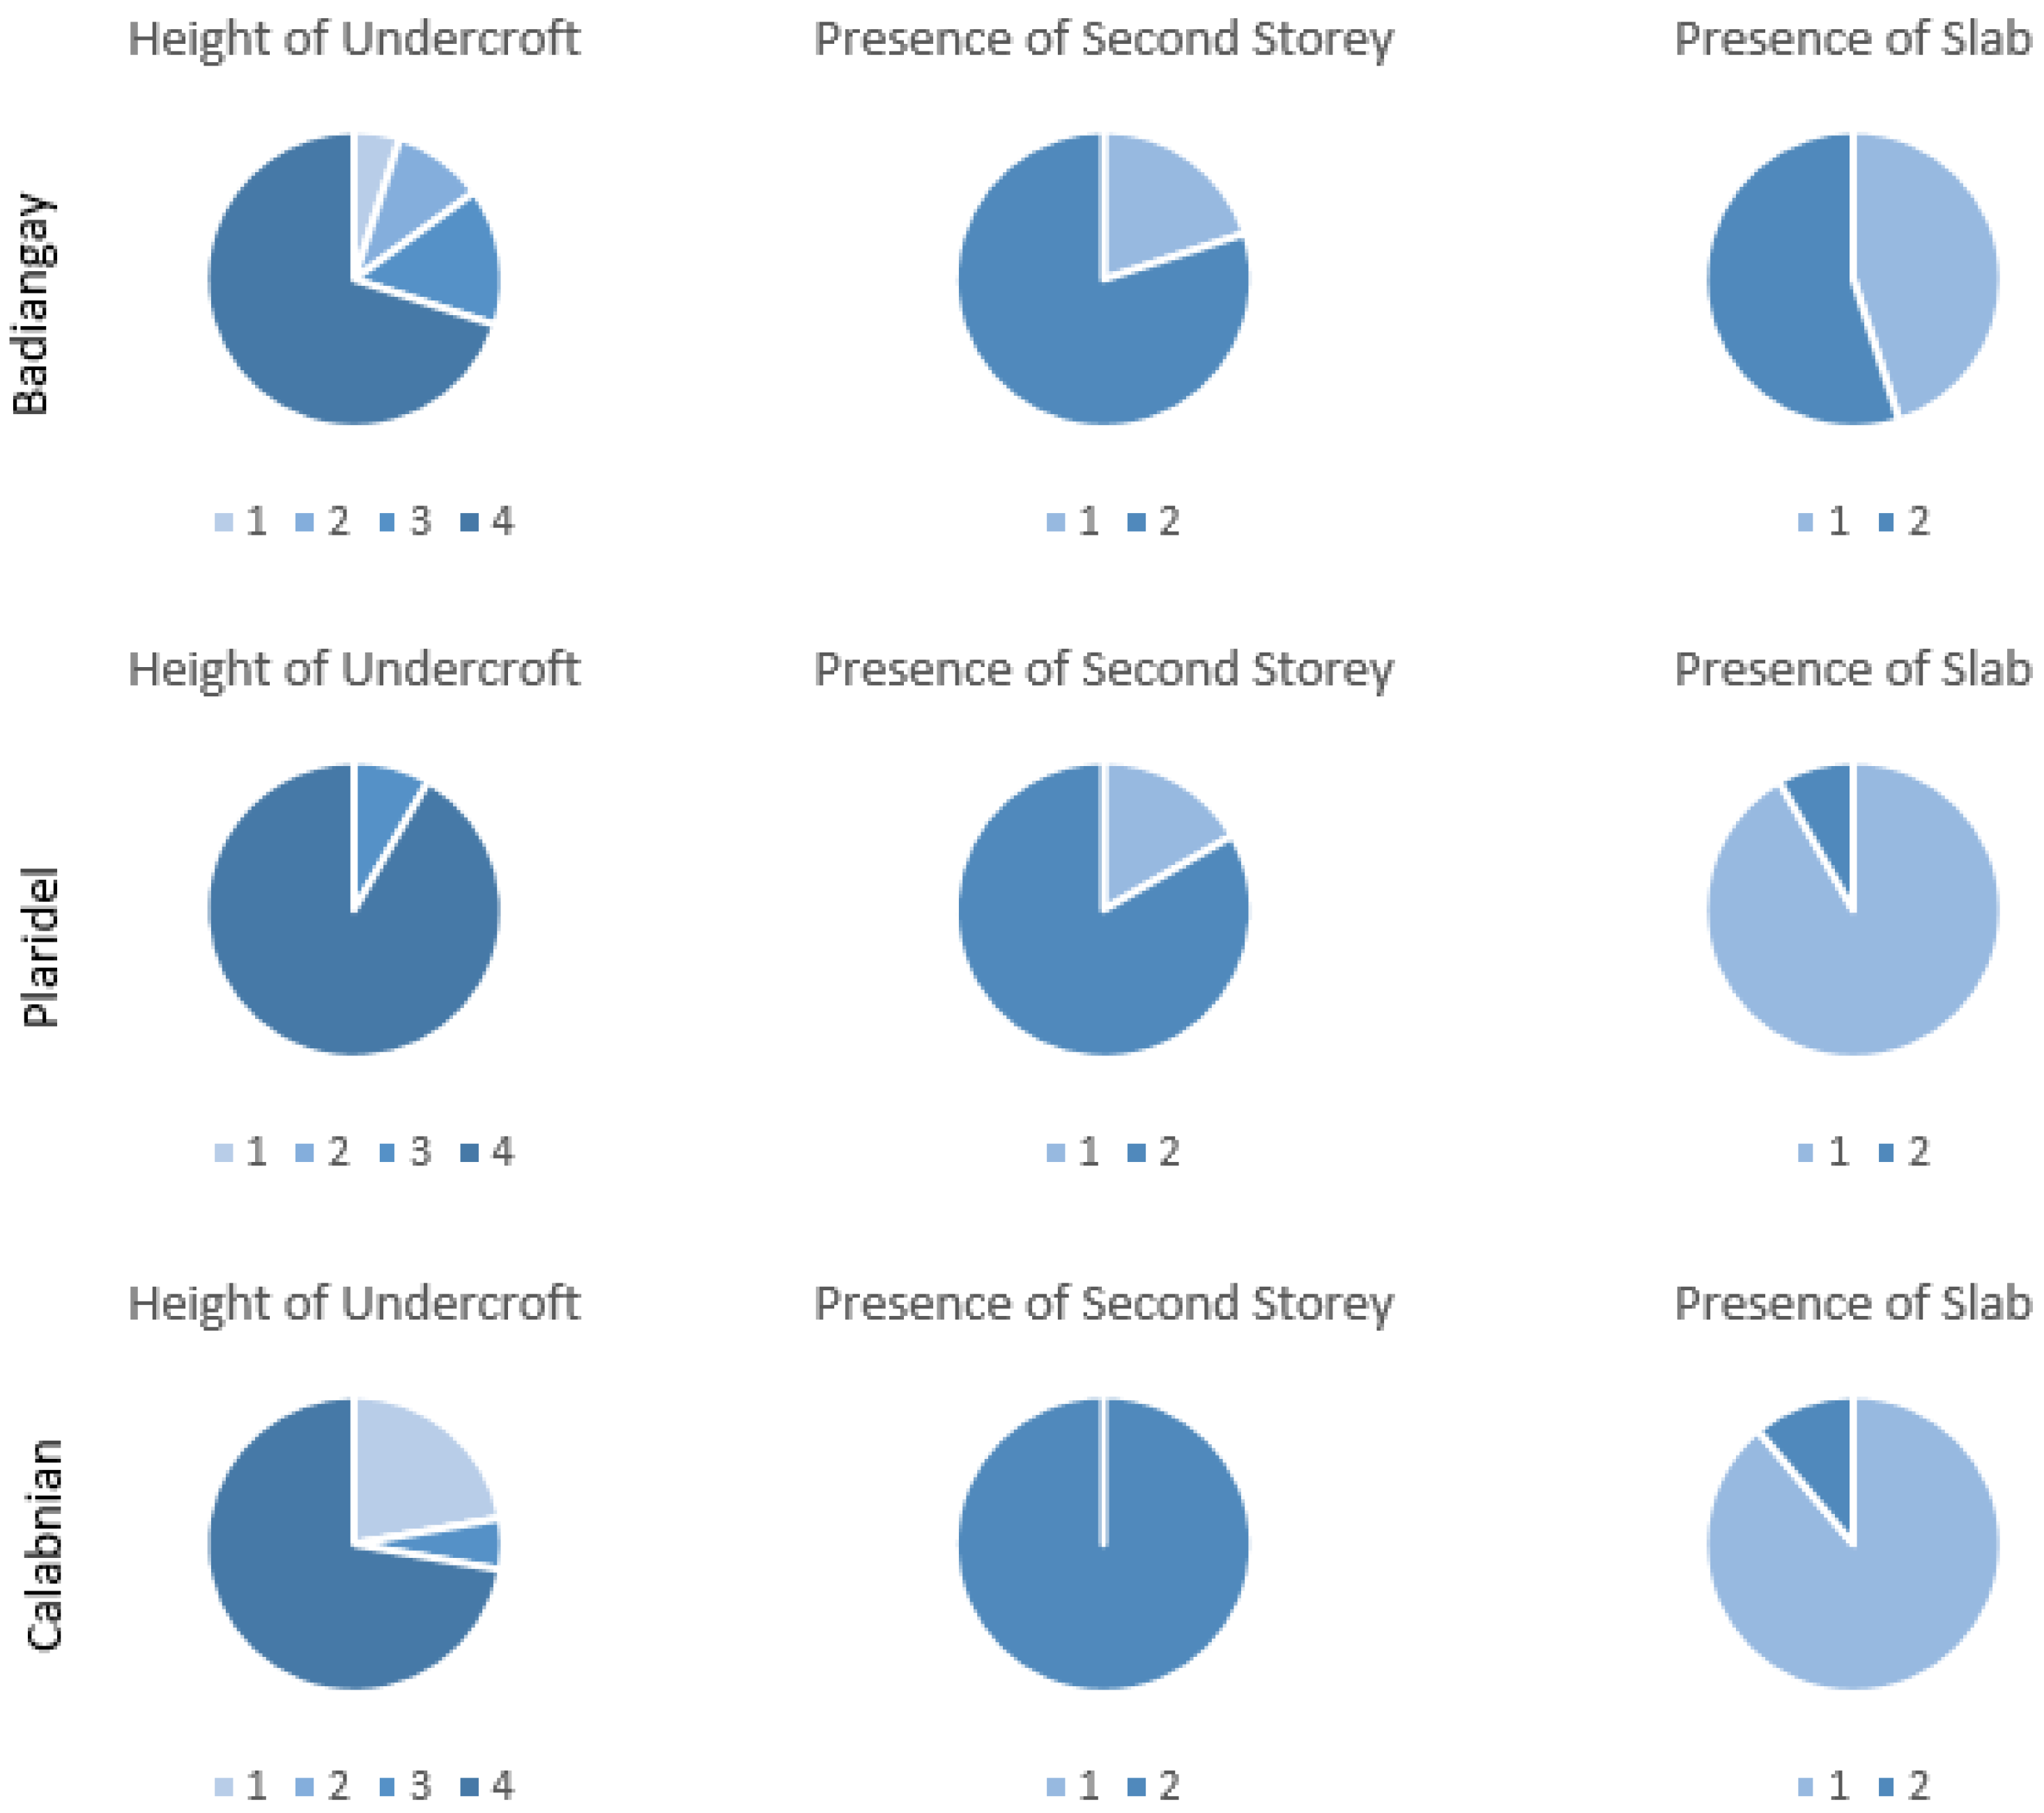
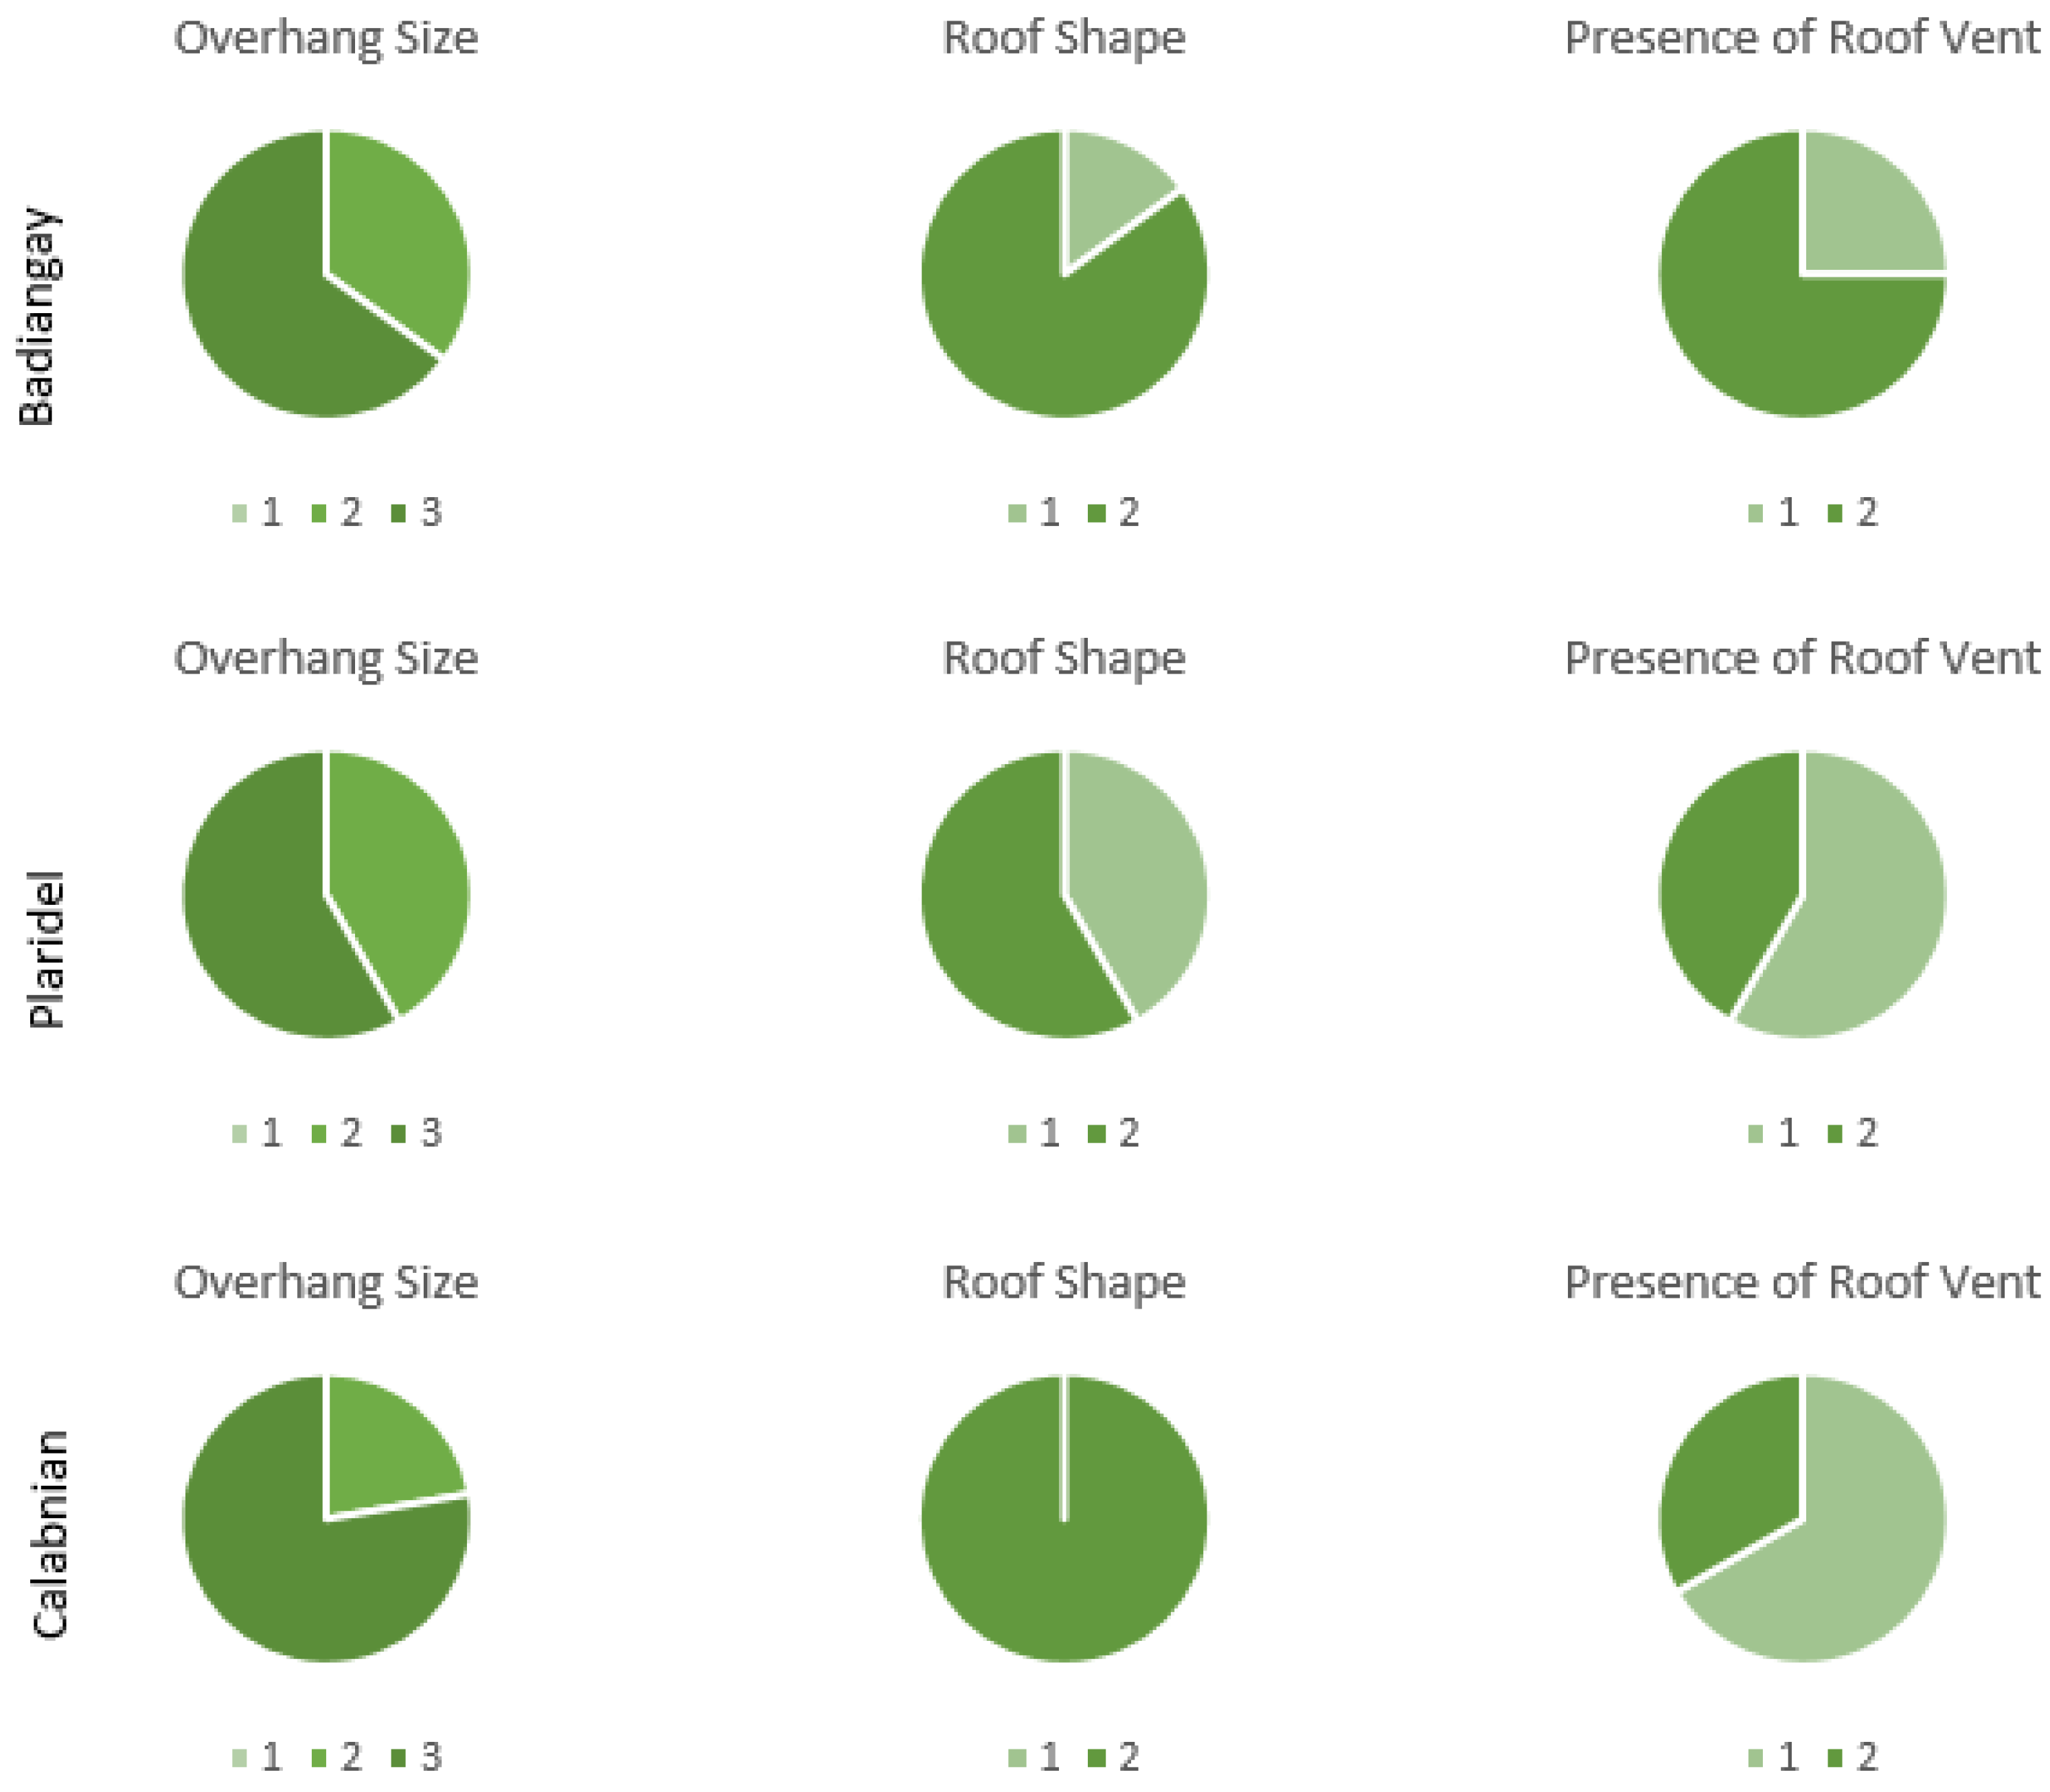
3.2. Building Vulnerability Assessment
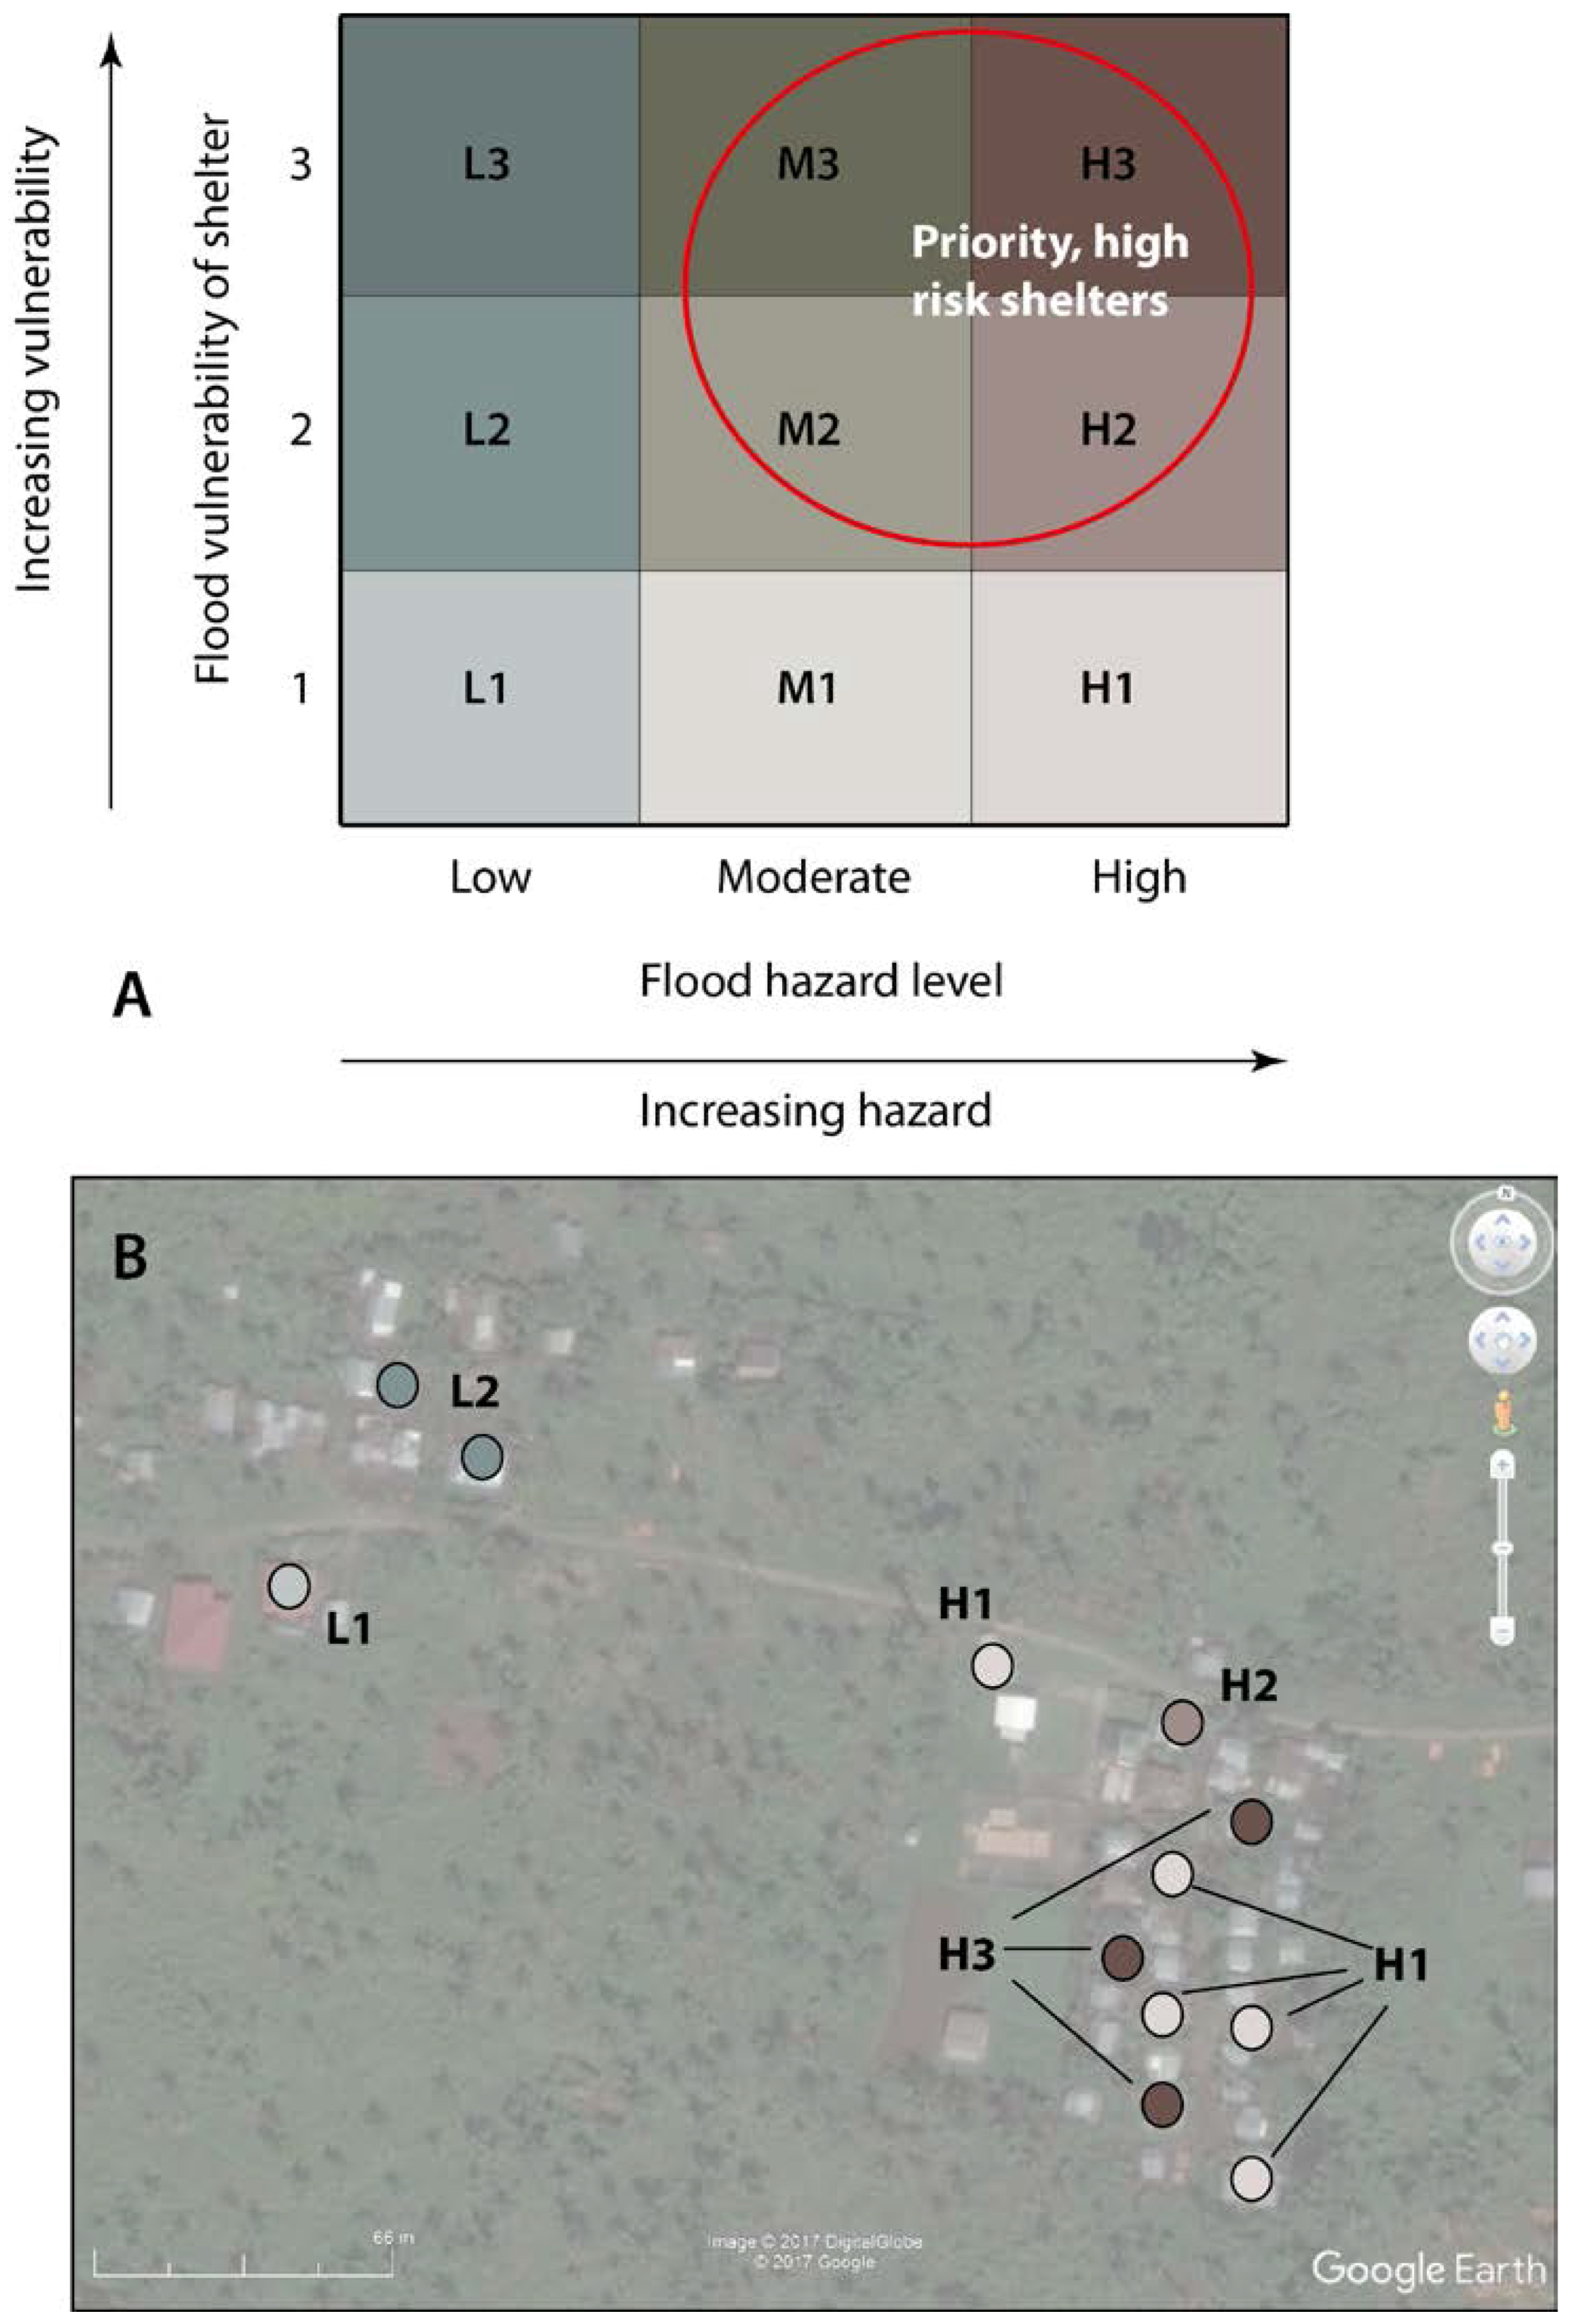
3.3. A Risk-Based Approach for Disaster Shelter Practitioners
4. Discussion
5. Conclusions
- The setting out of flood and wind hazard scenarios for individual rural community locations, derived from national datasets and individual community experiences;
- The application of a method to understand hazard-specific physical building vulnerability of vernacular housing in the Philippines;
- simple, systematic, and objective means of identifying the flood risk posed to rural shelters within assisted communities in post-disaster contexts;
- Visual outputs that can be readily translated into information useful for local people and as such offer an opportunity to explore the communication of a risk-based approach to post-disaster interventions for both practitioners and affected communities alike;
- Presentation of a method that offers shelter practitioners the first steps toward a risk reduction approach to advising on recovery processes as part of Build Back Safer drives in post disaster contexts.
Acknowledgments
Author Contributions
Conflicts of Interest
References
- Philippine Atmospheric, Geophysical and Astronomical Services Administration (PAGASA). 2017 Annual Tropical Cyclone Tracks; Philippine Atmospheric, Geophysical and Astronomical Services Administration, 2017. Available online: https://www1.pagasa.dost.gov.ph/index.php/tropical-cyclones/annual-tropical-cyclone-tracks (accessed on 5 October 2017).
- Sendai Framework for Disaster Risk Reduction 2015–2030, United Nations, 2015. Available online: https://www.unisdr.org/we/coordinate/sendai-framework (accessed on 24 January 2018).
- World Bank Data on Philippines. Available online: https://data.worldbank.org/country/philippines (accessed on 30 January 2018).
- Global Assessment Report, UNISDR, 2015. Available online: https://www.unisdr.org/we/inform/gar (accessed on 24 January 2018).
- Wisner, B.; Blakie, P.; Cannon, T.; Davis, I. At Risk: Natural Hazards, People’s Vulnerability and Disasters, 2nd ed.; Routledge: London, UK, 2004; ISBN 9780415252164. [Google Scholar]
- Dodman, D.; Francis, K.; Hardoy, J.; Johnson, C.; Satterthwaite, D. Understanding the Nature and Scale of Urban Risk in Low- and Middle-Income Countries and Its Implications for Humanitarian Preparedness, Planning and Response; Synthesis Report; UK Government Department for International Development, International Institute for the Environment and Development: London, UK, 2012.
- Baker, J. Climate Change, Disaster Risk and the Urban Poor: Cities Building Resilience for a Changing World, 1st ed.; The World Bank: Washington, DC, USA, 2012; ISBN 978-0-8213-8845-7. [Google Scholar]
- Pelling, M. The Vulnerability of Cities: Natural Disasters and Social Resilience; Earthscan: Abingdon, UK; Oxford, UK, 2003; ISBN 978-1853838309. [Google Scholar]
- Adelekan, I.; Johnson, C.; Manda, M.; Matyas, D.; Mberu, B.; Parnell, S.; Pelling, M.; Satterthwaite, D.; Vivekananda, J. Disaster risk and its reduction: An agenda for urban Africa. Int. Dev. Plan. Rev. 2015, 37, 33–43. [Google Scholar] [CrossRef]
- Parvin, G.A.; Reazul Ahsan, S.M.; Shaw, R. Urban Risk Reduction Processes in Bangladesh. In Disaster Risk Reduction Approaches in Bangladesh; Shaw, R., Mallik, F., Islam, A., Eds.; Springer: Tokyo, Japan, 2013; pp. 235–257. ISBN 978-4-431-54251-3. [Google Scholar]
- Kruger, F.; Bankoff, G.; Cannon, T.; Orlowski, B.; Schipper, E. Cultures and Disasters: Understanding Cultural Framing in Disaster Risk Reduction; Routledge: Abingdon, UK, 2015; ISBN 978-0-415-74558-1. [Google Scholar]
- Shaw, R.; Uy, N.; Baumwoll, J. Indigenous Knowledge for Disaster Risk Reduction; UNISDR: Geneva, Switzerland, 2008. [Google Scholar]
- Alcantara-Ayala, I.; Goudie, A.S. Geomorphological Hazards and Disaster Prevention, 1st ed.; Cambridge University Press: Cambridge, UK, 2010; ISBN 978-0-521-76925-9. [Google Scholar]
- Slater, L.J.; Singer, M.B.; Kirchner, J.W. Hydrologic versus geomorphic drivers of trends in flood hazard. Geophys. Res. Lett. 2015, 42, 370–376. [Google Scholar] [CrossRef]
- Yumul, G.P., Jr.; Servando, N.T.; Suerte, L.O.; Magarzo, M.Y.; Juguan, L.V.V.; Dimalanta, C.B. Tropical cyclone-southwest monsoon interaction and the 2008 floods and landslides in Panay island, central Philippines: Meteorological and geological factors. Nat. Hazards 2012, 62, 827–840. [Google Scholar] [CrossRef]
- Chigira, A.; Tsou, C.Y.; Matsushi, Y.; Hiraishi, N.; Matsuzawa, M. Topographic precursors and geological structures of deep-seated catastrophic landslides caused by Typhoon Talas. Geomorphology 2012, 201, 479–493. [Google Scholar] [CrossRef]
- Brill, D.; May, S.M.; Engel, M.; Reyes, M.; Pint, A.; Optiz, S.; Dierick, M.; Gonzalo, L.A.; Esser, S.; Bruckner, H. Typhoon Haiyan’s sedimentary record in coastal environments of the Philippines and its palaeotempestological implications. Nat. Hazards Earth Syst. Sci. 2016, 16, 2799–2822. [Google Scholar] [CrossRef]
- Sanyal, J.; Lu, X.X. Remote sensing and GIS-based flood vulnerability assessment of human settlements: A case study of Gangetic West Bengal, India. Hydrol. Process. 2005, 19, 3699–3716. [Google Scholar] [CrossRef]
- Osti, R.; Tanaka, S.; Tokioka, T. Flood hazard mapping in developing countries: Problems and prospects. Disaster Prev. Manag. Int. J. 2008, 17, 104–113. [Google Scholar] [CrossRef]
- Abon, C.; David, C.P.C.; Tabios, G.Q. Community-based monitoring for flood and early warning system: An example in central Bicol River basin, Philippines. Disaster Prev. Manag. Int. J. 2012, 21, 85–96. [Google Scholar] [CrossRef]
- Pu, R. A Special Issue of Geosciences: Mapping and assessing natural disasters using geospatial technologies. Geosciences 2017, 7, 4. [Google Scholar] [CrossRef]
- Mas, E.; Brickaer, J.; Kure, S.; Adriano, B.; Yi, C.; Suppasri, A.; Koshimura, S. Field survey report and satellite image interpretation of the 2013 Super Typhoon Haiyan in the Philippines. Nat. Hazards Earth Syst. Sci. 2015, 15, 805–816. [Google Scholar] [CrossRef]
- Rabonza, M.L.; Felix, R.P.; Lagmay, A.M.; Eco, R.N.; Ortiz, I.J.; Aquino, D.T. Shallow landslide susceptibility mapping using high-resolution topography for areas devastated by super typhoon Haiyan. Landslides 2016, 13, 201–210. [Google Scholar] [CrossRef]
- Lagmay, A.M.; Racoma, B.A.; Aracan, K.A.; Alconis-Ayco, J.; Saddi, I.L. Disseminating near-real-time-hazards information and flood maps in the Philippines through Web-GIS. J. Environ. Sci. 2017, 59, 13–23. [Google Scholar] [CrossRef] [PubMed]
- Paz-Alberto, A.M.; Ramos, G.N.; Espiritu, J.A.; Mapanao, K.M.; Lao, R.B. Exposure and vulnerability assessment of buildings extracted from lidar derived datasets Bucao River floodplains, Zambales, Philippines. In Proceedings of the Fifth International Conference on Remote Sensing and Geoinformation of the Environment, Paphos, Cyprus, 20–23 March 2017; Volume 10444. [Google Scholar]
- Adger, W.N. Vulnerability. Glob. Environ. Chang. 2006, 16, 268–281. [Google Scholar] [CrossRef]
- Nasiri, H.; Yusof, M.J.M.; Ali, T.A.M. An overview to flood vulnerability assessment methods. Sustain. Water Resour. Manag. 2016, 2, 331–336. [Google Scholar] [CrossRef]
- Pita, G.; Pinelli, J.; Gurley, K.; Mitrani-Reiser, J. State of the art of hurricane vulnerability estimation methods: A review. Nat. Hazards Rev. 2014, 16. [Google Scholar] [CrossRef]
- Chen, S.E.; Leeman, M.E.; Englaish, B.J.; Kennedy, A.B.; Masters, F.J.; Pinelli, J.P.; Pang, W.; Rullan-Rodriguez, J.A.; Satyanarayana, P.; Calvo, J.; et al. Basic structure system rating of post-Super Typhon Haiyan structures in Tacloban and East Guiuan, Philippines. J. Perform. Constr. Facil. 2016, 30. [Google Scholar] [CrossRef]
- Hernandez, J.Y., Jr.; Aquino, R.E.R.; Pacheco, B.M.; Cruz, E.C. Damage caused by Typhoon Haiyan in the Philippines, review of structural regulations and practice and research developments in wind engineering. Wind Eng. JAWE 2015, 40, 270–274. [Google Scholar] [CrossRef][Green Version]
- Goyal, P.K.; Datta, T.K.; Vijay, V.K. Vulnerability of rural houses to cyclonic wind. Int. J. Disaster Resil. Built Environ. 2012, 3, 20–41. [Google Scholar] [CrossRef]
- Alam, M.R.; Kaish, A.B.M.A.; Zain, M.F.M.; Dev, S.K.; Mahzabin, M.S. Vulnerability assessment and construction recommendations of local houses in the cyclone prone coastal areas of Bangladesh. Int. J. Disaster Risk Reduct. 2017, 21, 118–130. [Google Scholar] [CrossRef]
- Campanero, R.; Egaro, V. Correlates of vulnerability: A quantified study of people’s vulnerability on the impact of super typhoon Yolanda in Guiuan, Eastern Samar, Philippines. Imp. J. Interdiscip. Res. 2017, 3, 416–432. [Google Scholar]
- Usamah, M.; Handmer, J.; Mitchell, D.; Ahmed, I. Can the vulnerable be resilient? Co-existence of vulnerability and disaster resilience: Informal settlements in the Philippines. Int. J. Disaster Risk Reduct. 2014, 10, 178–189. [Google Scholar] [CrossRef]
- ARUP. Pakistan Shelter Guide: Design for Improved Flood Resilience in Sindh; ARUP: London, UK, 2017. [Google Scholar]
- Promoting Safer Building: Supporting Self-Recovery after Disasters. Available online: promotingsaferbuilding.org (accessed on 10 December 2017).
- GFDRR. Disaster Risk Reduction. Available online: https://www.gfdrr.org/sites/gfdrr/files/WB_UNDP_PDNA_DRR_SP_FINAL.pdf (accessed on 30 January 2018).
- CARE Philippines. Typhoon Haiyan Shelter Recovery Project Evaluation; CARE International: Manila, Philippines, 2015. [Google Scholar]
- Global Shelter Cluster: 8 Build Back Safer Key Messages. Available online: https://www.sheltercluster.org/pacific/documents/8-build-back-safer-key-messages-english (accessed on 25 March 2017).
- Mayo, A. Cyclone Resistant Houses for Developing Countries; Building Research Station: Garston, UK, 1988. [Google Scholar]
- Clayton, A.; Davis, I. Building for Safety Compendium: An Annotated Bibliography and Information Directory for Safe Building; Intermediate Technology Publications: London, UK, 1994. [Google Scholar]
- Opdyke, A.; Javernick-Will, A.; Koschmann, M.; Moench, H. Characterizing Post-Disaster Shelter Design and Material Selections: Lessons from Typhoon Yolanda in the Philippines. In Proceedings of the Construction Research Congress, San Jose, CA, USA, 31 May–2 June 2016. [Google Scholar]
- Wazed, M.A. Bangladesh Report 2013: Disaster Preparedness Response and Recovery; Department of Disaster Management (DDM), Ministry of Disaster Management and Relief (MoDMR): Dhaka, Bangladesh, 2014. Available online: https://reliefweb.int/sites/reliefweb.int/files/resources/Bangladesh%20Report%202013.pdf (accessed on 29 January 2018).
- Parrack, C.; Flinn, B.; Passey, M. Getting the message across for safer self-recovery in post-disaster shelter. Open House Int. 2014, 39, 47–58. [Google Scholar]
- Global Shelter Cluster: Promoting Safer Building Working Group. Available online: https://www.sheltercluster.org/working-group/promoting-safer-building-wg (accessed on 10 December 2017).
- Twigg, J.; Lovell, E.; Schofield, H.; Miranda Morel, L.; Flinn, B.; Sargeant, S.; Finlayson, A.; Dijkstra, T.; Stephenson, V.; Albuerne, A.; et al. Self-Recovery from Disasters: An Interdisciplinary Perspective; Overseas Development Institute: London, UK, 2017; Available online: https://www.odi.org/sites/odi.org.uk/files/resource-documents/11870.pdf (accessed on 29 January 2018).
- NASA JPL. NASA Shuttle Radar Tomography Mission (SRTM) Global 1 Arc Second. Version 3. 2013; NASA LP DAAC. Available online: http://dx.doi.org/10.5067/MEaSUREs/SRTM/SRTMGL1.003 (accessed on 10 December 2017).
- NASA JPL. NASA Shuttle Radar Tomography Mission (SRTM) Global 3 Arc Second. Version 3. 2013; NASA JPL. Available online: http://dx.doi.org/10.5067/MEaSUREs/SRTM/SRTMGL3.003 (accessed on 10 December 2017).
- Mines and Geoscience Bureau (MGB). Detailed Landslide and Flood Hazard Map of Tacloban City and Santa Fe, Leyte, Philippines 3923-II-5 Badiangay Quadrangle; Department of Environment and Natural Resources–Mines and Geoscience Bureau (MGB), Lands Geological Survey Division: Quezon City, Philippines, 2015.
- Mines and Geoscience Bureau (MGB). Detailed Landslide and Flood Hazard Map of Santa Fe, Palo and Alang-Alang, Leyte, Philippines 3923-II-9 Bulod Quadrangle; Department of Environment and Natural Resources–Mines and Geoscience Bureau (MGB), Lands Geological Survey Division: Quezon City, Philippines, 2015.
- Mines and Geoscience Bureau (MGB). Detailed Landslide and Flood Hazard Map of La Paz, Burauen and Julita, Leyte, Philippines 3922-I-9 Calabnian Quadrangle; Department of Environment and Natural Resources–Mines and Geoscience Bureau (MGB), Lands Geological Survey Division: Quezon City, Philippines, 2015.
- Mines and Geoscience Bureau (MGB). Detailed Landslide and Flood Hazard Map of Pastrana, Jaro and Alangalang, Leyte, Philippines 3913-II-12 Patong Quadrangle; Department of Environment and Natural Resources–Mines and Geoscience Bureau (MGB), Lands Geological Survey Division: Quezon City, Philippines, 2015.
- Neussner, O. Residential Building Suitability Map for Leyte Island, Philippines; Deutsche Gesellschaft für Internationale Zusammenarbeit (GIZ) GmbH: Berlin, Germany, 2015; Available online: https://www.gidrm.net/site/assets/files/1218/olaf_neussner-_2015.pdf (accessed on 10 September 2017).
- Stephenson, V.; D’Ayala, D. A new approach to flood vulnerability assessment for historic buildings in England. Nat. Hazards Earth Syst. Sci. 2014, 14, 1035–1048. [Google Scholar] [CrossRef]
- D’Ayala, D.; Galasso, C.; Putrino, V.; Fanciullacci, D.; Barucco, P.; Fanciullacci, V.; Bronzino, C.; Zerrudo, E.; Manolo, M.; Fradiquela, C.; et al. Assessment of the Multi-Hazard Vulnerability of Priority Cultural Heritage Structures in the Philippines. In Proceedings of the 1st International Conference on Natural Hazards and Infrastructure, Chania, Greece, 28–30 June 2016. [Google Scholar]
- Kelman, I.; Spence, R. An overview of flood actions on buildings. Eng. Geol. 2004, 73, 297–309. [Google Scholar] [CrossRef]
- Fernandez, R.D.A. A visual Dictionary on Filipino Architecture; University of Santo Tomas Publishing House: Manila, Philippines, 2015; ISBN 978-971-506-770-6. [Google Scholar]
- Gavanski, E.; Kordi, B.; Copp, V.A.; Vickery, P.J. Wind loading on roof sheathing of houses. J. Wind Eng. Ind. Aerodyn. 2013, 114, 106–121. [Google Scholar] [CrossRef]
- Prasad, P.; Uliate, T.; Rafiuddin Ahmed, M. Wind loads on low-rise building models with different roof configurations. Int. J. Fluid Mech. Res. 2009, 36, 231–243. [Google Scholar] [CrossRef]
- Ahmad, S.; Kumar, K. Effect of geometry on wind pressures on low-rise hip roof buildings. J. Wind Eng. Ind. Aerodyn. 2002, 90, 755–779. [Google Scholar] [CrossRef]
- Seifert, J.; Li, Y.; Axley, J.; Rasler, M. Calculation of wind-driven cross ventilation in buildings with large openings. J. Wind Eng. Ind. Aerodyn. 2006, 94, 925–947. [Google Scholar] [CrossRef]


| Source | Hazard Level | Flood Height | Flood Duration | Topography | Rating for Risk Matrix |
|---|---|---|---|---|---|
| MGB 1:10K flood hazard maps | Low susceptibility | ≤0.5 m | ≤1 day | Low hills, gentle slopes. | L |
| Moderate susceptibility | 0.5−1 m | 1−3 days | Fluvial terraces, alluvial fans, infilled valleys. | M | |
| High susceptibility | 1−2 m | ≥3 days | Active river channels, along river banks. | H | |
| Very High susceptibility | ≥2 m | ≥3 days | Active river channels, along river banks. | H | |
| NOAH 100 year return flood model | 1 | ≤0.5 m | − | - | L |
| 2 | 0.5−1.5 m | − | - | M | |
| 3 | ≥1.5 m | − | - | H |
| Hazard | Indicator | Indicator No. | Options | Description |
|---|---|---|---|---|
| Flood | Presence of Second Storey | F1 | Yes, No | Presence of second storey provides a place to store belongings in event of a flood, reducing the likelihood of loss. |
| Raising of Ground Floor | F2 | 0.0–0.25 m, 0.25–0.5 m, 0.5–0.75 m, 0.75–1.0 m | Raising of ground floor level reduces likelihood of flooding and loss of belongings. | |
| Presence of Concrete Slab | F3 | Yes, No | A slab foundation beneath timber posts increases likelihood of floodwater washing building away. | |
| Wind | Roof Shape | W1 | Gable, Hipped | Hipped roof deflects wind pressure more effectively, reducing likelihood of roof damage. |
| Overhang | W2 | 0.0, 0.0–0.5 m, >0.5 m | Larger overhang leads to increased wind pressure at roof level, increasing likelihood of roof damage. | |
| Roof Vents | W3 | Yes, No | Ventilation at roof level permits winds to travel through the building, reducing wind pressure. |
| Indicator | Options | Vulnerability Factor |
|---|---|---|
| F1 | Yes | 0.5 |
| No | 1.0 | |
| F2 | 0.75–1.0 m | 0.25 |
| 0.5–0.75 m | 0.5 | |
| 0.25–0.5 m | 0.75 | |
| 0.0–0.25 m | 1.0 | |
| F3 | No | 0.5 |
| Yes | 1.0 |
| Indicator | Options | Vulnerability Factor |
|---|---|---|
| W1 | Hipped | 0.5 |
| Gable | 1.0 | |
| W2 | 0.0 | 0.33 |
| 0.0–0.5 m | 0.66 | |
| >0.5 m | 1.0 | |
| W3 | Yes | 0.5 |
| No | 1.0 |
© 2018 by the authors. Licensee MDPI, Basel, Switzerland. This article is an open access article distributed under the terms and conditions of the Creative Commons Attribution (CC BY) license (http://creativecommons.org/licenses/by/4.0/).
Share and Cite
Stephenson, V.; Finlayson, A.; Miranda Morel, L. A Risk-Based Approach to Shelter Resilience following Flood and Typhoon Damage in Rural Philippines. Geosciences 2018, 8, 76. https://doi.org/10.3390/geosciences8020076
Stephenson V, Finlayson A, Miranda Morel L. A Risk-Based Approach to Shelter Resilience following Flood and Typhoon Damage in Rural Philippines. Geosciences. 2018; 8(2):76. https://doi.org/10.3390/geosciences8020076
Chicago/Turabian StyleStephenson, Victoria, Andrew Finlayson, and Luisa Miranda Morel. 2018. "A Risk-Based Approach to Shelter Resilience following Flood and Typhoon Damage in Rural Philippines" Geosciences 8, no. 2: 76. https://doi.org/10.3390/geosciences8020076
APA StyleStephenson, V., Finlayson, A., & Miranda Morel, L. (2018). A Risk-Based Approach to Shelter Resilience following Flood and Typhoon Damage in Rural Philippines. Geosciences, 8(2), 76. https://doi.org/10.3390/geosciences8020076