Article

The Numerical Study of the Vertical Collapse Capacity of Reinforced Concrete Spatial Beam–Slab Structures with Unequal Spans

1
School of Civil Engineering and Architecture, Northeast Electric Power University, Jilin 132012, China
2
Key Laboratory of Urban Security and Disaster Engineering of China Ministry of Education, Beijing University of Technology, Beijing 100124, China
3
Shandong Electric Power Engineering Consulting Institute Corporation Limited (SDEPCI), Jinan 250013, China
4
State Grid East Inner Mongolia Electric Power Co., Ltd., Construction Company, Hohhot 010010, China
*
Author to whom correspondence should be addressed.
Buildings 2026, 16(9), 1718; https://doi.org/10.3390/buildings16091718
Submission received: 21 March 2026 / Revised: 7 April 2026 / Accepted: 22 April 2026 / Published: 27 April 2026

Abstract

To reveal the progressive collapse mechanism of reinforced concrete spatial beam–slab structures with unequal spans and improve their collapse-resistant design level, this study investigates the progressive collapse resistance of reinforced concrete spatial beam–slab structures with unequal span arrangements. A finite element model of the spatial frame structure was developed in ABAQUS under inner column failure conditions, and pushdown analysis was employed for numerical simulation of the test samples. The effects of the inner column failure position, beam–slab parameters, floor slab damage performance, and beam-end internal forces on the collapse capacity of reinforced concrete spatial beam–slab structures were analyzed. The results indicate that, under inner column failure, the floor slab contributes 40–50% of the structure’s bearing capacity; under side column failure, it contributes 20–30%; and under corner column failure, it contributes 15–25%. A larger beam span reduces the structure’s bearing capacity after column failure. Additionally, equal-span designs exhibit a “lag” in force compared with unequal-span designs, and lateral constraints of the floor slab have minimal influence on the bearing capacity of slabless structures. The beam and slab design parameters significantly affect the bearing capacity and ductility of a structure. The damage performance of the floor slab under small deformations reflects its yield mode, enabling inference of the crack distribution. These findings provide scientific insight into the progressive collapse mechanism of unequal-span reinforced concrete spatial beam–slab structures. On the practical side for engineering design, a bearing capacity formula incorporating the influence of the floor slab in unequal span arrangements is proposed. The innovation of this paper lies in systematically analyzing the differences in progressive collapse between equal-span and unequal-span structures, as well as the influence of the floor slab on the progressive collapse of unequal-span structures, thereby providing a theoretical basis for research on the progressive collapse of unequal-span structures such as the Xuankou Middle School in Wenchuan.

1. Introduction

Progressive collapse refers to the failure of local structural components under accidental loads, leading to the subsequent failure of connected components and resulting in large-scale damage disproportionate to the initial local failure [1]. The consequences of progressive collapse are severe, often resulting in significant casualties and economic losses. To mitigate the “disproportionate” damage caused by progressive collapse, various countries have established specific codes and standards [2].
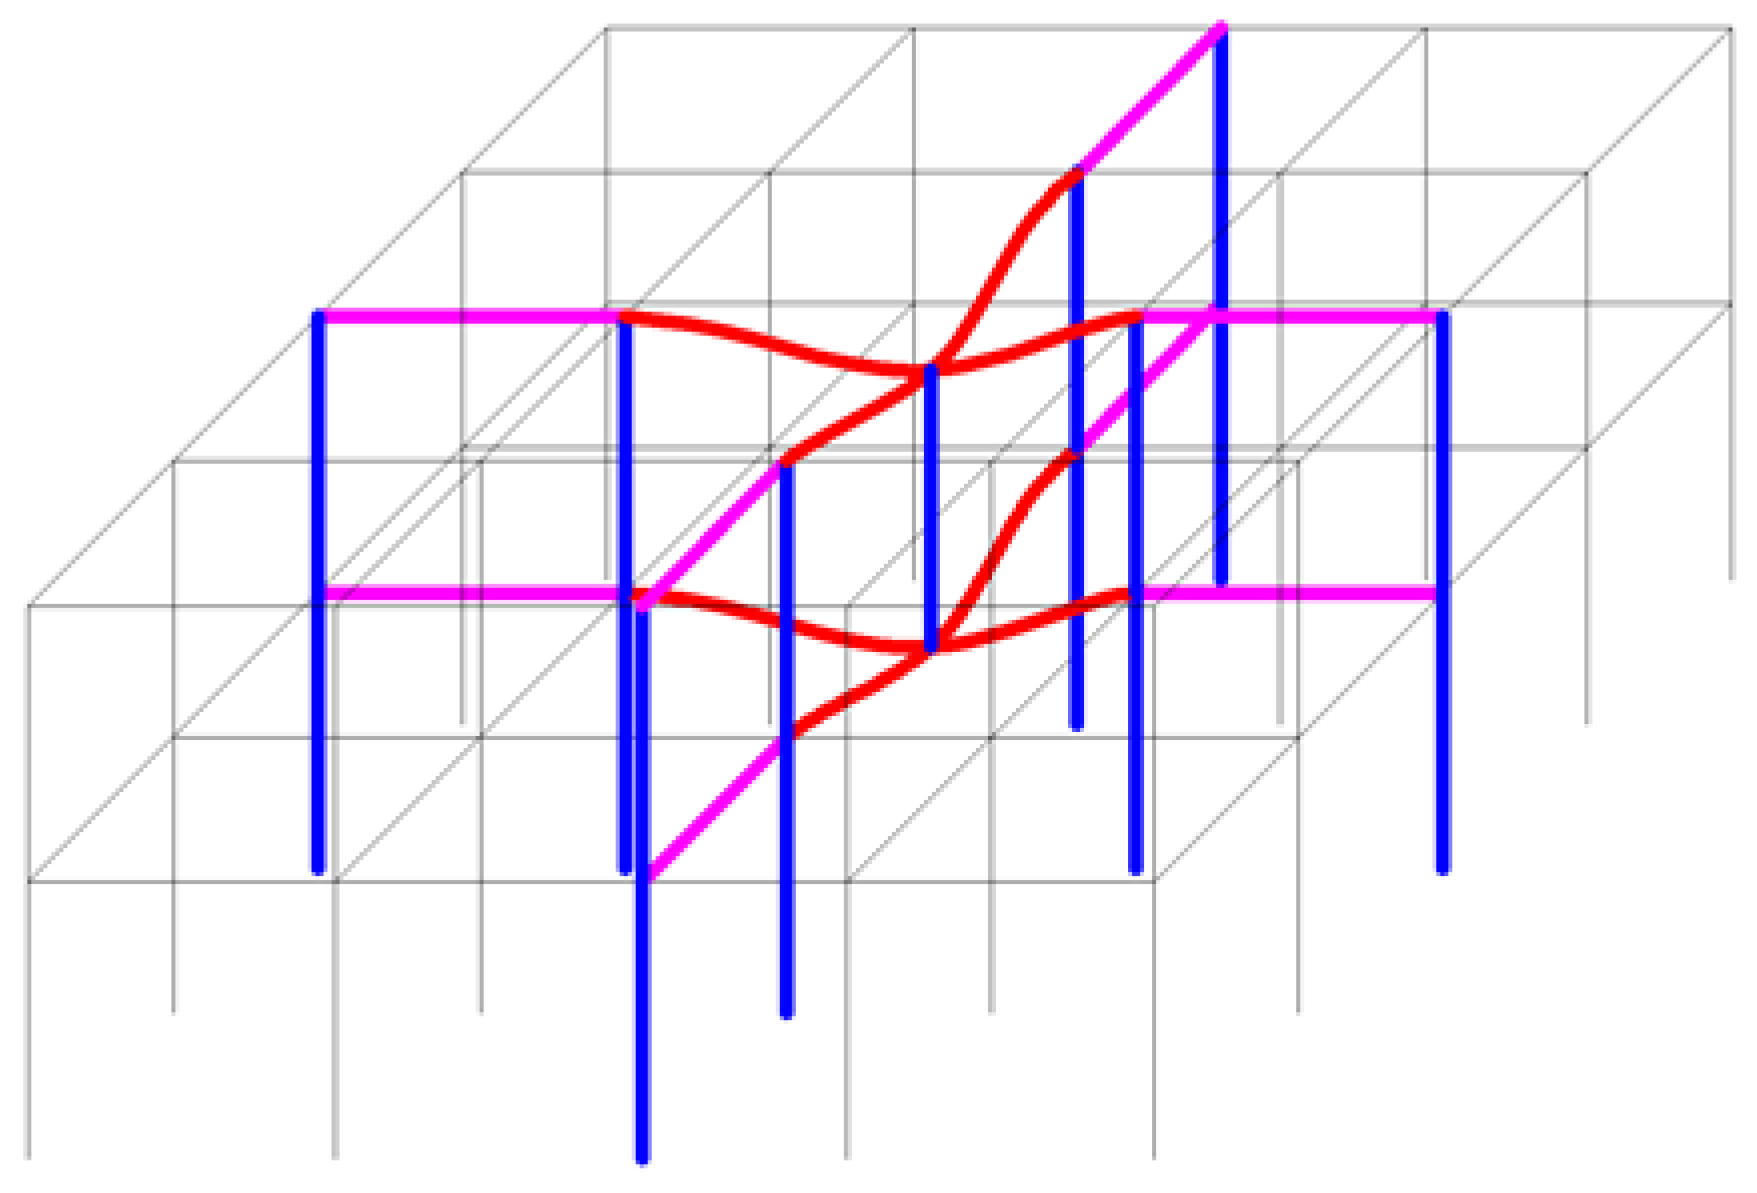
During the Wenchuan earthquake in China, the classroom building of Xuankou Middle School in Wenchuan County exemplified a typical reinforced concrete spatial beam–slab structure with unequal span arrangements, a design commonly found in Chinese primary and secondary school buildings. This configuration features a single-span frame with cantilevered corridors, where uneven span distribution caused irregular structural stiffness, making it particularly vulnerable to progressive collapse during seismic events due to low redundancy and a single load path. When critical supports like columns failed, the entire structure collapsed, revealing that the conventional “strong column-weak beam” principle proved ineffective in such unequal-span configurations. The structure’s “overly strong beams and weak columns” resulted in intact beams but completely destroyed columns, leading to floor collapse. This highlights the urgent need to reassess current design codes’ applicability to complex structural forms and implement damage-based design improvements. This widely publicized case significantly raised public and governmental awareness of seismic resilience while providing crucial technical insights for post-disaster reconstruction and existing building retrofitting to prevent similar catastrophes. The Xuankou Middle School teaching building, with its distinctive unequal-span configuration and the “strong beam-weak column” failure pattern, provides an ideal reference for investigating seismic collapse mechanisms. To date, research on its seismic performance has largely centered on three aspects: the effect of infill wall layouts on structural behavior, shaking table tests on scaled models of the corridor-type frame, and the derivation of equilibrium equations to assess the critical state of impending collapse. Despite these efforts, studies specifically dedicated to collapse resistance using this building as a prototype remain scarce [3].
In a study on RC frame structures, LI Zhi [4] investigated the progressive collapse resistance of RC space beam-column substructures with unequal spans under the corner column failure scenario through pushdown loading tests and refined finite element models of reinforced concrete space beam-column structures subjected to corner column failure. LI Zhi [5] investigated the collapse resistance of reinforced concrete frame structures under high temperatures. Based on the uncertainties in the structure and loading, the fitted cumulative distribution function effectively evaluated the collapse probability of the RC frame structures under elevated temperatures. The existing theoretical analysis models for the progressive collapse resistance of reinforced concrete (RC) frames were only applicable to equal-span structures. Through theoretical derivation, GAN [6] extended the existing analytical models from equal-span to unequal-span structures and proposed a new modified tri-linear model. WANG [7] proposed an efficient analysis method for the entire collapse process of RC frame structures based on OpenSees. This method not only possessed high computational efficiency but was also applicable for the rapid assessment of collapse behavior under various column removal scenarios. DENG [8] conducted quasi-static pushdown tests on three 1/2-scaled RC beam-column substructures with a penultimate column removed, and analyzed the influence of seismically designed and non-seismically designed specimens, as well as different column section sizes, on the load-carrying capacity, failure modes, and evolution of resistance mechanisms. HUANG [9] analyzed the progressive collapse responses of frames under initial damage occurring at different locations, as well as the influence patterns of main design parameters on the progressive collapse of structures, using the nonlinear dynamic column removal method. XIONG [10] designed prefabricated RCS composite frame beam-column joints with different configurations and conducted experimental investigations on the progressive collapse resistance of each substructure using static loading. The results indicated that the progressive collapse failure modes, load-carrying capacities, and ultimate deformation capacities of the substructures varied with the different beam-column joint connection configurations. CHEN [11] established finite element models for both static and dynamic progressive collapse analysis of typical RC frame beam-column substructures using OpenSees. Different models were generated based on Latin Hypercube sampling, and the influence of structural uncertainties on the static and dynamic progressive collapse resistance of RC frame beam-column substructures was analyzed. HUANG [12] established a finite element analysis model for the progressive collapse of frame beam–slab substructures using SAP2000, and investigated the influence patterns of parameters such as concrete strength, slab thickness, and reinforcement ratio on the bearing capacity enhancement coefficient. Du Ke [13] compared the continuous collapse resistance of frame substructures with and without floor slabs. Yu et al. [14] employed a refined numerical model to analyze the compressive arch effect, catenary effect of longitudinal beams, bending mechanism of cross beams, and tensile membrane effect of floor slabs. Kai Qian et al. [15,16] performed pushdown analysis and conducted substructure tests on adjacent beams and columns with floor slabs on the bottom floor. Floor slabs had significantly enhanced structural bearing capacity during collapse. Yuzhe Xiao et al. [17] conducted dynamic experiments on beam–column substructures.
Sagiroglu [18] conducted a blast removal test on a bottom-story edge column of a 10-story RC frame built in 1958, evaluating the dynamic load redistribution and potential for progressive collapse after initial local failure. A vierendeel truss mechanism formed above the removed column served as the primary load redistribution path. The forces originally carried by the column above the removal point were redistributed to other columns, with the immediately adjacent columns sustaining the largest increase in load, diminishing with distance, and the diagonally opposite columns experiencing the least change. Sasani et al. [19] performed a quasi-static progressive collapse test on a two-span RC beam by simulating the loss of a middle column. Based on the experimental results, they developed a numerical model capable of simulating rebar fracture during progressive collapse, and validation against test data confirmed the model’s accuracy. Choi and Kim [20] designed four 1:2.65 scale two-span continuous beam specimens, two designed for seismic resistance and two non-seismically designed, using a quasi-static testing method. Their findings indicated that the seismically designed specimens developed a more pronounced catenary action, effectively preventing collapse following sudden column loss. Orton [21] tested eight continuous beam specimens with discontinuous top and bottom reinforcement to investigate progressive collapse behavior after middle column removal. Some specimens were strengthened with carbon fiber sheets, and a comparison between strengthened and unstrengthened specimens demonstrated a significant increase in the load capacity contributed by the catenary mechanism after strengthening.
Current research on the progressive collapse of RC frames predominantly focuses on planar structures. Studies involving spatial frames mainly utilize equal-span configurations, with limited investigation into the more practical scenario of unequal-span designs. Equal-span reinforced concrete structures feature bays of approximately equal length in one direction, resulting in uniform stiffness distribution and clear load paths. In contrast, unequal-span reinforced concrete structures exhibit significant variations in bay lengths along one direction. Typically, shorter spans possess higher stiffness while longer spans are more flexible, leading to an uneven stiffness distribution and complex internal force redistribution paths. The advantage of equal-span structures lies in the comparable stiffness of their members [22]. After local failure, beams in adjacent bays exhibit similar flexural deformation capacities, allowing plastic hinges to form simultaneously and enabling the effective development of a global catenary mechanism that dissipates energy collectively, substantially enhancing the vertical load-bearing capacity. Consequently, equal-span structures generally outperform unequal-span ones in resisting progressive collapse, exhibiting a more ductile failure process with greater overall deformation capacity, thereby providing more crucial time for occupant evacuation [23].
Unequal-span reinforced concrete structures, where longer spans provide larger functional spaces, are widely used in primary and secondary school buildings. Under normal service conditions, the beams in shorter, stiffer spans experience smaller deformations and perform adequately. However, during a progressive collapse scenario triggered by column loss, these stiffer short-span beams attract a disproportionately large share of the load from the compromised area due to their significantly higher stiffness compared to long-span beams. This leads to a rapid increase in internal forces within the short-span beams. Relevant studies indicate that during progressive collapse of unequal-span structures, short-span beams often fail in shear prematurely, which subsequently hinders the full development of the catenary action. This prevents the remaining structural components from forming effective alternative load paths, potentially resulting in rapid vertical collapse [24]. Figure 1 presents the collapsed Xuankou Middle School in Wenchuan photographed from various angles during the Wenchuan earthquake. Xuankou Middle School represents a typical unequal-span configuration, which is extensively adopted in primary and secondary school buildings throughout China.
Existing research has encompassed the collapse assessment of unequal-span substructures under high-temperature conditions and accounted for uncertainties, leading to the development of refined analytical models. Experimental and numerical methods have been widely employed to investigate compressive arch action and catenary action in beams, tensile membrane action in floor slabs, as well as the influences of seismic design, beam-column joint detailing, and column removal locations. Studies have confirmed that floor slabs can significantly enhance structural resistance; however, the underlying spatial load-transfer mechanisms remain insufficiently understood. Current research predominantly focuses on planar frames or substructures, leaving a notable gap in systematic understanding regarding the spatial composite action of slabs and the full-range evolution of resistance mechanisms in unequal-span spatial frames following the loss of a critical column. Furthermore, quantitative calculation methods and theoretical formulas for determining the slab contribution to structural resistance are currently lacking.
Despite the widespread use of unequal-span reinforced concrete spatial beam slab structures in buildings such as school corridors, their design against progressive collapse remains insufficiently addressed in current codes. The most existing design provisions assume regular, equal span configurations and do not explicitly consider the effects of uneven span lengths, varying lateral restraints, or the spatial composite action of floor slabs. In the scientific and engineering literature, although progressive collapse of RC frames has been extensively studied, the vast majority of work focuses on planar substructures or equal span spatial frames. Research on unequal span spatial beam slab structures is scarce, and the role of the floor slab—particularly its quantitative contribution to load resistance and failure mode transition—remains poorly understood. To address these gaps, the present study formulates the following scientific problem: how does the spatial composite action of the slab affect the progressive collapse resistance of unequal span RC beam slab structures under different column removal scenarios? The purpose of this research is to reveal the underlying collapse mechanisms and to provide a rational assessment framework. The specific objectives are: (1) to quantify the slab contribution to the vertical collapse capacity under internal, side, and corner column failures; (2) to investigate the effects of key beam slab parameters on the collapse resistance; and (3) to propose an improved bearing capacity formula incorporating the slab influence for unequal span configurations.

2. Finite Element Model Establishment and Verification

2.1. Materials and Methods

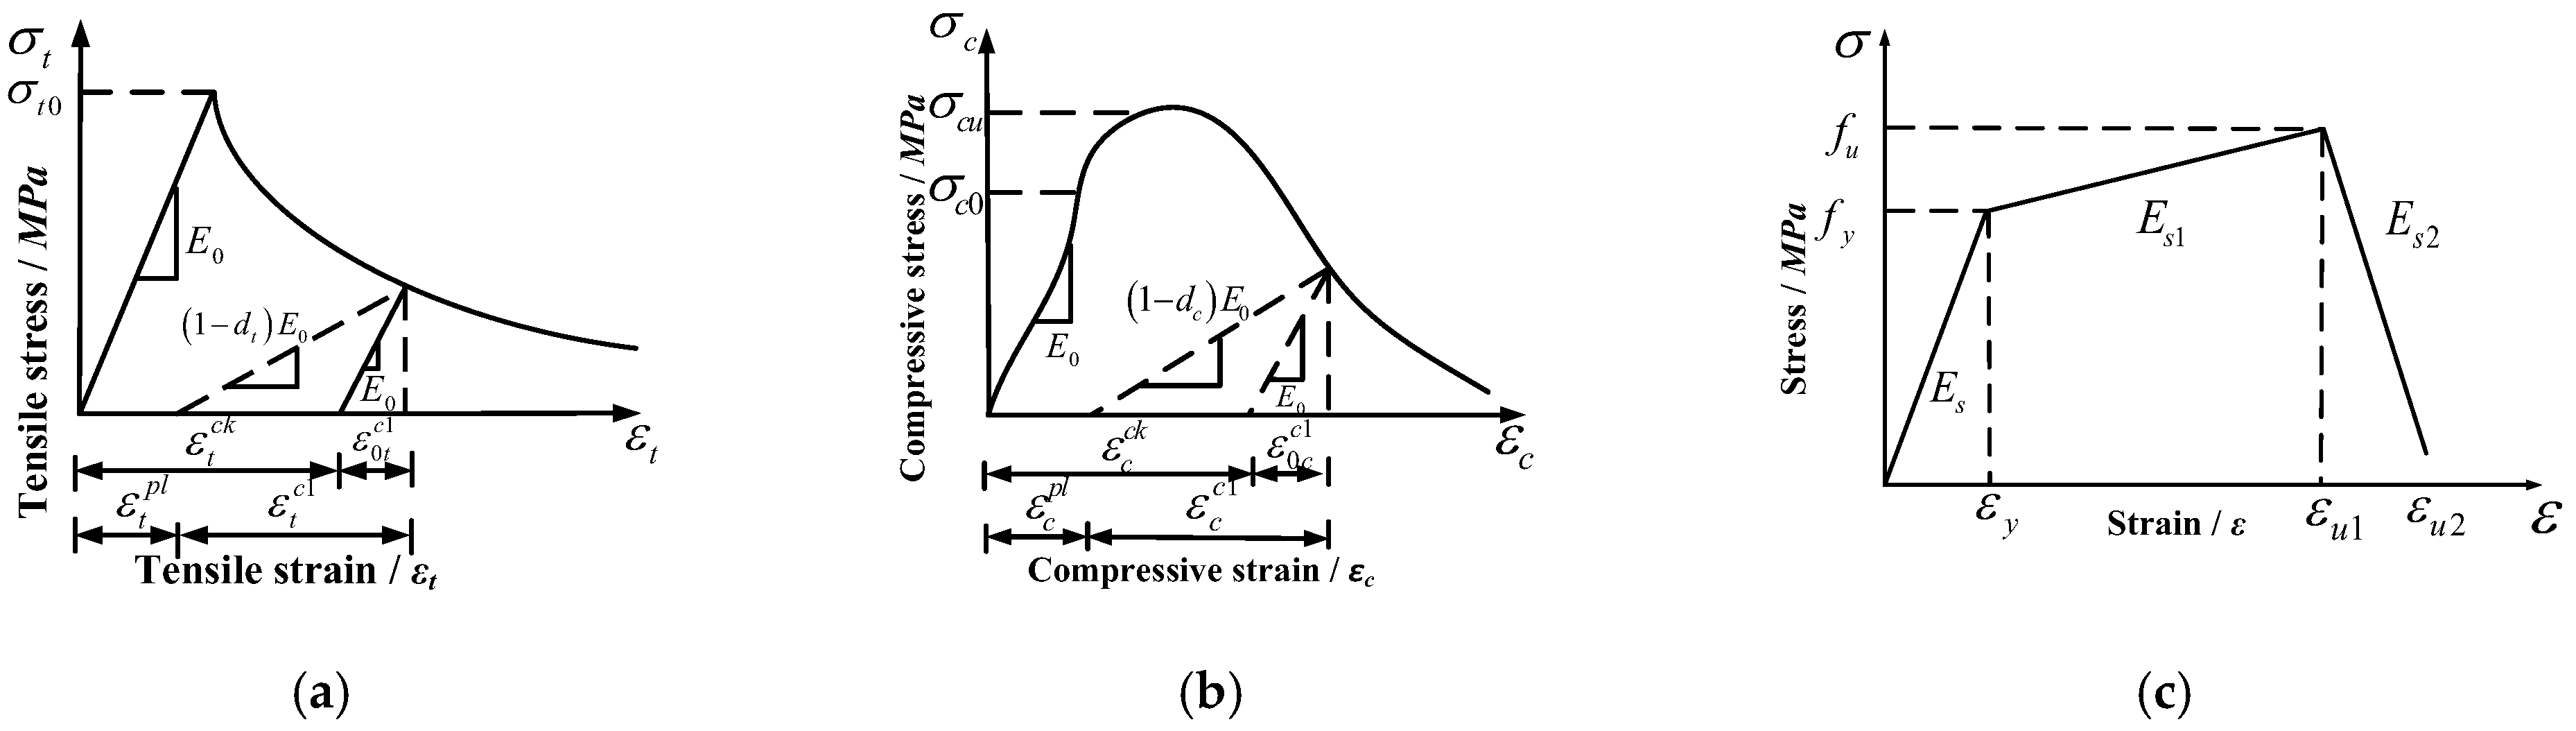
The material’s stress–strain curve is presented in Figure 2. The concrete constitutive model employs the CDP (concrete damage plasticity) damage plasticity approach. As indicated in Equations (1) and (2), the damage variable d is introduced to modify the elastic modulus, accounting for compressive crushing and tensile cracking in the concrete. Equations (3) and (4) represent the stress–strain relationships for concrete under uniaxial tension and compression [13].
d t = 1 σ t E c 1 ε ~ t p l 1 b t 1 + σ t E c 1
d c = 1 σ c E c 1 ε ~ c p l 1 b c 1 + σ c E c 1
σ t = 1 d t E 0 ( ε t ε ~ t p l )
σ c = 1 d c E 0 ( ε c ε ~ c p l )
In the formula, ε ~ t p l and ε ~ c p l represent the equivalent plastic tensile and compressive strains that govern the yield and failure of concrete. σ c and σ t denote the uniaxial compressive and tensile stresses, respectively, whereas b t and b c are empirical constants. b t = 0.1 , b c = 0.7 , and E0 correspond to the elastic modulus of the concrete. The parameters of the concrete used in the CDP (Concrete Damage Plasticity) model are listed in Table 1. σ b 0 / σ c 0 represents the biaxial compressive strength ratio, whereas K denotes the yield surface shape parameter [13]. The calculation formulas for the stress–strain relationship of concrete elements used Formulas C.2.3-1 to C.2.4-5 in Section C.2 of Reference [25]. Detailed explanations of each calculation formula and their parameters were provided in the relevant content of Section C.2 in Reference [25].
The constitutive model for steel bars is illustrated in Figure 2c. The tensile failure of steel bars is simulated via a flexible damage model. The descending section of the steel bar constitutive relationship is modeled linearly, with the elastic modulus of both the strengthening and descending sections approximately taken as E s 1 = 0.01 E s 2 = 0.01 E s . The material parameters of the steel bars are listed in Table 2.

2.2. Element Types

In the finite element model, C3D8R elements are employed for concrete, as they are widely applied in large-strain analyses of refined meshes. T3D2 elements are utilized for steel bars, as they account for only tension and compression, providing a better representation of the mechanical properties of steel bars.

2.3. Finite Element Model Meshing

Using the structured meshing technique in ABAQUS 2024 version for mesh generation, each component was first partitioned into regular shapes, followed by the assignment of seed densities, and finally, the mesh was generated. This method produced regular hexahedral elements, which offered good computational accuracy and efficiency. The density of the finite element mesh is closely related to the computational accuracy. If the mesh is too coarse, the computational accuracy decreases; if the mesh is too fine, the accuracy improves significantly, but the computational effort becomes excessively high, leading to increased costs. However, the finite element models studied in this paper are relatively regular structures, so the mesh density has a limited effect on their accuracy. For the finite element model with a slab structure, the mesh size is 5 cm × 5 cm; for the finite element model without a slab structure, the mesh size is 10 cm × 10 cm [13].

2.4. Trial Overview

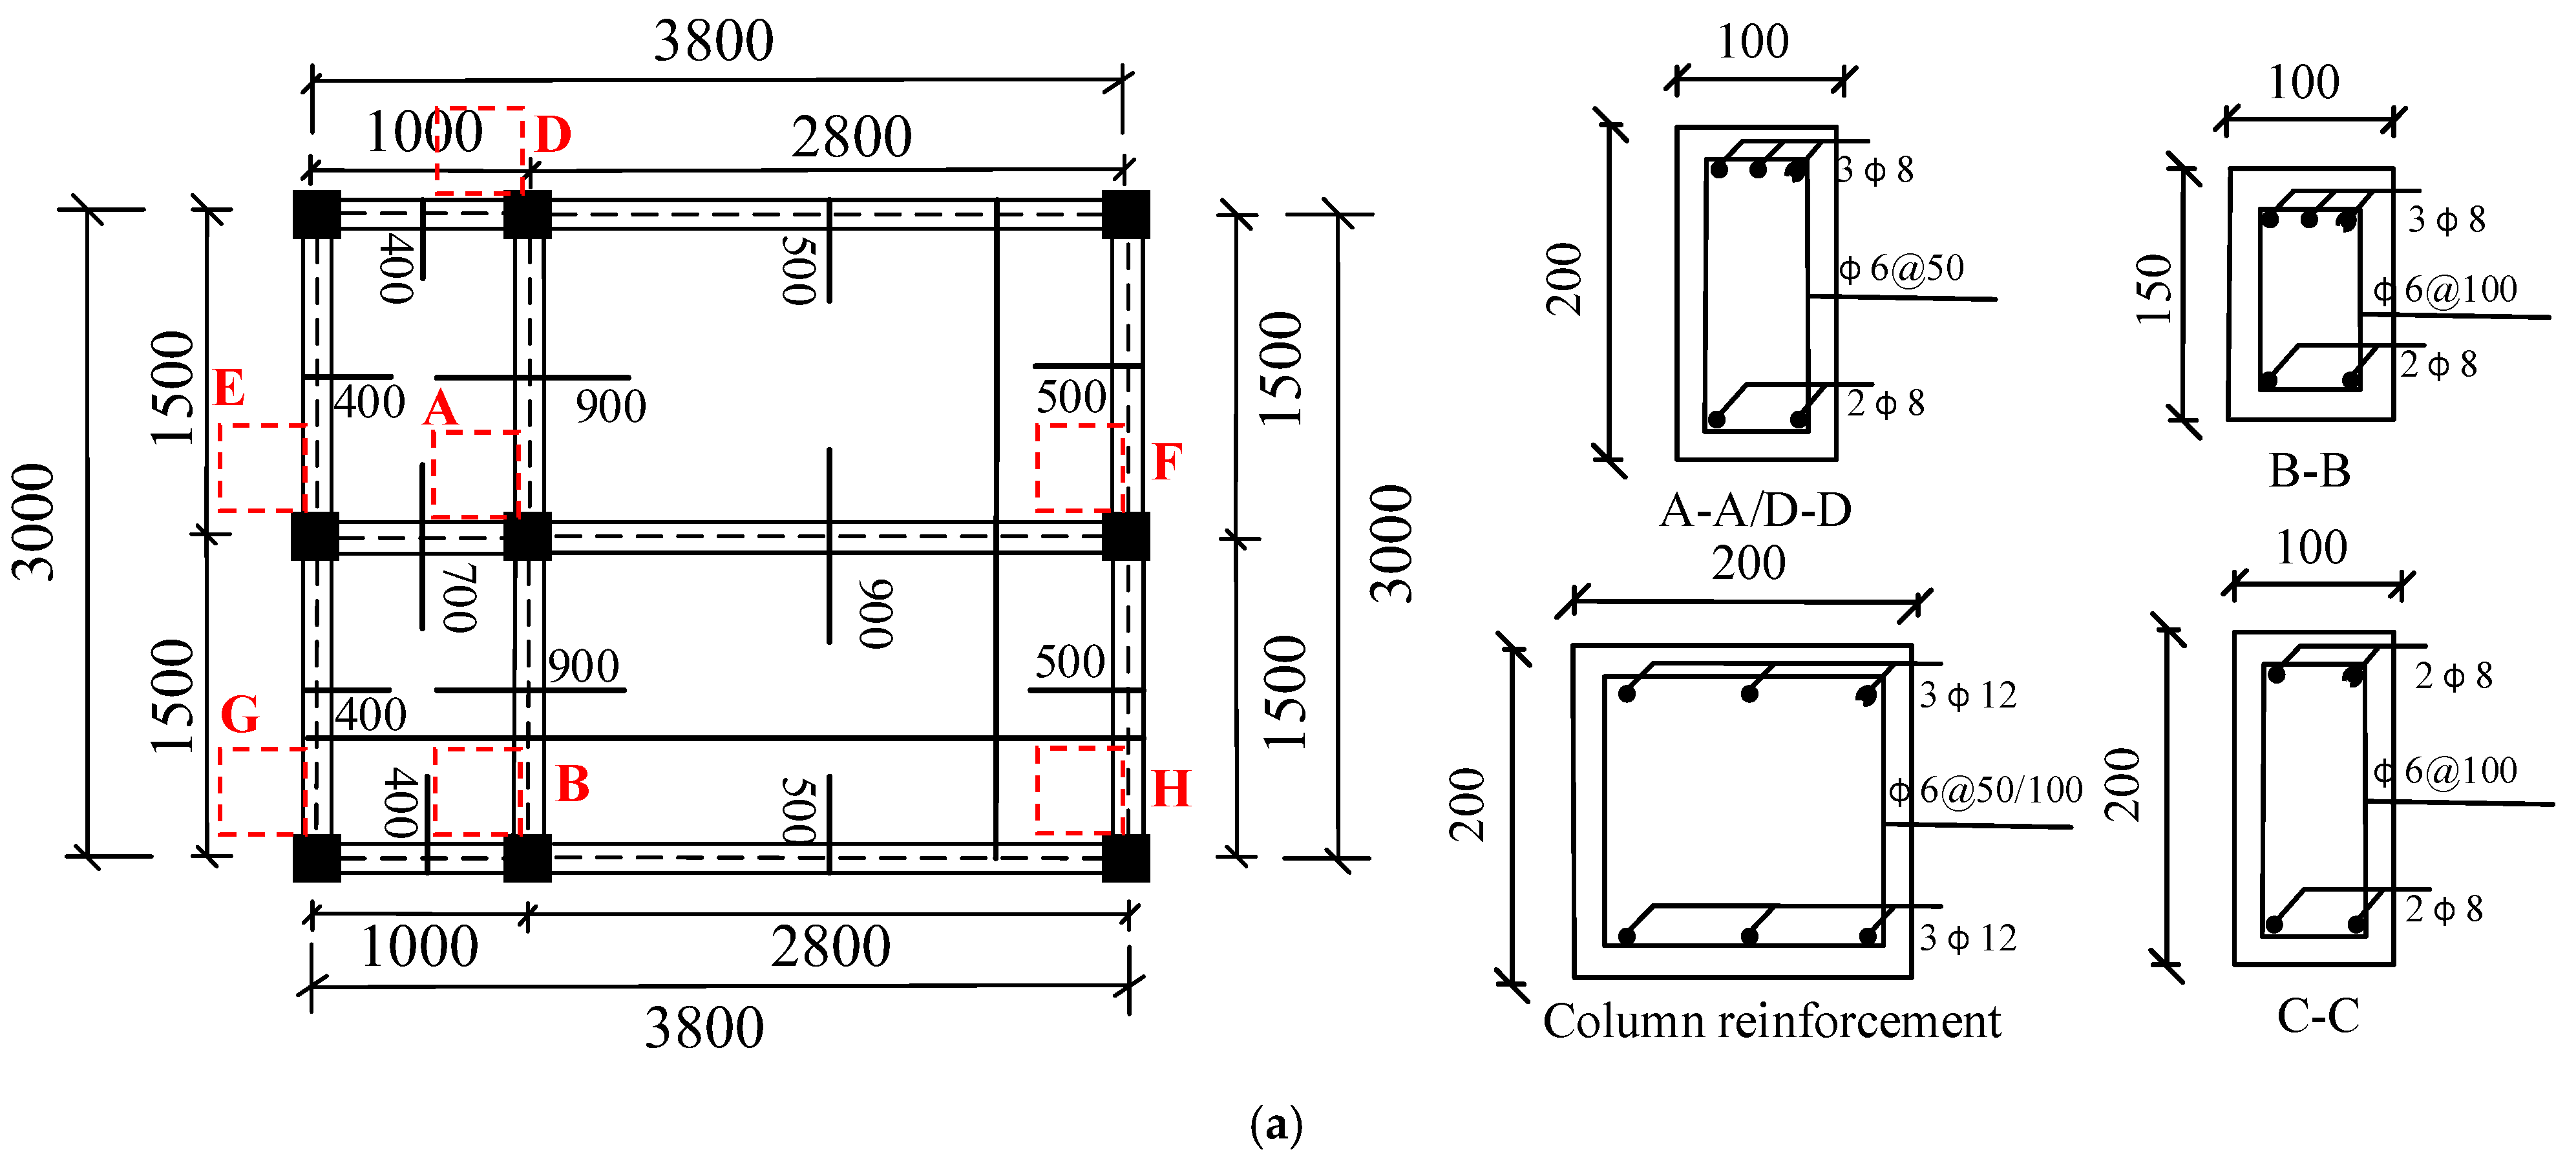
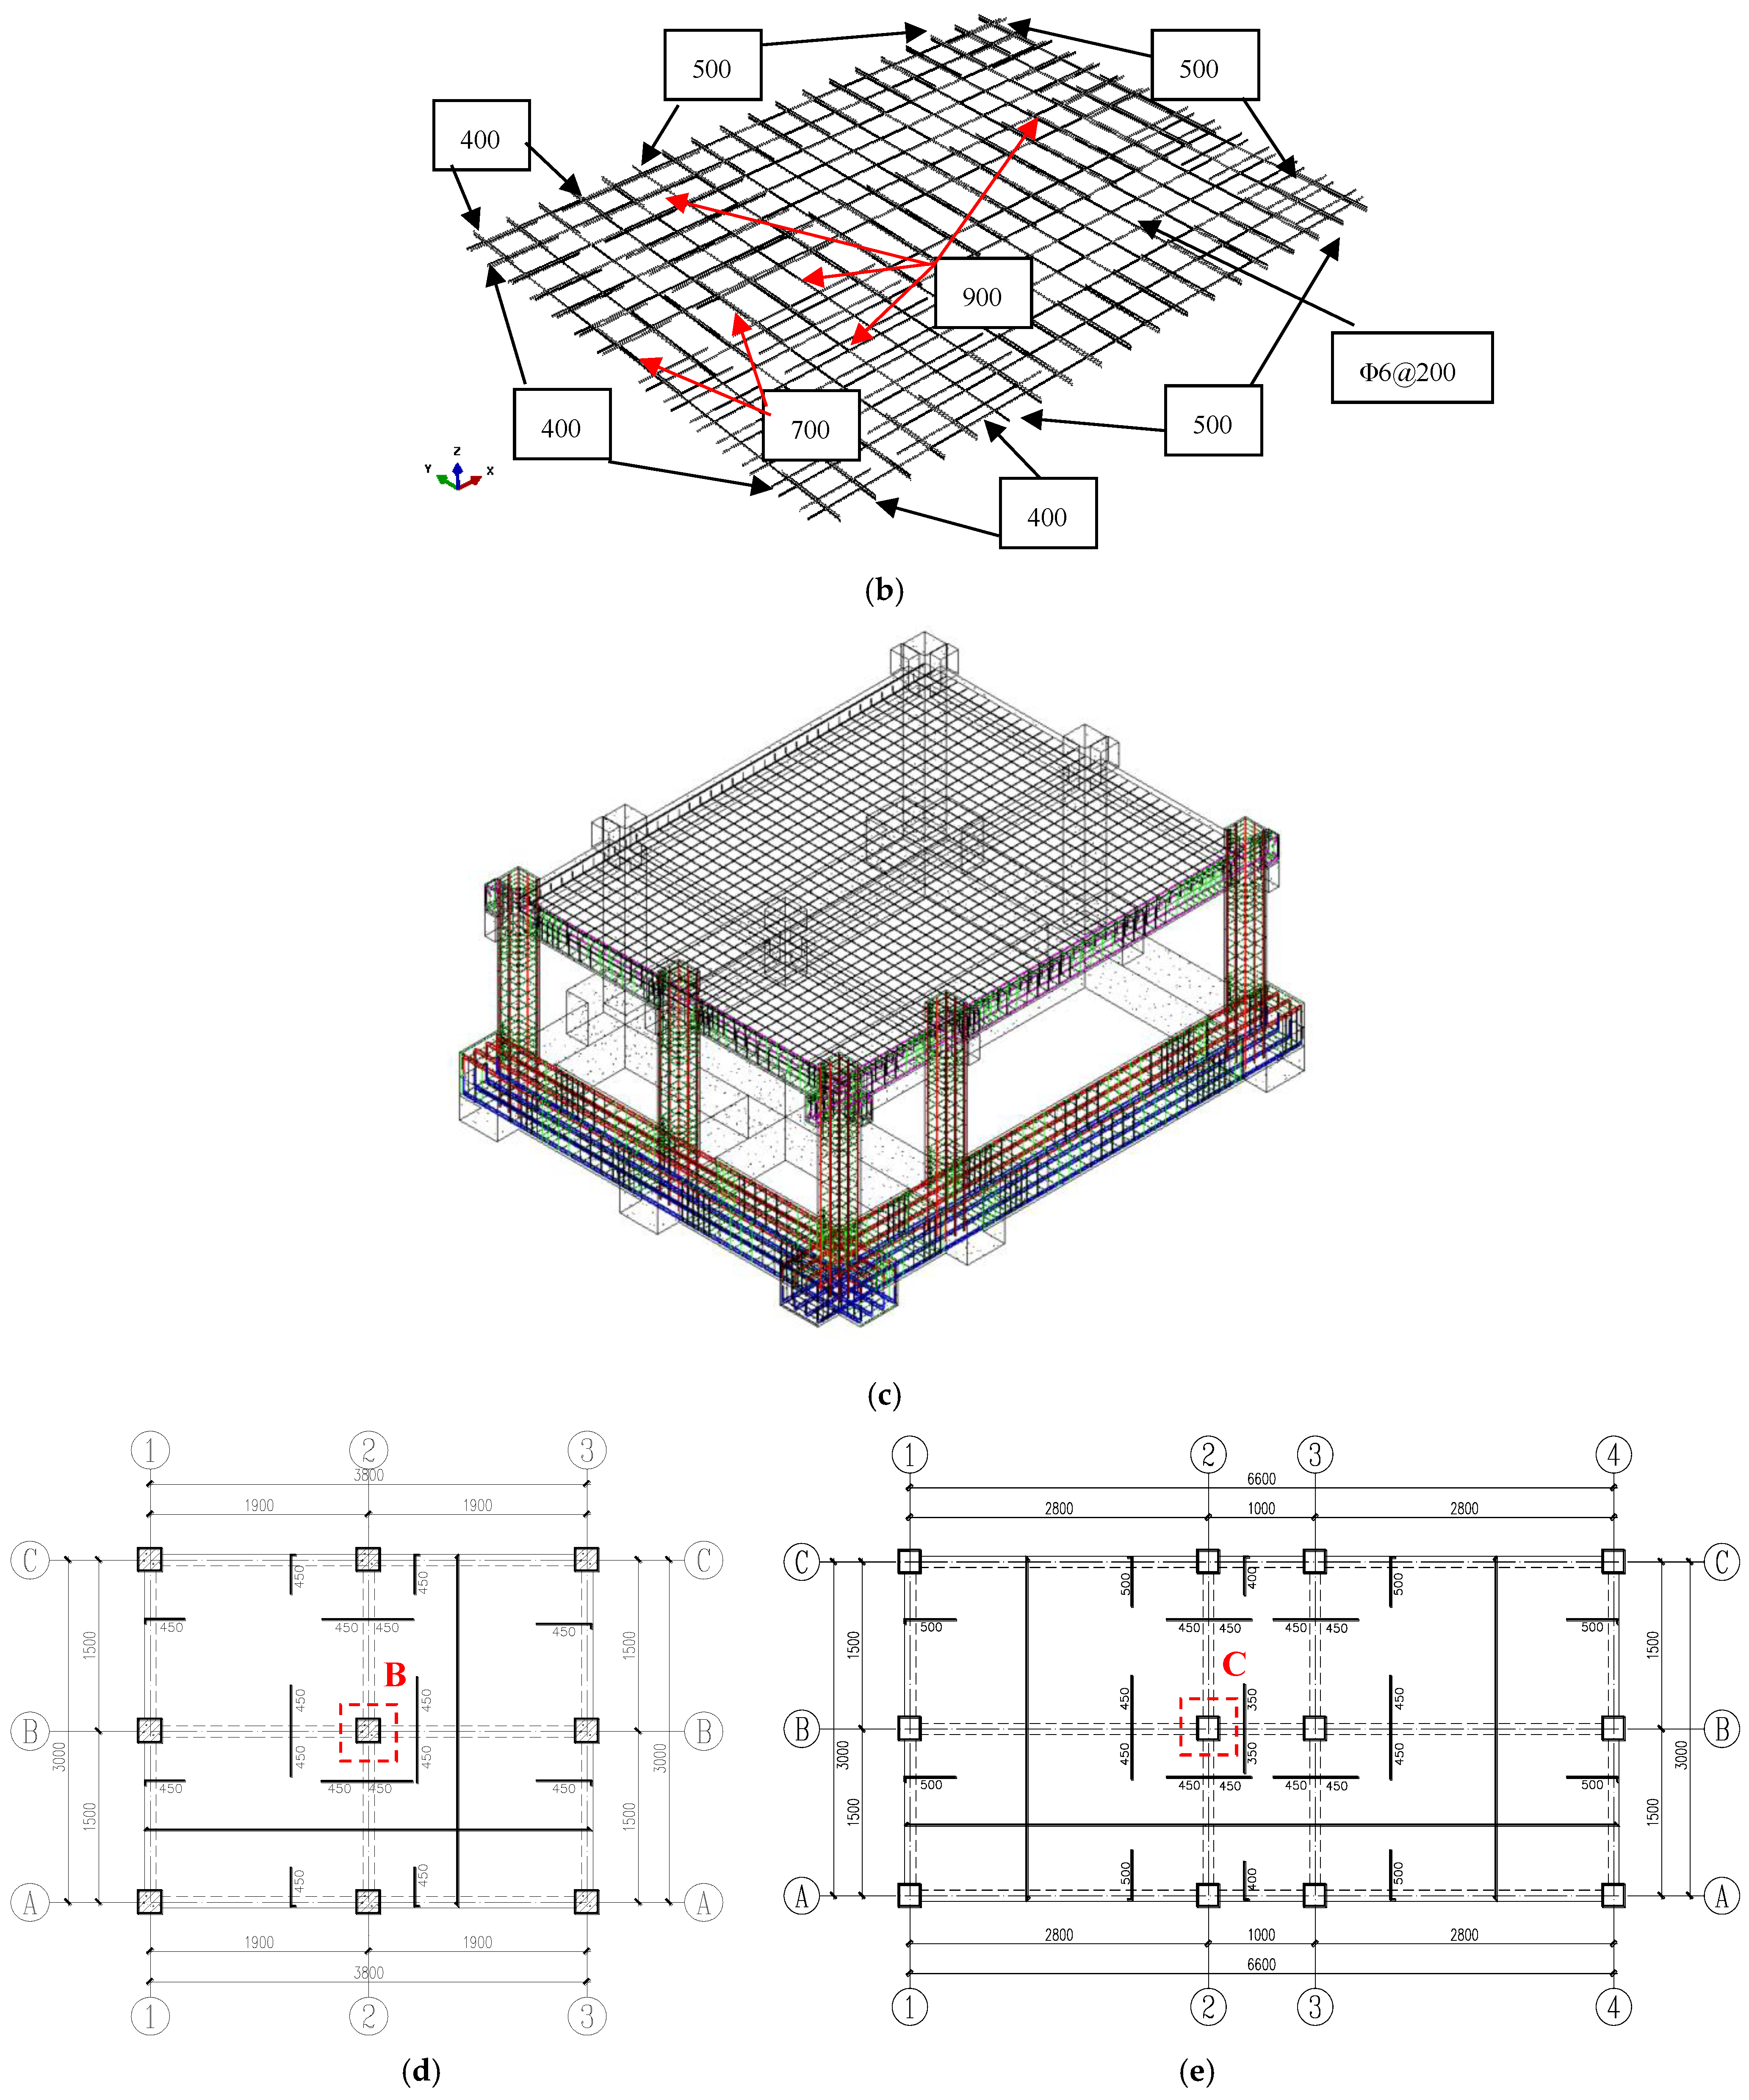
Using Xuankou Middle School, which was damaged during the Wenchuan earthquake, as the prototype structure, a portion of the ground floor from the teaching building was selected for a scaled test with a 1:3 scale ratio. The test featured a 2 × 2 span configuration, utilizing C30 concrete for the samples. The longitudinal reinforcement of the beams and columns comprised HRB400 steel, whereas HPB300 steel was employed for the stirrups and slab reinforcement. Stirrups were spaced 50 mm apart in dense regions and 100 mm apart in nondense regions. The floor slab reinforcement consisted of 6 mm diameter steel bars spaced 200 mm apart. The detailed reinforcement layout of the test sample is illustrated in Figure 3. The finite element model was constructed on the basis of the test data of specimen S1, as reported in reference [13]. The reinforcement details of the S1 beam are provided in Table 3. The accuracy of the finite element model was validated against experimental observations and test data from reference [13].
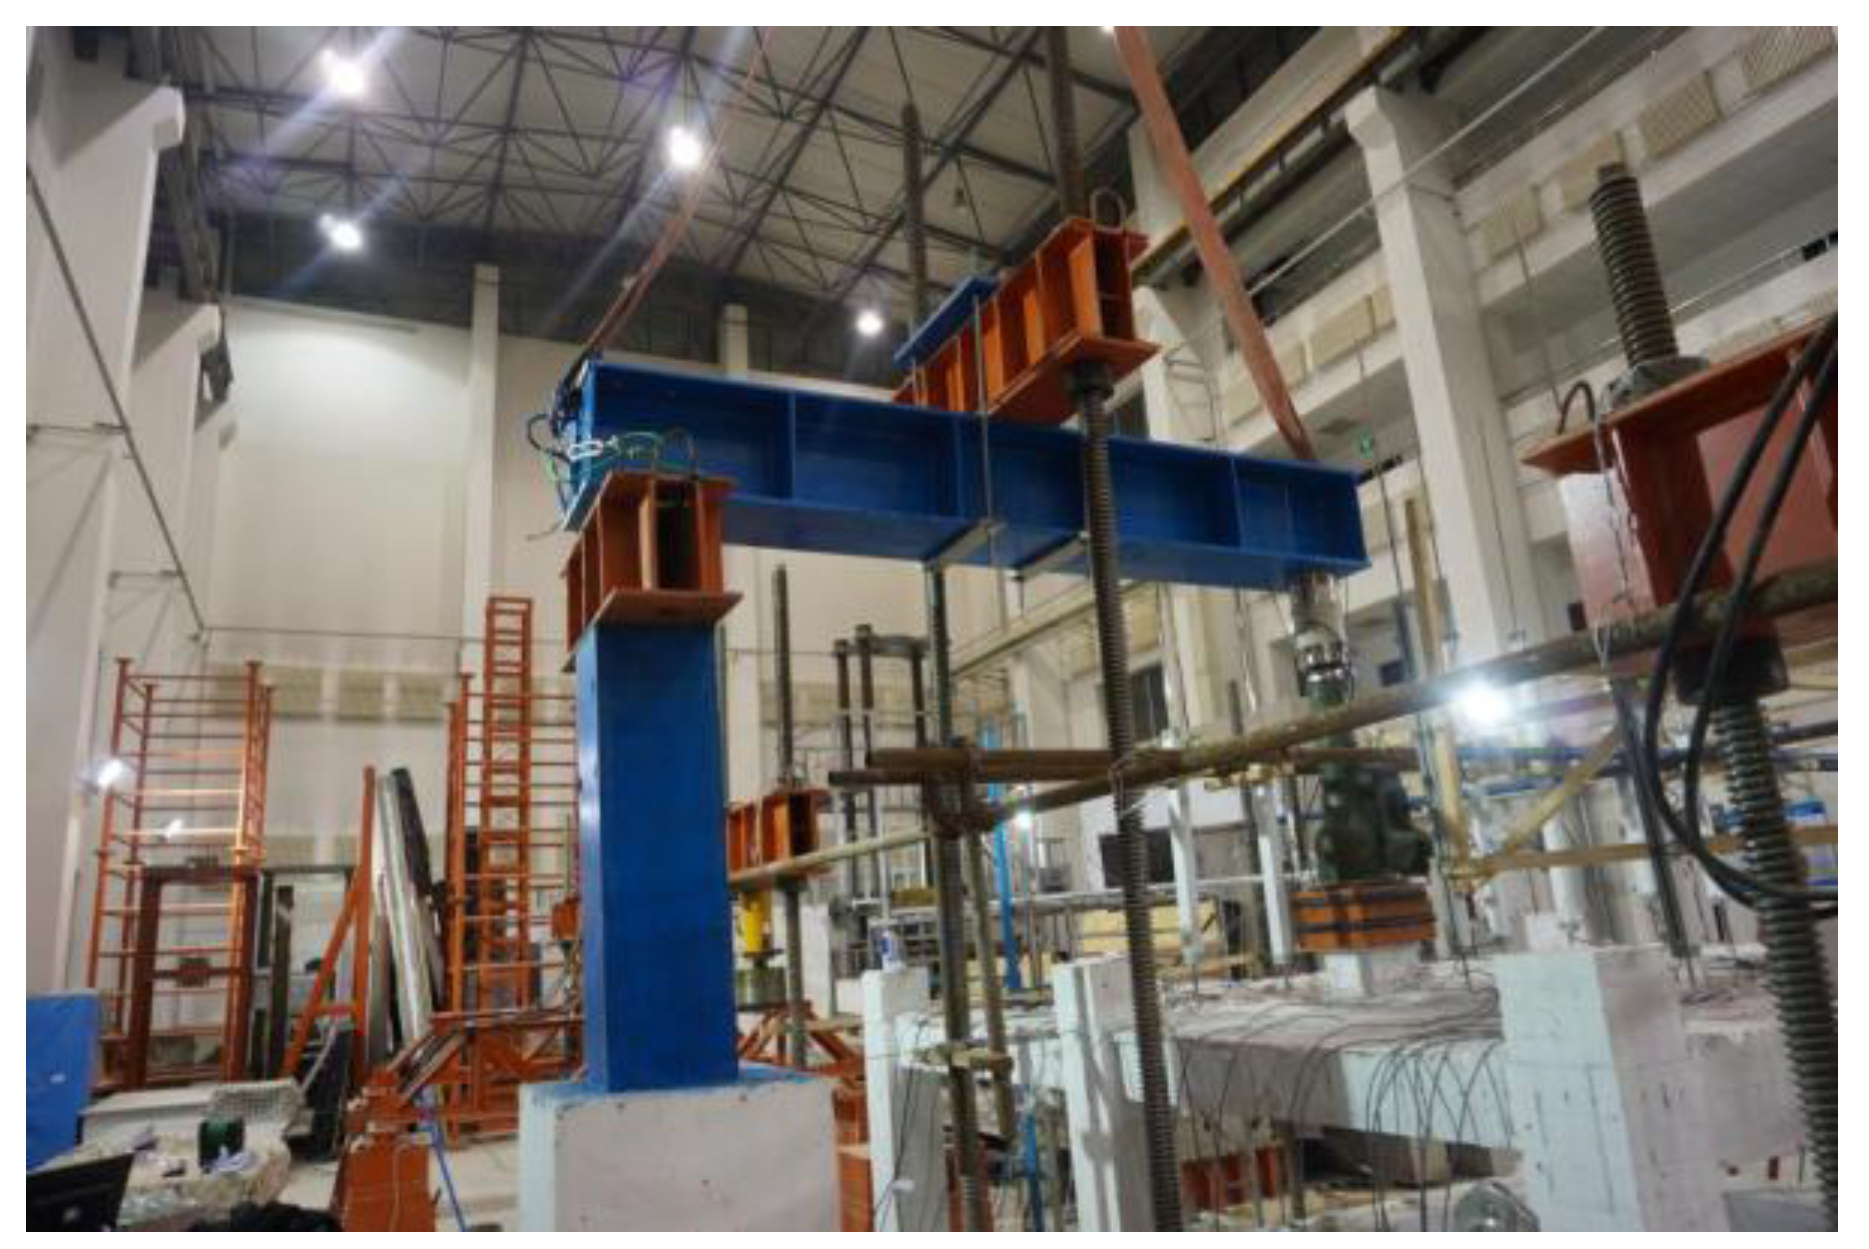
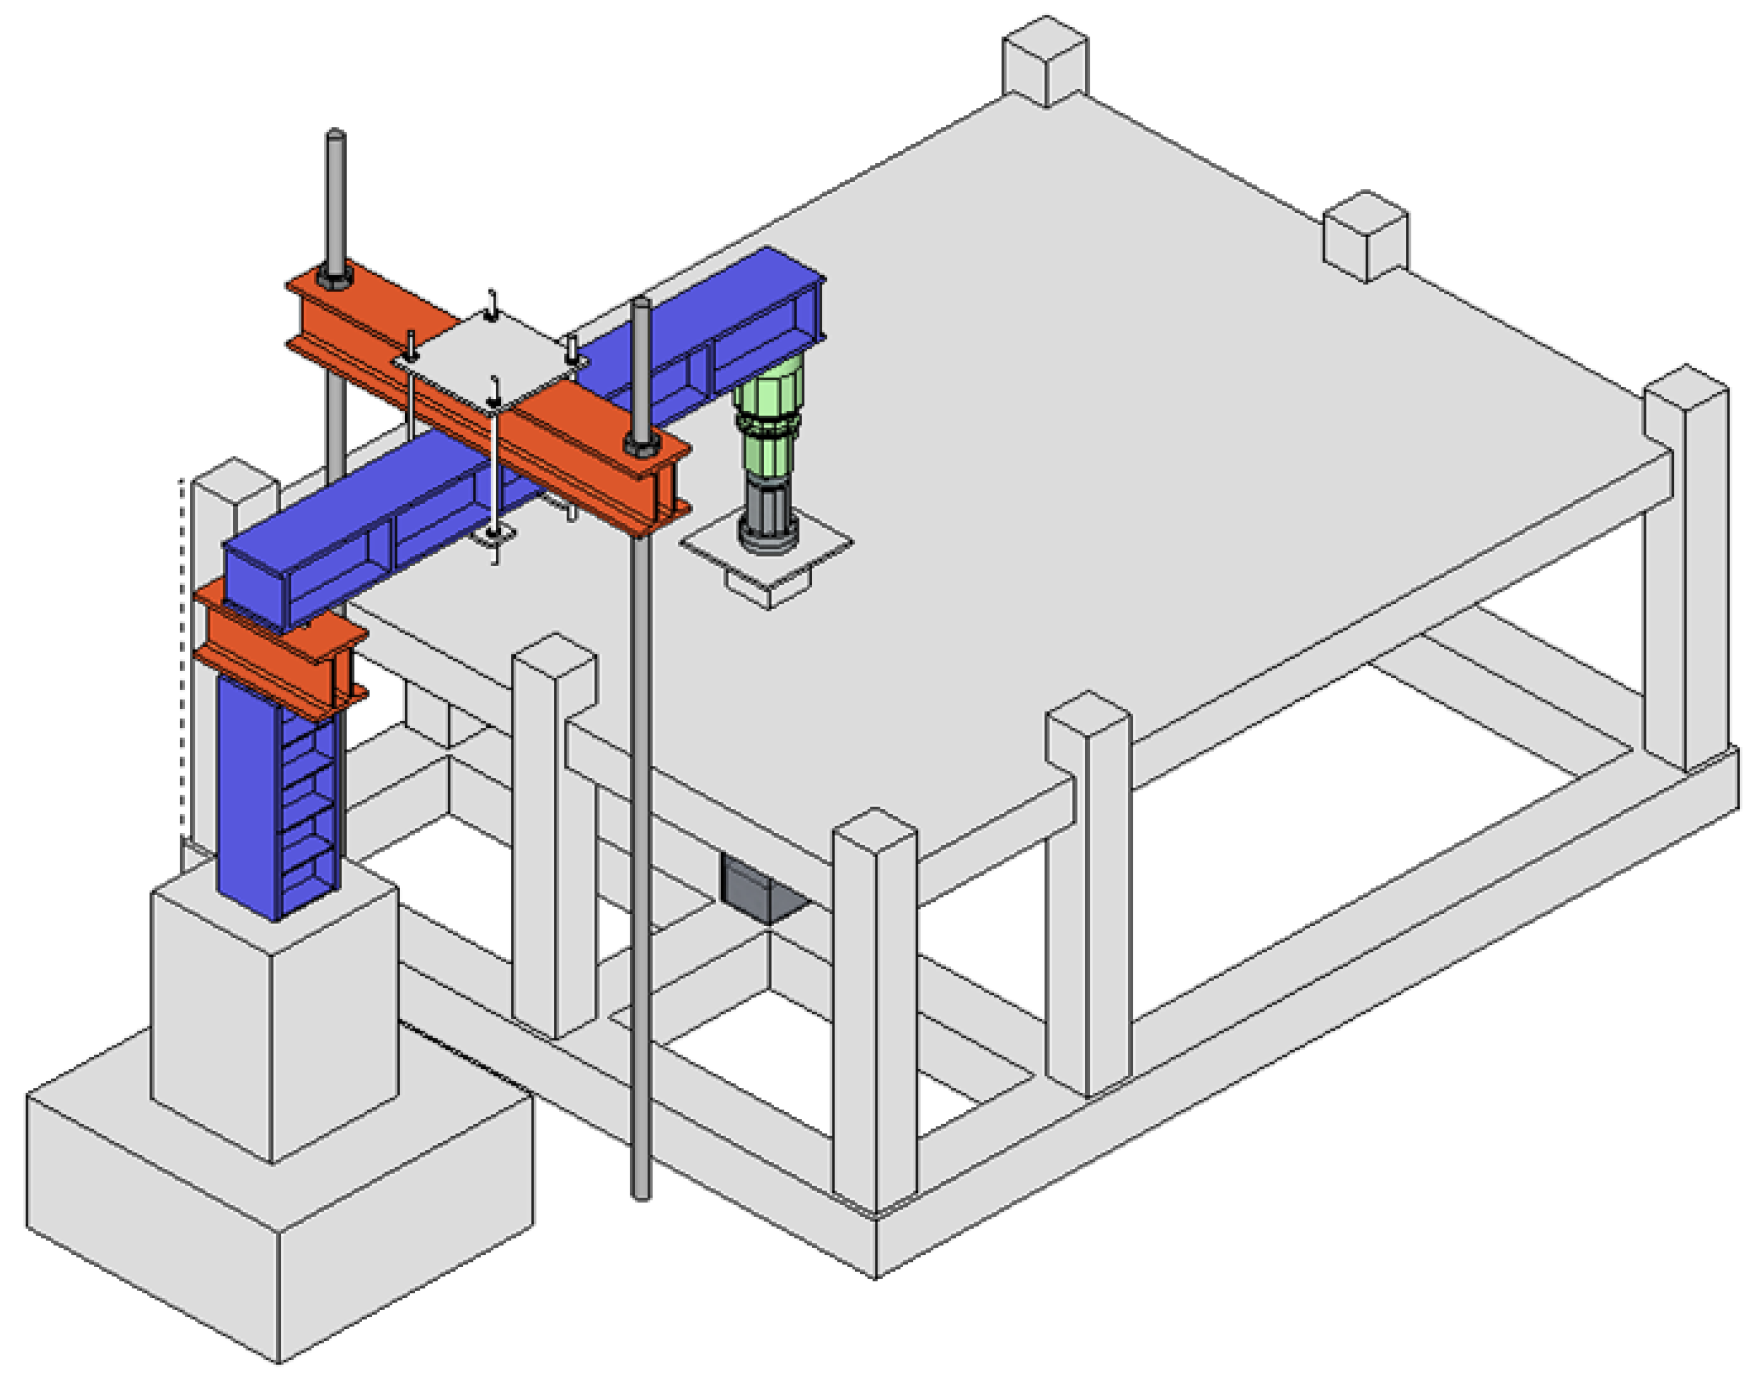
Figure 4 and Figure 5 show the loading setup diagram and 3D schematic of the specimen, respectively, clearly illustrating the loading method and experimental equipment arrangement.
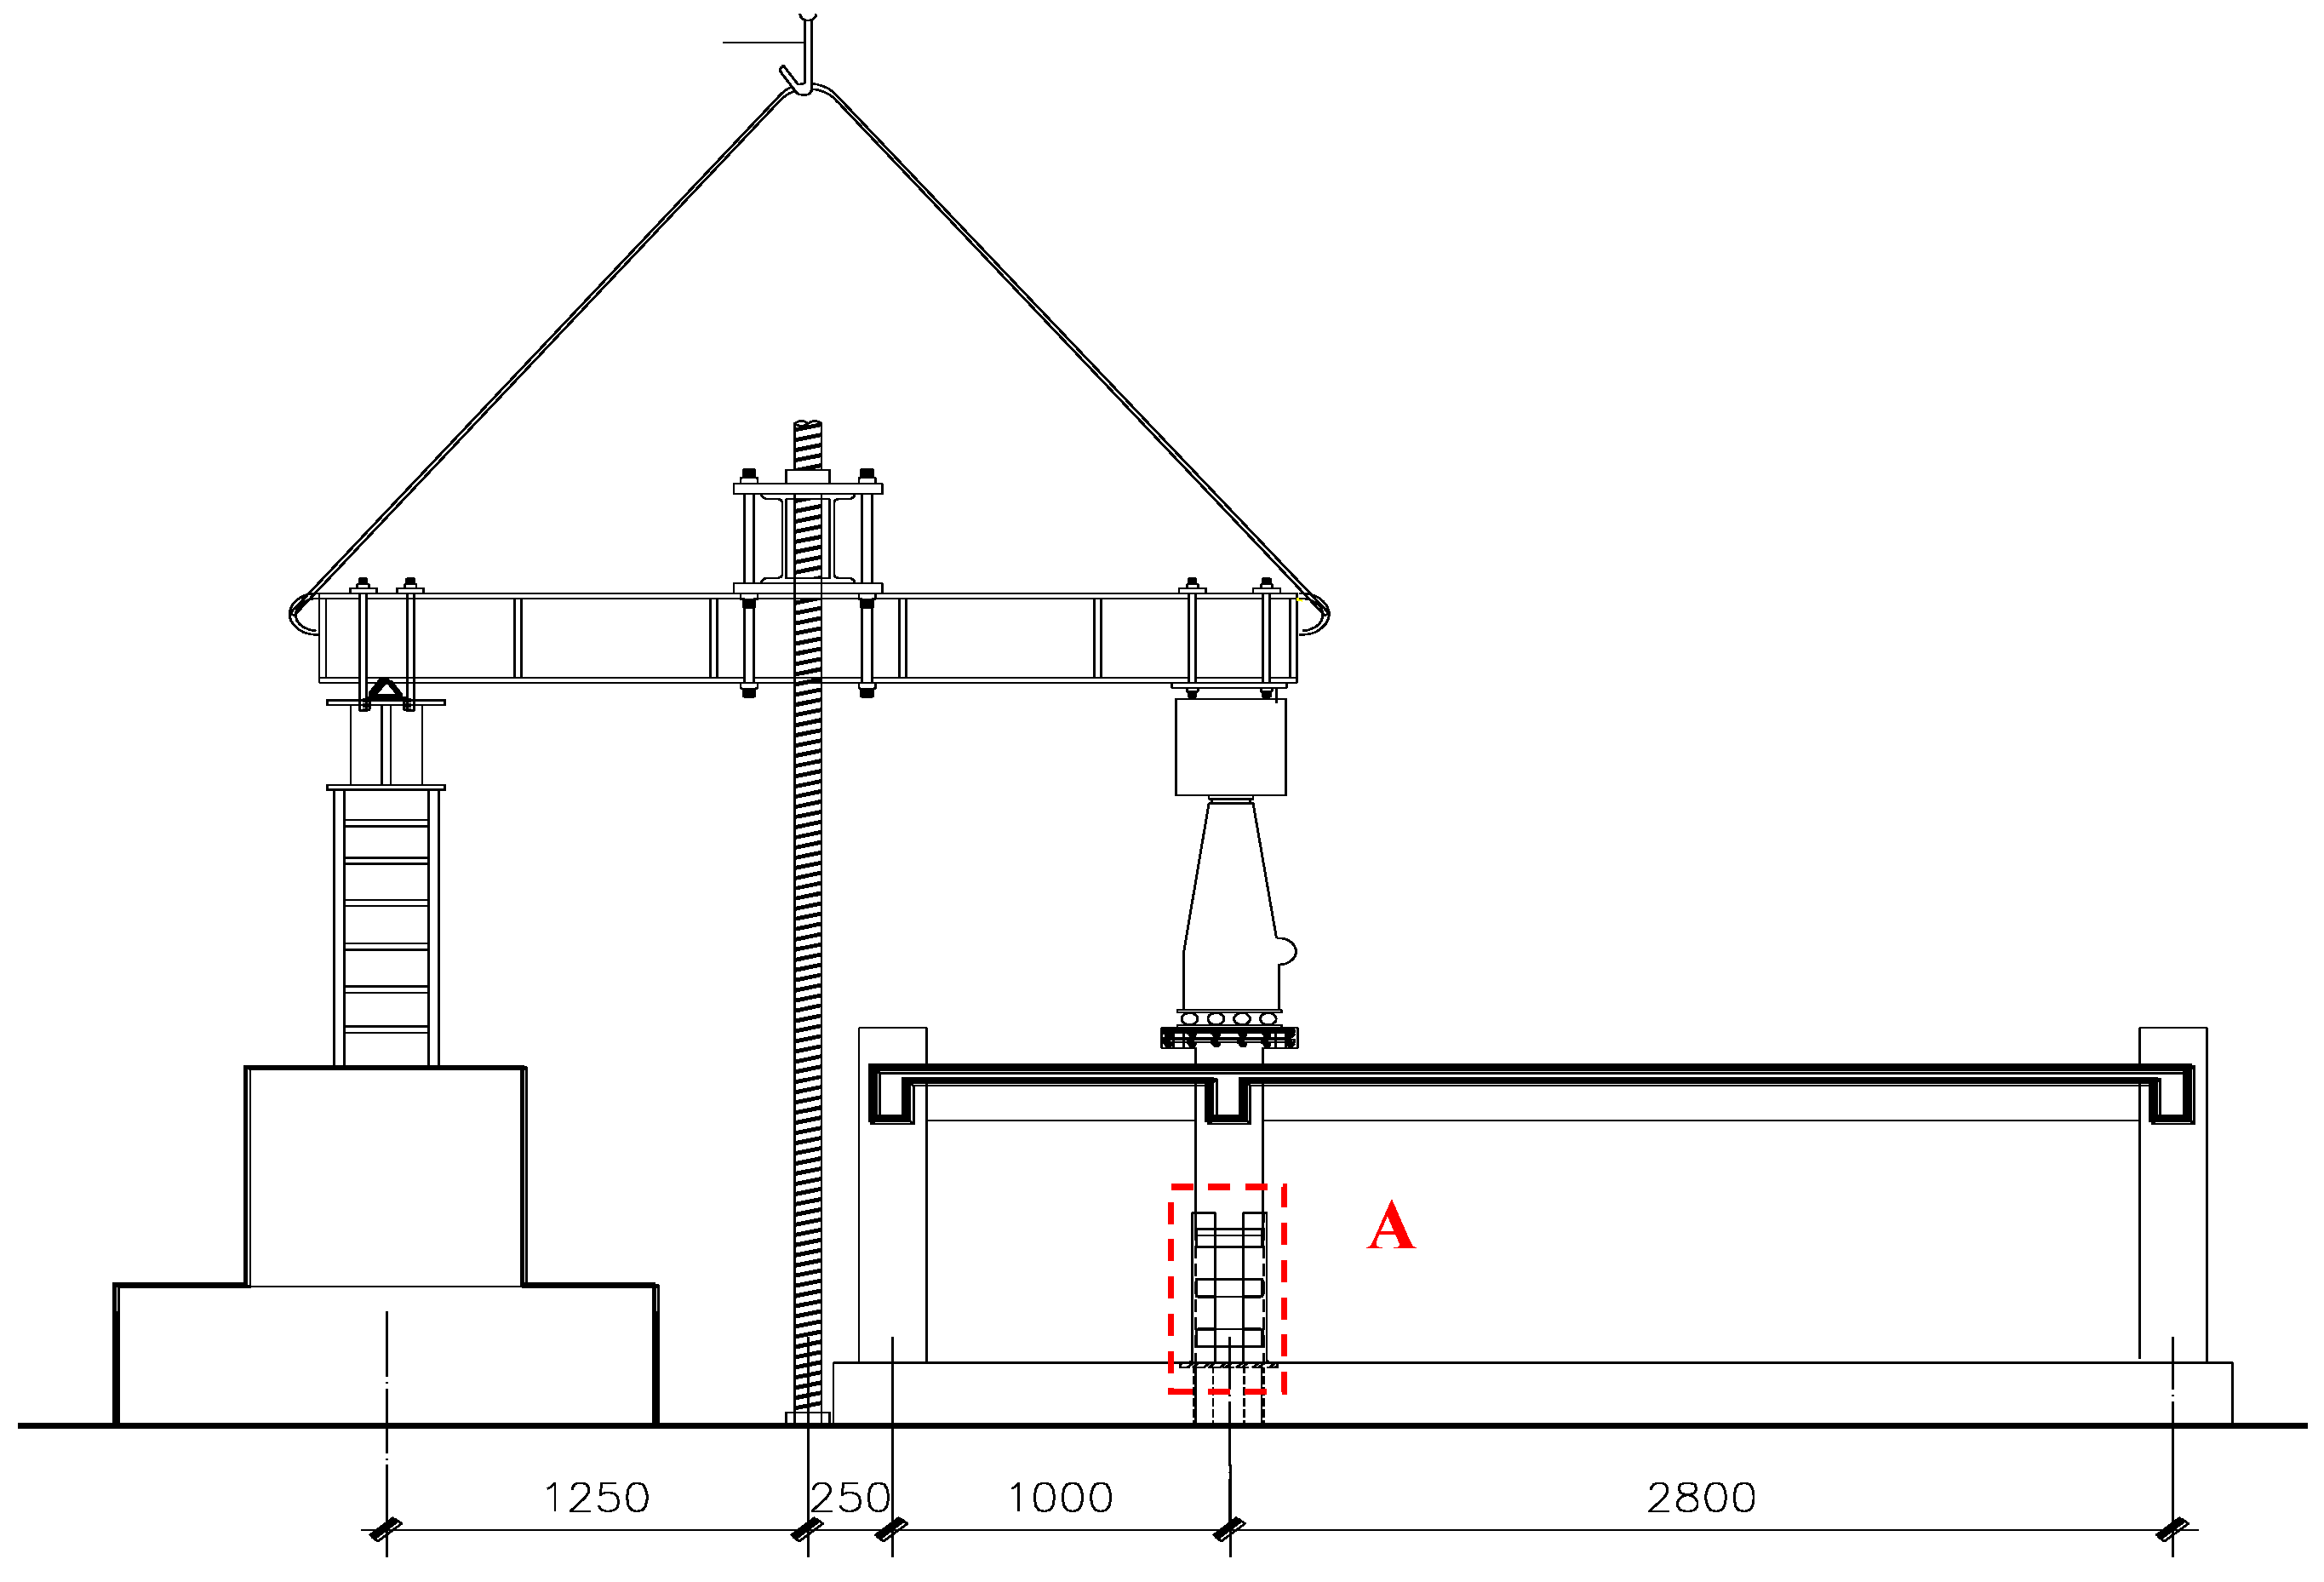
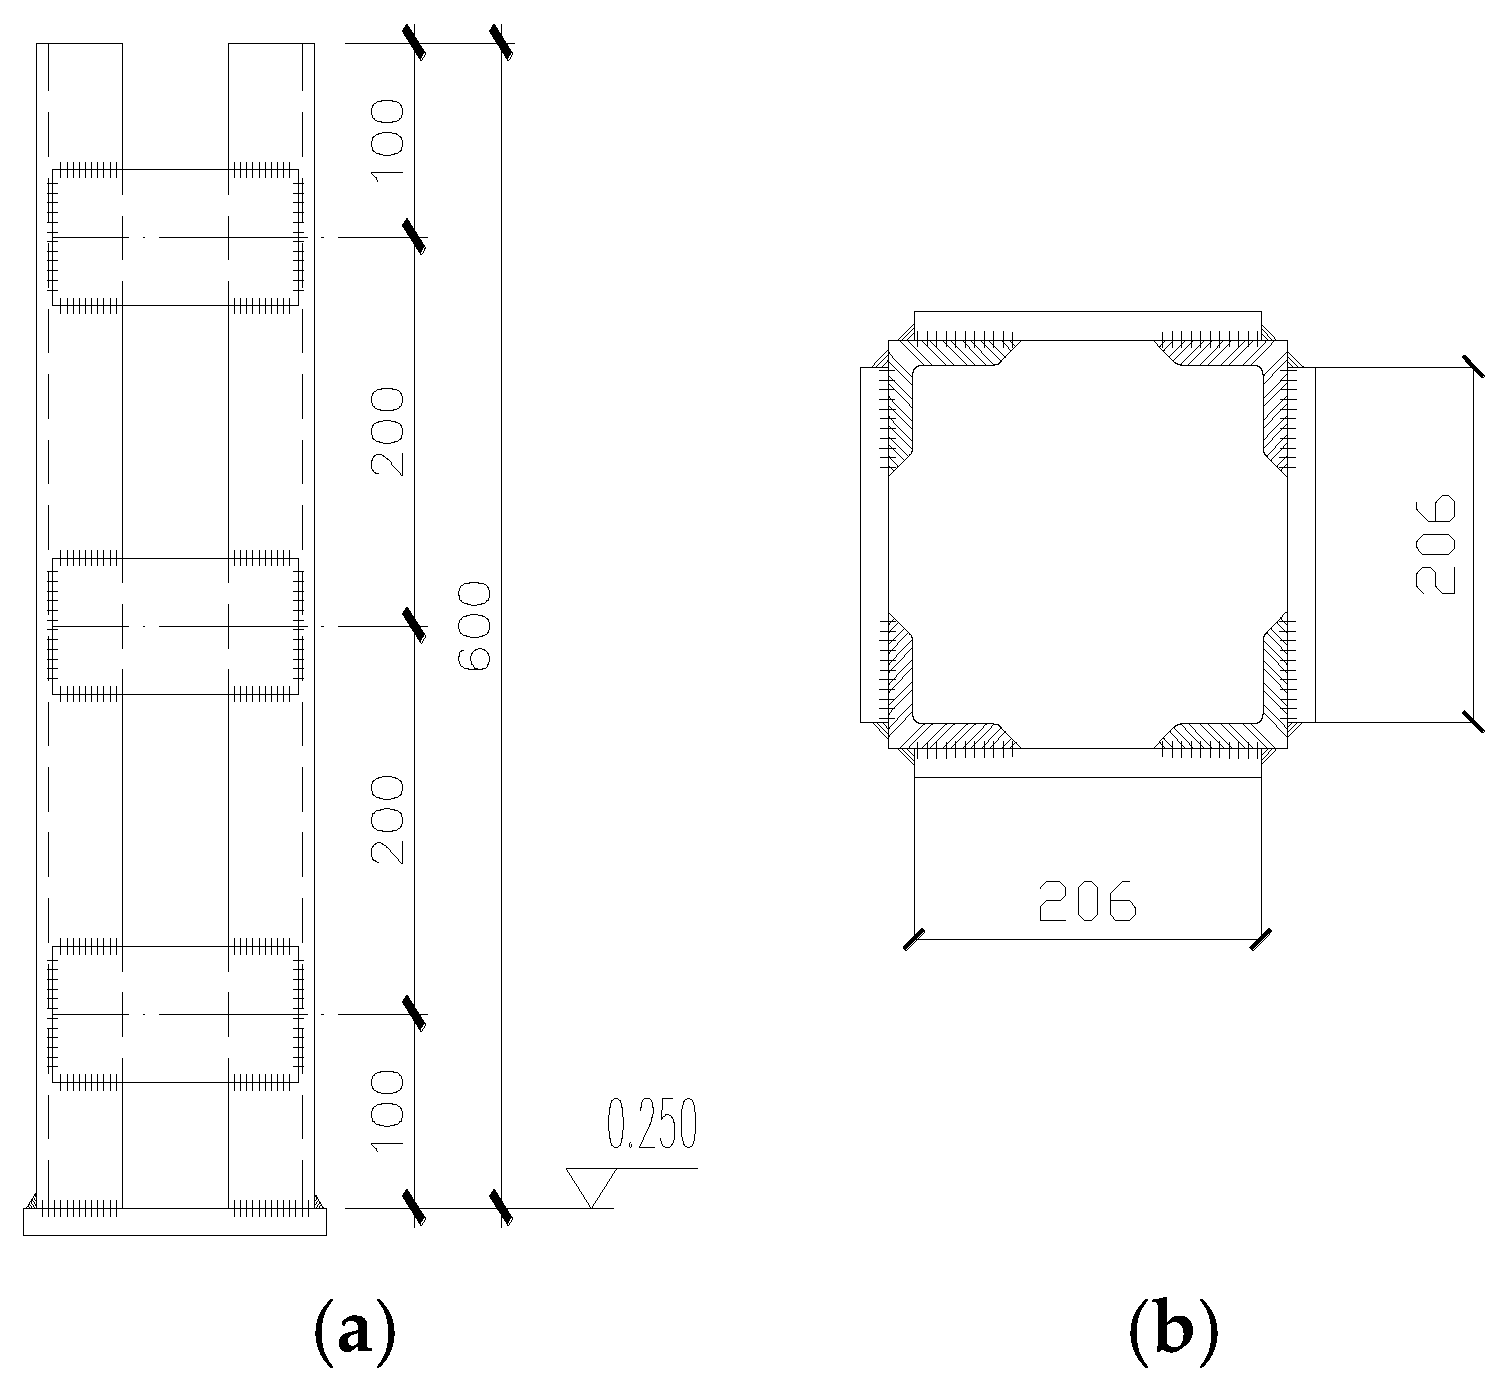
In building structures, the upper floors (second floor and above) of the prototype structure impose restraint effects on the ground floor. The prototype structure also exhibits substantial lateral stiffness at both sides. In the upper structure with removed columns, residual columns retain flexural capacity to constrain eccentric torsion during collapse progression. Under real progressive collapse scenarios, the column-removed section undergoes near-vertical downward collapse, as illustrated in Figure 6. This study designed a vertical collapse-simulating component—a forced alignment sleeve (labeled A in Figure 7, with detailed configuration shown in Figure 8). Prior to testing, the forced alignment sleeve was welded to the ground beam embedded parts using arc welding, implemented in strict accordance with national welding standards.
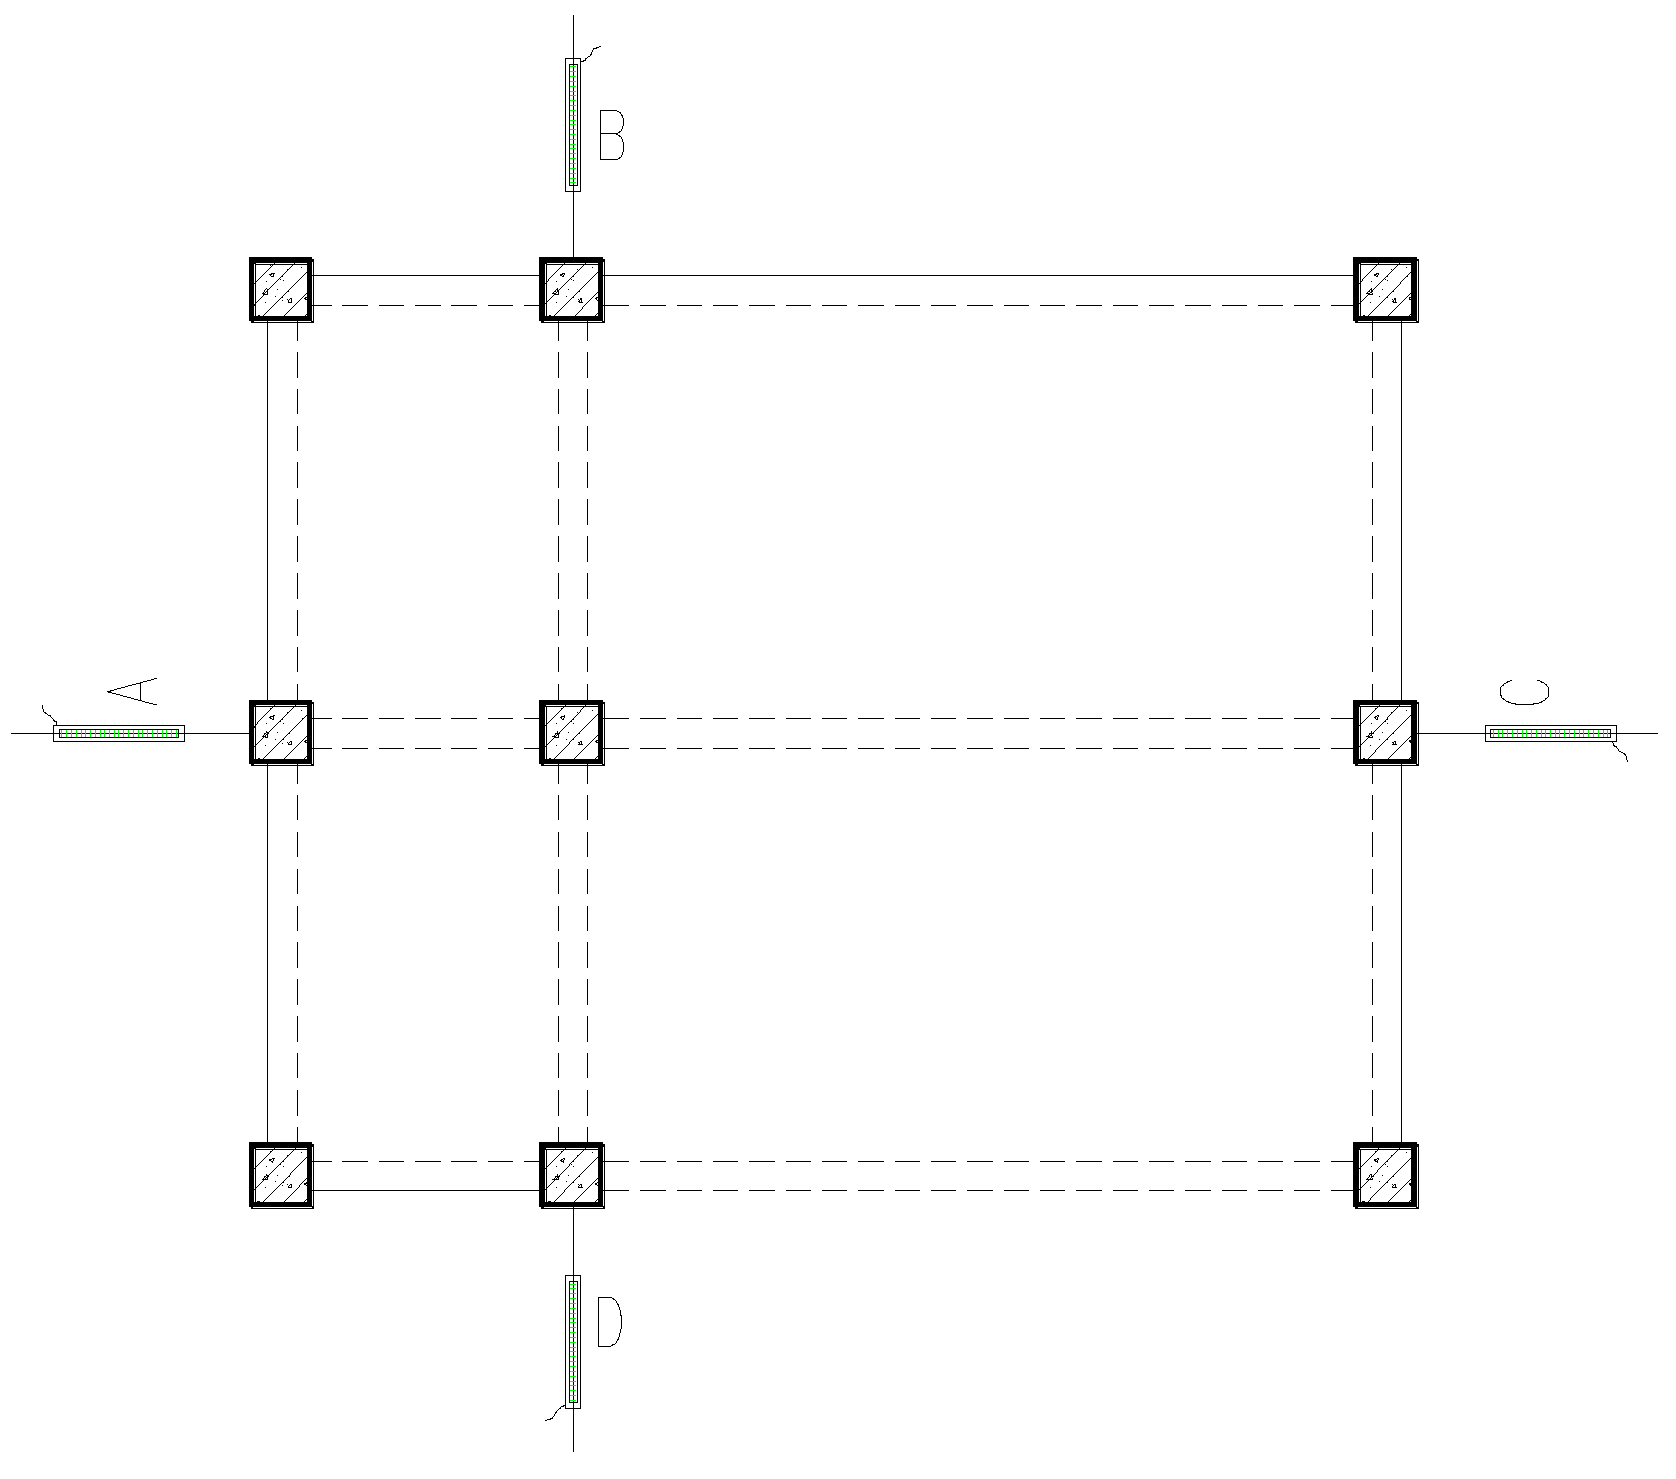
In the experiment, horizontal displacement was measured using displacement transducers. The installation positions of the transducers are indicated by labels A, B, C, and D in Figure 9, with measurement points located at column centerlines and flush with the beam–slab top surfaces. Detailed specimen data can be found in Reference [26].

2.5. Boundary Conditions and Loading Methods

The specimen’s concrete was cast in place, and in the numerical model, the MERGE command was employed to treat the concrete unit as a whole via Boolean operations. The steel bars were embedded in the concrete via the EMBED command, without considering bond-slip effects between the steel bars and the concrete. Owing to the large beam spans on both sides of the failed column, a forced deviation correction sleeve was installed at the column base to prevent eccentric torsion during collapse, which could cause column shifting. Constraints in the U1 and U2 directions were applied at the top of the failed inner column. During loading, the failure of the inner column was restricted to vertical displacement in the U3 direction. A fixed constraint method was applied at the column base. The numerical simulation employed a mixed force–displacement loading method, and a coupling reference point was established at the top of the failed column for load application. To mitigate oscillations in the finite element results during large deformations, the model utilized the display integration method in the ABAQUS analysis module.

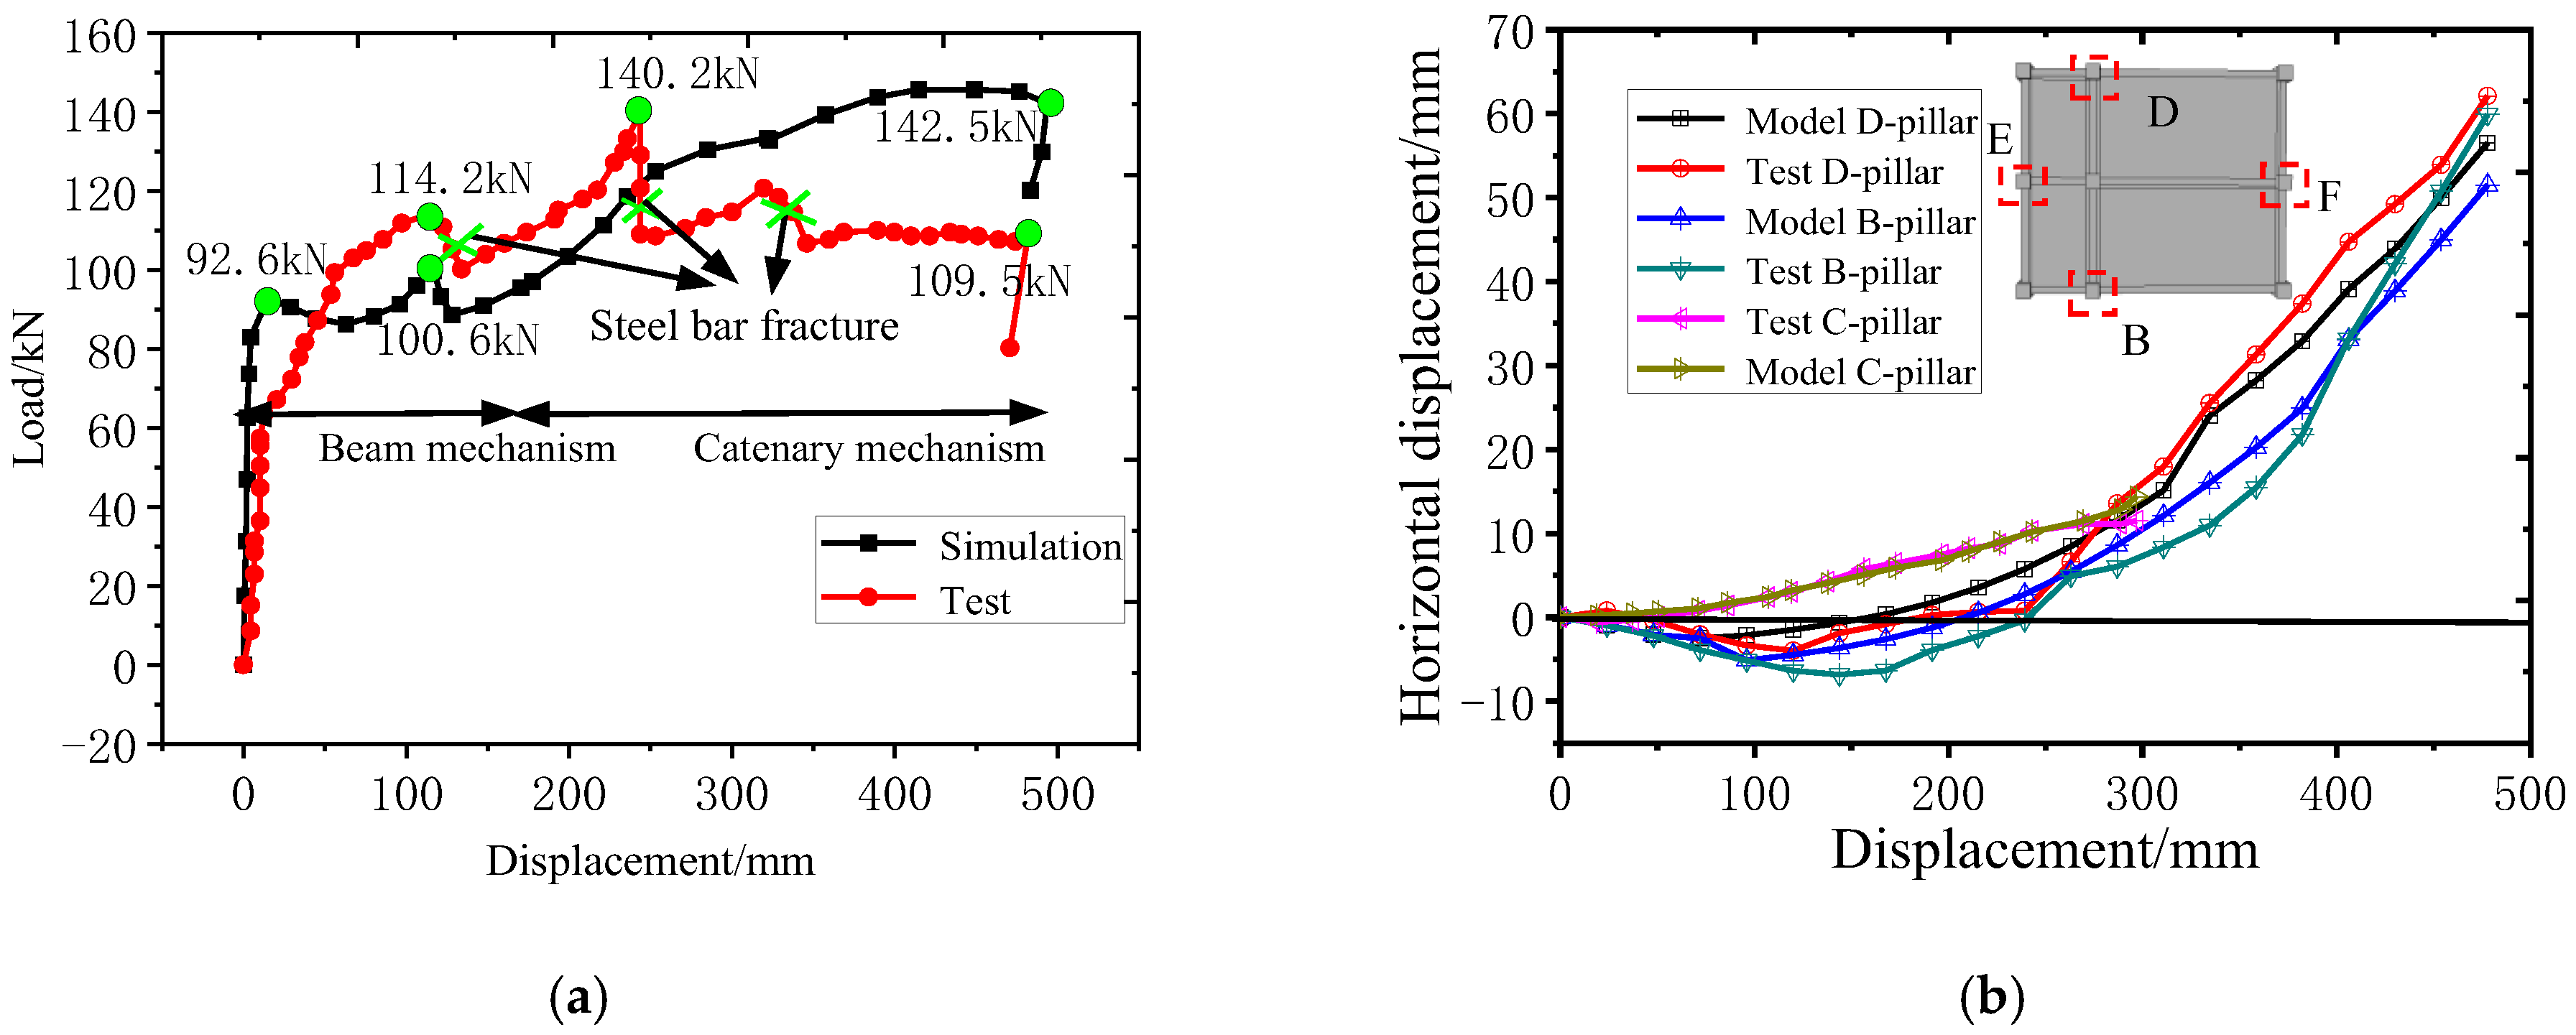
2.6. Load–Displacement Curve and Column Horizontal Displacement

In the load–displacement curve (Figure 10a), the numerical simulation reached the beam mechanism peak earlier than the test value did. Two decreases in the bearing capacity were observed during the beam mechanism stage. At the second drop in bearing capacity, the deformation in the numerical simulation agreed with that observed in the test. The peak load of the beam mechanism was 100.6 kN in the numerical simulation and 114.2 kN in the test. During the test, force-controlled loading could not accurately control the deformation development after cracking before the specimen reached its ultimate load, resulting in relatively slow crack propagation and a higher degree of crack closure in the early stage. In the numerical simulation, displacement-controlled loading was adopted, which could more stably control the cracking process, leading to a more sufficient and pronounced degree of concrete cracking in the simulation compared to that in the early test stage. Due to the lower degree of concrete cracking induced by force-controlled loading in the early test stage relative to the simulation, the beam mechanism in the test was activated later, causing the peak of the beam mechanism to be “delayed”. Consequently, the test peak value differed from the numerical simulation peak by 13.6 kN, corresponding to an error of 13.5%.
As the displacement of the failed column increased during the test, the specimen transitioned from the beam mechanism to the catenary mechanism. As the floor slab reinforcement became effective, the specimen’s bearing capacity gradually increased. During testing, the bearing capacity decreased sharply at a failure column displacement of 240 mm because of the floor slab reinforcement fracture. At this point, the bearing capacity reached its maximum value of 140.2 kN. At a failed column displacement of 350 mm, the side columns in the short-span area were pulled out during the large deformation stage, leading to overall failure of the short-span area. The middle column failure transitioned into side column failure, causing the final destruction of the sample. The final bearing capacity of each sample stabilized at approximately 110 kN. In the numerical simulation, the side columns in the short-span plate-belt area did not fail, as the tensioning effect of the beam and slab reinforcement maintained the residual bearing capacity. This allowed the bearing capacity of the finite element model to increase gradually until the beam-end concrete was crushed, reaching a maximum catenary mechanism capacity of 142.5 kN. The main reason for the discrepancy between the test and the numerical simulation was that the exterior column joints and the tie action of the reinforcement were idealized in the simulation. This idealization failed to accurately capture the pull-out failure of the exterior columns in the short-span region and the fracture of the reinforcement under large deformations, resulting in a bearing capacity degradation mechanism in the later stage that differed from that observed in the test.
The specific locations of side columns E, B, F, and D are shown in Figure 10b, which compares the horizontal displacements of side columns B and D during the collapse process in both the numerical simulation and the experiment. Before the displacement of the failed column reached 200 mm, the horizontal displacements of side columns B and D were negative, indicating initial outward movement of the structure. As the vertical displacement of the failed column increased, the beam–slab end formed a fully developed plastic hinge, causing side columns B and D to move inward due to the tension in the floor slab. At a specimen displacement of 480 mm, the experimental horizontal displacement of column B was 57 mm, whereas the numerical simulation displacement was 52 mm, resulting in a difference of 8.7%. For column D, the experimental horizontal displacement was 62 mm, and the numerical simulation predicted 56 mm, yielding a difference of 9.6%. Severe node damage during the test of side column A caused the column end to be pulled out, leading to excessively large displacement readings. Only the horizontal displacement of the far-end column F was recorded before the displacement of the failed column reached 300 mm. E comparison of the test data and numerical simulation data revealed that the values were relatively close.

2.7. Failure Mode Comparison

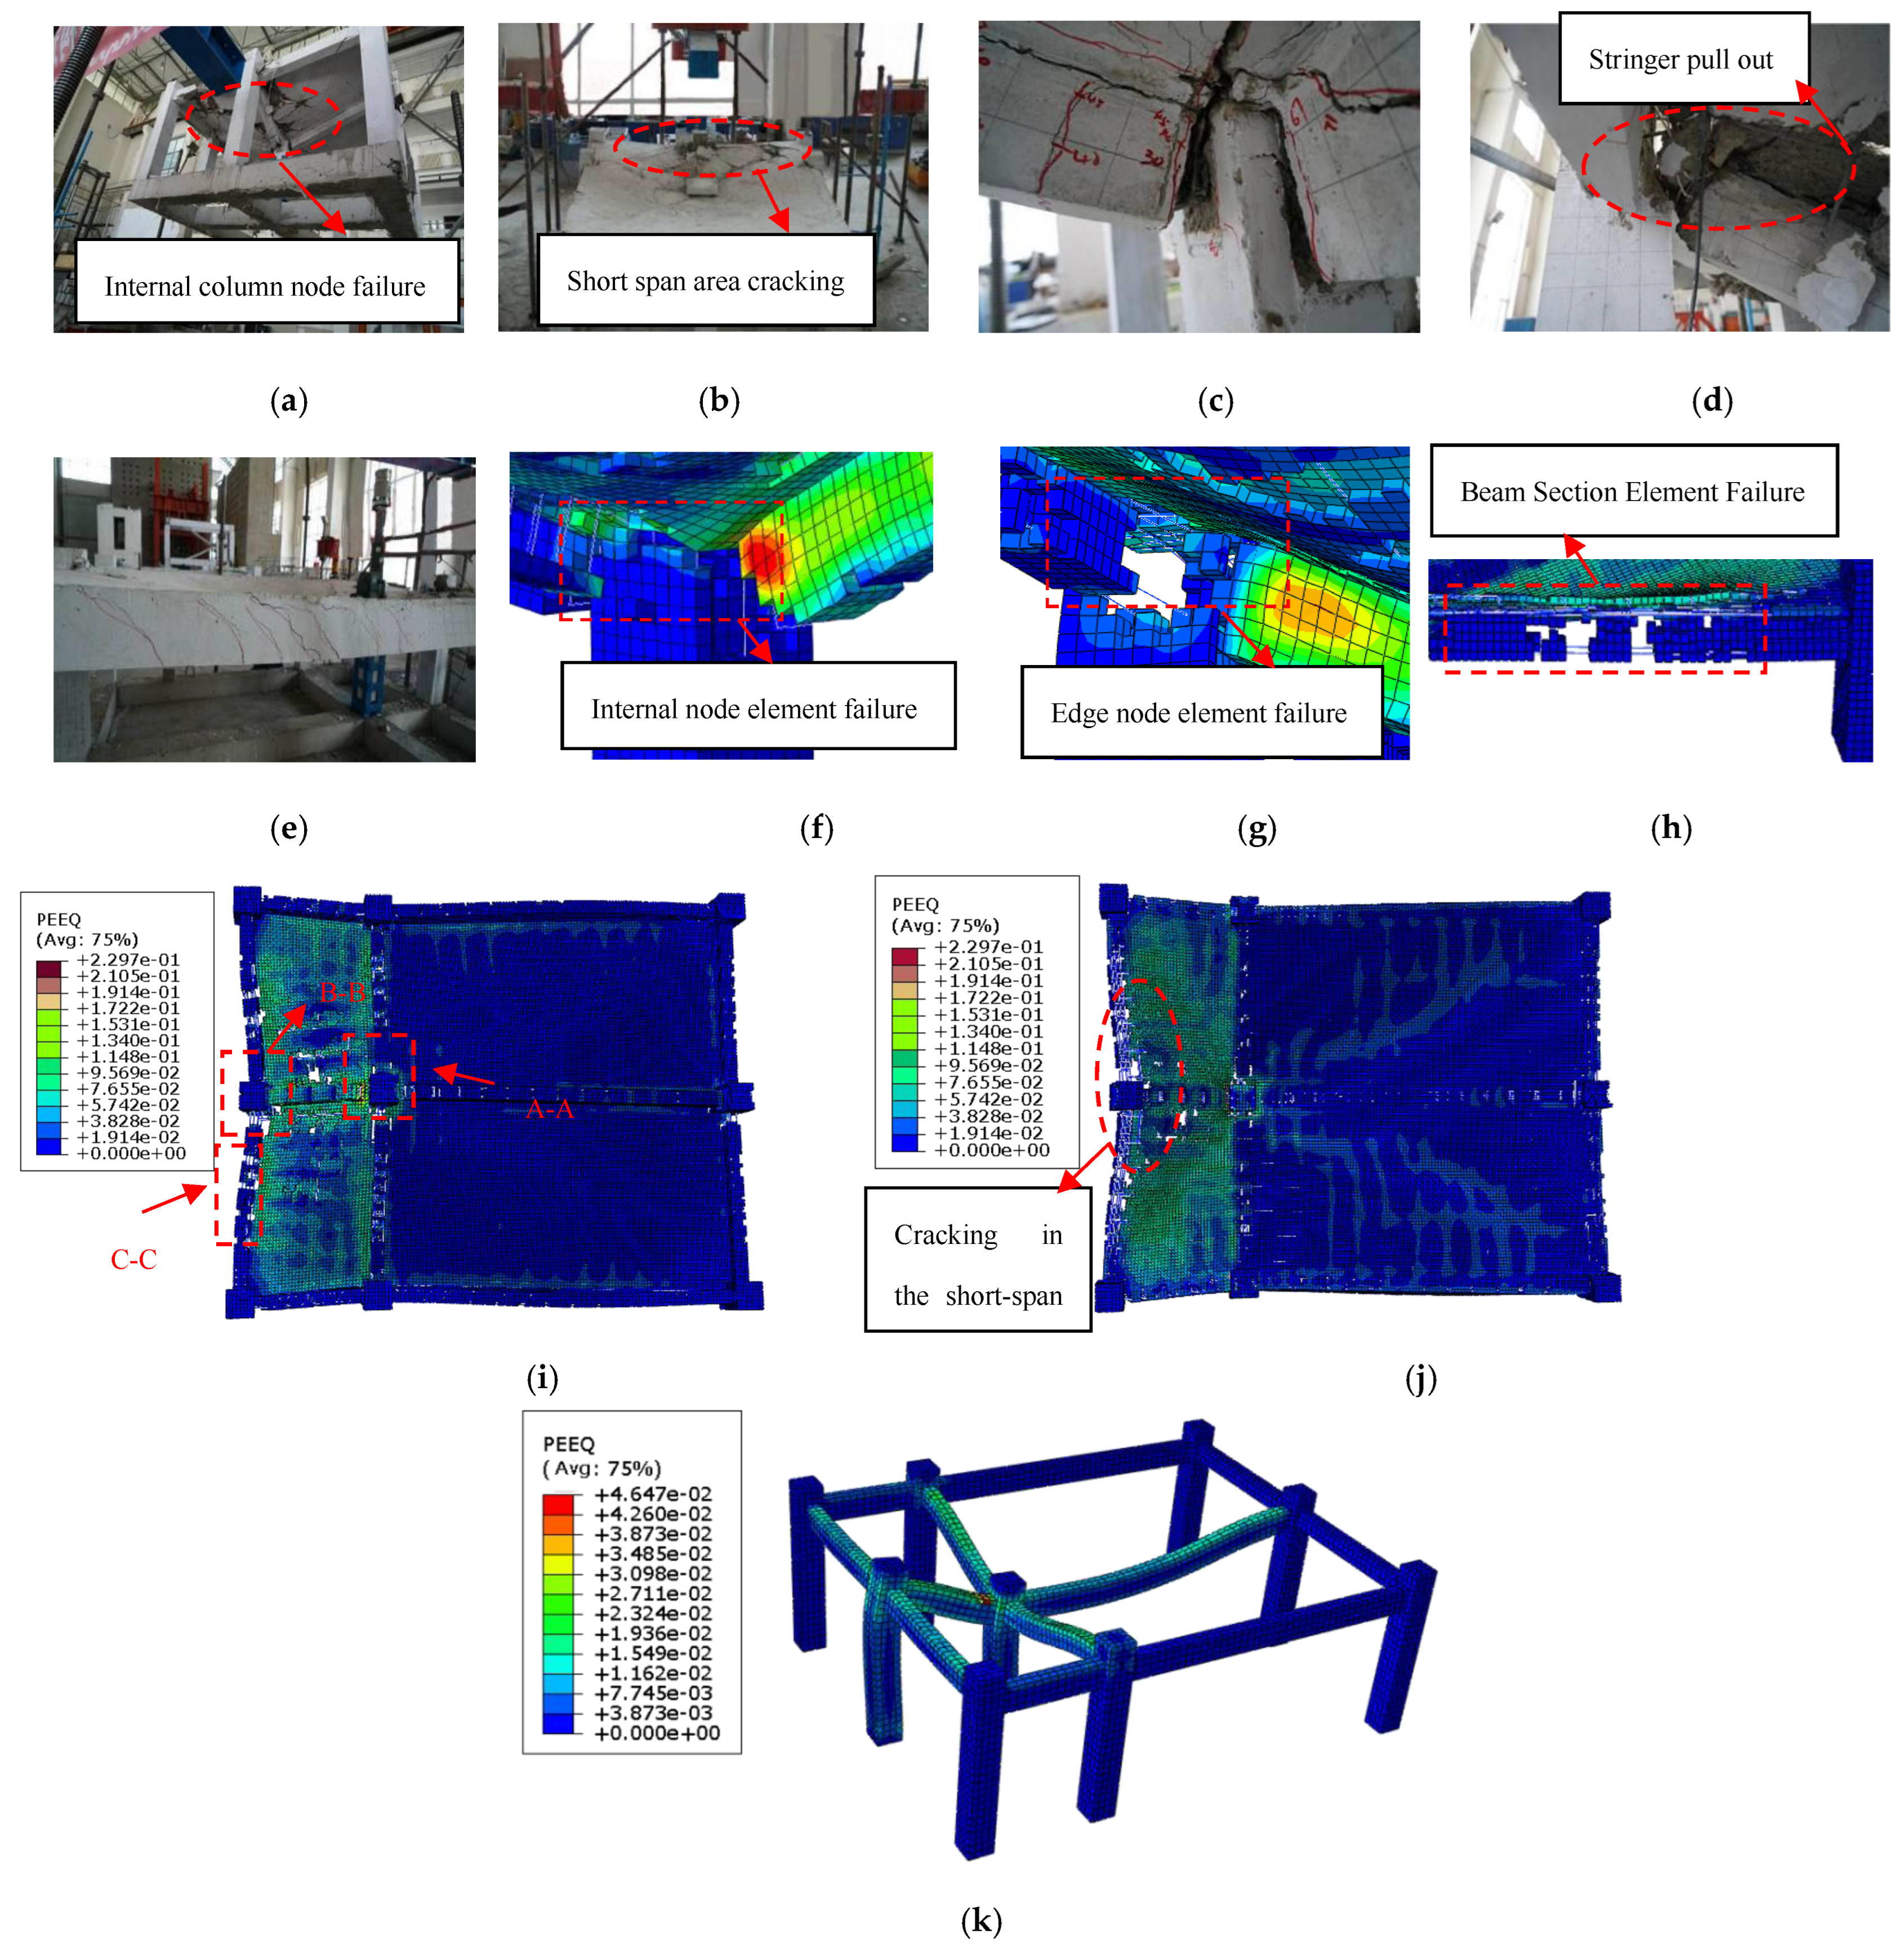
As shown in Figure 11a,b, upon completion of the test, most of the concrete near the short-span slab belt area was crushed. The lower section of the beam, which ended at the inner column node (A-A), exhibited cracks, as shown in Figure 11c. The longitudinal beam at the edge node (B-B) was pulled out, as illustrated in Figure 11d. Additionally, the edge cross beam (C-C) experienced tensile forces from the slab, resulting in numerous torsional cracks, as shown in Figure 11e. The corresponding model diagrams are provided in Figure 11f–h. The equivalent plastic strain cloud diagram from the finite element model was analyzed, revealing unit failure when the maximum principal strain reached ε max = 0.01. Figure 11i,j demonstrates that the concrete damage near the short-span plate-belt area in the numerical model closely aligns with the test results, primarily occurring near the failed inner column. The damage at the inner column node (A-A) and edge column node (B-B) was severe, with numerous units failing. The node damage corresponded closely to the test results. Additionally, the edge beam (C-C) unit failed, indicating significant torsional damage under large deformation, which caused the unit to exceed its strain limit. The edge beam damage observed in the test aligned with the simulated distribution. A comparison of the numerical simulation and experimental failure phenomena revealed that the simulation effectively reflected the experimental results.

3. Factors Affecting Vertical Collapse

3.1. Unequal Span Layout

To examine the impact of unequal span arrangements on the structural bearing capacity under inner column failure, three substructures were established: the outer corridor frame (A1/A2). The size and reinforcement of A1 are shown in Figure 3a. A2 is identical to A1 in other aspects, with the floor removed from A1. The equal span model (B1/B2). The size and reinforcement of B1 are shown in Figure 3d. A2 is the same as A1 in other aspects, with the floor removed from B1. The inner corridor frame (C1/C2). The size and reinforcement of C1 are shown in Figure 3e. A2 is the same as A1 in other aspects, with the floor removed from C1.
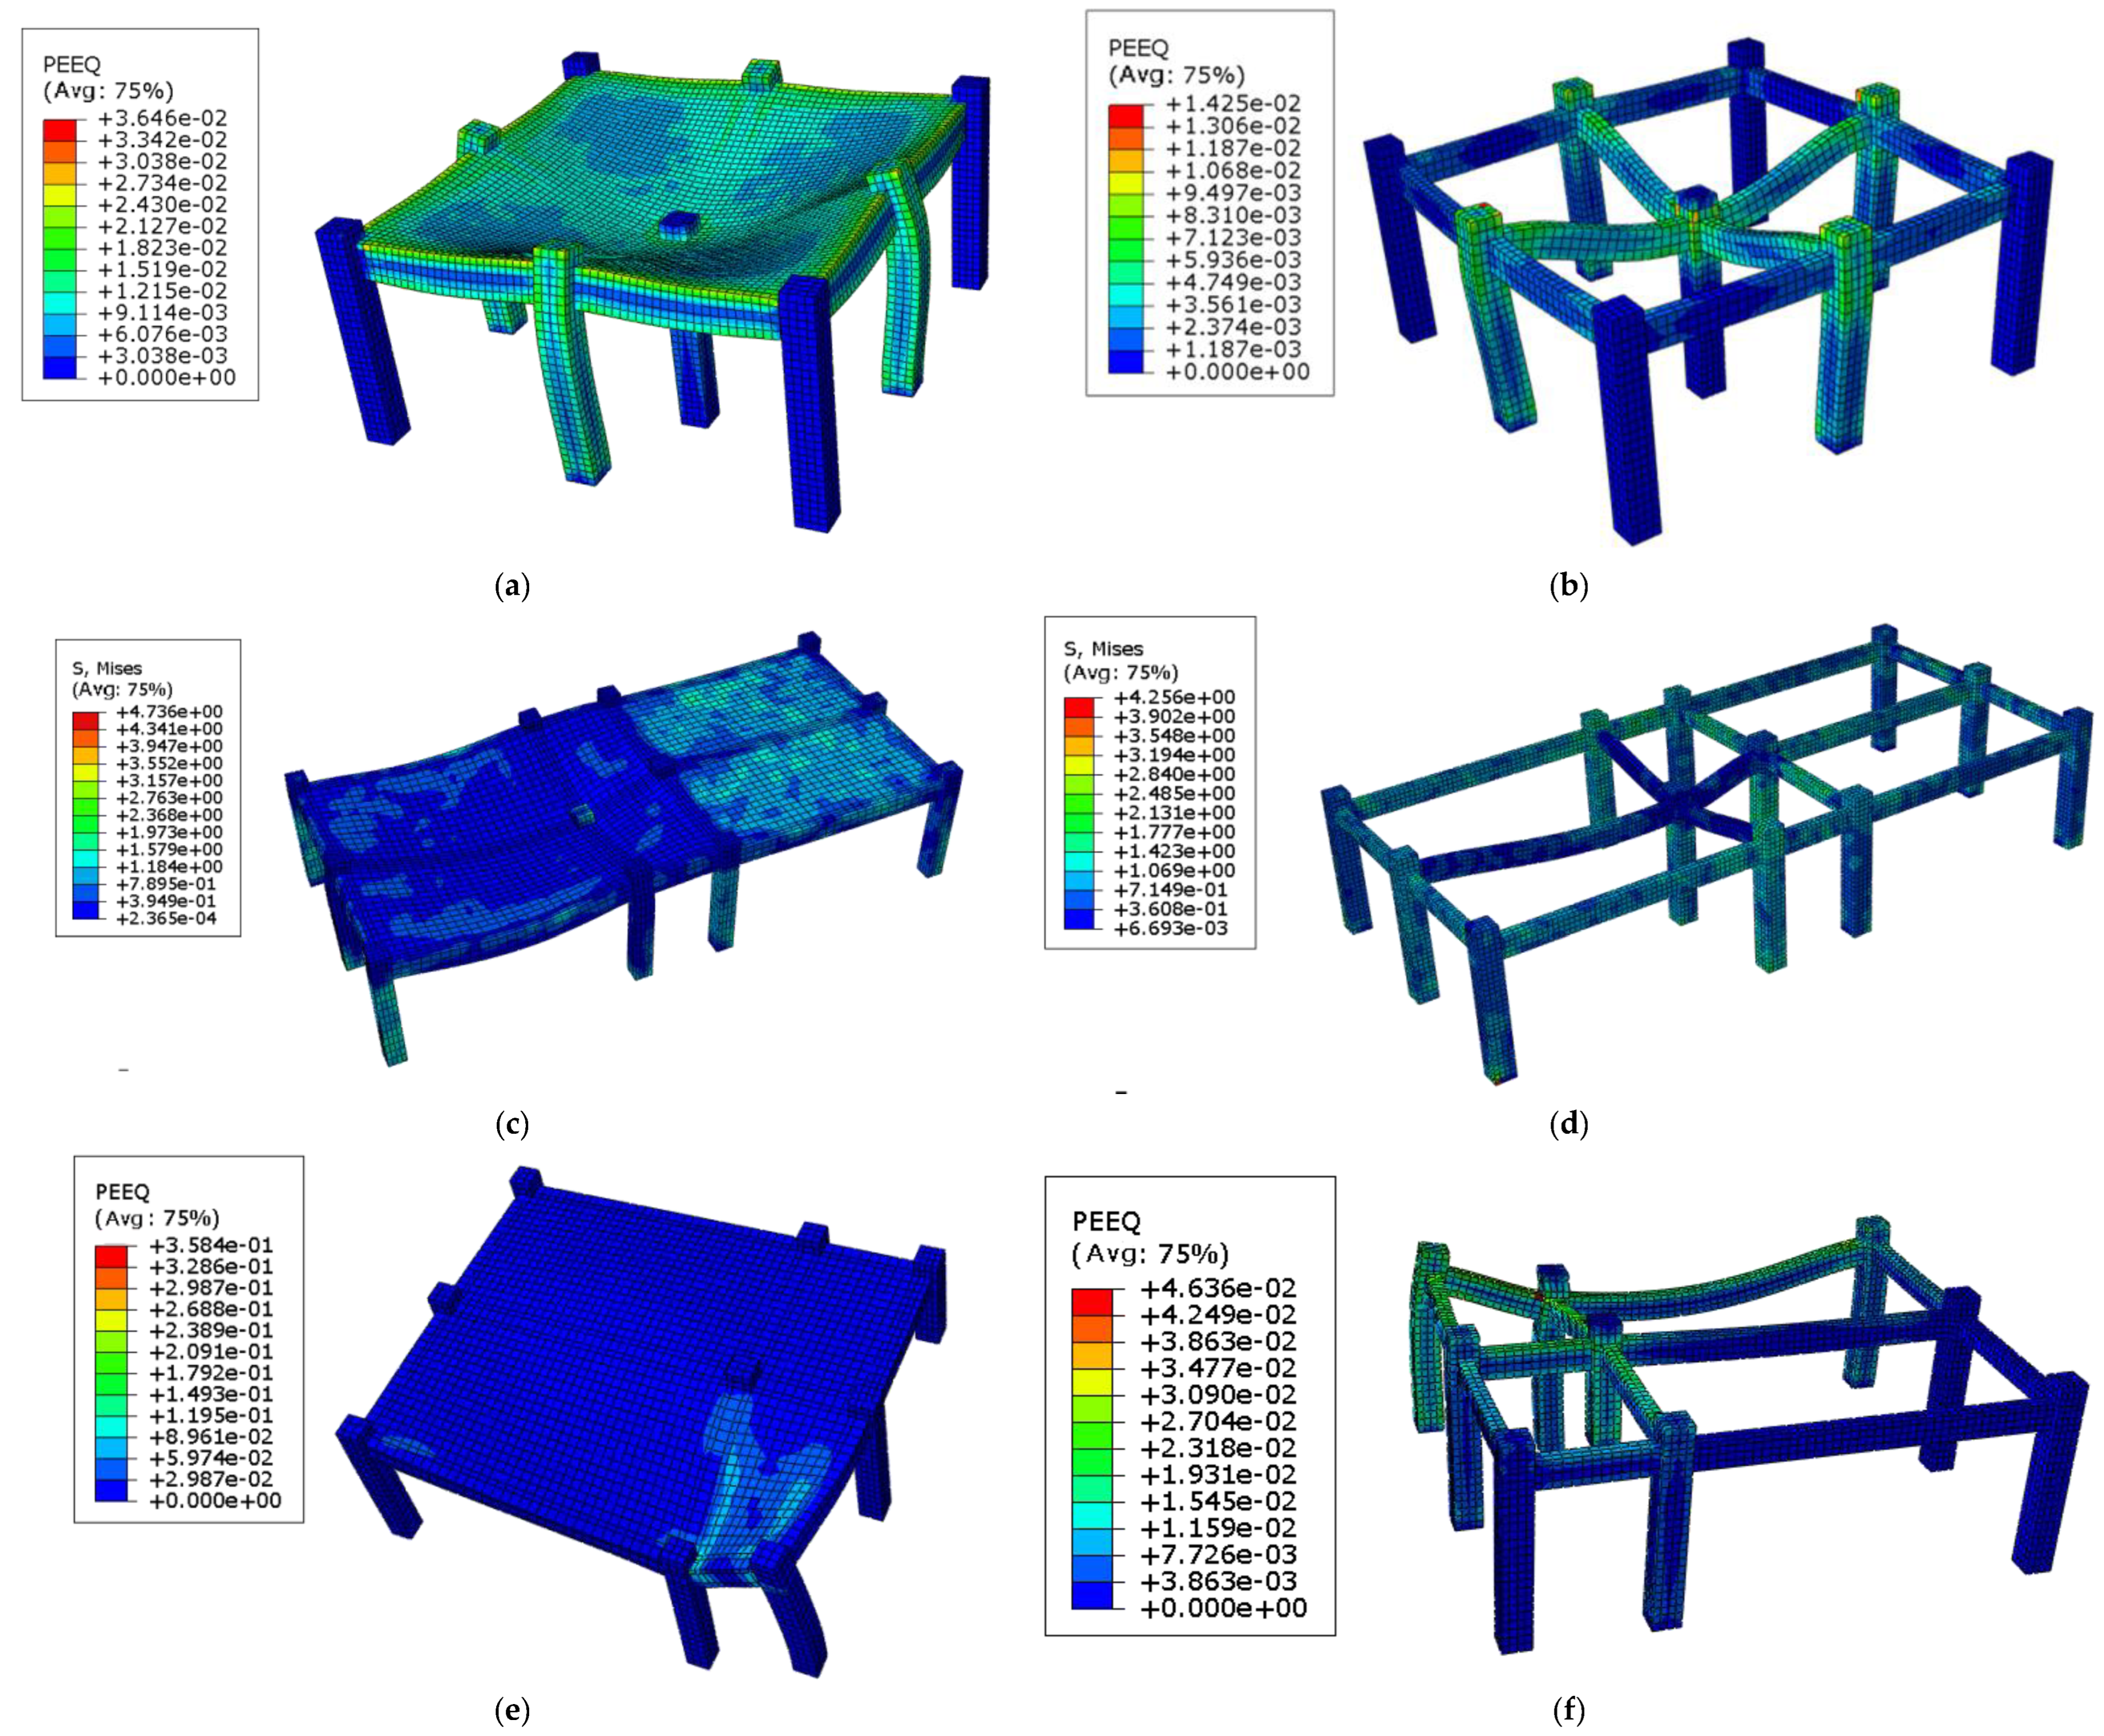
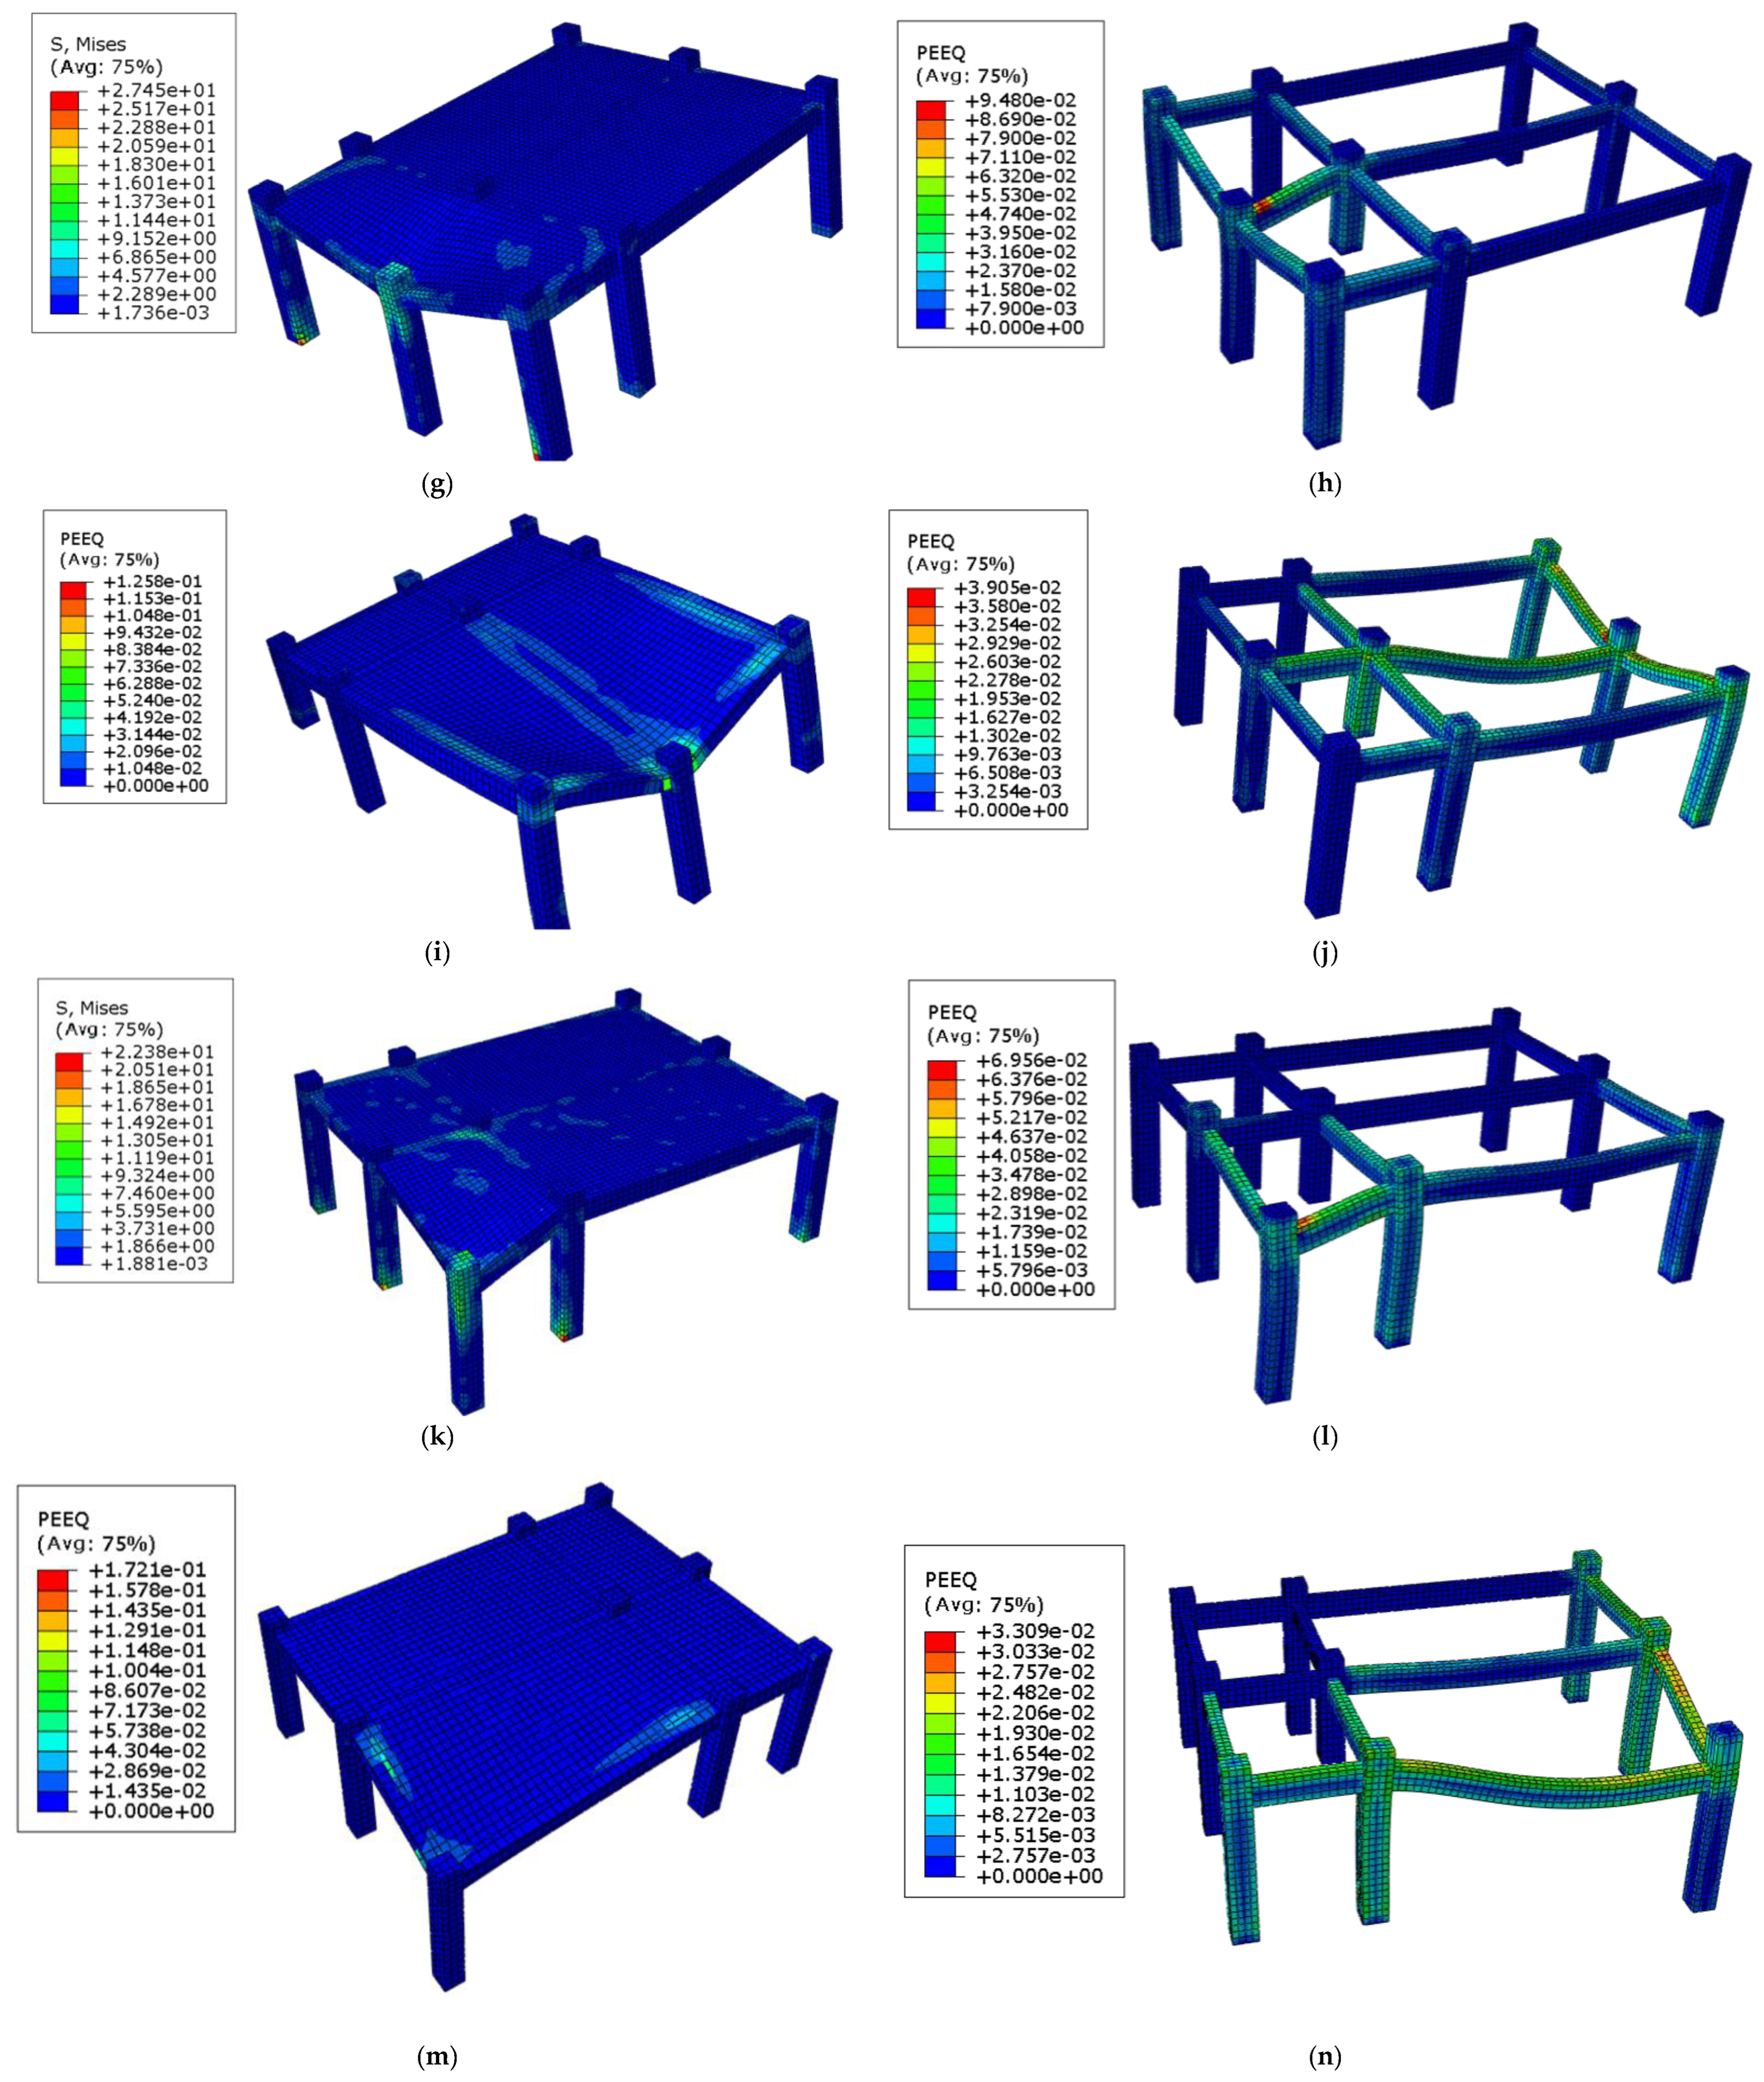
Figure 12 presents the Equivalent Plastic Strain (PEEQ) results calculated by ABAQUS for three structural models: External corridor, Internal corridor, and Equal-span models. The Equivalent Plastic Strain quantifies the cumulative plastic deformation in materials during yielding, where PEEQ > 0 indicates material yielding initiation. In Figure 12a,b, showing the equal-span model with and without floor slabs after middle column failure, the stress distribution demonstrates uniformity. When the central column fails, adjacent beams and slabs evenly redistribute the load, with four neighboring columns also participating in load-bearing. This indicates the equal-span model’s rational load transfer mechanism, where surrounding beams, slabs, and columns collectively share the redistributed load following middle column failure. Figure 12c,d illustrates the internal corridor model with and without slabs under middle column failure. Although surrounding beams, slabs, and columns enter plastic states and participate in load-bearing, the stress distribution shows less uniformity compared to the equal-span model.
Figure 12g,h depicts the external corridor model with and without slabs. Notably, larger floor slab areas exhibit lower stress concentrations than smaller ones. Only adjacent beams participate in load transfer, with minimal contribution from other columns. Figure 12e–n further demonstrates that in external corridor models, localized column failure primarily engages nearby beams and slabs in load redistribution, while distant columns remain inactive. This reveals an uneven stress distribution pattern where remote structural elements fail to participate in load transfer, indicating a less rational load-bearing mechanism compared to internal corridor and equal-span models. The comparative analysis concludes that the equal-span model achieves optimal load distribution uniformity, followed by the internal corridor model, while the external corridor model exhibits the least favorable stress redistribution characteristics during column failure scenarios.
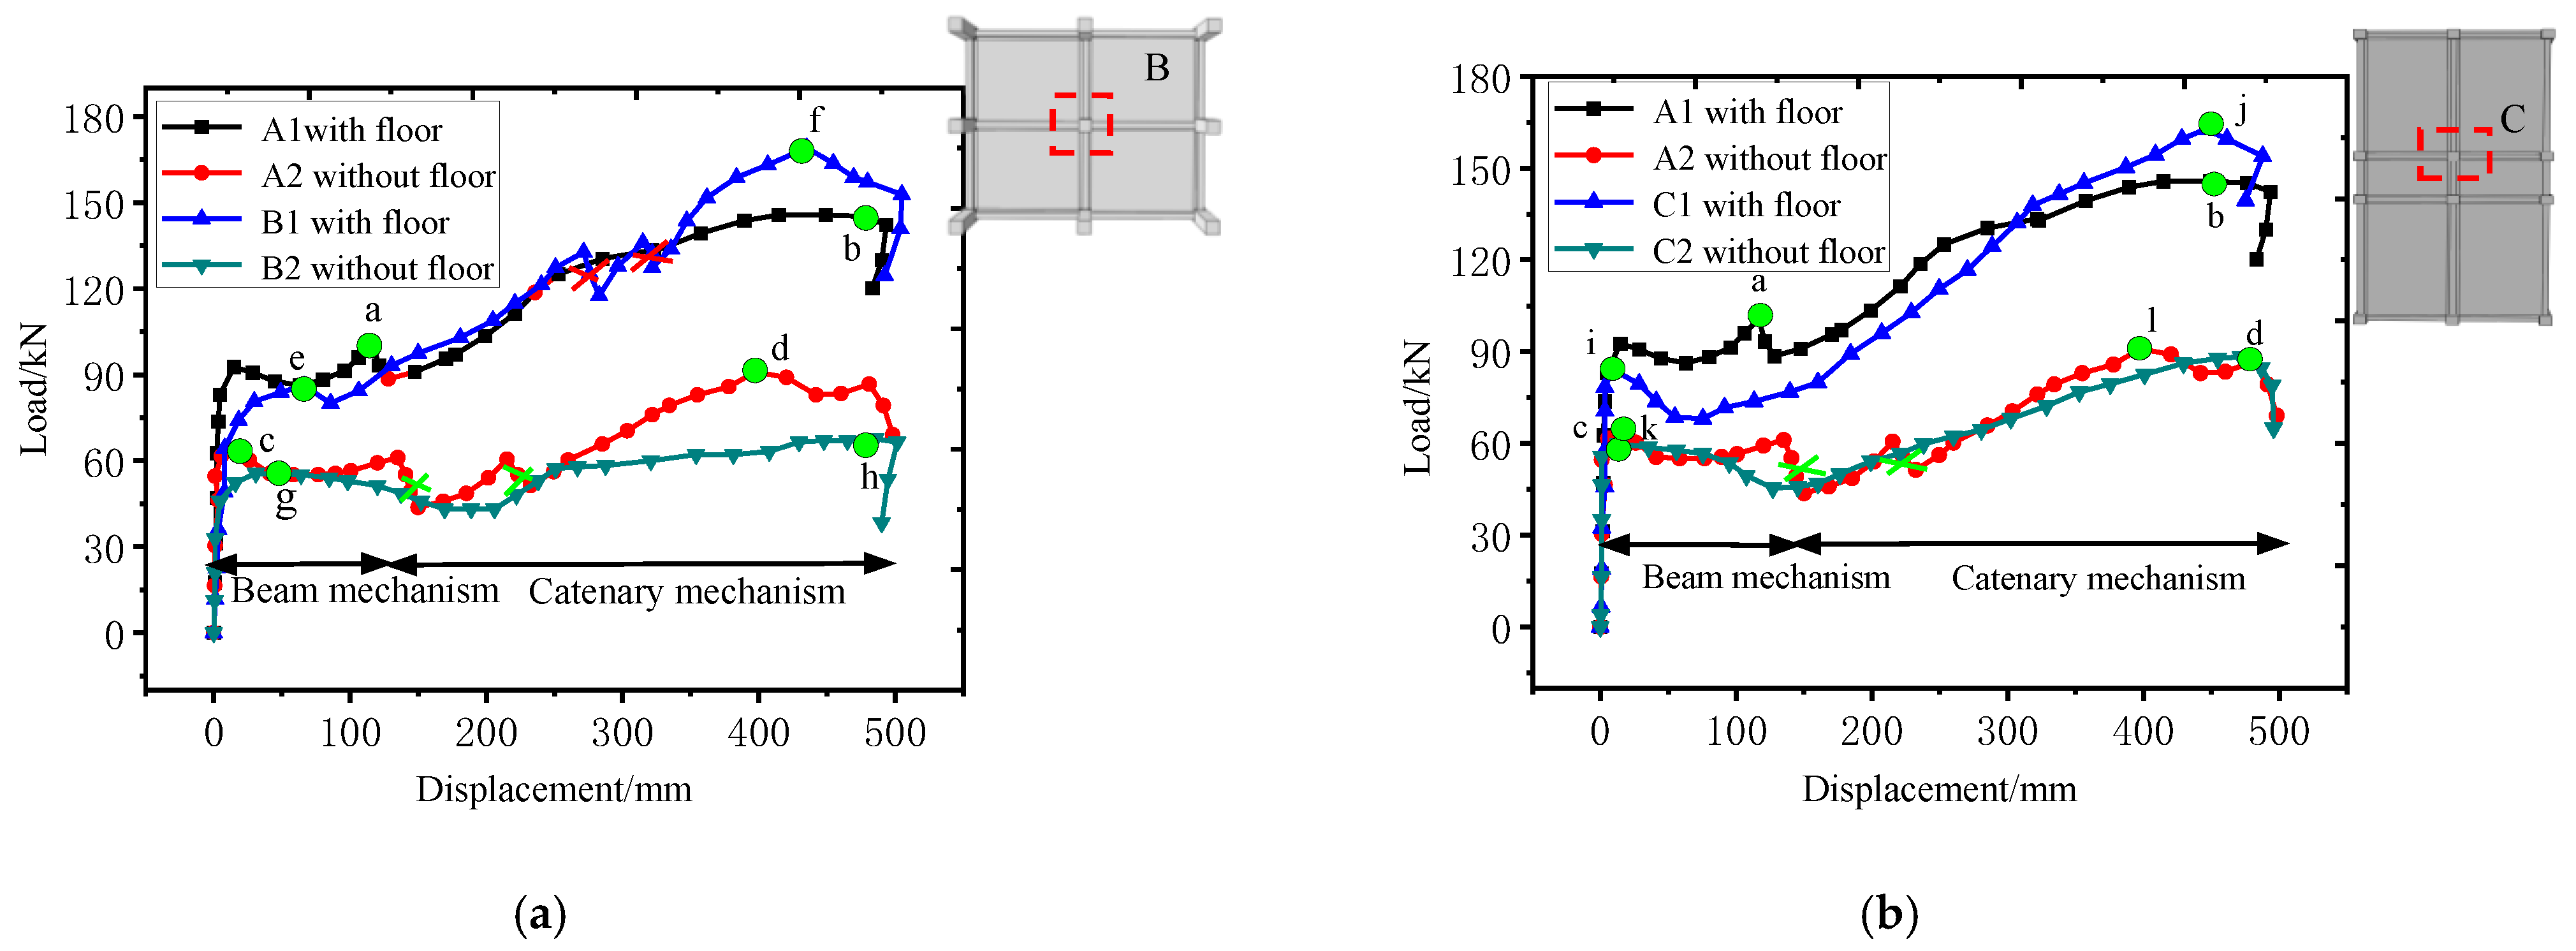
Figure 13 illustrates two mechanisms involved in the progressive collapse of the structure: the beam mechanism, driven by the bending capacity of beam end sections, and the catenary mechanism, driven by the tensile forces in beam–slab longitudinal reinforcements. In Figure 13a, at the beam mechanism’s peak point (100.6 kN) for the outer corridor substructure, the equal span structure showed no distinct drop in extreme bearing capacity, with its capacity continuously increasing. This indicated that the beam end section in the short-span area of the outer corridor, with slabs cracked first, led to an initial reduction in the bearing capacity. During the early collapse stage, the short-span beam–slab reinforcement was activated earlier, resulting in a greater bearing capacity during the beam mechanism phase. Compared with the outer corridor structure, the equal span structure exhibited a “lag” in force response. At the catenary mechanism’s maximum load point f (169.1 kN) and the external corridor structure’s peak point b (145.2 kN), the difference was 23.9 kN. At this stage, the stress in the equal-span floor slab reinforcement was uniform, and the damage to the X-direction reinforcement was nearly identical. For the plate-free structure, the beam mechanism’s peak point c (64.9 kN) in the external corridor structure exceeded the equal span structure’s peak point g (55.2 kN) by 9.7 kN, whereas the later catenary mechanism’s maximum point d (90.9 kN) surpassed point h (67.6 kN) by 23.3 kN. This was attributed primarily to the concentrated stress distribution in the short span of the external corridor frame, which demanded greater deformation coordination capacity. The connected cross-beam reinforcement played a more significant role in the later stages.
Figure 13b shows that when the inner column failed, the damage to the plated inner corridor structure was confined primarily to spans connected to the inner column. After the beam mechanism’s peak point i (84.1 kN), a significant reduction in the bearing capacity occurred. The vertical anti-collapse capacity conversion mechanism performed well, with the maximum bearing capacity point j of the catenary mechanism reaching 162.6 kN. Following the failure of the inner corridor structure, one side column exhibited limited deformation at the damaged position due to adequate horizontal constraints, whereas the other side column, with weaker constraints, exhibited greater lateral displacement, more severe damage, and a reduced bearing capacity. In the later stages, the damage to the long-span section was more severe than that to the outer corridor structure. The steel reinforcement in the long-span floor slab was fully utilized, resulting in a higher bearing capacity in the later stages. The load–displacement curves of the slab-free outer corridor structure closely resembled those of the inner corridor structure. Lateral constraints clearly had a minimal effect on the slab-free structures.

3.2. Failure Location of the Key Columns and Beam Span

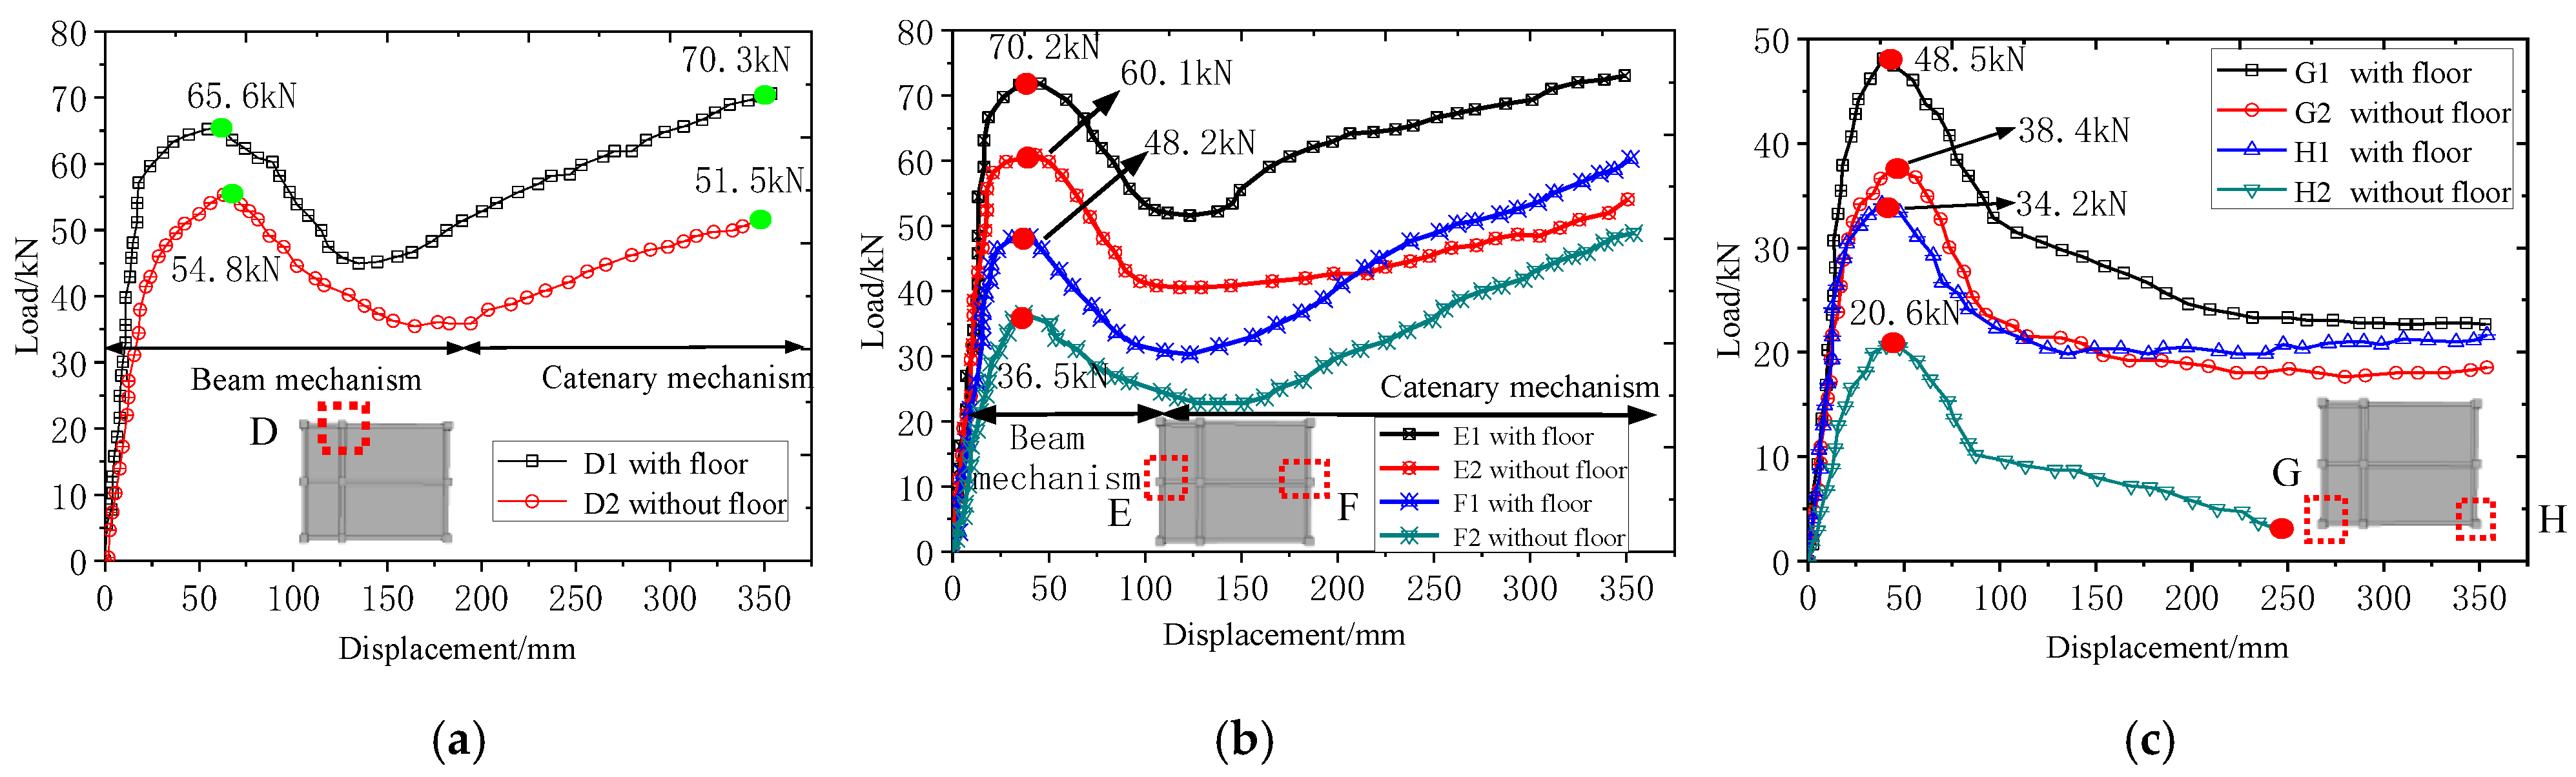
Per the DOD2010 standard, a component is deemed to have failed when the displacement of the failed column reaches 1/5 of the single-side beam span. To account for the synergistic effect of the beam–slab substructure under large deformation, this study sets the collapse displacement limit at 1/3 of the short-span beam length (1000 mm) on the basis of test results showing excessive lateral displacement of side columns in the short-span plate-belt area. Consequently, the component failure displacement is defined as 350 mm. Figure 14a shows that when the D side column failed, the peak bearing capacity of the D1 beam mechanism with a floor structure (65.6 kN) was 19.7% greater than that of the D2 mechanism without a floor structure (54.8 kN). At the collapse limit displacement, D1’s bearing capacity was 70.3 kN, which was 36.5% greater than D2’s (51.5 kN). The size and reinforcement of D1 are shown in Figure 3a. D2 is the same as D1 in other aspects, with the floor removed from D1.
To investigate how the beam span affects structural resistance to progressive collapse, a numerical model was created in which Y-beam side columns (E/F) and corner columns (G/H) were removed. Figure 14b shows that for the structure with a floor slab (model E1/F1), the peak bearing capacity of the beam mechanism after Y-beam side column E had failed was 70.2 kN, which was 45.6% greater than that after side column F had failed (48.2 kN). For the structure without a floor slab (model E2/F2), the peak bearing capacity of the beam mechanism after side column E had failed was 60.1 kN, which was 32.1% greater than that after side column F had failed (36.5 kN).
Figure 14c indicates that after the corner column has failed, no catenary mechanism emerges once the structural bearing capacity peaks in the beam mechanism, and the capacity does not increase further. The peak bearing capacities of the beam mechanism for models G1, G2, H1, and H2 were 48.5 kN, 38.4 kN, 34.2 kN, and 20.6 kN, respectively. After failure, the bearing capacity of the long-span corner column (model H2) was the lowest compared with those of G1, G2, and H1. When the vertical displacement of the failed column reached 245 mm, model H2 nearly lost all of its bearing capacity. Thus, in engineering design, reinforcing corner columns connected to long-span beams is crucial. After column failure, larger spans resulted in greater internal forces on the beam and a reduced structural bearing capacity. The size and reinforcement of G1 and H1 are shown in Figure 2a. G2 and H2 are the same as G1 and H1 in other aspects, with the floor removed from G1 and H1.

3.3. Floor Parameters

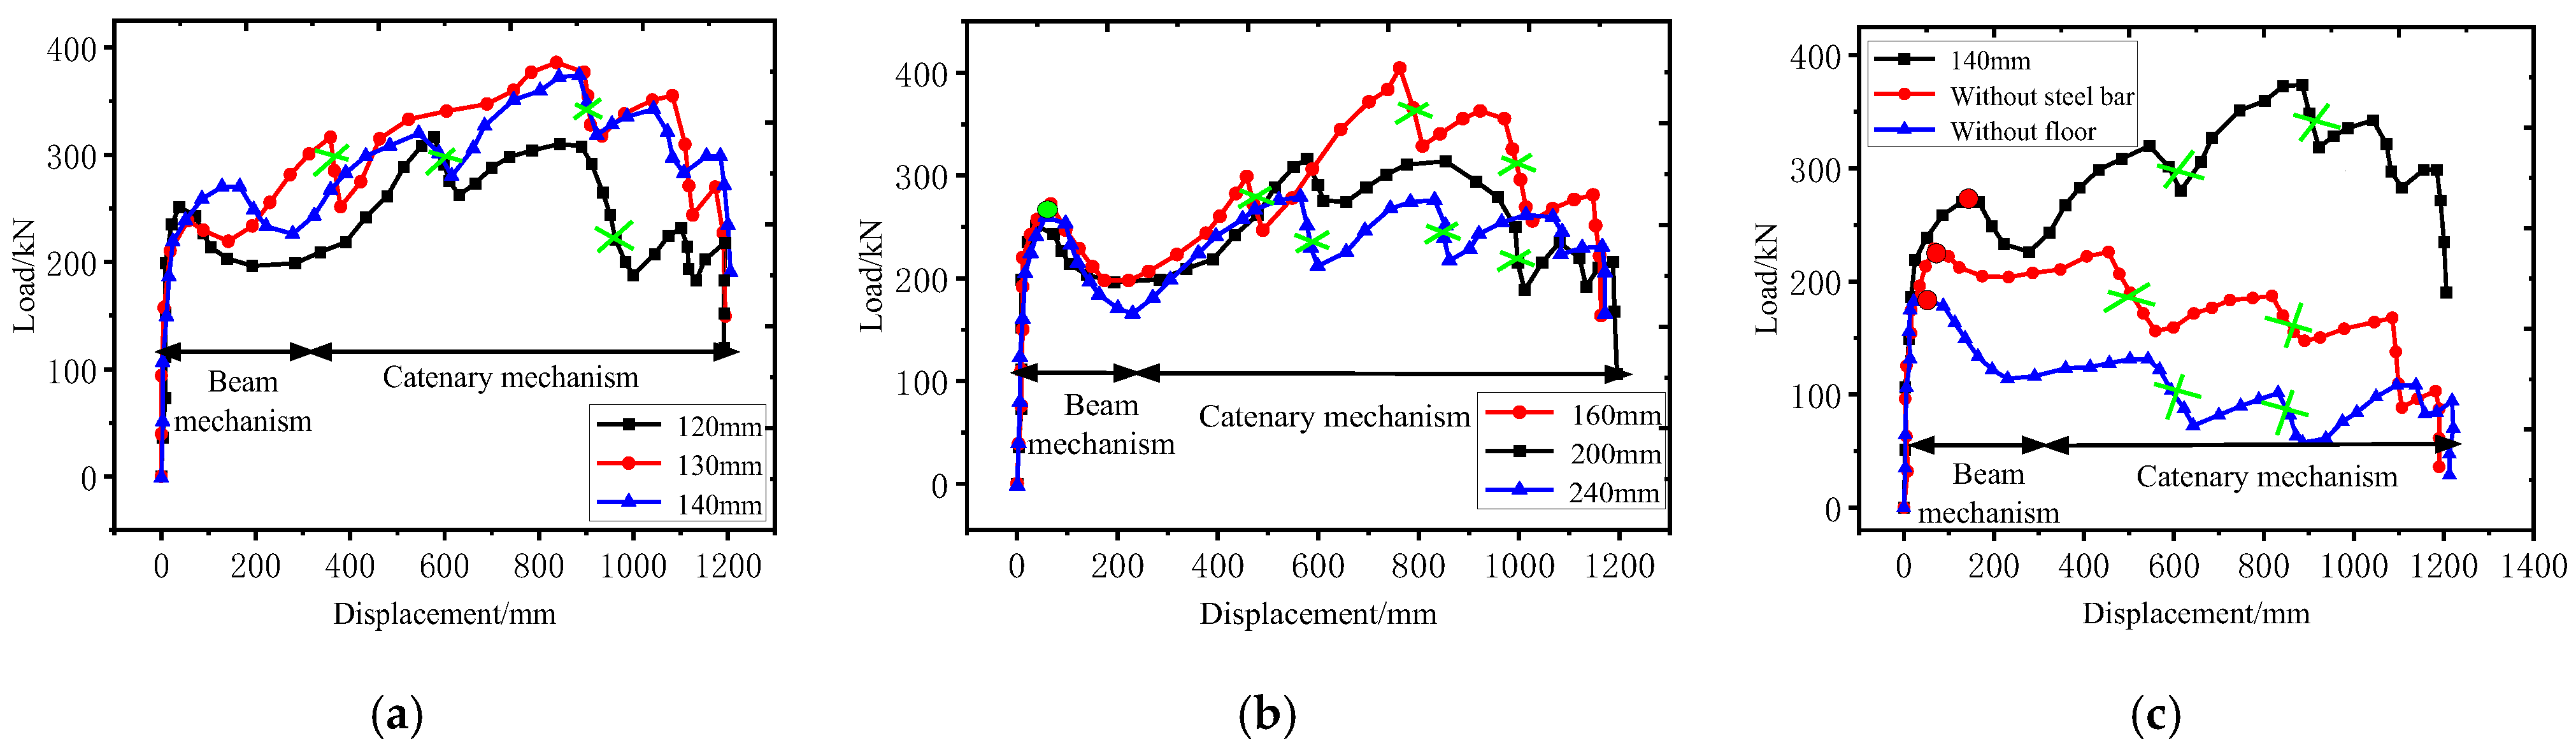
To investigate how different floor thicknesses affect the structural bearing capacity during inner column failure, prototype external corridor structure models with floor thicknesses of 120 mm, 130 mm, and 140 mm were developed. The model is reinforced on a floor thickness of 120 mm, with only the protective layer thickness adjusted, while the spacing between the upper and lower reinforcements remains constant. The geometric configurations and reinforcement detailing of all structural members are illustrated in Figure 2a,b. Figure 15a shows that increasing the floor thickness from 120 mm to 130 mm improved the bearing capacity by 15–20%, primarily because the thicker protective layer delayed concrete crushing at the wing edge position. However, increasing the floor thickness from 130 mm to 140 mm resulted in a negligible improvement in the bearing capacity. Beyond a certain floor thickness, the structural resistance to collapse showed minimal improvement. Increasing the slab thickness increased the structure’s deadweight and may have increased the risk of shear damage in the floor slab.
Figure 15b shows the influence of the floor reinforcement ratio on the component bearing capacity. A 120 mm thick double-layer reinforced floor with 200 mm reinforcement spacing was used as the benchmark, and models with 160 mm and 240 mm spacing were developed. Increasing the floor reinforcement spacing had a minimal effect on the bearing capacity during the early beam mechanism stage. Double-layer floor reinforcement suppressed crack development and primarily influenced the structural bearing capacity during large deformations. Increasing the floor reinforcement spacing from 200 mm to 240 mm reduced the later structural bearing capacity by 10–20%, whereas decreasing the bottom reinforcement spacing from 200 mm to 160 mm increased it by 20–30%.
To assess the role of floor reinforcement in structural collapse resistance, a model with a plain concrete slab (without reinforcement) was created and compared with a test sample featuring a 140 mm thick floor slab and a prototype corridor-type component without a slab. As shown in Figure 15c, a comparison of the bearing capacities of the structures with and without floor slab reinforcement revealed that during the beam mechanism stage, the structure with a floor slab exhibited a significantly greater capacity than the structure without a floor slab. The synergistic interaction between the beam and slab enhanced the bearing capacity by 100–130%. The floor slab concrete had limited early-stage crack propagation at the wing edge position, creating a “compression arch effect” that resisted collapse damage. In the catenary mechanism stage, floor slab reinforcement provided tensile resistance, leading to a rapid increase in bearing capacity. The bearing capacity of the structure without floor slab reinforcement continuously declined, highlighting the significant influence of floor slab reinforcement on capacity during the large deformation phase of the late collapse stage.
The floor slabs should be designed bidirectionally to provide sufficient horizontal constraints, enabling the formation of a tensile membrane mechanism and a secondary load-bearing system after the initial structure fails. This design reduces internal forces on components and prevents “disproportionate” damage.

3.4. Floor Damage Mechanism

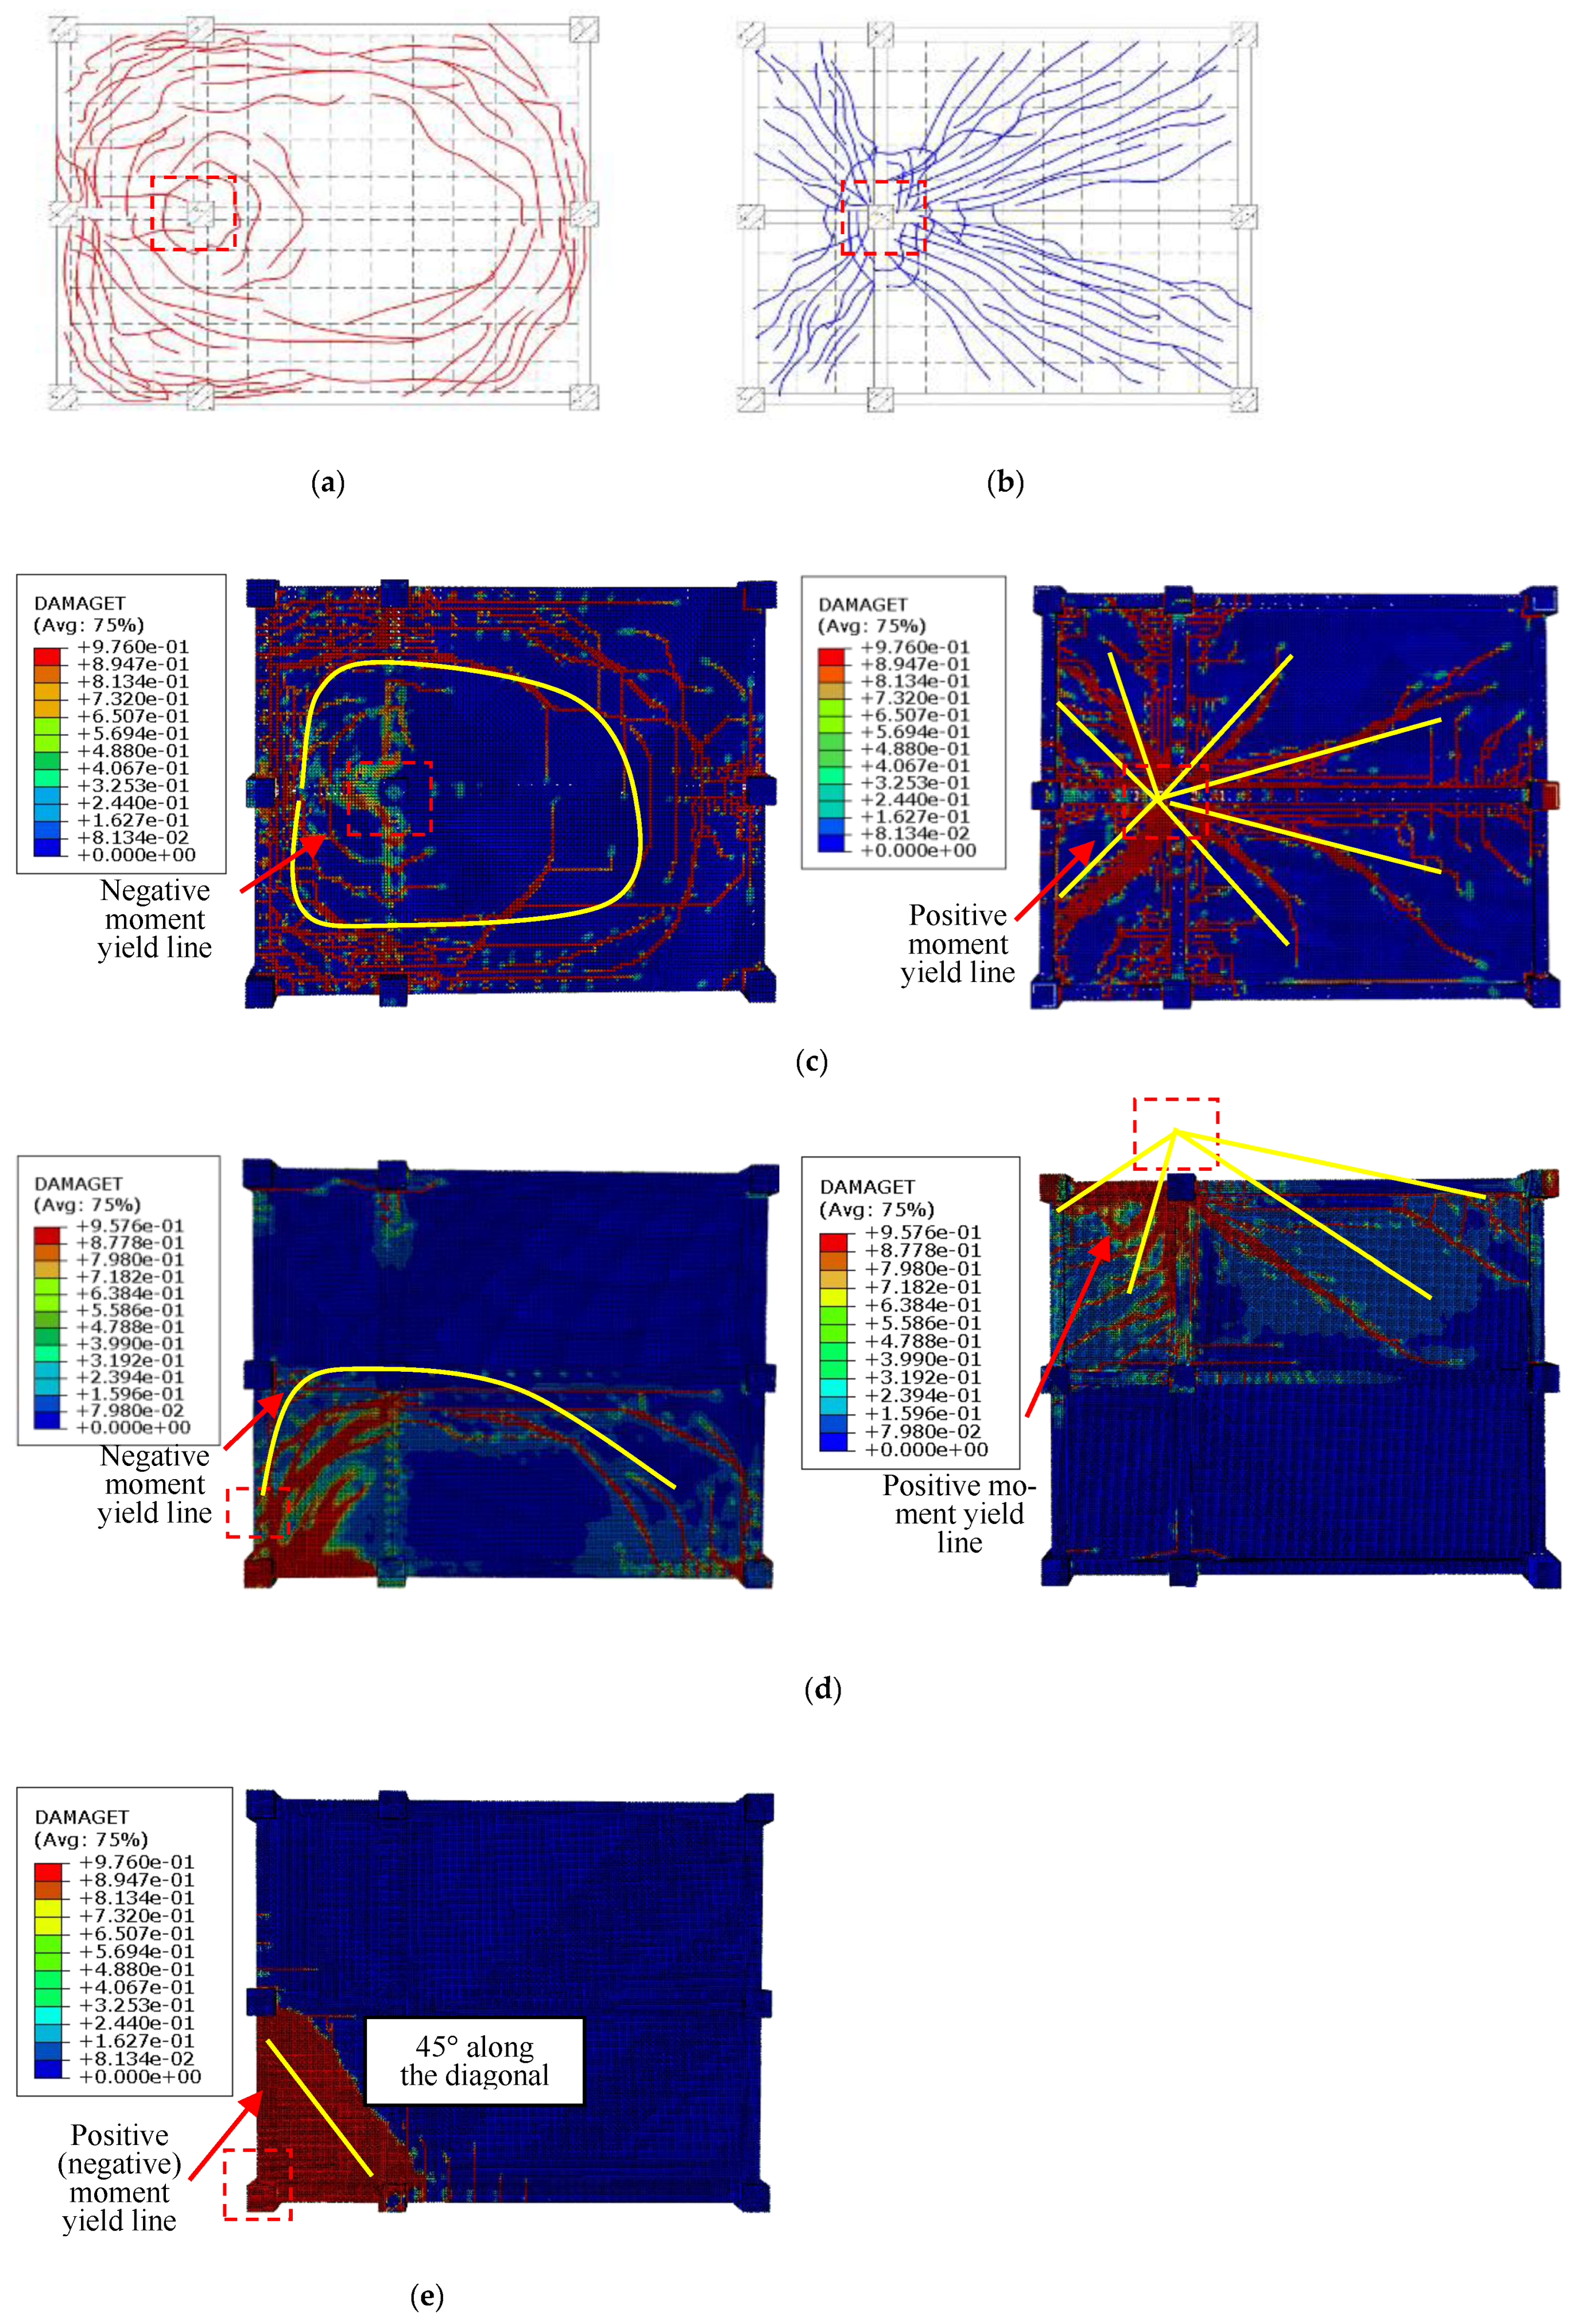
Figure 16a,b shows that cracks at the top of the slab formed a ring centered around the failed column, whereas cracks at the bottom of the slab spread radially outward. The stress ring of the slab defined the edge of the final collapse zone, where the concrete near the ring had cracked and failed first.
Figure 16c shows that the top of the slab initially experienced compressive stress, with damage concentrated around the failed column, forming a ring centered on it. The stress on this ring was the highest, and cracking of the concrete at the top of the slab initiated from the stress ring. The cracks gradually widened, eventually forming through-cracks. The tensile stress at the bottom of the slab was distributed along the diagonal, with tensile damage spreading radially outward as deformation increased.
Figure 16d shows that when the side column had failed, tensile damage at the top of the slab spread diagonally along the damaged slab strip toward the inner column. With increasing vertical displacement, a “quarter elliptical ring” with two unequal radii formed around the side column. The slab strip within the ring experienced tension, whereas the slab strip outside the ring underwent compression. The ring expanded progressively to surrounding areas as the displacement increased. The cracks at the bottom of the slab increased and radiated outward along the side columns toward the damaged slab strip.
Figure 16e shows that when the corner column had failed, tensile damage concentrated around the failed column and propagated along the 45° diagonal of the slab strip, gradually expanding outward. The floor slab near the diagonal connecting the two side columns cracked sequentially. In summary, the early damage behavior of the floor slab reflects its yield mode and helps predict crack development.

4. Analysis of Internal Forces in Key Sections

4.1. Beam–Slab Section Stress Analysis

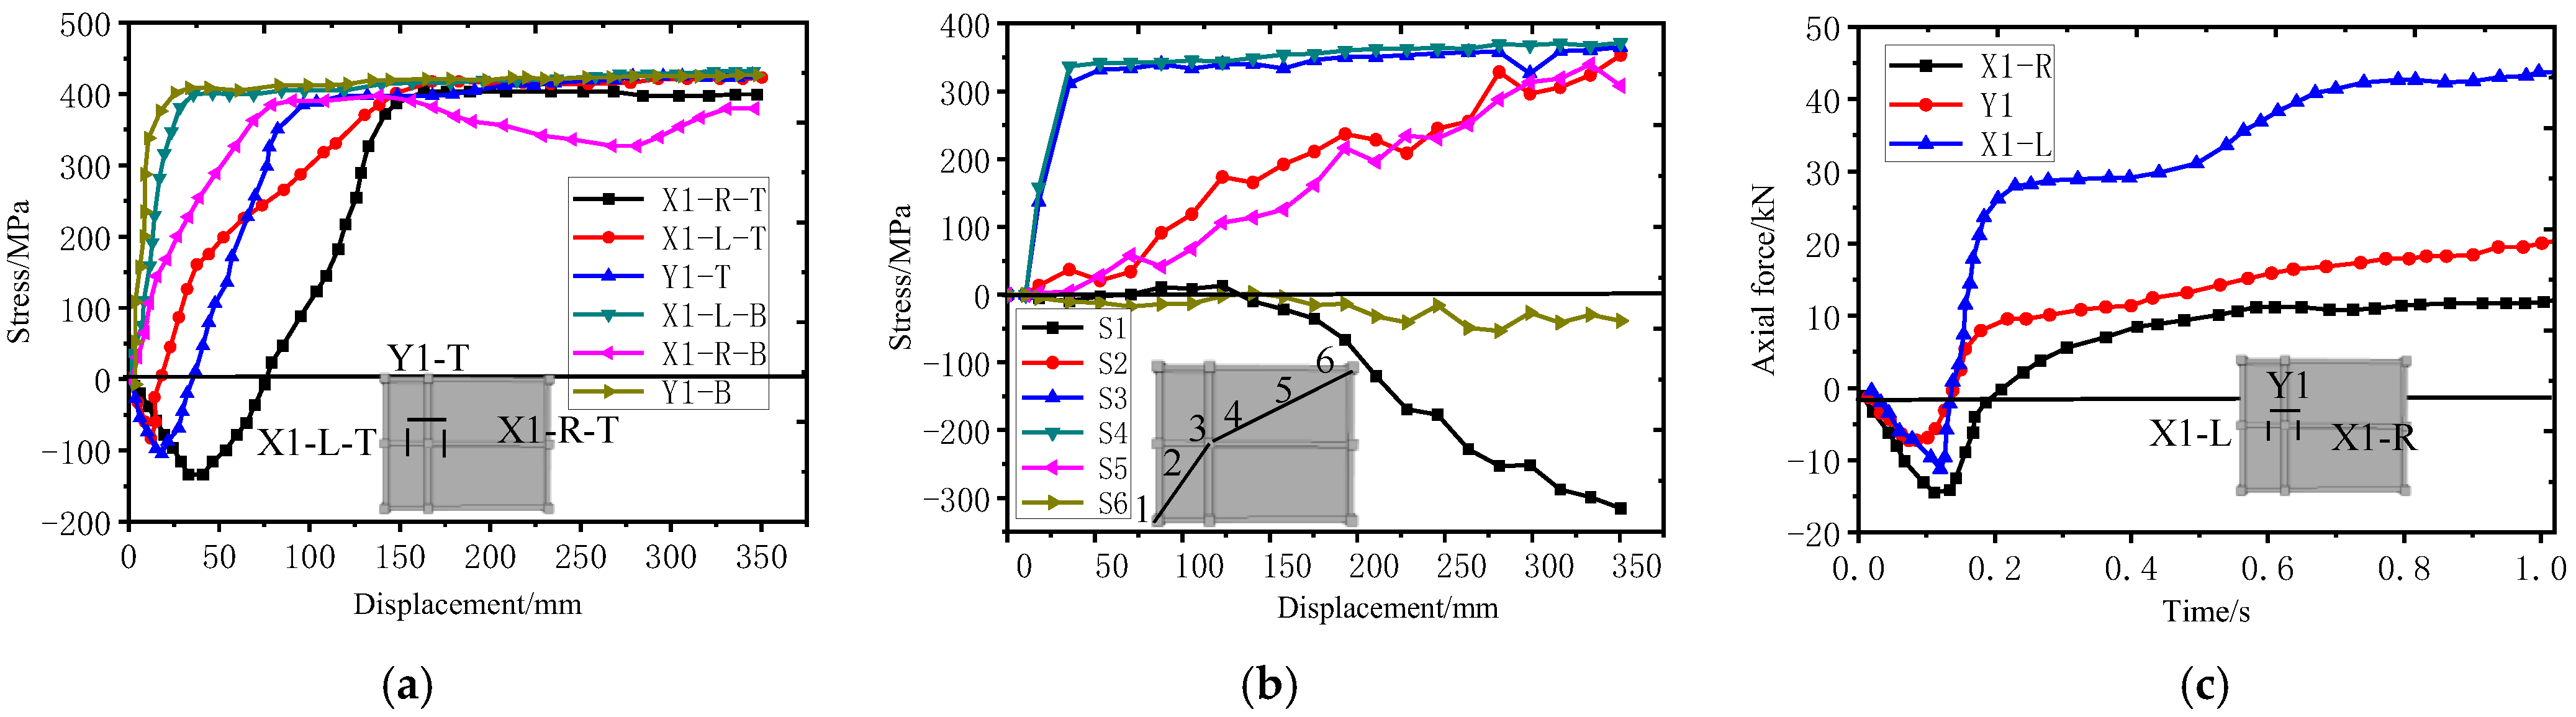
Figure 17a shows that the upper steel bars of the beam (X1-L-T, X1-R-T, and Y1-T) initially experienced compressive stress, as indicated by negative values. As the displacement of the failed column increased, the upper steel bars transitioned to tensile stress, reaching a yield stress of 400 MPa. The transition of the steel bar stress from negative to positive indicated the presence of a “compression arch effect” in the early stage. The lower longitudinal bars of the beam (X1-L-B, X1-R-B, Y1-B) consistently experienced tensile stress and yielded early in the collapse process. This indicated that the lower beam end had cracked early, with the lower steel bars breaking first.
Figure 17b shows that the floor steel bars at positions S3 and S4 reached the yield stress early in the collapse process. The stress in the floor steel bars at position S6 was minimal and largely unaffected. At position S1, the stress was minimal in the early collapse stage. After the displacement of the failed column reached 200 mm, the floor steel bars at S1 primarily experienced compressive stress. The stress values of the floor slab reinforcement at positions S2 and S5 were similar. As the displacement of the failed column increased, the stress values of the floor slab reinforcement at positions S2 and S5 rose and eventually reached yield. The floor slab reinforcement at positions S2 and S5 exhibited a nearly linear stress distribution. For floor slab reinforcement, proximity to the failed internal column increased its stress impact and shortened the time to reach yield stress.

4.2. Beam Axial Force Analysis

Figure 17c illustrates the extracted axial forces of the X1-L, X1-R, and Y1 beam sections near the failed inner column. In the early stage, the beams experienced “compression arching,” with negative axial force values. At 0.2 s of loading, the axial force in the beams transitioned from compression to tension, indicating a shift from the beam mechanism to the catenary mechanism. Once the catenary mechanism became effective in the later stage, the axial force gradually increased and stabilized. At a failure inner column displacement of 350 mm, the axial force of the X1-L section (45 kN) exceeded that of the Y1 section (15 kN), which in turn was greater than that of the X1-R section (10 kN). This finding indicated that the axial force during collapse was closely related to the beam’s span-to-height ratio. The span-to-height ratios were 5 for beam X1-L, 14 for X1-R, and 7.5 for Y1. A smaller span-to-height ratio resulted in greater axial force generated by the beam during progressive collapse.

5. Discussion

5.1. Mechanism of Progressive Collapse in Unequal-Span Structures

Finite element analysis results indicated that structures with unequal spans exhibited pronounced unbalanced force characteristics during vertical progressive collapse. For the external corridor substructure with unequal spans and slabs, the load-resisting response was distinctly staged. In the initial loading phase, defined as the beam mechanism stage, the beam end section within the short-span region first reached its flexural capacity due to its relatively higher stiffness. This resulted in an initial peak point on the load–displacement curve at a load of 100.6 kN. Subsequently, the load-bearing capacity in this region decreased first, indicating that the short-span components entered plastic development early in the collapse process, with their slab and beam reinforcement engaging earlier. As deformations continued to increase, the structural response gradually transitioned to the catenary mechanism stage, ultimately reaching a maximum load of 145.2 kN. For the slabless condition, the peak load of the external corridor structure in the beam mechanism stage was 64.9 kN, which was significantly higher than the corresponding value of 55.2 kN for the X-direction equal-span structure. Upon entering the catenary mechanism stage, its maximum peak load was 90.9 kN, surpassing that of the X-direction equal-span structure by 23.3 kN. This disparity highlighted a significant stress concentration effect in the short-span region, necessitating greater deformation compatibility, while the transverse beams connected to it played a critical load-bearing role in the later stages. The internal corridor structure with unequal spans displayed differing failure characteristics. Its peak load in the beam mechanism stage was 84.1 kN. After a brief decline, it formed a catenary mechanism, achieving a maximum load capacity of 162.6 kN. However, due to differing restraint conditions on either side of the structure, one side column benefited from sufficient horizontal restraint limiting its deformation, while the other side experienced weaker restraint, leading to larger lateral column displacements and consequently more significant damage. The damage in the long-span section during later stages was more severe than that observed in the external corridor structure. This phenomenon revealed that unequal span structures are susceptible to asymmetric failure during collapse due to abrupt stiffness changes and uneven restraints, posing substantial challenges to overall structural stability.

5.2. Mechanism of Progressive Collapse in Equal-Span Structures

Reinforced concrete structures with equal spans demonstrated more uniform force characteristics during progressive collapse. Finite element analysis results showed that for the X-direction equal-span substructure with slabs, no distinct drop in load capacity was observed during the beam mechanism stage. Its load–displacement curve maintained a continuous upward trend, indicating good force coordination among spans and the synchronous mobilization of flexural capacity at beam end sections. This progressive engagement of capacity reflected that equal-span structures could achieve effective load redistribution through the collaborative work of all spans. Upon entering the catenary mechanism stage, the maximum load of the equal-span structure reached 169.1 kN, exceeding that of the external corridor structure by 23.9 kN. This difference primarily stemmed from the consistent engagement of slab reinforcement within the equal-span structure, where slab reinforcement across spans essentially yielded simultaneously, creating an efficient tensile membrane action. The load-resisting mechanism of equal-span structures can be summarized as follows: uniform stiffness distribution resulted in relatively balanced moment and shear forces, enabling full utilization of structural redundancy. Following the failure of local components, loads could be effectively redistributed through the catenary action of adjacent spans or the flexural capacity of beams. Multi-span structures, leveraging their high redundancy, could form alternative load paths through the collaborative work of adjacent spans, including catenary action and arching effects. This mechanical behavior enabled equal-span structures to undergo progressive failure after significant deformation, with full development of plastic hinges at beam ends, rendering the collapse process relatively slow and predictable.

5.3. Comparison of Progressive Collapse Between Equal-Span and Unequal-Span Structures

Synthesizing the finite element findings, fundamental differences existed in the progressive collapse mechanisms between equal-span and unequal-span structures, which can be compared in terms of load-bearing performance and failure modes. Regarding load-bearing performance, under slab conditions, the equal-span structure exhibited optimal load capacity during the catenary mechanism stage, with a maximum load of 169.1 kN significantly higher than the 145.2 kN of the external corridor unequal-span structure. This indicated that an equal-span layout facilitated the synergistic effect of slab reinforcement, forming an efficient tensile force transfer network. Conversely, under slabless conditions, the unequal-span structure demonstrated a load capacity advantage, with its maximum catenary mechanism load of 90.9 kN being 34.4 percent higher than the 67.6 kN of the equal-span structure. This contrast revealed the critical role of slabs in unequal-span structures: the presence of slabs effectively mitigated stress concentration in the short-span region. However, without slab restraint, the short-span region had to rely on its own deformation compatibility to bear greater loads, which was the underlying reason for the higher load capacity of slabless unequal-span structures. Comparing failure modes, the equal-span structure with slabs experienced the most balanced force distribution and strong collaborative capacity among spans, representing the optimal scenario. Although the external corridor unequal-span structure with slabs exhibited earlier engagement of load capacity in the beam mechanism stage, its subsequent catenary effect was relatively insufficient, with a potential risk of overall tilting towards the cantilever side. The internal corridor unequal-span structure with slabs achieved a high load capacity of 162.6 kN, but due to the differing restraint conditions on its two sides, it was prone to asymmetric failure, with severe deformation in the long-span section compromising structural integrity. The research results demonstrated that equal-span structures, by virtue of their uniform stiffness distribution and high redundancy, could establish clear internal force redistribution paths through beam and catenary mechanisms, forming an effective beam-tie load-bearing system. In contrast, the stiffness irregularity of unequal-span structures caused short beams to become critical components subjected to disproportionately high loads. Their failure mode was complex, imposing higher demands on structural ductility and collaborative force-resisting performance. Therefore, progressive collapse-resistant design should adopt enhanced shear and ductility detailing measures specifically for the short-span regions of unequal-span structures, while equal-span structures could rely on conventional design methods to meet protection requirements.

6. Theoretical Analysis

The floor slab can provide a certain bending resistance in the negative moment region. Yu’s numerical simulations revealed that when the structure is in a state of small deformation, the slab can be equivalently treated as a flange. However, during large deformation stages, significant errors may arise if the slab is simply regarded as a flange [27]. Therefore, to more accurately calculate the early structural resistance, the beam–slab interaction can be considered in the small deformation stage (when the displacement of the failed column reaches 1/10 of the beam span) by treating the slab as an equivalent flange of the beam, while in the large deformation stage, the beam and slab should be analyzed separately. Thus, the resistance of the corridor-style substructure studied in this paper can be calculated using the beam resistance theory for large deformations and the slab resistance theory for large deformations. The theoretical calculation methods for beam resistance analysis and slab resistance analysis in the large deformation stage, as mentioned in the paper, are only applicable to scenarios involving interior column failure. They are not suitable for cases such as edge column failure or other types of failure scenarios.

6.1. Analysis of the Beam Resistance at the Large Deformation Stage

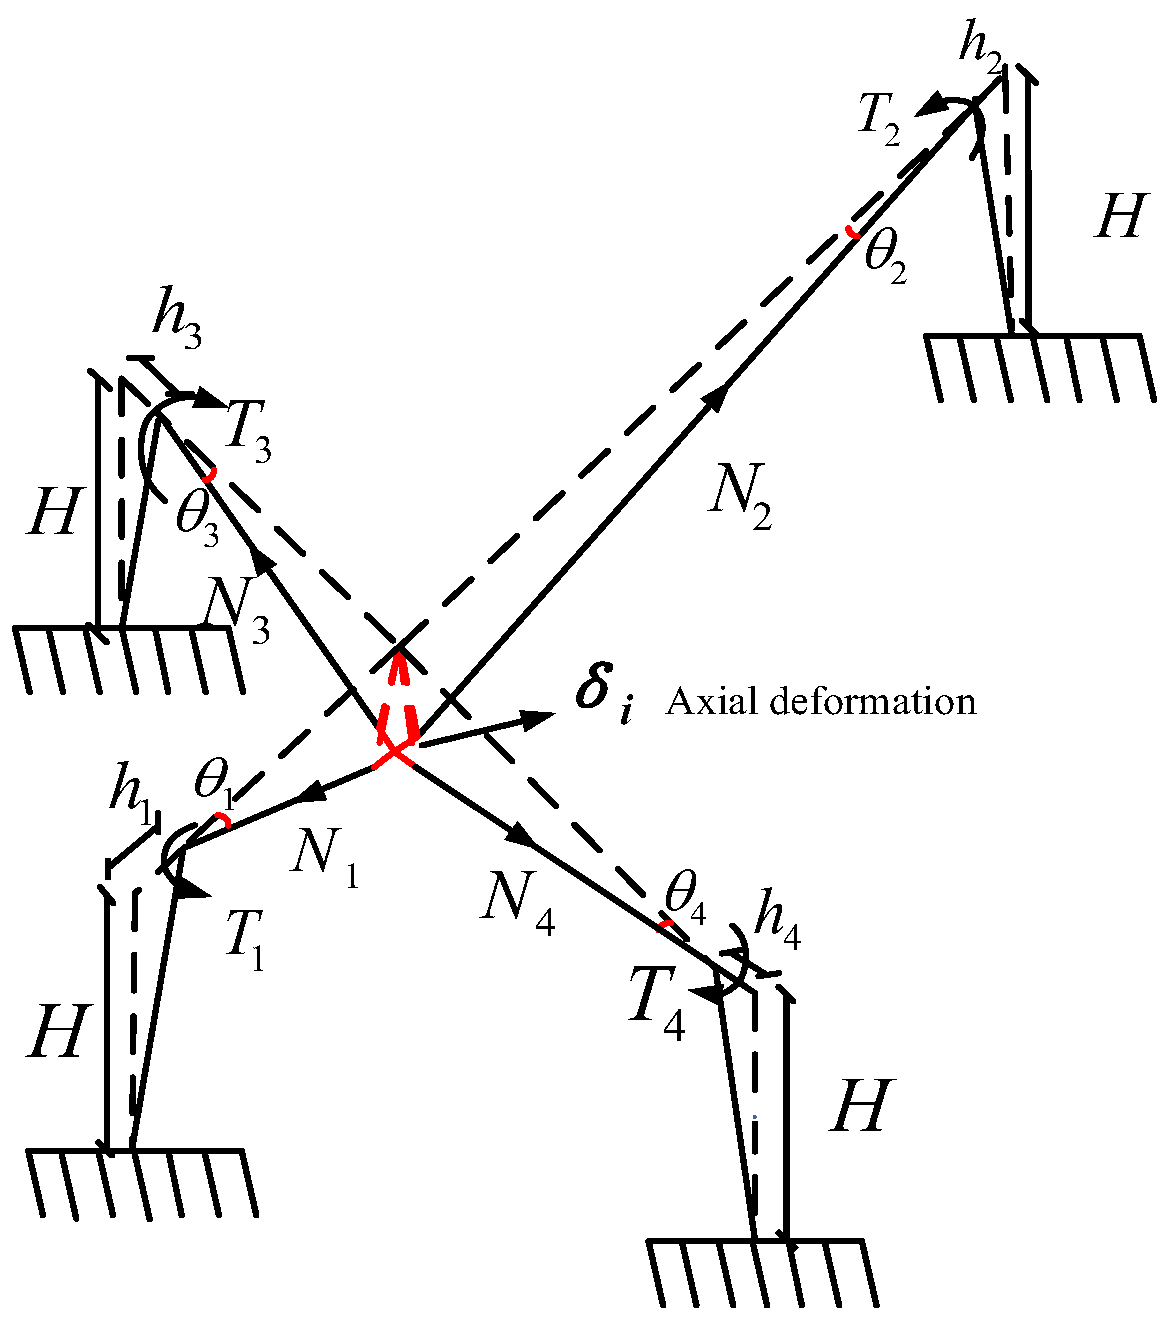
The later-stage bearing capacity of the catenary mechanism is jointly supported by the beam, slab, and reinforcement. Figure 18 depicts the mechanical model of the beam.
During the catenary mechanism stage, the beam resists collapse via axial tension. The axial force magnitude of a beam depends on its axial stiffness and deformation, expressed as:
N i = k i δ i
where k i represents the axial stiffness of the beam k i = E A / l , which depends on the cross-sectional dimensions and longitudinal reinforcement ratio of the beam. δ i denotes the axial deformation of the beam, and δ i , the axial deformation of the beam can be determined via the deformation coordination condition as:
δ i = l i l i cos θ i
where l i represents the beam span, θ i denotes the beam end rotation angle, and θ i = tan θ i is used as an approximation. The beam end rotation angle adopts a second-order approximation [28], given as cos θ i 1 θ i 2 / 2 ; then:
θ i = tan θ i = Δ l i h i
δ i = Δ 2 2 l i h i 2
where h i represents the horizontal displacement of the column end, Δ denotes the vertical displacement of the failed column, and the horizontal displacement primarily depends on the column’s lateral stiffness. During the test, the side column in the short-span area was pulled out when the column displacement reached δ = 350 mm, indicating that the column had reached its limit displacement under horizontal loading. This study considers only the bending deformation of the column. The horizontal displacement of a column is influenced by its cross-sectional dimensions.
h = h e f + h p f
h e f = 1 3 ϕ y H 2
h p f = ϕ u ϕ y ' l p H l p / 2
where h e f represents the yield deformation, h p f represents the plastic deformation, ϕ y represents the yield curvature at the column base, H represents the column height, ϕ u represents the ultimate curvature, ϕ y ' represents the equivalent curvature, and l p represents the equivalent plastic hinge length, with a correction coefficient of 0.83 [29].
For the side beams, a significant torsion mechanism is observed under the tension of the plate during large deformations. The torsional effects on side beams should be considered to prevent premature damage. During the large deformation stage, the torsional capacity of the mid-span section is estimated via a pure torsion approximation as follows:
T i = 0.35 f t W t + 0.12 ζ f y v A s t 1 A c o r s
where W t denotes the plastic resistance moment under torsion, ζ represents the strength ratio between torsional longitudinal reinforcement and stirrups, A s t 1 is the cross-sectional area of the stirrups, A c o r is the core area of the cross-section, and s, the spacing of torsion stirrups, is 50 mm. T i refers to the torsional bearing capacity of each beam. The calculated torque of the beam is reduced by a factor of 0.4. N i represents the axial force provided by each beam, whereas H denotes the column height. The resistance contributed by the catenary action of the beam at the mid-span section during large deformation is as follows:
R c = Σ i = 1 4 N i H l i + 0.4 T i l i

6.2. Analysis of Floor Resistance at the Large Deformation Stage

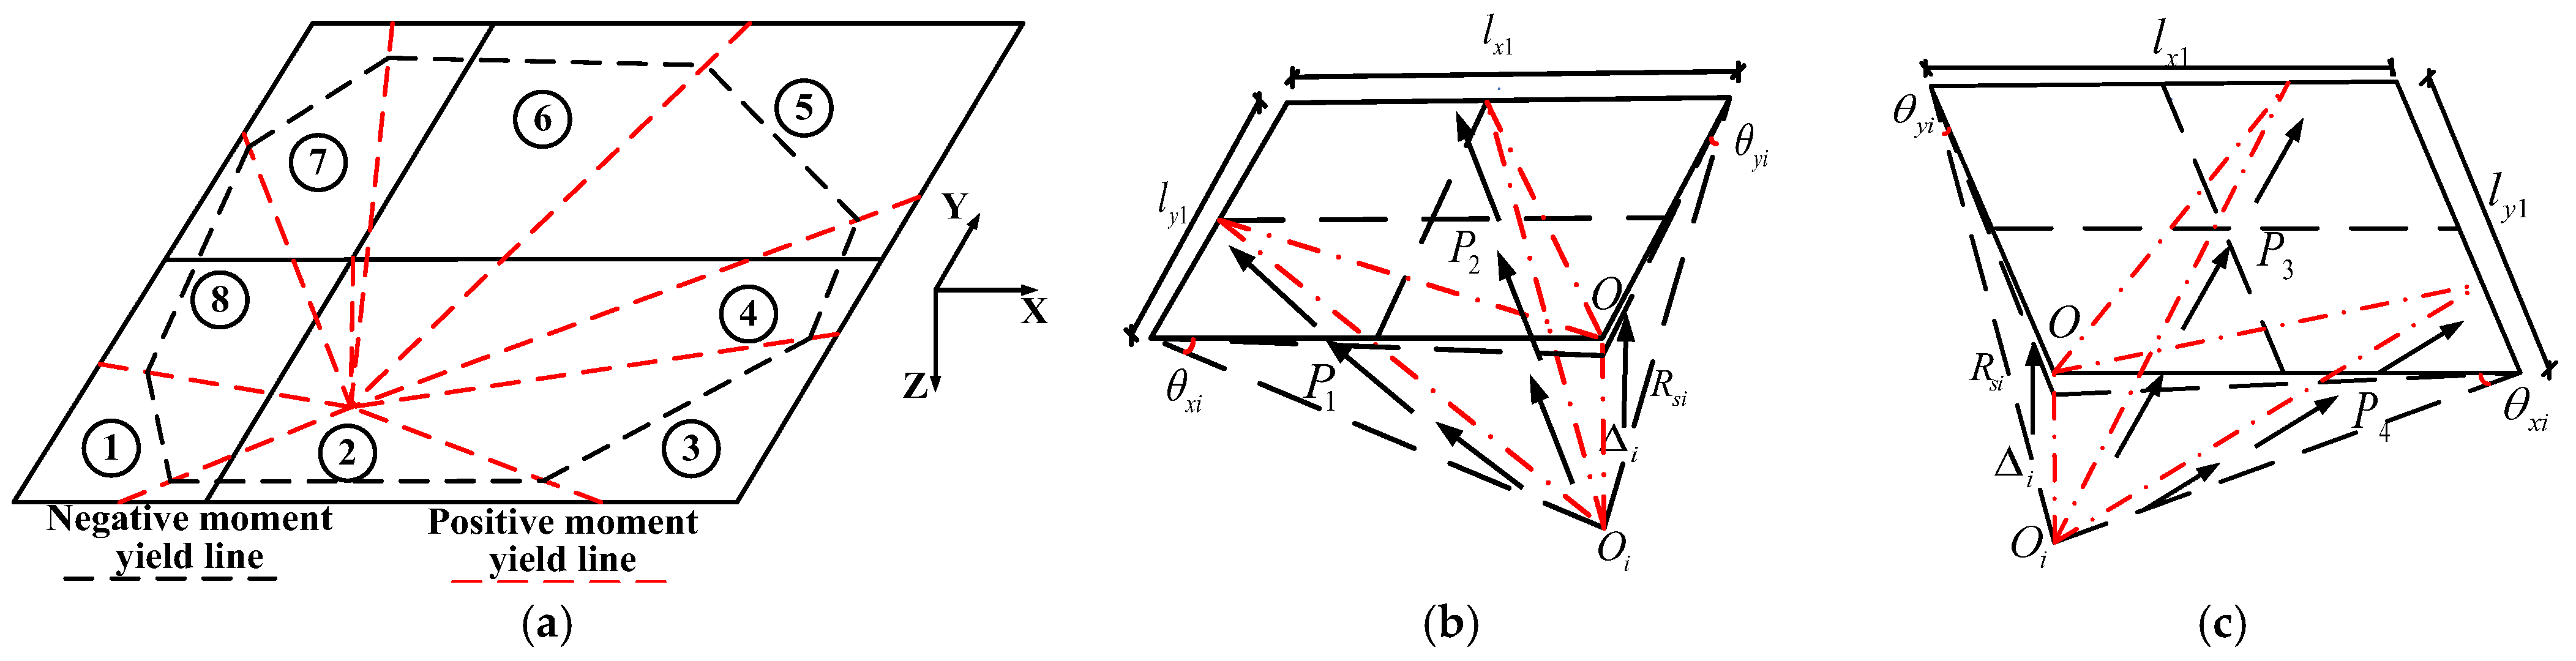
As illustrated in Figure 19a, the floor slab is divided into four triangular and four fan-shaped areas on the basis of the yield line positions. Cracks in the floor slab typically develop along the plastic hinge section. The resistance from each area is aggregated at the plastic hinge section. The resistance R s generated by the floor slab is transferred through the bidirectional tensile force P i at the plastic hinge section. Figure 11c and Figure 19b depict the detailed analysis of half the short-span area and half the long-span area.
On the basis of the deformation relationship, the resistance R s i generated by the floor slab in the short-span plate-belt area (including all of plate 7 and parts of plates 6 and 8) is as follows:
R s 1 = P 1 l x 1 Δ i l y 1 h y 2 + Δ i 2 + P 1 l y 1 Δ i 2 l x 1 h x 1 2 + Δ i 2
R s 2 = P 2 l y 1 Δ i l x 1 h x 1 2 + Δ i 2 + P 2 l x 1 Δ i 2 l y 1 h y 2 + Δ i 2
The resistance R s i generated in the long-span plate-belt area, including the entirety of slab 5 and portions of slabs 4 and 6, is as follows:
R s 3 = P 3 l y 1 Δ i l x 2 h x 2 2 + Δ i 2 + 3 P 3 l x 2 Δ i 4 l y 1 h y 2 + Δ i 2
R s 4 = P 4 l x 2 Δ i l y 1 h y 2 + Δ i 2 + P 4 l y 1 Δ i 4 l x 2 h x 2 2 + Δ i 2
where P i represents the resistance of the plastic hinge section, l x 1 represents the span length of the short-span longitudinal beam, l x 2 represents the span length of the long-span longitudinal beam, l y 1 represents the span length of the horizontal beam, Δ i represents the vertical displacement of the failed column, h x i represents the lateral displacement of the X-beam side column, and h y represents the lateral displacement of the Y-beam side column. During the collapse process, the stress in the mid-span section of the slab is approximately linearly distributed. The average stress in the plastic hinge section, near the positive moment yield line at the failure point, is determined via the yield stress of the slab reinforcement. The resistance P i of the plastic hinge section is resolved into X and Y directions and calculated via the deformation coordination of rotation angles θ x i and θ y i at the slab ends, along with the vertical displacement Δ i of the failed internal column:
sin θ i = Δ i Δ i 2 + l i h i 2
P x = Σ i = 1 n σ x i A s i sin θ x i
P y = Σ i = 1 n σ y i A s i sin θ y i
P = Σ i = 1 n P x i 2 + P y i 2
In the formula, σ x i represents the yield stress of the x-direction floor reinforcement, σ y i represents the yield stress of the y-direction floor reinforcement, θ x i represents the x-direction floor rotation angle, A s i represents the cross-sectional area of the i-th reinforcement, θ y i represents the y-direction floor rotation angle, n represents the number of slab strips divided into unit strips on the basis of the bidirectional longitudinal reinforcements of the slab, and Δ i represents the vertical displacement of the failed column. The plastic hinge section resistance P is determined by superimposing the contributions of the slab strip units. As the floor reinforcement does not fully contribute, a reduction factor of 0.8 is applied on the basis of the position of the floor yield line. The resistance provided by the floor is as follows:
R s = 1.6 R s 1 + R s 2 + R s 3 + R s 4
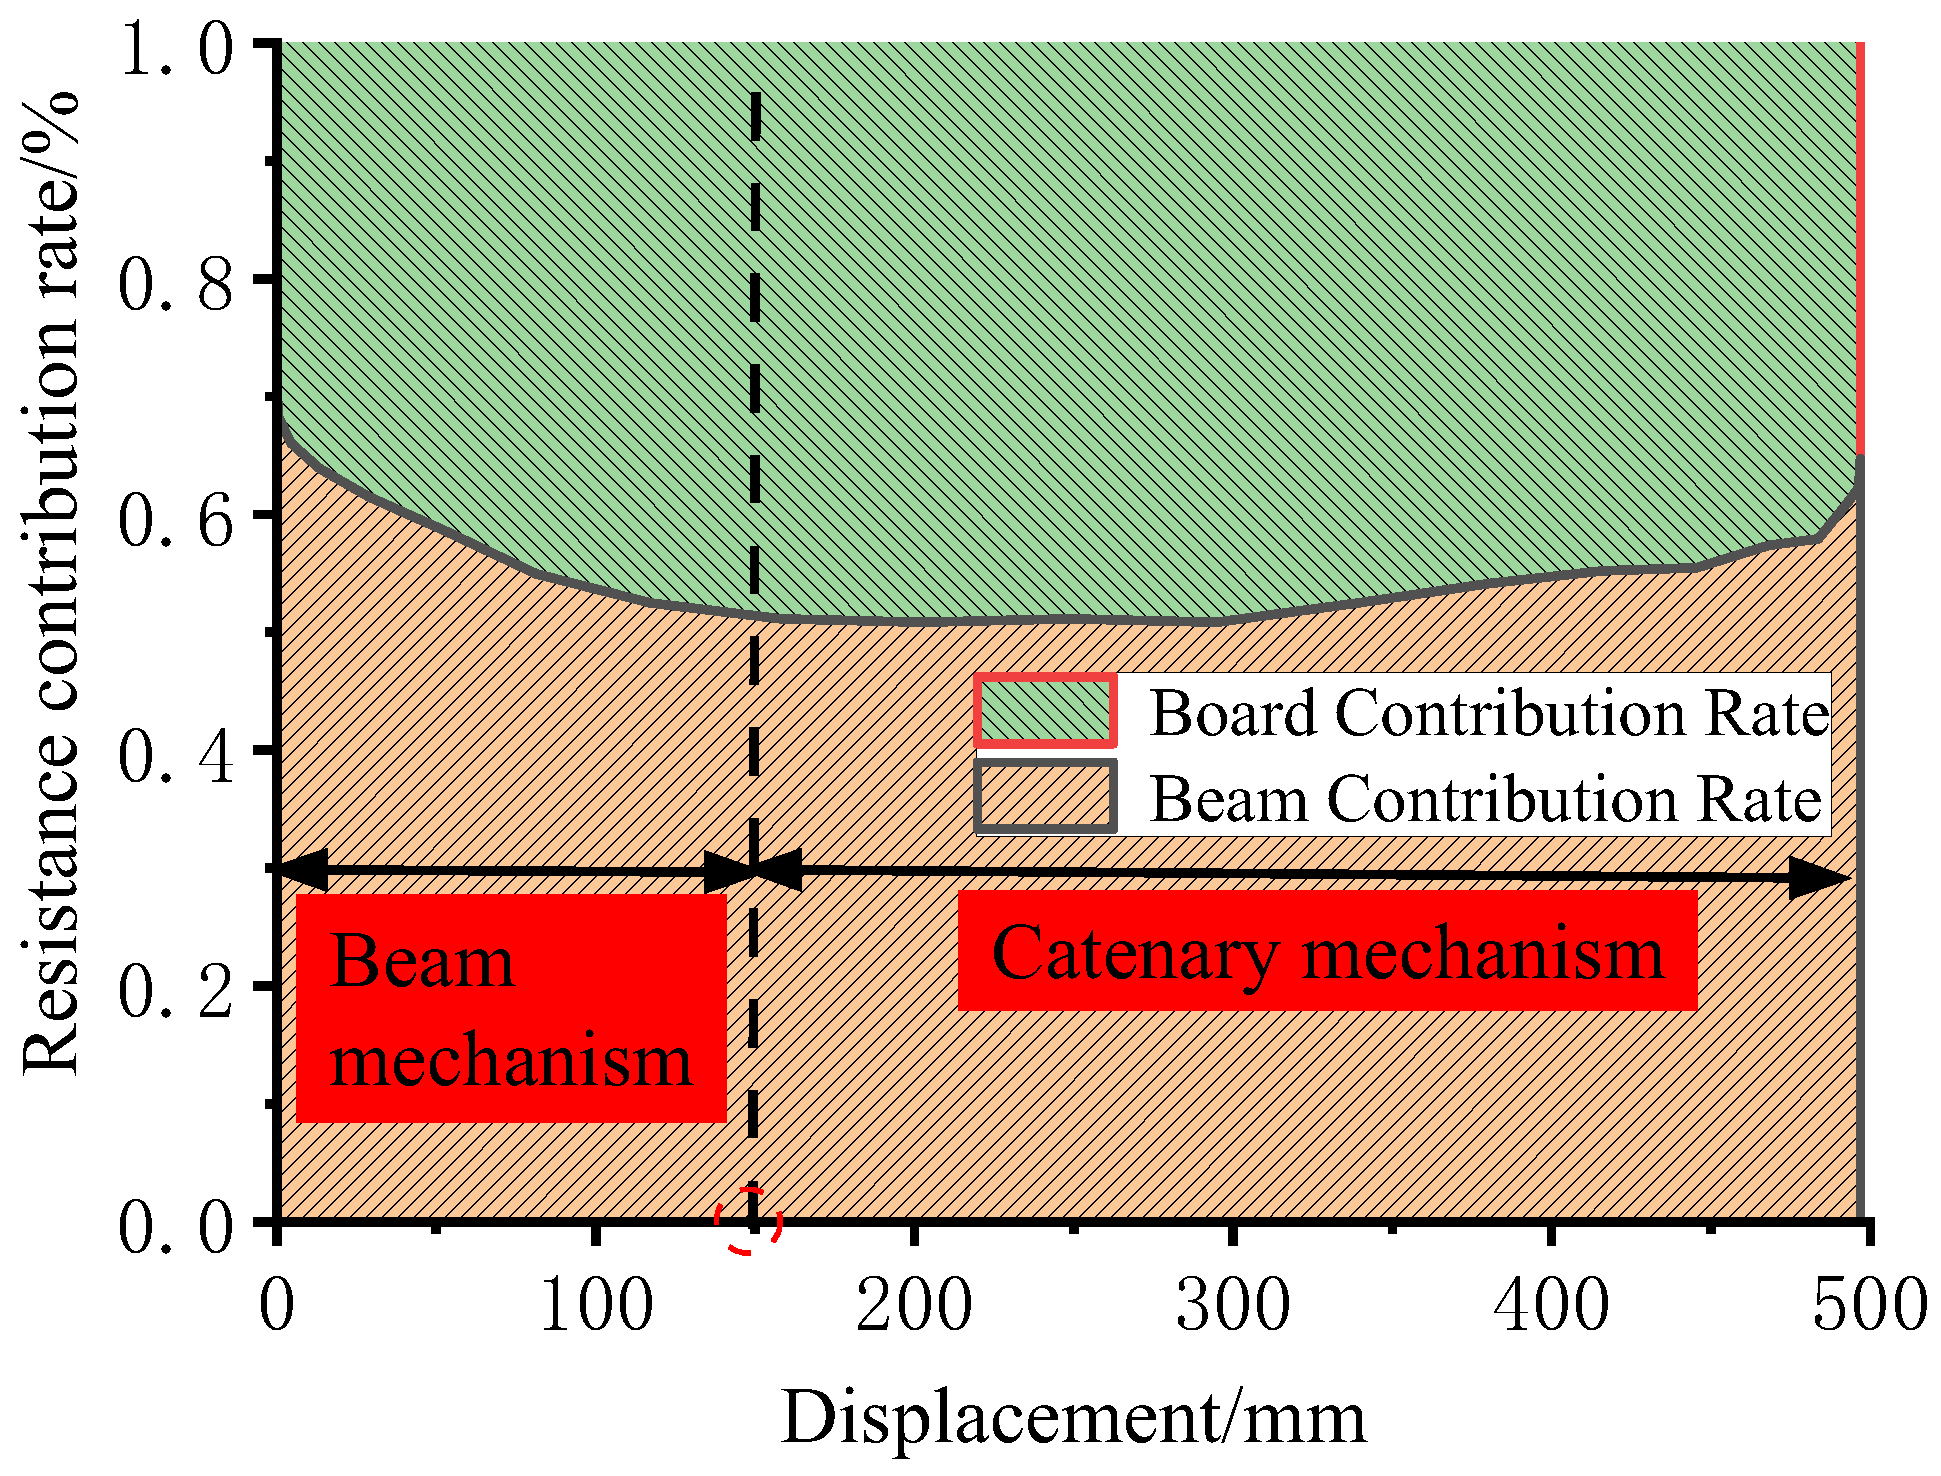
This study compared the experimental results of equal-span and unequal-span structures from References [13,30,31,32,33,34] with the computational results obtained herein. The experimental models in the literature included both slab-framed and slabless specimens. As shown in Table 4, the discrepancies between the experimental values from the references and the calculated values from this study ranged from 4.8% to 10%, indicating a close agreement. This demonstrated that the calculation method proposed in this study could effectively predict the load-bearing capacity of both equal-span and unequal-span structures, with and without floor slabs [35,36,37,38,39]. The observed discrepancies were attributed to non-uniform deformation of the floor slab, which led to asynchronous slab deformation during testing. The theoretical formulation was primarily validated against failure characteristic points. Under large deformations, the beam’s load-bearing capacity increased with further deformation, resulting in deviations between the calculated and experimental values in terms of both capacity and deformation. The contribution rates of the beam–slab system in the numerical model are shown in Figure 20. The beam contribution rate estimated by the theoretical formula was 5–10% lower than that obtained from the numerical simulation. The theoretical formula effectively captured the anticollapse behavior of the external corridor with a floor substructure during the large deformation stage. The synergistic interaction between the beam and slab significantly enhanced the bearing capacity of the external corridor frame structure during the large deformation stage [40,41,42,43,44].

7. Conclusions

On the basis of tests of the external corridor frame substructure and a finite element model, the following conclusions were derived regarding the influence of the floor slab on the structure’s anticollapse capacity:
(1)
Under an internal column removal scenario, the progressive collapse resistance is significantly influenced by span layout. With floor slabs present, the equal-span structure benefits from slab reinforcement collaboration, achieving a catenary-stage capacity of 169.1 kN, which exceeds the 145.2 kN of the external corridor unequal-span structure. Without slabs, the unequal-span structure exhibits a capacity of 90.9 kN due to short-span stress concentration, surpassing the equal-span structure by 23.3 kN. The internal corridor unequal-span structure reaches 162.6 kN but is prone to asymmetric failure and severe long-span damage caused by uneven lateral restraints. Although the equal-span structure shows a delayed load-resisting response, its overall performance is superior and its failure mode more coordinated.
(2)
The collapse resistance varies markedly with the location of the failed column. For side column failure, the floor slab substantially enhances load capacity; a longer span connected to the failed column induces greater internal forces and thus a lower overall capacity. After corner column removal, no catenary action develops, and the load capacity experiences no secondary increase. Corner column failure adjacent to a long span yields the lowest capacity and the most rapid strength loss.
(3)
Increasing slab thickness from 120 mm to 130 mm raises the load capacity by 15–20%, attributed to a thicker concrete cover delaying flange crushing. Further increase to 140 mm gives a saturated capacity enhancement, while the added self-weight introduces a punching shear risk. The reinforcement ratio primarily affects resistance at large deformations: reducing bottom rebar spacing to 160 mm increases post-peak capacity by 20–30%, whereas increasing spacing to 240 mm reduces it by 10–20%. During the beam mechanism stage, slab-beam composite action boosts capacity by 100–130%, and slab reinforcement provides critical tensile action in the catenary stage.
(4)
Damage patterns in the slab vary systematically with column failure location. Internal column failure creates an annular stress zone on the slab top; side column failure produces a quarter-elliptical pattern; corner column failure induces damage propagating along a 45° diagonal. Early slab damage characteristics effectively predict subsequent crack propagation.
(5)
Stresses in beam and slab reinforcement show distinct spatial distributions during progressive collapse. Top beam reinforcement transitions from initial compression to tension, reflecting the shift from compressive arch action to a catenary mechanism, while bottom reinforcement yields early in tension. Slab reinforcement stress becomes more pronounced near the failed column. The beam span-to-depth ratio is a critical factor influencing axial force, with smaller ratios generating larger axial forces during collapse.
(6)
Future research on unequal-span frames should focus on the spatial composite action of floor slabs and the full-range evolution of resistance mechanisms. Through refined modeling and parametric analysis, a quantitative theoretical model for the slab contribution should be established, along with a progressive collapse assessment framework applicable to complex structural configurations.
(7)
In design, priority should be given to protecting corner columns adjacent to long spans, as their failure produces the lowest capacity and fastest strength degradation. Differentiated detailing measures should be adopted for side columns and corner columns based on their distinct failure characteristics.
(8)
Slab thickness should not be increased blindly beyond 130 mm to avoid punching shear risk. A bottom rebar spacing of approximately 160 mm is recommended to enhance post-peak ductility. Slabs should be designed as two-way systems to fully mobilize their tensile membrane action.
(9)
For unequal-span structures, the proposed assessment framework should be used to improve existing anti-collapse design methods, with special attention to the asymmetric failure mode of long spans caused by uneven lateral restraints.

Author Contributions

Conceptualization, Y.Z.; Methodology, Y.Z.; Validation, G.D.; Investigation, M.R.; Resources, M.R.; Data curation, C.W.; Writing—original draft, C.W.; Visualization, C.M. All authors have read and agreed to the published version of the manuscript.

Funding

This research received no external funding.

Data Availability Statement

Data is provided within the manuscript information files.

Conflicts of Interest

Author Chong Wang was employed by the Shandong Electric Power Engineering Consulting Institute Corporation Limited. Author Chendong Mu was employed by the State Grid East Inner Mongolia Electric Power Co. The remaining authors declare that the research was conducted in the absence of any commercial or financial relationships that could be construed as a potential conflict of interest.

References

  1. CECS392-2014; Code for Design of Anti-Collapse of Building Structures. China Planning Press: Beijing, China, 2015.
  2. DOD2010; Design of Buildings to Resist Progressive Collapse. Department of Defense: Washington, DC, USA, 2010.
  3. Cheng, W. Disaster Memory and Place Identity Toward the Yingxiu Epicenter Memorial Site of the Wenchuan Earthquake of 2008. Ph.D. Thesis, Chengdu University of Technology, Chengdu, China, 2023. [Google Scholar]
  4. Li, Z.; Xue, T.; Yuan, X.; Zhang, Y.; Qian, K. Load resisting mechanism of RC spatial beam-column substructures with unequal spans in the loss of a corner column scenario. J. Vib. Shock 2023, 42, 115–125+179. [Google Scholar]
  5. Li, Z.; Huang, X.H.; Ji, F.Q.; Zhong, Y.; Deng, X.F. Research on dynamic response analysis and evaluation method of resistance to progressive collapse of reinforced concrete frame structures at high temperatures. J. Vib. Shock 2025, 44, 298–307. [Google Scholar]
  6. Gan, Y.; Yu, J.; Chen, J.; Shen, J. Study on Analytical Model and Robustness Ranking Index of RC Frames With Unequal Spans Against Progressive Collapse. Eng. Mech. 2022, 39, 210–222. [Google Scholar]
  7. Wang, Z.; Yu, Q.H.; Li, X.W.; Cheng, X.J.; Wu, B. Efficient Analysis Method For The Entire Progressive Collapse Process of RC Frame Structures Based on Opensees. J. Vib. Shock 2025, 44, 132–140. [Google Scholar]
  8. Deng, X.F.; Lan, D.Q.; Jin, L.; Du, X.L. Study on Progressive Collapse Behavor of RC Frame Under a Penultimate Column Removal Scenario. Eng. Mech. 2024, 41, 12–23. [Google Scholar]
  9. Huang, Y.Z.; Liang, Z.H.; Wang, S.N.; Xue, X.G.; Li, Y. Influences of Primary Design Parameters on Progressive Collapse Resistance of Regular RC Frame Structures. Eng. Mech. 2023, 40, 184–190. [Google Scholar]
  10. Xiong, J.G.; Li, Z.C.; Hu, S.J.; Wang, Y.C.; Lan, Q.Y. Experimental research on anti-progressive collapse performance of beam-column substructure in prefabricated RCS composite frame. J. Build. Struct. 2021, 42, 22–30. [Google Scholar]
  11. Chen, Z.F.; Lin, K.Q.; Lu, X.Z.; Li, Y. Uncertainty Analysis on Progressive Collapse Resistance of RC Beam-Column Substructures. Eng. Mech. 2021, 38, 72–80+90. [Google Scholar]
  12. Huang, Y.; Hong, L.; Yi, W. Analysis on Compressive Membrane Mechanism Based Progressive Collapse Bearing Capacity of RC Frame Considering Floor Slab Action. J. Hunan Univ. (Nat. Sci.) 2021, 48, 10–18. [Google Scholar]
  13. Du, K.; Teng, N.; Yan, D.; Sun, J. Experimental Study on the Effect of Floor Slab on the Progressive Collapse Resistance of RC Spatial Frame Structure. China Civ. Eng. J. 2019, 52, 14–23. [Google Scholar]
  14. Yu, J.; Luo, L.; Li, Y. Numerical Study of Progressive Collapse Resistance of RC Beam-Slab Substructures under Perimeter Column Removal Scenarios. Eng. Struct. 2018, 159, 14–27. [Google Scholar] [CrossRef] [Scilit]
  15. Qian, K.; Li, Z.; Weng, Y.; Deng, X. Behavior of RC Beam-Slab Sub-Structures to Resist Progressive Collapse. Eng. Mech. 2019, 36, 239–247. [Google Scholar]
  16. Qian, K.; Luo, D.; He, S.; Li, Z.; Weng, Y.H. Progressive Collapse Performance of Reinforced Concrete Frame Structures Subjected to Ground Two-Column Removal Scenario. J. Build. Struct. 2018, 39, 61–68. [Google Scholar]
  17. Xiao, Y.; Li, Y.; Lu, X.; Ren, P.; He, H. Experimental Study on the Dynamic Effects in Progressive Collapse of Beam-Column Concrete Substructures. Eng. Mech. 2019, 36, 44–52. [Google Scholar]
  18. Sagiroglu, S.; Sasani, M. Progressive Collapse-Resisting Mechanisms of Reinforced Concrete Structures and Effects of Initial Damage Locations. J. Struct. Eng. 2014, 140, 04013073. [Google Scholar] [CrossRef] [Scilit]
  19. Sasani, M.; Werner, A.; Kazemi, A. Bar fracture modeling in progressive collapse analysis of reinforced concrete structures. Eng. Struct. 2011, 33, 401–409. [Google Scholar] [CrossRef] [Scilit]
  20. Choi, H.; Kim, J. Progressive collapse-resisting capacity of RC beam–column sub-assemblage. Mag. Concr. Res. 2011, 63, 297–310. [Google Scholar] [CrossRef] [Scilit]
  21. Orton, S.L. Development of a CFRP System to Provide Continuity in Existing Reinforced Concrete Buildings Vulnerable to Progressive Collapse. Ph.D. Thesis, The University of Texas at Austin, Austin, TX, USA, 2007. [Google Scholar]
  22. Galal, M.A.; Bandyopadhyay, M.; Banik, A.K. Dual effect of axial tension force developed in catenary action during progressive collapse of 3D composite semi-rigid jointed frames. Structures 2019, 19, 507–519. [Google Scholar] [CrossRef] [Scilit]
  23. Tohidi, M.; Baniotopoulos, C. Effect of floor joint design on catenary actions of precast floor slab system. Eng. Struct. 2017, 152, 274–288. [Google Scholar] [CrossRef] [Scilit]
  24. Ling, L.; Wei, W.; Teh, L.H.; Chen, Y. Effects of span-to-depth ratios on moment connection damage evolution under catenary action. J. Constr. Steel Res. 2017, 139, 18–29. [Google Scholar]
  25. GB 50010-2010; Code for Design of Concrete Structures. China Architecture & Building Press: Beijing, China, 2015.
  26. Teng, N. Study on Progressive Collapse Resistance of RC Frame Structure Considering Catenary Mechanism. Ph.D. Thesis, Institute of Engineering Mechanics, China Earthquake Administration, Harbin, China, 2018. [Google Scholar]
  27. Liu, W.; Qian, C.; Han, S. Analyzing and Dealing with the Collapse Resistance of the Reinforced Concrete Frame after the Frame Column Failure. Earthq. Resist. Eng. Retrofit. 2018, 44, 95–101. [Google Scholar]
  28. Qiao, H.; Yang, Y.; Zhong, W. Progressive Collapse Analysis and Mechanism Study for Multistory Frame Structures with Middle-Column Demolition. J. Vib. Shock 2018, 37, 136–143. [Google Scholar]
  29. Xie, Y.; Jia, L. Calculation Method and Experimental Study on Ultimate Displacement of Reinforced Concrete Column. Build. Struct. 2014, 44, 66–70. [Google Scholar]
  30. Qian, K.; Li, B.; Ma, J.X. Load-carrying mechanism to resist progressive collapse of RC buildings. J. Struct. Eng. 2015, 141, 04014164. [Google Scholar] [CrossRef] [Scilit]
  31. Pham, A.T.; Tan, K.H. Analytical Model for Tensile Membrane Action in RC Beam-Slab Structures under Internal Column Removal. J. Struct. Eng. 2019, 145, 04018259. [Google Scholar] [CrossRef] [Scilit]
  32. Zhang, Q.; Li, Y. Experimental and modeling study on the progressive collapse resistance of a reinforced concrete frame structure under a middle column removal scenario. Struct. Des. Tall Spec. Build. 2020, 29, e1693. [Google Scholar] [CrossRef] [Scilit]
  33. Du, K.; Bai, J.; Teng, N.; Yan, D.; Chen, H.; Sun, J. Progressive-collapse test of slab effects on reinforced concrete spatial frame substructures. Mag. Concr. Res. 2021, 73, 1081–1099. [Google Scholar] [CrossRef] [Scilit]
  34. Du, K.; Bai, J.; Teng, N.; Yan, D.; Sun, J. Experimental investigation of asymmetrical reinforced concrete spatial frame substructures against progressive collapse under different column removal scenarios. Struct. Des. Tall Spec. Build. 2020, 29, e16711. [Google Scholar] [CrossRef] [Scilit]
  35. Wang, J.-L.; Zou, Y.; Liu, H.; Wu, Y.; Li, Z.; Xue, T.-Q. Dynamic Response Analysis of Infilled RC Frames with Openings Under Instantaneous Column Removal Scenarios. Buildings 2025, 15, 3778. [Google Scholar] [CrossRef] [Scilit]
  36. Shao, G.-D.; Xiao, C.; Zhu, M.-X.; Hassan, F.S.; Ma, C.-S.; Zhang, S.-Y.; Tian, L. Seismic Performance and Collapse Fragility of a 765 kV Transmission Tower–Line System. Buildings 2025, 15, 4206. [Google Scholar] [CrossRef] [Scilit]
  37. Kılıçer, S.; Kılıçer, S.T. Progressive-Collapse Robustness Assessment of Existing Reinforced Concrete Buildings in Diverse Geographical Regions Using the Tie-Force Method. Buildings 2026, 16, 1090. [Google Scholar] [CrossRef] [Scilit]
  38. Qu, T.; Zeng, B.; Zhou, Z.; Huang, L. Failure mode discrimination and theoretical prediction method for unequal span bonded prestressed concrete substructures against progressive collapse. Eng. Fail. Anal. 2024, 156, 107470. [Google Scholar] [CrossRef] [Scilit]
  39. Wang, C.C.; Kong, K.H.; Poh, L.H. Collapse behavior of asymmetrical cast-in and precast concrete subassemblages under internal column loss scenarios. Structures 2026, 85, 107839. [Google Scholar] [CrossRef] [Scilit]
  40. Qu, T.; Zeng, B.; Zhou, Z.; Huang, L. Experimental investigation of progressive collapse resistance of bonded local prestressed concrete frame substructures. Eng. Struct. 2025, 323, 119232. [Google Scholar] [CrossRef] [Scilit]
  41. Qu, T.; Zeng, B.; Zhou, Z.; Huang, L. Progressive collapse resistance of local prestressed concrete sub-structures: Numerical analysis and theoretical verification. J. Build. Eng. 2024, 90, 109430. [Google Scholar] [CrossRef] [Scilit]
  42. Chen, G.S.; Cheng, X.W.; Diao, M.Z. Progressive collapse resistance of one-way wet-connected precast concrete beam-slab-column substructures: Experimental and numerical investigations. Eng. Struct. 2025, 344, 122468. [Google Scholar] [CrossRef] [Scilit]
  43. Qu, T.; Zeng, B.; Zhou, Z. Dynamic and uncertainty-based assessment of the progressive collapse probability of prestressed concrete frame structures with infill walls. Structures 2024, 61, 106105. [Google Scholar] [CrossRef] [Scilit]
  44. Liu, Y.; Cheng, X.; Diao, M.; Li, Y.; Zhang, Y. Explicit analytical method for compressive arch action in full-scale reinforced concrete continuous beams: Validation and improvement of existing models. Eng. Struct. 2025, 339, 120606. [Google Scholar] [CrossRef] [Scilit]
Figure 1. Collapse Images of Xuankou Middle School, Wenchuan.
Buildings 16 01718 g001
Figure 2. Stress–strain curves of the material. (a) Uniaxial tensile stress–strain curve. (b) Uniaxial compressive stress–strain curve. (c) Steel bar stress–strain curve.
Buildings 16 01718 g002
Figure 3. Reinforcement details of the sample. (a) Beam and column reinforcement. (b) Floor reinforcement. (c) The 3D diagram of the test specimen’s reinforcement bars. (d) The X-axis equal-span model. (e) The internal corridor models.
Buildings 16 01718 g003aBuildings 16 01718 g003b
Figure 4. The test specimen loading setup.
Buildings 16 01718 g004
Figure 5. The 3D Schematic of the test specimen loading setup.
Buildings 16 01718 g005
Figure 6. The structural vertical collapse schematic.
Buildings 16 01718 g006
Figure 7. The sectional view of the test specimen loading setup.
Buildings 16 01718 g007
Figure 8. The detailed drawing of the forced alignment sleeve. (a) The elevation view. (b) The plan view.
Buildings 16 01718 g008
Figure 9. The layout of horizontal displacement transducers.
Buildings 16 01718 g009
Figure 10. Comparison between the experimental and simulation results. (a) Load–displacement curve. (b) Column horizontal displacement.
Buildings 16 01718 g010
Figure 11. Failure mode of the structure. (a) Bottom failure mode. (b) Plate top failure mode. (c) A-A internal column joint cracking. (d) B-B side column joint cracking. (e) C-C beam torsion crack. (f) Model A-A section. (g) Model B-B section. (h) Model C-C section. (i) Model plate bottom failure mode. (j) Model plate top failure mode. (k) Model slabless frame structure failure mode. The PEEQ plot in (fk) was calculated using the finite element software ABAQUS 2024 version (https://www.3ds.com/products/simulia) accessed on 20 January 2024.
Buildings 16 01718 g011
Figure 12. Failure mode of the structure. (a) Model plate failure of equal-span mode. (b) Model slabless frame structure failure of equal-span mode. (c) Model plate failure of internal corridor mode. (d) Model slabless frame structure failure of internal corridor mode. (e) Slab-involved failure mode during collapse of Column D. (f) slabless frame structure failure mode during collapse of Column D. (g) Slab-involved failure mode during collapse of Column E. (h) slabless frame structure failure mode during collapse of Column E. (i) Slab-involved failure mode during collapse of Column F. (j) slabless frame structure failure mode during collapse of Column F. (k) Slab-involved failure mode during collapse of Column G. (l) slabless frame structure failure mode during collapse of Column G. (m) Slab-involved failure mode during collapse of Column H. (n) slabless frame structure failure mode during collapse of Column H. The PEEQ plot in Figure 11 was calculated using the finite element software ABAQUS 2024 version (https://www.3ds.com/products/simulia) accessed on 20 January 2024.
Buildings 16 01718 g012aBuildings 16 01718 g012b
Figure 13. Comparison of unequal span layouts. (a) External corridor and equal-span model. (b) External corridor and internal corridor models.
Buildings 16 01718 g013
Figure 14. Failure of Columns at Different Positions. (a) Failure of D side column. (b) Failure of E and F side columns. (c) Failure of G and H corner columns.
Buildings 16 01718 g014
Figure 15. Influence of the slab parameters. (a) Different plate thicknesses. (b) Different reinforcement spacings. (c) Comparison without floor reinforcement.
Buildings 16 01718 g015
Figure 16. Slab damage. (a) Crack distribution on the top of the test plate. (b) Crack distribution at the bottom of the test plate. (c) Internal column failure and floor slab damage. (d) Side column failure and floor slab damage. (e) Corner column failure and floor damage. The PEEQ plot in Figure 15 was calculated using the finite element software ABAQUS 2024 version (https://www.3ds.com/products/simulia) accessed on 20 January 2024.
Buildings 16 01718 g016
Figure 17. Internal forces in the beam–slab. (a) Beam reinforcement stress. (b) Floor reinforcement stress. (c) Beam axial force time history diagram.
Buildings 16 01718 g017
Figure 18. Force model of the beam.
Buildings 16 01718 g018
Figure 19. Stress analysis of the slab. (a) Floor yield line. (b) Short-span regional load model. (c) Long-span regional load model.
Buildings 16 01718 g019
Figure 20. Contribution rates of the beam and slab.
Buildings 16 01718 g020
Table 1. Damage plasticity parameters of the concrete.
Poisson’s RatioExpansion AngleEccentricity σ b 0 / σ c 0 KViscosity Coefficient
0.2300.11.160.6670.005
Table 2. Material properties of the steel bars.
Steel Bar DiameterYield Strength/MPaUltimate Strength/MPaElastic Modulus/GPaElongation/%
Φ6340.1491.920617.4
Φ8420.4572.020729.0
Φ12430.3578.720825.1
Table 3. Reinforcement details of the S1 beam.
Working ConditionsPlate Thickness/mmX-Axis Beam TopX-Axis Beam BottomY-Axis Beam TopY-Axis Beam Bottom
EndCrossEndCross
S1403Φ82Φ82Φ83Φ82Φ82Φ8
Table 4. Load comparison between test value and theoretical value.
Serial NumberReferencesSpecimen MarkSlabless/Slab-on-FrameTest Value/kNTheoretical Value/kNDeviation %
1[13]B1Slabless frame8577.79.3
2[13]S1Slab-on-frame140131.76.3
3[30]Specimen S1Slab-on-frame1691596.3
4[30]Specimen S2Slab-on-frame1651797.8
5[31]S1Slab-on-frame121.3111.29.1
6[31]S2Slab-on-frame125.3113.910
7[32]FRAME-1Slabless frame43.648.19.3
8[32]FRAME-2Slab-on-frame91.487.24.8
9[33]S2Slab-on-frame123131.26.3
10[34]EXT-XSlab-on-frame115123.16.6
11[34]EXT-YSlabless frame94895.6
12[34]COR-LSlabless frame3734.28.2
Disclaimer/Publisher’s Note: The statements, opinions and data contained in all publications are solely those of the individual author(s) and contributor(s) and not of MDPI and/or the editor(s). MDPI and/or the editor(s) disclaim responsibility for any injury to people or property resulting from any ideas, methods, instructions or products referred to in the content.