Article

Simply Supported Bridge Damage Identification Using a Generalized Information Entropy Index of Rotation Difference: Theoretical and Experimental Study

1
Engineer School, Qinghai Institute of Technology, Xining 810016, China
2
School of Civil Engineering, Chongqing Jiaotong University, Chongqing 400074, China
*
Author to whom correspondence should be addressed.
Buildings 2026, 16(7), 1400; https://doi.org/10.3390/buildings16071400
Submission received: 23 January 2026 / Revised: 20 March 2026 / Accepted: 24 March 2026 / Published: 2 April 2026

Abstract

Accurate identification of damage in simply supported girder bridges and the timely implementation of protective measures are crucial to preventing structural failure. Rotation influence line-based methods offer a straightforward and cost-effective approach for bridge monitoring; however, their validation has primarily relied on numerical simulations, with a lack of rigorous theoretical explanation. To address this limitation, an analytical relationship between the rotation difference at cross-sections before and after damage and the moving load position is first derived using the principle of virtual work, thereby clarifying the theoretical mechanism underlying damage identification. On this theoretical basis, a novel generalized information entropy index of rotation difference is proposed by incorporating information entropy theory to quantify the local nonlinear response induced by damage. The proposed method is validated through numerical simulations conducted on a simply supported steel girder bridge model developed in ANSYS, as well as through comparisons with existing experimental datasets. The results demonstrate that the proposed index can accurately and stably identify both single and multiple damage locations in bridges, while requiring only two inclination sensors installed at the supports. Under varying damage locations and severity levels, the entropy response curves consistently exhibit distinct peaks corresponding to the actual damage positions, thereby confirming the physical consistency and practical applicability of the method. The strategy of combining a minimal sensor configuration with information entropy analysis significantly reduces system complexity and cost while maintaining identification accuracy, providing an efficient and economical solution for practical bridge health monitoring.

1. Introduction

As bridge stocks age worldwide and demands on transportation infrastructure continue to rise, many bridges gradually deteriorate and remain in service well beyond their original design life [1,2]. The progressive accumulation of such damage has led to a significant portion of bridges experiencing reduced stiffness, diminished load-carrying capacity, and classification as structurally critical [3,4]. These substandard bridges not only impose considerable economic costs but also present serious risks to public safety [5,6,7]. This reality highlights the pressing need to develop efficient and reliable structural damage detection methods to ensure long-term structural integrity and serviceability.
A variety of damage indices have been developed to accurately locate and quantify damage in bridge structures. Conventional identification methods rely primarily on modal parameters—such as natural frequencies and mode shapes—or on static response-based indicators, such as influence lines (ILs) and stress lines (SLs), all of which have been applied with considerable success in practice. Yang et al. [8] proposed a damage identification method that employs a stationary vehicle as a mobile sensing platform. The method extracts structural mode shapes from ambient vibration responses to assess changes in local stiffness for damage detection. Aulakh and Bhalla [9] demonstrated that strain-based modal parameters exhibit higher sensitivity to incipient damage than displacement-based parameters under ambient excitation. To address the over-smoothing issue in traditional vibration-based methods caused by Tikhonov regularization, Hou et al. [10] used an l1 regularization-based model updating approach that leverages damage sparsity, showing superior accuracy over conventional l2 regularization. Wang et al. [11] applied the MSE method to damage localization in offshore platforms and concluded that, among various damage detection approaches, MSE-based methods are more effective in identifying damage locations. To further improve identification accuracy, Cha and Buyukozturk [12] introduced a hybrid multi-objective genetic algorithm into the MSE framework, enabling effective detection of both the location and severity of minor structural damage. Alavinezhad and Hassanabad [13] proposed an improved modal strain energy-based damage identification method. Likewise, Angelo et al. [14] proposed a straightforward method for assessing the elastic modulus of simply supported girders under known moving loads. Yasha et al. [15] and Chen et al. [16] proposed a curvature influence line-based method for beam stiffness identification (with theoretical framework) and a set of stress influence line-based indices for damage localization, respectively; validation on the Tsing Ma Bridge for the latter showed stress influence line changes due to damage were markedly greater than natural frequency shifts. Overall, these methods typically identify damage by detecting anomalies in the processed signal responses of a damaged bridge that are not present in its healthy state.
Damage disrupts the inherent order within structural response signals, and spectral entropy serves as an effective metric to quantify this resulting disorder [17]. Defined through the Fourier power spectrum [18,19], spectral entropy reflects the energy concentration of a signal in the frequency domain: ordered, periodic responses (e.g., sinusoidal signals) exhibit low entropy, whereas disordered or chaotic responses (e.g., noise) yield high entropy. Shannon [20] first introduced entropy as a quantitative measure of information uncertainty. Entropy is mathematically defined as a function of a probability distribution. In addition, Smarra et al. [21] proposed a data-driven method for structural damage detection that integrates switching models, nonlinear modeling, and entropy-based sensor optimization. Experimental results demonstrated that this integrated approach enhances detection accuracy and sensitivity across diverse datasets. Li et al. [22] proposed a damage identification method based on a weighted and selective information fusion technique. The method employs artificial neural networks (ANNs), Dempster–Shafer evidence theory, and Shannon entropy. Specifically, weighting coefficients are optimized via a genetic algorithm, and decisions are selectively fused according to entropy levels to reduce uncertainty. This framework was numerically validated on the Binzhou Yellow River Highway Bridge, demonstrating higher identification accuracy compared to standalone ANNs or direct fusion techniques under identical noise conditions. Li et al. [23] applied information entropy to bridge monitoring data processing and prediction, proposing prediction error entropy as an evaluation metric and updating prediction intervals using a Bayesian model. The results demonstrate the promising potential of information entropy in this field. Civera and Surace adopted instantaneous spectral entropy (ISE) for near-real-time monitoring of mechanical and civil systems, such as wind turbine gearboxes [24] and multi-story frame structures [25]. In summary, information entropy serves as a metric for quantifying both the information content of a source and the disorder within a system. It demonstrates broad applicability across diverse engineering fields, including chemistry [26,27], power systems [28], seismic analysis [29], and material damage monitoring [30].
Inclinometers (also known as rotation sensors) measure the angular rotation of a structure relative to a reference horizontal plane [31,32,33]. They are widely used in industrial fields such as automotive, aerospace, and electronics [7,34]. Advances in technology and materials have significantly enhanced the performance and accuracy of inclinometers, making them gradually more suitable for bridge health monitoring. Currently, the precision of such tilt sensors in measuring the inclination angle of bridge structures can reach up to 3.5 × 10⁻⁴ degrees [35,36]. In a progressive damage case study on an aging bridge, Alten et al. [4] systematically evaluated different monitoring techniques using accelerometers, strain sensors, and inclinometers. The study revealed that the damage identification method based on changes in modal frequencies failed to detect all damage scenarios; strain measurements showed only slight variations near the damage locations. In contrast, rotation measurements exhibited clear and global responses under all damage scenarios, indicating that the assessment methodology using inclinometers was the most effective. In another study [37], the researchers proposed a Deformation Area Difference (DAD) method for damage detection through numerical and experimental analyses. This method identifies damage from the area difference between rotation diagrams obtained from healthy and damaged bridge states under static loading. The study demonstrated that damage leads to an increase in DAD factors, with the peak value occurring at the damage location. Huseynov et al. [38] proposed a reference-free damage monitoring method by comparing vehicle weights estimated from rotation-based and strain-based bridge weigh-in-motion (B-WIM) systems. Their study showed that for narrow, simply supported bridges, rotation responses are globally sensitive to structural damage, whereas strain responses are only locally affected. In recent years, numerous studies have focused on identifying local damage in bridges by analyzing their dynamic response under moving vehicle loads. For example, [5,39] employ numerical analysis to establish a theoretical basis for damage identification using rotation-based monitoring. The core approach adopts the difference in rotational responses—specifically, the rotation influence lines—between intact and damaged bridge states as a damage-sensitive indicator. Additionally, these works investigate the sensitivity of rotation measurements to structural damage and the effect of sensor location, providing insights for optimizing detection performance. Although inclinometer-based monitoring techniques have proven valuable for understanding structural behavior—such as responses during construction and/or operational stages [40], long-term performance [41,42,43], support boundary conditions [44], the deformed shape of a bridge deck [1,45,46], and modal properties [47,48] of bridges—the existing theoretical foundation for damage identification using rotation measurements relies predominantly on numerical simulations and lacks rigorous mathematical derivation [5,38,39]. Thus, it is necessary to establish a rigorous theoretical link between rotation influence lines and structural damage identification.
This study adopts a multi-stage validation approach: analytical derivation first establishes the theoretical mechanism, numerical simulation then confirms its feasibility, and experimental validation ultimately demonstrates its practical robustness. Specifically, Section 2 derives an analytical relationship between the rotation difference at cross-sections before and after damage and the moving load position for a simply supported beam based on the principle of virtual work and subsequently proposes a novel damage identification index by integrating information entropy theory. In Section 3, a finite element model of a simply supported steel girder bridge is established using ANSYS 16.0 to verify the effectiveness of the proposed index through numerical simulations. Section 4 further validates the engineering applicability of the damage identification index using existing experimental data. Finally, the main conclusions of this study are summarized in Section 5.

2. Theoretical Bases

2.1. Derivation of the Rotation Angle Equation for Simply Supported Beams

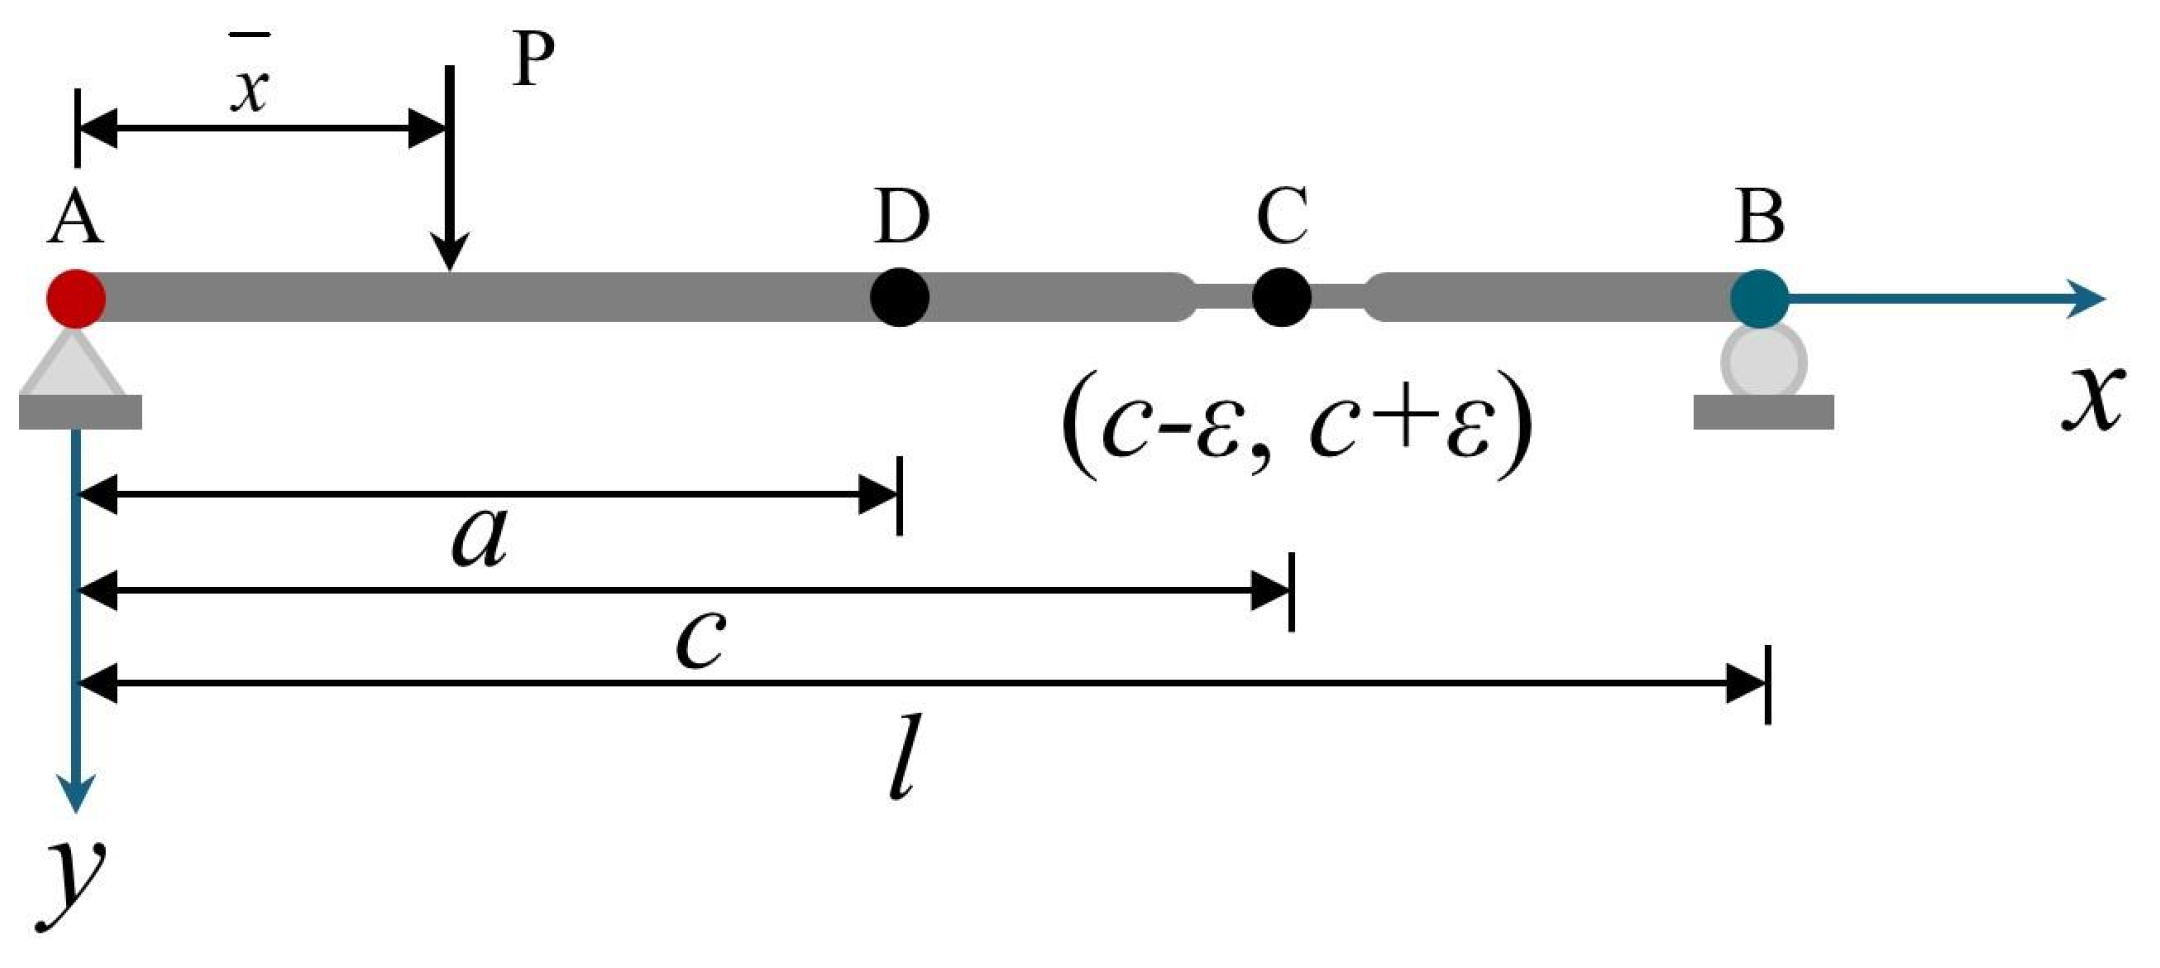
To ensure a rigorous analytical foundation, the derivation is based on the following assumptions: (1) the bridge is modeled as an Euler–Bernoulli beam, where plane sections remain plane and perpendicular to the neutral axis after deformation; (2) the material behaves as linearly elastic throughout the loading process, except for the localized stiffness reduction at the damage site; and (3) structural damage is represented as a localized reduction in flexural stiffness from EI to E’I within a small segment (cε, c + ε).
As illustrated in Figure 1, the bending moment M at any cross-section of a simply supported beam under a moving load P is expressed as Equation (1). Here, l denotes the span length of the simply supported beam, x ¯ indicates the position of the moving load, x refers to the location of the cross-section, EI is the flexural rigidity of the undamaged beam, E’I represents the reduced flexural rigidity within the damaged region, c denotes the center of the damaged region, and ε is half the length of the damaged segment, such that the damaged zone extends from cε to c + ε.
M F ( x ) = P ( l x ¯ ) l x , 0 x < x ¯ P x l l x ¯ , x ¯ x l
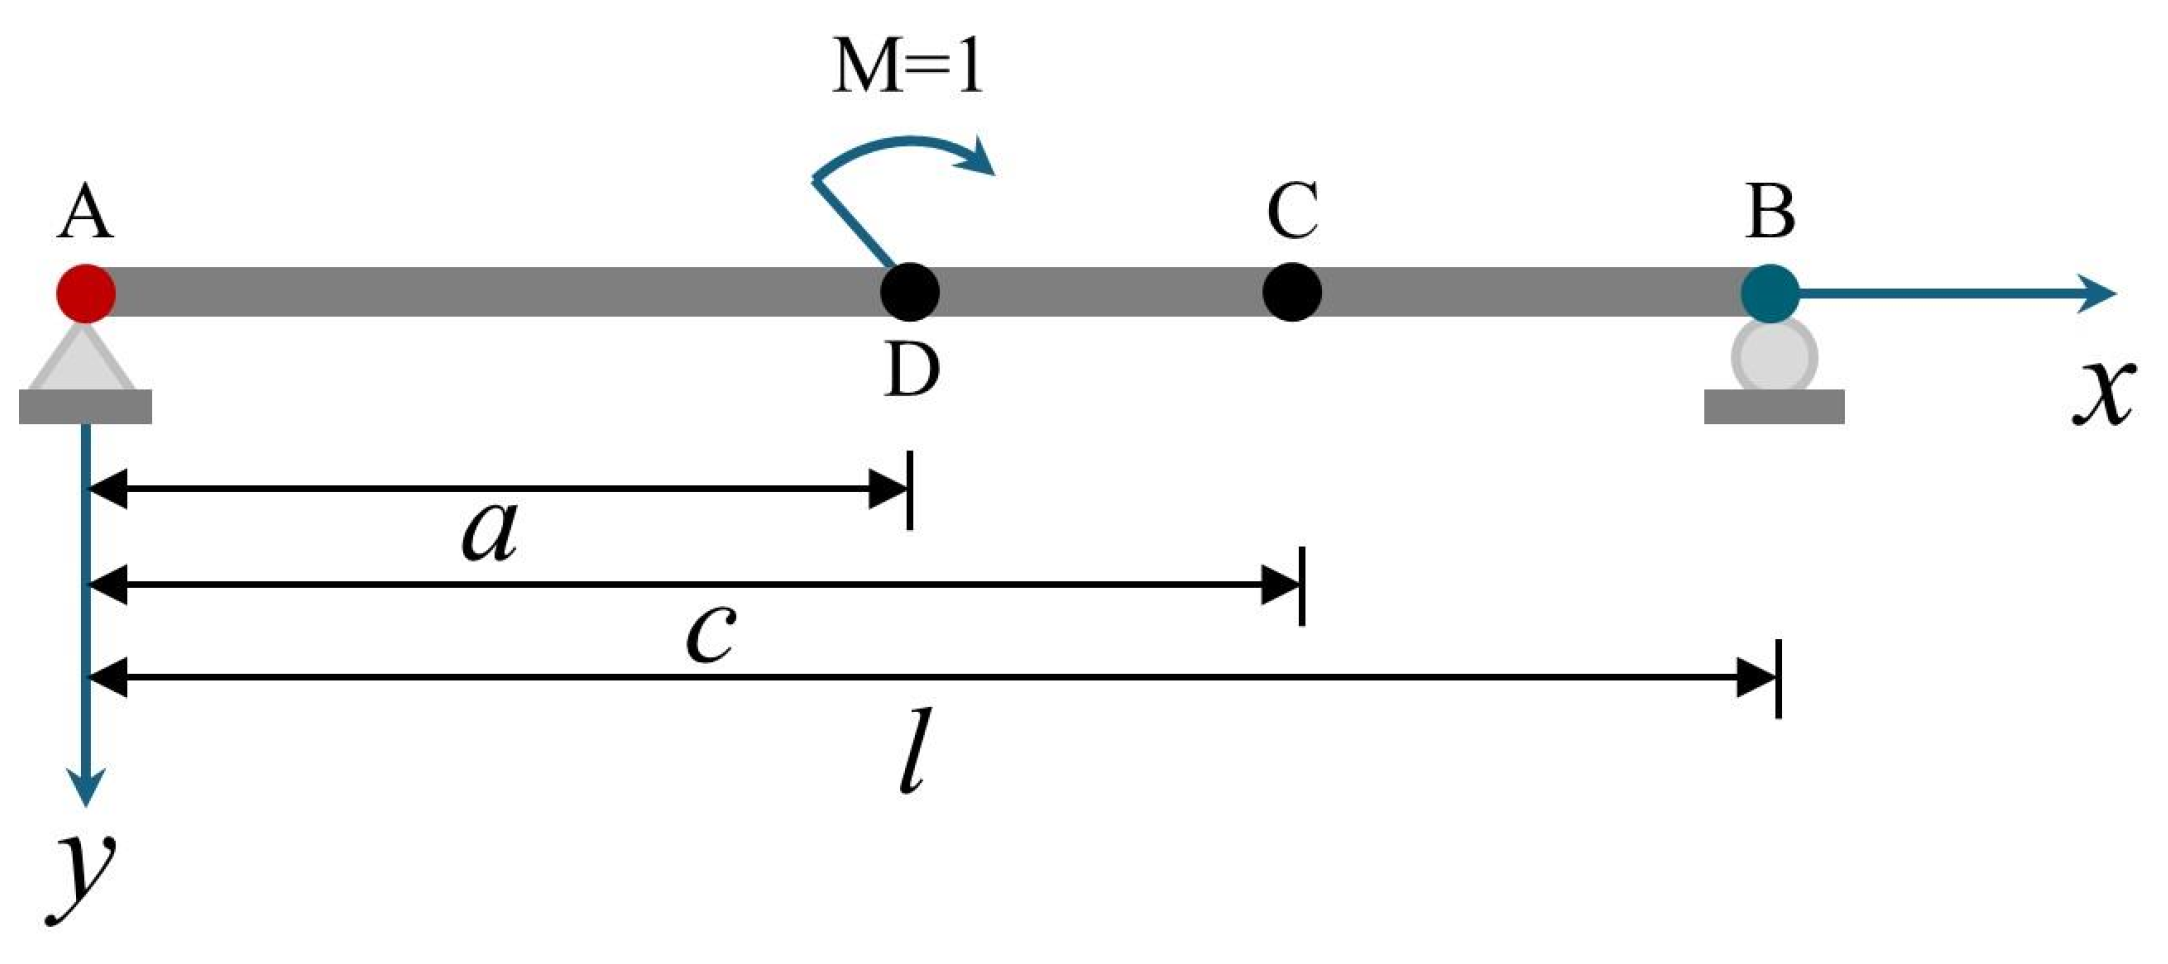
As illustrated in Figure 2, the rotation at an arbitrary point D (distance a from the left support) is determined using the principle of virtual work. A unit virtual bending moment M = 1 is applied at point D, inducing the virtual bending moment distribution Mi(x):
M i ( x ) = x l , 0 x < a l x l , a x l
The total rotation θD is obtained by integrating the product of the real and virtual moments over the beam length:
θ D = 1 E I M i ( x ) M F ( x ) d s + 1 E A N i ( x ) N F ( x ) d s + 1 G A γ Q i ( x ) Q F ( x ) d s
Given that the present study deals with beam structures, Equation (3) simplifies Equation (4):
θ D = 1 E I M i ( x ) M F ( x ) d s
Based on the principle of virtual work for deformable bodies, the rotation θD at point D is generally expressed as shown in Equation (4). To account for the localized stiffness reduction (E’I) within the damaged region (cε, c + ε) and the piecewise nature of the internal bending moments induced by the moving load P, the integral must be evaluated across different segments of the beam. Specifically, the rotation at point D varies depending on whether the moving load position x is located before or after the damage zone and before or after the observation point a. This leads to a piecewise function defined over four distinct intervals of x: 0 ≤ x < a; ax < cε; cεx < c + ε; and c + εx < l. For both the damaged and undamaged beam states, the detailed algebraic expressions for θD across these intervals are provided in Appendix A for improved readability.

2.2. Difference in Rotation of the Simply Supported Beam Before and After Damage

The difference between the rotation equations for the undamaged and damaged simply supported beam in Section 2.1 yields the relationship between the rotation difference at point D and the moving load position, expressed as Δ θ D = θ D θ D .
(1)
For 0 x ¯ < a , the ΔθD is expressed by
Δ θ D = 1 E I 1 E I 2 ε 3 + 6 c 2 ε 12 c ε l + 6 l 2 ε 3 l 2 P x ¯
In Equation (13), since the parameters c, ε, and l are constant, the rotation difference varies linearly with the position of the moving load P when it is located within the undamaged region (0, a).
(2)
For a x ¯ < c ε , the rotation difference within this undamaged region is similarly described by Equation (5), which shows that it varies linearly with the position x of the moving load P.
(3)
For c ε x ¯ < c + ε , ΔθD is expressed by
Δ θ D = 1 E I 1 E I P 6 l 2 x ¯ 4 + 2 l x ¯ 3 3 l 2 x ¯ 2 + 6 l 2 + 2 ( c + ε ) 2 6 l ( c + ε ) ( c + ε ) + ( 3 l c + ε ) ( c ε ) 2 } x ¯ ( c ε ) 2 ( 3 l 2 c l + ε l )
As derived from Equation (6), when the moving load P is located within the damaged region (cε, c + ε), the rotation difference is characterized by a quartic relationship with the load position.
(4)
For c + ε x ¯ < l the ΔθD is expressed by
Δ θ D = 1 E I 1 E I 2 ε 3 + 6 c 2 ε 6 c ε l 3 l 2 P ( l x ¯ )
Similarly, the rotation difference within this undamaged region varies linearly with the position x of the moving load P.
The preceding theoretical derivation demonstrates that structural damage introduces a localized stiffness perturbation. This perturbation disrupts the otherwise linear relationship between the moving load position and the rotation difference at a given cross-section. Outside the damaged region, the rotation difference varies linearly with load position; within the damaged region, however, the relationship becomes nonlinear (quartic). This transition from linear to nonlinear behavior produces characteristic features—such as inflection points or pronounced peaks—in the response curve. By identifying these features, the presence of damage can be detected and its approximate location determined. The GIERD index, introduced in the following subsection, is designed to amplify these damage-induced features and provide a robust indicator for damage localization.

2.3. Generalized Information Entropy Index of Rotation Difference (GIERD)

In structural health monitoring, conventional time- or frequency-domain indicators are often sensitive to noise and may not adequately capture signal distribution changes arising from measurement errors, operational variability, and structural complexity. To address these limitations, this study introduces a novel damage index grounded in information entropy theory. Information entropy quantifies the uncertainty associated with a signal’s probability distribution and offers several advantages for damage identification [19,23,47]: First, entropy is highly sensitive to distributional changes. Structural damage induces localized nonlinear behavior that alters the statistical characteristics of structural response signals. Information entropy captures these global distributional variations without relying on isolated extrema, thereby providing improved statistical stability. Second, entropy-based measures exhibit strong robustness to noise. Because entropy is derived from the overall probability distribution of the signal, the influence of random noise is inherently attenuated, enhancing reliability under realistic measurement conditions. Third, information entropy enables effective uncertainty quantification. Structural damage increases the irregularity of response signals, and corresponding changes in entropy directly reflect deviations from the undamaged baseline, yielding a continuous metric for assessing damage severity. Based on this theoretical framework, an information entropy-based damage index is developed in this section using rotation differences before and after damage, with the objective of improving the accuracy and robustness of structural damage identification.
According to information entropy theory, the signal length n used for damage identification is defined as the total number of discrete load positions along the bridge length l. The rotation difference Δθi at point D corresponding to the load position i is regarded as the information content at that location. Accordingly, the probability Pi associated with the signal at position i is defined by Equation (8), and the corresponding information entropy is then calculated using Equation (9):
P i = Δ θ i i = 1 n Δ θ i 1
H i = P i ln ( P i )
Substitution of Equation (8) into Equation (9) yields the information entropy of the rotation difference at point D corresponding to the moving load located at position i, as expressed in Equation (10):
H i = Δ θ i i = 1 n Δ θ i 1 ln i = 1 n Δ θ i ln Δ θ i
Because i = 1 n P i is not necessarily equal to unity, Hi is defined as the generalized information entropy index of rotation difference (GIERD), following the concept of generalized local information entropy proposed by Yang [49]. Furthermore, because Δθi may take zero or negative values—resulting in an undefined Pi or divergence of Hi—and given that Δθi represents a rotation difference, an axis-shifting transformation is applied to Δθi, as defined in Equation (11):
Δ θ i = Δ θ D i + 2 ( A B )
A = max (ΔθDi)
B = min (ΔθDi)
Here, ΔθDi represents the rotation differences at point D when the moving load is at positions i. A and B denote the maximum and minimum values of the rotation difference as the moving load traverses the entire length of the beam. θ i is the rotation difference at point D after the axis-shifting transformation, corresponding to the moving load at position i. Equation (11) performs a vertical shift of the rotation-difference curve. This transformation preserves the original shape and trend of the curve while preventing values that would lead to undefined or divergent behavior in the generalized information entropy. Consequently, the generalized information entropy of the rotation difference at point D, after the axis shift and with the moving load at position i, is expressed as
H i = P i ln ( P i )
Here, P i = Δ θ i i = 1 n Δ θ i 1 .
The formation of GIERD peaks is fundamentally rooted in the transition of the structural response from a state of ‘order’ to ‘disorder.’ For an undamaged beam, the relationship between the load position x and the rotation difference ΔθD is strictly linear, representing high predictability and low entropy. However, a localized stiffness perturbation introduces a quartic nonlinear response within the damaged region (cε, c + ε). The GIERD index quantifies this disruption; as the load traverses the damaged zone, the ‘unexpectedness’ of the nonlinear deviation relative to the linear state increases the local information entropy, manifesting as a sharp peak at the damage location. Compared to existing entropy-based damage indicators, such as spectral entropy or wavelet entropy, which primarily function as data-driven tools for vibration signal processing, the proposed GIERD index bridges the gap between information theory and structural mechanics, as shown in Table 1. Its added value lies in its explicit link to the structural response through the principle of virtual work. Unlike traditional measures that focus on frequency-domain or time-frequency energy concentration, GIERD quantifies localized nonlinear perturbations in the spatial domain of rotation differences. Furthermore, it addresses the mathematical instability of conventional Shannon entropy when processing signals with zero or negative values through a unique axis-shifting transformation, ensuring reliability for real-world bridge monitoring.

3. Finite Element Analysis

The analytical derivations in Section 2—specifically the relationships established in Equations (5)–(7)—predict that structural damage triggers a transition from linear to localized nonlinear response features in the rotation difference curve. To verify these theoretical predictions, a finite element model of a simply supported steel bridge is developed using ANSYS 16.0. By simulating various damage scenarios, this section aims to confirm whether the proposed GIERD index can effectively extract the damage-sensitive features identified in the theoretical framework under controlled numerical conditions.

3.1. Model Description

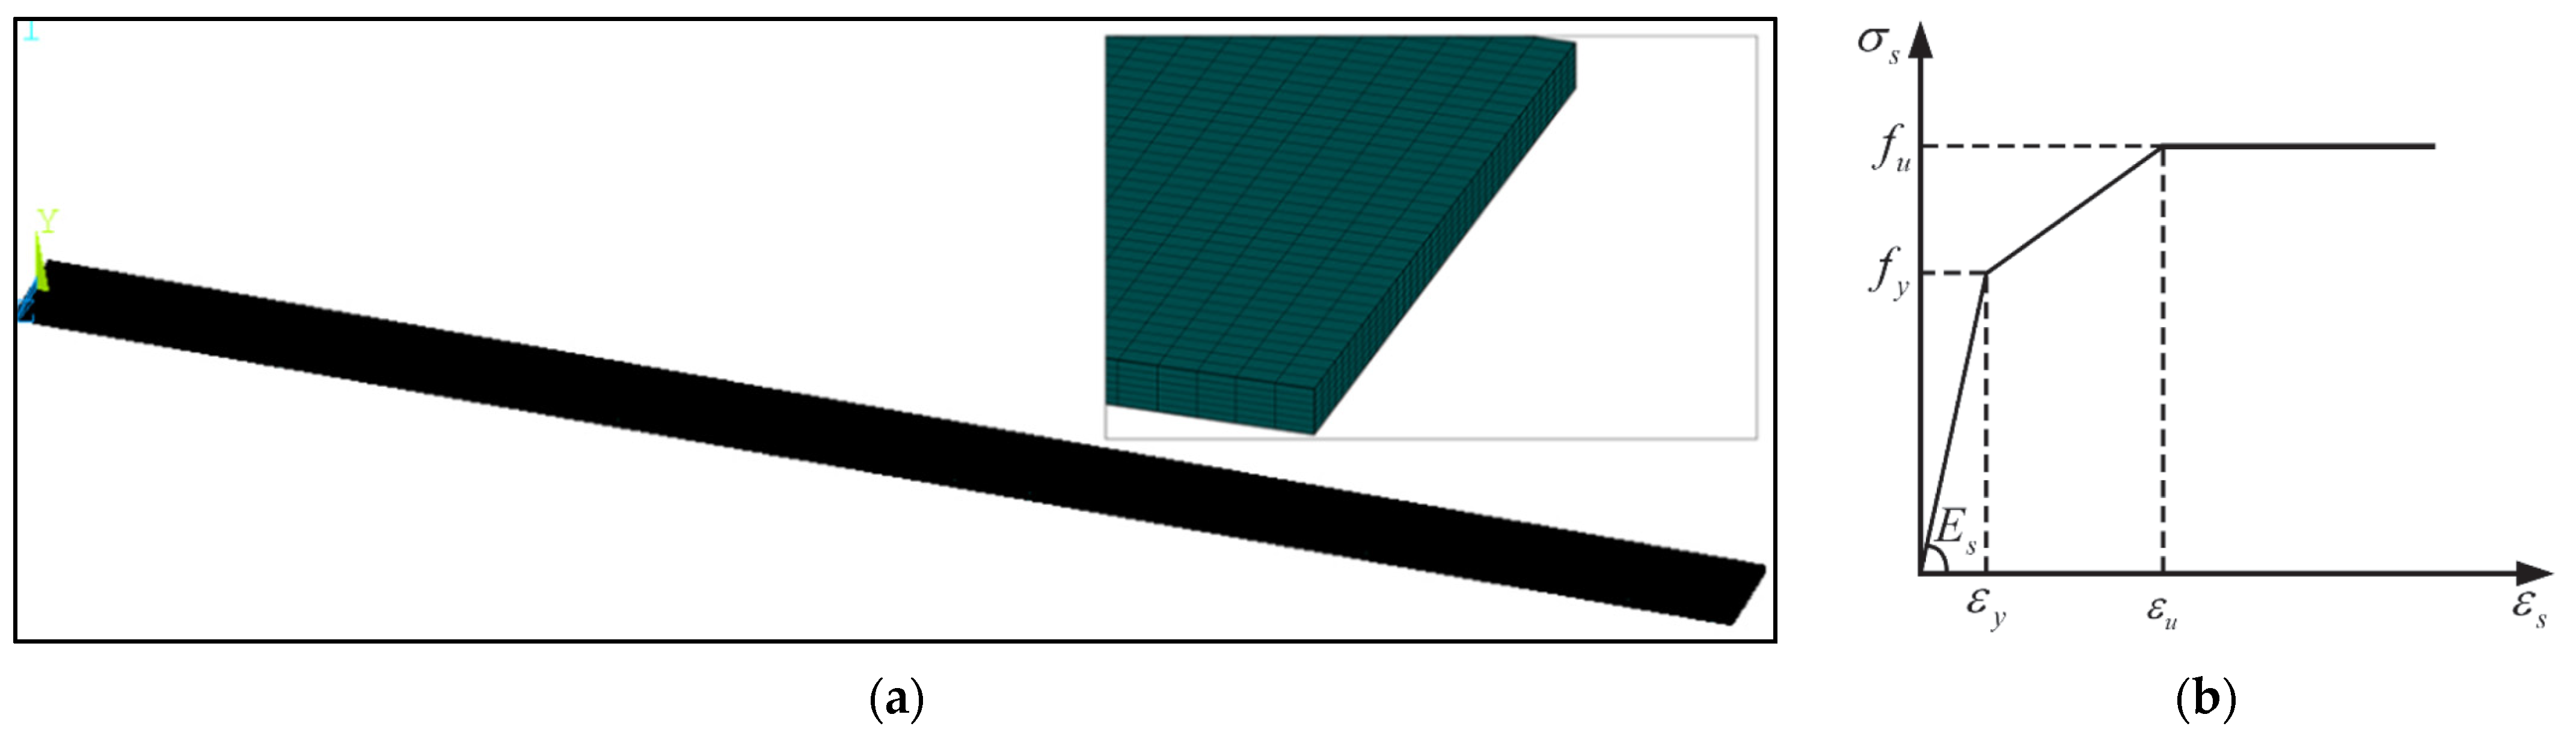
A simply supported steel girder bridge was modeled using the finite element software ANSYS, as illustrated in Figure 3. The bridge had a span of 175 cm with a rectangular cross-section of 8 cm × 0.4 cm and was discretized using beam elements. The material was Q355 steel with a yield strength fy = 408 MPa, ultimate strength fu = 554 MPa, and an elastic modulus of 213 GPa. To accurately capture the material nonlinearity, the tri-linear stress–strain relationship presented in Figure 3b was adopted in the simulation.
To ensure physical consistency with the linear-elastic assumptions established in the theoretical framework, the magnitude of the moving load P used in all numerical simulations was carefully calibrated. Although a tri-linear stress–strain relationship was defined for the Q355 steel elements to provide a comprehensive material representation, the actual stress levels induced during load passage were maintained below the material’s proportional limit. Consequently, while the FE model accounts for potential material nonlinearity, the structural response during the damage identification process remains within the elastic regime, directly aligning with the analytical derivations provided in Section 2.

3.2. Damage Cases Setting

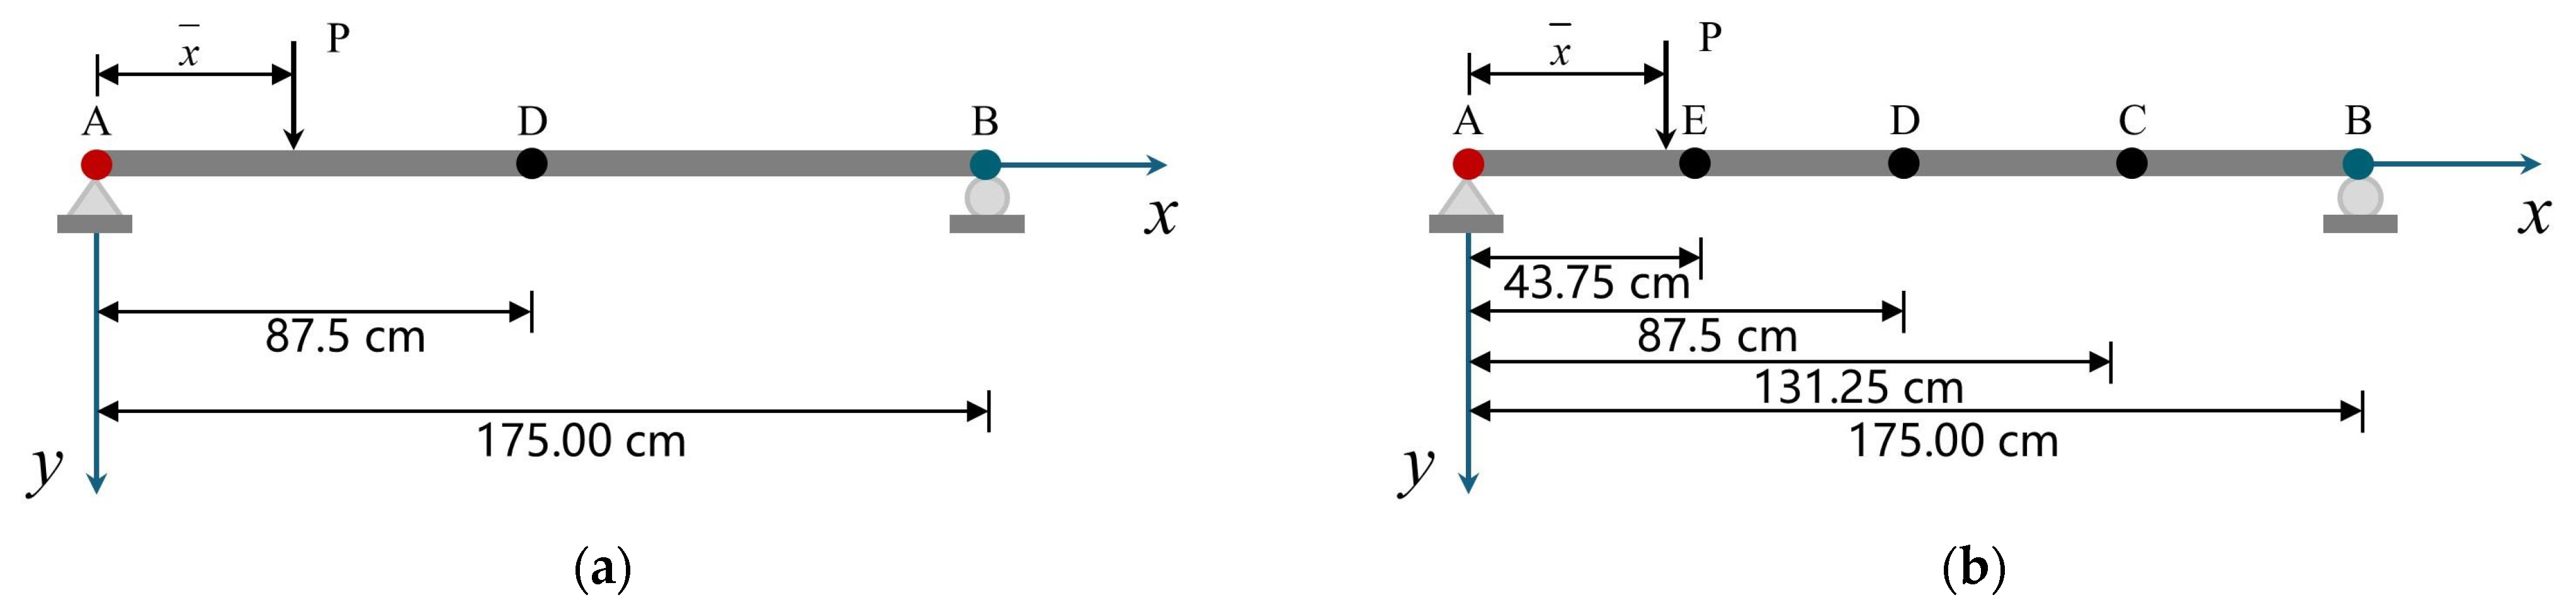
Throughout their service life, bridge structures are subjected to static and dynamic loads—including moving vehicle loads and wind loads—which may lead to various types of damage over time. To validate the effectiveness of the proposed GIERD method, four damage scenarios are established through numerical simulations. In each scenario, damage is simulated by reducing the elastic modulus of specific steel plates while maintaining a constant cross-sectional area. Four levels of damage severity are considered, corresponding to reductions in elastic modulus of 0%, 5%, and 15%. The damage configurations include single-point damage at mid-span, two-point damage at the 1/4 and 3/4 spans, and multi-point damage at the mid-span, 1/4 span, and 3/4 span. The specific configurations of these scenarios are summarized in Table 2, and the corresponding damage locations are illustrated in Figure 4.

3.3. Damage Detection Results

Using a moving load simulation in ANSYS on a simply supported steel girder bridge, the rotation difference at mid-span was obtained from Equations (5)–(7) for both the undamaged and damaged states. These results were then used to compute the Generalized Information Entropy Index of Rotation Difference (GIERD) via Equation (14) for damage identification. This index quantifies the uncertainty and localized nonlinear features in the rotation difference signal caused by structural damage.
(1)
Detection results for single-point damage
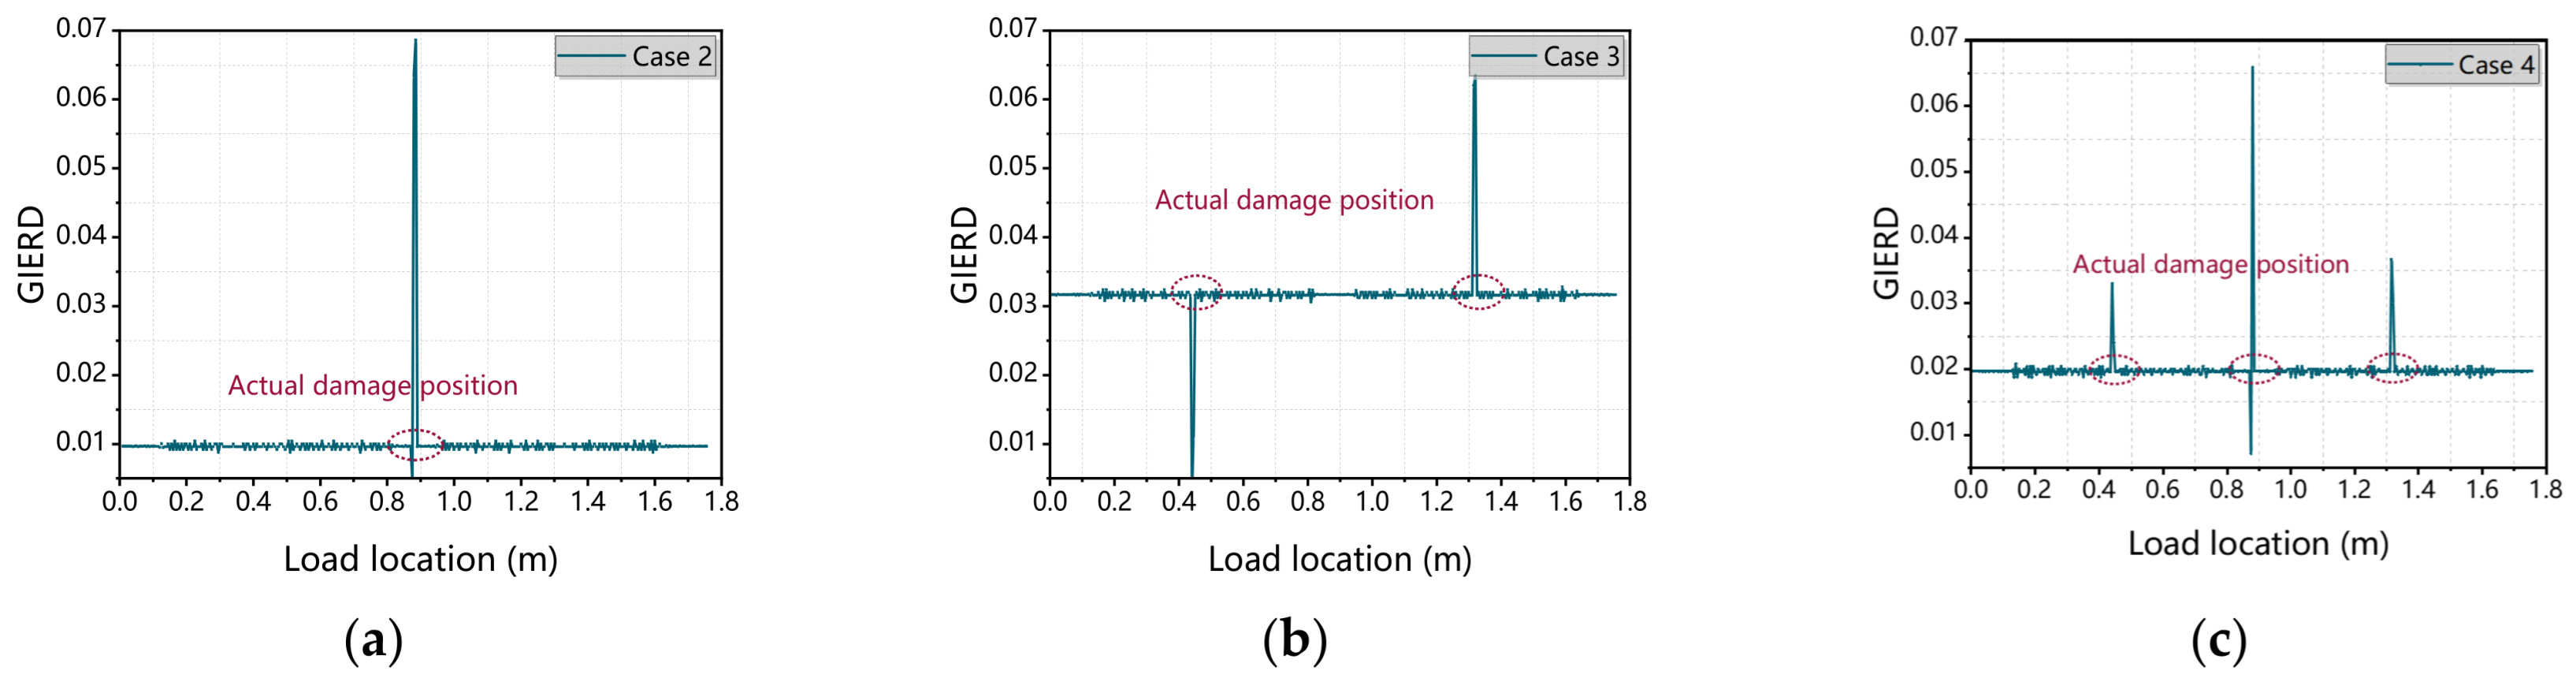
As shown in Figure 5a, a single damage location with 5% severity was introduced at point D in the simply supported steel girder bridge. The damage identification result using the GIERD index (Figure 5a) exhibits a pronounced peak at 87.5 cm along the abscissa, which corresponds exactly to the location of the damaged element. This accurate correspondence demonstrates the capability of the GIERD index to precisely identify the damage location.
(2)
Detection results for multi-point damage
The damage identification performance for multiple damage points is demonstrated in Scenarios 3 and 4, as shown in Figure 5b. In Scenario 3, which includes two damage points (C and E, each with 15% severity), the GIERD index result in Figure 5b exhibits two pronounced peaks whose positions coincide precisely with the actual damage locations. Similarly, in Scenario 4, which includes three damage points (C, D, and E, each with 15% severity), the result in Figure 5c shows three distinct peaks that accurately correspond to the preset damage locations. These results collectively confirm that the GIERD index can accurately identify damage locations for both single and multiple damage cases.
To quantitatively assess the damage localization accuracy, the Localization Error (EL) is defined as the absolute difference between the identified and actual damage locations, normalized by the span length (L = 175 cm). Table 3 summarizes the results for the three damage scenarios simulated in ANSYS. As shown, the GIERD index achieves zero error for all numerical cases, confirming its precision under idealized conditions.

4. Experimental Validation Using Published Data

4.1. Overview of the Experimental Dataset

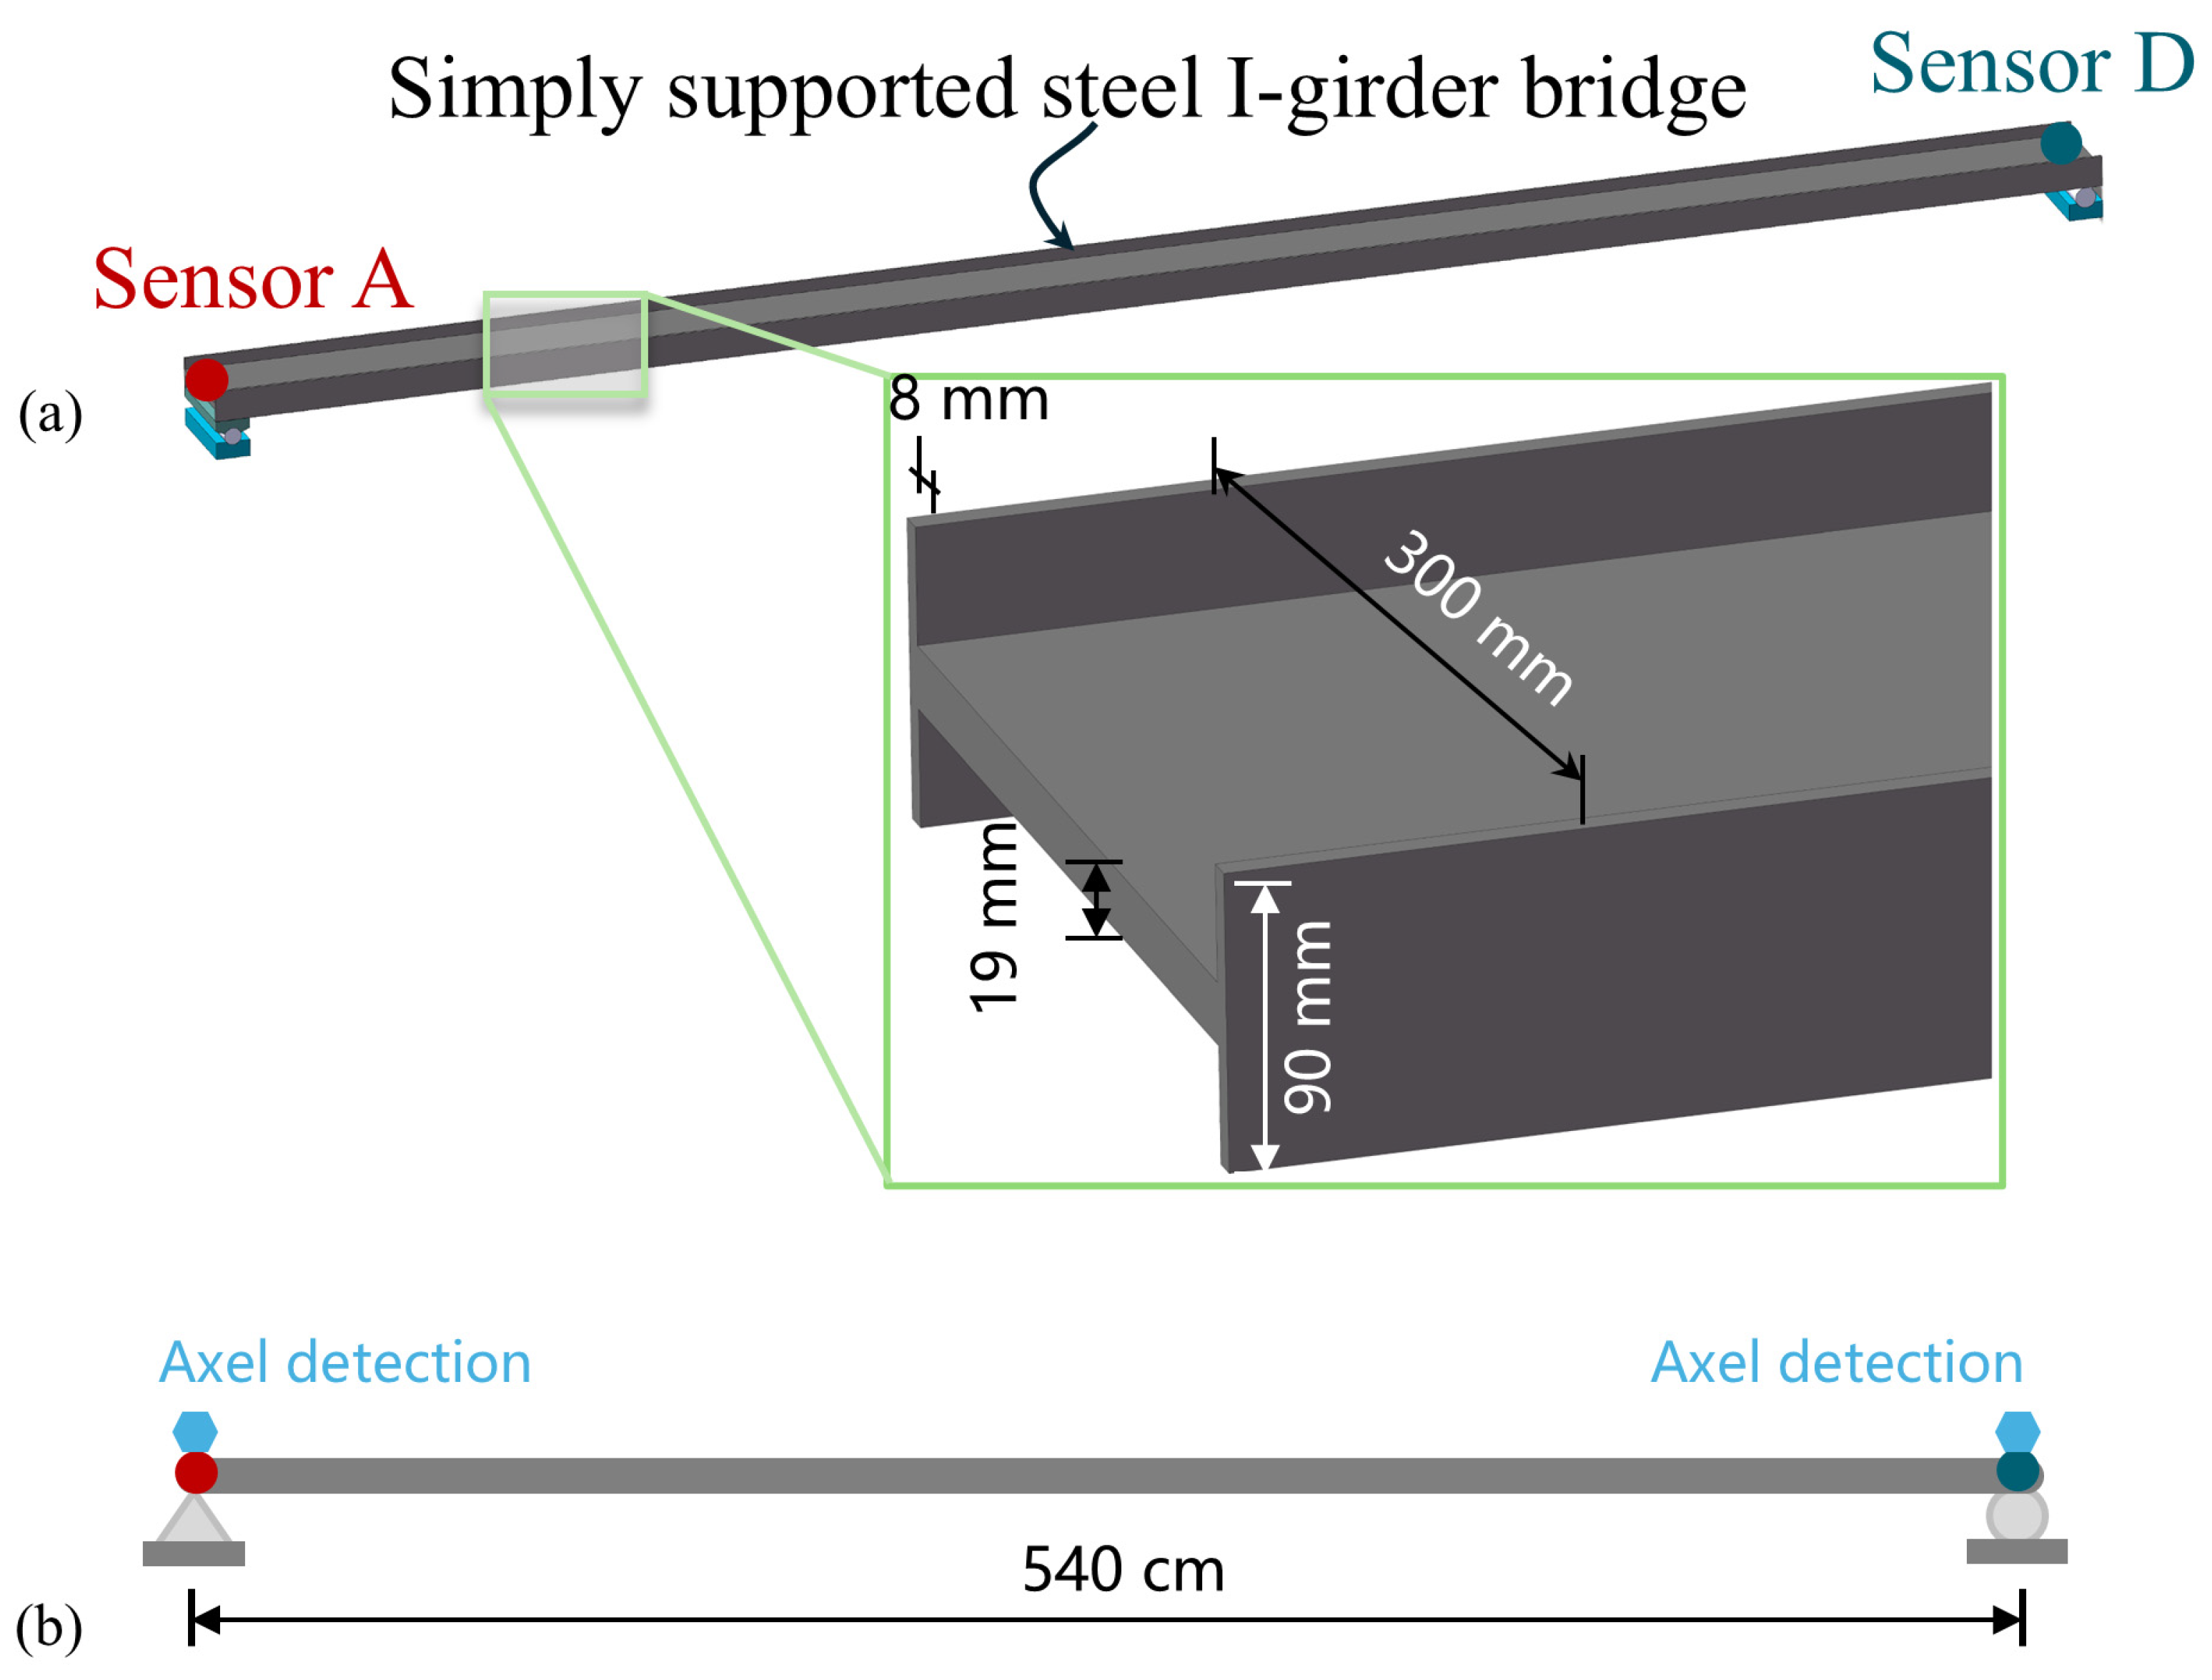
While the numerical simulations in Section 3 demonstrate the high accuracy of the GIERD index in an idealized, noise-free environment, practical structural health monitoring is often complicated by measurement noise and complex load transfer paths. Therefore, to experimentally validate the effectiveness of the proposed GIERD index, this study draws upon a well-documented laboratory dataset reported by Huseynov et al. [5]. The experimental model consisted of a 5.4 m simply supported steel bridge with an elastic modulus of 210 GPa and a second moment of area of 11.6 × 10⁻⁷ m4 (Figure 6). High-precision inclinometers were installed at both supports (Sensors A and D), and data were acquired at a sampling rate of 512 Hz.
Structural damage was simulated using a “negative damage” approach, wherein localized stiffness increases were introduced by attaching steel plates to the bridge flanges. Multiple severity levels were applied at critical locations, including mid-span, quarter-span, and 0.85-span. As summarized in Table 4, both single-point and multi-point damage scenarios were considered to comprehensively assess the robustness of the proposed index.
This multi-scale validation approach—employing a 5.4 m laboratory bridge to complement the 175 cm numerical study—is specifically designed to demonstrate the scale-independence of the GIERD index. By achieving accurate damage localization across independent platforms and structural dimensions, the physical universality of the underlying theoretical derivation is strongly corroborated, thereby confirming the method’s transferability to real-world bridge structures.

4.2. Validation Results of the GIERD Index

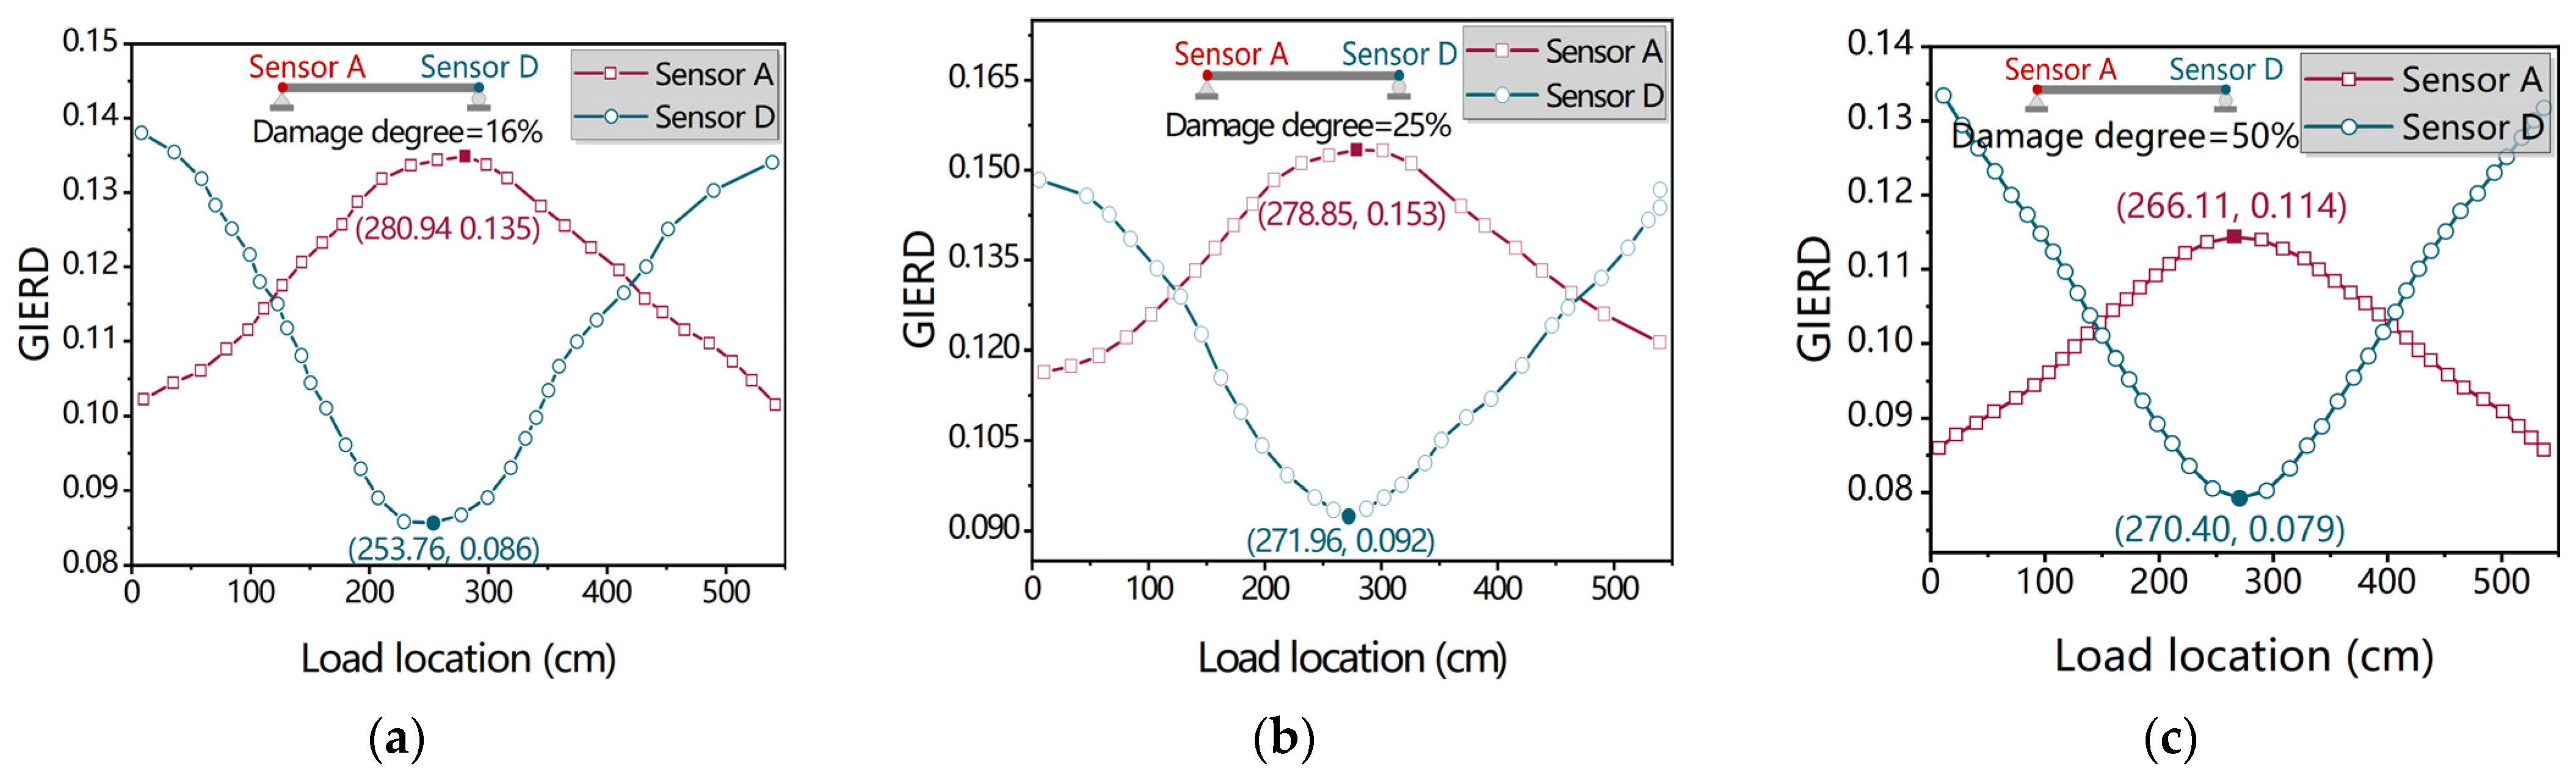
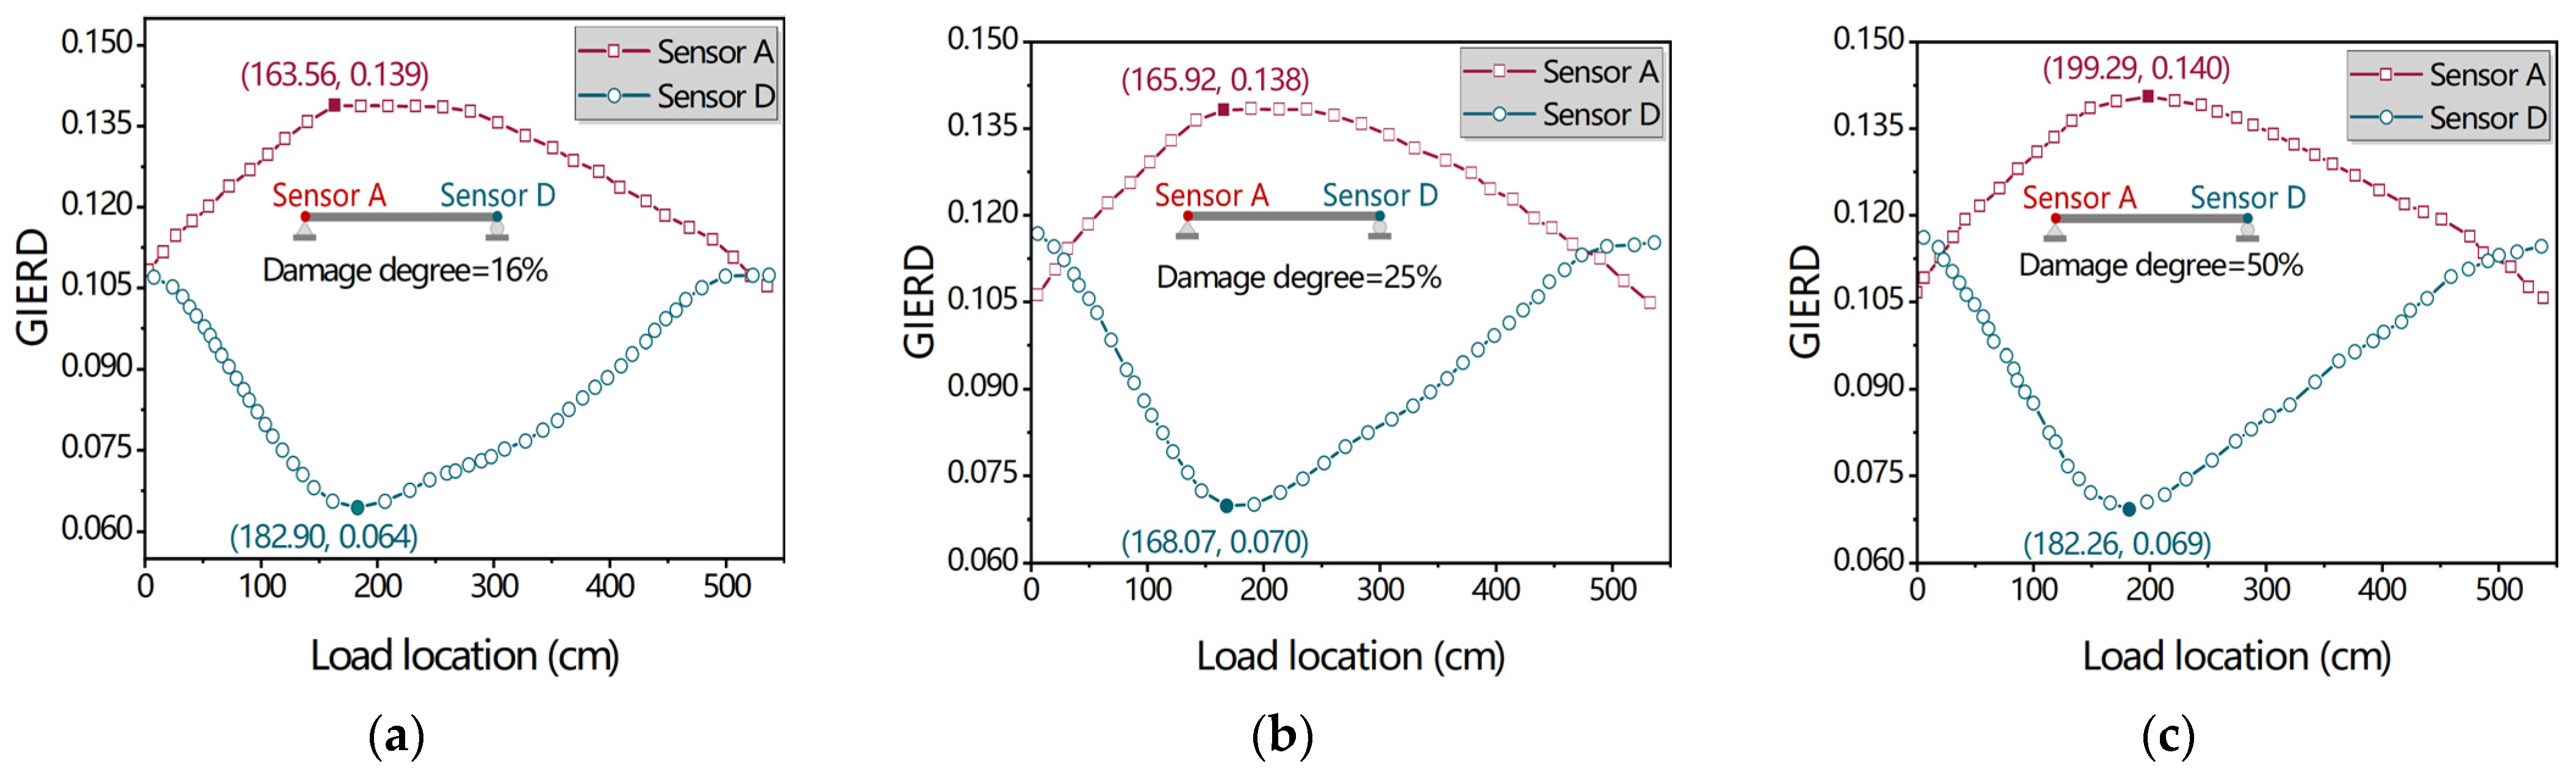
The derivation in Section 2.2 showed that damage introduces local nonlinear features in the rotation difference curve, which the GIERD index is designed to capture as distinct peaks. The experimental results presented below allow an examination of whether this theoretically predicted behavior is observable in actual measurements. Previous research has demonstrated that support-mounted sensors are capable of capturing global rotation changes induced by damage at arbitrary locations [5]. Accordingly, data from Sensors A and D are employed here to validate the GIERD index. The identification results for single-point damage at mid-span and quarter-span are presented in Figure 7 and Figure 8, respectively, while Figure 9 illustrates the method’s performance for multi-point damage scenarios.
As shown in Figure 7, when damage is located at mid-span with a severity of 16%, the response curves from both Sensors A and D exhibit distinct peaks, with peak abscissas at 280.94 cm and 253.76 cm, respectively. When the damage severity increases to 25%, the peak abscissas shift to 278.85 cm and 271.96 cm, respectively. At a severity of 50%, the peak locations are 266.11 cm and 270.40 cm, respectively. Similarly, for damage at the quarter-span (Figure 8), as the severity increases from 16% to 50%, the peak locations identified by both sensors remain consistent with the actual damage position. This systematic pattern demonstrates that the proposed damage identification method—based solely on support sensors and the GIERD index—retains strong adaptability across different damage locations. Despite variations in damage location, the peak characteristics in the sensor response curves remain pronounced, and the damage position can be corroborated using data from both sensors. Furthermore, the increase in damage severity does not result in identification failure, indicating that the proposed method possesses favorable engineering applicability and robustness for structural health monitoring. It is noteworthy that in some cases, the peak location shifts slightly with increasing damage severity, which may be attributed to local stiffness changes and alterations in load transfer paths induced by the damage.
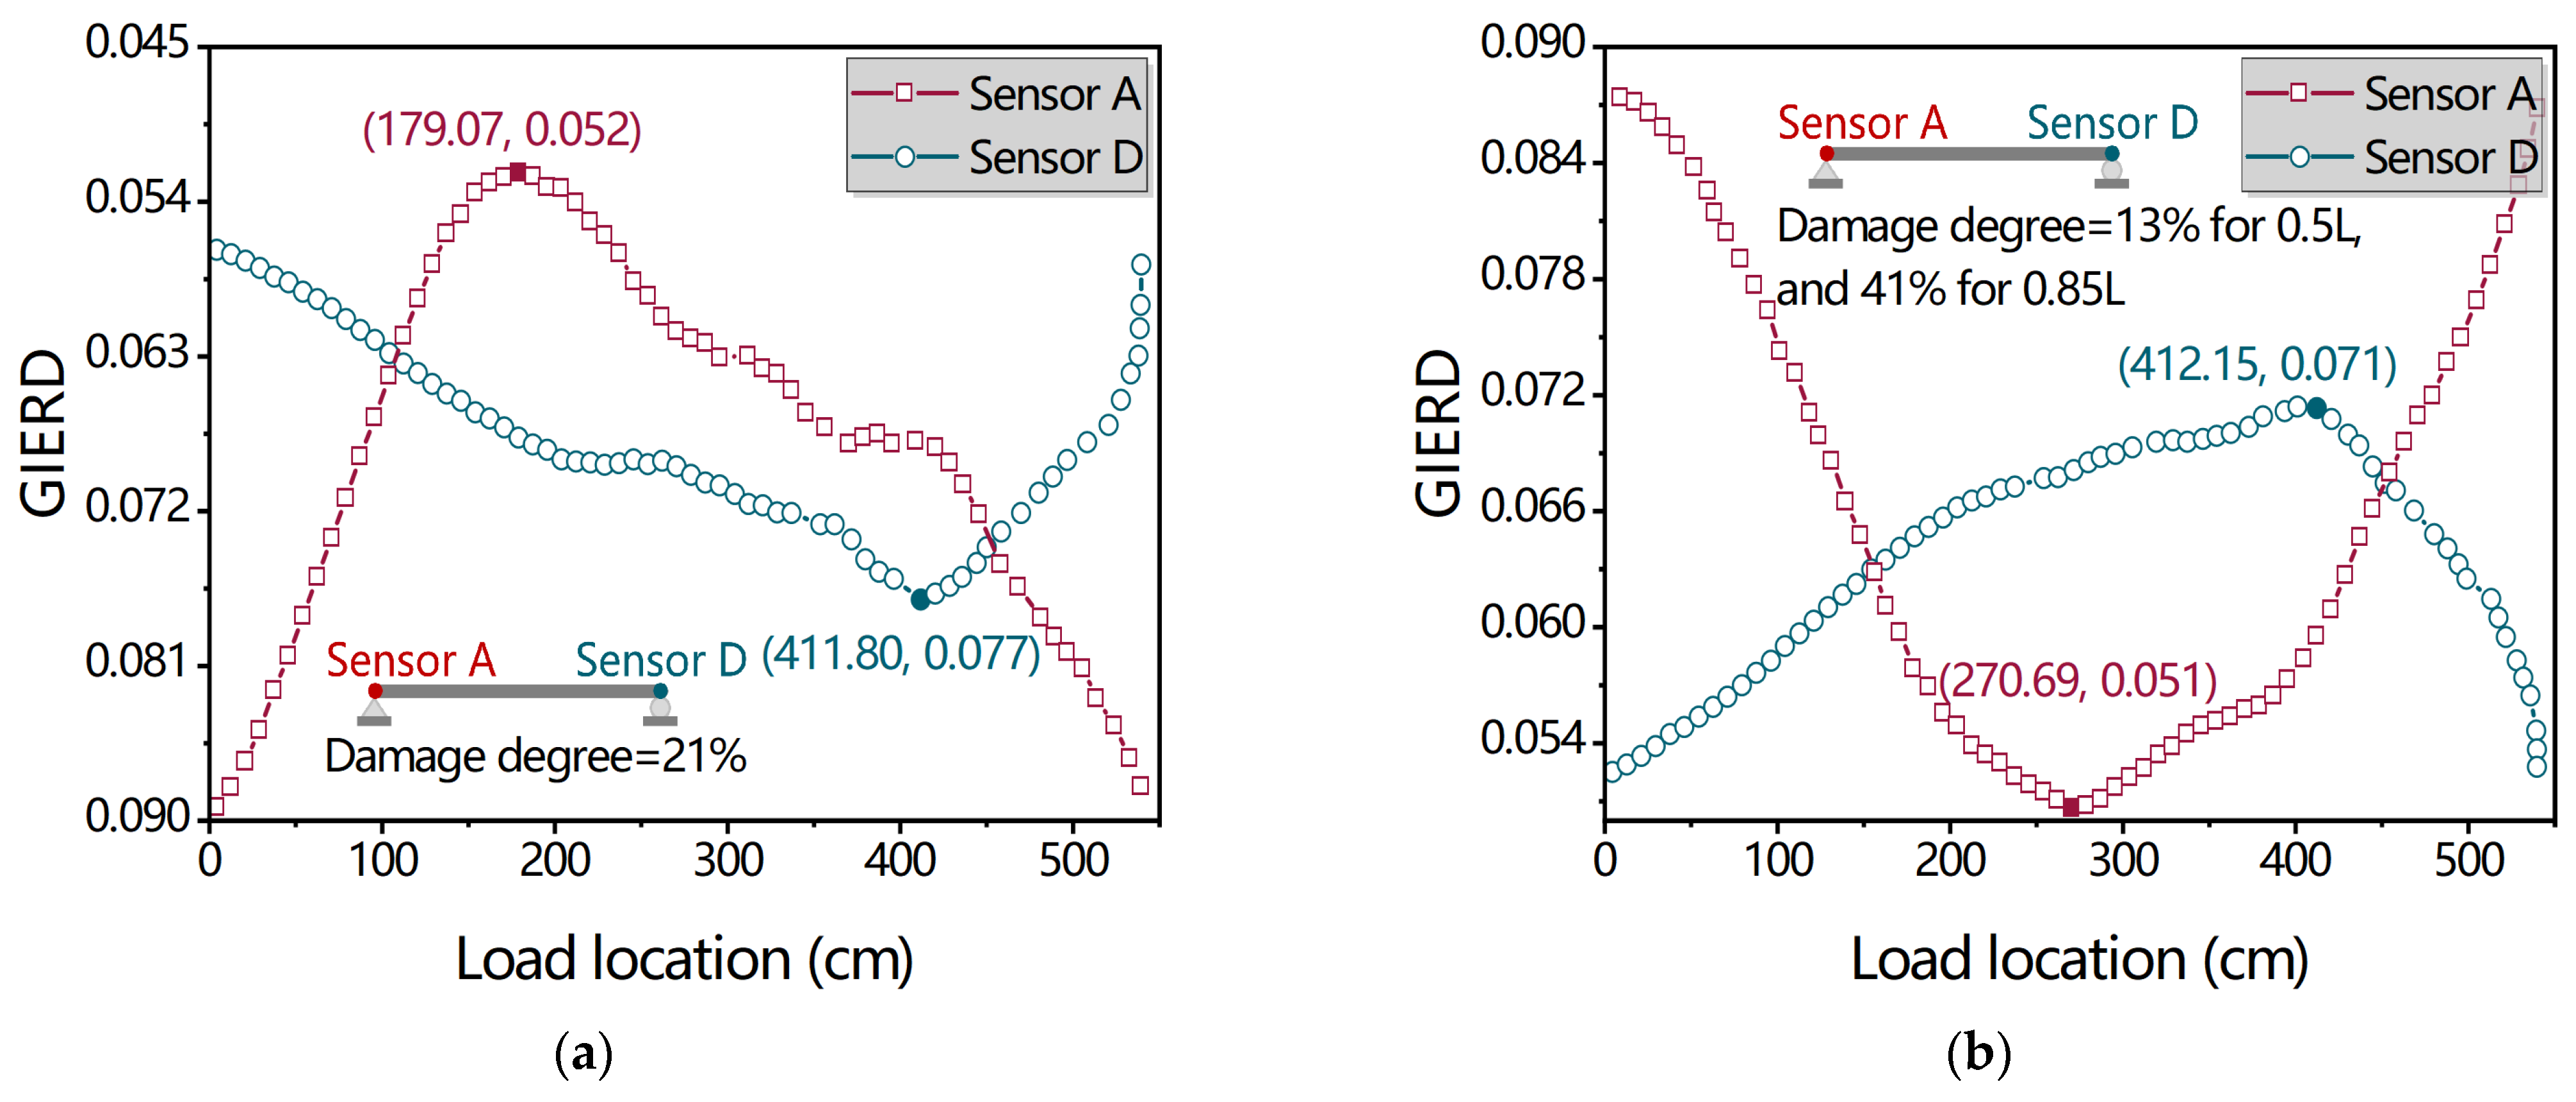
As shown in Figure 9, for bridges with multiple damage points (i.e., at the quarter-span and 0.85-span in Figure 9a and at mid-span and 0.85-span in Figure 9b), the GIERD index responses from Sensors A and D both exhibit approximately triangular distributions. Taking the uniform 21% severity case as an example, the response peak for Sensor A occurs at 179.07 cm, while that for Sensor D occurs at 411.80 cm. These values show slight deviations from the actual damage locations of 135 cm and 459 cm, respectively. Under the non-uniform severity condition (13% at 0.5L and 41% at 0.85L), the response curves still display distinct peaks at 270.69 cm (Sensor A) and 412.15 cm (Sensor D). Despite these minor deviations from the exact preset locations, the peaks consistently indicate the presence and approximate positions of damage. These multi-point identification results mirror the numerical observations in Section 3.3 (Figure 5c), where the GIERD index also produced multiple peaks at the damaged locations. This confirms that the proposed method, utilizing only two support sensors, is effective and robust for identifying multiple damage locations.
Similarly, Table 5 presents the localization errors for all eight damage scenarios, calculated using the same definition as in Section 3.3. For single-point damage at mid-span (Cases 1–3), errors are generally below 3%, with Sensor D often providing slightly better accuracy. For quarter-span damage (Cases 4–6), errors range from 5.29% to 11.91%. In multi-point damage scenarios (Cases 7 and 8), the method successfully detects both damage locations, with most errors remaining below 9%. The maximum localization error across all single-point damage cases is 11.91% (Case 4, Sensor A); however, most errors are well within 10%, demonstrating the practical viability of the approach. These observations suggest that while peak magnitude, width, and asymmetry carry qualitative information about damage severity, location, and interaction, extracting quantitative relationships requires further investigation with controlled parametric studies—a direction we identify for future work.
In summary, the experimental results consistently capture the theoretically predicted nonlinear features induced by damage (Section 2.2) and align with the numerical trends observed in Section 3.3. Specifically, the GIERD index successfully localized single-point damage across various positions (mid-span, quarter-span, and 0.85-span) and severity levels (16–50%). For multi-point scenarios, the index produced distinct peaks near the expected locations, despite minor deviations likely attributable to damage-induced alterations in load transfer paths. These findings confirm that the proposed approach—leveraging a minimal configuration of only two support-mounted inclinometers—provides a physically valid and robust solution for bridge structural health monitoring, successfully bridging the gap between theoretical derivation and practical implementation.

5. Conclusions and Further Research

5.1. Conclusions

This study proposed a novel damage identification method for simply supported bridges based on the Generalized Information Entropy Index of Rotation Difference (GIERD). The main contributions and findings are summarized as follows:
(1)
An analytical relationship between the moving load position and the rotation difference at cross-sections before and after damage was rigorously derived using the principle of virtual work. This derivation establishes that damage introduces a localized transition from linear to nonlinear (quartic) behavior in the rotation difference curve—a theoretical foundation that underpins the proposed entropy-based index.
(2)
The GIERD index, which quantifies this nonlinear perturbation through information entropy, was validated through numerical simulations on a simply supported steel girder bridge model in ANSYS. Under idealized conditions matching the theoretical assumptions, the index achieved perfect localization (zero error) for single, two-point, and multi-point damage scenarios with severity levels up to 15%.
(3)
Experimental validation using published data from a 5.4 m simply supported steel beam confirmed the method’s practical viability. Using only two inclination sensors mounted at the supports, the GIERD index successfully identified single-point damage at mid-span and quarter-span across severity levels from 16% to 50%, with localization errors generally below 3% for mid-span cases and below 12% for quarter-span cases. Multi-point damage scenarios were also correctly detected, with most errors within 10% of the span length.
(4)
The minimalist sensor configuration (two support-mounted inclinometers) offers significant practical advantages, including reduced system complexity, lower installation and maintenance costs, and simplified data acquisition. These features make the method particularly attractive for real-world bridge monitoring applications, where budget and accessibility constraints often limit sensor deployment.
(5)
The consistency among theoretical predictions, numerical simulations, and experimental validation demonstrates the physical validity and robustness of the GIERD index. The method effectively bridges the gap between rigorous mechanics-based analysis and practical damage detection, providing an efficient and economical solution for structural health monitoring of simply supported bridges.

5.2. Future Research Trend

The present study establishes a theoretical baseline using a simply supported beam. However, practical bridge engineering often involves continuous spans, skewed geometries, and dynamic multi-axle vehicle loads. While the core mechanical principle of the GIERD index—identifying localized stiffness perturbations via information entropy—remains fundamentally robust, its application to these complex scenarios requires further investigation. Future work will focus on:
(1)
Developing analytical formulas to quantitatively correlate peak magnitude and width with damage severity and spatial extent.
(2)
Developing signal deconvolution techniques to address multi-axle load superposition.
(3)
Analyzing the impact of dynamic vehicle-bridge interaction on entropy stability.

Author Contributions

Y.L.: Writing—original draft, Visualization, Methodology, Funding acquisition; L.T.: Investigation, Formal analysis; H.L.: Visualization; M.W.: Data Curation, Visualization, Supervision; L.Z.: Investigation, Funding acquisition; Z.H.: Funding acquisition, Writing—review and editing. All authors have read and agreed to the published version of the manuscript.

Funding

The authors express their sincere gratitude for the financial support provided by the Natural Science Foundation of Chongqing, China (CSTB2022NSCQ-MSX1655), the Science and Technology Research Program of the State Key Laboratory of Mountain Bridge and Tunnel Engineering of Chongqing Jiaotong University (SKLBT-19-007), and the Research Project Funding for the “Kunlun Talents” Introduction Program of Qinghai Institute of Technology (2023–QLGKLYCZX–029).

Data Availability Statement

The original contributions presented in this study are included in the article. Further inquiries can be directed to the corresponding author.

Conflicts of Interest

The authors declare that they have no known competing financial interests or personal relationships that could have appeared to influence the work reported in this paper.

Appendix A

For the damaged beam states, the rotation θD is given by
(1)
0 x ¯ < a :
θ D = 1 E I 0 x ¯ l x ¯ l P x 1 l x d x + x ¯ a x ¯ P l x + P x ¯ 1 l x d x + a c ε x ¯ P l x + P x ¯ 1 l x + 1 d x + c + ε l x ¯ P l x + P x ¯ 1 l x + 1 d x + 1 E I c ε c + ε x ¯ P l x + P x ¯ 1 l x + 1 d x
(2)
a x ¯ < c ε :
θ D = 1 E I 0 a l x ¯ l P x 1 l x d x + a x ¯ l x ¯ l P x 1 l x + 1 d x + x ¯ c ε x ¯ P l x + P x ¯ 1 l x + 1 d x + c + ε l x ¯ P l x + P x ¯ 1 l x + 1 d x + 1 E I c ε c + ε x ¯ P l x + P x ¯ 1 l x + 1 d x
(3)
c ε x ¯ < c + ε :
θ D = 1 E I 0 a l x ¯ l P x 1 l x d x + a c ε l x ¯ l P x 1 l x + 1 d x + c + ε l x ¯ P l x + P x ¯ 1 l x + 1 d x + 1 E I c ε x ¯ l x ¯ l P x 1 l x + 1 d x + x ¯ c + ε x ¯ P l x + P x ¯ 1 l x + 1 d x
(4)
c + ε x ¯ < l :
θ D = 1 E I 0 a l x ¯ l P x 1 l x d x + a c ε l x ¯ l P x 1 l x + 1 d x + c + ε x ¯ l x ¯ l P x 1 l x + 1 d x + x ¯ l ¯ x ¯ P l x + P x ¯ 1 l x + 1 d x + 1 E I c ε c + ε l x ¯ l P x 1 l x + 1 d x
For the undamaged beam states, the rotation θD is given by
(1)
0 x ¯ < a :
θ D = 1 E I 0 x ¯ l x ¯ l P x 1 l x d x + x ¯ a x ¯ P l x + P x ¯ 1 l x d x + a c ε x ¯ P l x + P x ¯ 1 l x + 1 d x + c + ε l x ¯ P l x + P x ¯ 1 l x + 1 d x + 1 E I c ϵ c + ϵ x ¯ P l x + P x ¯ 1 l x + 1 d x
(2)
a x ¯ < c ε :
θ D = 1 E I 0 a l x ¯ l P x 1 l x d x + a x ¯ l x ¯ l P x 1 l x + 1 d x + x ¯ c ε x ¯ P l x + P x ¯ 1 l x + 1 d x + c + ε l x ¯ P l x + P x ¯ 1 l x + 1 d x + 1 E I c ε c + ε x ¯ P l x + P x ¯ 1 l x + 1 d x
(3)
c ε x ¯ < c + ε :
θ D = 1 E I 0 a l x ¯ l P x 1 l x d x + a c ε l x ¯ l P x 1 l x + 1 d x + c + ε l x ¯ P l x + P x ¯ 1 l x + 1 d x + 1 E I c ε x ¯ l x ¯ l P x 1 l x + 1 d x + x ¯ c + ε x ¯ P l x + P x ¯ 1 l x + 1 d x
(4)
c + ε x ¯ < l :
θ D = 1 E I 0 a l x ¯ l P x 1 l x d x + a c ε l x ¯ l P x 1 l x + 1 d x + c + ε x ¯ l x ¯ l P x 1 l x + 1 d x + x ¯ l x ¯ P l x + P x ¯ 1 l x + 1 d x + 1 E I c ε c + ε l x ¯ l P x 1 l x + 1 d x

References

  1. Kang, M.-S.; An, Y.-K. Explainable Artificial Intelligence-Based Flexural Rigidity Matrix Estimation of Bridges Using Spatially Distributed Inclinometers. Eng. Struct. 2026, 346, 121633. [Google Scholar] [CrossRef] [Scilit]
  2. Ge, L.; Koo, K.Y.; Wang, M.; Brownjohn, J.; Dan, D. Bridge Damage Detection Using Precise Vision-Based Displacement Influence Lines and Weigh-in-Motion Devices: Experimental Validation. Eng. Struct. 2023, 288, 116185. [Google Scholar] [CrossRef] [Scilit]
  3. Sun, Z.; Siringoringo, D.M.; Fujino, Y. Load-Carrying Capacity Evaluation of Girder Bridge Using Moving Vehicle. Eng. Struct. 2021, 229, 111645. [Google Scholar] [CrossRef] [Scilit]
  4. Alten, K.; Ralbovsky, M.; Vorwagner, A.; Toplitzer, H.; Wittmann, S. Evaluation of Different Monitoring Techniques during Damage Infliction on Structures. Procedia Eng. 2017, 199, 1840–1845. [Google Scholar] [CrossRef] [Scilit]
  5. Huseynov, F.; Kim, C.; OBrien, E.J.; Brownjohn, J.M.W.; Hester, D.; Chang, K.C. Bridge Damage Detection Using Rotation Measurements—Experimental Validation. Mech. Syst. Signal Process. 2020, 135, 106380. [Google Scholar] [CrossRef] [Scilit]
  6. Mishra, M.; Lourenço, P.B.; Ramana, G.V. Structural Health Monitoring of Civil Engineering Structures by Using the Internet of Things: A Review. J. Build. Eng. 2022, 48, 103954. [Google Scholar] [CrossRef] [Scilit]
  7. Qin, Z.; Dai, K.; Wang, K.; Li, R. A Novel Inclinometer-Integrated Structured-Light Weld Vision Sensor and Its Calibration Method and Weld Seam Recognition. IEEE Trans. Ind. Electron. 2025, 72, 2111–2120. [Google Scholar] [CrossRef] [Scilit]
  8. Yang, Y.; Lu, H.; Tan, X.; Wang, R.; Zhang, Y. Mode Shape Identification and Damage Detection of Bridge by Movable Sensory System. IEEE Trans. Intell. Transp. Syst. 2023, 24, 1299–1313. [Google Scholar] [CrossRef] [Scilit]
  9. Aulakh, D.S.; Bhalla, S. Piezo Sensor Based Multiple Damage Detection Under Output Only Structural Identification Using Strain Modal Flexibility. Mech. Syst. Signal Process. 2023, 194, 110272. [Google Scholar] [CrossRef] [Scilit]
  10. Hou, R.; Xia, Y.; Zhou, X. Structural Damage Detection Based on L1 Regularization Using Natural Frequencies and Mode Shapes. Struct. Control Health Monit. 2018, 25, e2107. [Google Scholar] [CrossRef] [Scilit]
  11. Wang, S.; Liu, F.; Zhang, M. Modal Strain Energy Based Structural Damage Localization for Offshore Platform Using Simulated and Measured Data. J. Ocean Univ. China 2014, 13, 397–406. [Google Scholar] [CrossRef] [Scilit]
  12. Cha, Y.-J.; Buyukozturk, O. Structural Damage Detection Using Modal Strain Energy and Hybrid Multiobjective Optimization. Comput.-Aided Civ. Infrastruct. Eng. 2015, 30, 347–358. [Google Scholar] [CrossRef] [Scilit]
  13. Alavinezhad, M.; Hassanabad, M.G.; Ketabdari, M.J.; Nekooei, M. Numerical and Experimental Structural Damage Detection in an Offshore Flare Bridge Using a Proposed Modal Strain Energy Method. Ocean Eng. 2022, 252, 111055. [Google Scholar] [CrossRef] [Scilit]
  14. Aloisio, A.; Alaggio, R.; Fragiacomo, M. Time-Domain Identification of the Elastic Modulus of Simply Supported Box Girders under Moving Loads: Method and Full-Scale Validation. Eng. Struct. 2020, 215, 110619. [Google Scholar] [CrossRef] [Scilit]
  15. Zeinali, Y.; Story, B.A. Framework for Flexural Rigidity Estimation in Euler-Bernoulli Beams Using Deformation Influence Lines. Infrastructures 2017, 2, 23. [Google Scholar] [CrossRef] [Scilit]
  16. Chen, Z.-W.; Zhu, S.; Xu, Y.-L.; Li, Q.; Cai, Q.-L. Damage Detection in Long Suspension Bridges Using Stress Influence Lines. J. Bridge Eng. 2015, 20, 05014013. [Google Scholar] [CrossRef] [Scilit]
  17. Sabirov, D.S.; Shepelevich, I.S.; Sabirov, D.S.; Shepelevich, I.S. Information Entropy in Chemistry: An Overview. Entropy 2021, 23, 1240. [Google Scholar] [CrossRef] [Scilit] [PubMed]
  18. Powell, G.E.; Percival, I.C. A Spectral Entropy Method for Distinguishing Regular and Irregular Motion of Hamiltonian Systems. J. Phys. Math. Gen. 1979, 12, 2053. [Google Scholar] [CrossRef] [Scilit]
  19. Ren, W.-X.; Sun, Z.-S. Structural Damage Identification by Using Wavelet Entropy. Eng. Struct. 2008, 30, 2840–2849. [Google Scholar] [CrossRef] [Scilit]
  20. Shannon, C.E. A Mathematical Theory of Communications. Bell Syst. Tech. J. 1948, 27, 379–423. [Google Scholar] [CrossRef] [Scilit]
  21. Smarra, F.; Tjen, J.; D’Innocenzo, A. Learning Methods for Structural Damage Detection via Entropy-Based Sensors Selection. Int. J. Robust Nonlinear Control 2022, 32, 6035–6067. [Google Scholar] [CrossRef] [Scilit]
  22. Li, H.; Bao, Y.; Ou, J. Structural Damage Identification Based on Integration of Information Fusion and Shannon Entropy. Mech. Syst. Signal Process. 2008, 22, 1427–1440. [Google Scholar] [CrossRef] [Scilit]
  23. Li, J.; Fan, X.; Liu, Y. Bridge Monitoring Data Processing and Prediction Based on Information Entropy. Structures 2024, 66, 106849. [Google Scholar] [CrossRef] [Scilit]
  24. Civera, M.; Surace, C. An Application of Instantaneous Spectral Entropy for the Condition Monitoring of Wind Turbines. Appl. Sci. 2022, 12, 1059. [Google Scholar] [CrossRef] [Scilit]
  25. Civera, M.; Surace, C. Instantaneous Spectral Entropy: An Application for the Online Monitoring of Multi-Storey Frame Structures. Buildings 2022, 12, 310. [Google Scholar] [CrossRef] [Scilit]
  26. Wang, N.; Zhang, M.; Ren, X.; Sun, M.; Pian, T.; Wang, P.; Cui, Y.; Yao, X.; Jia, C.; Yang, H.Y. High-Entropy Deep Eutectic Solvent Achieves Ultra-Low Polarization Zinc Anode Chemistry. Angew. Chem. 2025, 137, e202502761. [Google Scholar] [CrossRef] [Scilit]
  27. Kar, N.; Skrabalak, S.E. Synthetic Methods for High-Entropy Nanomaterials. Nat. Rev. Mater. 2025, 10, 638–653. [Google Scholar] [CrossRef] [Scilit]
  28. Zhang, G.; Zhong, H. Review and Prospect of Information Entropy and Its Applications in Power Systems. Proc. CSEE 2023, 43, 6155–6180. [Google Scholar]
  29. Rundle, J.B.; Giguere, A.; Turcotte, D.L.; Crutchfield, J.P.; Donnellan, A. Global Seismic Nowcasting with Shannon Information Entropy. Earth Space Sci. 2019, 6, 191–197. [Google Scholar] [CrossRef] [Scilit]
  30. Malik, S.; Kontsos, A. A Novel Information Entropy Approach for Crack Monitoring Leveraging Nondestructive Evaluation Sensing. Mech. Syst. Signal Process. 2024, 214, 111207. [Google Scholar] [CrossRef] [Scilit]
  31. Hou, S.; Zeng, C.; Zhang, H.; Ou, J. Monitoring Interstory Drift in Buildings under Seismic Loading Using MEMS Inclinometers. Constr. Build. Mater. 2018, 185, 453–467. [Google Scholar] [CrossRef] [Scilit]
  32. Zhang, W.; Sun, L.M.; Sun, S.W. Bridge-Deflection Estimation through Inclinometer Data Considering Structural Damages. J. Bridge Eng. 2017, 22, 04016117. [Google Scholar] [CrossRef] [Scilit]
  33. Komarizadehasl, S.; Komary, M.; Alahmad, A.; Lozano-Galant, J.A.; Ramos, G.; Turmo, J. A Novel Wireless Low-Cost Inclinometer Made from Combining the Measurements of Multiple MEMS Gyroscopes and Accelerometers. Sensors 2022, 22, 5605. [Google Scholar] [CrossRef] [Scilit] [PubMed]
  34. Qu, X.; Ding, X.; Li, X.; Yu, W.; Xu, Y.-L. Assessing and Mitigating impacts of structural inclination on acceleration measurements and estimated displacements using integrated GNSS and accelerometer structural health monitoring systems. Measurement 2025, 253, 117578. [Google Scholar] [CrossRef] [Scilit]
  35. OBrien, E.J.; Brownjohn, J.M.W.; Hester, D.; Huseynov, F.; Casero, M. Identifying Damage on a Bridge Using Rotation-Based Bridge Weigh-In-Motion. J. Civ. Struct. Health Monit. 2021, 11, 175–188. [Google Scholar] [CrossRef] [Scilit]
  36. Bruns, D.G. An Optically Referenced Inclinometer with Sub-Microradian Repeatability. Rev. Sci. Instrum. 2017, 88, 115111. [Google Scholar] [CrossRef] [Scilit]
  37. Erdenebat, D.; Waldmann, D.; Scherbaum, F.; Teferle, N. The Deformation Area Difference (DAD) Method for Condition Assessment of Reinforced Structures. Eng. Struct. 2018, 155, 315–329. [Google Scholar] [CrossRef] [Scilit]
  38. Huseynov, F.; Hester, D.; OBrien, E.J.; McGeown, C.; Kim, C.-W.; Chang, K.; Pakrashi, V. Monitoring the Condition of Narrow Bridges Using Data from Rotation-Based and Strain-Based Bridge Weigh-in-Motion Systems. J. Bridge Eng. 2022, 27, 4022050. [Google Scholar] [CrossRef] [Scilit]
  39. Hester, D.; Brownjohn, J.; Huseynov, F.; Obrien, E.; Gonzalez, A.; Casero, M. Identifying Damage in a Bridge by Analysing Rotation Response to a Moving Load. Struct. Infrastruct. Eng. 2020, 16, 1050–1065. [Google Scholar] [CrossRef] [Scilit]
  40. Glišić, B.; Posenato, D.; Inaudi, D.; Figini, A. Structural Health Monitoring Method for Curved Concrete Bridge Box Girders. In Proceedings of the Sensors and Smart Structures Technologies for Civil, Mechanical, and Aerospace Systems 2008; SPIE: San Diego, CA, USA, 2008; Volume 6932, pp. 39–47. [Google Scholar]
  41. Bas, S.; Apaydin, N.M.; Ilki, A.; Catbas, F.N. Structural Health Monitoring System of the Long-Span Bridges in Turkey. Struct. Infrastruct. Eng. 2018, 14, 425–444. [Google Scholar] [CrossRef] [Scilit]
  42. Ko, J.M.; Ni, Y.Q. Technology Developments in Structural Health Monitoring of Large-Scale Bridges. Eng. Struct. 2005, 27, 1715–1725. [Google Scholar] [CrossRef] [Scilit]
  43. Li, H.; Ou, J. The State of the Art in Structural Health Monitoring of Cable-Stayed Bridges. J. Civ. Struct. Health Monit. 2016, 6, 43–67. [Google Scholar] [CrossRef] [Scilit]
  44. Hoult, N.A.; Fidler, P.R.A.; Hill, P.G.; Middleton, C.R. Long-Term Wireless Structural Health Monitoring of the Ferriby Road Bridge. J. Bridge Eng. 2010, 15, 153–159. [Google Scholar] [CrossRef] [Scilit]
  45. He, X.; Yang, X.; Zhao, L. New Method for High-Speed Railway Bridge Dynamic Deflection Measurement. J. Bridge Eng. 2014, 19, 05014004. [Google Scholar] [CrossRef] [Scilit]
  46. Helmi, K.; Taylor, T.; Zarafshan, A.; Ansari, F. Reference Free Method for Real Time Monitoring of Bridge Deflections. Eng. Struct. 2015, 103, 116–124. [Google Scholar] [CrossRef] [Scilit]
  47. Zhou, D.; Wang, N.; Fu, C.; Guo, C.; Zhao, Y. A Novel Elastomer-Based Inclinometer for Ultrasensitive Bridge Rotation Measurement. Sensors 2022, 22, 2715. [Google Scholar] [CrossRef] [Scilit]
  48. Samir Mohamed Mohamed Soliman, E. Evaluation of Modal Parameters and Static Characteristics for Composite Mono Leaf Spring. Noise Vib. Worldw. 2021, 52, 33–47. [Google Scholar] [CrossRef] [Scilit]
  49. Yang, Z.; Chen, X.; Jiang, Y.; He, Z. Generalised Local Entropy Analysis for Crack Detection in Beam-like Structures. Nondestruct. Test. Eval. 2014, 29, 133–153. [Google Scholar] [CrossRef] [Scilit]
Figure 1. Local damage of simply supported beam. Note: This is a general schematic for coordinate definition; the analytical derivation accounts for all relative positions of the load and damage.
Buildings 16 01400 g001
Figure 2. Unit bending moment diagram.
Buildings 16 01400 g002
Figure 3. Finite element model: (a) Finite element model of the simply supported steel girder bridge; (b) Tri-linear stress–strain curve of Q355 steel used in the simulation.
Buildings 16 01400 g003
Figure 4. Damage locations: (a) single-point damage; (b) two and multi-point damage.
Buildings 16 01400 g004
Figure 5. Damage detection results using the Generalized Information Entropy Index of Rotation Difference (GIERD): (a) single-point damage; (b) two-point damage; (c) multi-point damage.
Buildings 16 01400 g005
Figure 6. Schematic of the test structure: (a) elevation; (b) sketch of the bridge showing sensors and their locations. Adapted from [5].
Buildings 16 01400 g006
Figure 7. Detection results using the Generalized Information Entropy Index of Rotation Difference (GIERD) for single-point damage (mid-span) at severity levels of (a) 16%; (b) 25%; and (c) 50%.
Buildings 16 01400 g007
Figure 8. Detection results using the Generalized Information Entropy Index of Rotation Difference (GIERD) for single-point damage (quarter-span) at severity levels of (a) 16%; (b) 25%; and (c) 50%.
Buildings 16 01400 g008
Figure 9. Detection results using the Generalized Information Entropy Index of Rotation Difference (GIERD) for multi-point damage. (a) Uniform 21% severity at the quarter-, mid-, and 0.85-span; (b) Non-uniform severity: 13% at the mid-span and 41% at the 0.85-span.
Buildings 16 01400 g009
Table 1. Comparison between conventional entropy indicators and the proposed GIERD index.
FeatureSpectral Entropy [17,18]Wavelet Entropy [19]Proposed GIERD Index
Primary DomainFrequency domainTime-frequency domainSpatial domain (load position)
Link to MechanicsData-driven or statistical; based on power spectrum distributionData-driven or statistical; based on wavelet packet energy distributionBased on the principle of virtual work; derived from analytical relationship between damage and rotation
Handling of Zero or NegativesTypically requires absolute values or rectification; undefined for negative signalsTypically requires absolute values or rectification; undefined for negative signalsAxis-shifting transformation ensures numerical stability for zero or negative values
Table 2. Damage scenarios of simply supported steel girder bridge.
CasesDamage TypesDamage LocationsDamage Severity
1HealthyNone0
2Single pointMid-span5%
3Two-point1/4, and 3/4 spans15%
4Multi-pointMid-span, 1/4, and 3/4 spans15%
Table 3. Quantitative localization accuracy for FEM.
Damage TypeActual Location (cm)Identified Location (cm) EL (%)
Single point87.587.50
Two-point43.7543.750
131.25131.250
Multi-point43.7543.750
87.587.50
131.25131.250
Table 4. Damage scenarios of laboratory experiment.
Damage TypesCasesDamage LocationsDamage Severity
Single point1Mid-span50%
225%
316%
41/4 span50%
525%
616%
Multi-point71/4 span and 0.85 span21%
8Mid-span and 0.85 span13% for mid-span and 41% for 0.85 span
Table 5. Quantitative localization accuracy for experimental scenarios.
CasesActual Location (cm)SensorIdentified Location (cm) EL (%)
1270A266.110.72
D270.400.07
2A278.851.64
D271.960.36
3A280.942.03
D253.753.01
4135A199.2911.91
D182.268.75
5A165.925.73
D168.076.12
6A163.565.29
D182.908.87
7135A179.078.16
459D411.808.74
8270A270.690.13
459D412.158.68
Disclaimer/Publisher’s Note: The statements, opinions and data contained in all publications are solely those of the individual author(s) and contributor(s) and not of MDPI and/or the editor(s). MDPI and/or the editor(s) disclaim responsibility for any injury to people or property resulting from any ideas, methods, instructions or products referred to in the content.