1. Introduction
Cost overruns remain one of the most persistent threats to construction project success, particularly in projects exposed to high uncertainty, complex interfaces, and tight resource constraints. Although extensive research has documented the causes of cost escalation, a key practical problem remains unresolved: how to translate expert risk judgments generated during feasibility analysis into quantitative parameters that can be used directly to update project budgets under uncertainty. This gap is especially relevant in refurbishment and rehabilitation projects, where uncertainty is intensified by the characteristics of existing assets, incomplete information, and evolving technical solutions, all of which complicate early-stage decision-making and cost control [
1,
2,
3,
4,
5].
Recent evidence confirms that cost escalation is rarely driven by a single factor; rather, it arises from interconnected drivers, including planning and scheduling deficiencies, estimation inaccuracies, design inefficiencies, adverse weather, scope-definition problems, contractual ambiguities, and unforeseeable site conditions [
1,
2,
3,
4]. In response, risk management has increasingly shifted from descriptive checklists toward more integrated approaches that seek to convert qualitative judgments into quantitative inputs suitable for forecasting and control. International guidance emphasizes structured processes for identifying, analyzing, evaluating, treating, monitoring, and communicating risk, as well as selecting appropriate assessment techniques for decision-making under uncertainty [
6,
7]. Similarly, cost-estimating best practices highlight the importance of risk and sensitivity analyses and the continuous updating of estimates based on evidence and observed performance [
8]. For capital works, the practical objective is not merely to add a generic contingency, but to align budgets with an explicit confidence level (e.g., P50, P80, or P90), where Px denotes the probability that the cost estimate will not be exceeded [
9].
Despite these advances, a recurring limitation in practice is the weak traceability between expert-based risk assessments and the numerical inputs required by probabilistic cost models. Many projects still rely on generic contingency percentages or regulatory allowed deviations that are not calibrated to the specific risk profile of individual work packages, particularly in refurbishment contexts where hidden conditions and interface risks are common [
5]. This limitation becomes even more critical in heritage tourism investments, where interventions must satisfy strict conservation requirements while operating under site restrictions, specialized labor needs, supply constraints, and schedule pressures associated with tourism demand and seasonality [
10,
11]. More specifically, prior approaches rarely provide an operational procedure that systematically transforms expert-based qualitative assessments into standardized coefficients and links them directly to probabilistic budget updating. Accordingly, this study addresses this practical gap by proposing a structured procedure that links expert scoring, weighted risk prioritization, and probabilistic budget updating through PERT-based estimation and Monte Carlo simulation, thereby enabling the recalculation of the maximum project budget at a specified confidence level.
The Cuban investment framework underscores this challenge. Regulatory instruments require the approval of an investment budget with an explicit maximum limit, including a “possible deviation percentage” determined during evaluation and recorded in the approval opinion [
12]. In practice, however, such margins can be insufficient when the project is exposed to multiple interacting risks concentrated in high-complexity components (e.g., civil works, assembly, specialized equipment, and logistics), increasing the likelihood of budget overruns and weakening cost control during execution [
13]. This tension is especially relevant for tourism-related rehabilitation projects—an area where investment decisions and execution performance are closely scrutinized and where cost instability can jeopardize both financial viability and delivery commitments.
To address this gap, this study aims to quantify the impact of risk factors on construction investment costs and to estimate an updated maximum project budget at a defined confidence level using an integrated methodological approach that combines qualitative and quantitative analyses. Unlike prior approaches, the proposed method explicitly links expert-based risk assessment with probabilistic budget updating through a unified and traceable procedure. The procedure links qualitative risk prioritization with probabilistic cost estimation in a single workflow by combining: (1) a Frequency–Impact matrix to prioritize risk factors; (2) weighted scaling to transform expert judgments into normalized coefficients; and (3) PERT-based Monte Carlo simulation to propagate uncertainty across cost components and update the maximum project budget at a predefined 95% confidence level, in line with established practices in probabilistic cost-risk analysis and contingency determination [
14]. In this way, the proposed approach provides an operational mechanism for translating expert-based risk assessments into traceable numerical inputs for budget updating and decision-making under uncertainty [
15,
16].
The method is demonstrated through the rehabilitation of the Esmeralda Hotel project in Cuba, a heritage tourism investment characterized by high patrimonial value and considerable technical complexity. The case illustrates how risk exposure is unevenly distributed across cost components and why generic contingencies may be insufficient to absorb realistic variability in this type of intervention. Overall, the study presents a replicable, decision-oriented procedure that supports investors, designers, and project managers in improving budget reliability through transparent, probability-based cost control in uncertain construction environments.
2. Literature Review
Risk management in construction projects has evolved from a mainly descriptive activity toward a more analytical field concerned with the prediction, quantification, and control of cost deviations under uncertainty. In the literature, one well-established stream examines the drivers of cost overruns, showing that budget deviations are rarely attributable to a single cause. Instead, they usually result from interacting factors, including planning deficiencies, design changes, market volatility, contractual weaknesses, governance failures, unforeseen site conditions, and inadequate coordination during execution [
2,
3,
13,
17]. In this perspective, cost gaps are understood not only as financial discrepancies between planned and actual costs, but also as manifestations of deeper weaknesses in project preparation and risk governance.
A second stream of research has focused on methodological tools for risk-informed cost estimation. Contemporary studies increasingly emphasize the use of simulation-based and probabilistic approaches—such as Monte Carlo simulation, uncertainty networks, sensitivity analysis, and scenario modeling—to improve forecasting accuracy and support decision-making under uncertainty [
15,
16]. This line of work has contributed significantly to moving beyond deterministic budgeting and generic contingencies. At the same time, the literature recognizes the continuing importance of expert judgment, especially in early project stages where historical data may be incomplete or context-specific risks are difficult to parameterize [
18]. However, a recurring practical challenge remains converting expert-based qualitative assessments into standardized numerical inputs that can be directly incorporated into probabilistic cost models.
A third stream highlights the importance of contextual specificity in construction risk analysis. Studies from developing economies and sector-specific settings show that risk exposure is shaped not only by technical variables but also by institutional, regulatory, logistical, and organizational constraints [
10,
19,
20,
21]. These issues become especially pronounced in tourism-related and heritage-sensitive projects, where interventions must balance conservation requirements, specialized labor demands, site restrictions, and service-delivery expectations. In such contexts, conventional contingency margins may be insufficient because they do not adequately reflect the interaction between project complexity and context-specific risk accumulation [
10,
21].
Taken together, these three strands of literature show substantial progress in understanding the causes of cost overruns, in developing probabilistic tools for risk analysis, and in recognizing the role of project context. Despite these advances, an important methodological gap remains. Prior studies rarely provide an end-to-end, transferable procedure that simultaneously: (i) identifies and prioritizes context-specific risk factors; (ii) translates expert judgments into traceable numerical coefficients; and (iii) links those coefficients directly to probabilistic budget updating and maximum budget-limit estimation. This gap is particularly evident in heritage tourism refurbishment projects in emerging and regulation-constrained environments. The present study addresses this need by proposing and empirically demonstrating an integrated workflow that combines Frequency–Impact prioritization, weighted scaling, and PERT/Monte Carlo simulation within a single decision-oriented budgeting procedure.
Despite these advances, prior research remains fragmented in the way risk assessment and cost estimation are operationally connected. A substantial body of studies focuses on identifying and classifying cost-overrun risks through qualitative or statistical approaches, yet these contributions typically remain at a descriptive level and do not provide explicit procedures for translating risk assessments into budget-updating mechanisms [
22,
23,
24,
25]. In parallel, simulation-based approaches—particularly those relying on Monte Carlo techniques—offer robust probabilistic estimates, but usually depend on predefined or statistically derived inputs, with limited integration of structured expert judgment [
26,
27,
28]. Additionally, expert-based risk assessment methods, including scoring systems and multi-criteria decision-making techniques, are widely used in early project stages; however, their outputs are rarely transformed into standardized numerical parameters that can be directly incorporated into probabilistic cost models [
29,
30,
31].
In contrast to these partially disconnected approaches, the present study proposes an integrated, end-to-end procedure that explicitly links qualitative risk assessment with probabilistic budget estimation within a single analytical workflow. The contribution of the method lies in: (i) systematically transforming expert-based evaluations into normalized impact coefficients through a structured Frequency–Impact matrix and weighted-scaling process; (ii) explicitly linking these coefficients to technical–economic indicators (TEIs), thereby capturing their effect on cost components; and (iii) incorporating these parameters into PERT-based Monte Carlo simulation to update the maximum project budget at a defined confidence level, following established probabilistic estimation practices [
27,
28,
32]. By integrating these stages, the proposed approach provides a traceable and operational mechanism that extends beyond descriptive or isolated methodologies and enables risk-informed budgeting in construction investment projects [
32,
33].
Table 1 combines foundational methodological contributions and recent applied studies, highlighting that existing research addresses risk identification, expert-based evaluation, and probabilistic estimation separately, but rarely integrates these components into a unified procedure for budget updating.
Overall, the literature converges on the need for risk-based, data-informed approaches that make uncertainty explicit in cost planning. However, as shown in
Table 1, existing studies tend to address risk identification, expert-based evaluation, and probabilistic estimation separately, with limited integration into operational budgeting procedures. The present study contributes by consolidating these elements into a unified and traceable workflow for risk-informed budget updating in construction investment projects.
3. Materials and Methods
The research was conducted in two sequential phases. Phase 1 (Analysis) characterizes the construction investment, defines the project’s technical–economic indicators (TEIs), establishes the baseline budget structure, and identifies the risk factors associated with cost gaps. Phase 2 (Estimation) quantifies the impact of the identified risks on the TEI and recalculates the total investment cost to obtain an updated Maximum Budget Limit.
For clarity and consistency, the main terms used throughout the procedure are defined as follows. Technical–economic indicators (TEIs) are the cost components into which the project budget is disaggregated for analytical and estimation purposes. The Maximum Budget Limit is the updated upper bound on total investment cost after incorporating the quantified effect of risk at the selected confidence level. A cost gap is the difference between the initial estimate and the updated cost after risk factors materialize. The cost generated by risk factors is the incremental cost resulting from their quantified impact on each TEI. The recalculated cost is the updated cost obtained after adding the cost generated by risk factors to the estimated cost of each TEI or, at the aggregate level, to the evaluated project budget.
The study also distinguishes between risk sources, risk events, and risk factors. Risk sources refer to the broader causal domains from which uncertainty arises, including environmental, labor, logistics, organizational, technological, and legal conditions. Risk events are the specific occurrences through which those sources affect project execution, such as intense rainfall, equipment breakdowns, delays in material delivery, or contract non-compliance. In operational terms, the risk factors evaluated in this study correspond to these event-level conditions, as they constitute the units assessed by experts and incorporated into the Frequency–Impact matrix and the subsequent quantitative analysis. For consistency, the term “risk factor” is used throughout the remainder of the manuscript to refer specifically to the event-level conditions evaluated in the empirical procedure.
3.1. Phase 1. Analysis
Step 1.1. Project characterization. The study begins with a structured characterization of the investment project, including its technical specificities, site conditions, applicable regulations, engineering studies and permits, and the main features of the construction process. This step provides the context required to interpret cost drivers and to delimit the scope of the subsequent risk assessment.
Step 1.2. Formal identification and costing of TEIs. TEIs are identified according to the applicable ministerial regulations. Once the relevant TEIs are defined, each TEI is monetized based on the project budget breakdown—construction items, work quantities, regulated unit prices, and the allocation by process (e.g., earthworks, assembly/installation, equipment, and other components). The relative contribution of each TEI to total cost is then calculated. This distribution is used to (i) determine which TEIs carry the greatest weight in the budget, (ii) anticipate where risk materialization would generate the largest financial impacts, and (iii) select the TEIs that warrant deeper risk analysis.
Step 1.3. Identification of risk factors. Event-level risk factors that historically generate cost gaps are identified using evidence from prior investments and triangulated through expert interviews, documentary analysis, and cause–effect (Ishikawa) diagrams. For operational purposes, the identified risk factors are grouped according to their primary risk source—environmental, labor, technological, financial, legal, organizational, logistics, operational, and external/contextual—without assuming independence among them. This step produces the initial risk register, which feeds into the prioritization and correlation analyses.
The evidence base used for risk identification comprised three complementary sources. First, documentary review covered the available technical and economic records of the Esmeralda Hotel project and of prior comparable investments, particularly the Ordoño Hotel and Caballeriza Hotel projects. The reviewed materials included budget breakdowns by TEI, technical documentation, execution reports, variation records, planning and scheduling documents, and records of deviations or contingencies observed during implementation. Second, semi-structured expert interviews were conducted with members of the Risk Working Group and additional specialists involved in project planning, execution, and investment control. The interviews focused on identifying recurring sources of cost gaps, the construction processes most exposed to uncertainty, and the typical mechanisms through which risks affected specific TEIs. Third, cause–effect (Ishikawa) diagrams were used to organize and synthesize the evidence obtained from documentary review and interviews into a preliminary risk inventory.
The interviews followed a semi-structured protocol organized around three guiding themes: (i) identification of recurrent sources of cost gaps, (ii) construction processes most exposed to uncertainty, and (iii) mechanisms through which risks affect specific TEIs. Interview responses were recorded in structured notes and subsequently coded by thematic similarity. The coded information was then compared with documentary evidence to identify convergent patterns and ensure consistency in the risk identification process.
To reduce the possibility of overlooking recurring risk drivers, the information gathered from documents and interviews was subjected to a structured comparative review. Risk statements were grouped by thematic similarity, compared across sources, and retained in the register only when they were supported by at least two sources of evidence or repeatedly mentioned by experts in relation to comparable project conditions. This triangulation-and-grouping process was used to consolidate the final list of risk factors and to improve the completeness and consistency of the risk register before prioritization.
The risk identification and scoring process was supported by a Risk Working Group comprising 11 experts with professional experience in construction management, project planning, cost estimation, engineering supervision, and investment control. The eligibility criteria required that participants demonstrate professional involvement in construction projects of similar complexity and prior experience in cost estimation, project execution, or technical evaluation relevant to the type of investment being analyzed. The expert group included specialists occupying different functional roles within the project environment, thereby ensuring the incorporation of complementary technical, managerial, and control perspectives. The group’s average professional experience was 16 years, with individual experience ranging from 8 to 24 years.
To improve clarity regarding expert participation, the Risk Working Group operated under a structured role-based scheme throughout the procedure. Experts contributed in three complementary stages: (i) risk identification and validation, where they supported the construction and refinement of the risk register based on project documentation and prior experience; (ii) individual scoring, where each expert independently evaluated the frequency of occurrence and impact of each risk factor using the predefined ordinal scales; and (iii) aggregation and validation, where individual scores were consolidated and, when necessary, discussed collectively to resolve significant discrepancies and ensure consistent interpretation.
Table 2 summarizes the expert roles and their participation across these stages. This structured participation ensured that expert input was systematically captured and methodologically controlled, thereby enhancing the transparency and reproducibility of the scoring process.
Each expert assessed the identified risk factors using the Frequency–Impact logic adopted in the study. Ratings were first provided individually and then aggregated to obtain the final values used in the matrix construction and subsequent quantitative analysis. Aggregation was performed using the consensus procedure of the expert scores for each factor. When important discrepancies were observed, they were discussed in a joint review session to clarify the interpretation of the risk factor and its expected effect on the corresponding TEI before confirming the final aggregated assessment. The assignment of experts to specific roles ensured that all stages of the process were covered by relevant expertise while maintaining independence during the individual scoring phase.
The elicitation protocol was implemented through a structured scoring instrument designed for this study. Each expert evaluated the identified risk factors using two dimensions: frequency of occurrence and magnitude of impact on the corresponding TEI. Frequency was assessed on a four-level ordinal scale anchored as follows: rare (low probability of occurrence), occasional (occasional occurrence), moderate (recurrent occurrence under certain conditions), and frequent (high likelihood of occurrence during project execution). Impact was assessed on a four-level ordinal scale anchored as: minor (limited effect on cost performance), moderate (noticeable but manageable effect), severe (substantial effect on the affected TEI), and catastrophic (critical effect with major budget consequences). Before completing the scoring, the experts were given a brief calibration session to review the meaning of the categories, unify interpretation criteria, and ensure consistent application of the scale. Initial scoring was conducted individually and anonymously in order to reduce potential dominance effects during the evaluation process. The results were then discussed collectively only when important discrepancies were identified, and a consensus-based consolidation was required. The full structure of the scoring instrument, including evaluation fields and instructions provided to experts, is presented in
Appendix A.
Step 1.4. Construction of the Frequency–Impact matrix. A Frequency–Impact matrix is then built to prioritize risk factors by combining the expected frequency of occurrence with the magnitude of their impact on the TEI, using structured assessments from the Risk Working Group.
For each identified risk factor, the experts assigned two ordinal scores corresponding to (i) expected frequency of occurrence during project execution and (ii) magnitude of impact on the affected TEI. The scoring followed the categorical anchors described previously for frequency and impact. Each expert first provided an individual assessment. The individual scores were then consolidated through the consensus procedure described above to obtain a single frequency rating and a single impact rating for each risk factor. These ratings were plotted on the Frequency–Impact matrix, which classifies risks based on the combination of probability and severity. The resulting matrix enables the identification of high-priority risks in the upper-right quadrant (high probability and high impact), as well as medium- and low-priority risks in the remaining regions.
The matrix is populated through structured expert judgment supported by qualitative correlation logic and categorical scaling, resulting in a ranked set of risks and an initial prioritization for quantitative modeling.
Step 1.5. Qualitative and quantitative correlation between risk factors and TEI. To establish and quantify the link between each risk factor and each TEI, a two-way matrix is developed in which rows represent the normatively defined TEIs and columns represent the identified risk factors. Each cell captures the strength of the relationship between a given risk and a given TEI using expert criteria with four levels: high (direct and frequent impact), medium (conditional impact), low (occasional or marginal influence), and none (no verifiable relationship). This mapping supports identifying the most sensitive TEI, constructing preliminary “vulnerability maps,” and gaining a clearer understanding of how risk propagates across the total cost structure.
In addition, the matrix makes it possible to determine whether a given factor affects one, several, or all TEIs, and to locate critical points where multiple risks converge on the same cost components. The matrix is built using complementary sources: (i) expert judgment combining specialists from construction, economics, and control; (ii) project documentation (quantities, processes, and budget items); and (iii) evidence from previous projects to detect consistent patterns of impact.
Once qualitative relationships are established, preliminary numerical scores are assigned (typically on a 0–5 scale) to represent the intensity of each relationship, based on the magnitude of the expected impact, historical frequency, and the construction process affected. This enables an initial qualitative sensitivity screening that addresses: which TEIs change most when a factor varies, which factors affect multiple TEIs simultaneously, and which TEIs concentrate the highest vulnerability.
3.2. Phase 2. Estimation
Phase 2 quantifies the impact of the prioritized risks on the TEI and recalculates the total investment cost to derive an updated Maximum Budget Limit. This phase begins with:
Step 2.1. Impact coefficient calculation. This step transforms the qualitative assessment of each risk factor into a quantitative impact coefficient that represents the magnitude of its effect on each TEI. Risk priority is determined from the factor’s position in the Frequency–Impact matrix, and the resulting coefficients are then recorded in a dedicated data-collection table used during the procedure. At minimum, this table should include: (i) the risk factor, (ii) its priority level, (iii) the assigned impact and frequency ratings (or the corresponding matrix category), and (iv) the computed impact coefficient. These compiled coefficients constitute the primary input for the subsequent probabilistic estimation stage. By expressing expert judgment numerically, the impact coefficient enables the subsequent use of quantitative techniques (e.g., PERT and simulation) and supports the attribution of additional cost to each risk.
Based on each risk factor’s assessed frequency of occurrence and impact severity on the affected TEI, a Frequency–Impact weighting matrix is constructed [
32]. In this matrix, the frequency of occurrence (
P) is represented on the horizontal axis, and the impact severity (
I) on the vertical axis. Each cell contains the numerical weight obtained from the product
, which transforms each qualitative Frequency–Impact combination into a standardized numerical score suitable for subsequent quantitative analysis.
Using these scores, the qualitative-to-quantitative transformation is operationalized through weighted scaling. This step assigns numerical weights to the qualitative categories assessed in the previous phase. The ordinal anchors used in the elicitation process were defined prior to score aggregation and applied consistently by all experts during the individual assessment stage. The weighting scheme applied in this study follows the values reported in
Table 3.
Weighted scaling enables the standardization of evaluations from multiple experts, reduces subjectivity, supports subsequent mathematical computations, and generates a comparable indicator across risk factors.
The impact-coefficient procedure operates at two levels. First, an impact coefficient is calculated for each individual risk factor based on its assigned frequency and impact-severity ratings. Second, the factor-level coefficients associated with each technical–economic indicator (TEI) are aggregated to obtain an overall impact coefficient for that TEI.
For each risk factor
j, the factor-level impact coefficient is calculated using Equation (1):
where:
CIj = impact coefficient of risk factor j;
Fj = weighted frequency score assigned to risk factor j;
Sj = weighted impact-severity score assigned to risk factor j.
The values of
Fj and
Sj are obtained directly from the ordinal categories assigned by the expert group and converted into numerical weights through the Frequency–Impact weighting matrix shown in
Table 2.
Next, for each TEI
k, the aggregate impact coefficient is obtained by averaging the coefficients of the risk factors associated with that TEI, as shown in Equation (2):
where:
ICk = aggregate impact coefficient for TEI k;
CIj = factor-level impact coefficient of risk factor j associated with TEI k;
nk = number of risk factors associated with TEI k.
This formulation makes explicit the transition from individual risk-factor scoring to the aggregate coefficient used in the subsequent probabilistic estimation stage.
All intermediate and final outputs from these steps should be recorded in a results log table for traceability and later use in the probabilistic estimation stage. At minimum, the table should include: (i) the TEI identifier, (ii) the number of associated risk factors, disaggregated by priority level (e.g., high/medium/low), (iii) the impact coefficients assigned to each priority level, and (iv) the resulting aggregate impact coefficient computed for each TEI.
Step 2.2. Quantitative assessment of risk factors in the construction investment. A quantitative assessment of the identified risk factors is conducted. The process begins by defining an admissible range for total cost behavior during the execution phase, based on plausible scenarios classified as optimistic, most likely, and pessimistic.
The values used as inputs for the PERT distributions were defined through structured expert judgment supported by evidence from prior investment projects with comparable characteristics. In particular, the Ordoño Hotel and Caballeriza Hotel projects provided an empirical reference for estimating the plausible range of cost variation associated with the identified risk factors.
For each technical–economic indicator (TEI), three scenario values were defined: optimistic, most likely, and pessimistic. The optimistic scenario represents conditions in which the impact of risk factors is minimal or effectively mitigated. The most likely scenario reflects the expected cost behavior under typical execution conditions. The pessimistic scenario represents situations in which the identified risks materialize with greater intensity or unfavorable combinations. These three values were used as parameters for the PERT distribution applied in the Monte Carlo simulation.
The selection of the minimum (−5%) and maximum (+10%) variation bounds follows an asymmetric configuration that reflects the typical behavior of cost uncertainty in construction projects. Empirical and practical evidence indicate that cost deviations are more likely to occur on the upper side due to execution risks, supply disruptions, and external constraints, whereas potential reductions are usually limited to marginal efficiency gains.
These bounds were further supported by expert judgment elicited during the validation stage, in which participants indicated that downward deviations are generally constrained to narrow margins, whereas upward deviations may be substantially larger. In addition, the selected range was cross-checked against observed cost variations in the reference project and comparable cases identified during the risk analysis phase.
Therefore, the adopted PERT parameters represent a conservative yet realistic approximation of uncertainty, capturing both the asymmetry and the magnitude of plausible cost deviations in similar construction contexts.
The outputs of this step were documented in a scenario summary table, including: (i) the TEI identifier, (ii) the aggregate impact coefficient for the TEI (from Step 2.1), and (iii) the estimated total cost under each scenario (optimistic, most likely, pessimistic). These scenario-based estimates define the admissible cost range required for subsequent quantitative modeling.
Step 2.3. PERT simulation and final cost estimation. Next, a Monte Carlo simulation was implemented in @RISK software (version 7.6.1) using the PERT distributions defined for the evaluated TEI. The simulation was run using 1000 iterations, which was found sufficient to ensure stability in the estimated outputs. Additional runs with higher iteration counts showed no significant variation in the expected values and upper confidence bounds, indicating convergence in practical terms. Each evaluated technical–economic indicator (TEI) was modeled using the scenario-based inputs defined in the previous step, and the resulting distributions were used to estimate the total investment cost at the selected confidence level.
In this application, the correlation between cost components was not parameterized; therefore, the simulation was performed under the assumption of independence across the evaluated TEIs. This assumption was adopted due to the absence of reliable data to parameterize dependency structures between components. These modeling conditions should be considered when interpreting the results, since the absence of dependency structures may underestimate tail risk when cost components are interrelated.
The simulation outputs were organized in a results table for each TEI. At minimum, this table includes: (i) the TEI identifier, (ii) the aggregate impact coefficient for the TEI, (iii) the simulated TEI cost under the PERT distribution, (iv) the cost generated by risk factors, and (v) the resulting recalculated cost, corresponding to the simulated cost under uncertainty.
The “cost generated by risk factors” is not an additional cost component introduced into the model. It is defined as the difference between the simulated cost obtained from the PERT/Monte Carlo procedure and the baseline (most likely) cost estimate for each TEI. Therefore, it represents the incremental cost variation attributable to the materialization of risk within the simulated scenario.
Since this value is derived directly from the simulation output, it does not involve any separate addition of risk-related costs, thereby avoiding double counting. For example, if the baseline (most likely) cost of a TEI is 100 monetary units and the simulation yields an expected cost of 110 under uncertainty, the cost generated by risk factors is calculated as 10. This value is not added again to the simulated cost; rather, it expresses the portion of the simulated result that is attributable to risk.
Formal convergence diagnostics and fixed random-seed control were not explicitly implemented, which constitutes a limitation in terms of strict computational reproducibility. However, the observed stability of results across repeated simulations suggests that this does not materially affect the robustness of the findings.
Finally, the recalculated costs of the evaluated TEIs were combined with those of the non-evaluated TEIs to obtain the total investment cost. At minimum, this summary includes: (i) recalculated cost of evaluated TEIs, (ii) cost of non-evaluated TEIs, (iii) total investment cost, (iv) initial project cost, and (v) the incremental value (difference between total investment cost and initial project cost).
Taken together, Steps 2.2 and 2.3 translate the prioritized risk structure into scenario-based cost ranges and subsequently into probabilistic estimates through PERT/Monte Carlo simulation. The outputs are consolidated in
Section 4, which updates the Maximum Budget Limit by combining (i) the recalculated costs of the evaluated TEIs, (ii) the cost of TEIs not included in the quantitative assessment, and (iii) the resulting total investment cost. This final synthesis provides a transparent basis for comparing the updated budget with the initial approved cost and for quantifying the incremental value attributable to risk, thereby supporting risk-informed budgeting and control decisions under uncertainty.
4. Results
The methodology described above was applied to the Esmeralda Hotel investment project, located in the tourism destination of Holguín, Cuba, on one of the main squares along the organizing axis of the city’s historic center. The building has high heritage value (Protection Grade I, the highest level), given its age and its significance as an outstanding example of local domestic architecture from the second half of the nineteenth century, as reported by the Holguín Design and Engineering Company.
As an initial step, the project’s technical–economic indicators (TEIs) were defined according to the investment’s scope and budget structure. In this case, the relevant TEIs comprise: earthworks; civil construction and assembly; installation and building services; furniture; institutional equipment; technological equipment; freight, insurance, tariffs, commercial management, transport, and warehousing; decoration and signage; and technical documentation and services.
To ensure consistency, all monetary values reported in the Results section and related tables are expressed in MP (thousand Cuban pesos).
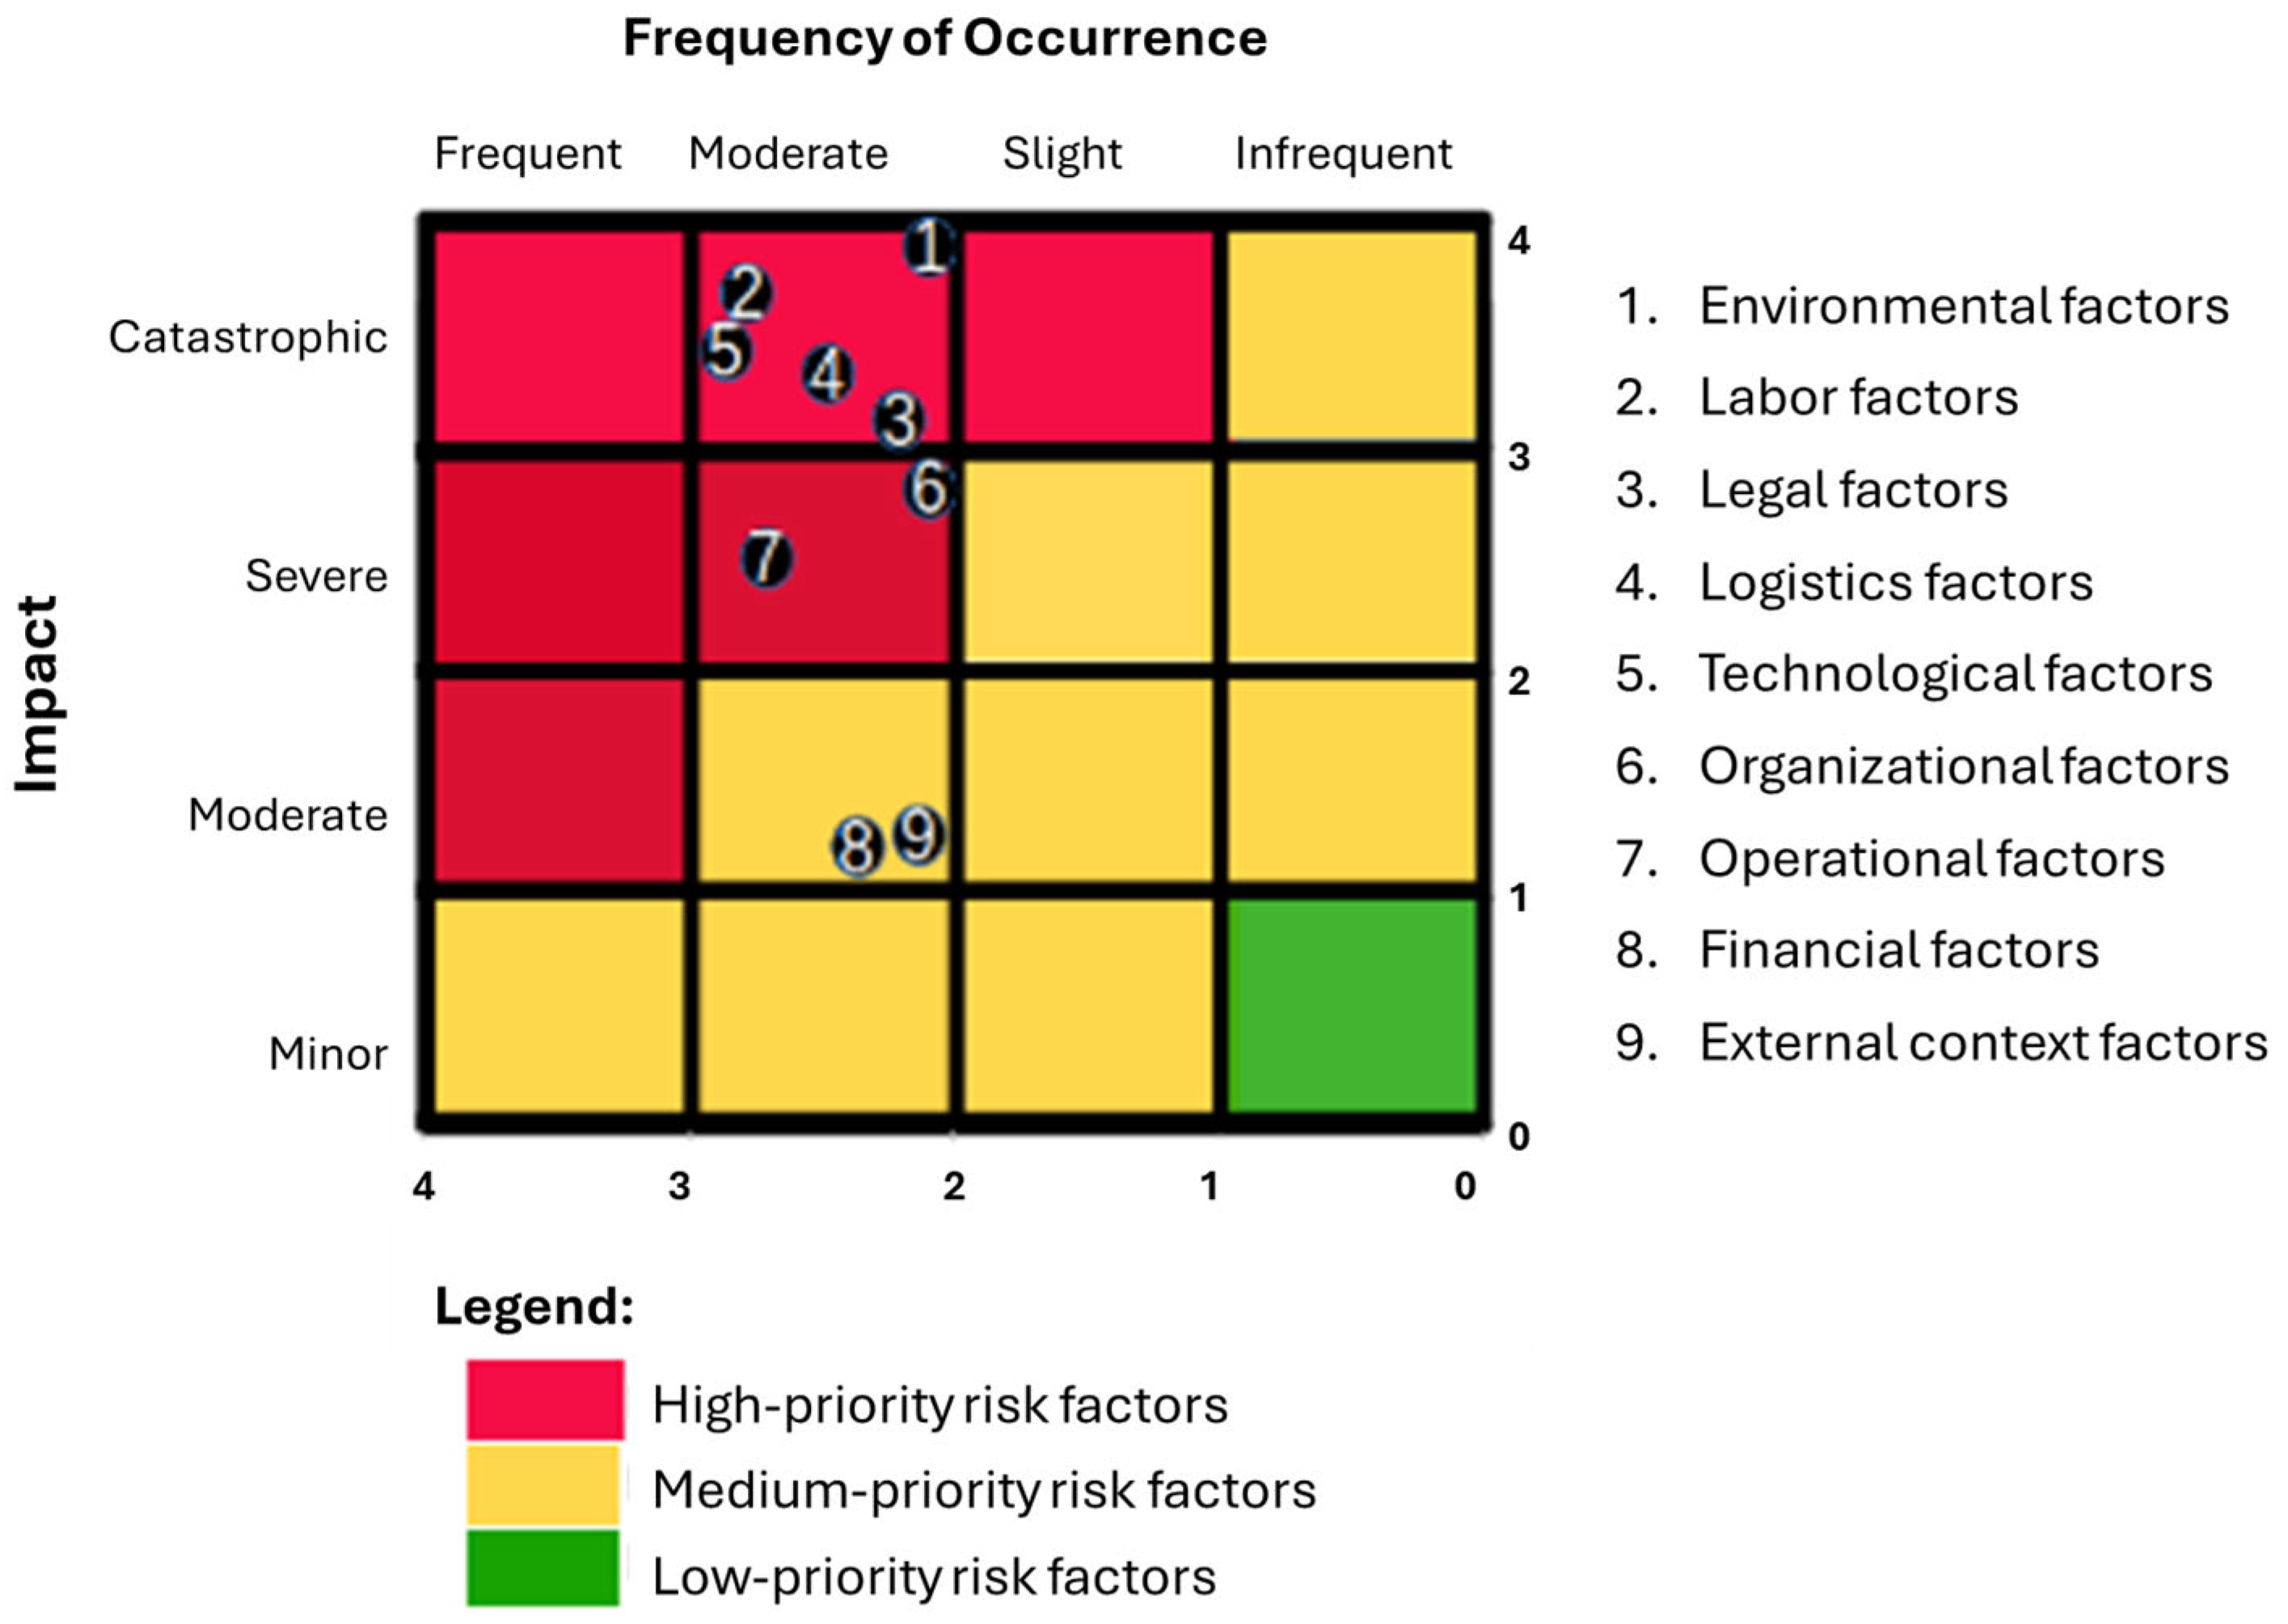
Risk identification was informed by accumulated experience from prior investment projects with comparable characteristics—specifically, the Ordoño Hotel and the Caballeriza Hotel—which provided a practical reference base for recognizing recurring risk sources and the specific events through which they could affect project costs. Based on this evidence, the event-level risk factors evaluated in the study were defined and incorporated into the Frequency–Impact matrix presented in
Figure 1.
Subsequently, based on the results obtained,
Table 4 was constructed to define the priority levels of the risk factors according to their probability of occurrence.
Although the first seven factors listed do not occur frequently, the risks associated with them may have catastrophic consequences for the total cost. In practice, when these risks materialize, they can halt the investment’s execution and extend the planned implementation time, which in turn amplifies cost gaps.
Based on the information above and following the methodological steps, a risk register by priority level was developed (see
Table 5). The register organizes the identified event-level risk factors according to their primary causal domain and priority level within the assessment procedure. Each risk was assigned a unique identifier and classified according to its primary causal domain. Technological risks were defined as those associated with the availability, operability, or technical condition of equipment and technical resources, whereas logistics risks were defined as those related to procurement, delivery, transport, or constraints on on-site availability. These criteria supported the formulation of mutually exclusive risk descriptions within the register.
Consistent with the position of the factors in the Frequency–Impact matrix and with the gradations of the impact coefficient for factors classified by priority level,
Table 4 presents a cleaned and non-duplicated risk register in which each item is uniquely identified and assigned to a single primary causal category. This revision improves the consistency of the classification process and reduces cross-category ambiguity in the subsequent analysis. Based on this revised register, the impact coefficients of the risk factors were then established for each TEI (see
Table 6).
The qualitative assessment was then extended through a quantitative evaluation of the cost gaps associated with risk factors affecting the total investment cost. This stage began by defining an admissible range for total cost behavior—optimistic, most likely, and pessimistic—during the execution phase through interactive sessions involving the Risk Working Group and invited investment specialists with experience in similar projects.
The pessimistic range was defined by estimating an additional 10% of the “real” value of each TEI and adding this increment to the corresponding TEI amount. Under the same logic, the optimistic range was defined by subtracting 5% from the initial value, representing the possibility that not all estimated costs would be executed. Based on these assumptions, cost variations were estimated for each TEI and for the total project cost under the optimistic, most likely, and pessimistic scenarios (see
Table 7).
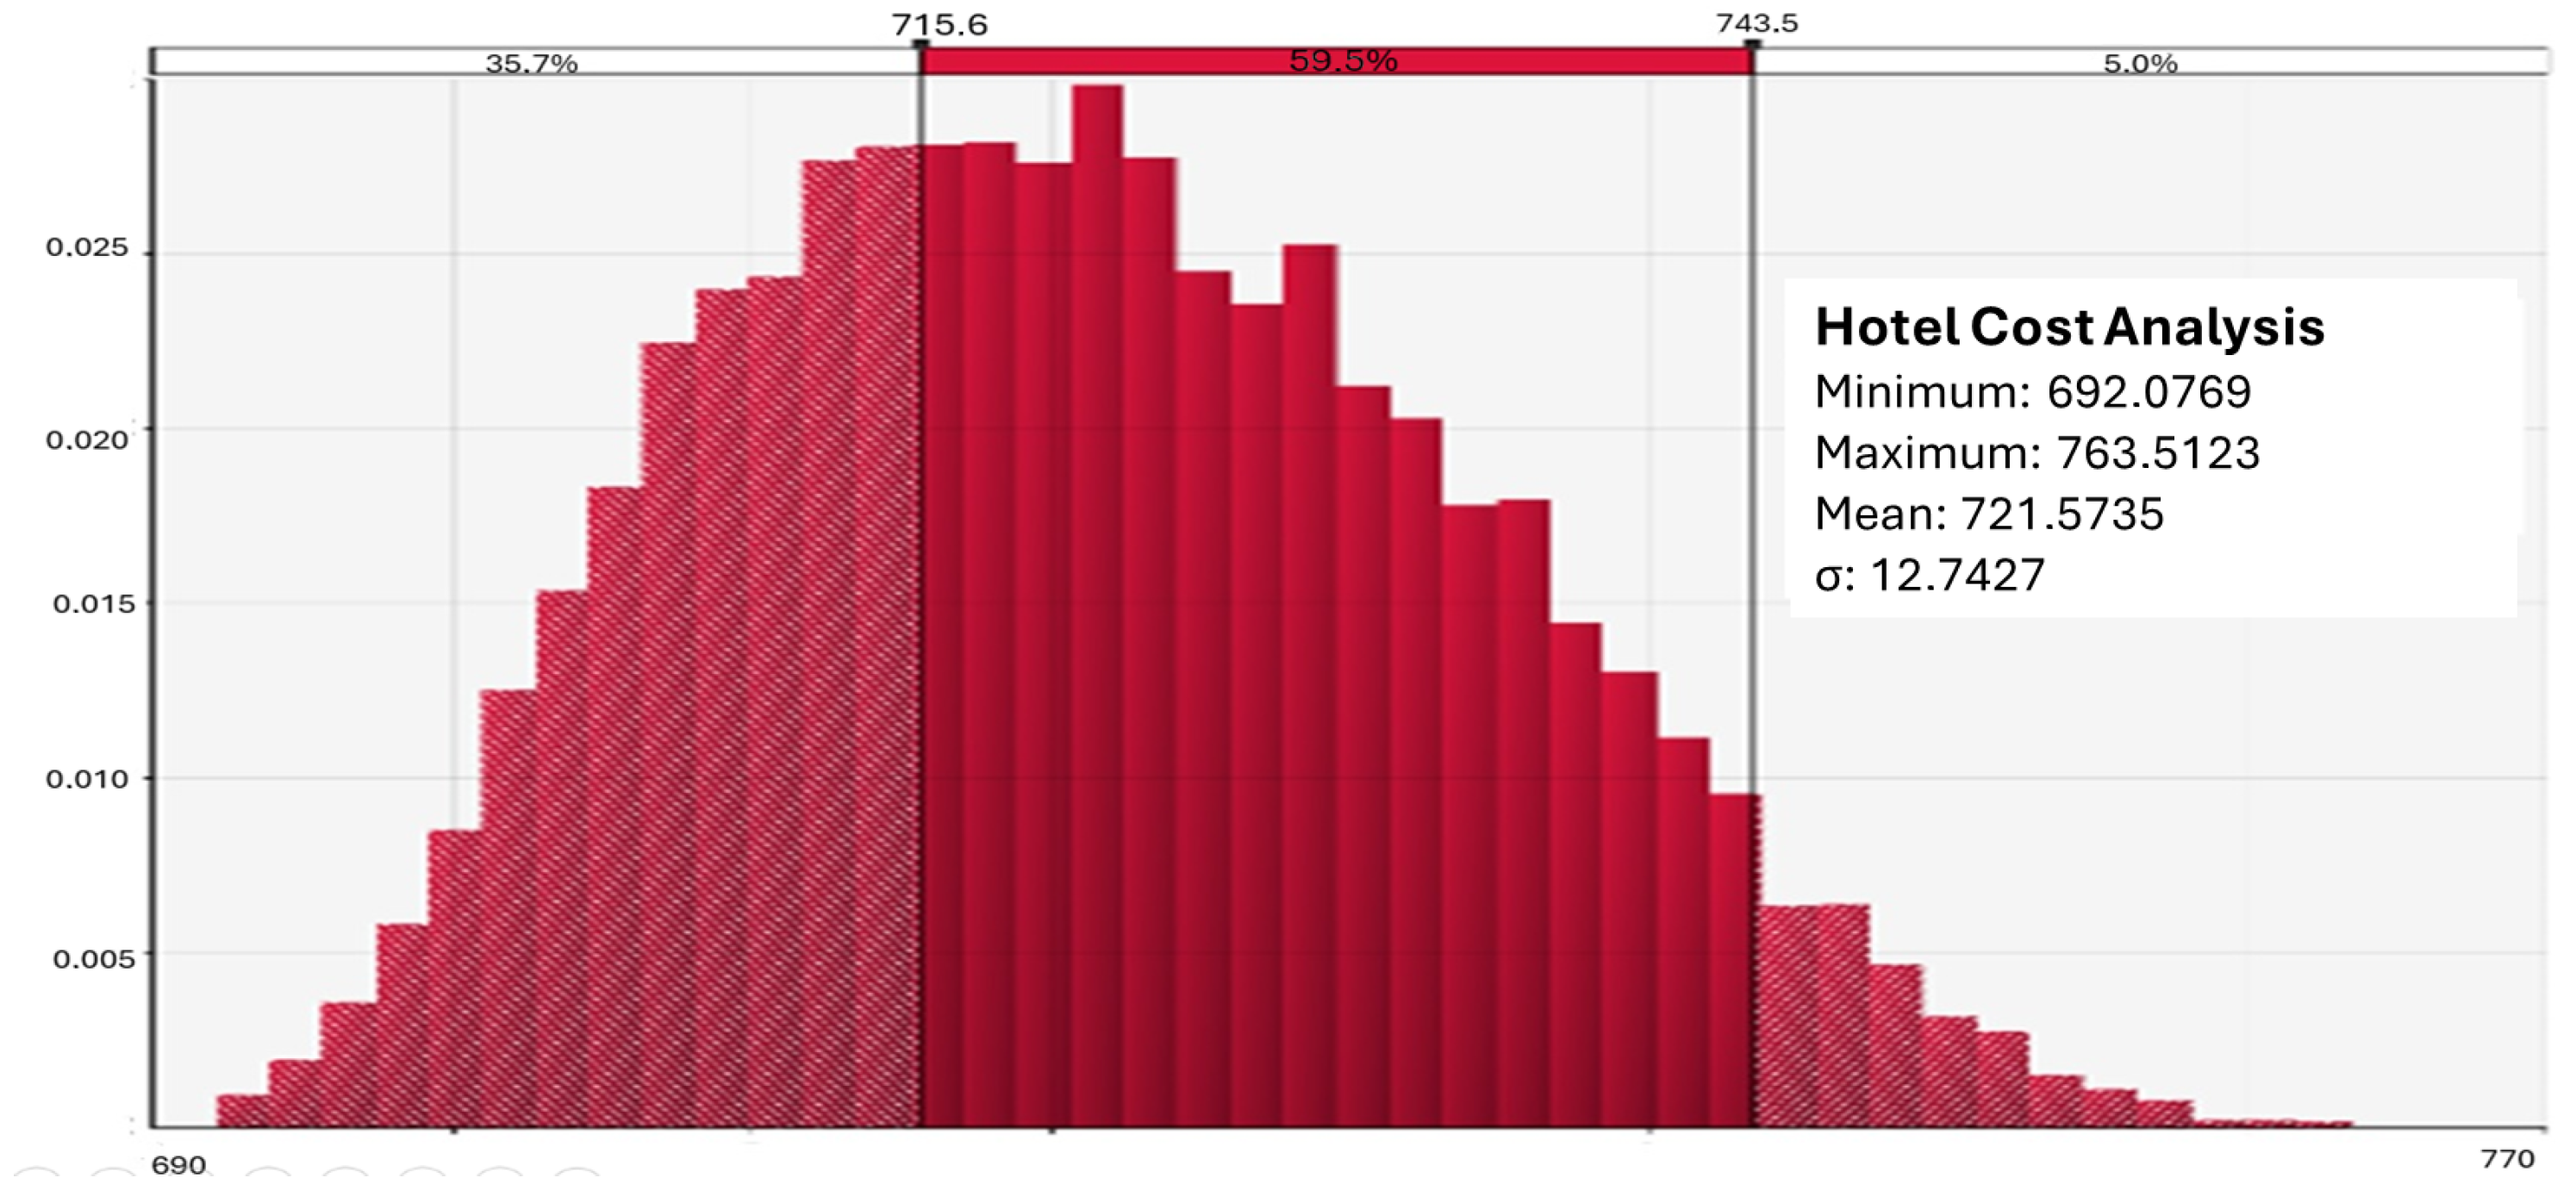
Using @RISK software (version 7.6.1) and specifying PERT distributions (
Figure 2), the simulated time-based costs were estimated according to the resulting probability distribution.
Based on the data shown in
Figure 2, the simulated mean reaches 721.57. The shaded areas at both ends represent intervals of 10,000 units, with the minimum estimated cost as the reference up to the calculated total cost, which corresponds to 715.6 MP (thousand Cuban pesos). The upper part of the plot also displays the range between the calculated total cost and the simulated cost at a 95% confidence level. This value corresponds to the calculated total cost plus the additional contingency (unforeseen) amount required to account for the probability that the risks associated with the identified factors will materialize. In this study, the sum of the calculated total cost and the contingency increment is taken as the updated reference value for the new total investment cost.
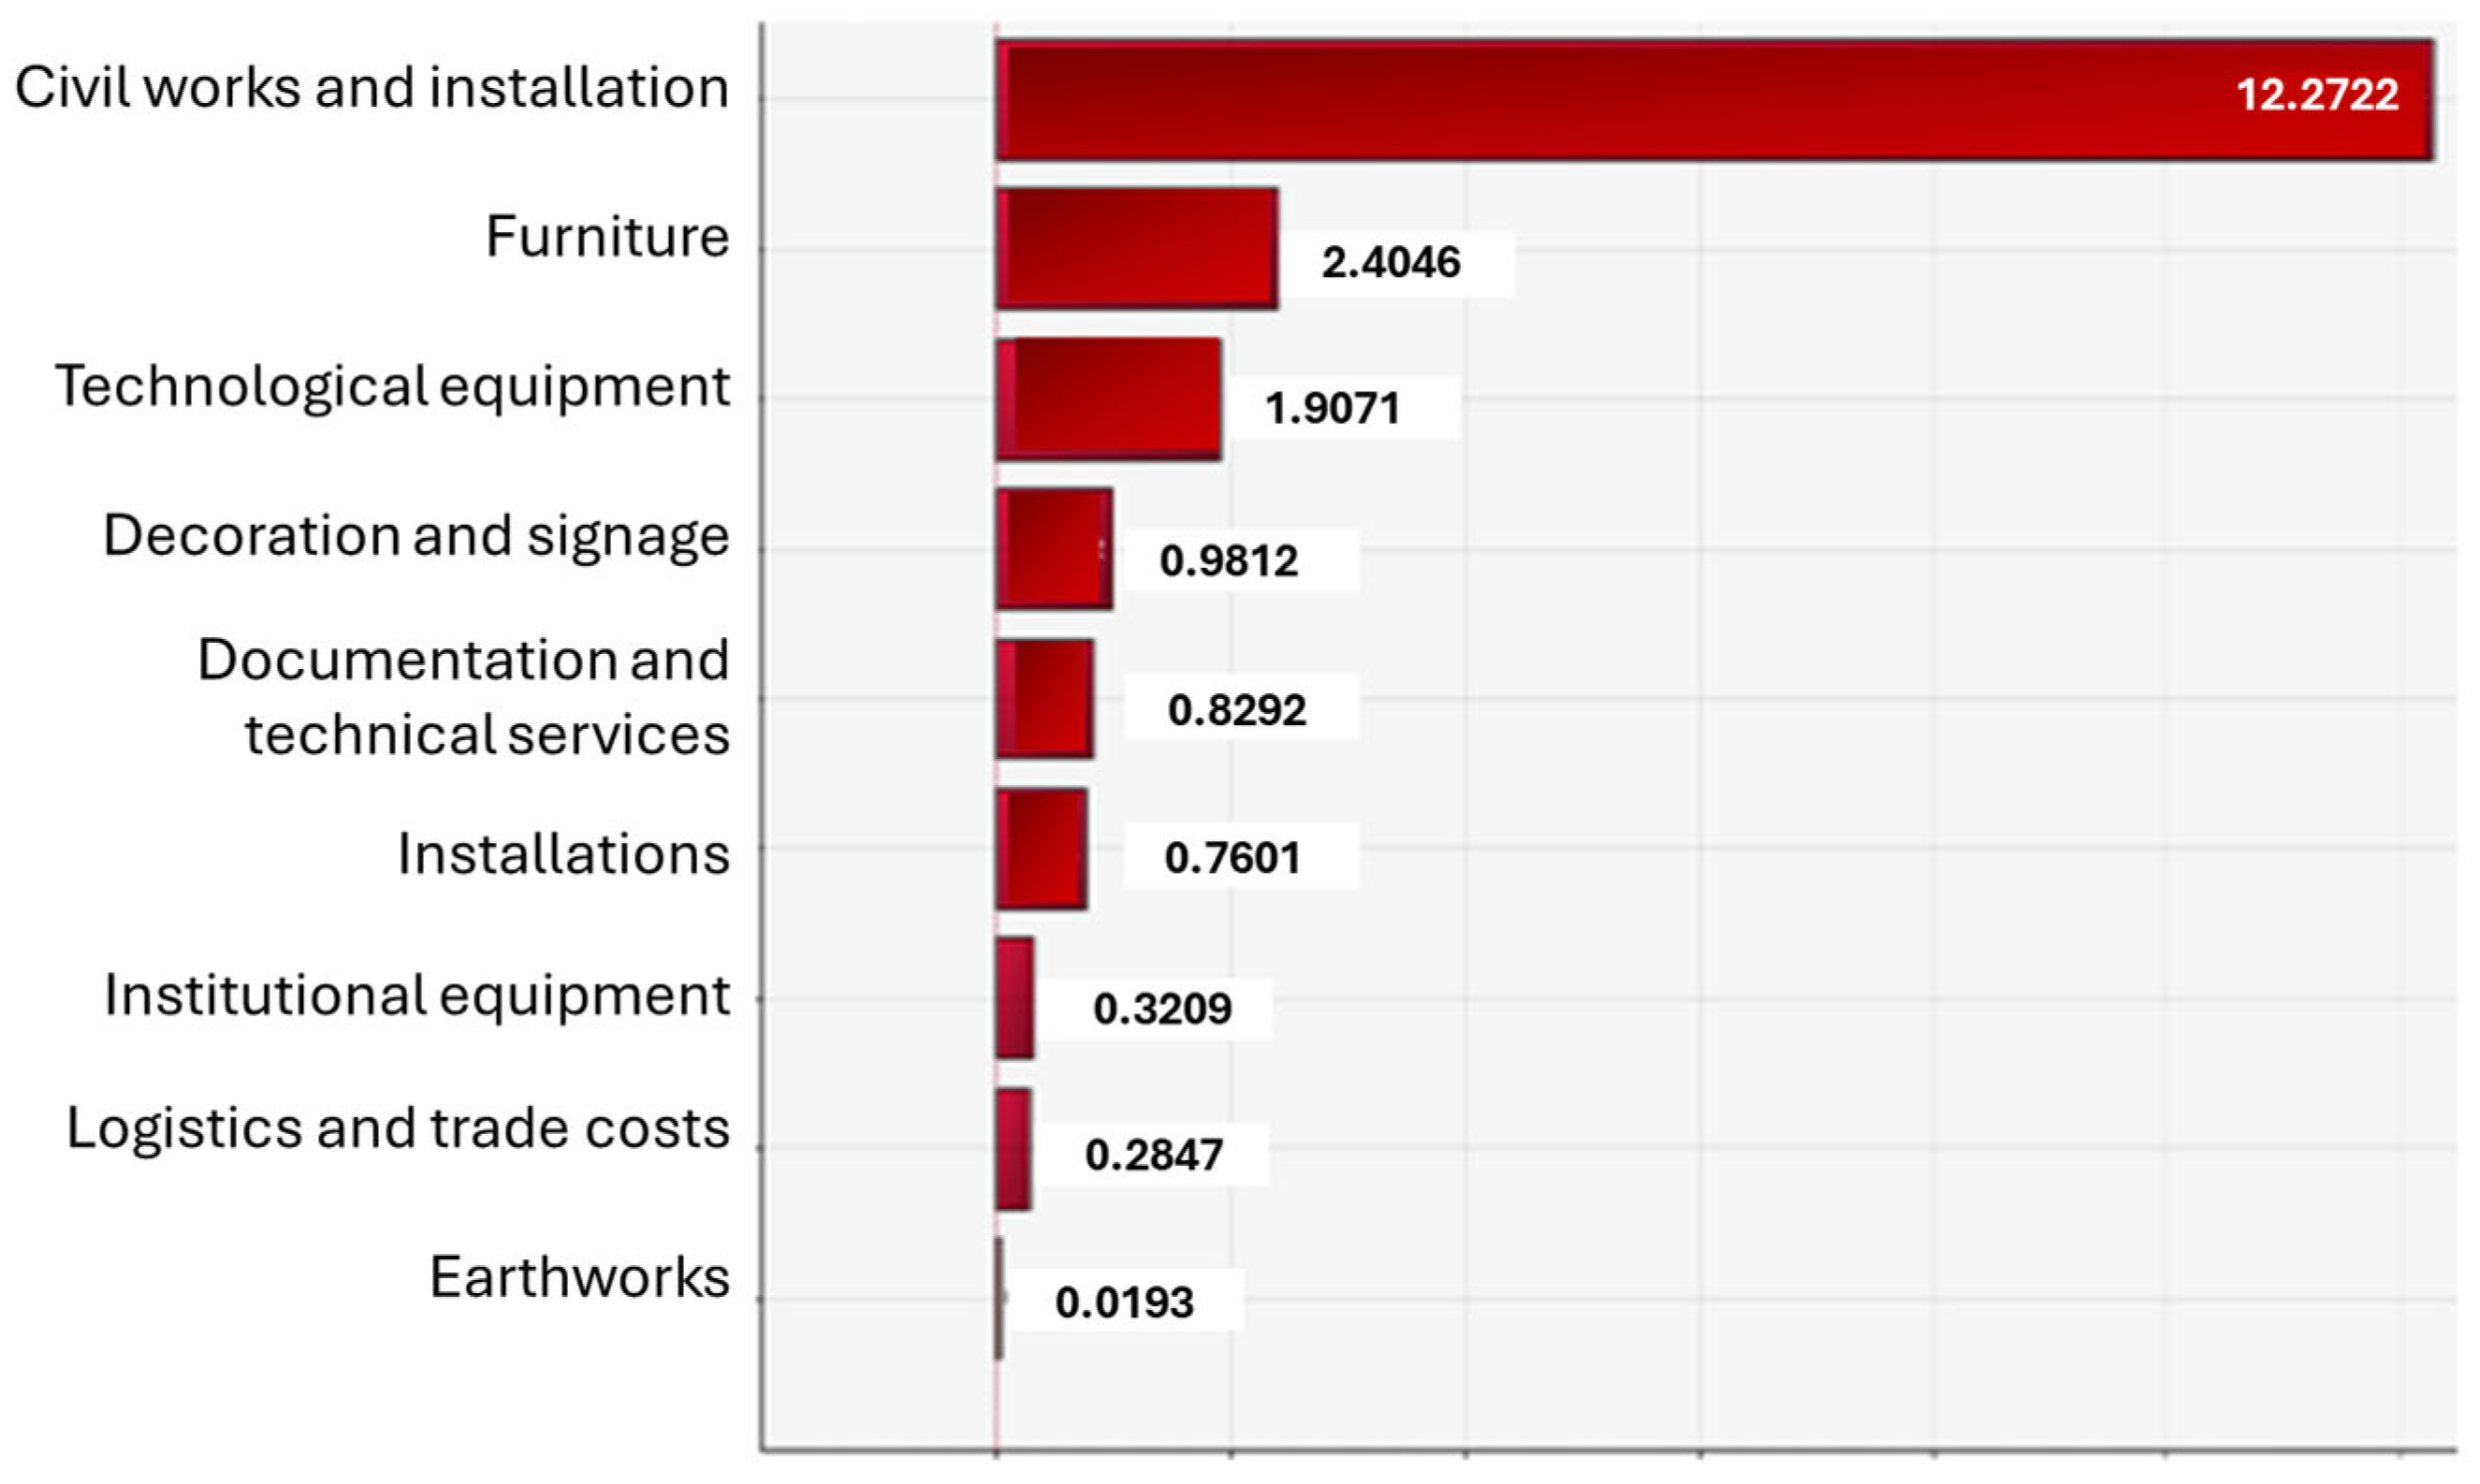
In addition,
Figure 3 presents a regression map that relates the evaluated TEI to the percentage of the total cost it represents. This analysis helps identify which TEIs are most critical, since variation in these components can produce substantial gaps in total cost. In this case, the dominant driver is Civil construction and assembly, which emerges as the key TEI influencing overall cost variation.
The simulation outputs, including the results for each TEI—namely, the most likely scenario cost, the simulated TEI cost, and the cost attributable to risk factors—are summarized in
Table 8.
In this investment, the calculated percentage required to meet the planned total cost is 35.7%, indicating that—after applying the PERT distribution—the evaluated probability of meeting the estimated cost is insufficient. Specifically, none of the planning ranges reaches even a 50% probability of achieving the baseline estimated cost. Based on the PERT value distribution (1000 iterations) and expressed in thousands of Cuban pesos (MP), the cost required to achieve a 95% confidence level is 743.7 for the hotel. This implies that an increase of 28.09 MP over the estimated project cost would be required under the PERT-based parameters defined above.
It is important to distinguish between the role of the probabilistic simulation and the role of the impact coefficient in the recalculation procedure. The Monte Carlo simulation based on the PERT distribution captures the uncertainty in the scenario-based cost estimates for each technical–economic indicator (TEI), reflecting the plausible range of variation across the optimistic, most likely, and pessimistic scenarios. The impact coefficient, obtained from the Frequency–Impact analysis, represents the expected magnitude of cost increase associated with the identified risk factors affecting each TEI. Accordingly, the simulated TEI cost is interpreted as a probabilistic estimate of the baseline cost under scenario uncertainty, whereas the cost attributable to risk factors is estimated by applying the corresponding impact coefficient to that simulated cost. The resulting recalculated TEI cost therefore reflects the combined effect of scenario-based uncertainty and the expected incremental cost associated with risk exposure, rather than a duplicate simulation of the same risk effect.
Based on this distinction,
Table 9 presents the recalculation of the TEI amounts by reporting the initial TEI cost, the simulated TEI cost, the expected cost generated by risk factors, and the resulting recalculated TEI cost. The table also provides the paired values used to calculate the Pearson correlation between the initial and recalculated TEI cost distributions.
The results confirm that the TEIs with the greatest contribution to cost growth are those associated with a higher number of processes and greater technical complexity—particularly civil construction and assembly, furniture, and technological equipment. However, when the average increase for each TEI is assessed relative to its initial projected value (the desired baseline scenario), the cost growth remains close to the distribution mean, with an estimated standard deviation of approximately 2%.
The supporting values used to calculate the Pearson correlation between the initial TEI cost distribution and the recalculated TEI cost distribution are presented in
Table 9, allowing verification of the paired values underlying the reported coefficient.
Table 9 shows that the recalculated TEI cost distribution closely mirrors the original cost structure across the evaluated TEIs. This is reflected in the Pearson correlation coefficient between both distributions, which reaches 0.99, indicating an extremely strong association.
The values used to calculate the Pearson correlation between the initial TEI cost distribution and the recalculated TEI cost distribution are presented in
Table 9, allowing verification of the paired values underlying the reported coefficient. The resulting coefficient (r = 0.99) indicates that the recalculated distribution closely preserves the original proportional structure of costs across the evaluated TEIs.
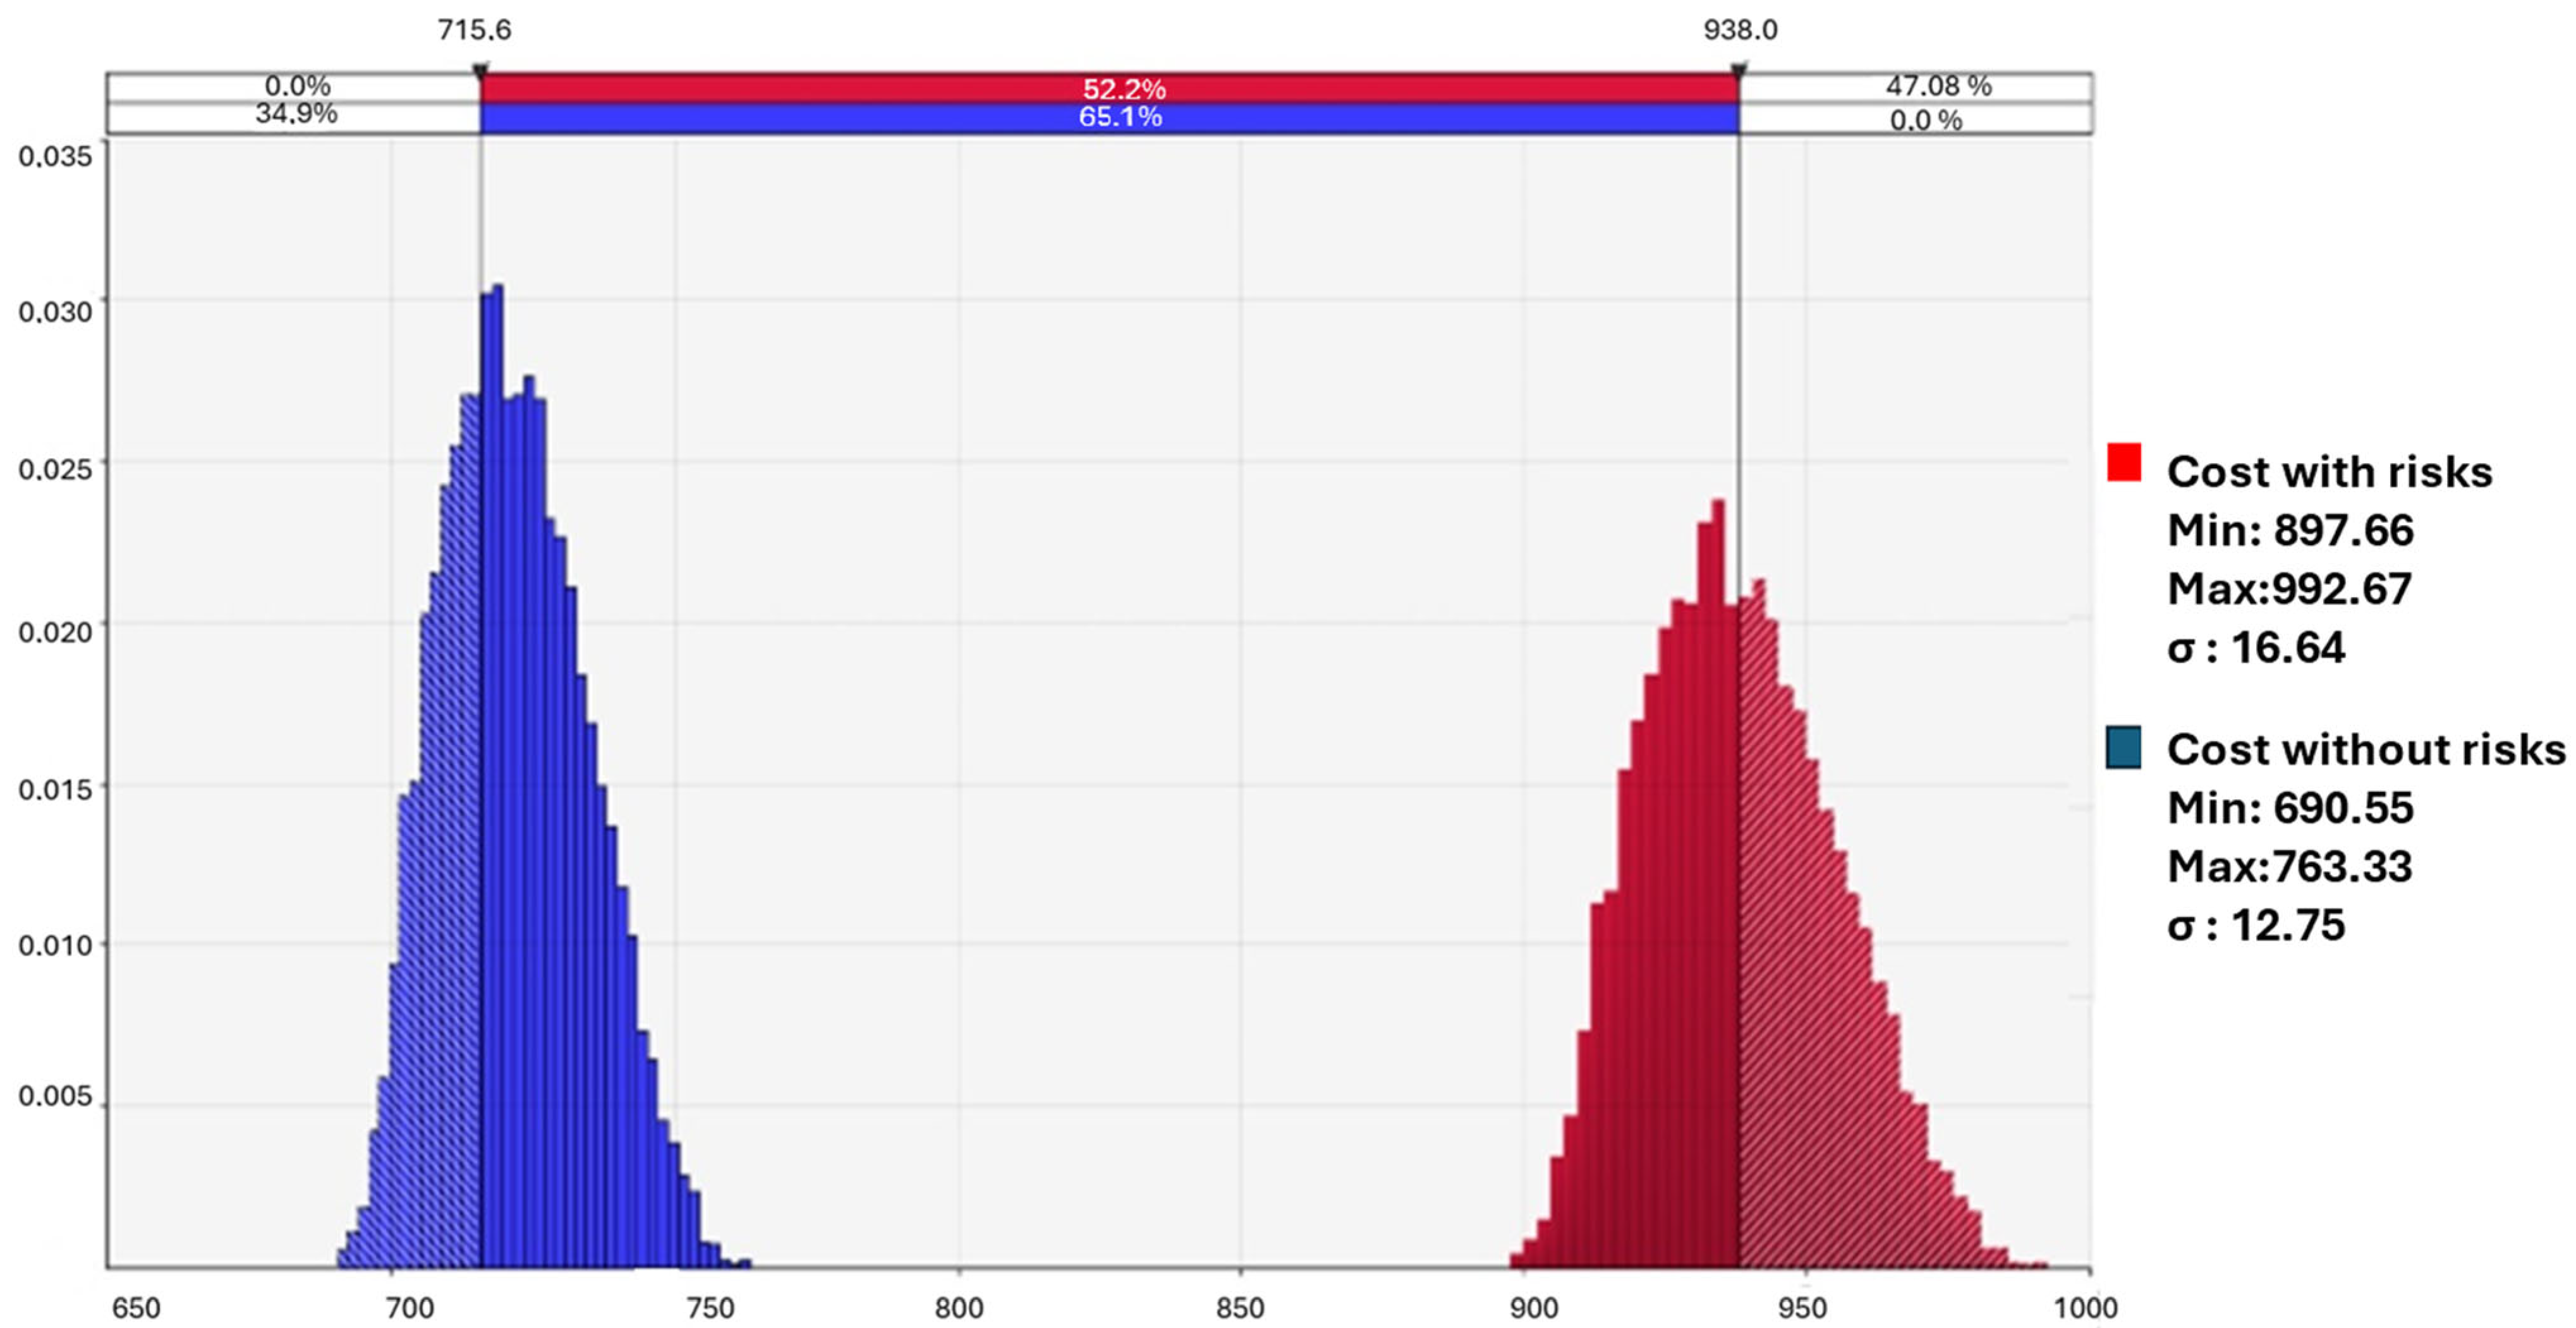
Figure 4 compares the total cost estimated during the pre-investment phase with the recalculated total cost after adding the amount associated with the potential materialization of risk factors during the execution phase.
The increases in the minimum and maximum ranges shown in the comparative plot are driven by the probability-weighted impact of risk factors affecting each TEI. The simulated mean aligns with the amount to be executed after recalculating the total cost and incorporating risk factors, indicating that—if the identified risks materialize—their financial impact can be absorbed without negatively affecting project execution. In addition, the Civil construction and assembly TEI exhibits the largest cost increase, since it represents the highest-cost component and concentrates the processes that directly enable physical progress of the construction investment.
Finally, after recalculating the evaluated TEI through the combination of simulated baseline cost and risk-related incremental cost, the portion of financing not affected by the analyzed risk factors was added in order to obtain the recalculated maximum budget limit. This adjustment is summarized in
Table 10.
Once the recalculated maximum budget limit had been obtained, the resulting values were compared with the actual cost structure in order to reconstruct the quantitative gap analysis, as shown in
Table 11. The differences reported in
Table 10 are heterogeneous across TEIs, as they compare the recalculated estimated costs from the proposed procedure with the actual costs observed in the case-study investment. Accordingly, the magnitude of each gap reflects not only the baseline size of the component, but also the extent to which that component concentrated the cumulative effects of risk materialization during execution. The largest differences are observed in TEIs which are associated with greater technical complexity and a direct influence on construction progress—particularly in earthworks, civil construction and assembly, installation and building services, and technological equipment—where execution-stage contingencies, rework, and operational disruptions are more likely to generate substantial cost deviations. In some cases, such as earthworks, the relative gap appears especially large because the recalculated estimated value was very small; therefore, even moderate absolute deviations translate into very large proportional differences.
The recalculated maximum budget limit (
Table 9) indicates that incorporating risk-driven uncertainty increases the required investment envelope from 804.51 MP to 1026.95 MP, implying an incremental allocation of 222.44 MP to absorb potential risk materialization and maintain continuity of execution. The reconstructed gap analysis (
Table 10) further shows that the cost gap is highly concentrated: civil construction and assembly account for the largest share of the total gap (59.19%), followed by earthworks (13.82%) and technical documentation and services (11.12%), with additional contributions from installation and building services and technological equipment. Taken together, these results suggest that cost gaps in the Esmeralda Hotel project are primarily driven by TEIs with greater process complexity and stronger exposure to interacting risks, reinforcing the need for risk-informed, confidence-based budgeting in heritage tourism rehabilitation projects.
5. Discussion
5.1. Risk-Based Cost-Gap Management: Empirical Evidence and Methodological Contributions
The results obtained from applying the proposed methodology support the conclusion that managing risk-associated cost gaps in construction investments requires a systematic, quantitative approach tailored to the execution context. Empirical evidence from the Esmeralda Hotel project confirms the pattern reported in international studies, which emphasizes that cost overruns in construction projects largely stem from insufficient early risk identification, the absence of continuous monitoring mechanisms, and the use of contingency estimates based on generic criteria rather than project-specific data [
2,
3,
35].
Consistent with this view, the findings show that the gap between estimated and actual cost does not arise solely from initial calculation errors, but from the cumulative materialization of risk factors that were not managed in a timely manner. This conclusion aligns with authors who underscore the need to integrate simulation models and probabilistic analysis into cost estimation in order to improve the accuracy of baseline budgets [
15,
16,
36]. In this study, the Frequency–Impact matrix and PERT/Monte Carlo simulation enabled the quantification of variations that—if left unmodeled—would likely remain hidden until advanced execution stages, when the investor’s ability to respond is more limited.
Importantly, the study demonstrates that the TEIs with greater technical complexity and larger budget shares—particularly Civil construction and assembly, Furniture, and Technological equipment—concentrate the highest vulnerability to the identified risk factors. This is consistent with research highlighting the sensitivity of technically intensive work packages to logistics, organizational, and resource-availability risks [
10,
17]. However, the analysis also indicates that even TEIs with a smaller financial weight can accumulate relevant gaps when systematic risk factors are present, such as the availability of skilled labor or the technical consistency of design and execution documentation.
A distinctive contribution of the proposed methodology is the explicit transition from qualitative to quantitative risk valuation. While the literature recognizes the importance of expert judgment in early stages of risk analysis [
18], traditional approaches often struggle to translate such judgments into usable numerical parameters. In contrast, the procedure implemented here produced normalized impact coefficients, facilitating the integration of different qualitative scales within a single interpretive model. In doing so, it addresses a key weakness frequently identified in regional practice: the lack of quantitative tools for justifying budget increases with empirical evidence and probabilistic foundations [
20,
21,
36].
The analysis also shows that, after recalculation, the estimated total gap represents 24.69% of the recalculated budget, supporting the relevance of incorporating contingency provisions based on observed risk behavior rather than relying exclusively on regulatory margins. This result is consistent with international evidence suggesting that standard contingency allowances often underestimate real risk exposure, potentially leading to project stoppages or unplanned requests for additional funding [
13].
Another relevant element is the very high correlation observed (0.99) between the initial TEI cost distribution and the recalculated cost distribution. This suggests that although risk materialization changes the magnitude of costs, it does not substantially alter the relative distribution of costs across the evaluated budget components. This finding contributes to existing knowledge by indicating that cost-gap management may not necessarily require redefining the overall budget structure, but rather adjusting its magnitude as a function of risk while preserving broad proportionality across components.
The reported correlation coefficient (0.99) corresponds to the Pearson correlation calculated across the set of evaluated technical–economic indicators (TEIs), with paired observations consisting of the initial estimated cost and the recalculated cost for each TEI obtained through the proposed risk-adjustment procedure. This comparison was used to assess the extent to which the recalculated distribution preserves the original budget’s internal proportional structure after incorporating the expected effects of the identified risk factors. The high coefficient indicates that the adjustment procedure changes the magnitude of costs while preserving, to a large extent, their relative distribution across the evaluated components.
Finally, the procedure demonstrates that incorporating historical risk registers can function as an organizational learning mechanism with long-term impact. The Esmeralda Hotel experience shows that the absence of systematic records prevents anticipatory identification of cost-behavior patterns and limits knowledge transfer to new projects—an issue widely documented in the Latin American context [
11].
Overall, the results support the relevance and applicability of the proposed procedure. The approach strengthens economic planning, reduces uncertainty, and provides a replicable methodological basis for future construction investments—particularly in tourism and heritage contexts where risk exposure is inherently high.
5.2. Limitations and Recommendations for Future Research
Although the proposed methodology produced robust and consistent results for estimating and managing risk-associated cost gaps in the Esmeralda Hotel investment, several limitations should be acknowledged, as they condition the scope of the conclusions. First, the study was applied to a single construction project with specific heritage and regulatory characteristics, which may constrain the generalizability of the findings to other project types—particularly those with different scale, technical complexity, procurement structures, or geographic settings. While prior research suggests that risk models can be adapted across contexts, their comparative validity must be tested in diverse conditions to consolidate a broadly applicable methodological framework.
Second, the estimation of impact coefficients and the correlation matrix linking risk factors to the TEIs relied partly on expert judgment. Although expert elicitation is common and accepted in construction risk analysis, it inevitably introduces subjectivity, especially when historical risk records are limited. In this case, the scarcity of systematic risk data increased dependence on practitioners’ tacit knowledge and reduced the ability to benchmark results against larger datasets, as recommended by recent research on probabilistic modeling [
15,
16].
A further limitation concerns the use of Monte Carlo simulation and the PERT model, both of which require parametric assumptions about probability distributions that may shift under more volatile macroeconomic conditions or regulatory reforms affecting the construction sector. The analysis did not explicitly incorporate exogenous macro-level drivers—such as abrupt exchange-rate changes, supply-chain crises, or disruptive global events—which recent studies have shown to be highly influential in explaining cost instability and overruns [
13].
Future research can strengthen and extend the proposed procedure along several complementary directions. First, the methodology should be applied and validated across multiple projects and work types, including contemporary buildings, infrastructure works, large-scale hotel developments, and non-heritage refurbishments, to assess model stability and sensitivity under different regulatory and construction environments. Second, longitudinal risk databases should be developed by integrating historical records from multiple investments, reducing reliance on expert judgment and improving probabilistic precision in estimating impact coefficients; institutional risk-recording systems would also enable future national and international comparative studies. Third, macroeconomic variables and external scenarios should be incorporated into the probabilistic models to simulate stress conditions—such as material-market volatility, logistics disruptions, or environmental shocks—thereby increasing the predictive value of the approach in changing contexts. Fourth, advanced data-analytics and machine-learning techniques (e.g., Bayesian models, neural networks, or evolutionary algorithms) could be explored to better estimate dynamic risks and detect non-obvious patterns not captured by traditional project data. Finally, the potential of the model to support strategic financing decisions should be examined, particularly the use of the recalculated maximum budget limit as an evidence-based tool for negotiation with investors, insurers, and financial institutions.
5.3. Managerial Implications
The findings of this study yield several managerial implications for executives, investing entities, planners, and project delivery teams, particularly in contexts characterized by limited resources and high risk exposure. The proposed methodology provides a practical decision-support tool that can strengthen strategic decision-making across multiple stages of the investment cycle by improving efficiency, financial foresight, and organizational responsiveness to unexpected events.
First, combining Frequency–Impact matrices with a quantitative risk impact coefficient enables managers to pinpoint which TEIs concentrate the highest vulnerabilities. This information is essential for prioritizing actions, allocating resources, and designing preventive measures before execution begins. As a result, managers can anticipate potential cost gaps and adjust financial plans using quantitative evidence rather than relying on generic criteria or tacit estimates.
Second, applying PERT and Monte Carlo simulations introduces a predictive perspective that supports the development of more realistic and robust budgets. The results indicate that contingency margins set by prevailing regulations may be insufficient to cover a project’s actual risk exposure. Using the proposed approach, decision-makers can define contingencies with explicit probability levels, thereby reducing financial uncertainty and lowering the likelihood of execution interruptions caused by budget shortfalls.
Beyond its project-level contribution, the findings also have implications for the policy and regulatory landscape governing heritage tourism construction projects in Cuba. The results suggest that, in rehabilitation projects characterized by high patrimonial value, technical uncertainty, and concentrated exposure across critical TEIs, uniform or weakly differentiated contingency margins may be insufficient to absorb the real variability observed during execution. This is particularly relevant within the Cuban investment framework, where the approved maximum budget limit and its admissible deviation play a central role in project authorization and control. From this perspective, the proposed risk-based procedure can support a more evidence-based determination of contingency allowances, improve the technical justification of budget revisions, and encourage more differentiated regulatory treatment between conventional construction projects and heritage tourism rehabilitation investments. More broadly, the study indicates that risk-informed budgeting should be incorporated earlier in the investment process, not only as an execution-control mechanism but also as a support tool for appraisal, approval, and oversight decisions in projects where budget instability may affect both financial performance and the preservation of patrimonial assets.
The methodology also highlights the importance of establishing a multidisciplinary Risk Working Group capable of continuously monitoring the behavior of identified factors. Traditional practice often assigns risk responsibility to a single unit; however, the evidence underscores the need for cross-functional risk governance involving technical, economic, legal, and logistics specialists. This not only improves the quality of assessment but also accelerates response capacity when project conditions or the external environment change.
More broadly, the findings suggest that mainstreaming risk-based approaches in the Cuban construction industry depends not only on technical tools but also on stronger stakeholder collaboration and greater risk awareness across the project network. In practice, heritage tourism investments involve the interaction of designers, contractors, suppliers, control entities, investors, local authorities, and, in many cases, institutions responsible for heritage protection and tourism operation. Under these conditions, risk management cannot remain confined to a specialized technical exercise or to a single organizational unit. Instead, it should be embedded in a network-governance logic that promotes information sharing, coordinated monitoring, and joint interpretation of emerging risks across the investment life cycle. In the Cuban context, this implies fostering a culture of anticipatory risk awareness, strengthening inter-organizational communication routines, and creating collaborative decision spaces in which technical, financial, regulatory, and operational actors can align mitigation responses in a timely manner. Such collaboration is essential to transforming the proposed methodology from a one-off analytical tool into a repeatable governance practice that improves budget reliability and execution performance across the sector.
Another key implication is the need to adopt systematic risk-recording systems—a practice that remains limited in Cuba and the broader Latin American context. Historical risk databases can improve the accuracy of future estimates, reduce dependence on expert judgment, and professionalize risk management within investing organizations. Institutions that implement such records can shift from reactive management to proactive, evidence-based management grounded in observed patterns and accumulated empirical experience.
A further managerial implication concerns the progressive digitization and partial automation of the workflow proposed in this study. In practical terms, the procedure could evolve from an expert-driven and spreadsheet-supported exercise into an integrated digital decision-support routine based on structured risk registers, project-level cost databases organized by TEI, standardized electronic templates for Frequency–Impact scoring, and simulation tools for probabilistic budget updating. Such digitization would improve traceability, reduce transcription and consolidation errors, accelerate scenario re-estimation, and strengthen institutional memory across projects. In the Cuban context, however, this transition must be approached realistically. Important constraints include heterogeneous digital maturity across investment entities, limited interoperability between technical and economic records, restricted access to specialized software, and continued dependence on tacit expert knowledge when historical datasets remain incomplete. For this reason, a phased implementation strategy is advisable: first, standardize electronic risk records and coding criteria across projects; second, consolidate institutional databases of recurring risks and observed cost deviations; third, train multidisciplinary teams in digital risk analysis; and, only then, scale to more automated analytics and advanced forecasting tools. Under these conditions, digitization should be understood not as a full replacement of expert judgment, but as a mechanism to make that judgment more traceable, comparable, and operationally useful for risk-informed budgeting in Cuban construction projects.
The results further show that the recalculated total cost remains highly correlated with the initial cost structure. This implies that managers can treat the budget structure as a reliable “map” for intervention planning, focusing attention on critical TEIs without the need to redesign the entire economic model. Such structural stability supports more efficient resource allocation and strengthens negotiation with suppliers, contractors, and financial stakeholders.
Finally, the methodology has direct implications for strategic financial management. Recalculated total-cost values provide a stronger basis to justify additional funding needs to higher-level authorities, investors, or financing institutions. This enhances transparency in the investment process and improves decision quality at key points of the project life cycle.
In summary, the proposed methodology contributes not only a technical procedure for cost and risk estimation but also a shift toward more informed, preventive management aligned with internationally recognized risk-analysis principles. Its implementation can increase economic efficiency, reduce cost overruns, and improve the overall quality and reliability of construction investments.
6. Conclusions
This study quantified the impact of risk factors on construction investment costs and estimated an updated maximum project budget at a defined confidence level using an integrated expert-based and probabilistic approach. Applied to the Esmeralda Hotel project, the proposed procedure enabled the systematic assessment of the risk factors affecting the technical–economic indicators (TEIs) and the recalculation of the maximum budget limit based on probabilistic parameters rather than solely on regulatory assumptions.
From a theoretical perspective, the study contributes to construction investment risk management by proposing an integrated procedure that links qualitative risk identification with quantitative cost adjustment. The combined use of Frequency–Impact matrices, weighted coefficients, and PERT/Monte Carlo simulation provides a structured framework for analyzing how identified risk factors translate into cost deviations for specific technical–economic indicators. A relevant finding is the very high correlation between the initial TEI structure and the recalculated cost distribution, suggesting that risk materialization mainly affects cost magnitude while broadly preserving the relative distribution of costs across the evaluated budget components.
From a practical perspective, the results indicate that most of the gap between estimated and actual costs is driven by the cumulative effect of high-priority risks, particularly those associated with technically complex work packages, such as civil construction, assembly, furniture, and technological equipment. The proposed procedure helps identify the budget components with the greatest risk exposure and estimate the additional financial margin required to achieve a specified confidence level for project execution. The findings also suggest that contingency margins established by prevailing regulations may be insufficient in volatile construction environments, particularly in heritage and tourism projects. In this sense, the methodology supports more realistic financial planning, prioritization of mitigation, and organizational learning through the systematic documentation of recurring risk patterns.
This study has several limitations. First, the methodology was illustrated through a single case-study application, which limits the generalizability of the empirical findings. Second, the probabilistic simulation was implemented under the assumption of independence among the evaluated cost components, without explicitly modeling correlation structures that may affect tail-risk behavior. Third, the scenario inputs used in the PERT distributions were based on structured expert judgment supported by comparable prior projects, which may be sensitive to expert calibration and data availability.
Future research could apply this approach to multiple construction projects with different technical and contractual characteristics, incorporate dependency structures among cost components, and evaluate alternative probabilistic parameterizations. Additional work could also use historical project databases to strengthen the calibration of risk distributions and to examine the applicability of the procedure to other types of investment projects beyond the heritage and tourism context analyzed here.
Overall, the study shows that the combination of qualitative techniques, weighted scaling, and probabilistic simulation constitutes a robust framework for cost-gap analysis under uncertainty and can support stronger financial and operational management of construction projects in contexts with constrained data availability and limited allowable error margins.






 ,
,