How Does the Built Environment Shape Low-Carbon Consumption in an Energy-Based City? A GIS–SEM Study of Ordos, China
 , , ,
, , ,
Abstract
1. Introduction
1.1. Background and Problem Statement
1.2. Research Objectives
2. Literature Review, Theoretical Framework, and Research Gap
2.1. Built Environment, Perception, and Behavioral Translation
2.2. Why Mechanisms Differ in Energy-Based Cities
2.3. Research Gap and Hypotheses
3. Study Area and Data
3.1. Study Area: Ordos as a Theoretically Relevant Energy-Based City
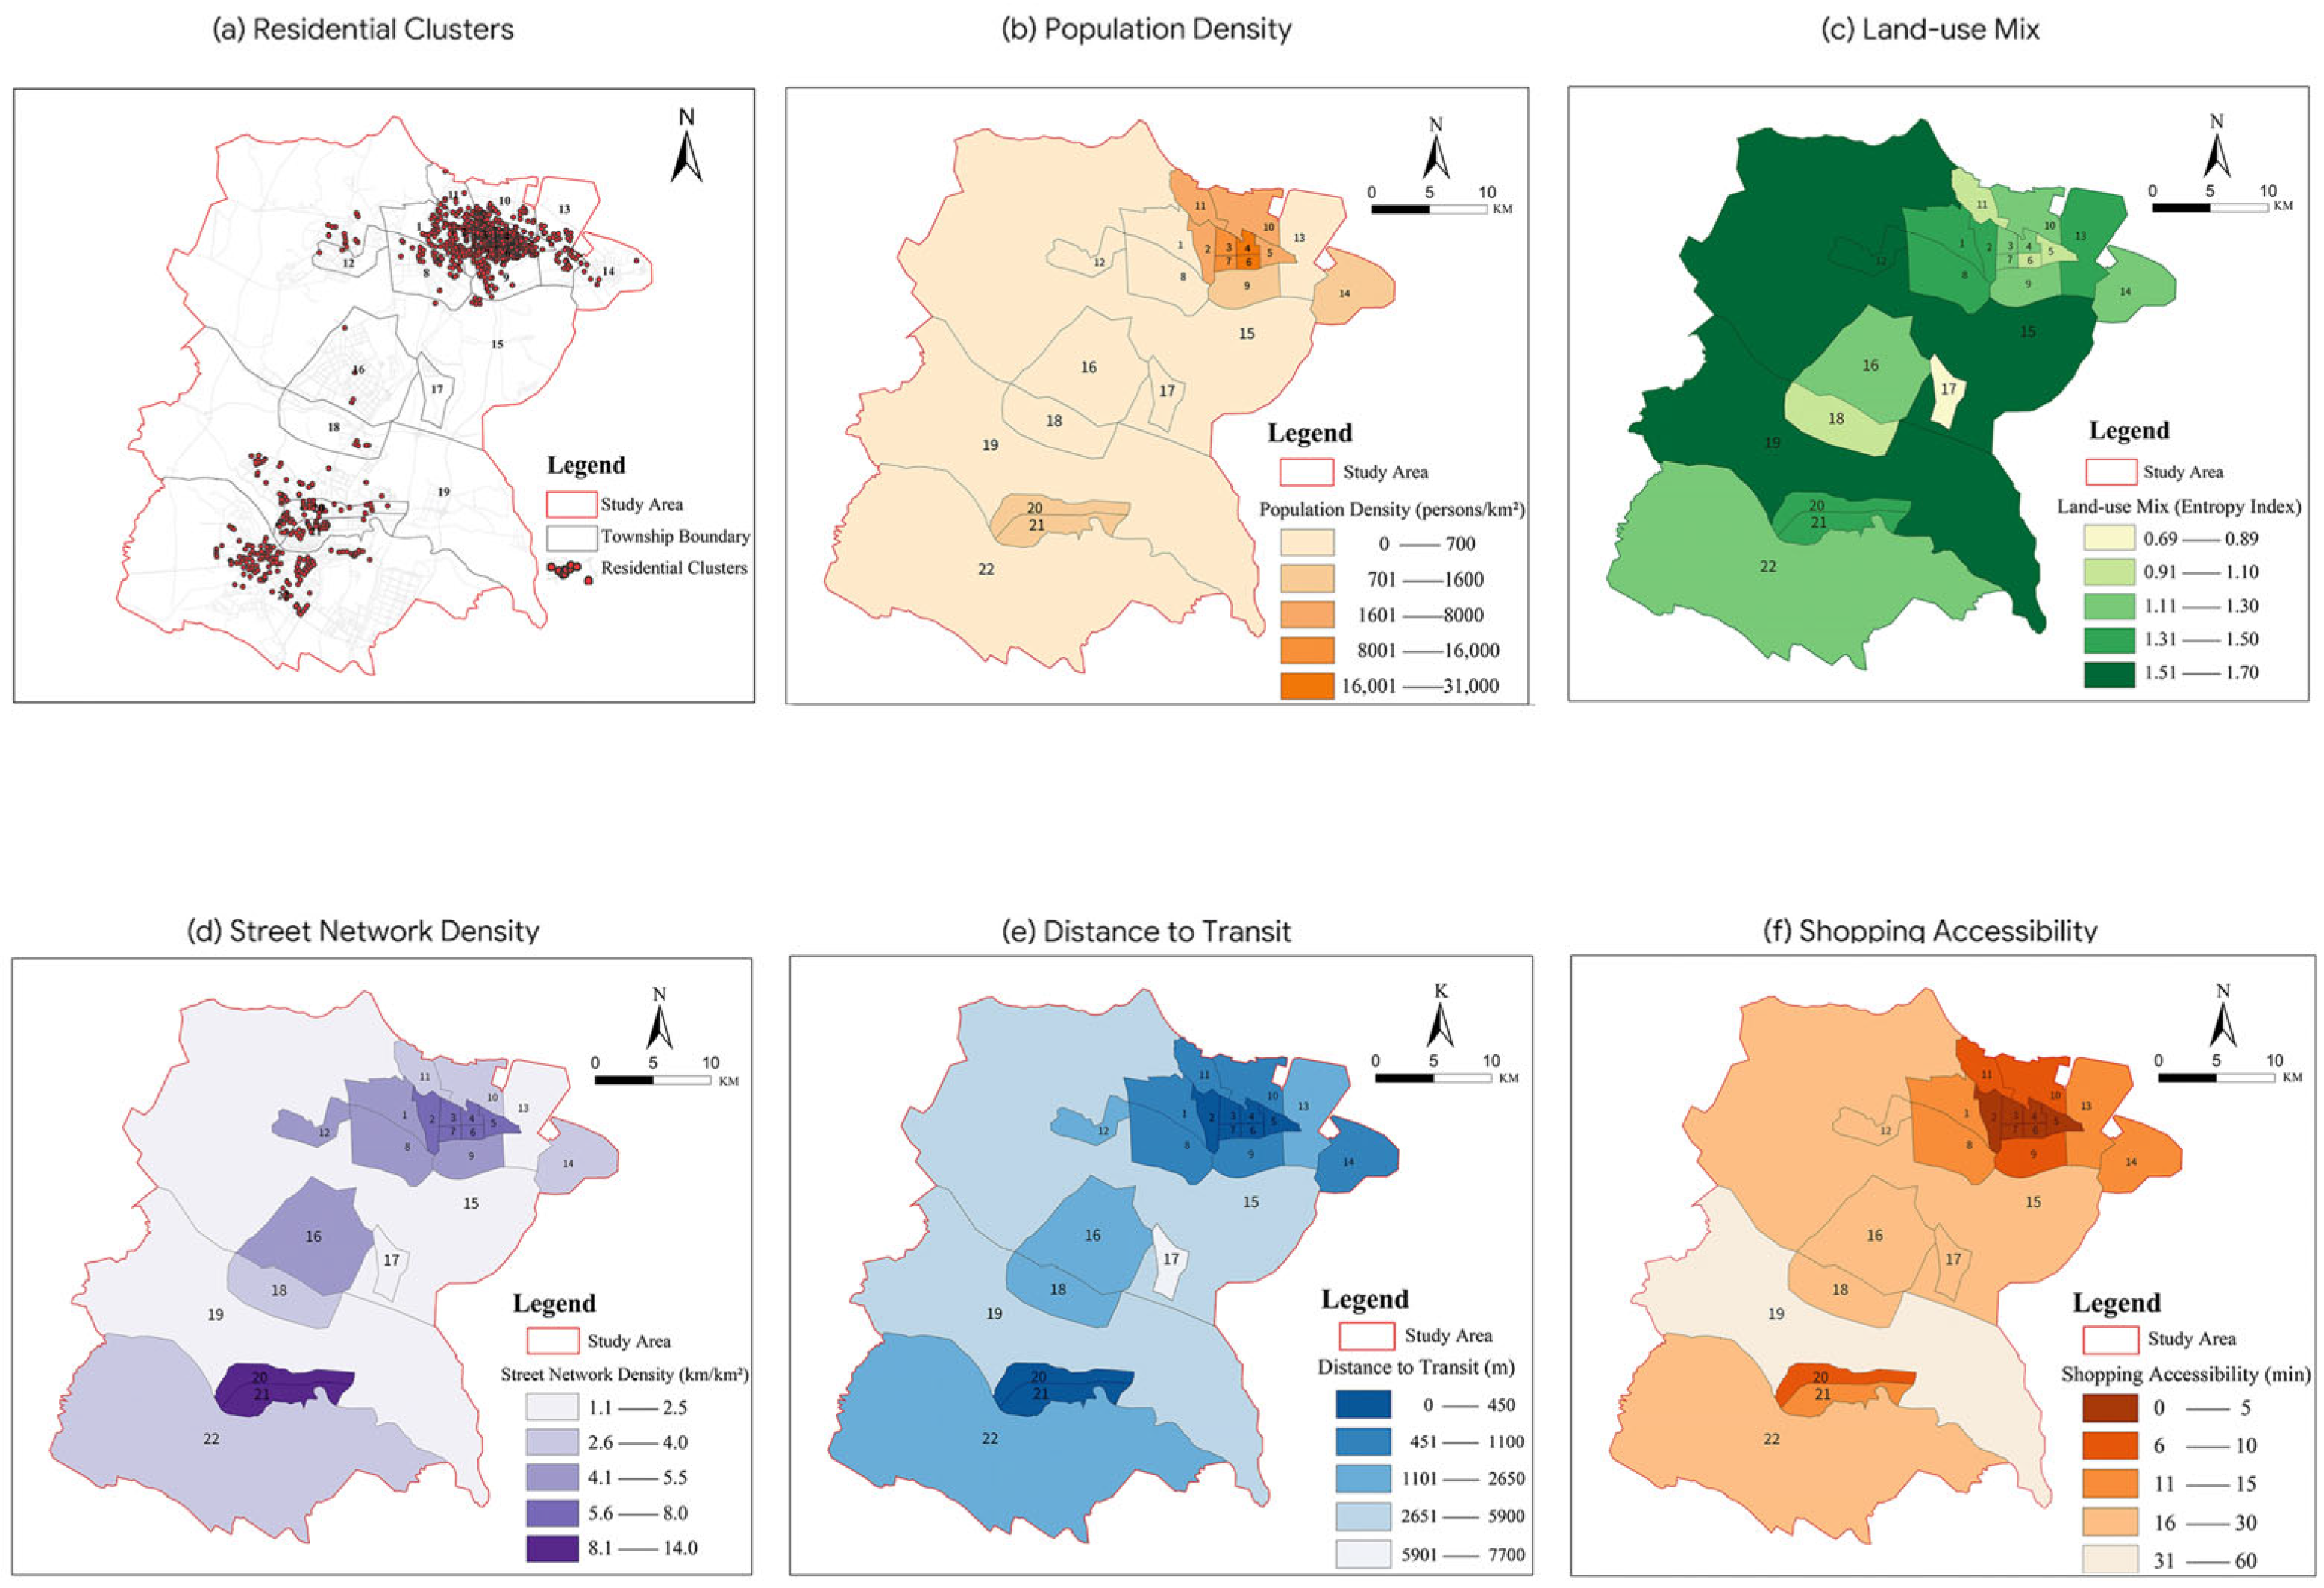
3.2. Data Sources, Sample, and GIS–Survey Fusion
3.3. Variable Measurement and Indicator Selection
4. Methodology
4.1. Workflow and SEM-Based Analytical Strategy
4.2. Model Specification
4.3. Bootstrap Inference and Effect Decomposition
5. Results
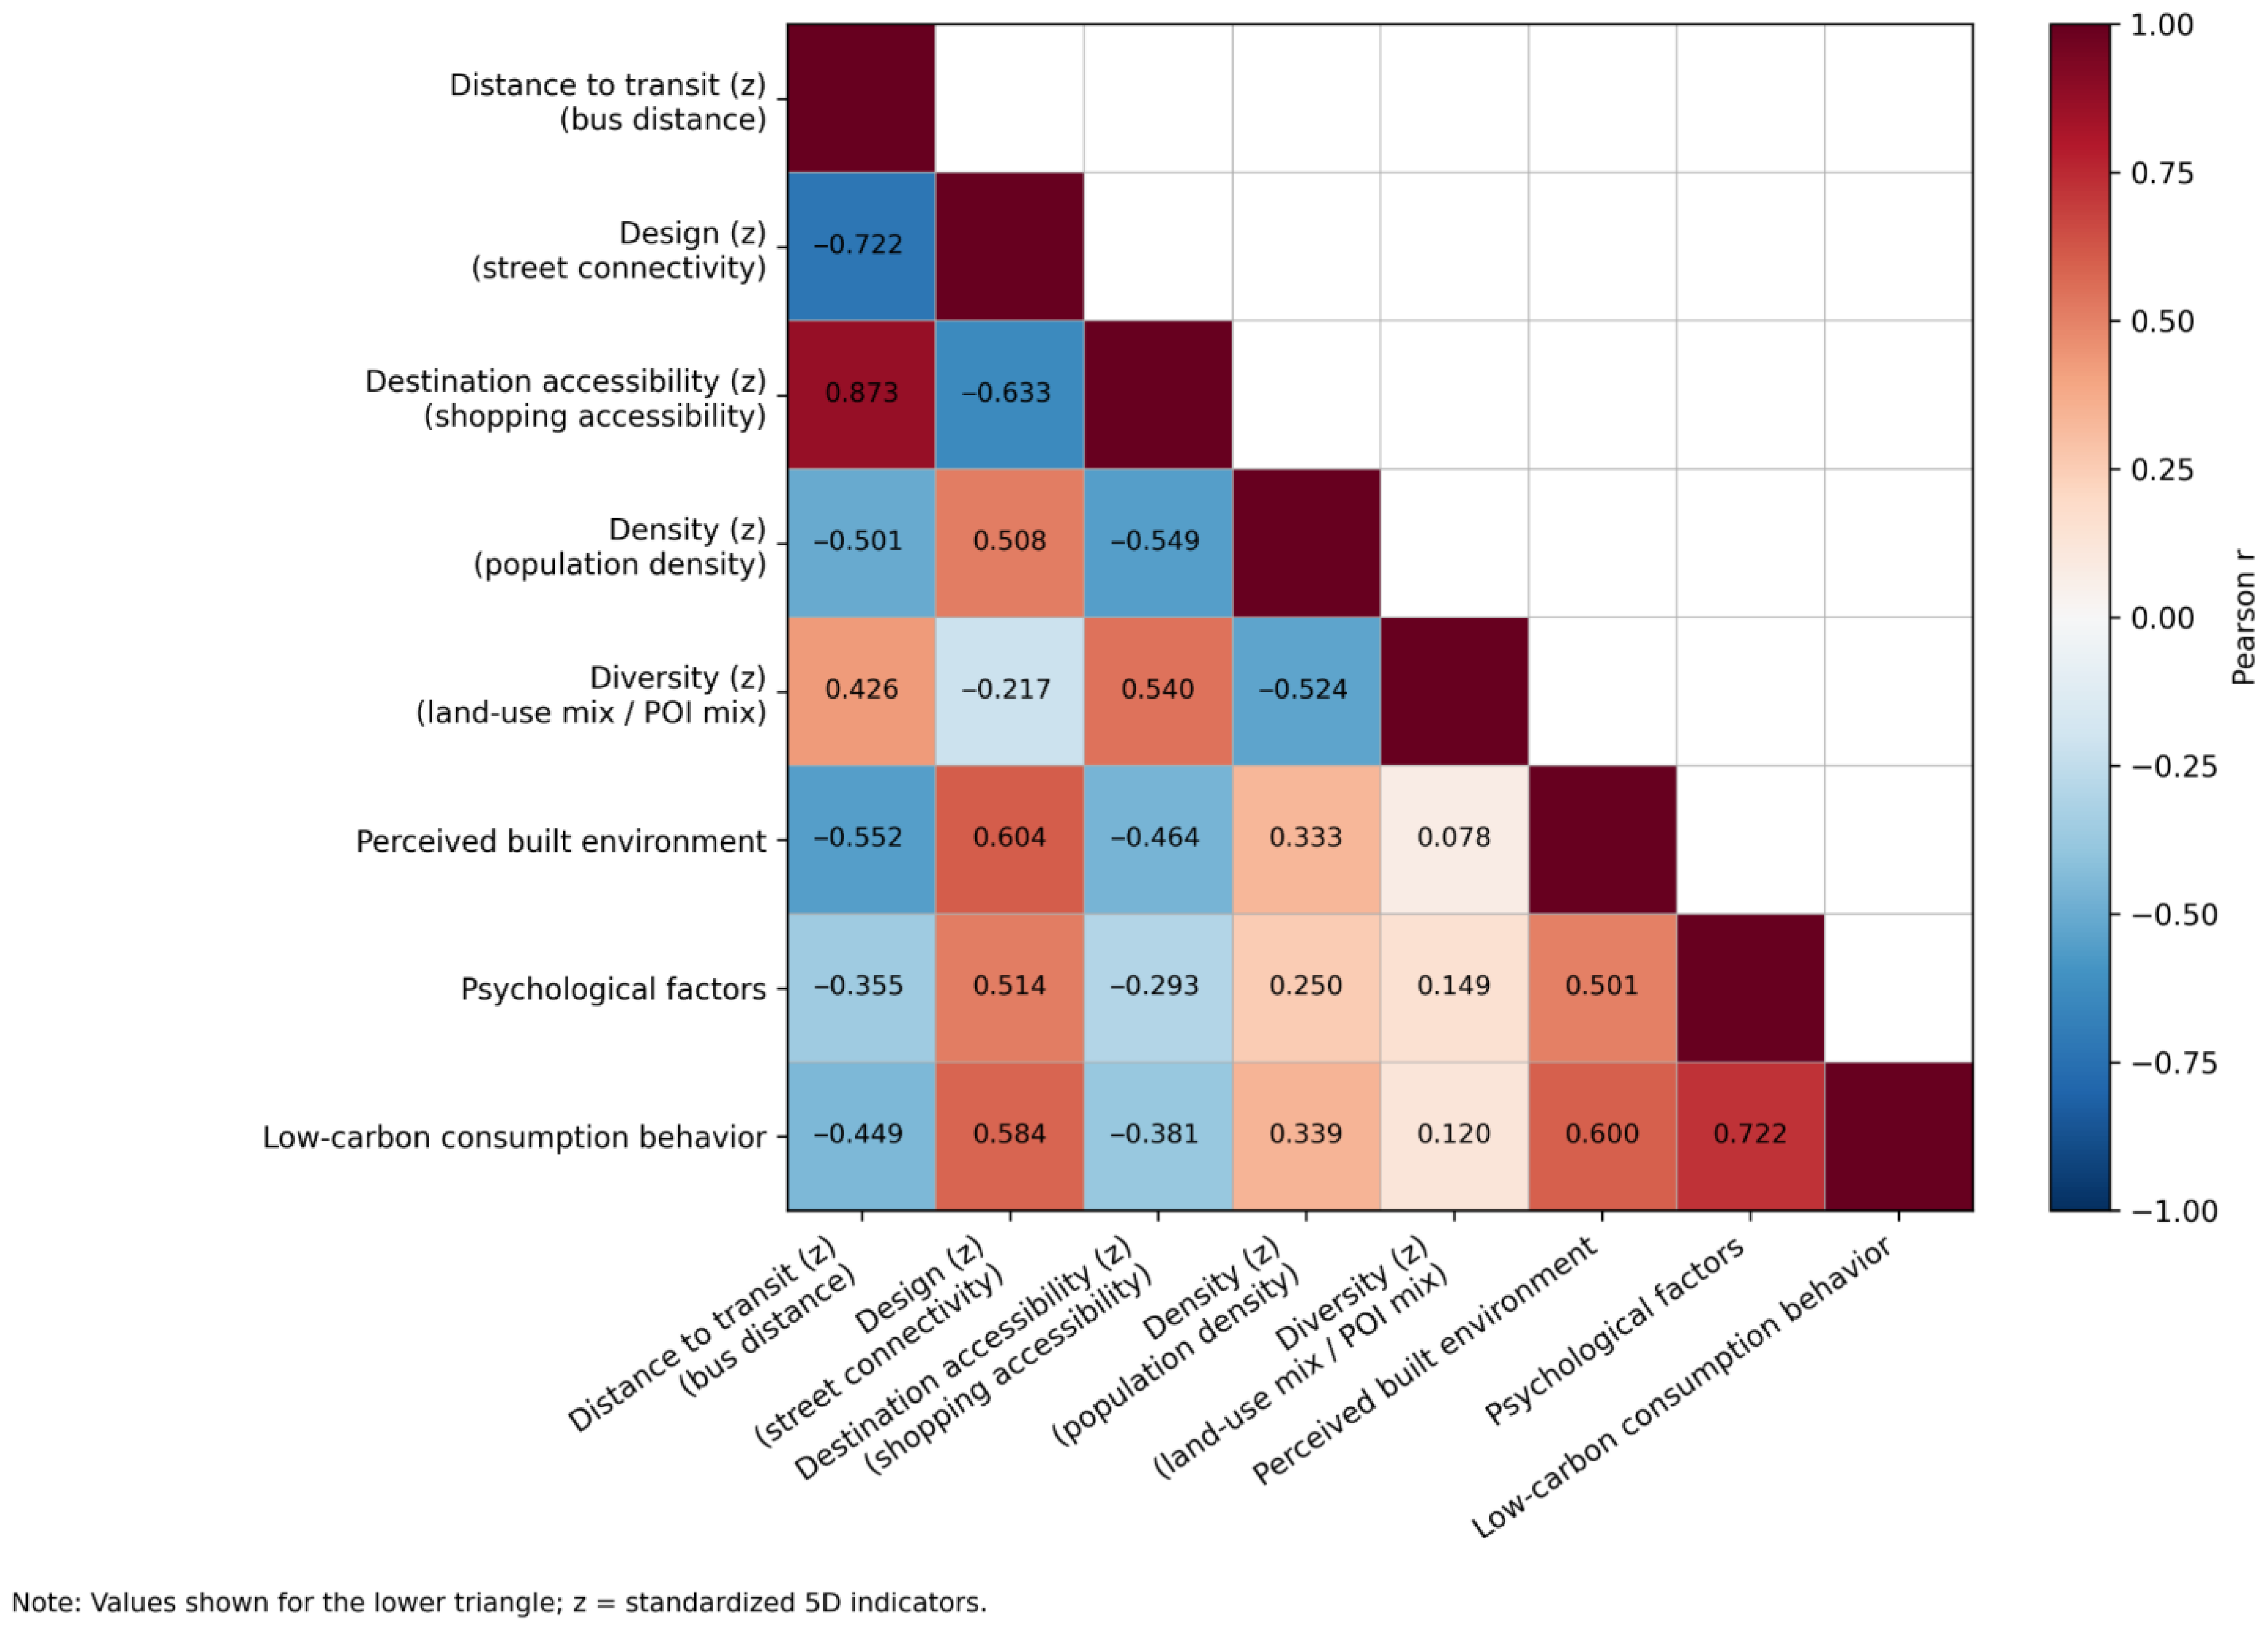
5.1. Descriptive Statistics and Correlations
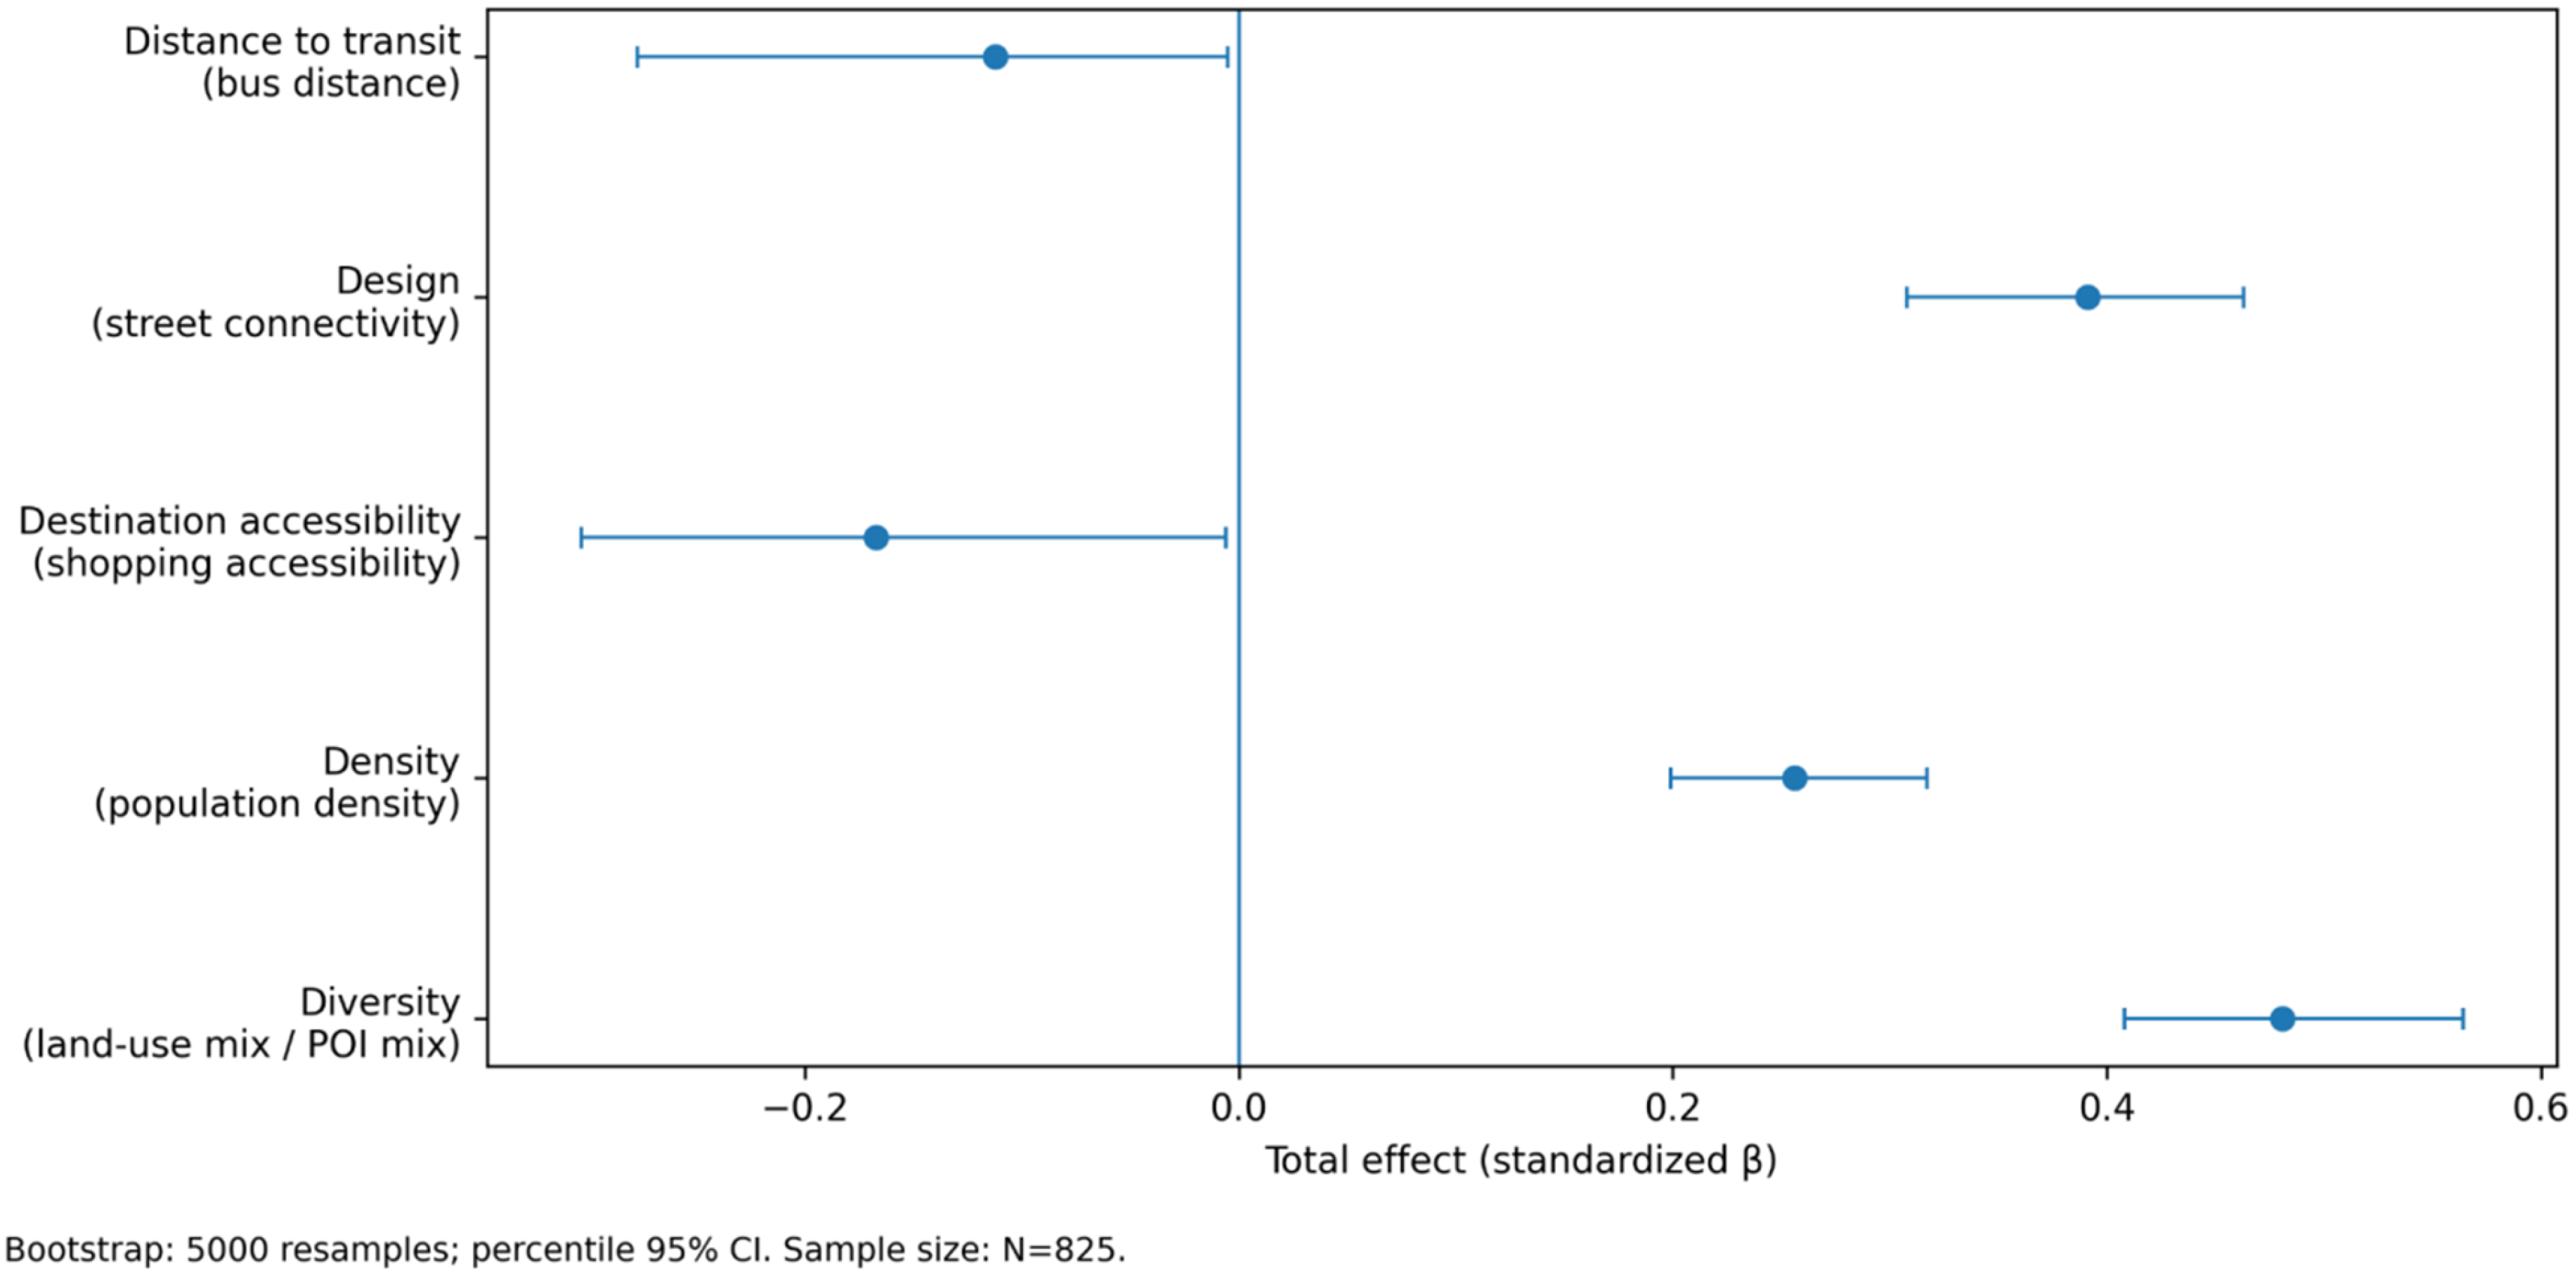
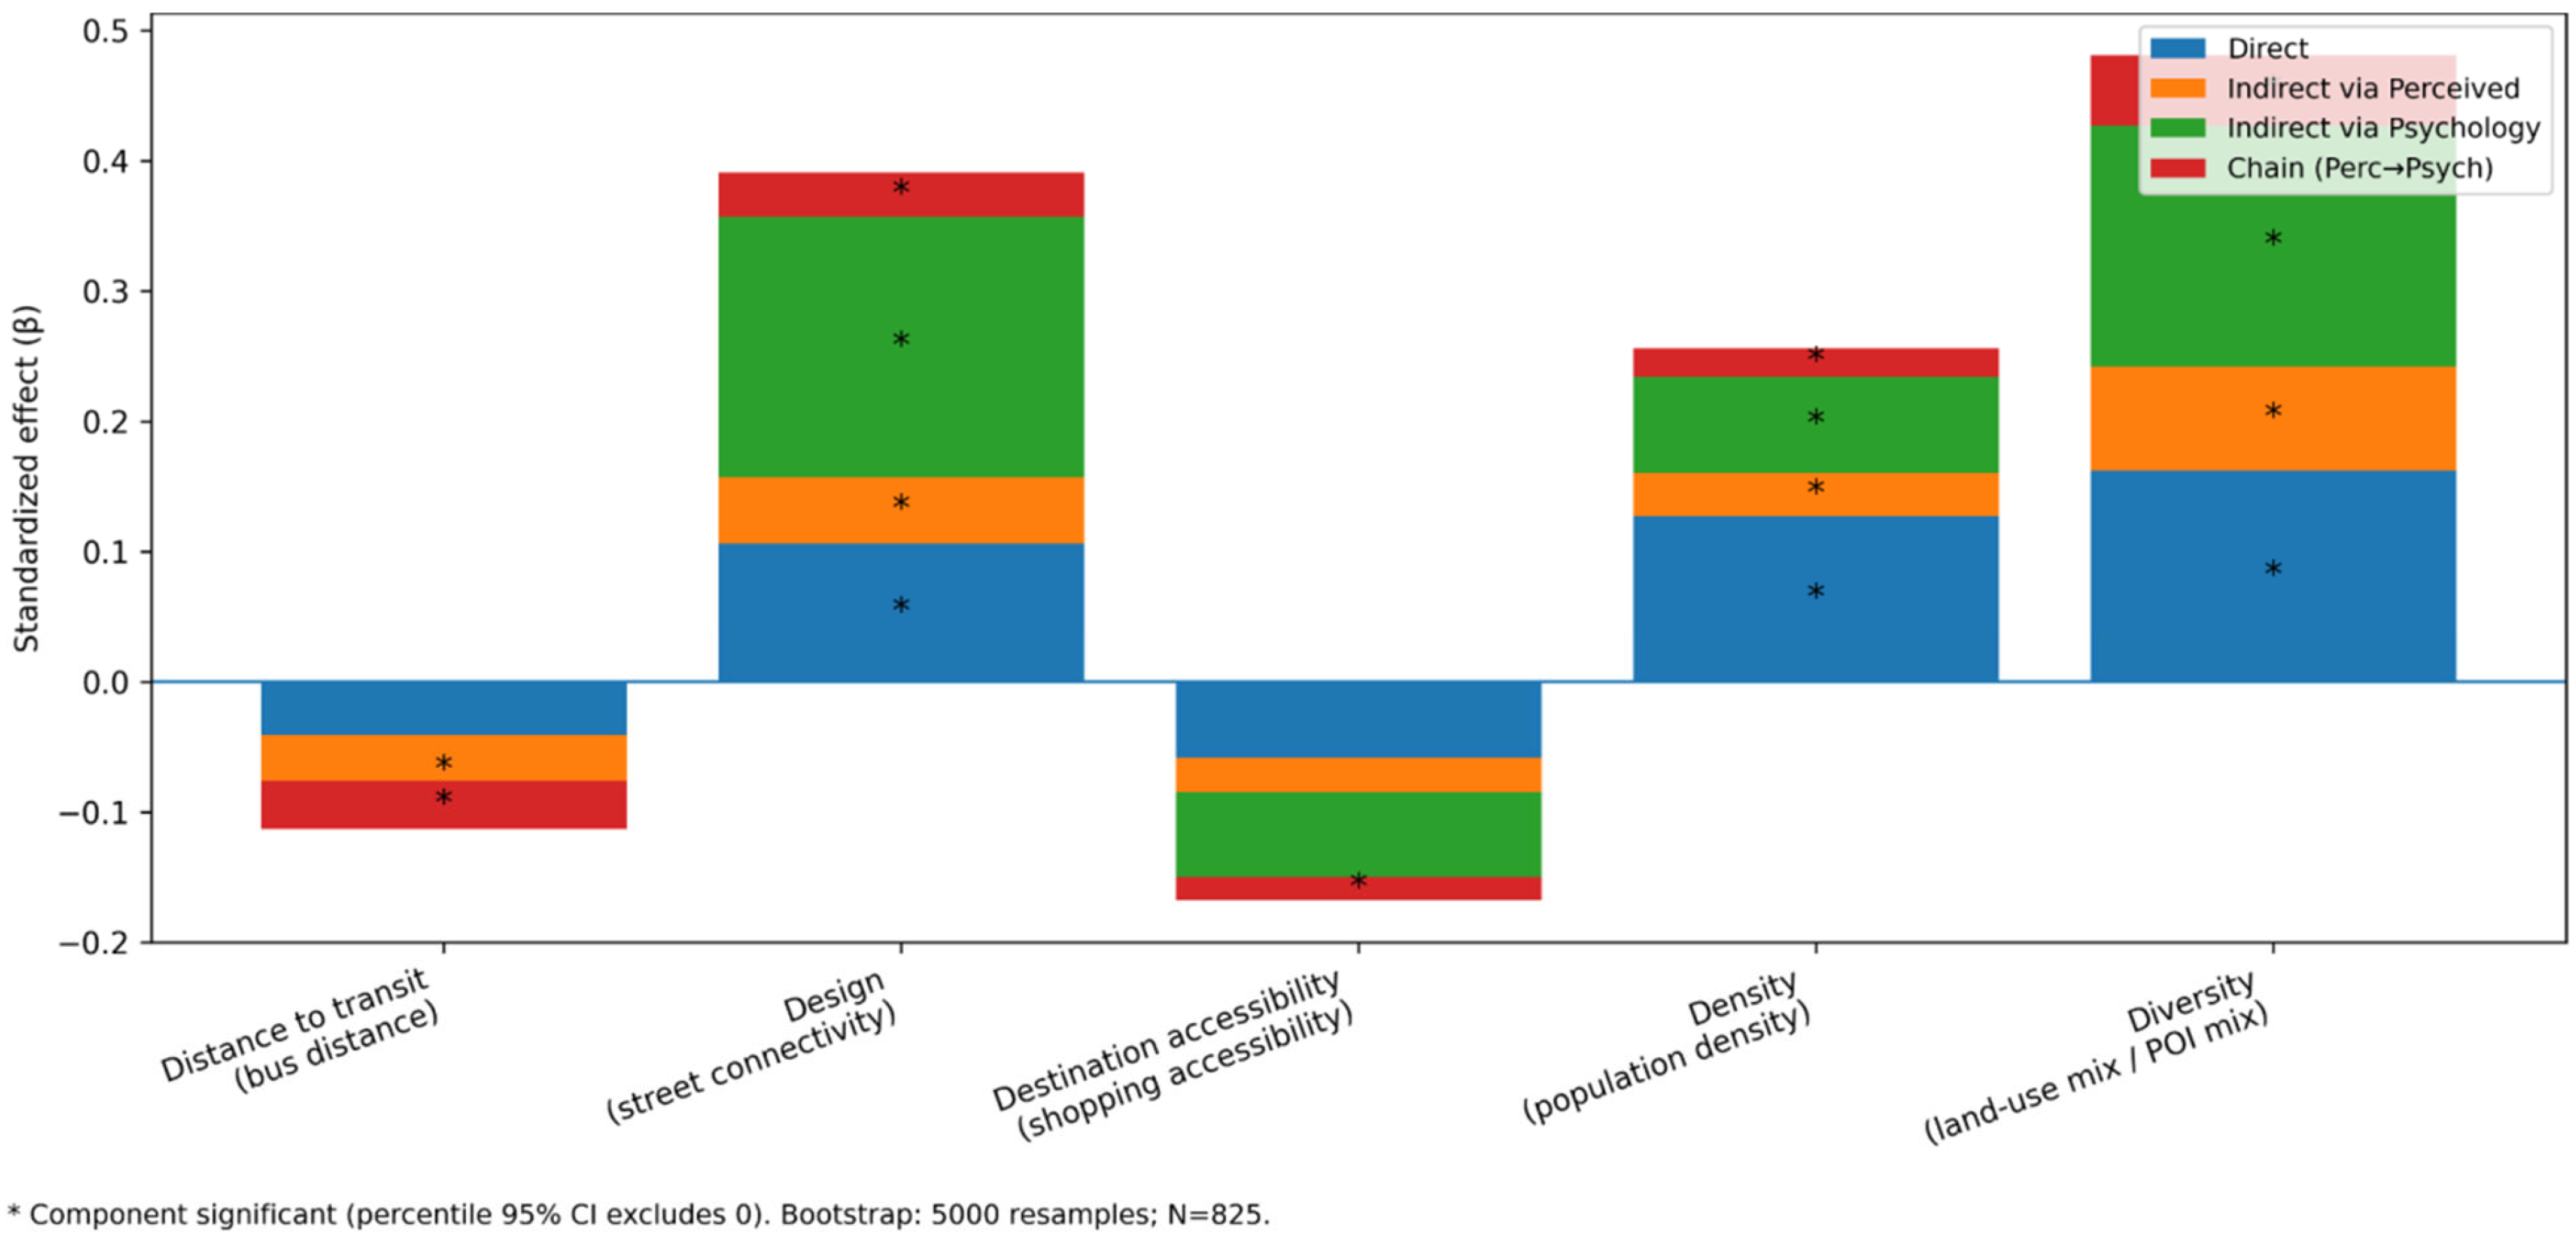
5.2. Decomposition of Effects and Hypothesis Testing
6. Discussion
6.1. Translating the SEM Results into Neighborhood Design Conditions
6.2. Dialogue with Existing Studies: Design Implications for Energy-Based Cities
6.3. Methodological Implications
6.4. Limitations
7. Design and Planning Implications for Neighborhood-Scale Low-Carbon Consumption
7.1. Peripheral Neighborhood Accessibility and Service-Node Design (For Full-Mediation Barriers)
- (1)
- Demand-responsive transit (DRT) embedded in neighborhood structure: In low-density peripheral towns, app-based on-demand minibuses can complement fixed-route services, but their effectiveness depends on spatial integration. Priority should be given to stop placement near neighborhood anchors (e.g., community centers, schools, clinics, and local retail clusters), short and legible walking approaches, sheltered waiting areas, and clear transfer points. These design features can reduce both actual and perceived last-mile burden.
- (2)
- Hybrid service nodes and service clustering: Co-locating basic retail, public services, and pickup/drop-off functions around key facilities can reduce multi-purpose trip costs and support trip chaining. From a spatial-layout perspective, this implies designing neighborhood-scale nodes with sufficient service mix and walkable catchments, rather than distributing single-purpose facilities in a fragmented pattern. In contexts with weak shopping accessibility, service clustering is likely to improve perceived convenience more effectively than isolated facility additions.
- (3)
- Pilot-based corridor and node retrofits: Under fiscal constraints, energy-based cities can prioritize small-scale upgrades around selected corridors and neighborhood nodes (e.g., access routes to transit stops, community-service clusters, and local centers). Pilot-first implementation allows planners to test how changes in route continuity, node usability, and layout quality affect perceived accessibility and behavior before wider rollout.
7.2. Core-Area Connectivity and Urban Design Quality Upgrades (For Partial-Mediation Advantages)
- (1)
- Fifteen-minute living circles through layout optimization: In core and semi-core districts, the priority is not only to maintain relatively high density, but also to optimize the spatial arrangement of daily destinations so that residents can complete routine errands through short, connected trips. This includes improving the placement and complementarity of grocery, public service, leisure, and community facilities within walkable catchments.
- (2)
- Connectivity quality, not connectivity quantity alone: Since street connectivity shows a strong total effect, network improvements should focus on route continuity and intersection permeability while also addressing usability. In practice, this means reducing detours, improving crossing quality, strengthening sidewalk continuity, and minimizing barriers that make connected networks difficult to navigate on foot.
- (3)
- Urban design quality to support perceived walkability: The mediation results indicate that perception remains important even in structurally advantaged areas. Core-area upgrades should therefore include comfort- and legibility-oriented design elements, such as pavement continuity, lighting, wayfinding cues, shaded/sheltered walking and waiting spaces, and climate-responsive design (including wind and winter comfort where relevant). These measures help convert objective connectivity and service density into stable low-carbon routines.
7.3. Perception-Supportive Soft Interventions Embedded in Everyday Spaces
8. Conclusions
Supplementary Materials
Author Contributions
Funding
Institutional Review Board Statement
Informed Consent Statement
Data Availability Statement
Conflicts of Interest
Abbreviations
| 5D | Five dimensions of the built environment (density, diversity, design, distance to transit, and destination accessibility) |
| AGFI | Adjusted goodness-of-fit index |
| AVE | Average variance extracted |
| BE | Built environment |
| CFA | Confirmatory factor analysis |
| CFI | Comparative fit index |
| CR | Composite reliability |
| DRT | Demand-responsive transit |
| GIS | Geographic information system |
| GTFS | General Transit Feed Specification |
| HTMT | Heterotrait–monotrait ratio |
| IFI | Incremental fit index |
| NFI | Normed fit index |
| OSM | OpenStreetMap |
| POI | Point of interest |
| RMB | Renminbi |
| RMSEA | Root mean square error of approximation |
| SEM | Structural equation modeling |
| SI | Supplementary information |
| TLI | Tucker–Lewis index |
| TPB | Theory of planned behavior |
| VIF | Variance inflation factor |
References
- Cervero, R.; Kockelman, K. Travel demand and the 3Ds: Density, diversity, and design. Transp. Res. Part D Transp. Environ. 1997, 2, 199–219. [Google Scholar] [CrossRef]
- Ewing, R.; Cervero, R. Travel and the built environment: A meta-analysis. J. Am. Plan. Assoc. 2010, 76, 265–294. [Google Scholar] [CrossRef]
- Song, S.; Diao, M.; Feng, C.C. Individual transport emissions and the built environment: A structural equation modelling approach. Transp. Res. Part A Policy Pract. 2016, 92, 206–219. [Google Scholar] [CrossRef]
- Zhang, M. The role of land use in travel mode choice: Evidence from Boston and Hong Kong. J. Am. Plan. Assoc. 2004, 70, 344–360. [Google Scholar] [CrossRef]
- Cervero, R.; Murakami, J. Rail + property development in Hong Kong: Experiences and extensions. Urban Stud. 2009, 46, 2019–2043. [Google Scholar] [CrossRef]
- Frank, L.D.; Sallis, J.F.; Conway, T.L.; Chapman, J.E.; Saelens, B.E.; Bachman, W. Many pathways from land use to health: Associations between neighborhood walkability and active transportation, body mass index, and air quality. J. Am. Plan. Assoc. 2006, 72, 75–87. [Google Scholar] [CrossRef]
- Handy, S.L.; Boarnet, M.G.; Ewing, R.; Killingsworth, R.E. How the built environment affects physical activity: Views from urban planning. Am. J. Prev. Med. 2002, 23, 64–73. [Google Scholar] [CrossRef]
- McCormack, G.R.; Shiell, A. In search of causality: A systematic review of the relationship between the built environment and physical activity among adults. Int. J. Behav. Nutr. Phys. Act. 2011, 8, 125. [Google Scholar] [CrossRef]
- Ma, L.; Cao, J. How perceptions mediate the effects of the built environment on travel behavior? Transportation 2019, 46, 175–197. [Google Scholar] [CrossRef]
- Ewing, R.; Hajrasouliha, A.; Neckerman, K.M.; Purciel-Hill, M.; Greene, W. Streetscape features related to pedestrian activity. J. Plan. Educ. Res. 2016, 36, 5–15. [Google Scholar] [CrossRef]
- Jacobs, J. The Death and Life of Great American Cities; Random House: New York, NY, USA, 1961. [Google Scholar]
- Gehl, J. Cities for People; Island Press: Washington, DC, USA, 2010. [Google Scholar]
- Speck, J. Walkable City: How Downtown Can Save America, One Step at a Time; Farrar, Straus and Giroux: New York, NY, USA, 2012. [Google Scholar]
- Lynch, K. The Image of the City; MIT Press: Cambridge, MA, USA, 1960. [Google Scholar]
- Carlson, S.A.; Whitfield, G.P.; Davis, R.T.; Peterson, E.L.; Fulton, J.E.; Berrigan, D. Associations between Perceptions and Measures of Weather and Walking, United States—2015. Int. J. Environ. Res. Public Health 2021, 18, 8398. [Google Scholar] [CrossRef] [PubMed]
- Vasilikou, C.; Nikolopoulou, M. Outdoor thermal comfort for pedestrians in movement: Thermal walks in complex urban morphology. Int. J. Biometeorol. 2020, 64, 277–291. [Google Scholar] [CrossRef] [PubMed]
- Unruh, G.C. Understanding carbon lock-in. Energy Policy 2000, 28, 817–830. [Google Scholar] [CrossRef]
- Seto, K.C.; Davis, S.J.; Mitchell, R.B.; Stokes, E.C.; Unruh, G.; Ürge-Vorsatz, D. Carbon lock-in: Types, causes, and policy implications. Annu. Rev. Environ. Resour. 2016, 41, 425–452. [Google Scholar] [CrossRef]
- Huang, H.; Shi, C. Analysis of the path optimization of the sustainable development of coal-energy cities based on TOPSIS evaluation model. Energies 2023, 16, 857. [Google Scholar] [CrossRef]
- Zhang, J.; Zhang, L.; Qin, Y.; Wang, X. Influence of the built environment on urban residential low-carbon cognition in Zhengzhou, China. J. Clean. Prod. 2020, 271, 122429. [Google Scholar] [CrossRef]
- Li, Y.; Ye, J.; Li, Z.; Zhu, M.; Li, Y. Impact of built environment on commuting carbon emissions using big data: A case study of Jinan’s main urban area. Sci. Rep. 2025, 15, 16875. [Google Scholar] [CrossRef]
- Zhao, C.; Tang, J.; Kong, X.; Yu, T.; Li, Z. Emission analysis of multi-mode public transportation based on joint choice model considering built environment factors. Energy 2024, 309, 133101. [Google Scholar] [CrossRef]
- Jiang, Y.; Motose, R.; Ihara, T. Estimating the carbon footprint of household activities in Japan from the time-use perspective. Environ. Sci. Pollut. Res. 2022, 30, 22343–22374. [Google Scholar] [CrossRef]
- Steg, L.; Vlek, C. Encouraging pro-environmental behaviour: An integrative review and research agenda. J. Environ. Psychol. 2009, 29, 309–317. [Google Scholar] [CrossRef]
- Bamberg, S.; Möser, G. Twenty years after Hines, Hungerford, and Tomera: A new meta-analysis of psycho-social determinants of pro-environmental behaviour. J. Environ. Psychol. 2007, 27, 14–25. [Google Scholar] [CrossRef]
- Ajzen, I. The theory of planned behavior. Organ. Behav. Hum. Decis. Process. 1991, 50, 179–211. [Google Scholar] [CrossRef]
- Fielding, K.S.; McDonald, R.; Louis, W.R. Theory of planned behaviour, identity and intentions to engage in environmental action. J. Environ. Psychol. 2008, 28, 318–326. [Google Scholar] [CrossRef]
- Kaida, N.; Kaida, K. Pro-environmental behavior correlates with present and future subjective well-being. Environ. Dev. Sustain. 2016, 18, 111–127. [Google Scholar] [CrossRef]
- Gardner, B. Modelling motivation and habit in stable travel mode contexts. Transp. Res. Part F Traffic Psychol. Behav. 2009, 12, 68–76. [Google Scholar] [CrossRef]
- Verplanken, B.; Walker, I.; Davis, A.; Jurasek, M. Context change and travel mode choice: Combining the habit discontinuity and self-activation hypotheses. J. Environ. Psychol. 2008, 28, 121–127. [Google Scholar] [CrossRef]
- Steg, L. Car use: Lust and must. Transp. Res. Part A Policy Pract. 2005, 39, 147–162. [Google Scholar] [CrossRef]
- Cheng, X.; Long, R.; Wu, F.; Geng, J.; Yang, J. How social interaction shapes habitual and occasional low-carbon consumption behaviors: Evidence from ten cities in China. Renew. Sustain. Energy Rev. 2023, 182, 113387. [Google Scholar] [CrossRef]
- Zhang, D.; Shen, X.; Chen, W. The Influence of Social Embeddedness on Pro-Environmental Behavior of Community Residents in Giant Panda National Park. Land 2025, 14, 1844. [Google Scholar] [CrossRef]
- Lu, X.; Lu, Z.; Mao, J.; Sun, Z.; Cui, C.; Huang, Y.; Cao, K. Place attachment as an indicator of public participation in low-carbon community development: A case study of Beijing, China. Ecol. Indic. 2023, 154, 110658. [Google Scholar] [CrossRef]
- Yang, M.; Ren, G.; Guo, L. The Impact of Environmental Education on College Students’ Low-carbon Behaviour: A Chain Mediation Model Moderated by Prosocial Behaviour. Aust. J. Environ. Educ. 2025, 41, 1–16. [Google Scholar] [CrossRef]
- Hu, X.; Wu, C.; Wang, L. A study on the effects of virtual gaming environment stimuli on adolescents’ environmental awareness and behavior: The mediating role of environmental trust. Front. Psychol. 2025, 16, 1716373. [Google Scholar] [CrossRef] [PubMed]
- Xiong, W.; Liu, D.; Li, Z.; Wang, Q.; Yao, S. How Does Ant Forest Influence Low Carbon Consumption Behavior: An Analysis Based on the S-O-R Model. Sustainability 2024, 16, 1736. [Google Scholar] [CrossRef]
- Ding, C.; Ye, J.; Wu, X.; Zhang, R. Intelligence technologies and low-carbon consumption behavior: Evidence from Chinese app “Ant Forest”. Front. Environ. Sci. 2025, 13, 1596697. [Google Scholar] [CrossRef]
- Fu, D.; Shaharudin, M.S.; Huang, Y.; Chen, Y.; Wei, X.; Wei, B. Predicting Low-carbon Practice: Integrating SEM and Machine Learning Validation of Extended Norm Activation Model. In Proceedings of the 2025 2nd International Conference on Big Data and Digital Management; Association for Computing Machinery: New York, NY, USA, 2025; pp. 418–427. [Google Scholar] [CrossRef]
- Sörqvist, P.; Langeborg, L. Why people harm the environment although they try to treat it well: An evolutionary-cognitive perspective on climate compensation. Front. Psychol. 2019, 10, 348. [Google Scholar] [CrossRef]
- Hollan, J.; Hutchins, E.; Kirsh, D. Distributed cognition: Toward a new foundation for human-computer interaction research. ACM Trans. Comput.-Hum. Interact. 2000, 7, 174–196. [Google Scholar] [CrossRef]
- Liu, S.; Huang, G.; Wei, Y.; Qu, Z. Monitoring and assessing land use/cover change and ecosystem service value using multi-resolution remote sensing data at urban ecological zone. Sustainability 2022, 14, 11187. [Google Scholar] [CrossRef]
- Wei, B.; Shaharudin, M.S. Make every action count: Exploring the universe of low-carbon behavior research through TCCM framework. Carbon Manag. 2025, 16, 2603002. [Google Scholar] [CrossRef]
- Wu, X.; Zhao, J.; Li, S.; Cao, S.; Shi, Y.; He, M. Psychological mechanisms and configurational pathways of participation in personal transportation carbon trading: An environment–cognition–intention perspective. Front. Psychol. 2025, 16, 1677832. [Google Scholar] [CrossRef]
- Liu, Y.; Wang, S.; Xie, B. Evaluating the effects of public transport fare policy change together with built and non-built environment features on ridership: The case in South East Queensland, Australia. Transp. Policy 2019, 76, 78–89. [Google Scholar] [CrossRef]
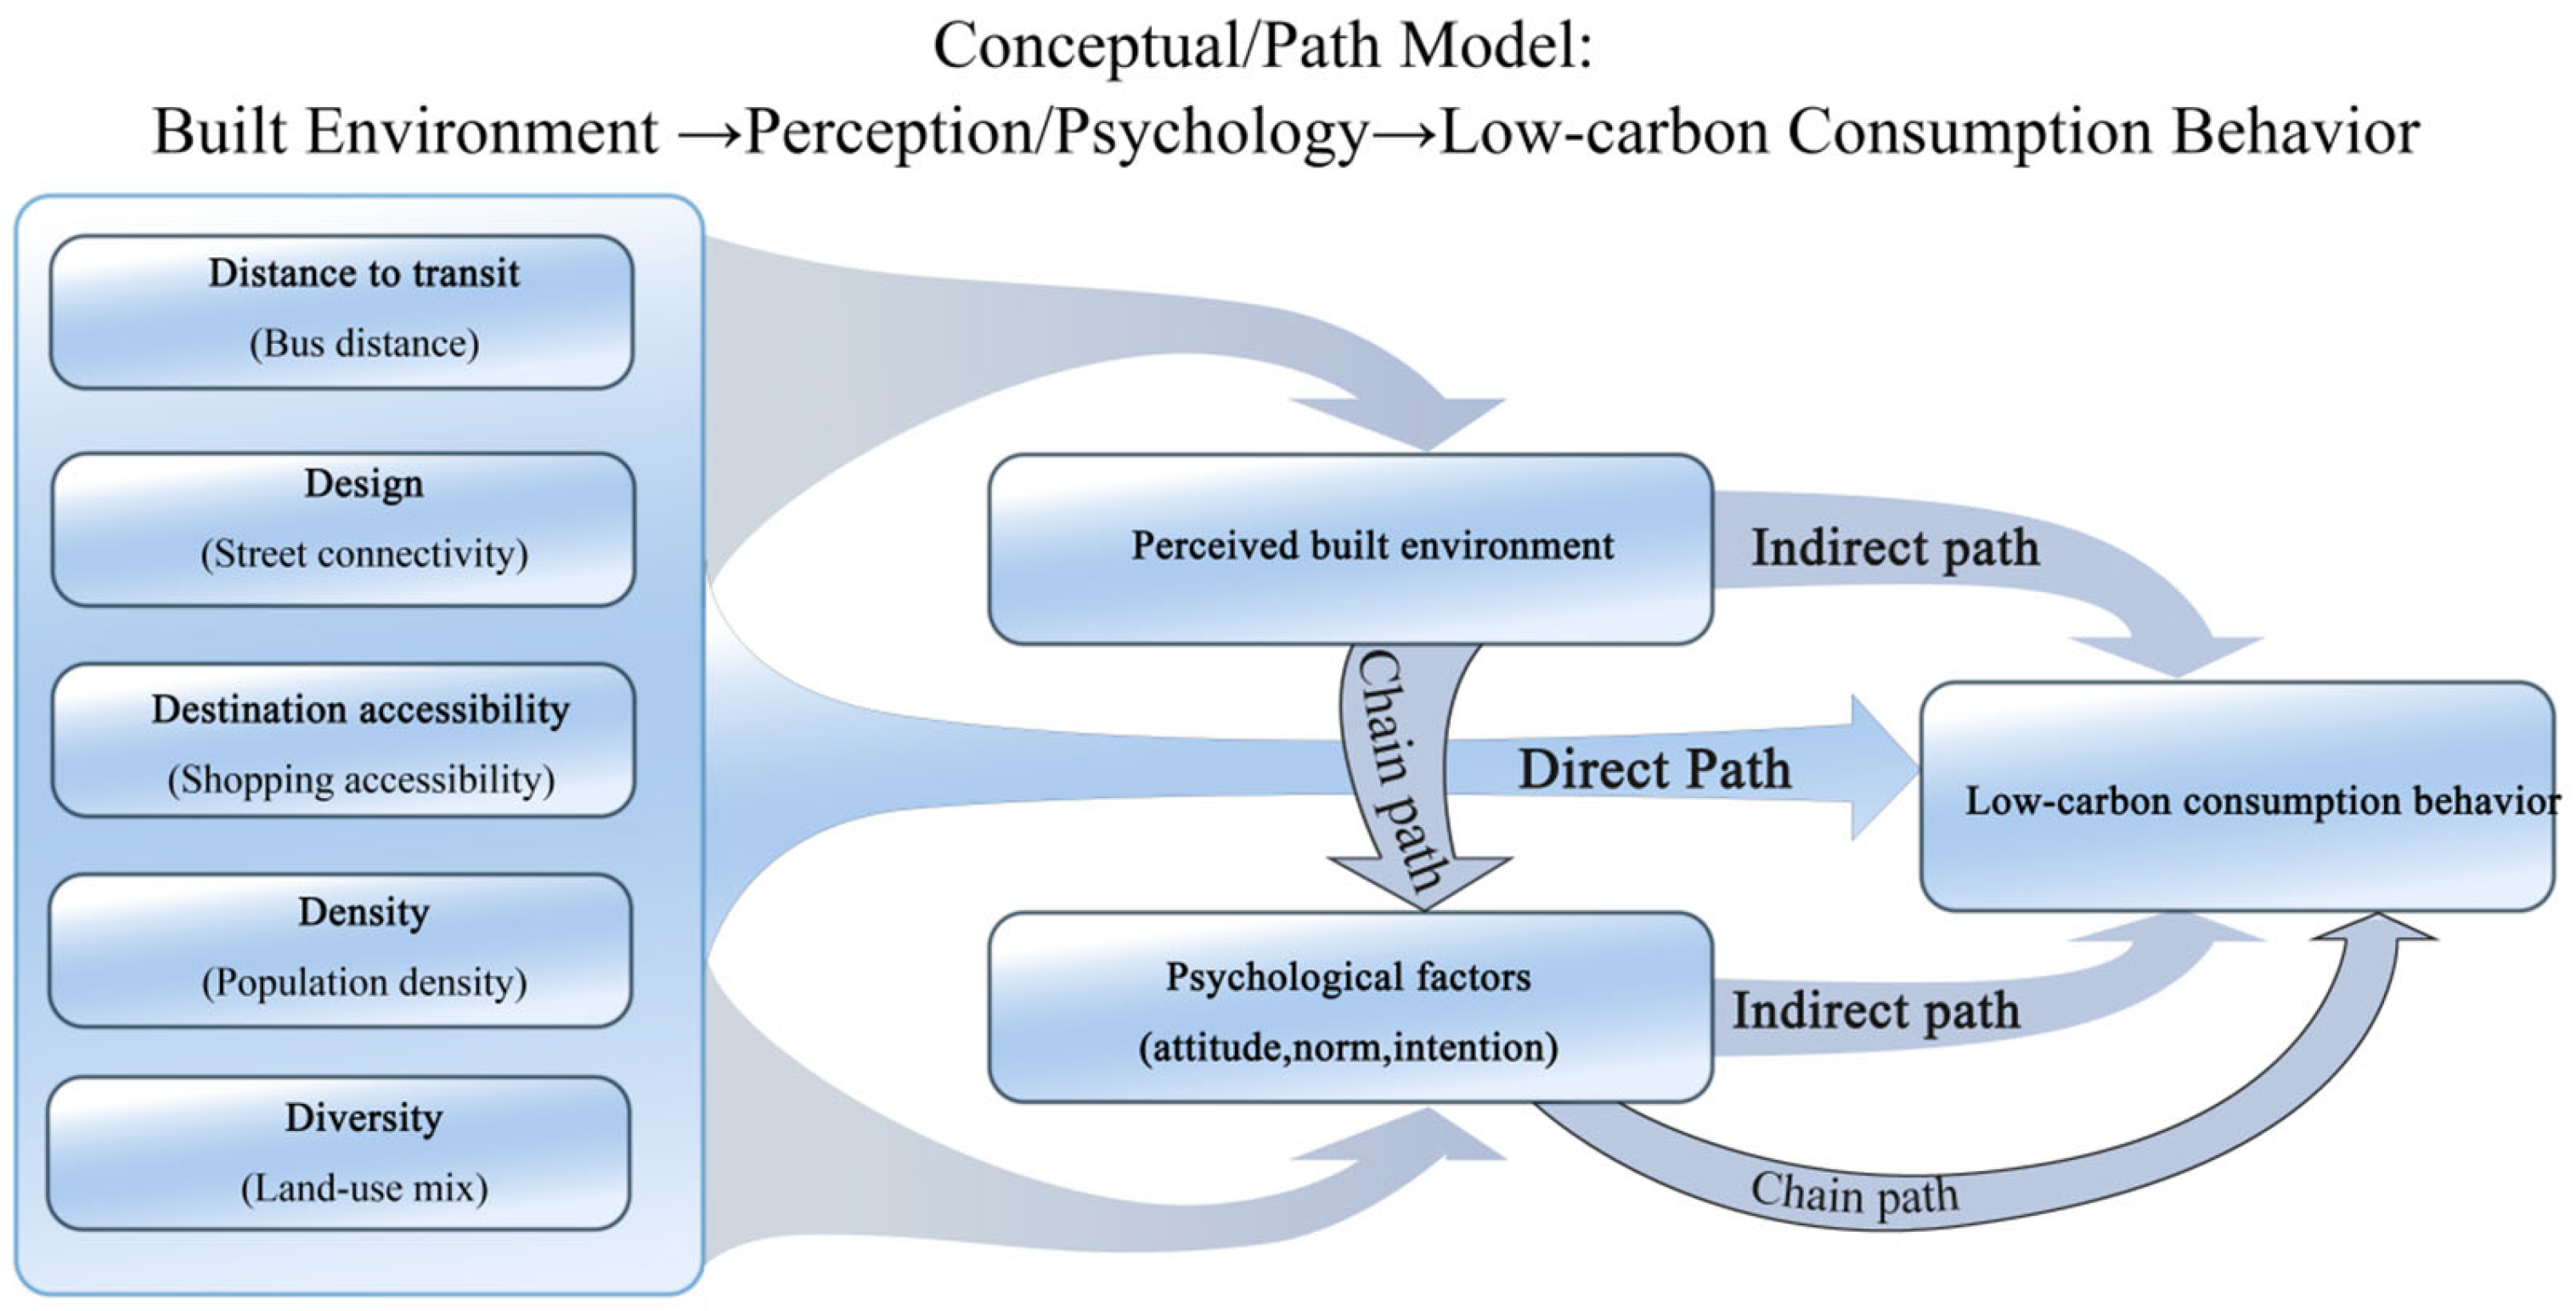
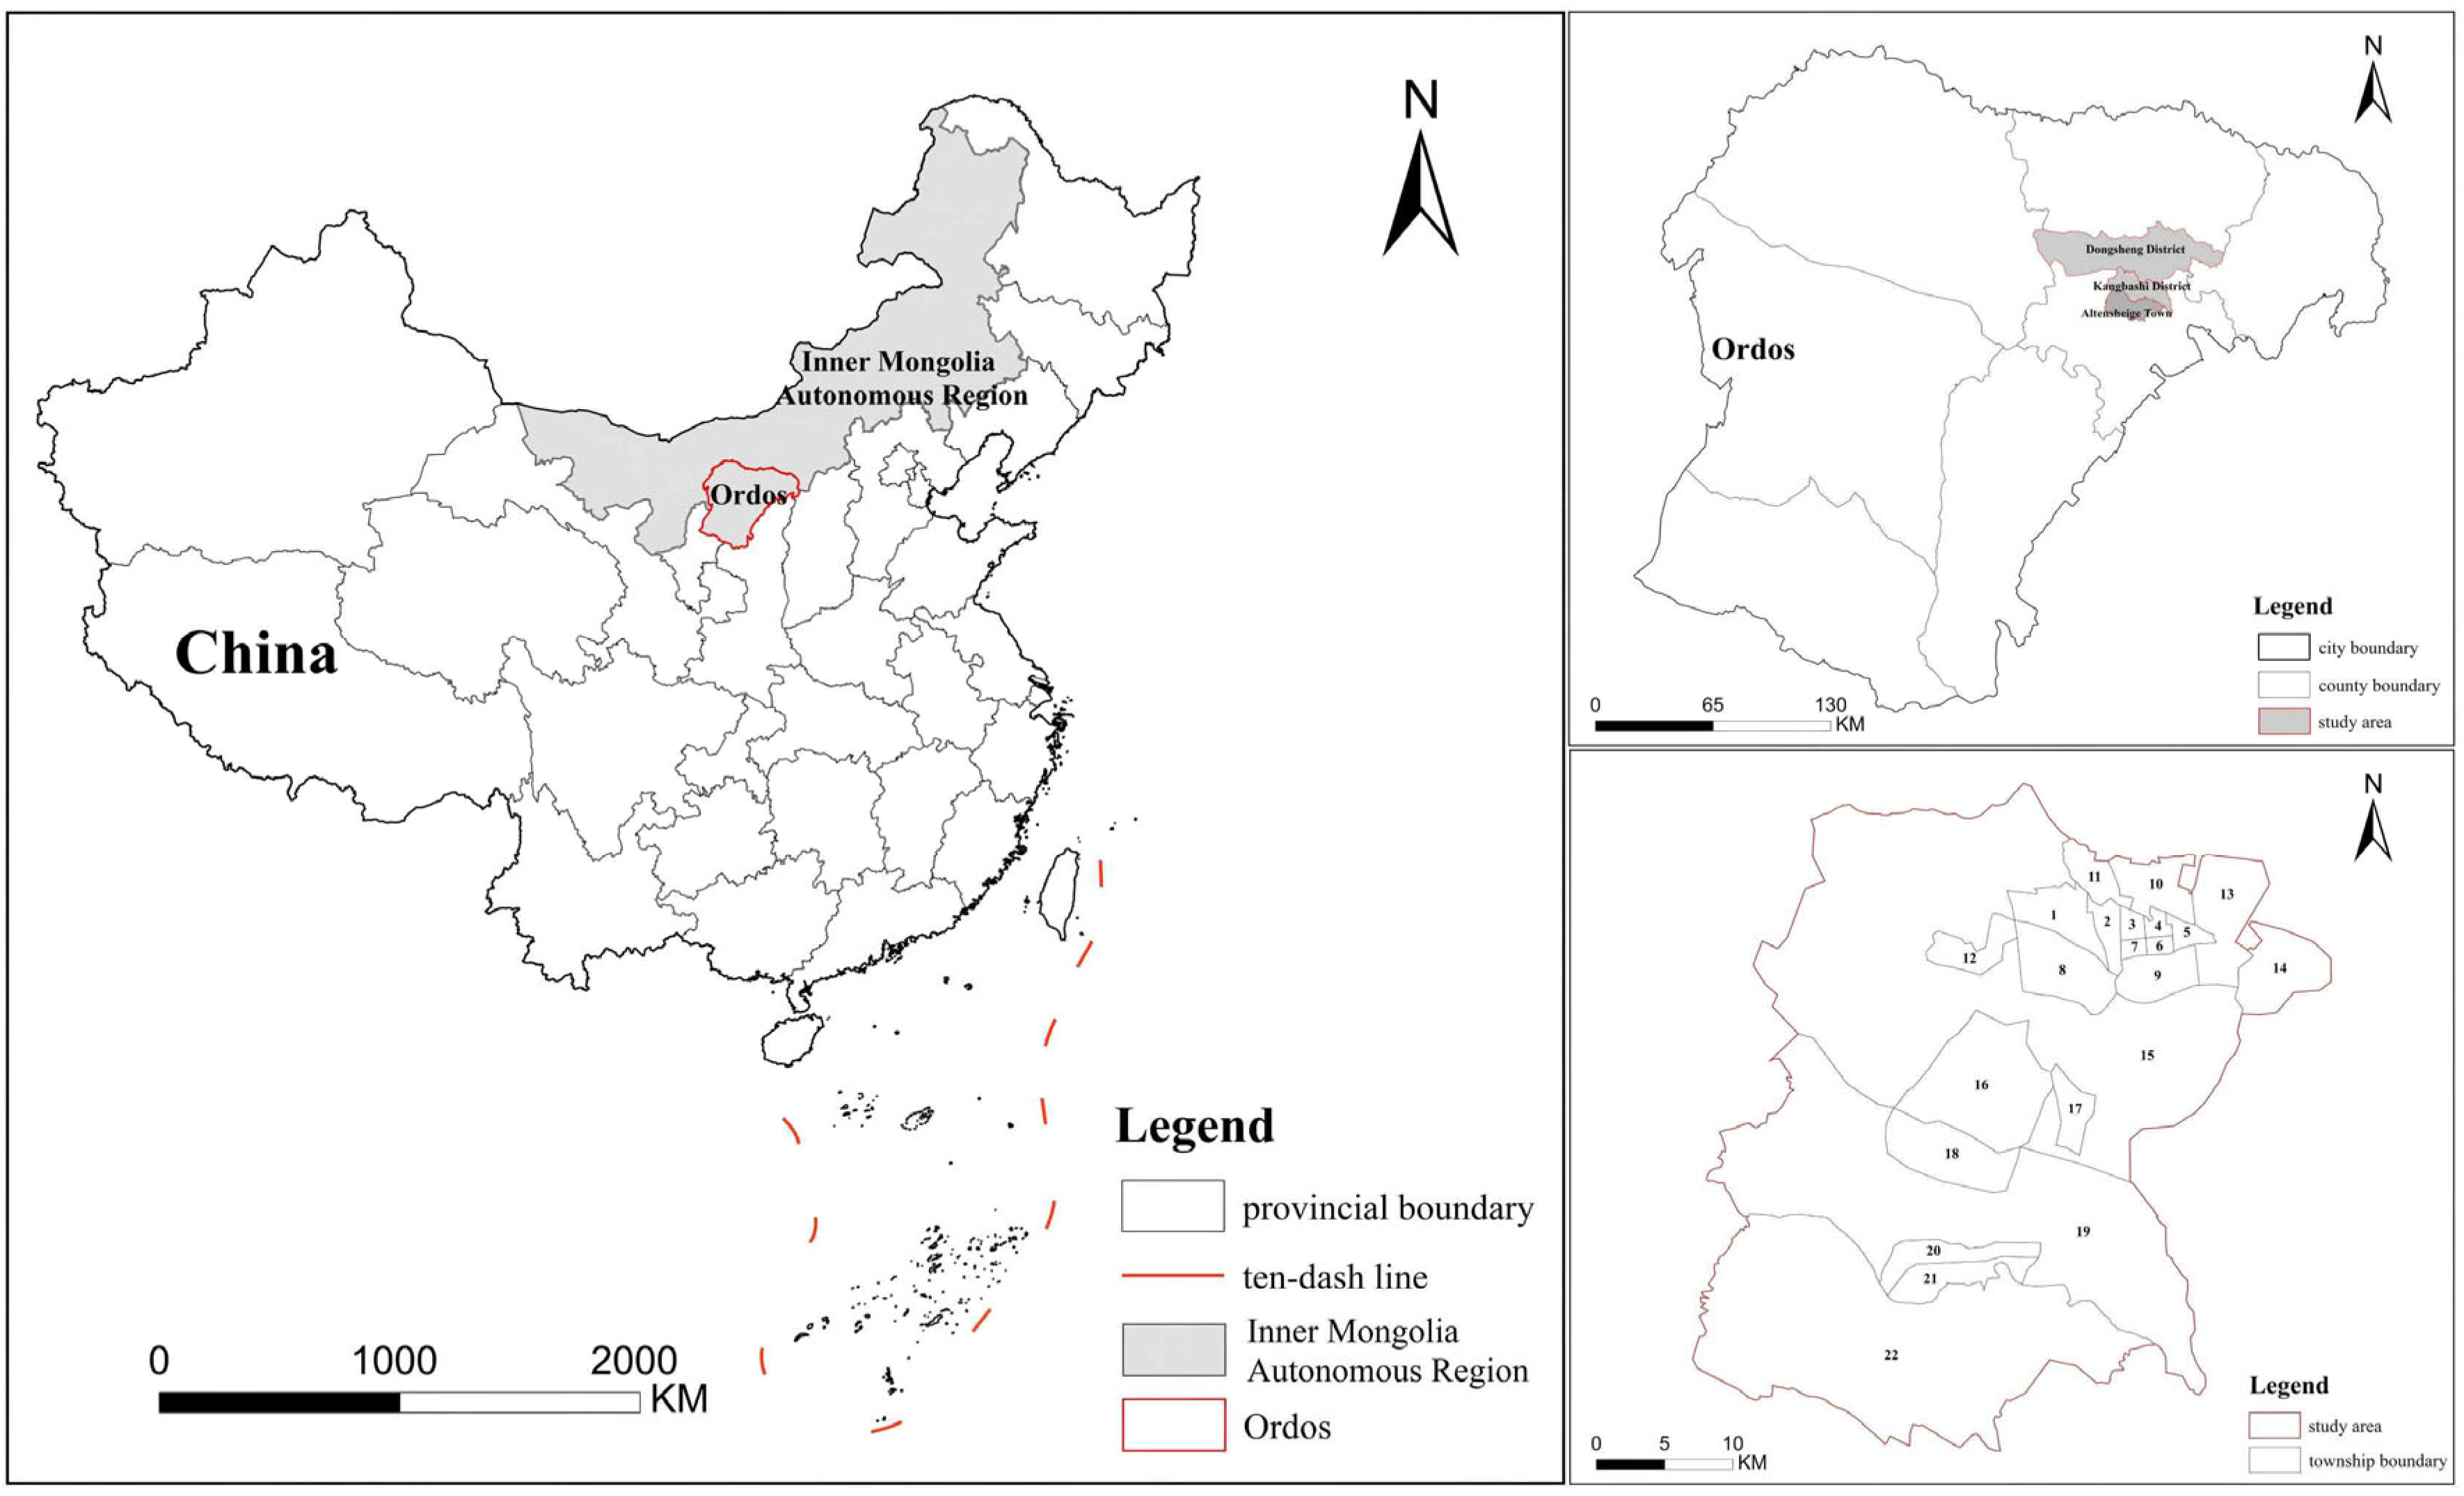

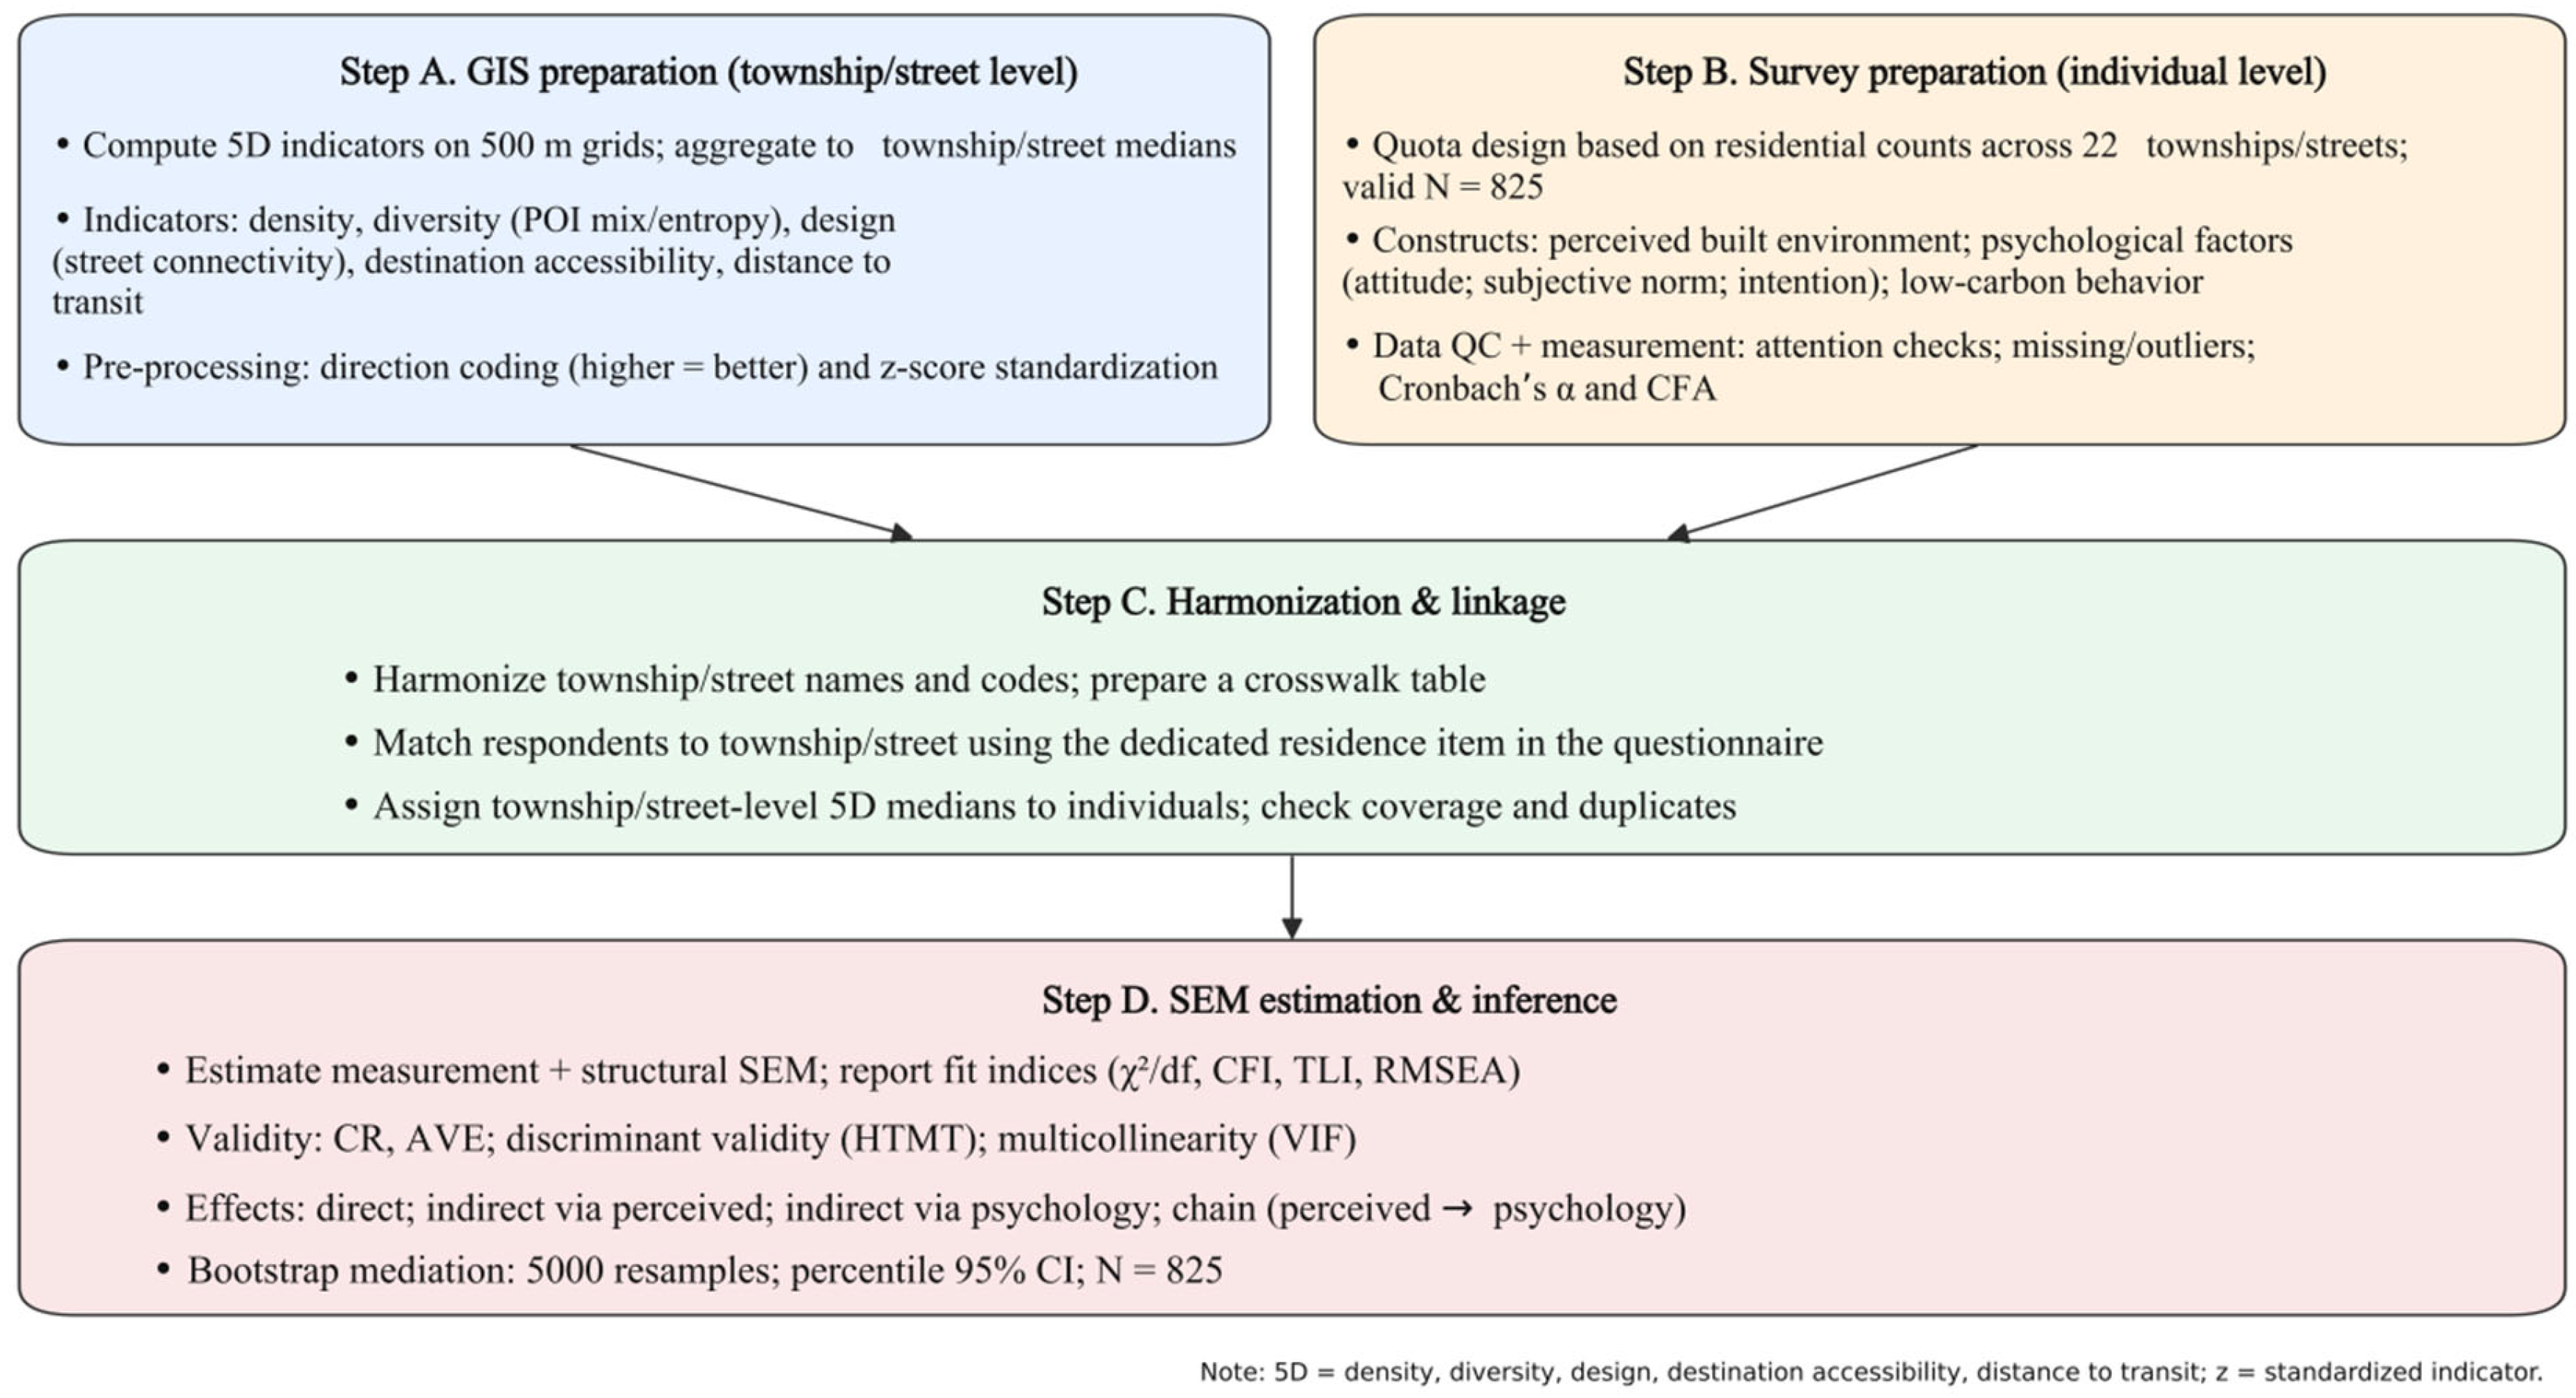


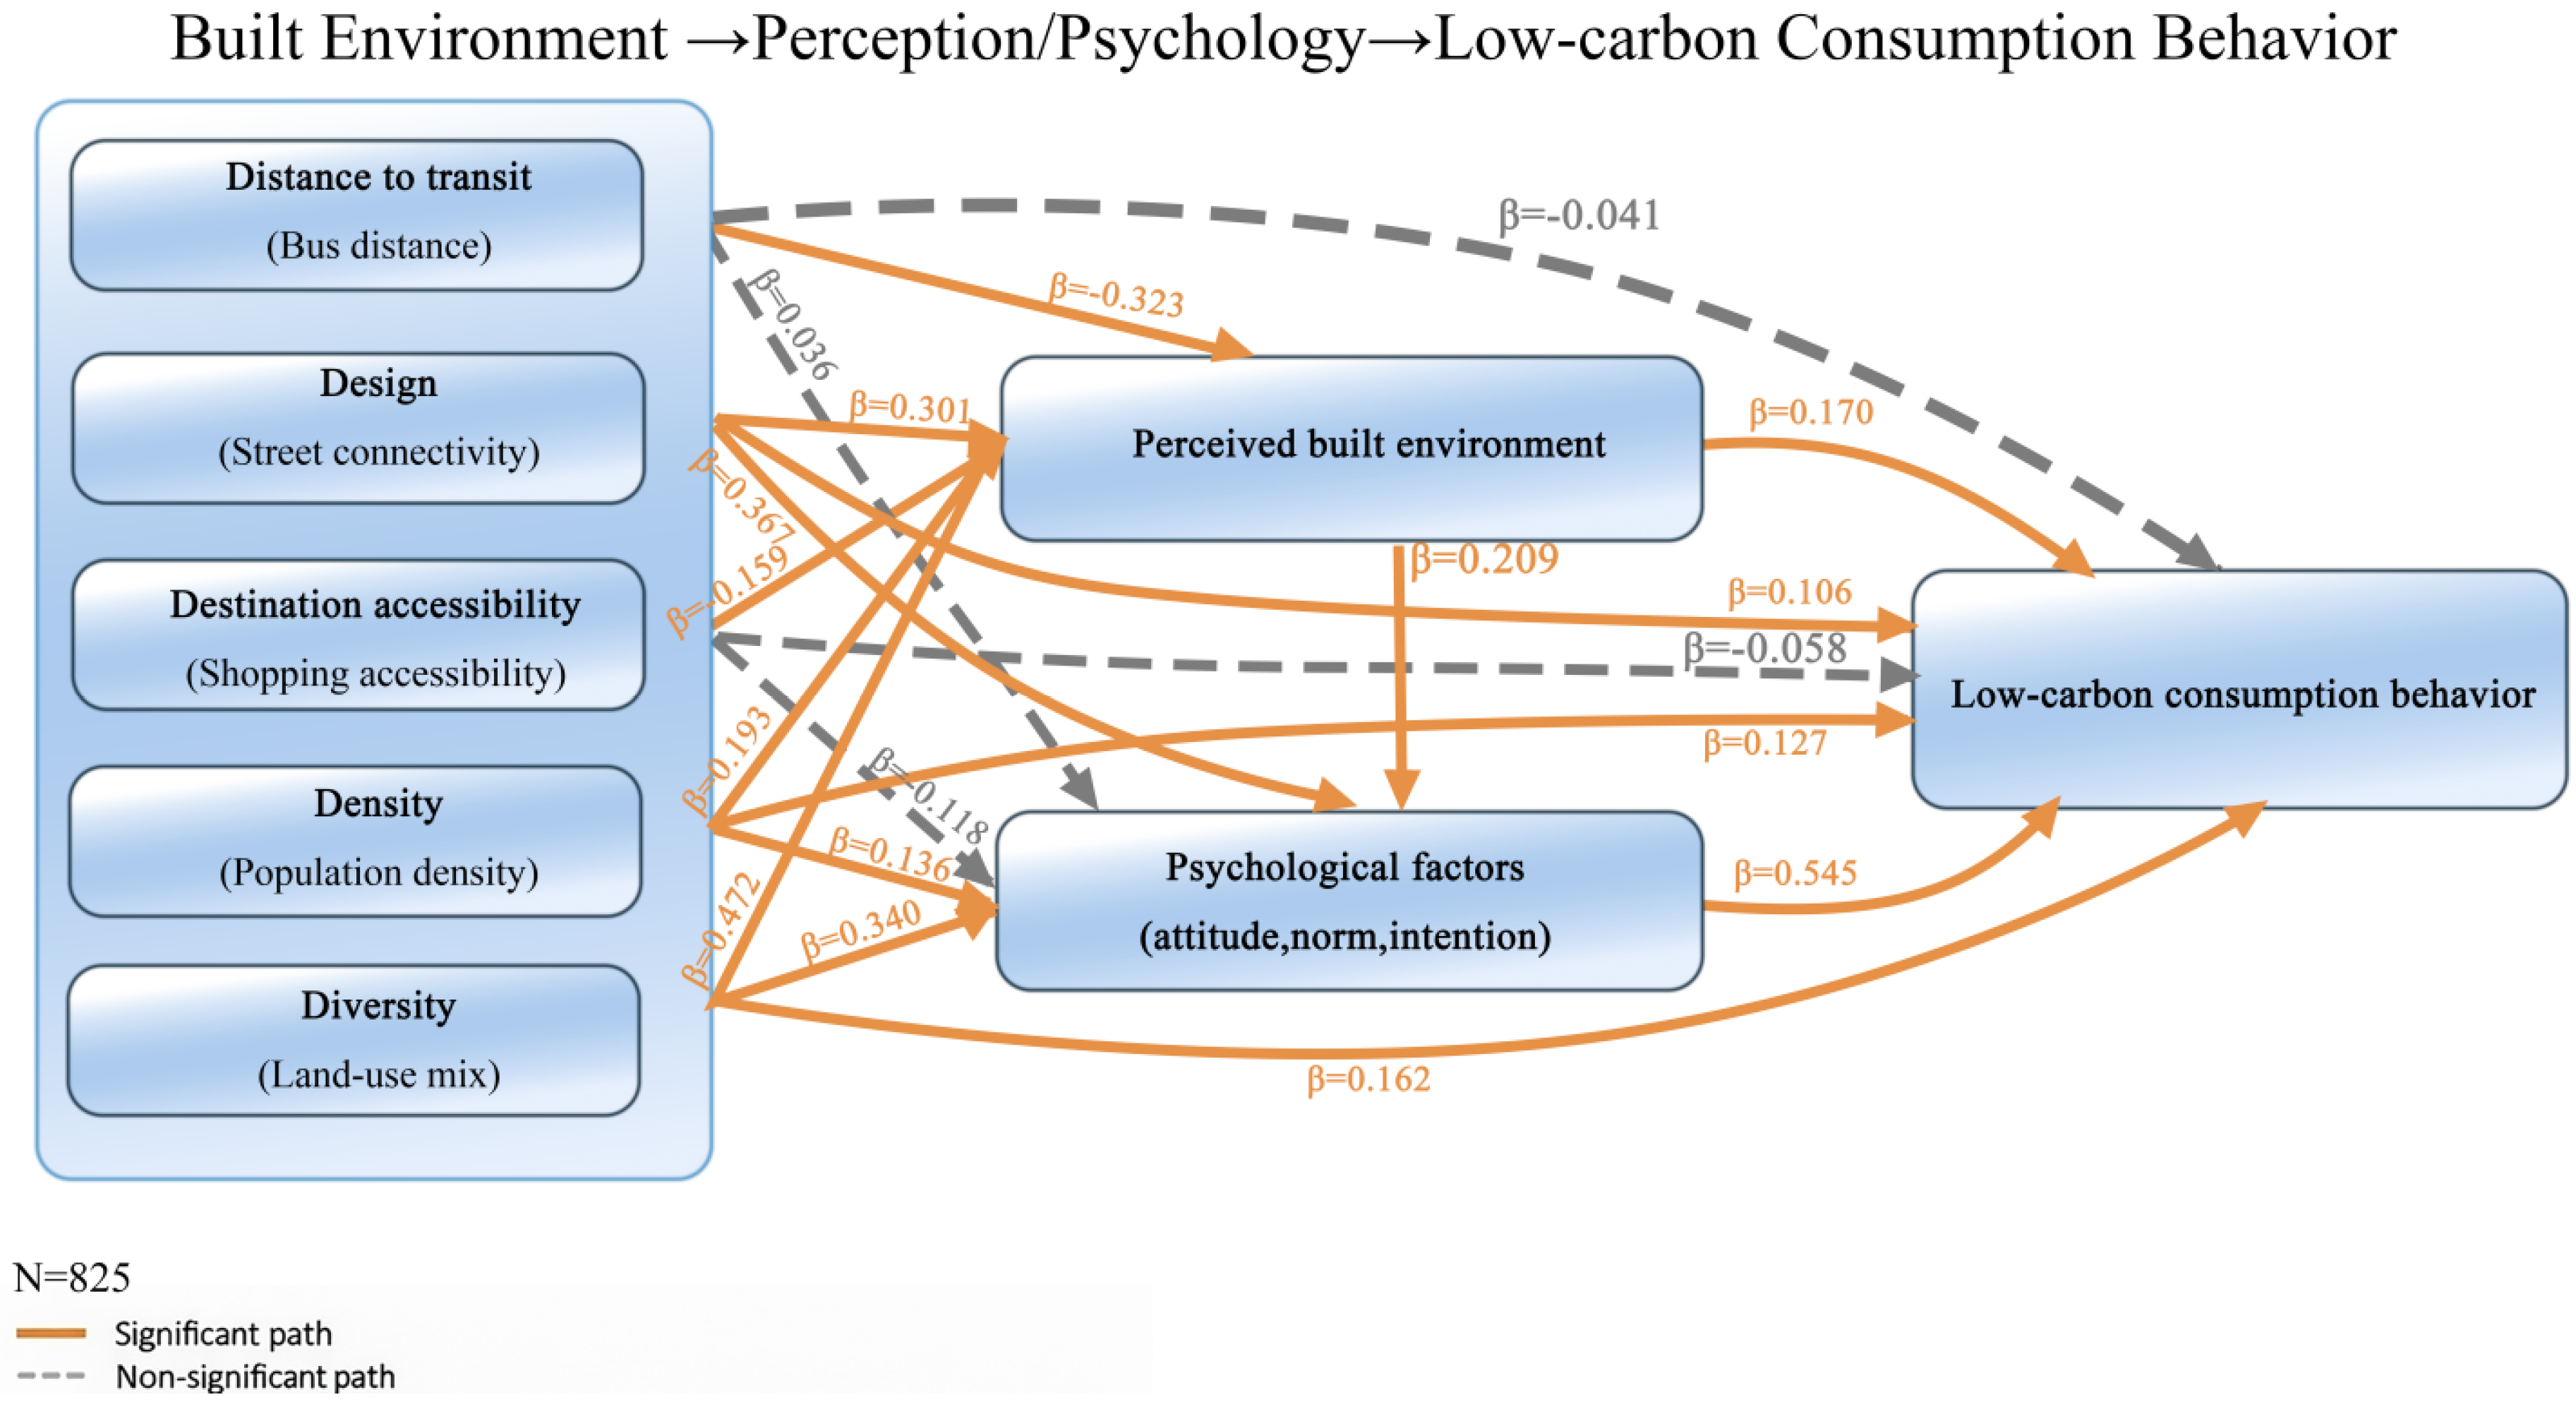

| Theme | 5D Indicator (Typical) | Expected Sign on Behavior | Mediating Channel Cited | Context/Notes | Key References (Examples) |
|---|---|---|---|---|---|
| Structural advantages → Partial mediation | Density/Diversity/Design | + | Perceived neighborhood quality → Psychology (attitude/norm/intent) | Direct opportunities + improved readability/safety/comfort | Ajzen [26]; Cervero & Kockelman [1]; Ewing & Cervero [2] |
| Accessibility disadvantages → Full mediation | Distance to transit/Shopping time | − (direct), via chain | Negative perceived convenience → Psychology resistance | Direct path often weak/non-sig; chain (Perceived → Psychology) salient | Handy et al. [7]; McCormack & Shiell [8] |
| Psychology → Behavior strongest path | — | + | Attitude/subjective norms/behavioral intention | TPB core linkage, robust across contexts | Ajzen [26]; Bamberg & Möser [25] |
| Percentage | n | Category | Characteristic |
|---|---|---|---|
| 52.0 | 429 | Male | Gender |
| 48.0 | 396 | Female | |
| 5.7 | 47 | Under 18 | Age group |
| 40.4 | 333 | 18–24 | |
| 34.5 | 285 | 25–34 | |
| 14.1 | 116 | 35–44 | |
| 5.3 | 44 | 45 and above | |
| 13.6 | 112 | Junior high school or below | Education |
| 42.2 | 348 | High school/technical secondary school | |
| 24.2 | 200 | Junior college | |
| 15.2 | 125 | Bachelor’s degree | |
| 4.8 | 40 | Master’s degree or above | |
| 18.9 | 156 | Below RMB 3000 | Monthly income |
| 54.9 | 453 | RMB 3000–5000 | |
| 17.0 | 140 | RMB 5000–8000 | |
| 9.2 | 76 | RMB 8000 and above | |
| 68.0 | 561 | Owner-occupied housing | Housing tenure |
| 24.0 | 198 | Rental housing | |
| 8.0 | 66 | Other |
| Dimension | Operational Definition | Unit | Direction (Higher = …) | Spatial Unit | Data Year/Source | Notes |
|---|---|---|---|---|---|---|
| Density | Population per built-up area | persons/km2 | better | Subdistrict/township unit | Local stats + GIS grid | Z-standardized prior to merge |
| Diversity | POI entropy index (0–1) | index | more mixed (better) | Subdistrict/township unit | POI providers/OSM + own calc | Higher = more land-use mix |
| Design | Intersection density/network density | junctions/km2 or km/km2 | more connected (better) | Subdistrict/township unit | OSM road network | Proxy for street connectivity |
| Distance to transit | Centroid-to-nearest bus stop (network/Euclidean) | m or min | worse | Subdistrict/township unit | Transit stops (GTFS/OSM) | Higher = farther/longer; direction unified before z |
| Destination accessibility (shopping) | Time to nearest daily shopping facility | min | worse | Subdistrict/township unit | POI + network time | Higher = longer; direction unified before z |
| Agree/Strongly Agree (%) | SD | Mean | Behavior Indicator | Item |
|---|---|---|---|---|
| 58.2 | 1.05 | 3.64 | Walk/cycle/public transport for daily trips | Q9 |
| 61.1 | 0.97 | 3.69 | Buy energy-efficient home appliances | Q10 |
| 57.3 | 1.01 | 3.62 | Turn off lights/AC and set temperatures reasonably | Q11 |
| 59.4 | 1.05 | 3.64 | Buy locally produced goods | Q12 |
| 58.7 | 1.02 | 3.64 | Reduce disposable products | Q13 |
| 57.8 | 1.02 | 3.63 | Participate in waste sorting | Q14 |
| 58.4 | 0.98 | 3.65 | Choose eco-friendly or reusable products | Q15 |
| 58.4 | 1.03 | 3.62 | Use household energy-saving devices | Q27 |
| Objective BE Indicator | Total Effect β | 95% CI | Direct Effect β | 95% CI | Indirect via Perception β | 95% CI | Indirect via Psychology β | 95% CI | Chain Indirect (Perception → Psychology) β | 95% CI | Total Indirect β | Mediation Type |
|---|---|---|---|---|---|---|---|---|---|---|---|---|
| Distance to transit (bus distance) | −0.112 | [−0.277, −0.005] | −0.041 | [−0.148, 0.045] | −0.055 | [−0.101, −0.025] | 0.020 | [−0.066, 0.095] | −0.037 | [−0.068, −0.017] | −0.072 | Full |
| Design (street connectivity/road network density) | 0.391 | [0.308, 0.463] | 0.106 | [0.029, 0.176] | 0.051 | [0.027, 0.075] | 0.200 | [0.134, 0.276] | 0.034 | [0.016, 0.054] | 0.285 | Partial |
| Destination accessibility (shopping accessibility) | −0.167 | [−0.303, −0.006] | −0.058 | [−0.160, 0.056] | −0.027 | [−0.054, 0.000] | −0.065 | [−0.151, 0.025] | −0.018 | [−0.038, −0.0002] | −0.110 | Full |
| Density (population density) | 0.256 | [0.199, 0.317] | 0.127 | [0.074, 0.185] | 0.033 | [0.017, 0.051] | 0.074 | [0.028, 0.118] | 0.022 | [0.011, 0.036] | 0.129 | Partial |
| Diversity (land-use mix/POI mix) | 0.481 | [0.408, 0.564] | 0.162 | [0.087, 0.240] | 0.080 | [0.046, 0.118] | 0.185 | [0.126, 0.249] | 0.054 | [0.028, 0.083] | 0.319 | Partial |
| Diagnostic/Robustness Check | Rule/Threshold | Statistic | Conclusion |
|---|---|---|---|
| Internal consistency (Cronbach’s α) | α ≥ 0.70 | Perceived = 0.919; Psychology = 0.895; Behavior = 0.937 | Pass |
| Convergent validity (CR, AVE) | CR ≥ 0.70; AVE ≥ 0.50 | Perceived: CR = 0.919, AVE = 0.587; Psychology: CR = 0.895, AVE = 0.631; Behavior: CR = 0.937, AVE = 0.651 | Pass |
| Discriminant validity (HTMT) | HTMT < 0.85 (strict)/0.90 (lenient) | HTMT: Perc–Psych = 0.501; Perc–Beh = 0.601; Psych–Beh = 0.722 | Pass (<0.85) |
| Multicollinearity (VIF) among 5D predictors | VIF < 10 (common)/<5 (conservative) | VIFs (bus distance, road density, shopping accessibility, population density, POI mix) = 5.29, 2.40, 5.01, 1.81, 1.73 (max = 5.29) | Acceptable (<10); borderline under strict < 5 |
| Measurement model fit (CFA) | χ2/df < 5; CFI/TLI > 0.90; RMSEA < 0.08; (GFI/AGFI > 0.90) | χ2/df = 1.129; GFI = 0.977; AGFI = 0.971; RMSEA = 0.013; TLI = 0.998; CFI = 0.998; NFI = 0.982; IFI = 0.998 | Good fit |
| Bootstrap mediation inference | percentile 95% CI; indirect significant if CI excludes 0 | 5000 resamples; percentile 95% CI; N = 825 (see Table 5 for effects) | Implemented |
Disclaimer/Publisher’s Note: The statements, opinions and data contained in all publications are solely those of the individual author(s) and contributor(s) and not of MDPI and/or the editor(s). MDPI and/or the editor(s) disclaim responsibility for any injury to people or property resulting from any ideas, methods, instructions or products referred to in the content. |
© 2026 by the authors. Licensee MDPI, Basel, Switzerland. This article is an open access article distributed under the terms and conditions of the Creative Commons Attribution (CC BY) license.
Share and Cite
Liu, S.; Dewancker, B.J.; Gao, W.; Li, Z.; Zhang, T.; Bao, X.; Ren, Y. How Does the Built Environment Shape Low-Carbon Consumption in an Energy-Based City? A GIS–SEM Study of Ordos, China. Buildings 2026, 16, 1142. https://doi.org/10.3390/buildings16061142
Liu S, Dewancker BJ, Gao W, Li Z, Zhang T, Bao X, Ren Y. How Does the Built Environment Shape Low-Carbon Consumption in an Energy-Based City? A GIS–SEM Study of Ordos, China. Buildings. 2026; 16(6):1142. https://doi.org/10.3390/buildings16061142
Chicago/Turabian StyleLiu, Siyuan, Bart Julien Dewancker, Weijun Gao, Zehang Li, Tianyang Zhang, Xin Bao, and Yu Ren. 2026. "How Does the Built Environment Shape Low-Carbon Consumption in an Energy-Based City? A GIS–SEM Study of Ordos, China" Buildings 16, no. 6: 1142. https://doi.org/10.3390/buildings16061142
APA StyleLiu, S., Dewancker, B. J., Gao, W., Li, Z., Zhang, T., Bao, X., & Ren, Y. (2026). How Does the Built Environment Shape Low-Carbon Consumption in an Energy-Based City? A GIS–SEM Study of Ordos, China. Buildings, 16(6), 1142. https://doi.org/10.3390/buildings16061142