1. Introduction
With the rapid expansion of China’s high-speed railway network, train operating speeds have reached 350 km/h in regular commercial service [
1]. At such high speeds, high-frequency vibration loads are transmitted to the subgrade and slopes, significantly amplifying residual deformation and differential settlement of the track substructure [
2,
3]. As a mountainous country, China contains numerous natural and artificial slopes, making landslides one of the major types of railway geological hazards [
4].
When train speeds increase from 200 km/h to 350 km/h, the amplitude of subgrade dynamic stress increases nonlinearly with an amplification factor reaching 1.3–1.8 [
5,
6]. In bridge-subgrade transition sections, the vertical dynamic stress induced by train loading is 30–50% higher than in ordinary subgrade sections [
7,
8,
9]. According to China’s High-Speed Railway Design Code, cumulative deformation must remain below 15 mm [
10].
Anti-slide piles are among the most commonly used measures for landslide control, offering advantages such as minimal construction disturbance, high anti-slide capacity, and cost-effectiveness [
11]. However, traditional single-row or ordinary double-row anti-slide piles encounter issues such as excessive bending moments in the pile body and excessive pile-top displacement when applied to slopes with large sliding forces. To address these issues, Zheng [
12] proposed a Surrounding Pile Soil Coupling–Anti-slide Chord (SPSC-AC) structure. Nevertheless, the current understanding of its mechanical behavior under dynamic loading remains limited [
13,
14], particularly regarding the formation mechanism of the dynamic soil arching effect and its impact on load distribution, which calls for further in-depth investigation.
The SPSC-AC structure is a novel composite anti-slide system, characterized by its integration of multiple anti-slide piles into a unified load-bearing framework through curved connecting beams [
12]. This design fully leverages the high compressive strength of concrete, establishing a pile–soil coupling joint anti-slide mechanism [
15]. Studies have shown that the structure can effectively confine the soil within the enclosing piles, allowing them to jointly resist landslide forces and demonstrating significant technical and economic advantages for short subgrade sections between bridges and tunnels [
16,
17,
18].
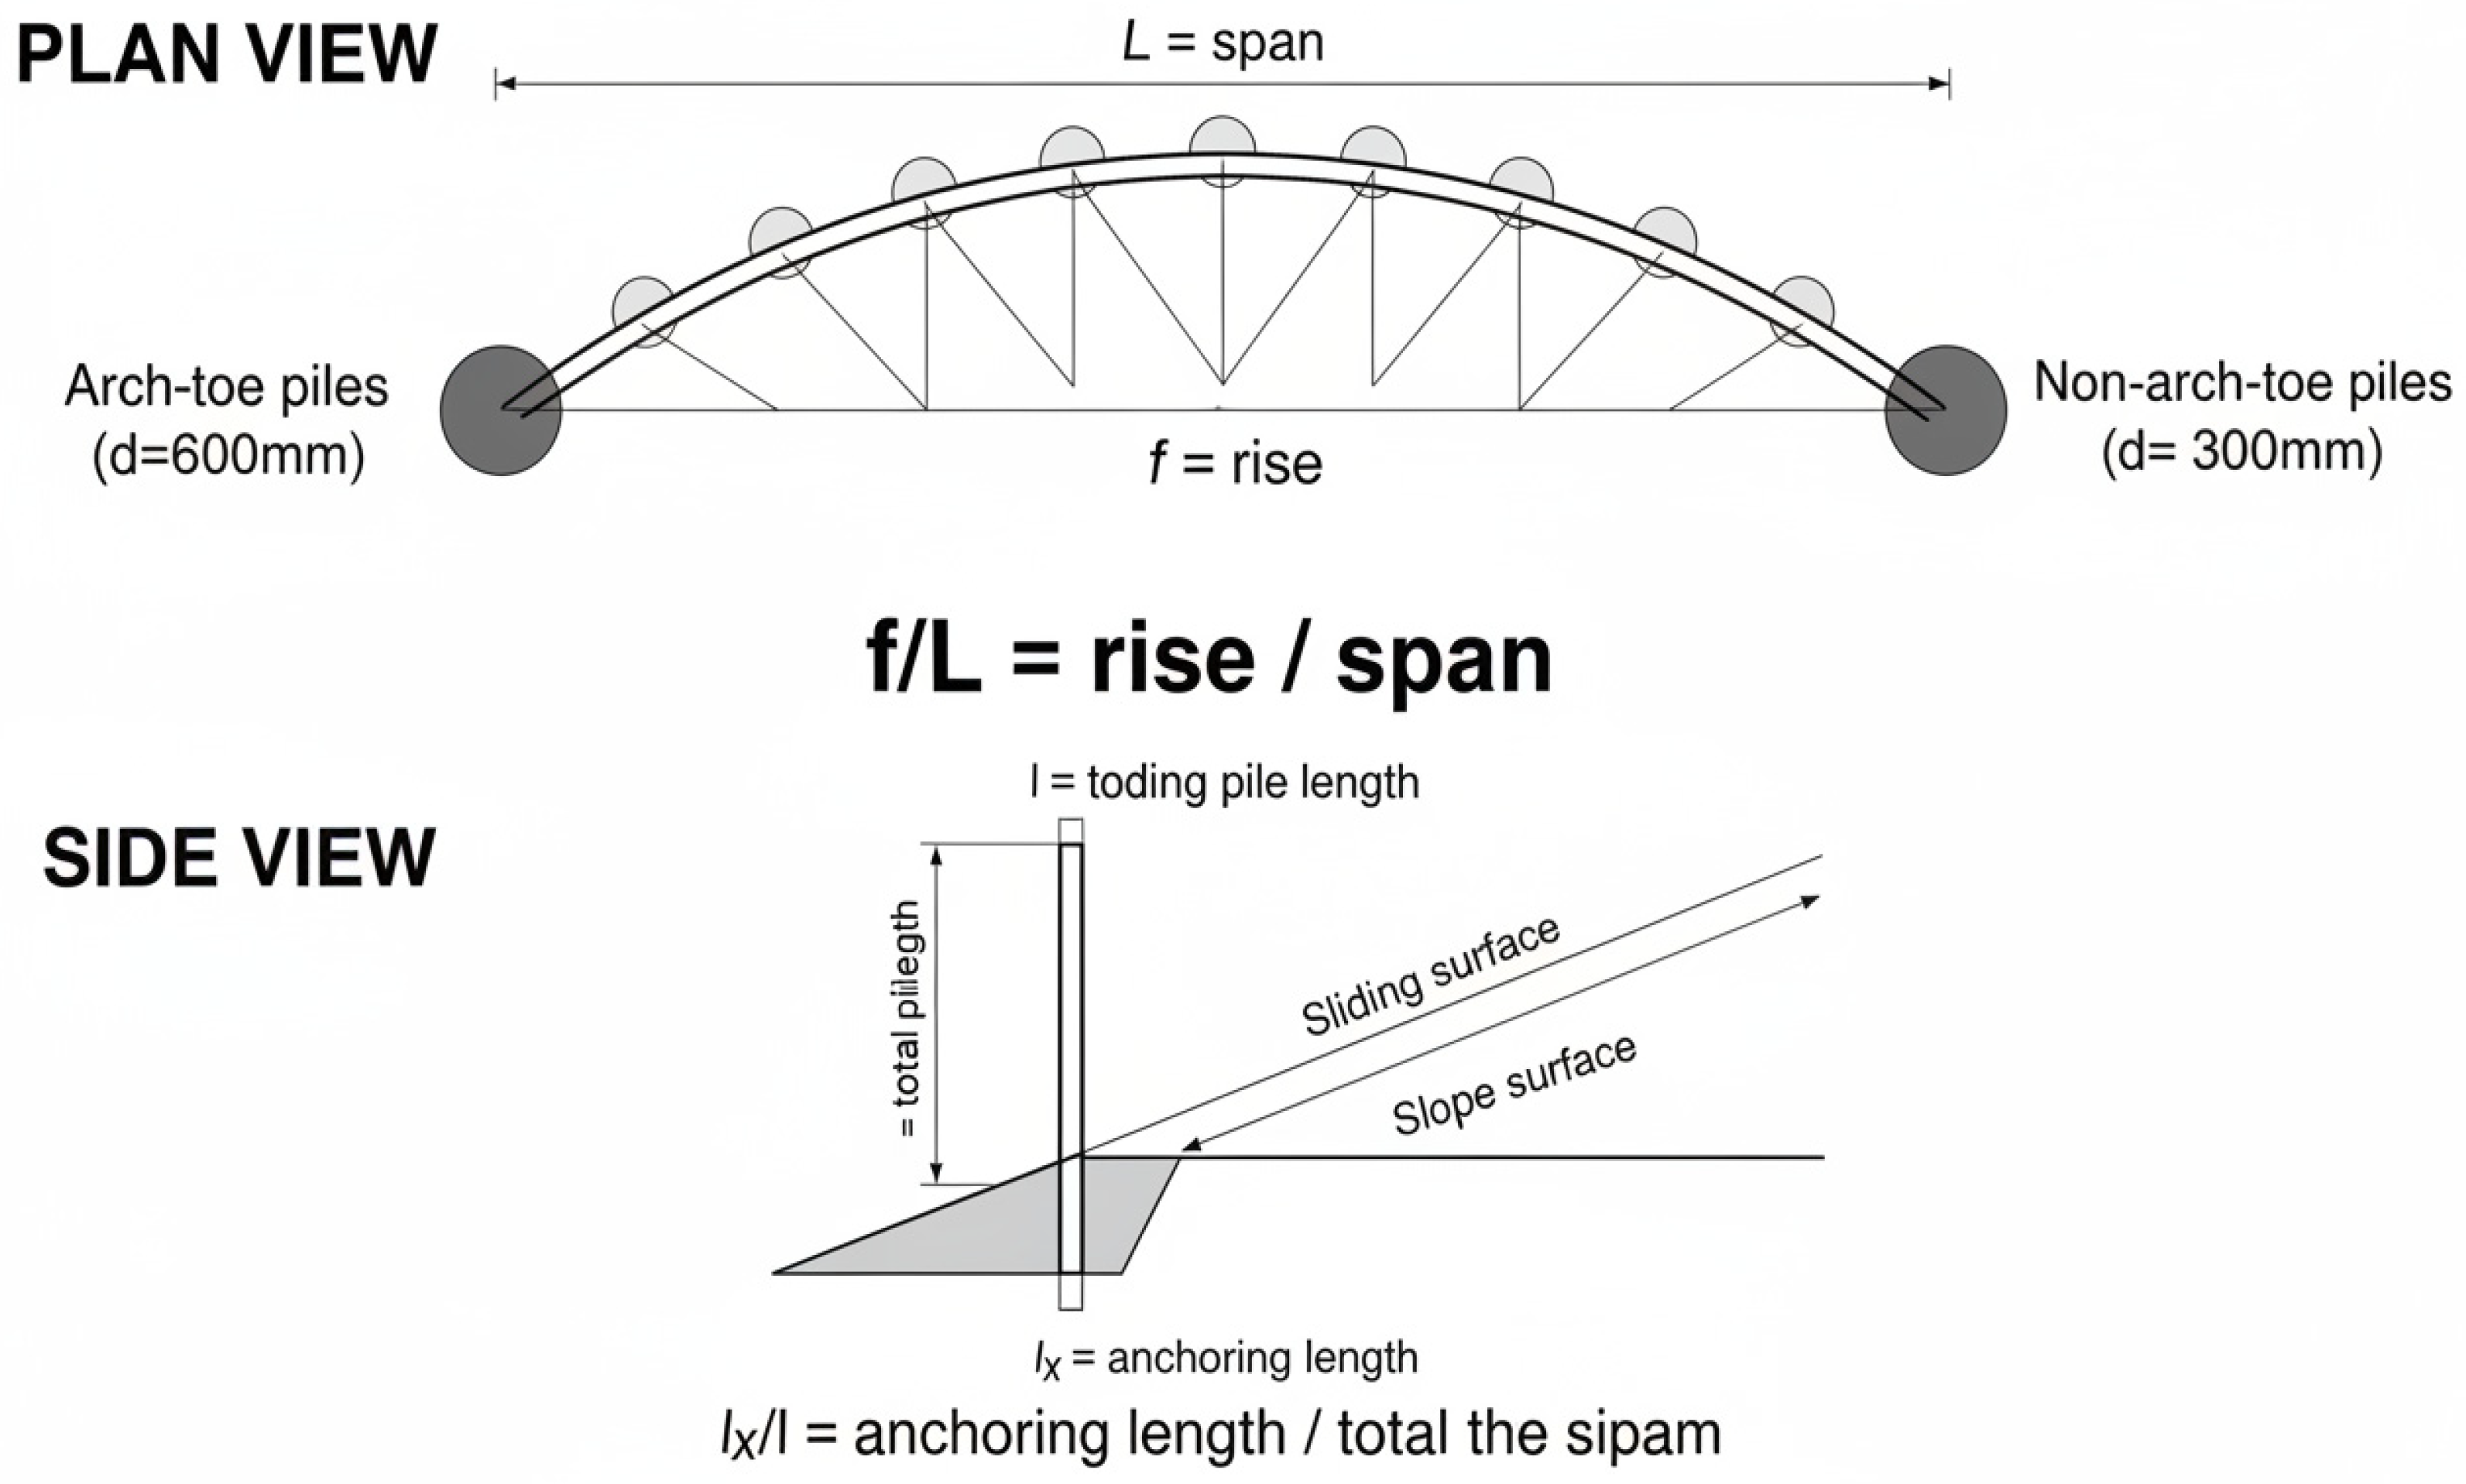
The key design parameters of the SPSC-AC structure include pile cross-sectional dimensions, connecting beam rise-to-span ratio, and anchoring ratio [
19,
20]. Studies indicate that a rise-to-span ratio of 0.3–0.35 is generally optimal [
21]. Variations in anchoring depth have a significant impact on pile bending moments and overall slope stability [
22,
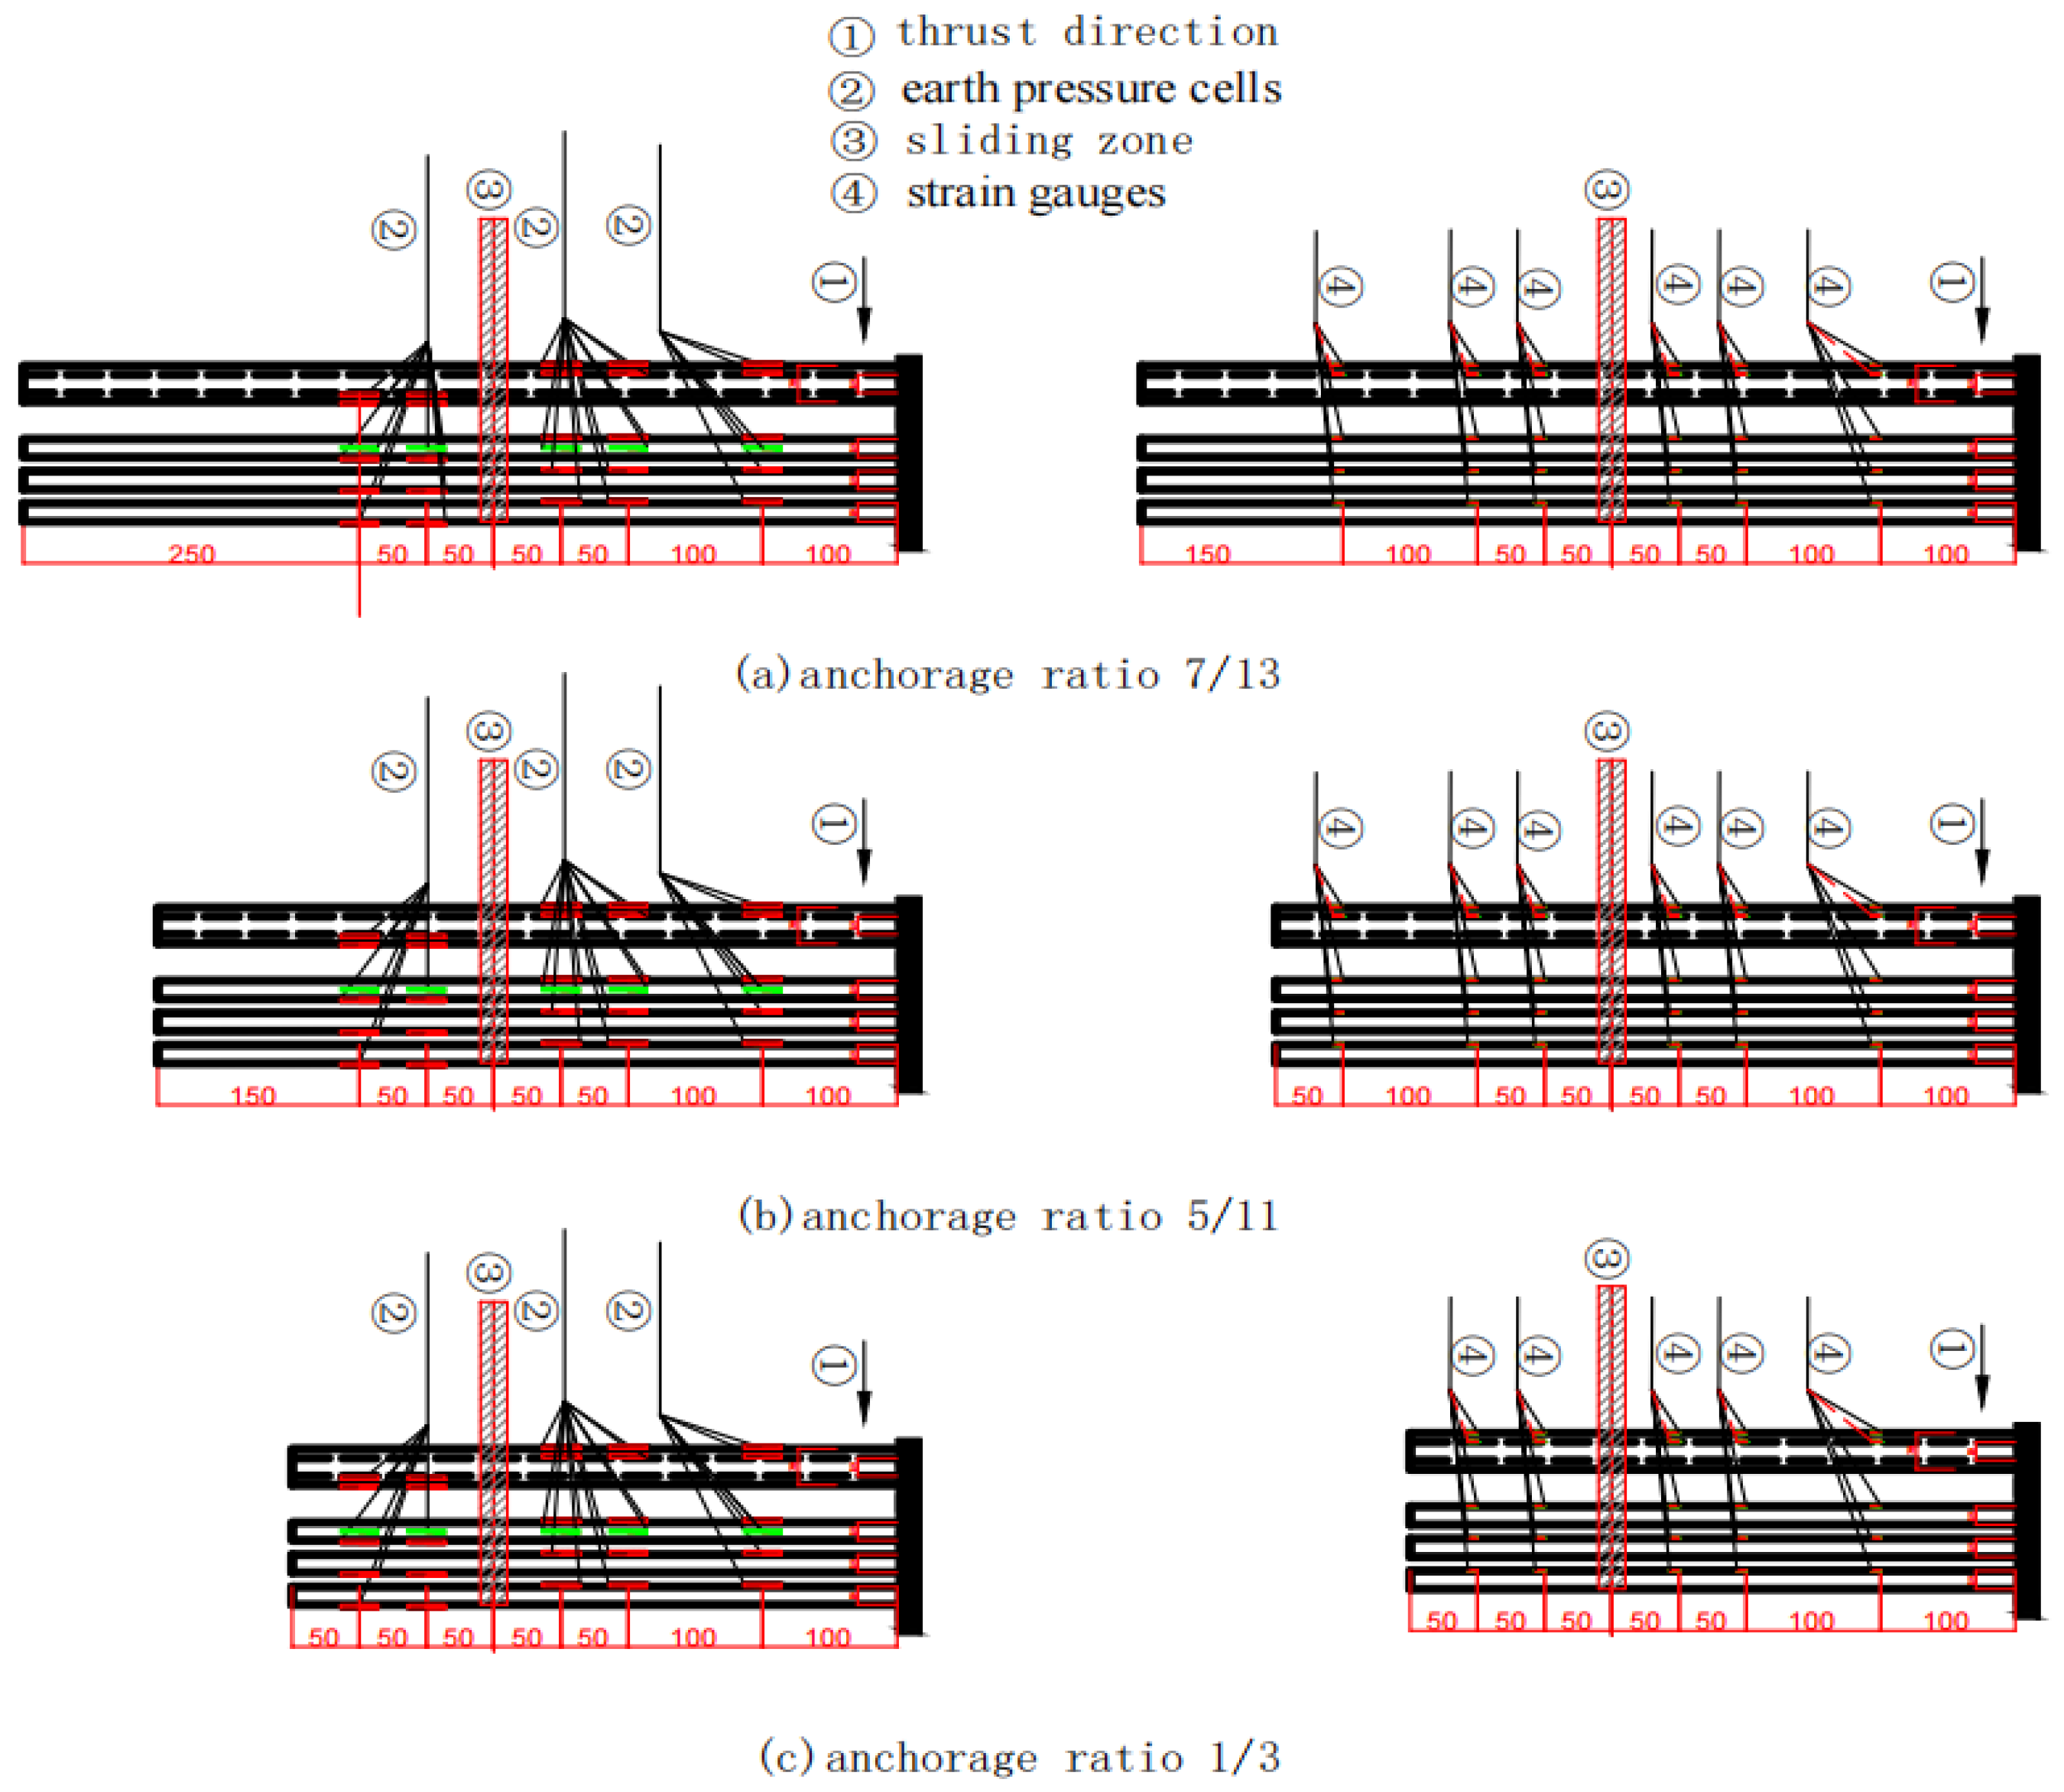
23]. The corresponding geometric parameters are defined in
Figure 1.
Field monitoring studies have shown that significant variations occur in pile-side earth pressure near the sliding surface [
24]. Shaking table model tests indicate that under seismic loading, the dynamic earth pressure on front piles exhibits an inverted K-shaped distribution, while rear piles display an S-shaped distribution [
25], demonstrating that both pile arrangement and load type strongly influence earth pressure distribution patterns.
In multi-row anti-slide pile systems, the rear pile thrust sharing ratio serves as a key indicator of the structure’s synergistic performance. Studies have shown that this ratio is influenced by factors such as pile spacing, row spacing, and overall pile arrangement [
26]. As pile row spacing increases, the soil arching effect generated by the front piles gradually strengthens, while that of the rear piles tends to weaken [
27]. The pile–soil stress ratio is another critical parameter reflecting pile–soil interaction and load transfer efficiency, which decreases as the ratio of pile spacing to pile width increases [
28].
The reasonable simplification of train dynamic loads has a significant impact on the calculation of slope dynamic responses. In finite element simulations, British researchers [
29,
30] were among the first to investigate track–vehicle force mechanisms, providing three main frequency ranges of wheel–rail forces. Pan and Pande [
31] proposed an excitation force function simulation method tailored to China’s conditions. More recently, Xu et al. [
32] employed the DLOAD subroutine in ABAQUS to input 350 km/h train loads in real time, achieving accurate simulation of continuous moving loads. On the experimental side, Jiang et al. [
33] used eight dynamic hydraulic actuators to effectively replicate train moving loads at speeds up to 360 km/h. Despite these advances, research on high-speed train load modeling for speeds ≥ 350 km/h remains limited.
The core mechanism of pile–soil interaction in anti-slide systems is the soil arching effect. When pile–soil coupling is effective, the displacement of the soil between the piles relative to that of the soil behind them mobilizes the soil’s shear resistance, thereby forming an arching effect within a specific range of soil layers between the piles [
34,
35,
36,
37]. Chevalier et al. [
38] investigated the influence of friction parameters on the soil arching effect through experiments and discrete element simulations. Jin et al. [
39] employed infrared thermal imaging to directly observe the full process comprising the relative displacement of soil between piles → wedging → pile side friction → soil arch formation. Wang et al. [
40] used the discrete element method to analyze stress redistribution in pile-supported embankments. However, these studies mainly focus on static soil arching, and theoretical research on dynamic soil arching under train-induced loading remains limited.
The soil arching effect directly influences load distribution in anti-slide pile groups. Zhou et al. [
41] employed the thrust–cohesion ratio and stress homogenization index as quantitative indicators to study the three-dimensional spatial distribution of passive soil arches in front of anti-slide piles. Dong [
42] demonstrated that the development of the soil arching effect can effectively control subgrade deformation. However, research on dynamic soil arching is relatively scarce, restricting the accurate assessment of the dynamic performance of anti-slide structures. Seismic slope stability studies have increasingly compared pseudo-static and dynamic approaches. Mostafaei et al. [
43] reported that pseudo-static analysis of rock wedges in arch dams produced conservative results at low reduction factors, underscoring sensitivity to parameter selection. Karray et al. [
44] showed that pseudo-static methods fail to capture the time-dependent response of clayey slopes under seismic loading. These results indicate that dynamic analysis is essential for reliable assessment of slope-support systems under cyclic loads, including high-speed train vibrations.
Recent research on anti-slide piles further supports this view. Huang et al. [
45] demonstrated that dynamic analysis numerically more accurately predicts pile–anchor responses under seismic loading than pseudo-static methods. Zhu et al. [
13] experimentally verified these differences through shaking table tests on H-type anti-slide piles. Although pseudo-static approaches are computationally efficient, dynamic analysis is necessary to capture the complex soil–structure interaction and time-dependent deformation under cyclic loading.
This study investigates the influence of the SPSC-AC structure on railway slope earth pressure distribution and elucidates its load redistribution mechanism through systematic physical model experiments. The specific research objectives are to:
- (1)
Quantify earth pressure distribution: Systematically analyze the characteristics of earth pressure along depth, plane, and time dimensions under simulated train dynamic loading;
- (2)
Establish a dual control indicator system: Define and analyze two core control indicators—rear pile thrust sharing ratio (δ) and pile–soil stress ratio (n)—and explore their quantitative relationships with the rise-to-span ratio (f/L) and anchoring ratio (η); and
- (3)
Propose design optimization recommendations: According to experimental results, identify optimal design ranges for key parameters of the SPSC-AC structure and provide specific engineering recommendations.
The remainder of the paper is organized as follows.
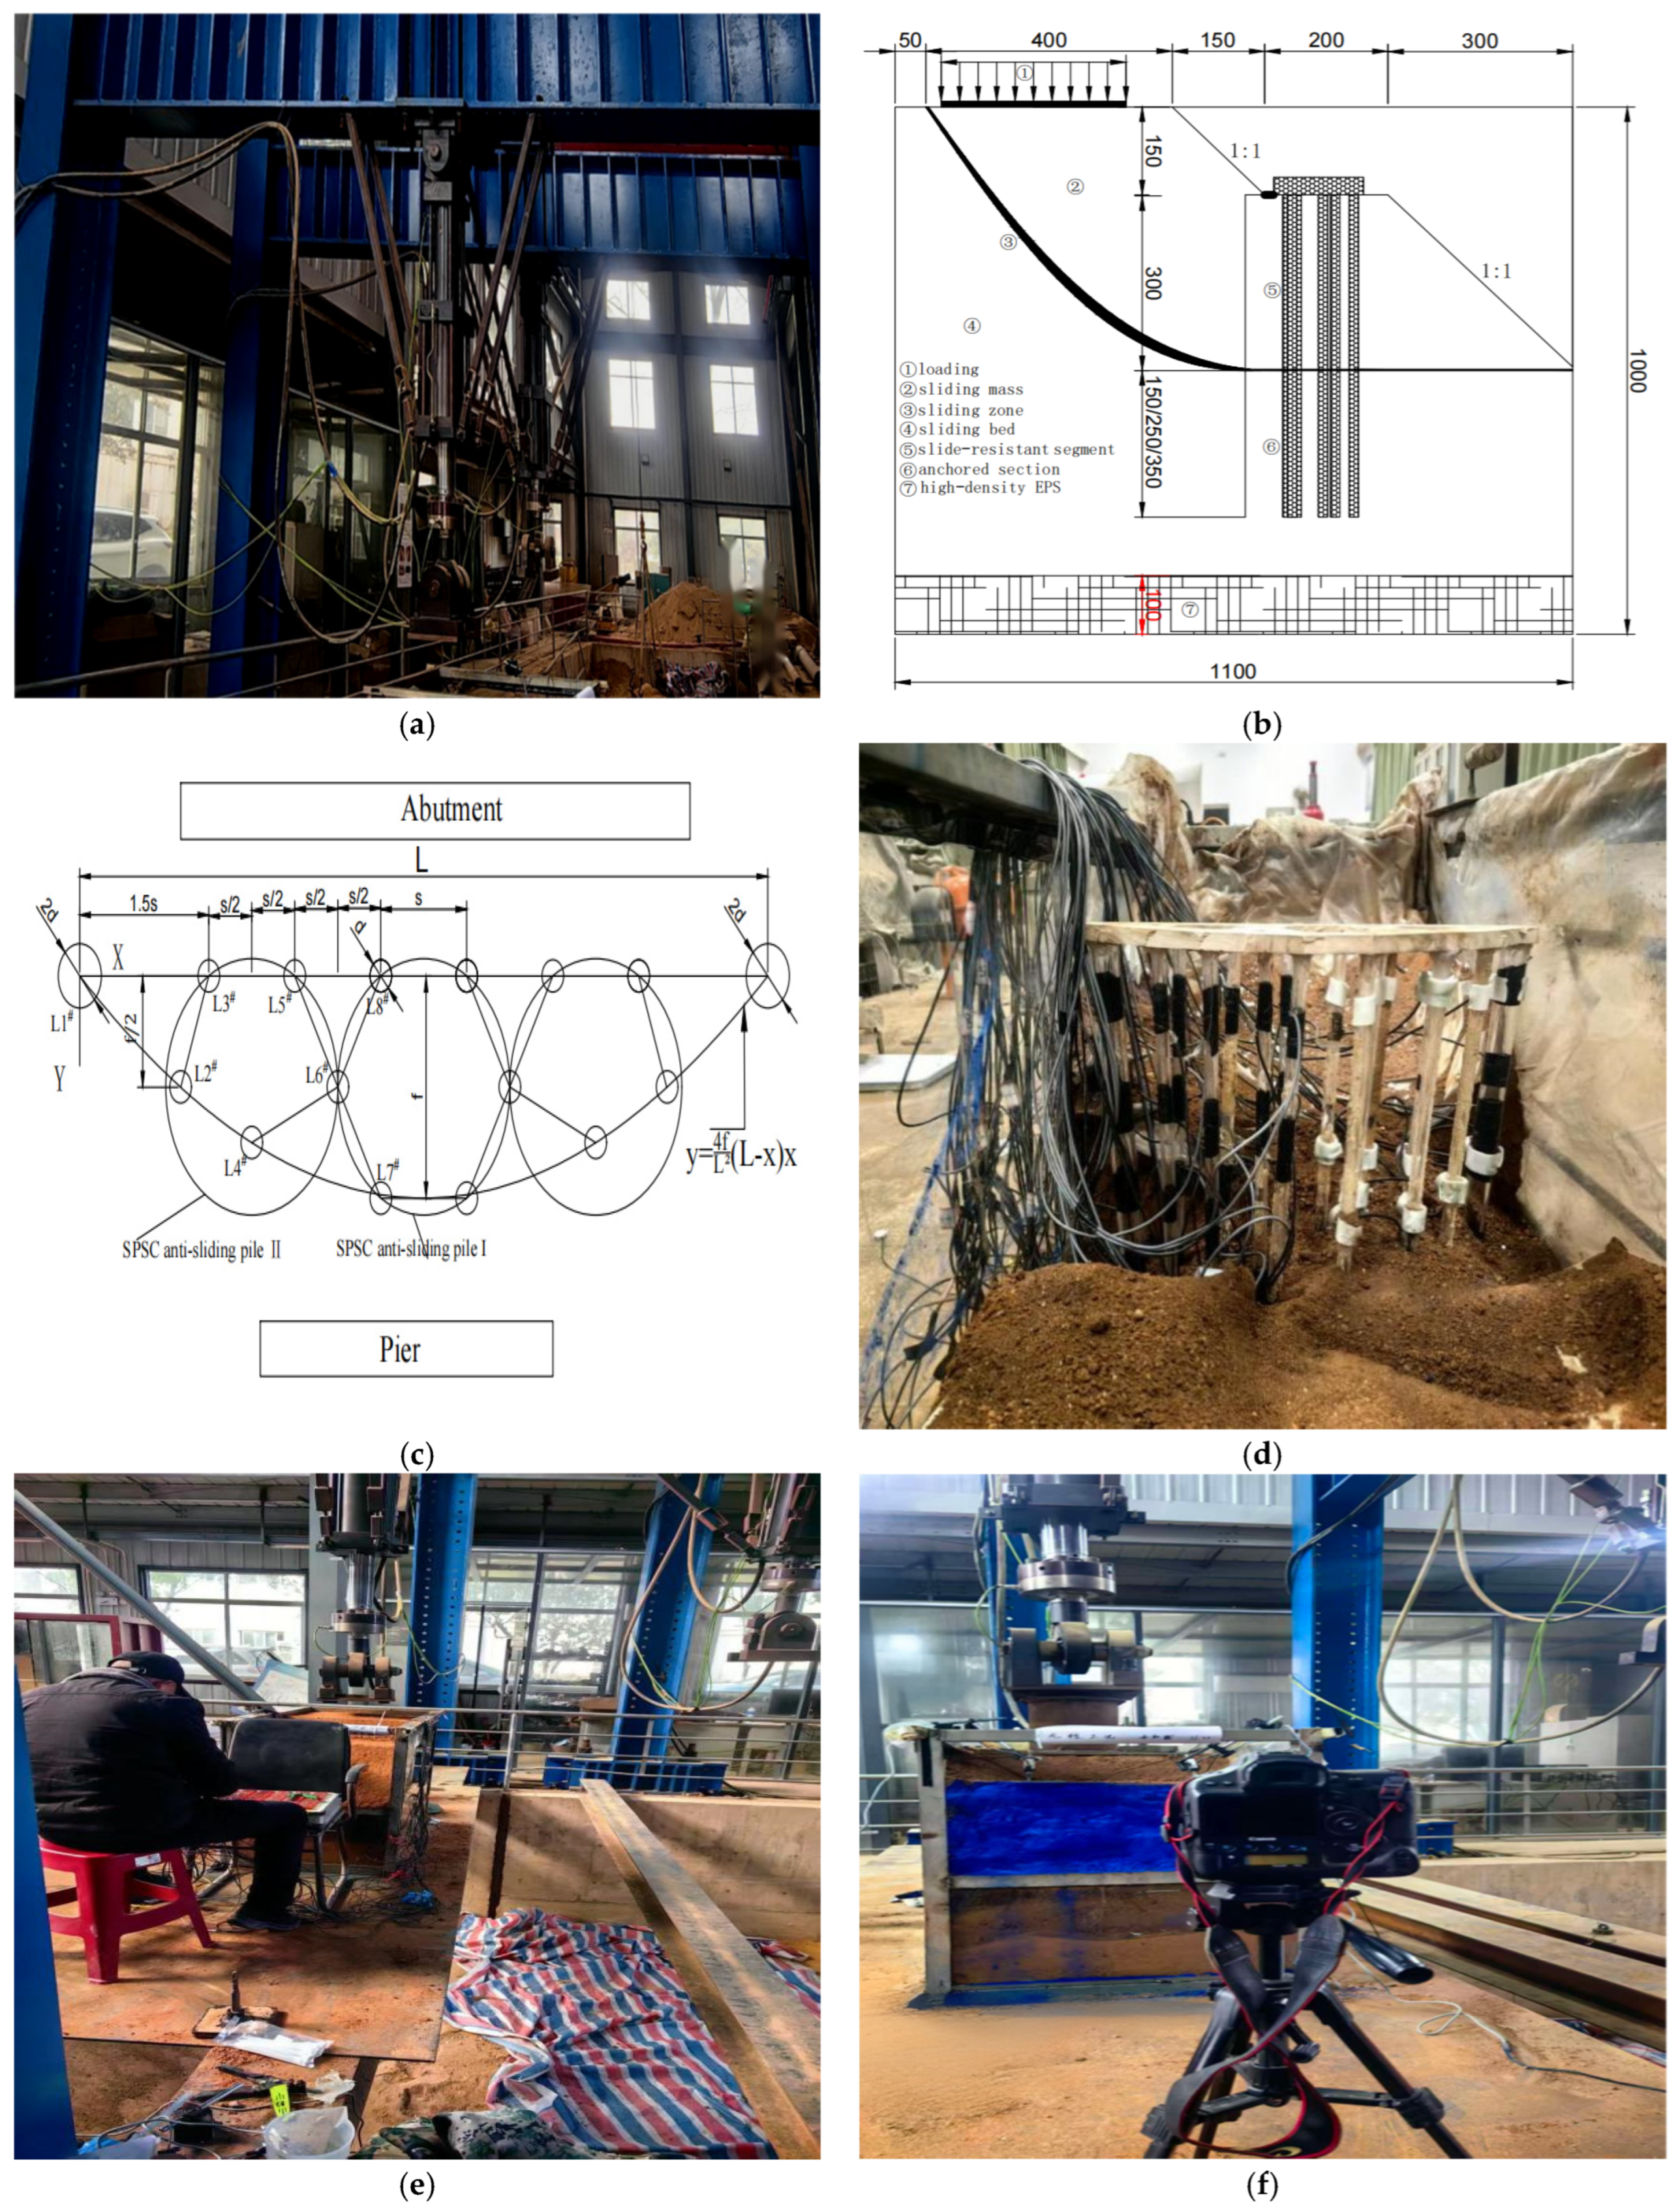
Section 2 introduces the physical scale model tests, including the similarity design, model setup, loading schemes, and measurement systems that are used to capture dynamic earth pressures and pile responses.
Section 3 presents a detailed analysis of the experimental results, covering earth pressure distribution patterns along pile depth and across rows, the rear pile thrust-sharing ratio, and pile-to-soil stress ratio, as well as the correlation between bending moments and earth pressure.
Section 4 draws the main conclusions of the study, highlights practical design recommendations for the SPSC-AC structure, and discusses the limitations of the current work along with potential directions for future research.
3. Influence of SPSC-AC Structure on Earth Pressure
3.1. Earth Pressure Distribution Patterns of the SPSC-AC Structure
3.1.1. Earth Pressure Distribution Along Pile Depth
Earth Pressure Distribution in the Loaded Section
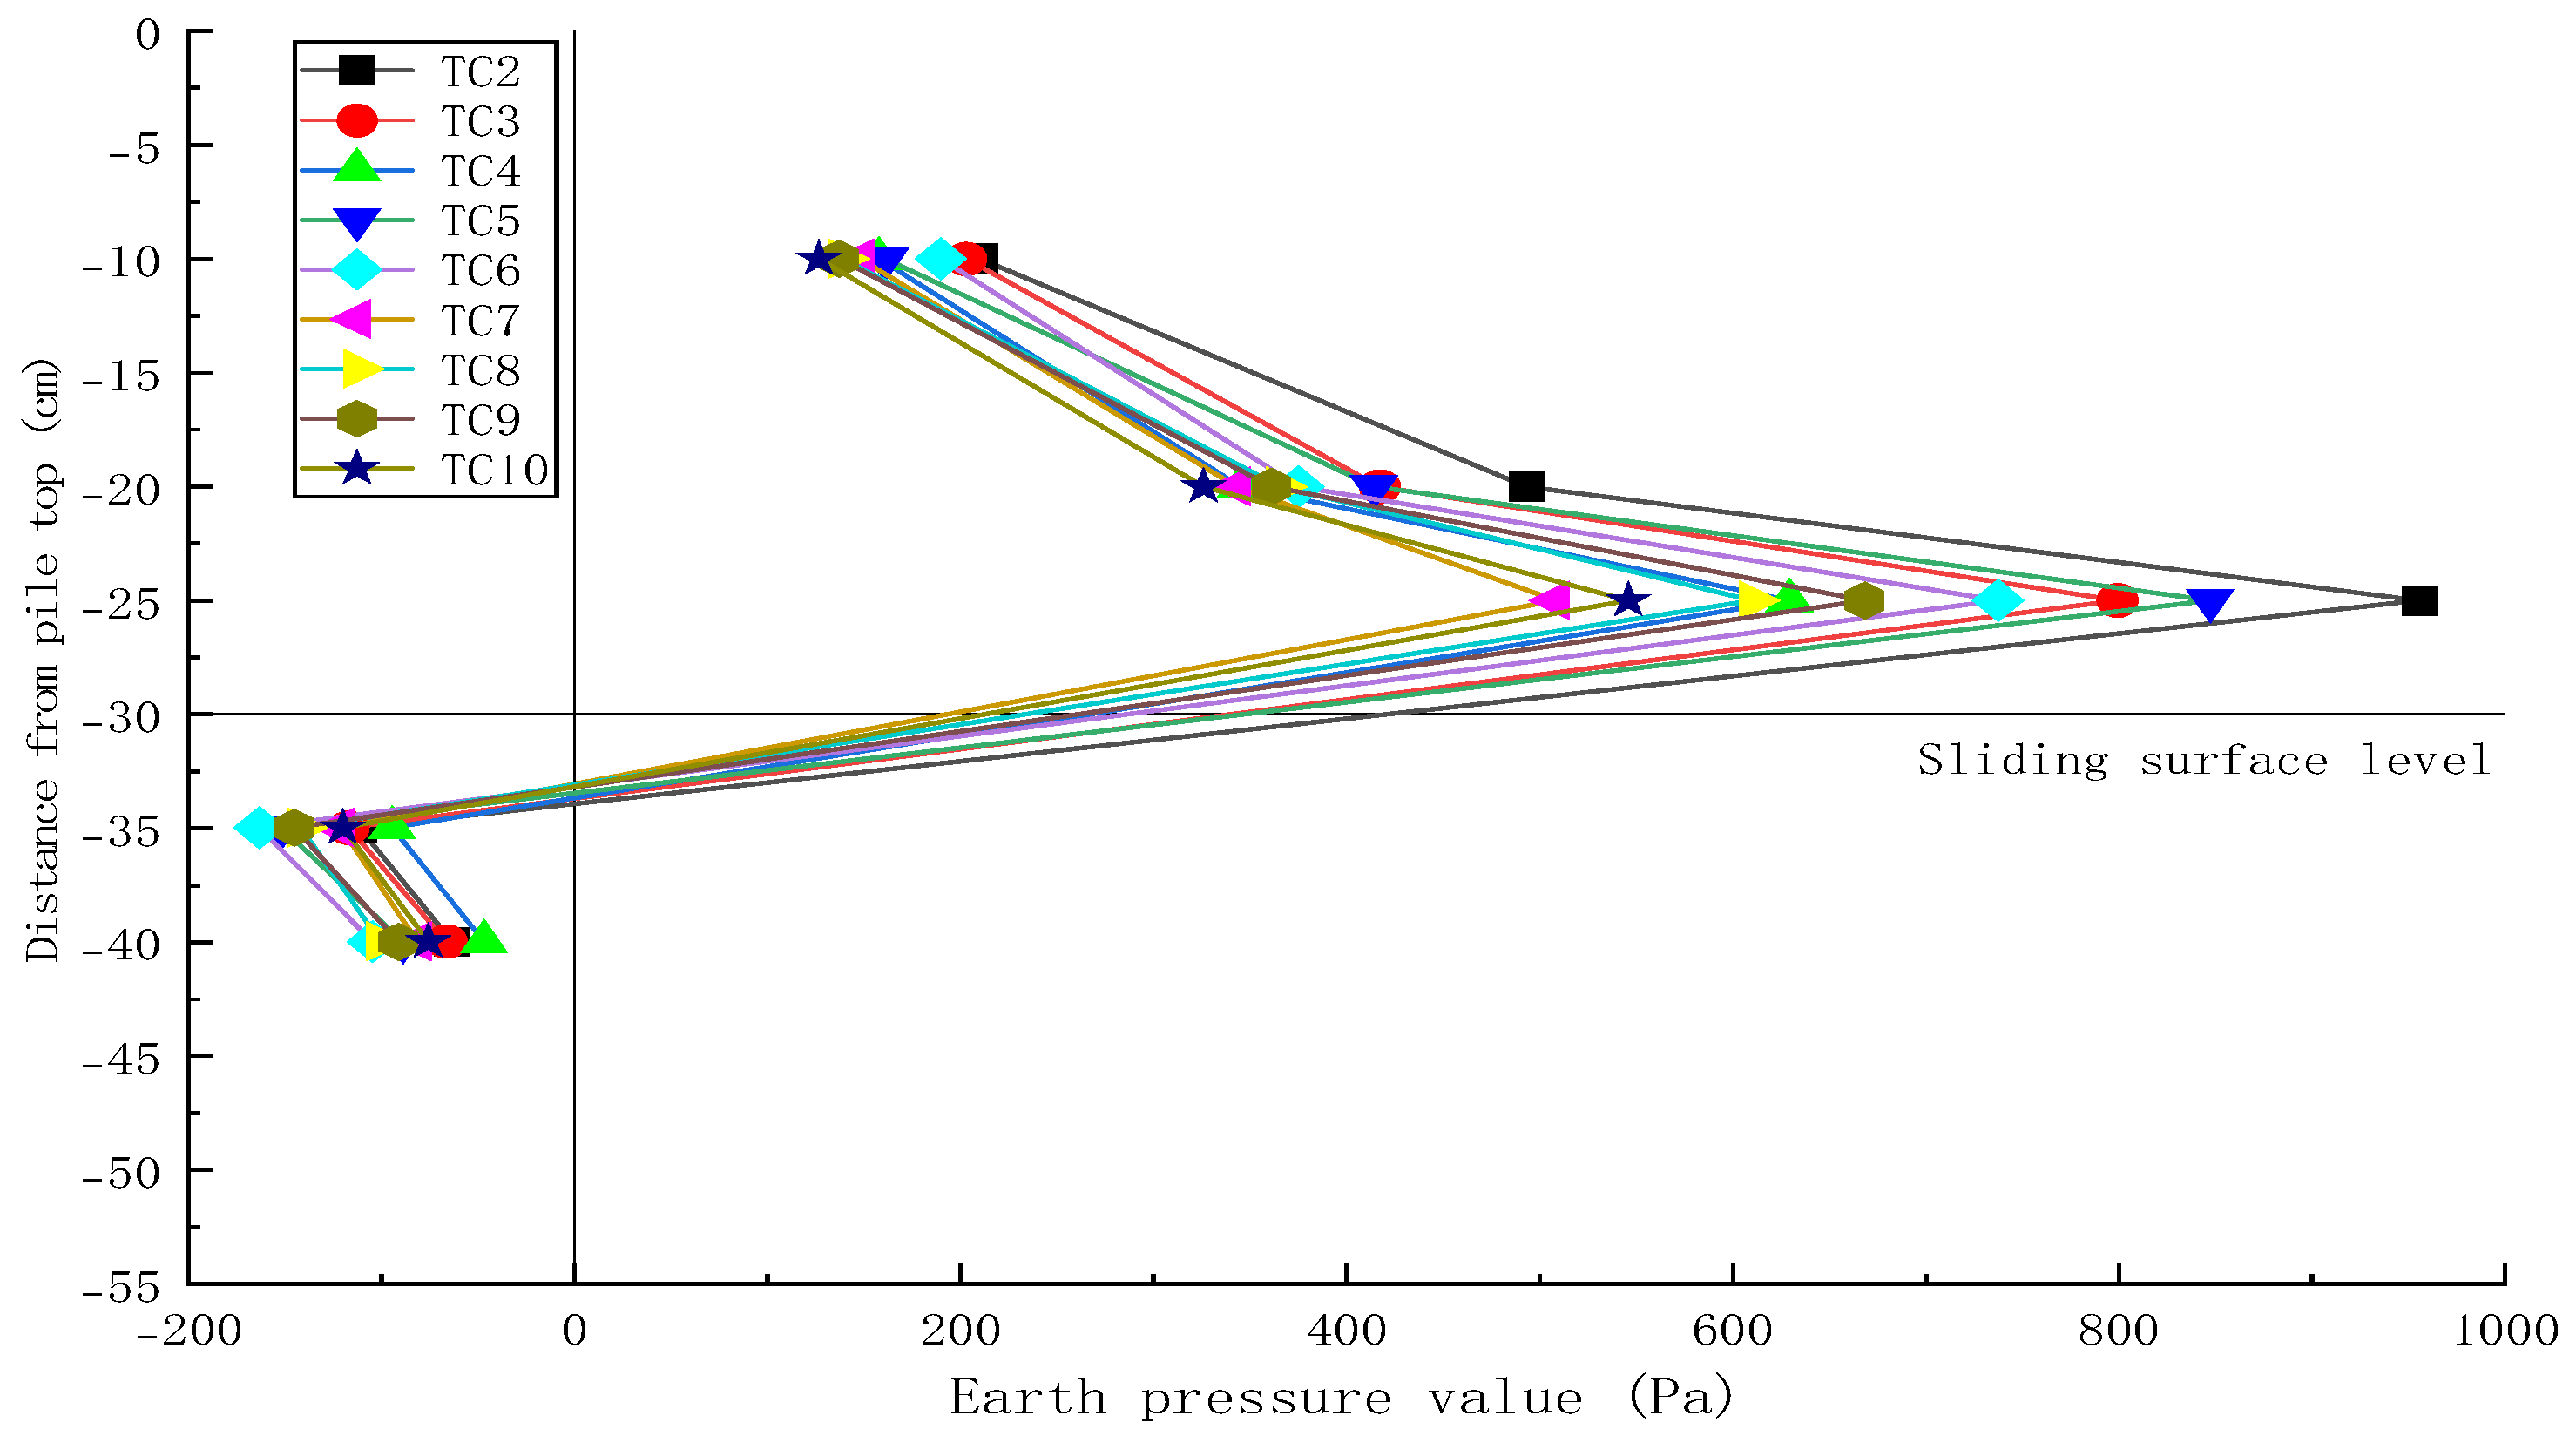
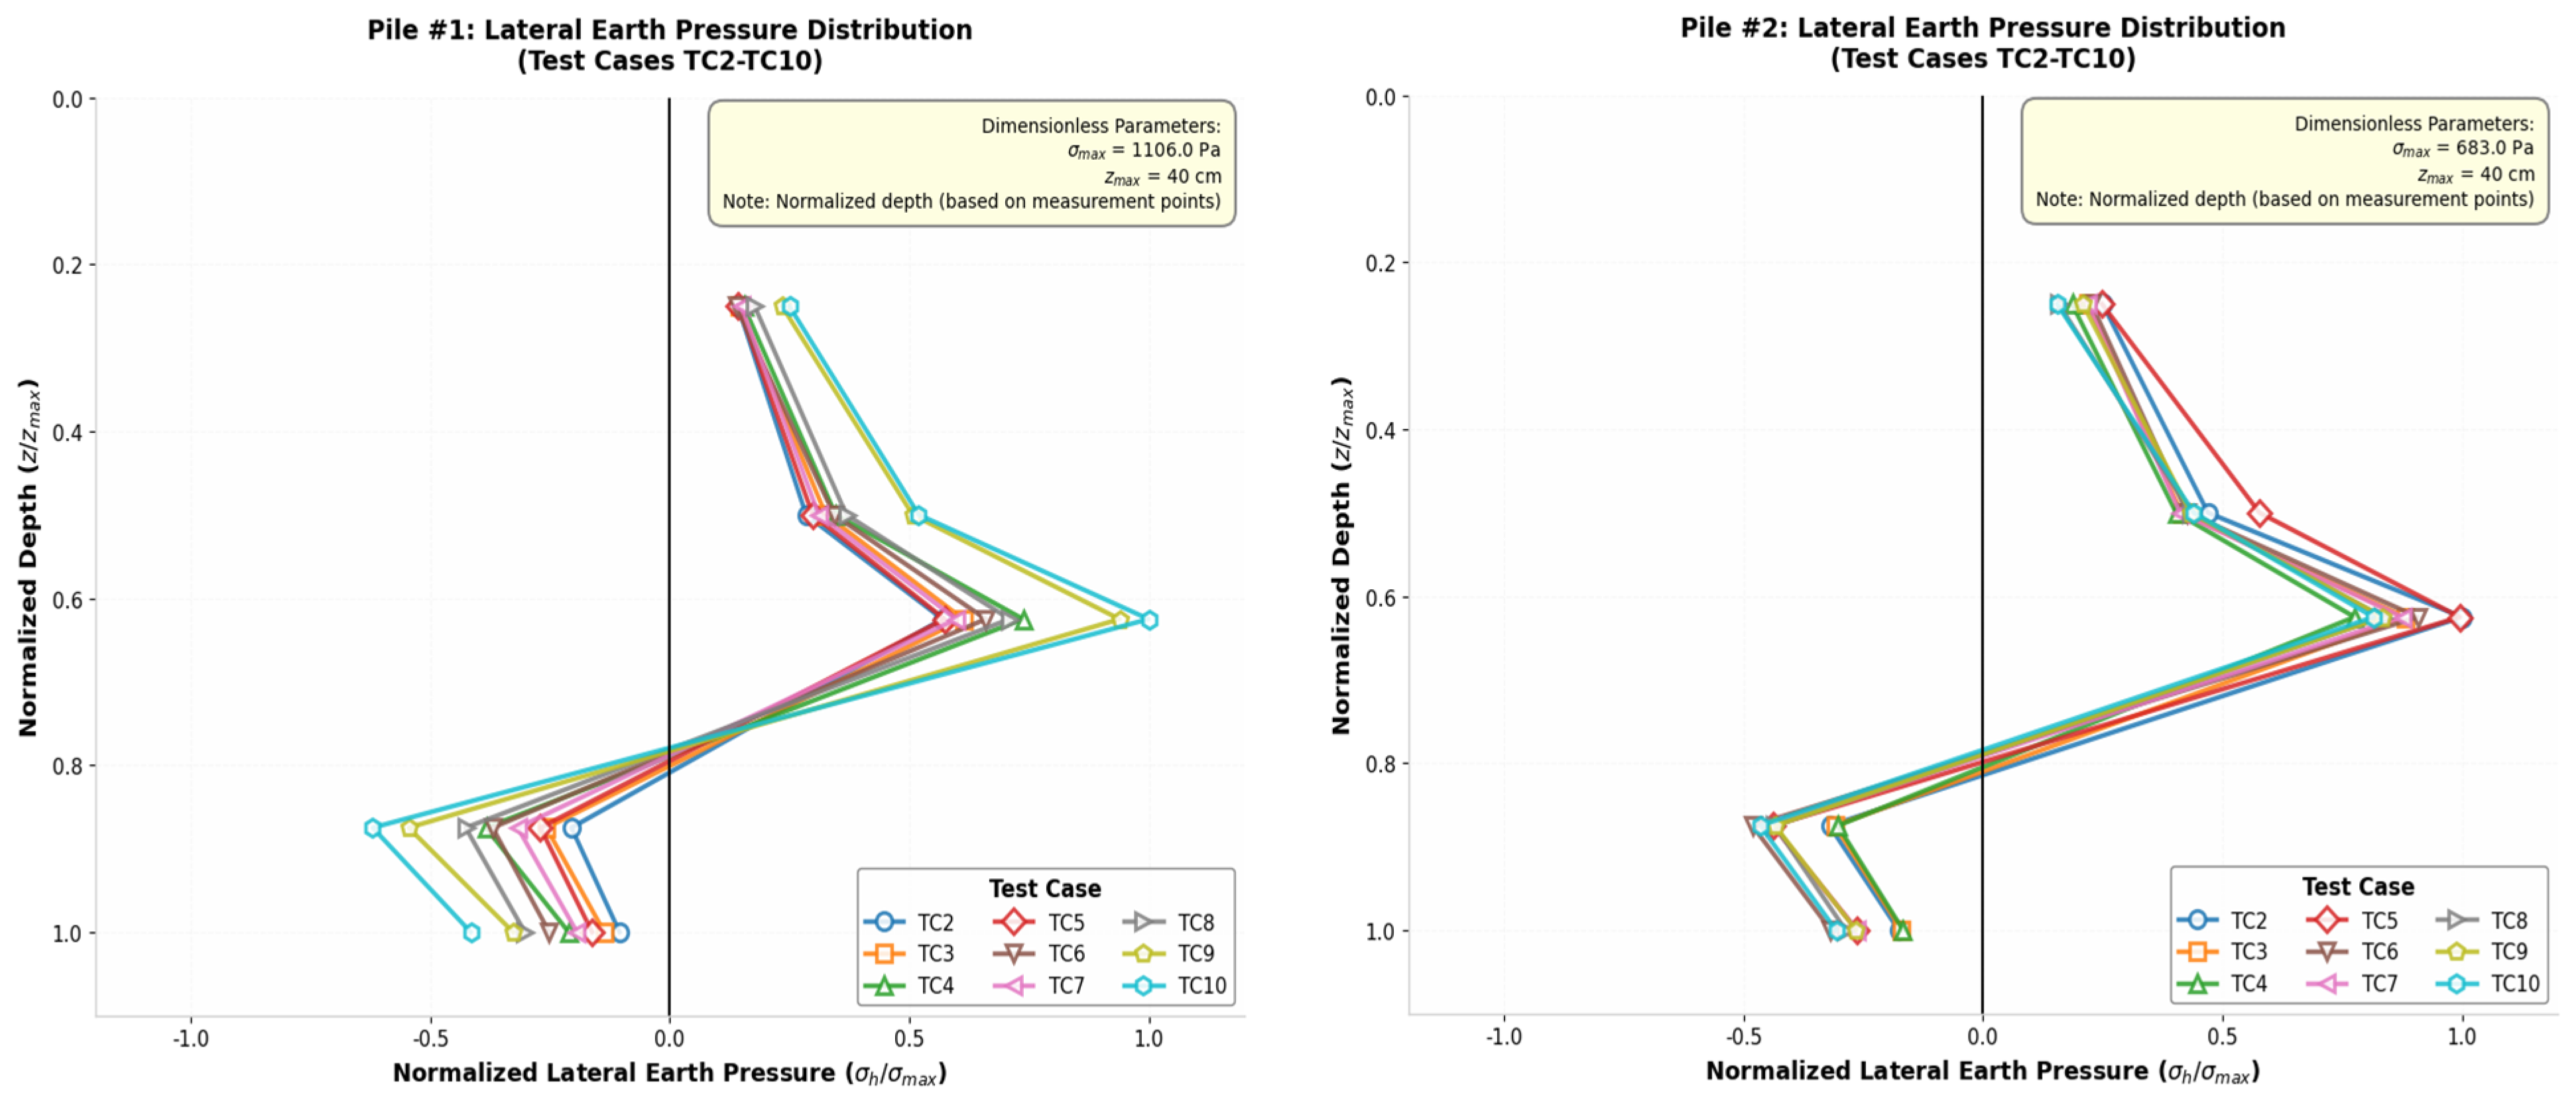
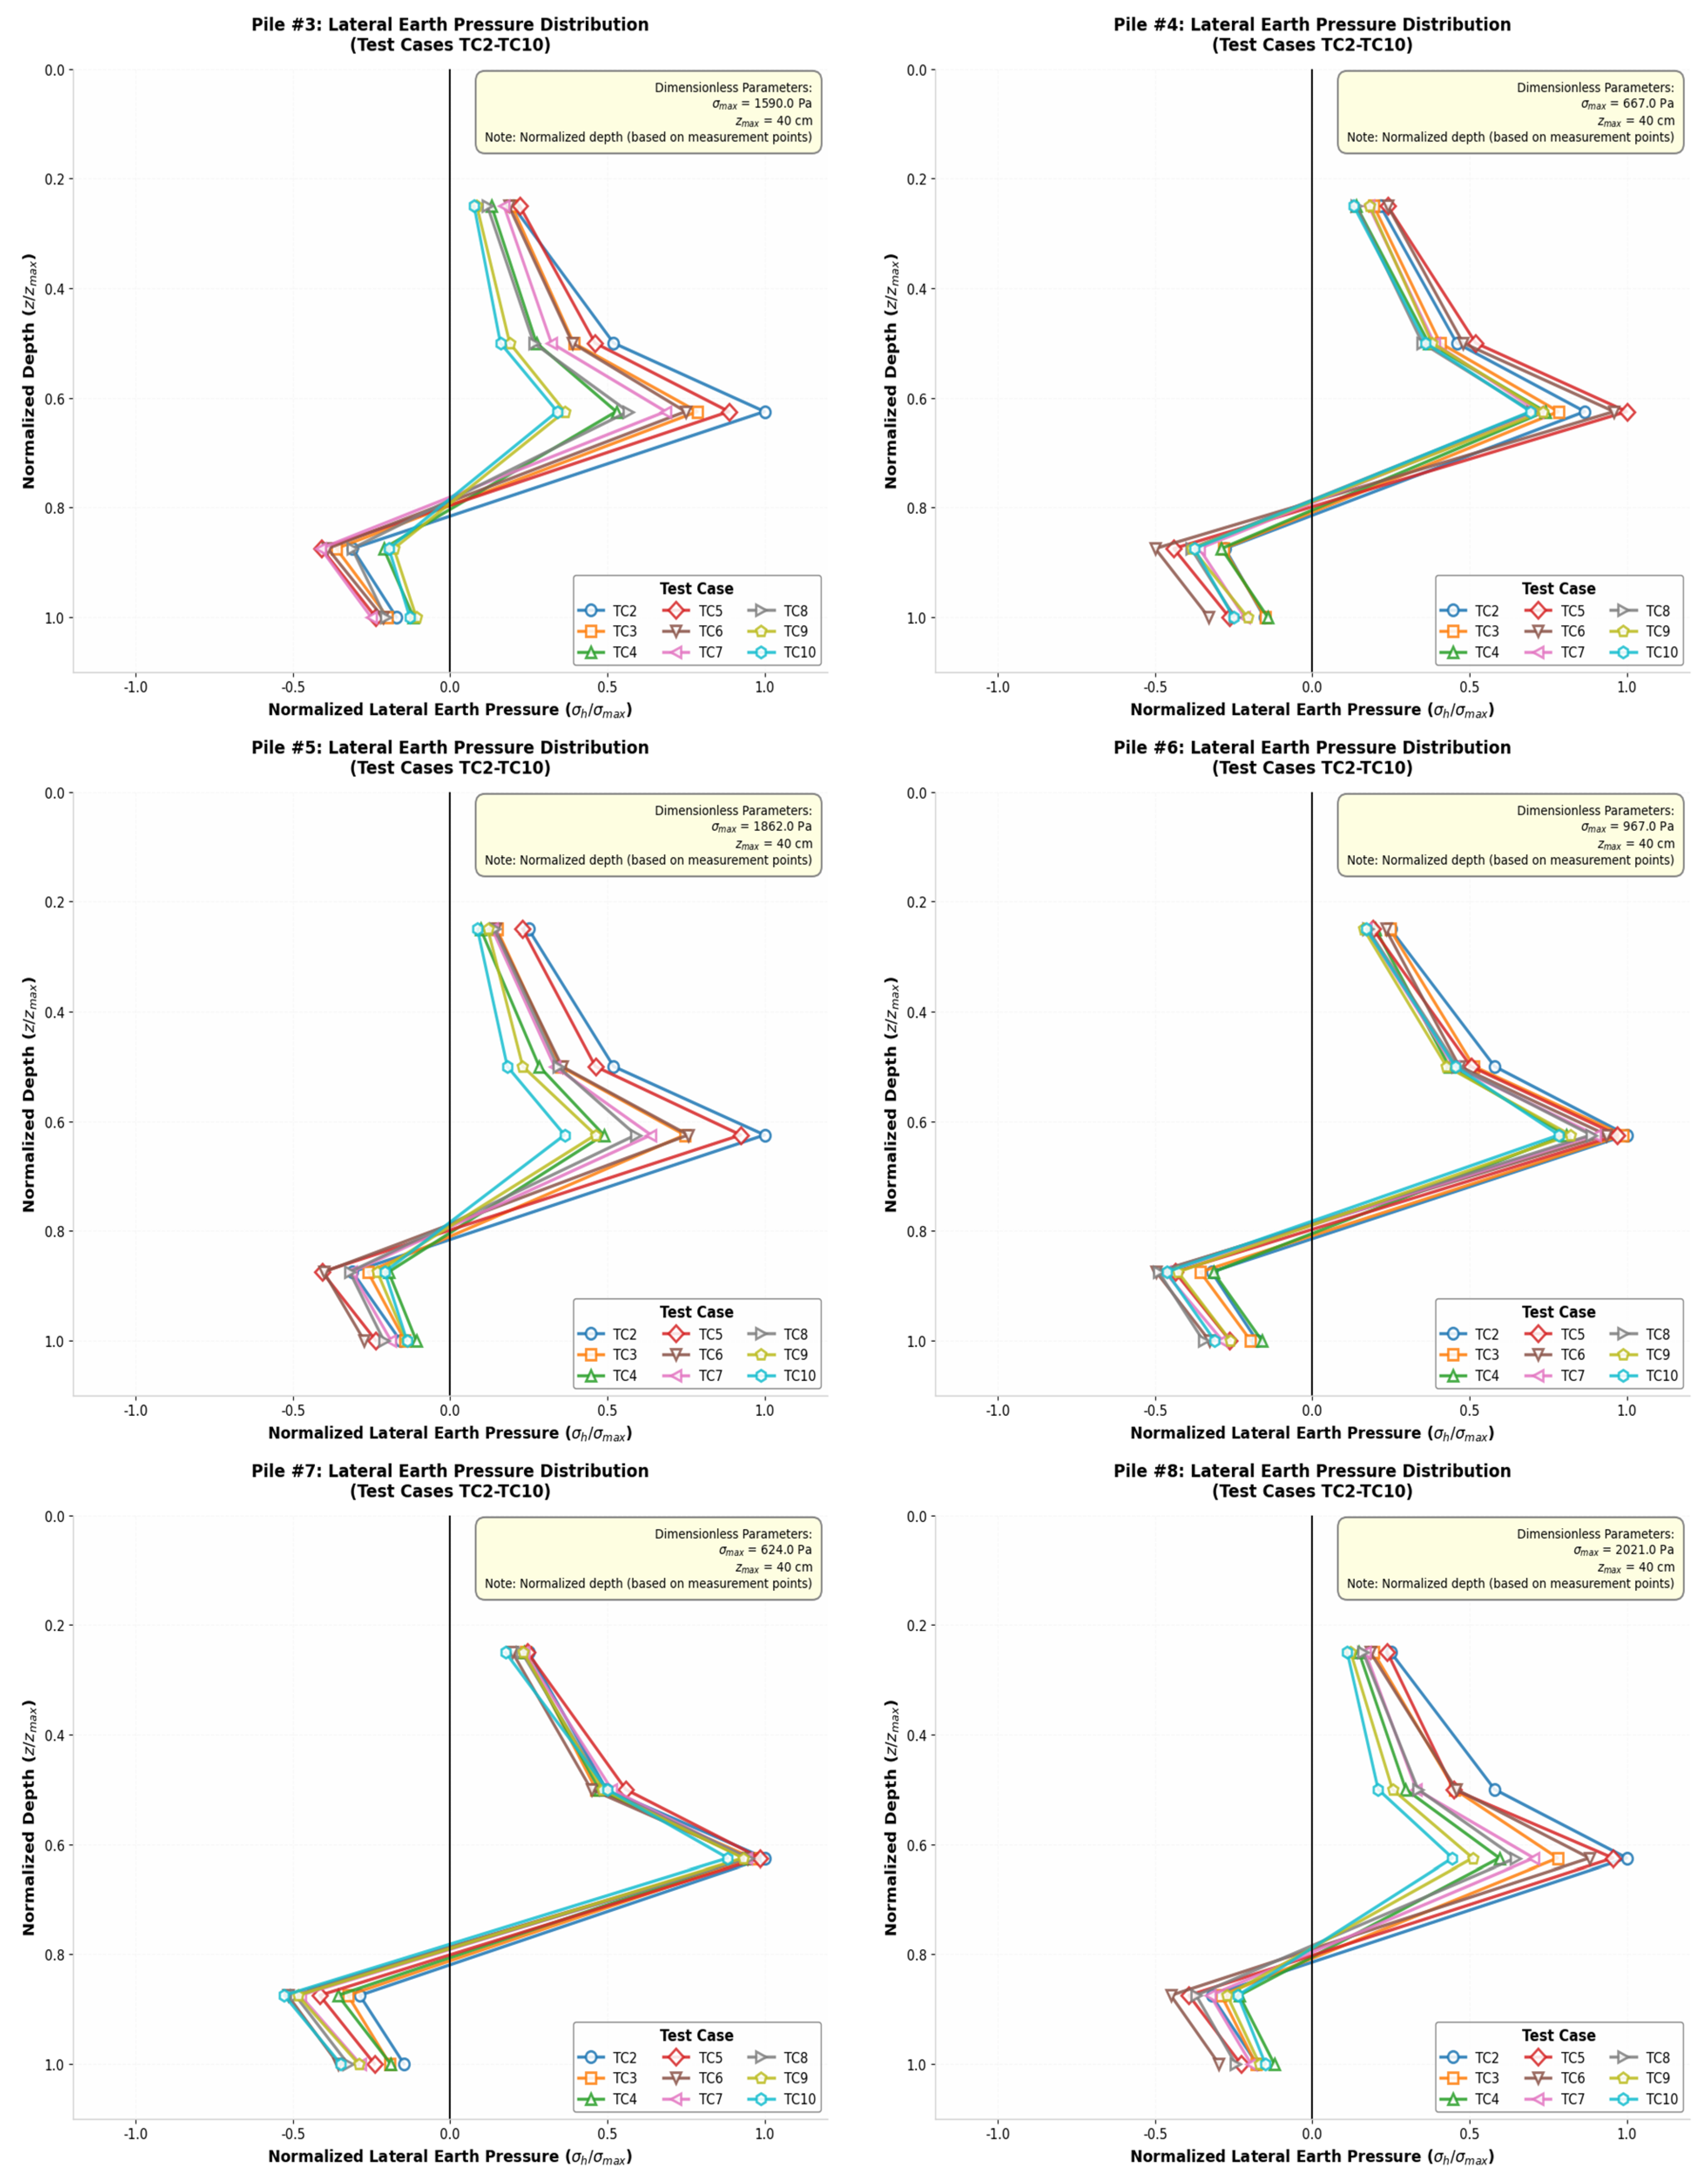
Earth pressure distributions are shown in
Figure 4. The measured earth pressure along the pile depth showed a non−linear distribution, with peak pressure located approximately 5 cm above the potential sliding surface. This behavior can be attributed to shear zone development and soil arching. Based on soil mechanics theory, the shear zone thickness in cohesive soil is primarily governed by cohesion and internal friction angle rather than particle size. For the tested clay (c = 15–25 kPa, φ = 14.5–18.5°), the estimated shear zone thickness ranged from 4 to 6 mm following the shear band theory for cohesive soils [
48], which corresponded to the observed peak location after considering the 1:20 scale effect. In addition, the three-dimensional soil arch formed by the SPSC-AC structure redistributed stresses toward the pile heads, producing stress concentration above the sliding surface. This is consistent with Karl Terzaghi’s concept of the critical depth of active earth pressure.
Earth Pressure Distribution in the Anchored Section
The earth pressure in front of the piles within the anchored section exhibits an inverted triangular distribution, characteristic of passive earth pressure. With increasing depth, the soil resistance acting on the pile from the sliding bed gradually decreases. This resistance increases with both the rise-to-span ratio and the anchorage ratio. Below a certain depth, the earth pressure rapidly decays, approaching zero near the pile base. The soil arching effect in front of the pile causes the earth pressure distribution to display nonlinear behavior. In the arch foot region (near the sides of the pile), stress concentration is evident, with locally elevated earth pressures.
3.1.2. Analysis of Earth Pressure Distribution in the Loaded Area
Inter-Row Differences and Reverse Increase Phenomenon of Corner Piles
Distinct variations in earth pressure were observed among pile rows, following the order: rear row > middle row > front row. This distribution indicates effective load redistribution within the arch–beam–pile coupling system. The rear row, located nearest to the landslide source, sustained the greatest thrust. Such a load gradient characterizes the SPSC-AC structure and contributes to its high load-carrying capacity.
The earth pressure on the arch foot pile (Pile #1) showed a pronounced reverse increase. With increasing rise-to-span and anchorage ratios, the peak pressure on Pile #1 increased from 630 Pa to 1106 Pa, reaching approximately 20% higher than that of the rear middle pile (Pile #8) in certain cases. Strain and bending moment measurements confirmed this trend. Both the growth rate and stable earth pressure of Pile #1 exceeded those of the middle piles, demonstrating the reverse load increase at the corner piles.
Synergistic Load Reduction Effect
As the rise-to-span ratio and anchorage ratio increased, the earth pressure on all pile rows decreased monotonically. At Measurement Point 3, located 25 cm below the pile top, the total earth pressure across nine test conditions decreased from 17,910 Pa to 11,116 Pa, corresponding to a reduction of 37.9%. This reduction reflects differences among structural configurations from TC2 to TC10, rather than a before-and-after comparison within a single condition. All tests employed the same loading protocol, namely a 1.0 Hz sinusoidal waveform with 14,400 cycles, F(t) = P0 + Pasin (ωt), where P0 = 12 kN and Pa = 2.4 kN. Therefore, the compaction effect remained constant across all cases and served as a controlled variable. The observed variations under different f/L and η combinations primarily resulted from structural optimization. In this comparative analysis, the compaction effect was effectively eliminated, and the 37.9% reduction directly reflected structural efficiency.
Extreme Value Location, Arch Toe Load Concentration, and Coupled Effects
Under all test conditions, the maximum earth pressure is observed near the sliding surface at the back of the rear row of piles (Measurement Point 3). This consistent occurrence indicates that the load is concentrated at this location, regardless of variations in structural design parameters. This finding is particularly critical for the structural design of the rear row of piles, as it identifies this zone as the most highly stressed and therefore requiring special design consideration and reinforcement.
When f/L ≤ 1/4, the structural curvature is relatively gentle, and the primary load is concentrated in the central region of the structure. Under these conditions, the earth pressure acting on the middle piles exceeds that on the Arch Toe piles. In contrast, when f/L ≥ 1/3 and η ≥ 5/11, the thrust-sharing ratio of the corner piles exceeds that of the middle piles, resulting in a “corner > middle” thrust distribution. These results demonstrate a complex coupling between curvature and anchorage ratio, thereby indicating that careful parameter optimization is required to achieve a balanced and efficient load distribution.
Although the measured earth pressure generally followed a triangular pattern, deviations from classical Rankine and Coulomb theories were identified. Using the soil parameters c = 25 kPa, φ = 18.5°, the measured peak pressure was 15–20% lower than the theoretical values. This reduction resulted from load redistribution within the SPSC-AC system, where soil arching transferred part of the lateral pressure to the anti-slide piles. In contrast, stress concentration at the arch feet produced pressures 20–30% higher than theoretical predictions, which are not captured by classical earth pressure theory. Accordingly, a soil arching reduction factor of 0.8–0.85 was introduced to modify the triangular distribution assumption for SPSC-AC structures.
Design Implications and Distinction Between Soil Arching and Stiffness Attraction
In the design of the SPSC-AC structure, particular emphasis should be placed on strengthening the Arch Toe (corner) piles. Design measures may include increasing the cross-sectional dimensions or the reinforcement ratio of the corner piles. Alternatively, the anchorage ratio of these piles can be appropriately increased to enhance their embedment capacity and overall load-bearing performance.
Load distribution was governed by soil arching and stiffness attraction. Soil arching accounted for more than 90% of the load increase at the corner piles, resulting from relative displacement and stress transfer toward the arch feet. Stiffness attraction contributed approximately 5%, due to the stiffness difference between arch foot piles and ordinary piles. Soil arching represents a dynamic evolution process, whereas stiffness attraction is an inherent static structural characteristic.
3.1.3. Analysis of Loading and Anchoring Peaks of the Arch Toe Piles
Comparison of Loading and Anchoring Peaks and Parameter Influences
Across the nine test conditions examined in this study, the ratio between the loading peak and the anchoring peak ranges from 1.61 to 2.78. This result indicates a non-uniform load distribution along the pile, with the loaded section experiencing significantly higher stress levels than the anchored section.
As the rise-to-span ratio increases from 1/5 to 1/3, the peak value in the anchored section increases by nearly 80%, highlighting the strong influence of structural geometry on anchoring performance. The anchorage ratio has a significant effect on the peak earth pressure in the anchored section of Pile #1. When the rise-to-span ratio is held constant, increasing the anchorage ratio from 1/3 to 7/13 results in an increase of more than 60% in the peak earth pressure of the anchored section. Additionally, the location of the peak shifts downward as the anchorage ratio increases, indicating deeper stress concentration with greater embedment.
Upper Unloading–Lower Pressing Dual-Peak Convergence Effect
For cases with a small rise-to-span ratio and low embedment, the ratio between the upper unloading peak and the lower pressing peak is approximately 1:0.36. In contrast, under conditions of a larger rise-to-span ratio and higher embedment, this ratio increases to approximately 1:0.62, reflecting a convergence of the dual-peak stress response.
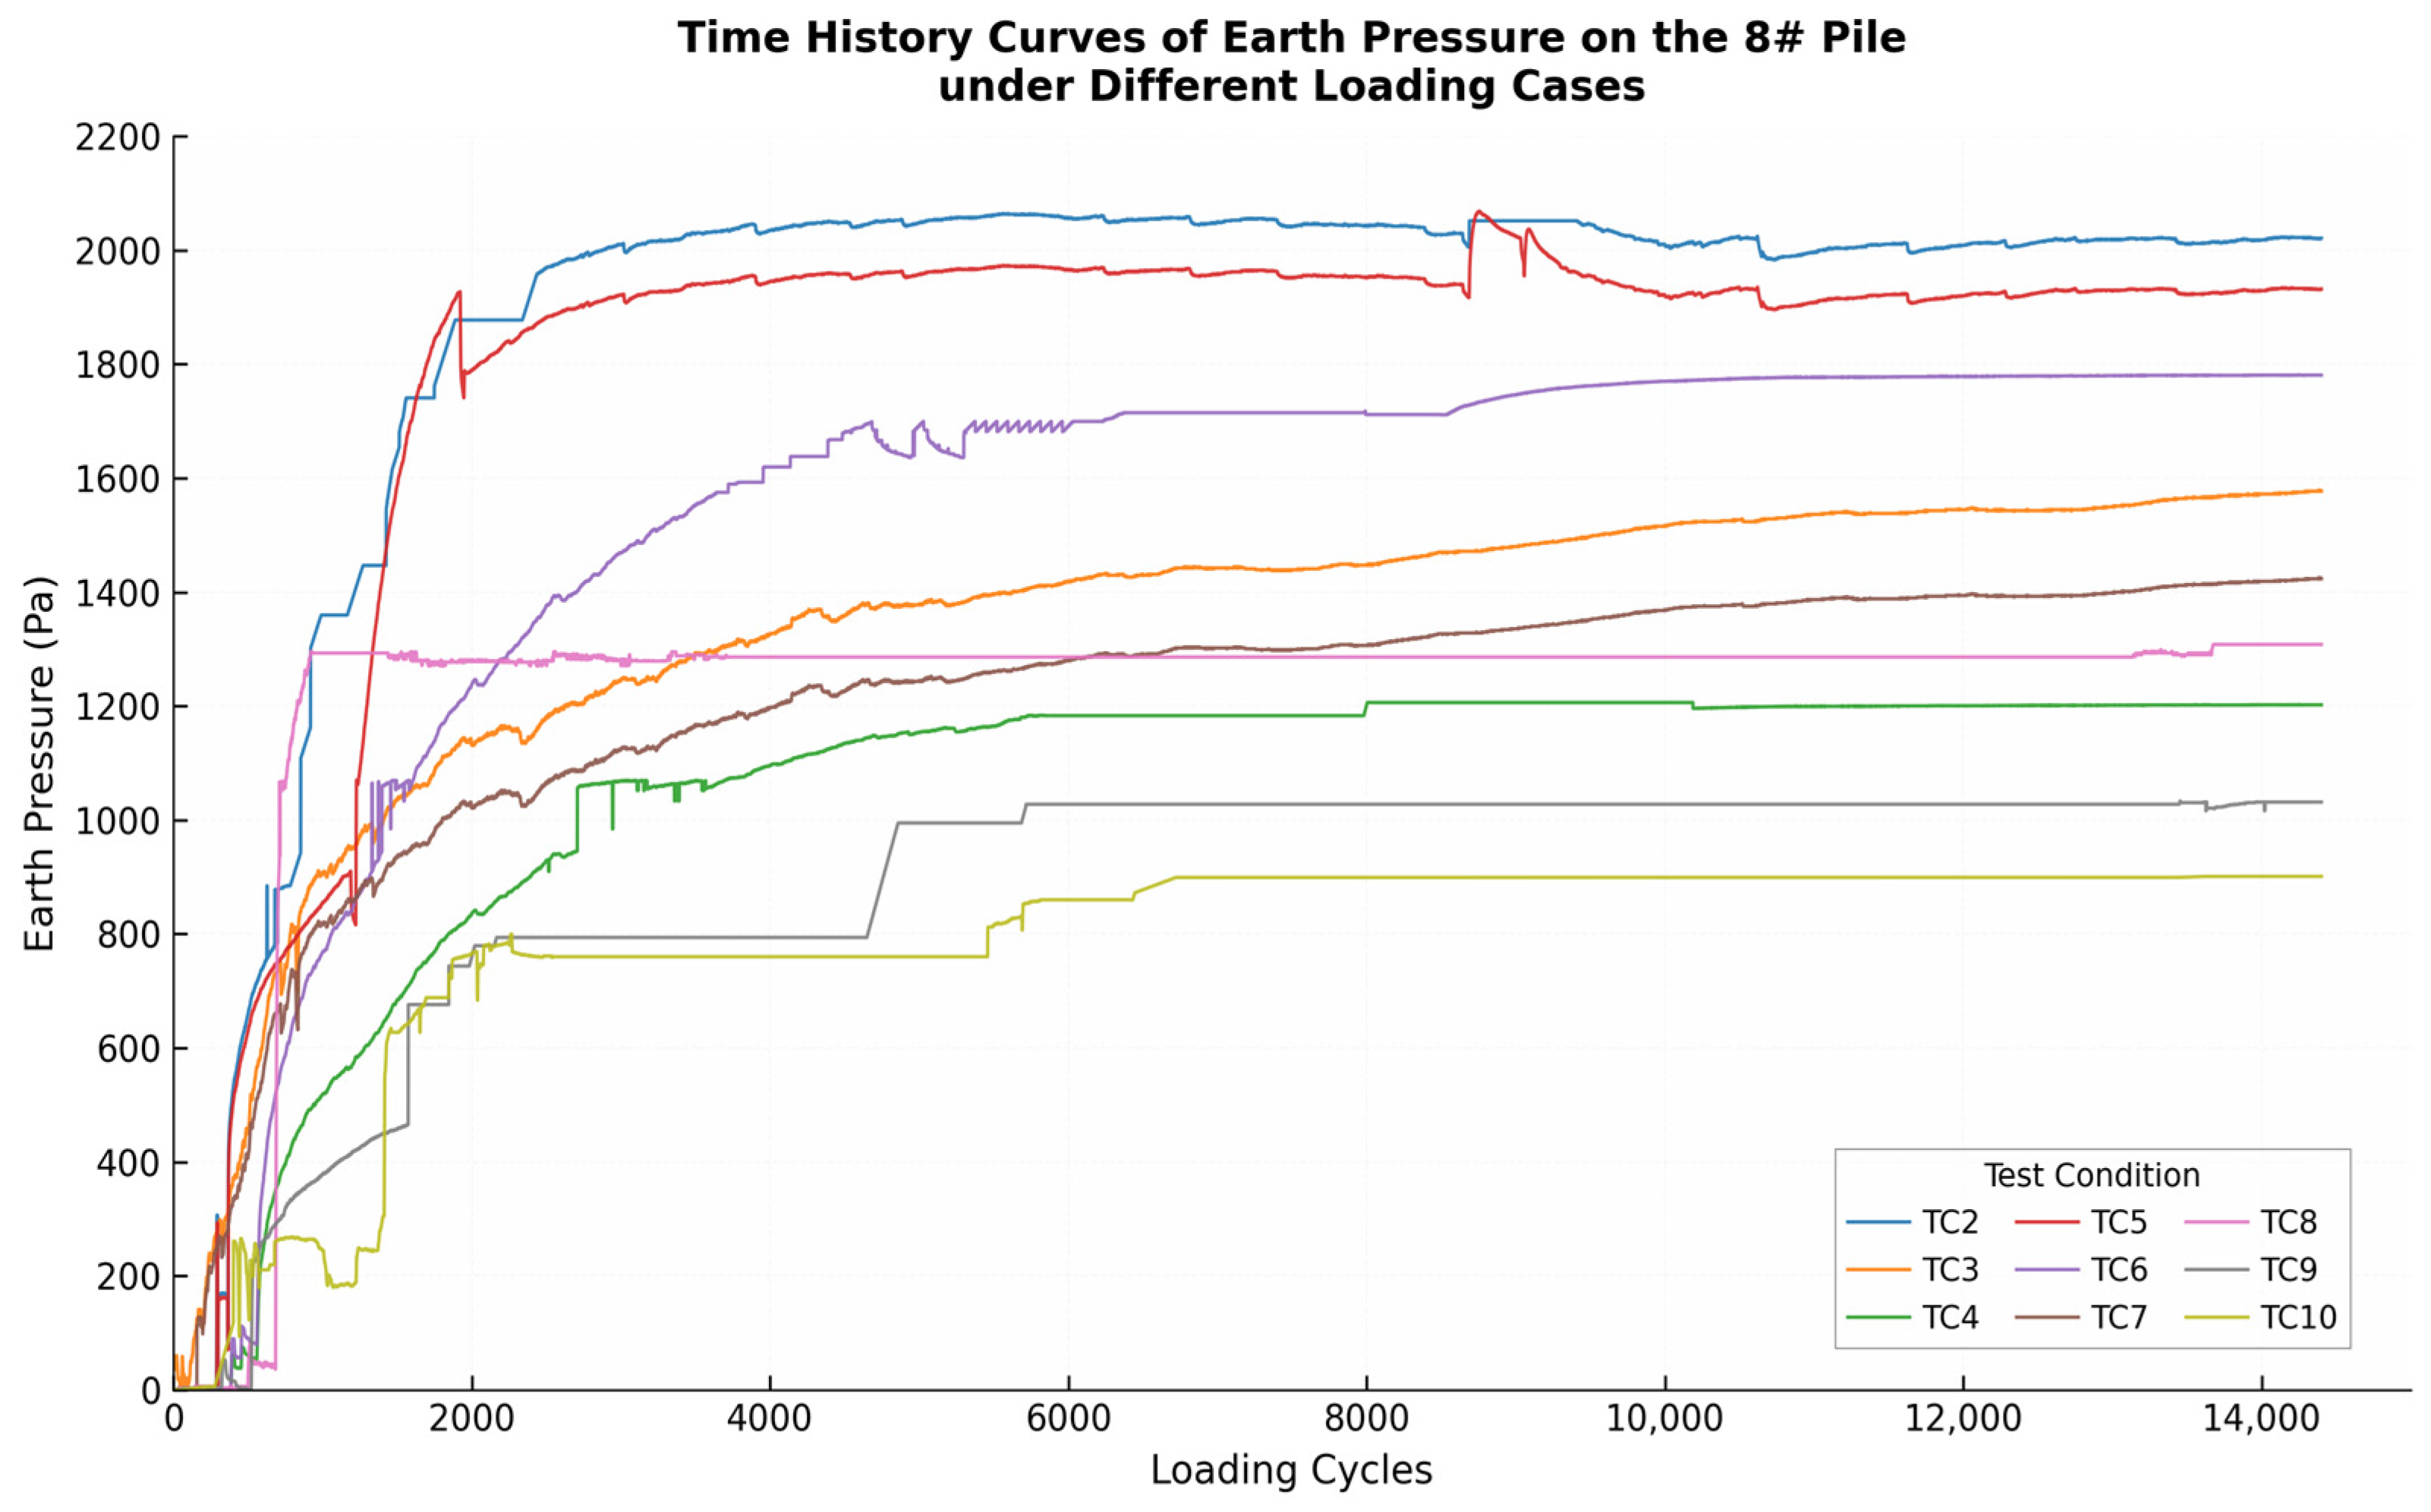
3.1.4. Three-Stage Characteristics of Earth Pressure Time History
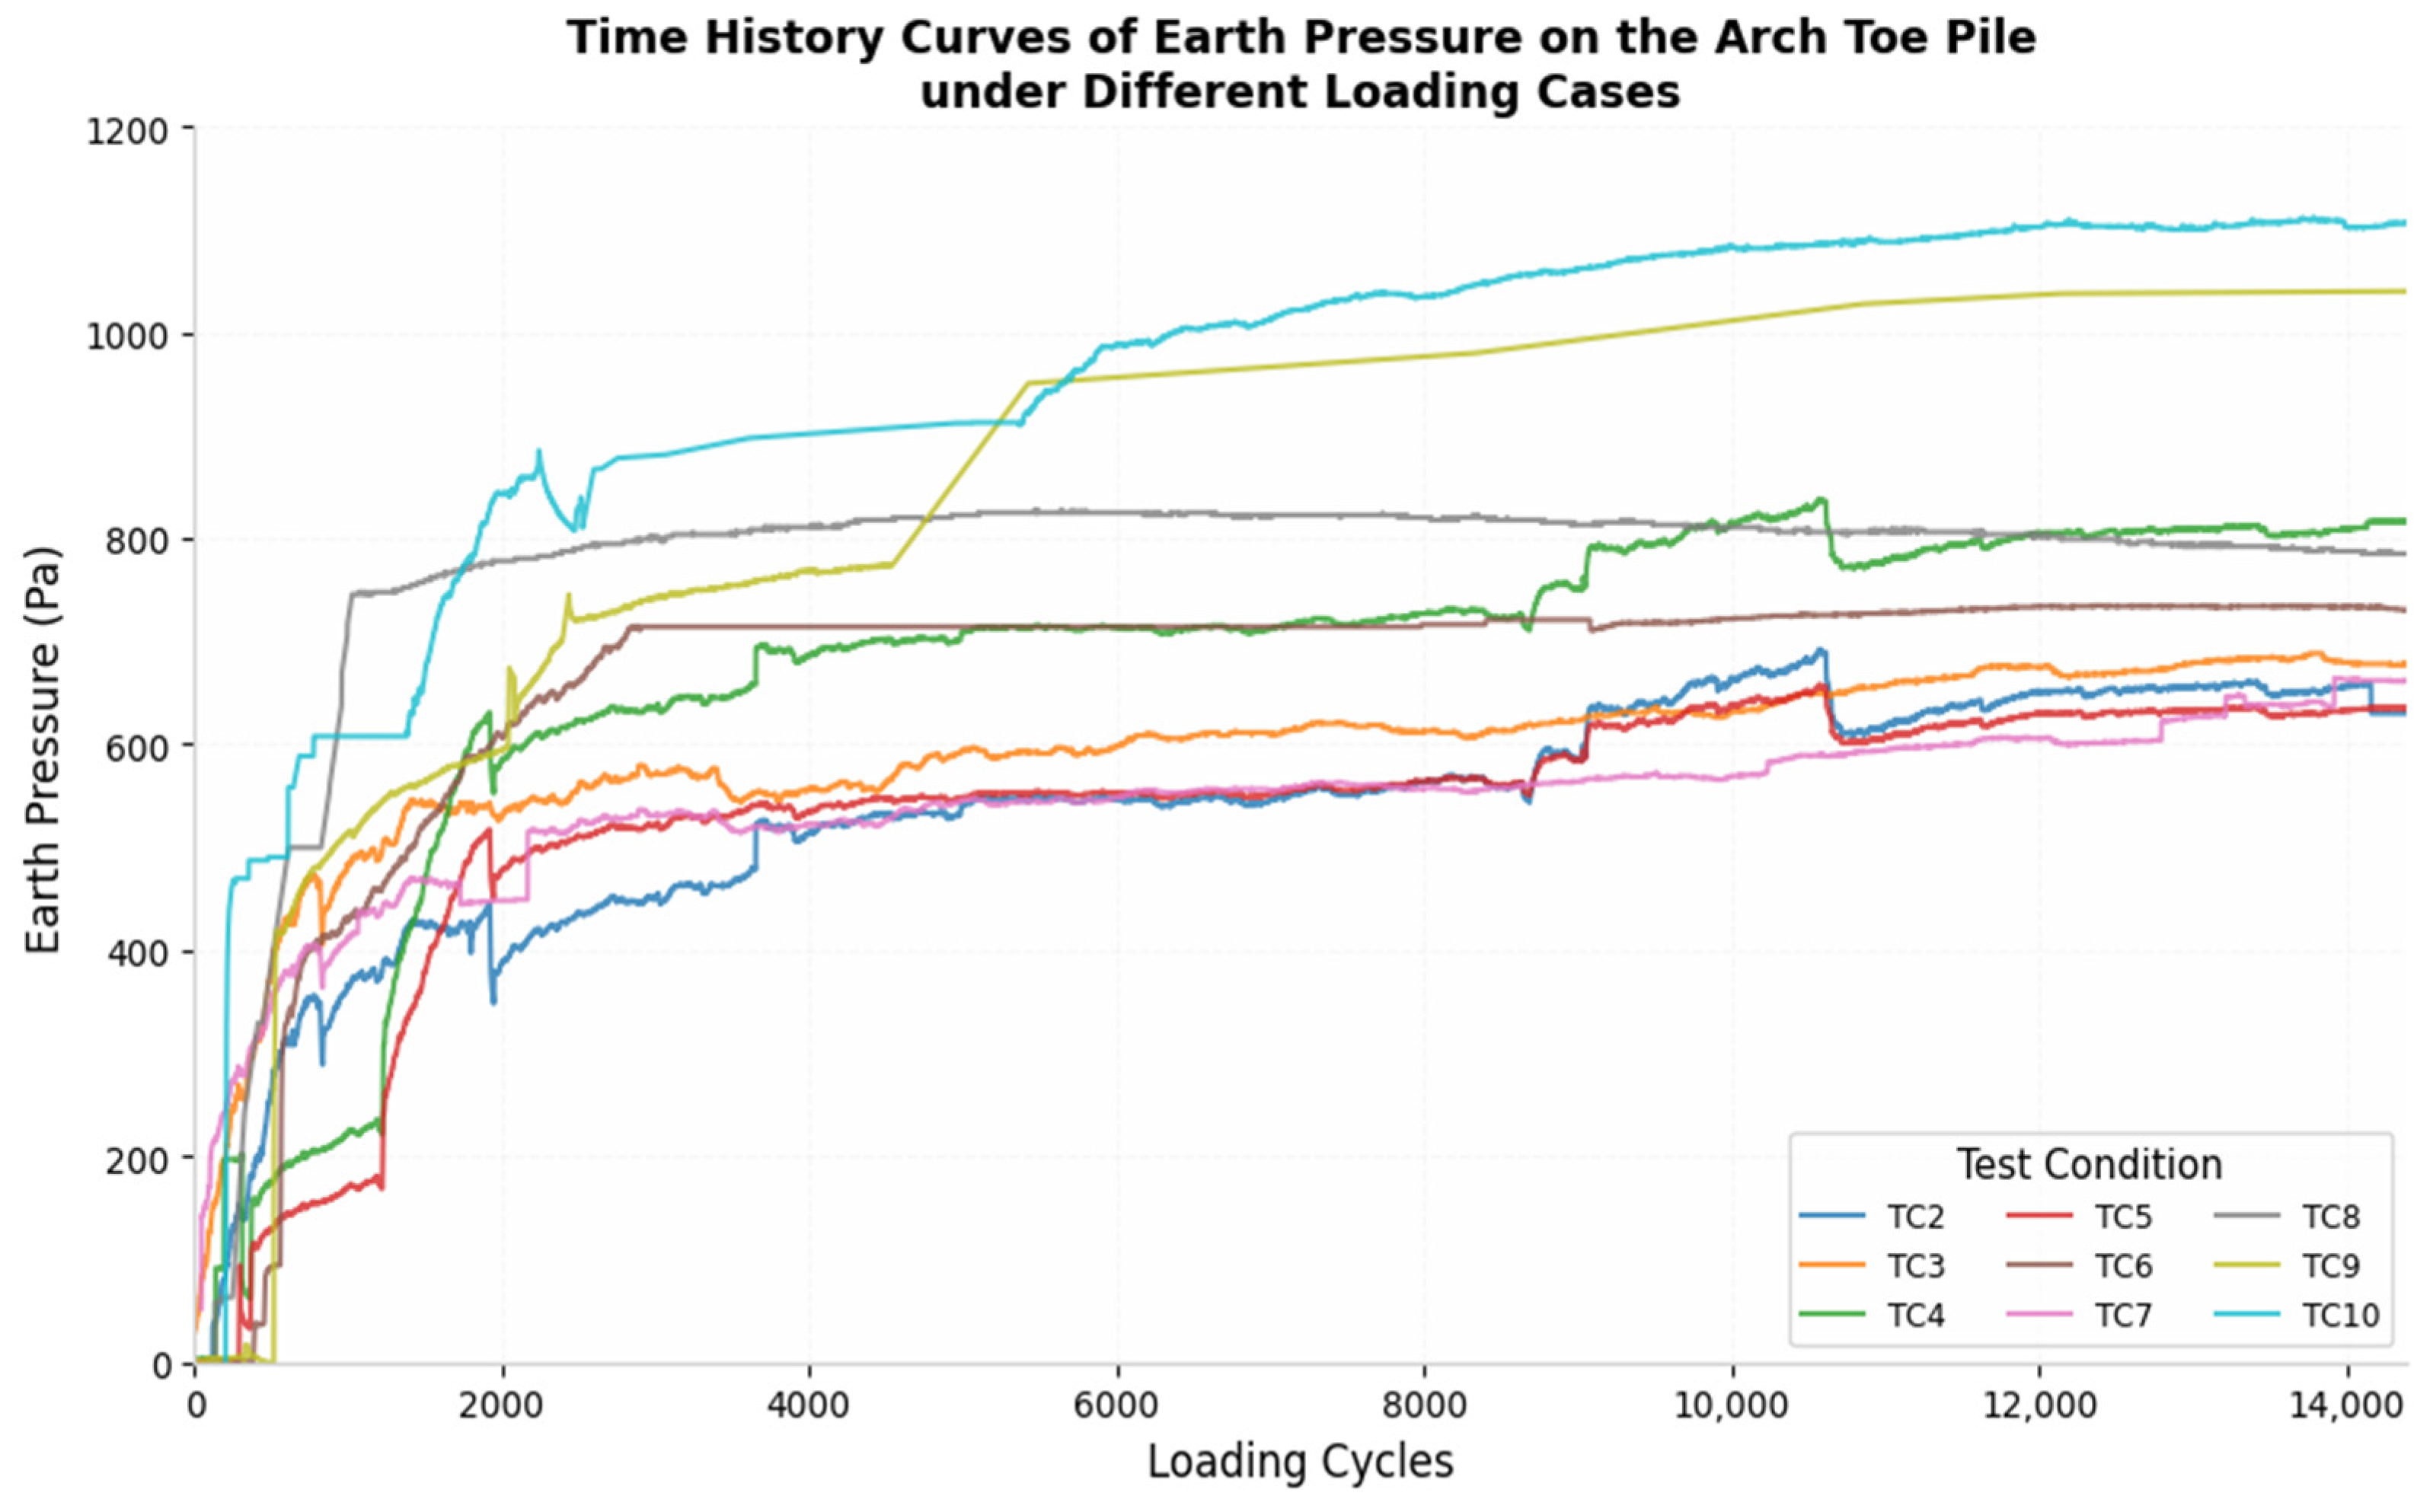
During the four-hour loading process, distinct three-stage characteristics were observed in the magnitude and evolution of earth pressure both behind and in front of the piles.
Figure 5 and
Figure 6 illustrate the time history variation in earth pressure at Measurement Point 3 for the SPSC-AC structure under nine test conditions over 14,400 loading cycles.
Linear Growth Stage
During the initial loading stage (0–40 min), the earth pressure increases in an approximately linear manner with loading time.
Deceleration Stage
As loading continues (40–200 min), the soil becomes progressively compacted, leading to stress concentration behind the piles and stress relaxation between adjacent piles. During this period, the soil arching effect gradually develops and begins to govern load transfer. Consequently, the slope of the earth pressure–time curve decreases, and the system transitions from an elastic compression regime to an arch-type load transfer mechanism.
Steady Stage
Once the soil arching effect is fully established (>200 min), stress redistribution within the pile–soil system is essentially complete. Earth pressure at each measurement point stabilizes, and the time history curves tend to become nearly horizontal.
3.1.5. Earth Pressure Distribution in Inter-Pile Soil
Earth Pressure Distribution in Inter-Pile Soil of the Coupled Structure
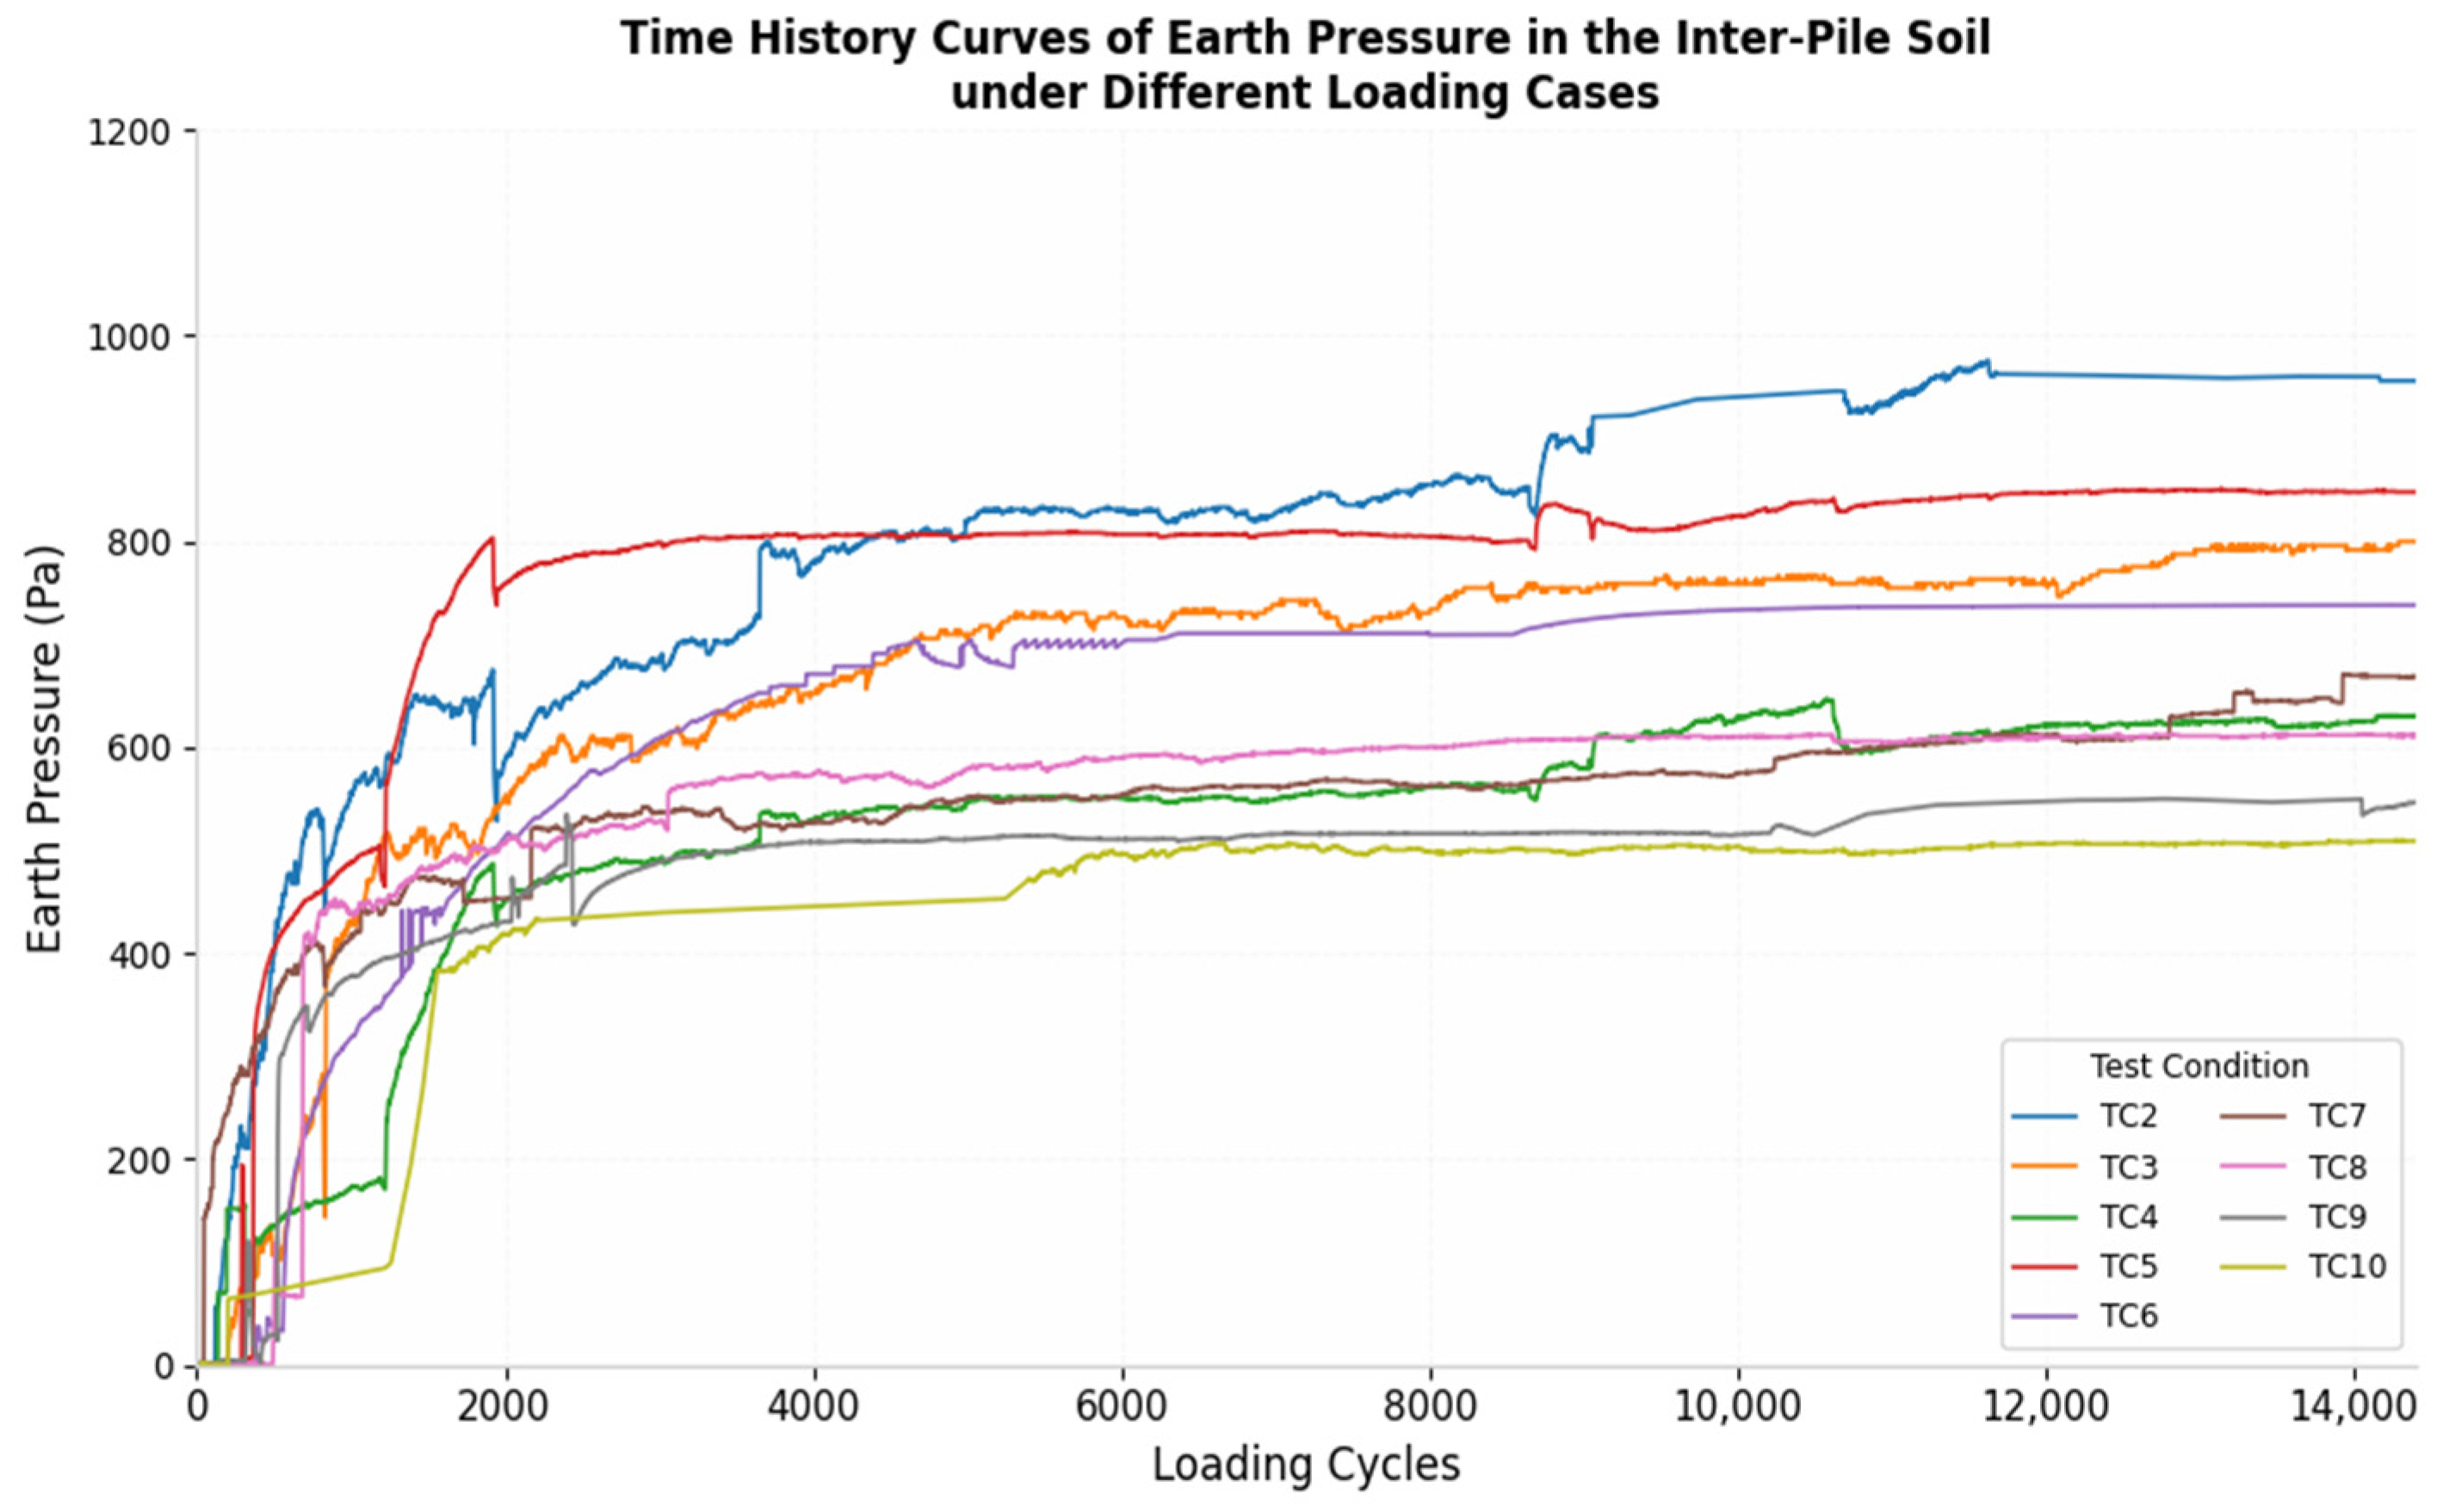
As shown in
Figure 7, the earth pressure measured in the inter-pile soil above the sliding surface ranges from approximately 80% to 89% of that measured on Pile #6 (the central pile in the middle row) across all test conditions. Below the sliding surface, the variation in inter-pile earth pressure is more complex; however, its magnitude is generally about 30% to 35% of the passive earth pressure acting on Pile #6. This value is consistently much lower than the peak passive earth pressure measured on the pile back at the same depth, thus confirming the shared load-bearing mechanism of the pile–soil coupled structure.
Influence of Rise-to-Span Ratio and Anchorage Ratio
Owing to stress concentration induced by the soil arching effect, the reduction in inter-pile earth pressure is approximately 5% greater than that observed on the pile back, while the absolute inter-pile earth pressure remains lower than the corresponding pile-back stress at the same depth. With an increase in the anchorage ratio, earth pressures on both the pile back and within the inter-pile soil decrease synchronously, and the relative difference in their reductions shrinks to about 3%.
Time Variation in Earth Pressure in the Inter-Pile Soil
Figure 8 shows the time history curves of earth pressure in the inter-pile soil.After 14,400 cycles, the inter-pile earth pressure remained stable, indicating that the soil arch was elastically compacted without degradation. The interface friction coefficient increased slightly during the first 0–4000 cycles and then stabilized at 0.35–0.40 up to 14,400 cycles, demonstrating stable performance under long-term train loading. The underlying mechanisms are as follows: the maximum sliding displacement in each cycle is small, allowing the arch geometry to be largely restored; high-frequency micro-vibrations elastically compact the soil, slightly increasing the stiffness of the arch; and after 4 h, the soil arching effect shows no signs of degradation, with inter-pile earth pressure remaining steady rather than decreasing in steps.
3.1.6. Pressure Reduction Mechanism of the SPSC-AC Structure
Owing to the structural symmetry, only the results for eight representative piles are presented. Model test results indicate that increasing the anchorage ratio from 1/3 to 7/13 can reduce the maximum earth pressure on the pile back by 20% (
Table 3).
3.2. Relationship Between Rear Pile Thrust-Sharing Ratio and Rise-to-Span & Anchorage Ratios
3.2.1. Theoretical Analysis
Effect of Rise-to-Span Ratio on Rear Pile Thrust-Sharing Ratio
The rear pile thrust sharing ratio was defined as δ = TR/T, where TR denotes the total thrust of rear piles, and T represents the total thrust of all piles. The calculation was performed as follows: (1) earth pressure data were collected; (2) the thrust of each pile was obtained by integrating the earth pressure along the pile depth; (3) TR and T were determined by summation; and (4) δ was calculated and averaged over three repeated tests. The coefficient of variation was less than 8%, with a 95% confidence interval of [0.58, 0.68].
Effect of Anchorage Ratio on Rear Pile Thrust-Sharing Ratio
The anchorage ratio significantly influences the anti-overturning and anti-sliding performance of the SPSC-AC structure under large landslide thrusts. By adjusting the stiffness of the anti-slide piles, the anchorage ratio regulates the distribution of thrust. For instance, when the rise-to-span ratio is fixed at 1/5, increasing the anchorage ratio (η) from 1/3 to 5/11 and then to 7/13 decreases δ from 68.0% to 66.3% and then to 65.0%. This adjustment enhances the coordination between the inter-pile soil arch and the tie beam.
Synergistic Effect of Rise-to-Span and Anchorage Ratios
For example, from test condition 2 to test condition 10, both the rise-to-span ratio (f/L) and the anchorage ratio (η) increase significantly, while the rear pile thrust-sharing ratio (δ) decreases markedly from 68.0% to 58.0%, demonstrating the combined influence of these two parameters.
3.2.2. Derivation of the Formula for Rear Pile Thrust-Sharing Ratio
Theoretical Basis and Assumptions
The derivation of the formula is based on data from nine model test conditions. The core assumption is that the rear pile thrust-sharing ratio (δ) can be expressed as a function of the rise-to-span ratio and anchorage ratio. To balance simplicity and engineering applicability, it is further assumed that the relationship can be represented by a non-linear model: δ = a + b/(c·f/L + d·η + 1), where a, b, c, and d are coefficients to be determined. Before establishing the mathematical model, both f/L and η are normalized to the range of [0, 1]. Although δ, f/L, and η are all dimensionless, their actual numerical ranges differ significantly, making normalization necessary for stable and accurate regression fitting.
Normalization of Parameters
The min-max normalization method is used to linearly map the two parameters to the [0, 1] interval. The normalized rise-to-span ratio, denoted as f/L
norm, is calculated as:
Substituting the specific values gives:
Similarly, the normalized anchorage ratio, denoted as η
norm, is calculated as follows:
Substituting the specific values gives: ηnorm = (η − 0.333)/0.205.
Linear Regression Model
A linear relationship is assumed between the thrust-sharing ratio δ and the normalized parameters f/L
norm and η
norm:
where β
0 is the intercept, and β
1 and β
2 are the regression coefficients for f/L
norm and η
norm, respectively. The optimal coefficients are obtained by fitting the data from the nine model tests using the least squares method.
3.3. Relationship of Pile-to-Soil Stress Ratio with Rise-to-Span and Anchorage Ratios
3.3.1. Distribution Patterns of Pile-to-Soil Stress Ratio
The pile-to-soil stress ratio was used to evaluate the interaction between the anti-slide pile and the surrounding soil, directly affecting the bearing behavior and failure mode of the SPSC-AC structure. The pile-to-soil stress ratio is defined as n = σ
pile/σ
soil, where σ
pile and σ
soil denote the average earth pressure on the pile back and in the inter-pile soil, respectively. In the anchored section, the inter-pile earth pressure decreased sharply and remained much lower than the passive earth pressure in front of the piles; therefore, the pile-to-soil stress ratio was not analyzed for this section.
Table 4 presents the pile-to-soil stress ratio at the location of maximum earth pressure in the loaded section (Measurement Point 3) after loading under the nine test conditions.
The curved tie beam in the SPSC-AC structure unifies the multi-row anti-slide piles into a single, integrated system.
Influence of Rise-to-Span Ratio
When the rise-to-span ratio of the tie beam in the SPSC-AC structure is small, the inter-pile soil must bear a greater portion of the load, causing inter-pile earth pressure to increase significantly as the ratio decreases. As the rise-to-span ratio increases (from 1/4 to 1/3), a well-formed soil arch develops between the piles, enhancing the pile–soil system’s ability to resist sliding. For non-Arch Toe piles, the earth pressure at the back of each row shows a decreasing trend, and the inter-pile earth pressure decreases synchronously, reflecting the unloading effect of the soil arch. Despite this reduction in back pressure, the downward sliding force is transmitted directly to the pile through the arch foot. In particular, the Arch toe pile experiences a significant increase in earth pressure share, thereby raising the average stress at the back of the pile relative to that in the inter-pile soil. As a result, the pile-to-soil stress ratio increases by approximately 0.1–0.15.
Influence of Anchorage Ratio
The test results indicate that, for a given rise-to-span ratio, the pile-to-soil stress ratio increases consistently as the anchorage ratio rises from 1/3 to 7/13.
3.3.2. Optimization Recommendations for Pile-to-Soil Stress Ratio in Design
Taking both the pile-to-soil stress ratio and economic considerations into account, it is recommended that design parameters be selected within the ranges listed in
Table 5.
The discrepancy between the optimization range and recommended value in
Table 5 reflects a balance between theoretical performance and practical engineering constraints.
Optimization Range represents the ideal parameters derived from experiments. For the geometric parameters (f/L and η), the optimization range defines the boundaries of peak technical performance. For the pile-to-soil stress ratio, the narrow range of 1.36–1.37 indicates the most efficient load-sharing mechanism under specific test conditions.
Recommended Value provides practical engineering guidance. For geometric parameters, specific values (f/L = 1/3, η = 5/11) are chosen for their balance of performance, cost, and constructability. For the pile-to-soil stress ratio, the recommendation ≥ 1.36 serves as a minimum performance threshold, ensuring:
Structural Safety: A baseline level of load transfer efficiency.
Design Flexibility: Accommodation of construction variability and long-term environmental effects.
Continuous Improvement: Values exceeding 1.37 are acceptable if achievable.
The absence of an upper limit for the stress ratio avoids unnecessary costs from over-engineering, while the specific recommendations for geometric parameters promote standardization and economic efficiency. This approach ensures that the structure remains both safe and cost-effective.
3.4. Correlation Analysis of Pile Moment and Earth Pressure
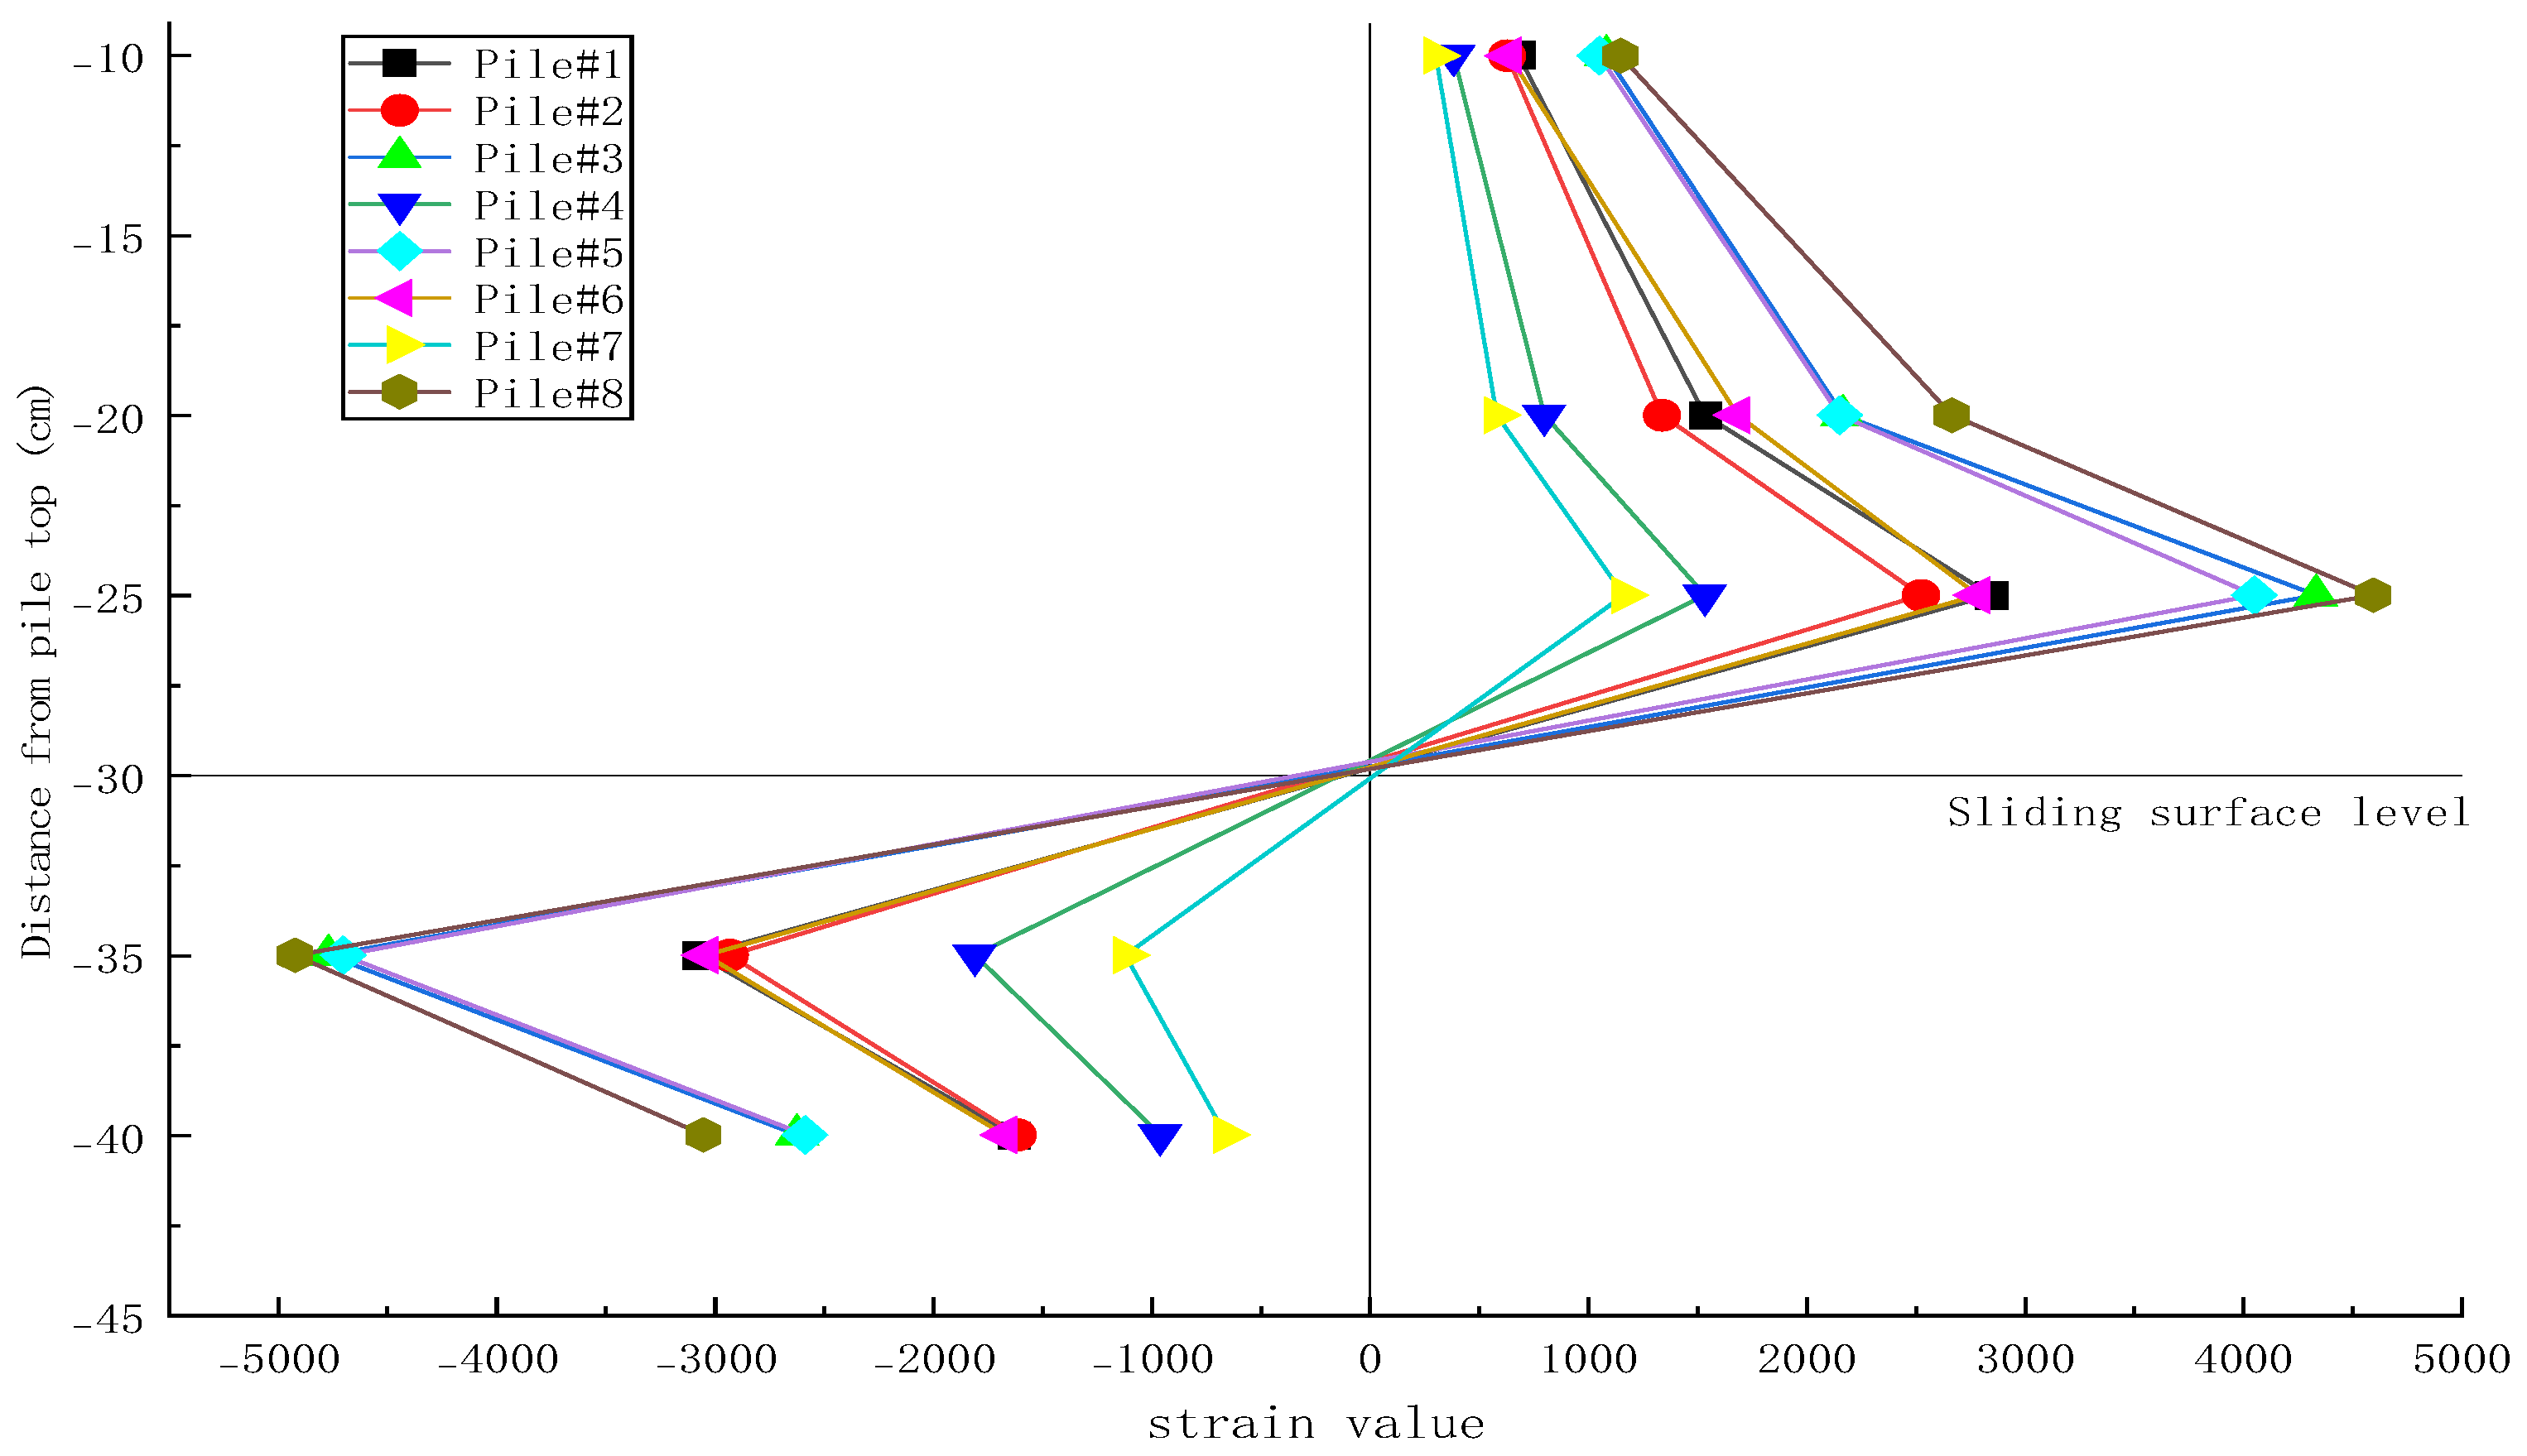
Using data from the strain gauges (
Figure 9), the bending moment distribution along the pile shaft was determined. The results show that the maximum negative bending moment is slightly greater than the maximum positive bending moment, thereby indicating an asymmetric moment response along the pile.
Table 6 presents the strain measurements and maximum bending moment values for each pile at the end of loading under test condition 3. To enhance the performance of the SPSC-AC structure, the Arch toe pile#1 was reinforced, giving it a moment of inertia 16 times that of the other piles. Piles located at the chord positions (Piles #1, #8, #3, and #5) exhibit higher bending moments than the remaining piles. The order of extreme shaft strain values is:
The order of extreme bending moment values is:
These results show that the distribution of extreme strain and bending moment closely follows the earth pressure distribution, confirming that the SPSC-AC structure effectively transfers and resists loads along the piles.
3.5. Practical Implications
Translating model-scale observations to full-scale applications requires addressing scale effects, soil heterogeneity, and construction tolerances. The 1:20 geometric similarity ratio ensures dimensional consistency. The model pile diameter (15 mm) is approximately 30 times the D50 of model soil (0.5 mm), satisfying soil–structure interaction requirements. For prototype implementation (300 mm pile diameter), field soil D50 values (0.1–10 mm) maintain similar ratios, ensuring representative pile–soil interaction. Natural soils exhibit spatial variability in density, moisture, and strength, influencing arch formation. Field monitoring indicates ±15% soil property variations result in approximately ±5% thrust-sharing ratio variations. Conservative safety factors of 1.2–1.3 are recommended. Pile spacing deviations (±5%) cause <3% thrust-sharing ratio variation. However, tie beam curvature deviations beyond ±10% of design rise significantly impair soil arching effects. Implementation recommendations: (1) Conduct site-specific geological investigation; (2) Perform numerical simulations calibrated against experimental results; (3) Implement construction and post-construction monitoring; (4) Apply safety factors of 1.2–1.3; (5) Establish geometric parameter quality control measures. Field validation shows <10% deviation between monitoring data and model predictions.
3.6. Long-Term Performance
Environmental factors, including seasonal moisture variations, rainfall infiltration, temperature fluctuations, and seismic events, influence long-term structural performance. Field moisture content can vary by ±5–10%, affecting shear strength. Moderate variations (±5%) minimally impact soil arching due to interlocking and apparent cohesion. Large increases (>10%) can reduce strength and alter earth pressure distribution. Proper drainage systems are essential. The enclosed configuration provides surface water protection. However, prolonged rainfall increases pore water pressure, reducing effective stress. During intense rainfall (>50 mm/day), earth pressures can temporarily increase by 15–25%. Integrated design with surface drainage is critical. Annual temperature variations (±20 °C) cause minimal thermal effects, given concrete’s thermal expansion coefficient (approximately 10–5 °C). Soil cover provides thermal buffering, and the flexible arching mechanism accommodates small thermal movements. While 14,400-cycle testing showed stable performance, railway operations may involve millions of cycles. Gradual stiffness degradation under very high cycle counts (>106) is possible, though unlikely within a 50–100-year design life.
Long-term monitoring is recommended. Arch–beam–pile coupling provides inherent ductility and energy dissipation. Shaking table tests show that soil arching can be temporarily disrupted during strong shaking, but it reforms post-earthquake with minimal permanent displacement. Design parameters provide balanced stability under moderate seismic loading. Long-term measures: (1) Comprehensive drainage systems; (2) Regular performance monitoring; (3) Maintenance protocols; (4) Regional climate and seismic considerations; and (5) Post-earthquake inspection and retrofitting plans.
3.7. Dynamic Resonance of Small Spacing and Its Applicable Scope
At a small spacing ratio s/D = 4, pronounced dynamic resonance was observed under a 1.0 Hz load. The resonance amplification factor ranged from 1.2 to 1.5 for earth pressure and from 1.1 to 1.3 for bending moment, facilitating the development of a three-dimensional soil arch.
Existing studies have predominantly focused on static loading conditions [
34,
35,
36,
37,
38,
39,
40,
41,
42], whereas dynamic investigations under seismic loading [
43,
44,
45,
46] involve higher frequencies (1–10 Hz) and transient characteristics distinct from train-induced vibrations. This study addresses the research gap concerning cyclic loading within the 0.5–2.0 Hz frequency range representative of high-speed railway operations.
The findings are applicable under the following conditions: (1) load frequency of 0.5–2.0 Hz; (2) pile spacing of 3d–5d; (3) medium sliding force with a three-layer soil structure; and (4) SPSC-AC systems incorporating curved tie beams.
Limitations include the specified soil type, sinusoidal loading simplification, and the 4-h model-scale test duration.
4. Conclusions
This study presents a comprehensive experimental investigation into the dynamic earth pressure characteristics and load-transfer mechanisms of the Surrounding Pile–Soil Coupling–Anti-slide Chord (SPSC-AC) structure for railway slope reinforcement under high-speed train loading. Through systematic physical model tests with varying rise-to-span ratios (f/L) and anchorage ratios (η), the following conclusions are drawn:
(1) Three-dimensional soil arching mechanism and earth pressure distribution
The SPSC-AC structure establishes a stable three-dimensional soil arch via curved connecting beams. The earth pressure distribution exhibits three key characteristics: (a) in the depth-wise direction, peak pressure occurs approximately 5 cm above the sliding surface, which is 15–20% lower than Rankine/Coulomb predictions due to arching effects [
42]; (b) in the lateral direction, pressures follow a descending order of rear row > middle row > front row, with corner piles showing a reversed increase (up to 20% higher than middle piles); and (c) in the temporal domain, a three-stage evolution is observed under 14,400 loading cycles (linear growth → deceleration → stabilization), indicating stable arching without degradation.
(2) Dual-control indicator system and parametric optimization
The rear-pile thrust-sharing ratio (δ = 0.58–0.68) and pile-to-soil stress ratio (n = 1.16–1.37) are proposed as dual control indicators. Optimal performance is achieved at f/L ∈ [1/4, 1/3] and η ∈ [5/11, 7/13] (δ ≈ 0.58–0.63, n ≥ 1.36), demonstrating superior load redistribution compared with conventional systems [
26,
27].
(3) Design implications and practical applications
Three design measures are recommended: (a) corner-pile strengthening to address arch foot stress concentration (peak pressure 630–1106 Pa); (b) differential stiffness design with reinforced rear rows and reduced front/middle rows for material efficiency; and (c) application to high-speed railways with stable performance under 14,400 cycles (distinct from seismic conditions [
43,
44,
45,
46]). A soil arching reduction factor of 0.8–0.85 and safety factors of 1.2–1.3 are recommended for field implementation.
(4) Limitations and future directions
Model-scale effects (1:20), idealized soil conditions, and simplified loading warrant cautious extrapolation. Future work should include full-scale validation, numerical extension, and long-term performance assessment.