Systematic Review

Unveiling the Key Drivers of Transaction Costs in Modular Integrated Construction: A Meta-Analysis

1
College of Civil Engineering and Architecture, Zhejiang University, Hangzhou 310058, China
2
China Zhejiang Construction International Group Co., Ltd., Hong Kong, China
3
Department of Building and Real Estate, The Hong Kong Polytechnic University, Hong Kong, China
4
CR Construction Co., Ltd., Hong Kong, China
*
Author to whom correspondence should be addressed.
Buildings 2026, 16(5), 1051; https://doi.org/10.3390/buildings16051051
Submission received: 3 November 2025 / Revised: 23 February 2026 / Accepted: 26 February 2026 / Published: 6 March 2026

Abstract

Despite its recognized advantages in sustainability and efficiency, the widespread adoption of Modular Integrated Construction (MiC) is impeded by transaction costs (TCs). While previous studies have cataloged numerous barriers, a systematic, quantitative synthesis of their relative impact on TCs is lacking. This study bridges this gap by conducting a hybrid systematic review and meta-analysis of 37 empirical studies (2005–2025) to identify and rank the key drivers of TCs in MiC. Grounded in Transaction Cost Economics, 32 factors were categorized into transaction attributes, the transaction environment, and stakeholder-related aspects. The meta-analysis quantified the pooled effect sizes, revealing that operational and procedural hurdles—specifically “Poor Logistics,” “Design Change,” and “Insufficient Quality Inspection Standards and Regulations”—are the most critical determinants. A key finding is the divergence between the most frequently cited barriers and those with the highest impact, underscoring the value of meta-analytic synthesis over simple frequency counts. Subgroup analyses further indicated that the severity of institutional and regulatory drivers is more pronounced in developing economies. This research provides a novel, evidence-based framework for stakeholders to develop and prioritize mitigation strategies, advocating for investments in integrated digital tools, rigorous front-end planning, and context-sensitive policy development to reduce transactional inefficiencies and promote MiC adoption.

1. Introduction

Globally, construction technology has gradually shifted from traditional cast-in-place construction to off-site construction to address inefficiencies caused by low standardization, high fragmentation, limited automation, and the aging of the workforce [1,2]. Modular Integrated Construction (MiC) represents a leading approach in this shift, defined by the factory-based manufacture of three-dimensional volumetric modules that are subsequently transported and assembled on-site [3]. MiC significantly outperforms conventional practices in enhancing productivity, quality, safety, and on-site working environment [4,5,6]. The empirical evidence for its efficacy is compelling, demonstrating that MiC can achieve a 40% reduction in project duration, a 16% decrease in labor requirements, and an 80% drop in accidents, noise pollution by 30–50%, construction waste by 46–87%, and carbon emissions by 2–22% [7,8,9,10,11]. These proven advantages have spurred the active introduction and promotion of MiC across a diverse range of countries, such as Canada, the US, Australia, the UK, Malaysia, Singapore, Sweden, and China [2,12].
Despite its documented advantages and governmental promotion, the global adoption rate of MiC remains low [12,13,14]. This sluggish uptake is attributed to significant barriers, including high capital expenditures, limited expertise, process inefficiencies, and the absence of regulatory frameworks and incentives [12,13,15]. Overcoming these hurdles entails substantial transaction costs (TCs)—expenses arising from challenges such as asset specificity and uncertainty [16,17]. In off-site construction, TCs encompass costs related to risk, delays, information gathering, negotiation, and contract enforcement [18]. These costs can constitute a significant portion of the total project budget [19]. For instance, in energy-efficient buildings, TCs can reach 20% of the investment, eroding profits and imposing a heavy financial burden on stakeholders [20]. Additionally, MiC’s unique characteristics, including high interconnection, specialization, and requirement for early stakeholder integration, further increase TCs [21]. The increase in TCs, in turn, can result in cost overruns, disputes, abandonment, and inefficiencies in MiC projects [18]. High TCs not only limit stakeholders’ production efficiency and developers’ enthusiasm to enter the market, but also hinder the development of the MiC industry [18]. The core of effectively controlling TCs lies in revealing the underlying mechanisms [19]. Therefore, understanding TCs and their influencing factors in MiC is crucial to promoting its implementation.
Previous studies have primarily focused on identifying TCs and related influencing factors in off-site construction projects, particularly in prefabricated housing projects [17,18,22,23]. A case in point is Wu et al. [19], who, from a developer’s perspective, identified major TC sources, such as disputes and design changes, alongside key determinants, such as contractor qualifications. While both MiC and prefabrication technologies fall under off-site construction, MiC exhibits more complex characteristics, such as heavyweight modules and millimetric-level installation precision requirements, warranting in-depth investigation [24]. However, there is still a lack of systematic discussion on TCs and related influencing factors in terms of MiC. Furthermore, several review studies have discussed barriers or risks in the adoption of MiC, which are also associated with TCs [13,14,15]. For example, Wuni and Shen [12] cataloged 120 adoption barriers, offering a useful foundation for identifying TC factors. However, even systematic reviews in this area have typically relied on qualitative synthesis. Those who have incorporated quantitative techniques have often been restricted to tallying factor frequencies, an approach that is increasingly questioned. Notably, some studies have shown that the frequency of influencing factors does not accurately reflect their importance [25]. A meta-analytic approach is proposed to address this shortcoming by enabling a precise, quantitative assessment of the significance of TC-influencing factors in MiC.
To bridge this identified gap, the present research is designed to delineate the factors influencing TCs in MiC and to investigate their fundamental mechanisms and shared characteristics. The investigation is structured into three phases, following the Preferred Reporting Items for Systematic Reviews and Meta-Analyses (PRISMA) protocol [26,27]. The initial phase involves a systematic review of the literature on MiC implementation barriers and TCs, justified by the scarcity of studies that focus exclusively on MiC’s TCs and the inherent link between these barriers and costs. In the second phase, data extracted from the selected studies are subjected to a meta-analysis to evaluate and rank the influence of each factor. The final phase employs subgroup analysis to compare effect sizes across different categories and sensitivity analysis to verify the stability of the findings. This study contributes to the field in two key ways: first, by introducing a transaction cost perspective into the analysis of MiC implementation challenges, and second, by demonstrating a novel integration of systematic review and meta-analysis to establish a quantitatively grounded ranking of TC factors derived from existing empirical evidence.

2. Materials and Methods

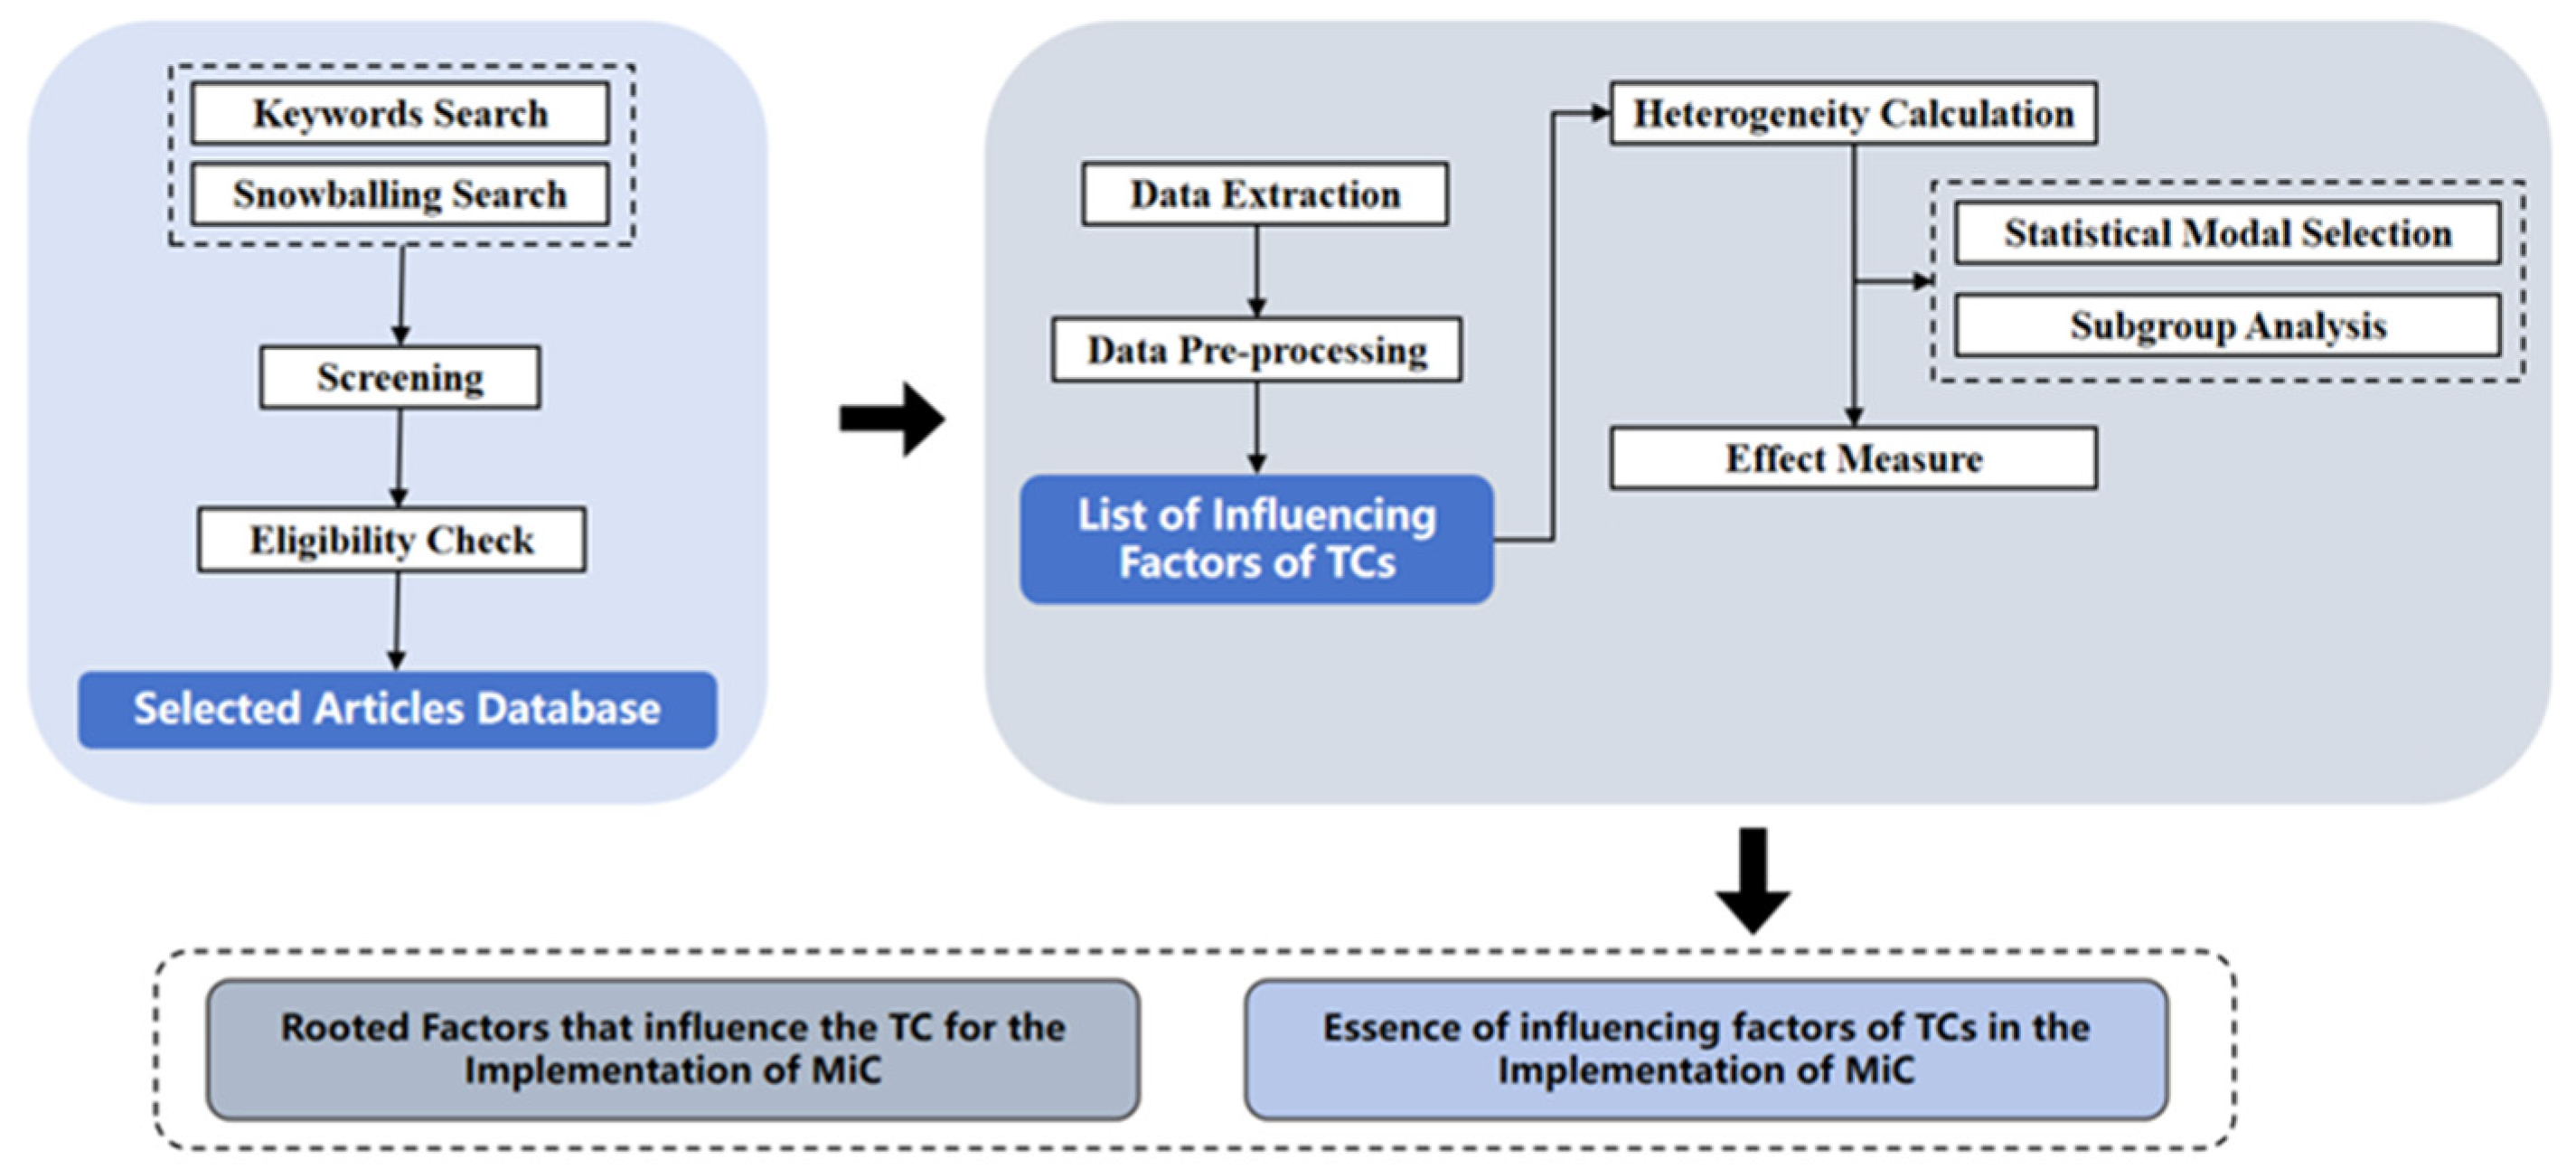
The methodological approach for this research is structured around a hybrid systematic review and meta-analysis framework, as outlined in Figure 1, which conforms to the PRISMA standards [27]. This integrated design leverages the distinct advantages of both techniques. The systematic review component establishes a comprehensive foundation by methodically identifying, selecting, and synthesizing relevant literature to map the extant research terrain [28]. However, such reviews often yield qualitative insights. To introduce quantitative precision, the meta-analysis component statistically aggregates data from independent empirical studies, thereby producing more reliable effect-size estimates [29]. Consequently, the systematic review served to curate the literature and extract the influencing factors of TCs in MiC, guided by established methodological principles [30]. Subsequently, the meta-analysis was applied to this extracted data to quantify, evaluate, and rank the effect sizes of these factors, thereby pinpointing the most critical determinants.

2.1. Systematic Review

2.1.1. Search Strategies and Selection Criteria

The literature search was conducted primarily within the Web of Science (WoS) core collection, Scopus and IEEExplore. These databases were selected for their rigorous curation of high-impact journals, transparent indexing policies, and their established precedent in previous systematic reviews within the construction management field [31,32]. The search strategy was twofold. An initial keyword-based search was executed using the keywords listed in the below Table 1:
A study’s eligibility for inclusion was determined against strict, pre-defined criteria [33]. The inclusion criteria mandated that studies: (1) focus on MiC or analogous off-site construction technologies; (2) explicitly investigate factors influencing TCs or barriers to MiC implementation; and (3) were excluded if they were duplicates, lacked an abstract, or if the full text was unavailable. To uphold the quality of the evidence base, the review was restricted to peer-reviewed journal articles published in English; conference proceedings were omitted. No constraints were applied regarding the geographic origin of the studies.

2.1.2. Literature Selection Procedure

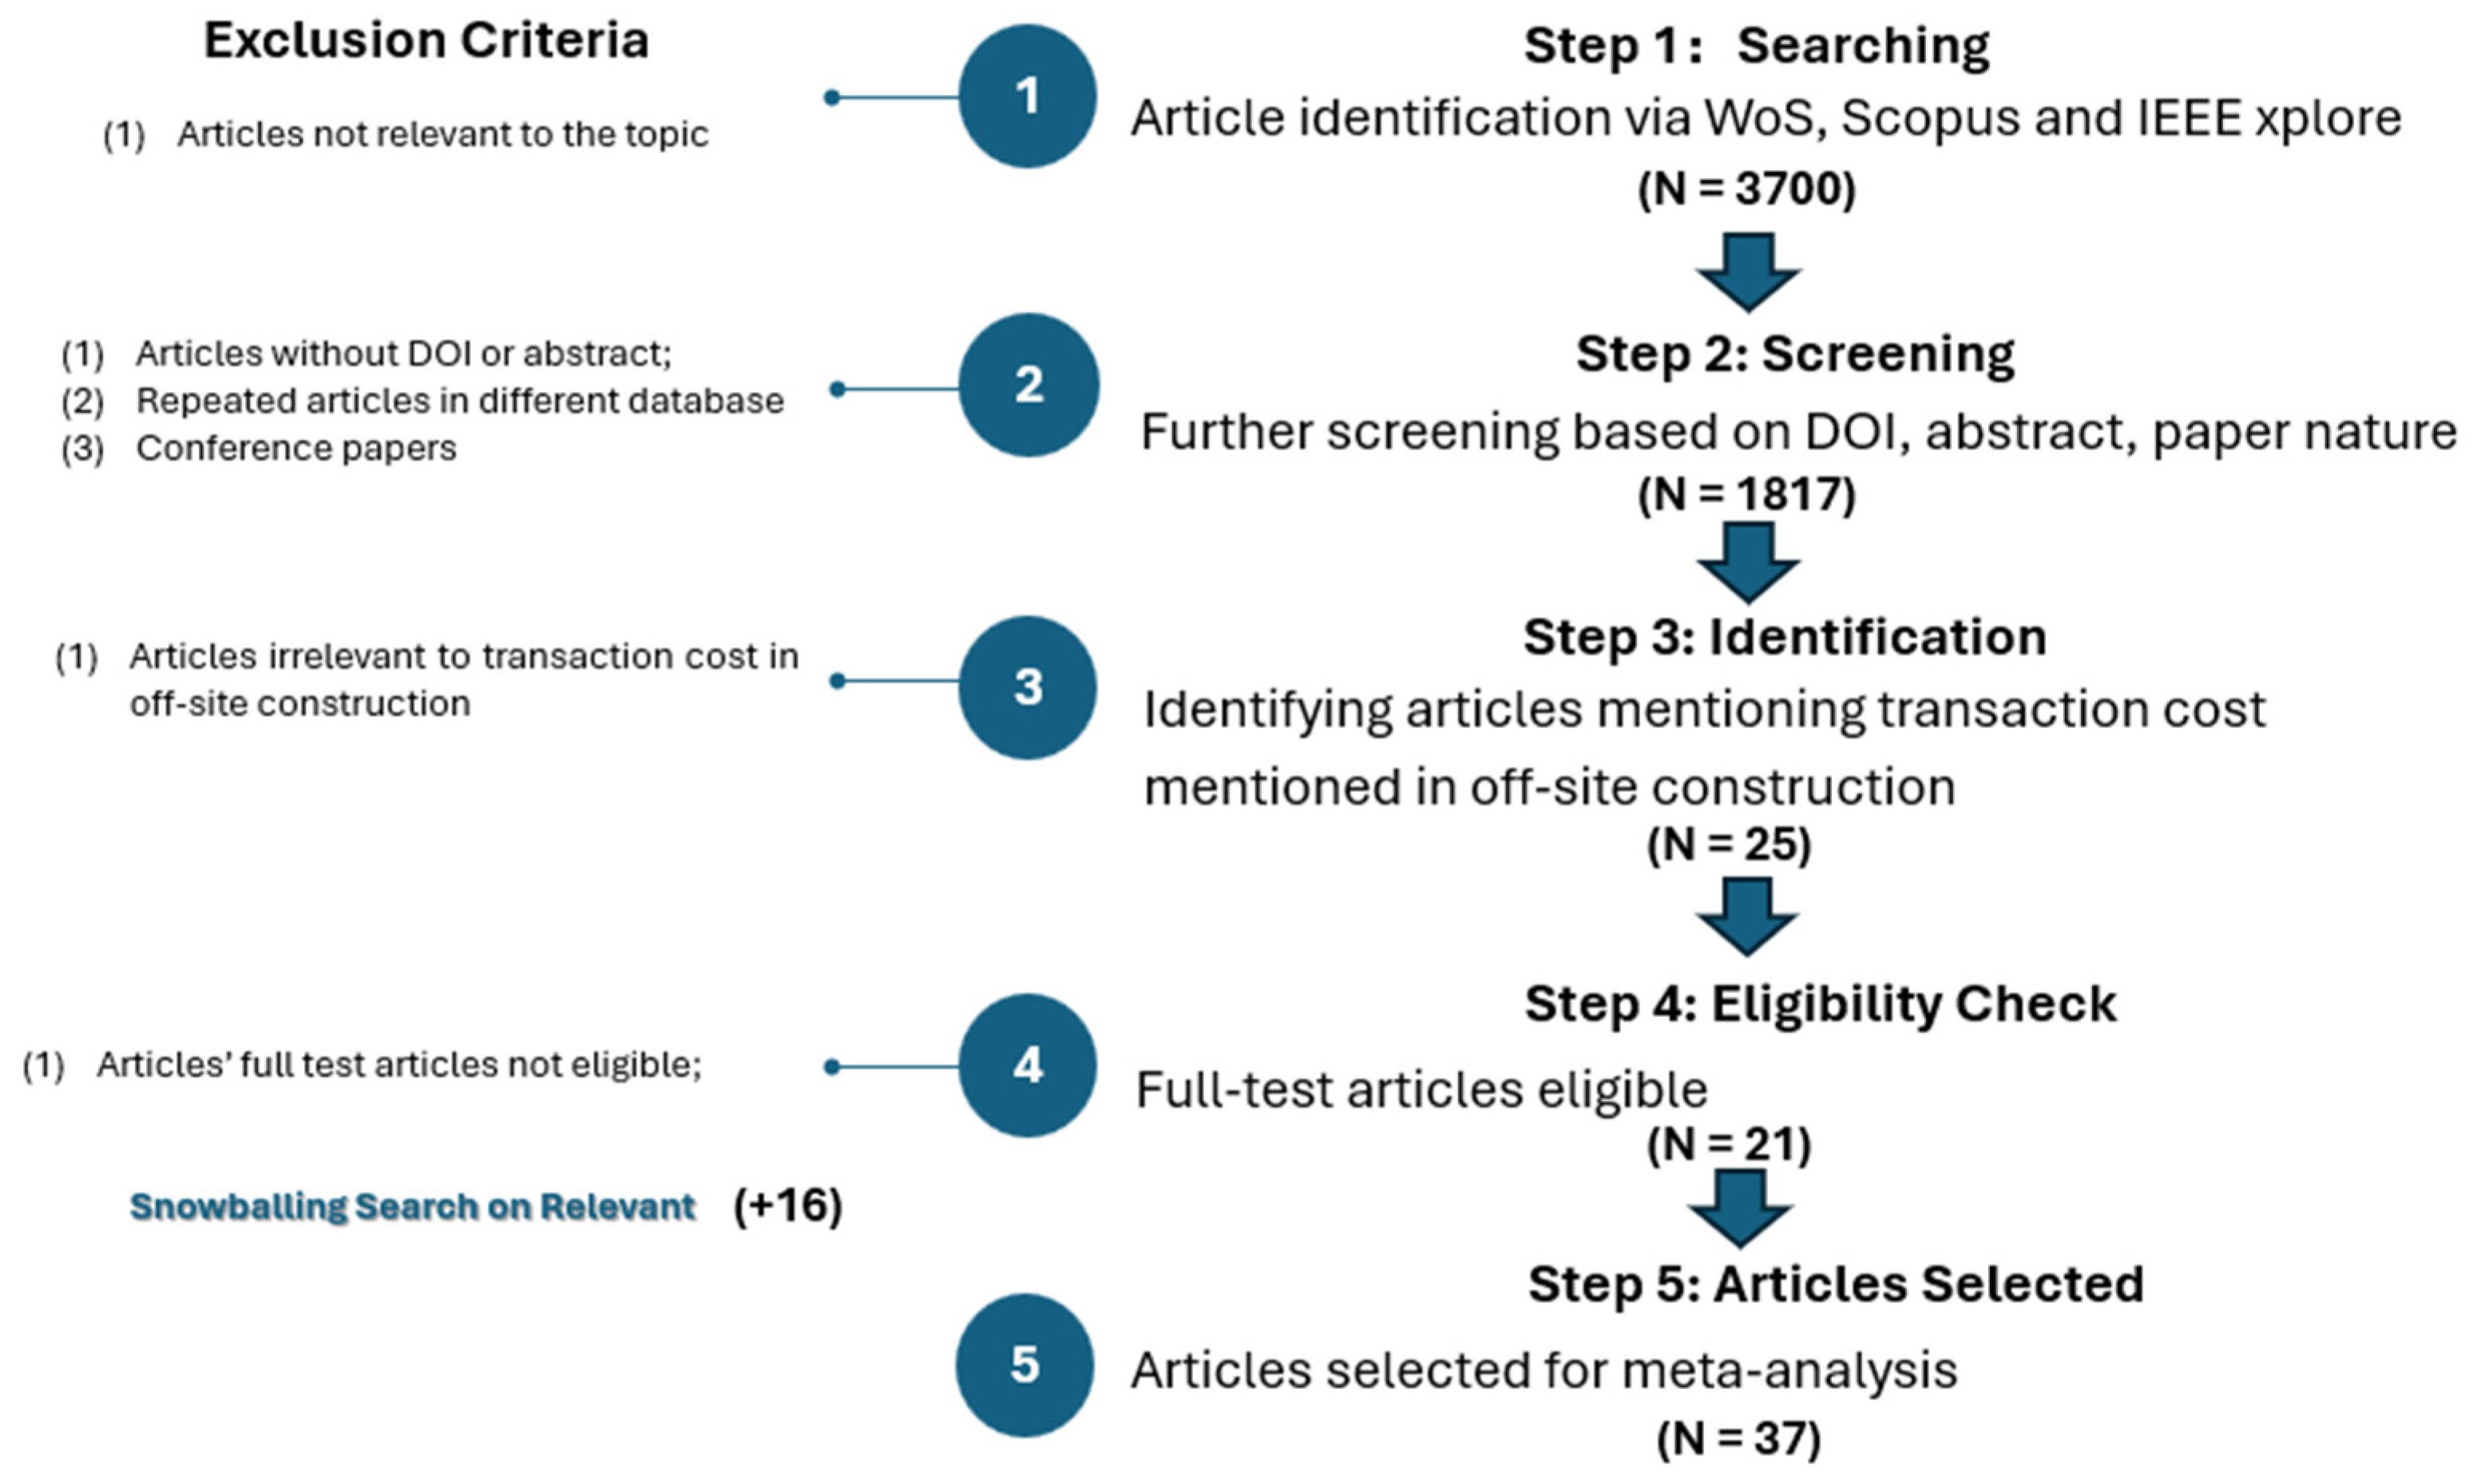
The process of selecting relevant literature was finalized in December 2025. Figure 2 outlines the screening procedure, conducted in accordance with the most recent PRISMA guidelines [26]. Following a reproducible search across WoS, Scopus, and IEEE Xplore, we identified 3700 records in total (13 December 2025). Initial keyword searches returned 1071 records from Web of Science (WoS), 2624 from Scopus, and 5 from IEEExplore. The screening process then proceeded in phases. Database-specific inclusion filters required a DOI, an abstract, and journal articles. After applying database-level filters, 3065 records remained (WoS: 889; Scopus: 2176; IEEE: 0). Within-database de-duplication yielded 3061 unique DOIs (Scopus contained 4 within-database duplicate DOIs). Cross-database harmonization then removed 1244 overlapping DOIs, resulting in 1817 unique DOIs retained for screening (overall retention 49.1%).
Title and abstract screening was then performed on these 1817 records using a theory-grounded definition of TCs. At this stage, we explicitly distinguished TCs from general production costs or generic implementation barriers, retaining only studies that conceptually addressed search, negotiation, coordination, monitoring, enforcement, or related governance issues in MiC or analogous off-site construction settings. This step identified 25 records that explicitly mentioned TCs in off-site construction contexts and therefore proceeded to full-text assessment. After searching for full text, only 21 papers were left for further study.
To mitigate the risk of omitting pertinent studies, we complemented database screening with both backward and forward snowballing on all eligible papers [25]. This procedure yielded an additional 16 records for consideration. Applying the same screening and eligibility criteria to these snowballed records, we finalized the set of studies for quantitative synthesis. In total, 37 articles were included in the meta-analysis, as summarized in Figure 2.

2.2. Meta-Analysis

2.2.1. Data Collection and Statistical Model

Meta-analysis is a powerful quantitative synthesis method that synthesizes findings from multiple independent empirical investigations that meet specific comparability standards, thereby facilitating the integration of evidence [34]. Its capacity to generate more robust conclusions from disparate studies has earned it the moniker “the analysis of analyses” [35]. The technique’s utility in deriving statistically powerful insights from literature has led to its widespread adoption across diverse academic disciplines [36]. A principal advantage of this approach is its propensity to yield effect size estimates that more accurately reflect true population parameters. This improved precision is achieved by pooling statistical data from numerous primary studies, effectively generating a consolidated dataset on a much larger scale [37].
The execution of a meta-analysis typically unfolds in two sequential stages. The first stage entails defining the effect size metric and systematically extracting pertinent data from the collected literature. The second stage involves applying a statistical model to analyze the aggregated data [25]. In the present research, the mean rating (on a five-point Likert scale) for each TC-influencing factor was chosen as the effect size. This metric directly captures the aggregated perceived importance or severity of each factor as reported by practitioners and experts across different studies, providing a consistent and interpretable measure for cross-study comparison. We acknowledge that cultural and contextual differences may influence absolute scoring on Likert scales; however, the relative ranking of mean scores within our synthesized large-N sample offers a robust indicator of comparative factor significance.
To ensure the statistical power and reliability of the quantitative synthesis, a strict inclusion criterion was applied: only factors reported with complete quantitative data (mean, standard deviation, and sample size) in at least three independent studies (k ≥ 3) were included. Factors with insufficient data were reviewed qualitatively.
Given the anticipated and observed substantial variability across studies in terms of geographic context, project types, and respondent profiles—factors expected to lead to heterogeneity in true effect sizes—a random-effects model was adopted for all analyses. This model is preferred over a fixed-effect model because it explicitly accounts for the variation between studies, assuming that the included studies are drawn from populations with differing true effect sizes. It therefore provides a more conservative and generalizable estimate of the mean effect, which is appropriate for our diverse research corpus [25].
The degree of heterogeneity among study effects for each factor was assessed using the I2 statistic, which quantifies the percentage of total variation across studies that is due to heterogeneity rather than chance [29]. In line with common practice for continuous outcomes in random-effects meta-analyses, an I2 value greater than 50% was considered indicative of substantial heterogeneity. The observed high I2 values for most factors further justified the use of the random-effects model and necessitated cautious interpretation of the pooled estimates as average effects across a distribution of possible true values.
Prior to computing the summary effect, individual study contributions were weighted. In a random-effects meta-analysis, the weight assigned to each study ( W i ) is inversely proportional to the sum of its within-study variance ( V i ) and the estimated between-studies variance ( T 2 ), as defined in Equations (1)–(4) [33]. This weighting scheme ensures that studies with more precise estimates (smaller variance) and those more consistent with the overall distribution of effects receive greater influence in calculating the pooled mean. Thus, the weighting incorporates both study precision (primarily driven by sample size) and the model’s estimate of between-study heterogeneity.
The weighted mean summary effect ( M ) for the random-effects model and its variance ( V ) were subsequently calculated using Equations (5) and (6) [33]. All computational procedures, including heterogeneity estimation, weighting, summary effect calculation, and the generation of 95% confidence intervals, were performed using R software (version 4.4.3) with the meta package. To verify the robustness of the results, a sensitivity analysis was conducted using the “leave-one-out” method, which involved iteratively excluding one study at a time and recalculating the pooled effect size to determine if any single study disproportionately influenced the overall findings. This entire analytical sequence was conducted independently for each of the 32 TC-influencing factors that met the quantitative inclusion criterion.
W i = 1 V i
In this equation, W i denotes the weight allocated to study i within a fixed-effects model framework, while V i is the variance associated with that study.
S = i = 1 n W i E i 2 ( i = 1 n W i E i ) 2 i = 1 n W i
Here, the statistic S corresponds to the weighted sum of squares across the entire set of studies, and E i signifies the effect size reported in study i .
V t 2 = T 2 = S ( n 1 ) W i W i 2 W i
This formula calculates T 2 (also denoted V t 2 ), which is the variance between studies variance. The variable n indicates the total number of studies included in the analysis.
W t = 1 ( V i + V i 2 )
Equation (4) defines W t as the revised weight assigned to study i for the random-effects model, incorporating both within-study and between-study variance.
M = i = 1 n W i E i i = 1 n W i
V = 1 i = 1 k W i
The final two equations compute the summary effect. In these, M represents the weighted mean (overall summary effect), and V is its corresponding weighted variance.

2.2.2. Subgroup Analysis

Subgroup analysis was conducted to explore potential sources of heterogeneity and to examine whether the perceived importance of TC drivers varied systematically across different contexts [38]. This approach partitions studies into groups based on shared characteristics to examine if these characteristics systematically influence the effect sizes. Formal statistical tests for between-subgroup differences were conducted. Three subgrouping variables were employed:
  • Publication year (Temporal Evolution): This analysis tests whether the perceived severity of TC drivers has shifted between distinct phases of MiC’s industrial and academic evolution. Studies were classified into two phases:
Phase 1: Foundational Development and Early Adoption (2005–2020). This period encompasses the initial technological exploration, feasibility studies, and early market entry of MiC, with research often focusing on identifying fundamental barriers and costs (k = 17 studies).
Phase 2: Mainstreaming & Scalability (2021–2025). This recent phase reflects an intensified focus on MiC as a scalable solution for supply chain resilience and decarbonization, with research pivoting towards systemic integration, supply chain coordination, and lifecycle performance (k = 20 studies).
2.
Economic Development Level: Grounded in institutional theory, which posits that transaction costs are shaped by the quality of formal and informal institutions, this analysis examines how a country’s economic context moderates TC drivers. Countries were classified as Developed Economies (High-income economies) or Developing Economies (Middle- and low-income economies) based on the World Bank’s income classifications for the study period. This classification resulted in two subgroups: Developed Economies (k = 13) and Developing Economies (k = 24).
3.
Study Region: Given the path-dependent nature of construction practices and the notable geographical concentration of research, this analysis examines regional disparities. Studies were categorized based on the geographical location of data collection into Asia (k = 26) and Non-Asia (k = 11). This grouping allows for the exploration of potential moderating effects stemming from regional differences in industry structure, policy approaches, and market maturity.
The results of the subgroup analysis are reported comprehensively in Section 3.2. All findings are interpreted with caution, acknowledging the contextual nature of the data and the sample size limitations within some subgroups.

2.2.3. Sensitivity Analysis

A comprehensive sensitivity analysis was conducted to evaluate the robustness of the meta-analytic findings and to investigate the potential influence of individual studies on the pooled effect estimates. To achieve this, a leave-one-out sensitivity analysis was systematically performed for each determinant. This analytical procedure was executed using R software and involved the iterative removal of each individual study from the complete dataset, one at a time, followed by the recalculation of the pooled mean effect size and its corresponding 95% confidence interval for each iteration. The primary aim was to determine whether the overall conclusions for any factor were disproportionately influenced by a single data source.
To ensure a structured and interpretable assessment, pre-defined quantitative criteria were established to evaluate robustness based on the behavior of the recalculated estimates. A finding was considered to demonstrate high robustness if the recalculated mean, after the omission of any single study, remained within the 95% confidence interval of the original pooled estimate from the full analysis. Conversely, contextual sensitivity was indicated if the exclusion of a specific study caused the recalculated mean to fall outside the bounds of this original confidence interval, signifying a disproportionate reliance on that particular data point. Furthermore, intrinsic instability was concluded for a factor if all recalculated confidence intervals from the leave-one-out iterations consistently spanned a critical neutral threshold (such as the score of 3.0), implying that no stable or conclusive summary estimate could be reliably derived from the available evidence.
The numerical and graphical results from this iterative sensitivity analysis are compiled in the Supplementary Materials File “Leave-one-out Sensitivity Analysis Plots”. Within the main text, the findings are synthesized narratively. This synthesis highlights the key patterns observed—from factors exhibiting minimal fluctuation and high stability to those whose summary estimates are demonstrably sensitive to specific study contexts—thereby providing a transparent and nuanced evaluation of the reliability of the conclusions for each determinant.

3. Results

3.1. Systematic Review Results

3.1.1. Included Literature Database

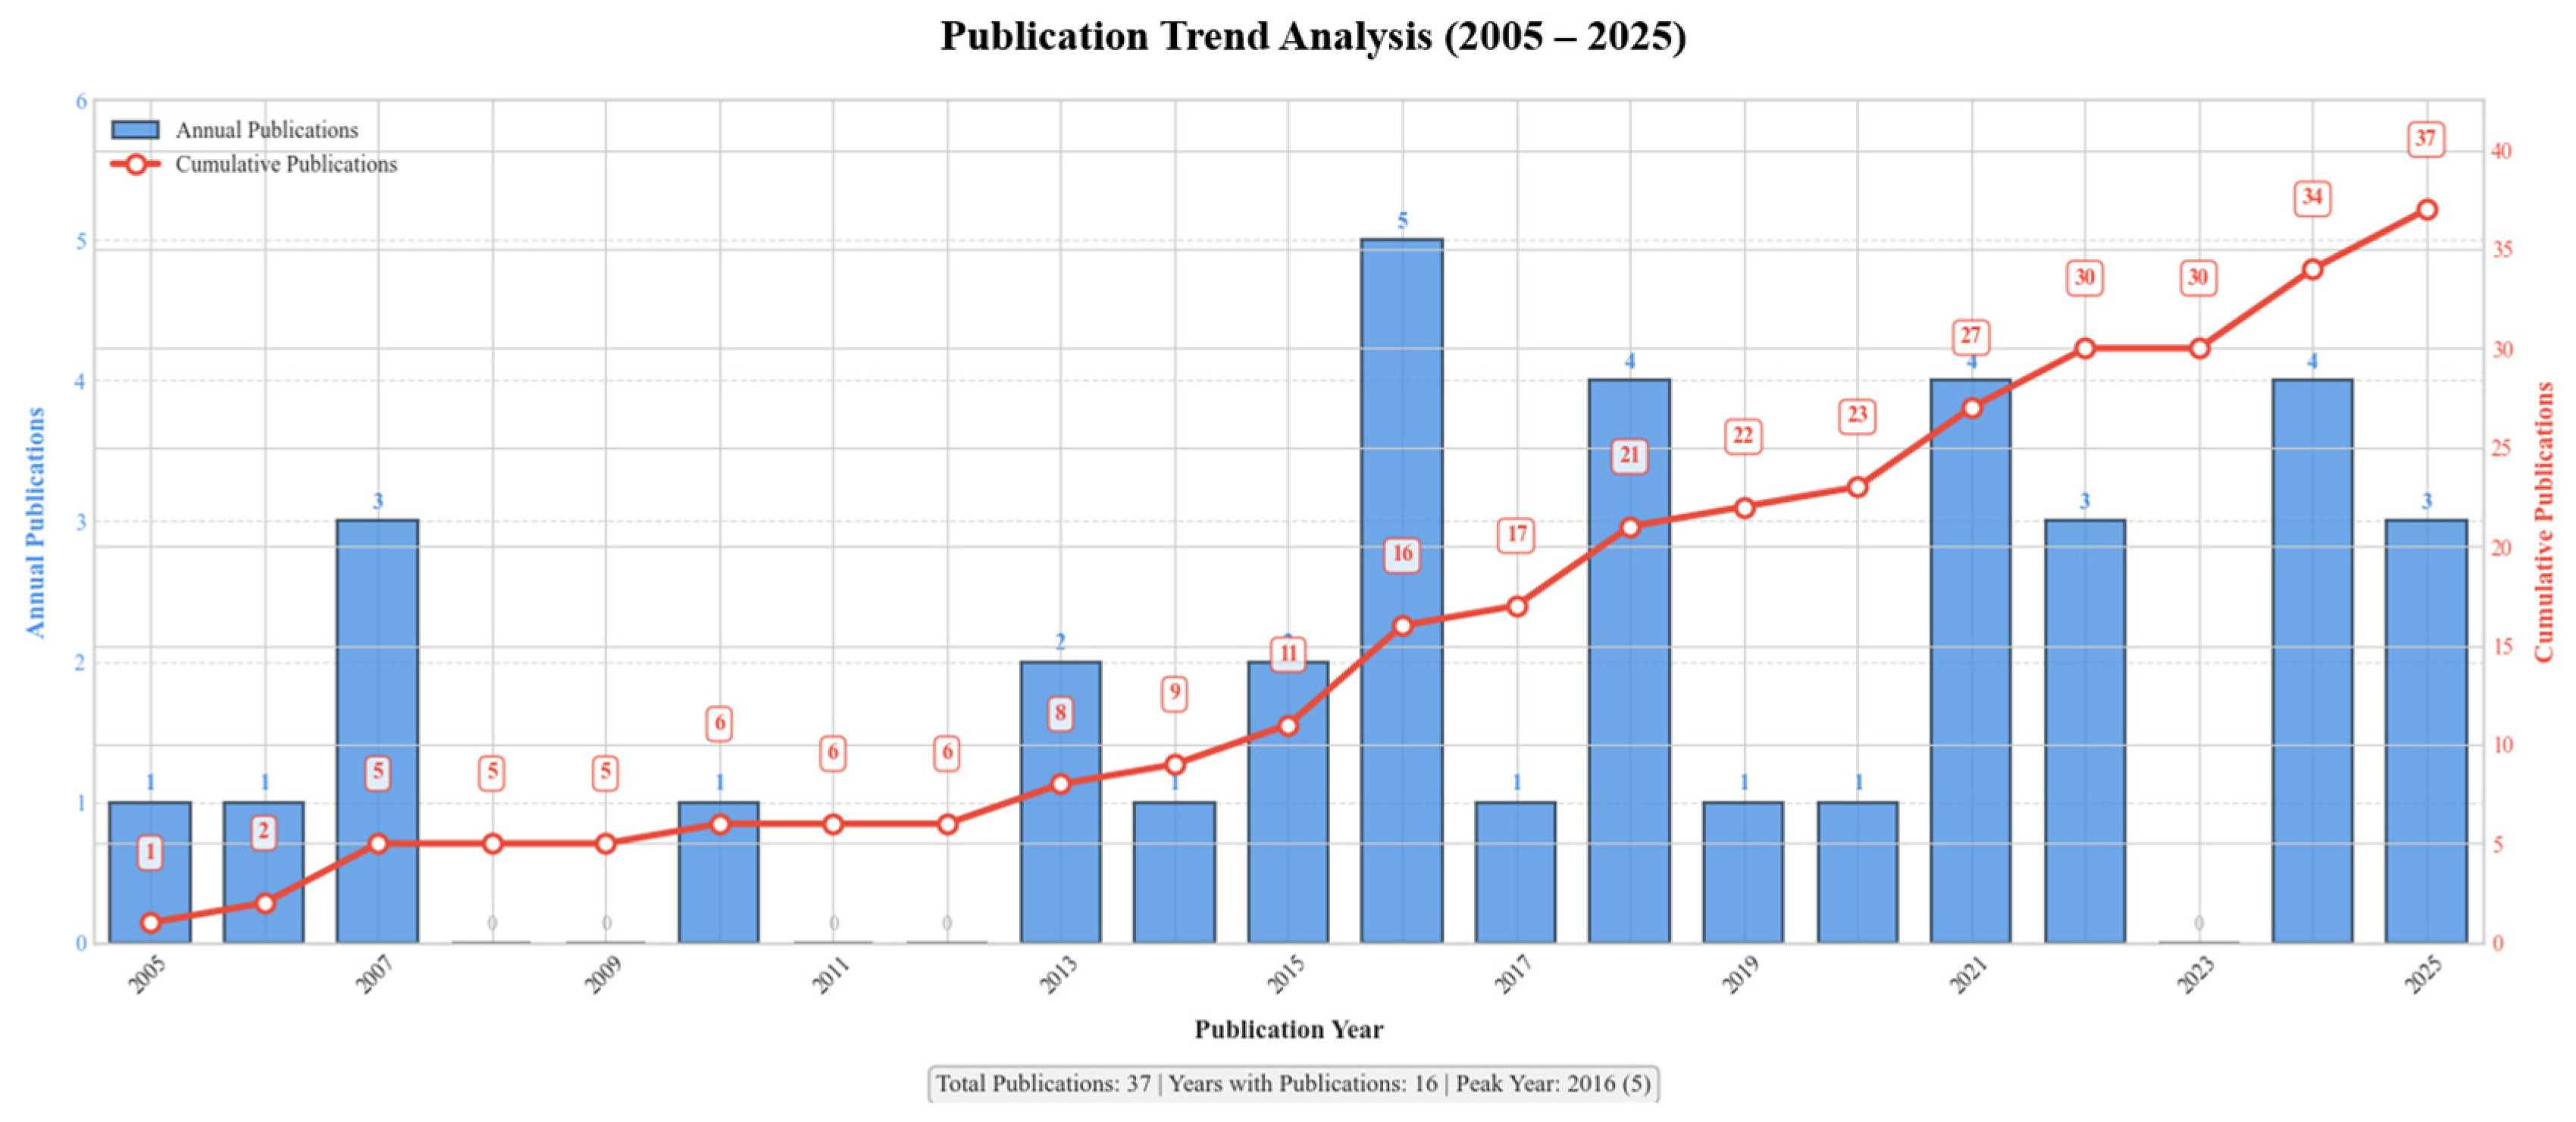
The final stage of the literature selection process yielded 37 studies that met all the predefined eligibility criteria, forming the core database for this analysis (see Table 2). To facilitate a more nuanced investigation, these studies were categorized according to their publication year and country of origin. The temporal distribution of the publications spans from 2005 to 2025, revealing a notable surge in research activity after 2020, as depicted in Figure 3. Geographically, the research corpus encompasses contributions from 14 countries or regions across four continents: Asia (e.g., China, Hong Kong, South Korea, Thailand, Malaysia), Europe (e.g., the UK, Sweden, Netherlands, Russia, Portugal), North America (e.g., the USA, Canada), and Oceania (e.g., Australia, New Zealand). A dominant majority of the studies (approximately 72%) originated from Asia, with China (including Hong Kong) providing the most substantial representation. It is noteworthy that the review did not identify any relevant studies from South America or Africa.

3.1.2. Descriptive Overview of the Included Studies

The meta-analysis synthesizes data from 37 empirical studies published between 2005 and 2025, providing an expanded and methodologically diverse evidence base compared to earlier reviews. The included studies employed a triangulation of research designs, enhancing the validity of the identified determinants through methodological convergence. The evidence base comprises:
  • Questionnaire surveys with Likert-scale measurements (16 studies, total n = 2262 respondents): These studies form the quantitative core of the meta-analysis, providing the mean ratings used to calculate pooled effect sizes. They utilized standardized 5-point Likert scales to assess the perceived importance of transaction cost determinants.
  • Mixed-methods approaches (6 studies): These integrated quantitative surveys with qualitative depth through semi-structured interviews (total n = 152 interviewees) or case study analysis, providing context-rich insights.
  • In-depth case studies (9 studies, examining 26 individual projects): These offered granular, context-specific analyses of transaction costs in real-world MiC implementations.
  • Comprehensive literature reviews (6 studies, synthesizing 424 documents): These provided the foundational frameworks and initial determinant lists, ensuring thorough coverage of the conceptual landscape.
  • Data mining and archival analysis (2 studies): One analyzed data from 391 Thai contractor companies, while another examined 1224 contracts, offering large-scale empirical validation.
Collectively, these methodological approaches encompass insights from approximately 4531 direct stakeholders and secondary data points, including contractors, developers, designers, policymakers, and project managers. This multi-method foundation strengthens the validity of the identified determinants through triangulation across different data sources and research paradigms.
Geographically, the research corpus is global yet exhibits a concentration reflective of MiC adoption patterns. The distribution includes 15 studies from Mainland China, 5 from Hong Kong, 4 from the United States, and multiple contributions from the United Kingdom, Australia, Sweden, Canada, and other developed and developing economies. While this distribution underscores worldwide interest in MiC, we acknowledge the potential for regional bias in the current evidence base, a limitation that our subgroup analyses explicitly address in Section 4.5.
This expanded and methodologically diverse evidence base provides a robust foundation for the subsequent meta-analysis, addressing concerns regarding sample adequacy while ensuring comprehensive coverage of transaction cost determinants across different research traditions and geographical contexts.

3.1.3. Influencing Factors Identification

Following a systematic review and text analysis of the included studies, 32 distinct factors influencing TCs in MiC were identified and categorized, with their frequencies documented in Table 3. While prior research has effectively framed TC drivers through the lens of transaction attributes—asset specificity, uncertainty, and frequency—this study expands the analytical framework by incorporating the critical dimensions of the transaction environment and transaction stakeholders [48,67]. This tripartite classification (Transaction, Transaction Environment, Transaction Stakeholder) allows for a more nuanced understanding of how institutional contexts and human capital dynamics fundamentally shape transaction efficiency beyond core transactional properties.
The updated frequency analysis, derived from a robust sample of 37 studies, reveals a recalibrated hierarchy of TC determinants. The most prevalent factors are D31 “Require Skilled Labour with Higher Wages” (18), D8 “Lack of Relevant Technical Support” (20), and D1 “Increased Initial Investment Requirement” (17). This ranking underscores two pivotal and interrelated sources of transactional inefficiency in MiC:
The Primacy of Human Capital: The dominance of D31 and the high significance of D27 (“Shortage of Skilled Professionals”, 8) highlight human asset specificity as a paramount concern. The specialized skills required for MiC create a dependency on a scarce labor pool, driving up wage premiums (D31) and exacerbating coordination costs due to expertise shortages (D27). This finding strongly aligns with and quantifies a core tenet of Transaction Cost Economics within the MiC context [29].
The Critical Role of the Transaction Environment: The high frequency of D8 and D11 (“Insufficient Government Support and Incentives”, 10) points to the substantial TC burden imposed by an underdeveloped institutional and technological ecosystem. The lack of ready technical support (D8) increases search, adaptation, and monitoring costs, while absent policy incentives (D11) fail to mitigate the fundamental risks and upfront investments (D1) that deter market entry.
A critical observation is the divergence between this meta-analytically informed frequency count and simpler tallies from smaller-scale reviews. For instance, factors previously highlighted, such as “Poor Construction Conditions” (D9, 5), appear less universally salient in this broader dataset. This discrepancy validates the methodological approach of synthesizing a larger evidence base to distinguish between context-specific barriers and pervasive, systemic drivers of TCs.
In conclusion, the frequency distribution presented in Table 3 does more than list barriers; it empirically identifies the epicenters of transactional friction in MiC. It compellingly argues that the journey toward reducing TCs and enhancing MiC adoption must centrally address the twin challenges of cultivating specialized human capital and fostering a supportive transaction environment through technology and policy. This provides an evidence-based roadmap for stakeholders, moving beyond generic checklists to targeted strategic intervention.

3.2. Quantitative Synthesis (Meta-Analysis) and Qualitative Evidence Integration

This section presents the quantitative synthesis of evidence from the 37 included studies. It proceeds from a descriptive overview of the evidence base to the core findings regarding the effect sizes of determinants, explores the sources of heterogeneity through subgroup analysis, and concludes with robustness checks. The random-effects model was employed for all analyses to account for expected variation across study contexts.

3.2.1. Overall Pooled Effect Sizes and Ranking of Determinants

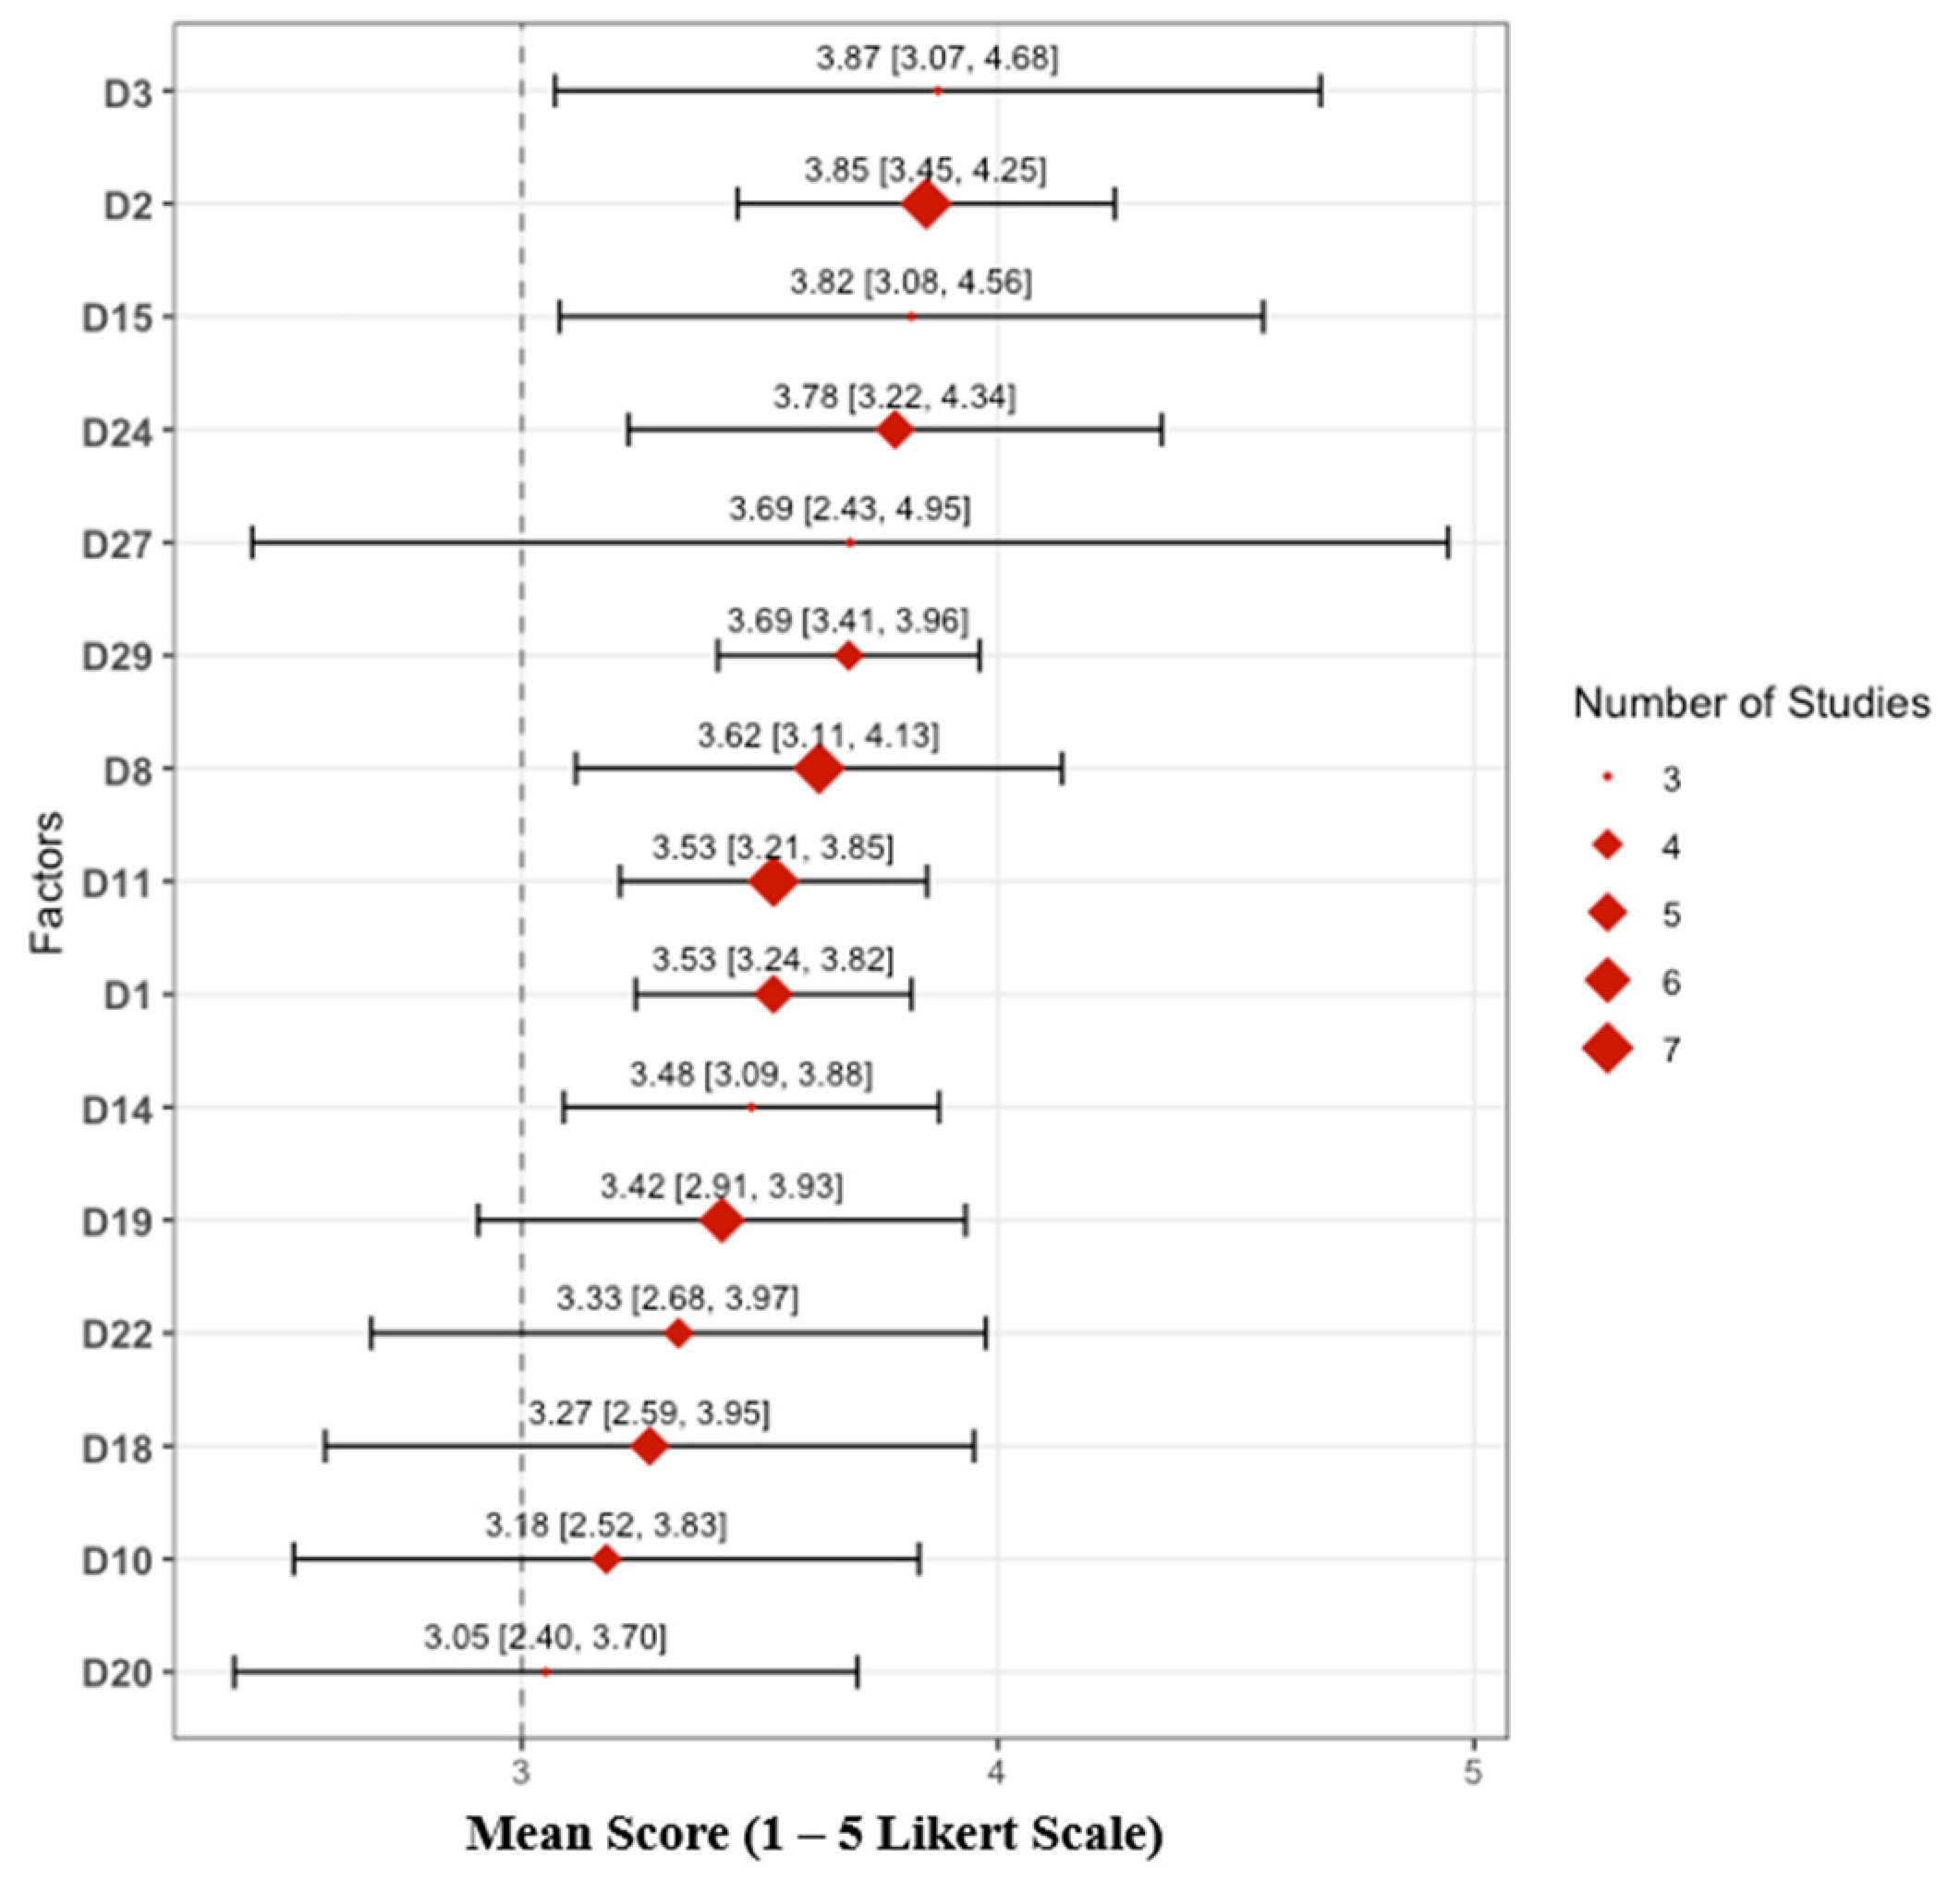
The meta-analysis yielded pooled mean effect sizes for all 32 determinants. Table 4 presents the top 15 most influential factors ranked by their pooled mean effect size, revealing the most critical drivers of TCs in MiC. The top three determinants are D3 “Poor Logistics” (Pooled Mean = 3.87), D2 “Design Change” (3.85), and D15 “Insufficient Quality Inspection Standards and Regulations” (3.82). The visual summary of these key drivers is presented in a forest plot (see Figure 4), where the red diamonds indicate the pooled mean scores derived from the random-effects model, and the error bars represent the 95% confidence intervals. The vertical dashed line at 3.0 denotes the neutral threshold.
Several key findings emerge from the analysis. First, the results highlight that operational and procedural hurdles are perceived as the most potent cost drivers. The top-ranking factors—Poor Logistics (D3), Design Change (D2), and issues related to quality inspection (D15)—are all intricately linked to the execution and coordination of MiC projects, suggesting that inefficiencies in the construction process itself are primary TC sources.
Second, an analysis of the heterogeneity statistics reveals extreme variability across study contexts. The I2 values for the top determinants consistently exceed 90% (see Table 4), indicating that over 90% of the total variance in observed effect sizes is attributable to genuine differences between studies—such as geographic location, project type, or regulatory environment—rather than sampling error. This profound heterogeneity underscores the high contextual dependency of each factor’s impact. Consequently, while the pooled mean provides a best estimate of the average effect, the 95% prediction interval—which estimates the range within which the true effect of a factor would fall in a new, similar study—is exceptionally wide for these factors. This reinforces the interpretation that these are universally significant but variably impactful drivers across different MiC scenarios.
Third, ranking determinants by pooled mean effect size provides a crucial, impact-based hierarchy that diverges meaningfully from simple frequency counts in the literature. For instance, D8 (“Lack of Relevant Technical Support”) was the most frequently studied factor (k = 7) but ranks 7th by effect size, while D1 (“Increased Initial Investment Requirement”) is another commonly cited factor yet ranks 9th. This discrepancy underscores a key limitation of narrative literature reviews that rely on citation prevalence and validates the meta-analytic approach for distinguishing how often a factor is discussed from how severely it is perceived to impact costs.

3.2.2. Investigation of Heterogeneity: Subgroup and Meta-Regression Analyses

To probe the sources of extreme heterogeneity (I2 > 90% for most factors) and test the moderating role of predefined contextual factors, subgroup analyses were conducted based on publication year, economic development level, and study region. The results revealed statistically significant patterns of variation across these dimensions.
The subgroup analysis by publication year revealed a clear temporal shift in the perceived severity of transaction cost determinants, aligning with the industry’s maturation from foundational development (2005–2020) to mainstreaming & scalability (2021–2025). Overall, pooled means for a majority of determinants exhibited an upward trend in the recent phase, with generally narrower confidence intervals reflecting larger samples and more consistent measurement. This evolution, however, was not uniform but varied by the nature of the barrier. For factors critical to systemic integration and coordination—such as D24 (Insufficient Stakeholder Collaboration), which rose from 3.38 [3.20, 3.56] (k = 2) to 4.39 [4.24, 4.54] (k = 3), D2 (Design Change), which increased from 3.77 [3.65, 3.89] (k = 4) to 4.23 [4.12, 4.34] (k = 3), and D27 (Shortage of Skilled Professionals), which grew from 3.38 to 4.30 (k = 3)—the effect sizes were significantly higher in Phase 2, indicating that barriers related to cross-disciplinary coordination and human capital have become markedly more pronounced as MiC projects scale. In contrast, core institutional and financial barriers demonstrated persistent relevance regardless of the industry’s stage. For example, D11 (Insufficient Government Support and Incentives) remained stable at approximately 3.6 across both phases (Phase 1: 3.65 [3.25, 4.05], k = 4; Phase 2: 3.58 [3.40, 3.76], k = 3), as did D1 (Increased Initial Investment Requirement; ~3.5). Finally, a few determinants showed a moderate decline in perceived severity in the recent phase, notably D18 (Insufficient Project Financing) and D10 (Deficiency in Standardization and Regulatory Frameworks), possibly signaling incremental progress in these areas. This pattern underscores that while the challenge landscape evolves with scalability, fundamental institutional and economic constraints remain enduring bottlenecks.
The subgroup analysis by economic development level indicated that for most factors related to institutions, regulations, and the market environment, the pooled effect size tended to be higher in studies from developing economies compared to developed ones. For instance, for factor D11 (“Insufficient Government Support and Incentives”), the pooled mean was 3.65 [3.25, 4.05] in the developing economies subgroup (k = 5) compared to 3.20 [2.85, 3.55] in the developed economies subgroup (k = 2), with a statistically significant between-subgroup difference. Similar trends were observed for factors such as D8 (“Lack of Relevant Technical Support”), D10 (“Deficiency in Standardization and Regulatory Frameworks”), and D18 (“Insufficient Project Financing”). This suggests that differences in institutional context represent a significant dimension explaining the variation in effect sizes for these factors.
The subgroup analysis by study region revealed geographical disparities in the impact patterns of certain factors. For example, the pooled effect sizes for D2 (“Design Change”) and D24 (“Insufficient Stakeholder Collaboration”) were significantly higher among Asian studies than non-Asian studies. In contrast, for operational barriers like D3 (“Poor Logistics”), the between-subgroup difference was not statistically significant, indicating a more universal impact. This analysis partially explains the heterogeneity attributable to the geographical concentration of the literature.
It is important to note that while all subgroup analyses showed trends or significant differences between groups and generally resulted in a reduction in residual heterogeneity (I2) within subgroups compared to the overall analysis, the remaining I2 values were still high. This confirms that economic development level and regional context are important, but not exhaustive, sources of heterogeneity. Unobserved study characteristics (e.g., specific project types, differences in respondent profiles) likely contributed to the remaining variance. Furthermore, for this analysis, some subgroups (e.g., the “Developed economies” or “Non-Asia” groups for certain factors) contained a limited number of independent studies (k ≤ 4). While this does not preclude the observation of trends, it limits the statistical stability of the subgroup estimates and the strength of conclusions. Therefore, the results of this subgroup analysis should be interpreted as a preliminary, descriptive exploration of heterogeneity sources. Their deeper theoretical implications will be further elaborated in the Discussion chapter.

3.2.3. Leave-One-Out Sensitivity Analysis

To evaluate the robustness of the meta-analytic findings, a comprehensive “leave-one-out” sensitivity analysis was conducted for each determinant. This procedure involved iteratively excluding each individual study from the model and recalculating the pooled effect size, thereby testing whether the overall conclusions were unduly influenced by any single data source. The results are available in the Supplementary Materials File “Leave-one-out Sensitivity Analysis Plots”.
The analysis confirmed that the pooled estimates for most factors were highly robust. For most determinants, the recalculated mean after omitting any single study remained within the confidence interval of the original overall estimate. This stability was notably observed for factors such as D11 (“Insufficient Government Support and Incentives”) and D19 (“Insufficient Supervision and Oversight”), where the summary effect proved resilient to the exclusion of any particular study. The robustness was particularly pronounced for several top-ranked drivers. For “Increased Initial Investment Requirement (D1)”, the recalculated pooled mean demonstrated minimal fluctuation, ranging narrowly from 3.44 (when omitting [15]) to 3.65 (when omitting [22]), with the lower bound of its 95% confidence interval consistently remaining above 3.1. Similarly, the estimate for “Design Change (D2)” exhibited exceptional stability, with the recalculated mean confined to a tight range of 3.52 to 3.88 regardless of which study was excluded.
Conversely, for a subset of factors characterized by extreme heterogeneity, the sensitivity analysis revealed a notable dependence on findings from specific contexts. This indicates that the overall result for these factors is sensitive to particular data points, further highlighting the substantial influence of unmeasured contextual moderators. For instance, in the case of “Insufficient Stakeholder Collaboration (D24)”, the omission of the study by [17]) led to a marked increase in the pooled mean from 3.78 to 4.09. Most conclusively, the analysis for “Shortage of Skilled Professionals (D27)” demonstrated that no single-study exclusion could alter its statistically non-significant status; all recalculated 95% confidence intervals continued to span the neutral threshold of 3.0. This confirms the intrinsic instability of the pooled estimate for D27 and powerfully illustrates that the perceived impact of this factor is fundamentally contingent on highly specific and variable study contexts.

4. Discussion

This study employed a hybrid systematic review and meta-analytic methodology to synthesize empirical evidence concerning the drivers of transaction costs (TCs) in Modular Integrated Construction (MiC). Building upon the rigorous quantitative synthesis presented in Section 3 (Results)—which encompassed the systematic identification of influencing factors and their quantitative ranking via meta-analysis —a pivotal finding is first interpreted: the marked divergence between the prevalence of a factor in the literature and its quantified impact on TCs. Subsequently, the theoretical and practical implications of this and other core results are explored and contextualized within the broader landscape of construction management research. The integration of data from 37 studies provides a robust platform to move beyond descriptive listings of barriers towards an evidence-based understanding of the mechanisms driving transactional inefficiency in MiC.

4.1. Divergence Between Frequency and Impact

This study employed a hybrid systematic review and meta-analytic methodology. A defining contribution of this study lies in its ability to empirically differentiate between how often a transaction cost driver is discussed in the literature and how severely it is perceived to affect costs in practice. This distinction is crystallized in the contrast between the ranking of determinants by their frequency of occurrence across the 37 reviewed studies (see Table 2) and their ranking by the pooled mean effect size derived from meta-analysis (see Table 4).
The frequency-based ranking is led by factors such as “Lack of Relevant Technical Support (D8)” (cited 20 times), “Require Skilled Labor with Higher Wages (D31)” (18 times), and “Increased Initial Investment Requirement (D1)” (17 times). This profile suggests a research and practitioner discourse heavily focused on upfront resource constraints—capital, specialized labor, and technical infrastructure.
However, the meta-analytic ranking, which quantifies the average perceived severity, reveals a different hierarchy of criticality. The top drivers are “Poor Logistics (D3)”, “Design Change (D2)”, and “Insufficient Quality Inspection Standards and Regulations (D15)”. Notably, while D8 and D1 remain important (ranking 7th and 9th by effect size, respectively), they are superseded by these operational and governance factors.
This discrepancy is not merely a methodological artifact but an insight with dual implications:
  • Methodological Validation: It underscores a key limitation of narrative literature reviews or analyses that rely primarily on citation or frequency counts. Such approaches may conflate the volume of discourse with the magnitude of impact, potentially leading to skewed priority-setting. Our findings validate the necessity of meta-analytic techniques, which statistically aggregate quantitative data across studies to provide a more accurate, evidence-based gauge of relative importance.
  • Substantive Re-focusing for Practice: The shift from “most discussed” to “most impactful” reframes the primary challenge of MiC adoption. It suggests that while securing adequate resources (D1, D31) and technical foundations (D8) are necessary preconditions, the most potent sources of transactional friction and cost overrun arise during project execution. The paramount drivers are systemic frictions inherent in the MiC model: the coordination complexity of just-in-time logistics (D3), the heightened cost of change due to high asset specificity (D2), and the governance gaps in quality assurance (D15). This shifts the strategic focus from overcoming generic entry barriers to actively managing high-stakes operational and procedural risks.
It is important to acknowledge that the Likert-scale data synthesized in this meta-analysis may be influenced by cultural and contextual factors, such as regional response style variations or differences in professional norms across countries. This might be the limitation of cross-context survey research. However, we try to mitigate it through the relative ranking of factors derived from the meta-analysis, even if absolute scores vary across studies. This is because the ranking reflects the within-study order of importance assigned by respondents, which is less susceptible to cultural anchoring than absolute values. Moreover, the consistency of rankings across multiple independent studies (each factor is supported by at least three samples from diverse geographic contexts) strengthens the reliability of the synthesized hierarchy. Therefore, while caution is warranted in interpreting absolute magnitudes, the comparative positioning of transaction cost drivers offers a valid and meaningful basis for identifying priority areas for intervention in MiC projects.

4.2. The Moderating Role of Year, Economic and Regional Factors

The meta-analytic ranking of determinants shifts the focus from commonly acknowledged financial and resource barriers to the operational and governance hurdles that most directly amplify transaction costs during MiC project delivery. The three highest-ranked factors—poor logistics (D3), design changes (D2), and insufficient quality inspection standards and regulations (D15)—collectively highlight the systemic frictions inherent in transitioning from traditional to modular construction. When examined through the lens of Transaction Cost Economics, these drivers map directly to the core theoretical constructs of uncertainty, asset specificity, and governance gaps, providing empirical validation for TCE in the MiC context.
A closer examination reveals why these determinants exert such a strong influence on transaction costs. Poor logistics (D3) encapsulates the critical coordination challenge between off-site manufacturing and on-site assembly, which introduces substantial behavioral and environmental uncertainty into the supply chain. Any misalignment in timing or sequencing disrupts the just-in-time delivery model, leading to costly delays, storage expenses, renegotiation, and contractual disputes. From a TCE perspective, this uncertainty necessitates investments in more elaborate coordination mechanisms and contingency planning, thereby inflating ex-ante and ex-post transaction costs.
Design changes (D2) are particularly detrimental in MiC due to high physical and human asset specificity. Once module fabrication commences, investments are made in specialized tooling, factory production lines, and skilled labor that cannot be easily redeployed. Alterations after this point require factory rework, logistical rearrangements, and site re-sequencing, creating hold-up situations and opportunities for opportunistic behavior among supply chain partners. This amplifies renegotiation, adaptation, and compliance costs—classic manifestations of transaction costs arising from asset specificity.
Insufficient quality inspection standards and regulations (D15) reflect an institutional gap that elevates both ex-ante and ex-post transaction costs through heightened measurement uncertainty. The lack of MiC-specific benchmarks increases ambiguity in module quality verification, creating information asymmetries between manufacturers and developers. In response, stakeholders deploy greater monitoring efforts, engage third-party inspections, and embed additional contractual safeguards to mitigate perceived risks. These governance responses, while rational at the project level, represent pure transaction costs that could be reduced through clearer institutional frameworks.
In summary, these findings underscore that achieving cost efficiency in MiC is less about overcoming a single major financial obstacle and more about systematically managing the high-impact frictions embedded in its supply chain coordination, design rigidity, and regulatory clarity. By anchoring these drivers in TCE constructs, the analysis reveals that transaction costs in MiC are not merely operational nuisances but fundamental consequences of uncertainty, asset specificity, and governance gaps. This reorients strategic priorities toward strengthening integrated project delivery mechanisms, enforcing early design freeze protocols, and developing industry-accepted quality assurance frameworks—interventions that directly target the theoretical sources of transactional friction.

4.3. Validating and Extending the Transaction Cost Economics Framework

This study’s findings provide robust empirical validation for TC in the context of a modern, technology-driven construction method. The high-ranked factors align perfectly with TC’s core tenets:
  • Asset Specificity: “Design Change (D2)” and the need for specialized skills implicitly reflect the high asset specificity (both physical and human) in MiC, which creates dependency and hold-up risks.
  • Uncertainty: “Poor Logistics (D3)” and “Insufficient Quality Inspection Standards (D15)” are major sources of uncertainty, driving up costs for information gathering, adaptation, and risk mitigation.
Furthermore, the study extends the analytical framework beyond the classical set of transaction attributes. By categorizing factors into Transaction, Transaction Environment, and Transaction Stakeholders, and by demonstrating the significant moderating effect of the environment (via economic development subgroups), it reinforces the importance of the institutional context in TC. It shows that the “rules of the game” in a given country or region are not a backdrop but an active determinant of the level of transactional friction.
The methodological contribution is equally significant. By demonstrating a clear divergence between factor frequency and effect size, this research challenges the sufficiency of qualitative systematic reviews and simple frequency tallies for priority-setting in applied fields. It champions meta-analysis as a necessary tool for evidence-based policy and management in construction, enabling stakeholders to allocate resources to mitigate the most impactful barriers, not just the most discussed ones.

4.4. Practical Implications and Strategic Recommendations

The context-dependent, yet clearly ranked, findings offer actionable, stratified guidance for industry practitioners and policymakers:
  • For Project Managers and Contractors:
Project managers and contractors bear the primary responsibility for addressing the high-impact operational drivers identified in this study. To mitigate the severe transaction costs associated with poor logistics (D3), project teams can consider investing in integrated digital tools such as the just-in-time assurance in supply chain management platforms. These technologies enable real-time coordination between off-site manufacturing and on-site assembly, reducing uncertainty and minimizing costly delays. To address the disproportionate cost of design changes (D2) in MiC projects, rigorous front-end planning and design freeze protocols must be implemented before to ensure that modifications are minimized after module fabrication commences. Furthermore, given the absence of formal quality benchmarks (D15), contractors and project managers should proactively adopt proprietary or industry-agreed quality assurance protocols to reduce monitoring costs, build trust among stakeholders, and compensate for current regulatory gaps. In this regard, blockchain technology offers a promising solution by providing an immutable and transparent ledger for recording quality inspections, material certifications, and module compliance data. The decentralized and tamper-proof nature of blockchain can enhance the credibility of self-regulated quality assurance processes, reduce information asymmetry among project participants, and minimize disputes arising from quality uncertainties, thereby further lowering transaction costs associated with verification and enforcement.
2.
For Policymakers and Industry Bodies:
Policymakers and industry bodies play a crucial role in shaping the transaction environment within which MiC projects operate. In developing economies, the priority must be building institutional capacity through the development of MiC-specific codes and standards (D10 and D15), the creation of financial incentives or guarantee schemes (D11 and D18), and the funding of pilot projects to cultivate local expertise. These foundational measures address the regulatory voids and resource constraints that disproportionately amplify transaction costs in less mature markets. In developed economies, where institutional frameworks are more established, the focus should shift toward optimizing the existing ecosystem. This involves fostering cross-industry collaboration to standardize logistics processes, supporting research and development in interoperable digital platforms, and refining insurance and bonding products tailored to MiC projects to mitigate perceived risks and facilitate market confidence.
Although stakeholder-related factors did not rank among the top three determinants by effect size in this meta-analysis, their critical importance should not be overlooked. The shortage of skilled professionals (D27) represents a persistent constraint that undermines the efficient execution of MiC projects across all contexts. The industry must therefore prioritize the development of targeted education and training programs to build competencies in digital design, factory production, and integrated logistics management. Establishing professional certification pathways for MiC specialists can further reduce information asymmetry and mitigate the transaction costs arising from human asset specificity, thereby strengthening the overall capacity of the workforce to support scalable and sustainable MiC adoption.

4.5. Limitations and Future Directions

This study has several limitations that warrant acknowledgment and chart a course for future inquiry. First, the meta-analysis was constrained by the available quantitative data in the literature, with some factors supported by only a few studies. This scarcity of standardized data necessitated cautious interpretation of the point estimates for certain determinants. Second, a critical observation is the substantial statistical heterogeneity (I2 > 90%) observed across the majority of synthesized factors. While subgroup analyses identified economic and regional moderators as significant, the high residual heterogeneity points to the influence of other unmeasured variables and underscores that the impact of TCs is not absolute but is fundamentally context-dependent. This variability reflects the MiC industry’s profound reliance on local institutional environments and supply chain maturity. For instance, the burden of “Poor Logistics” (D3) or “Design Change” (D2) may incur different costs depending on a region’s transport infrastructure, regulatory stability, and the level of digital integration between factory and site. Thus, the pooled results should be interpreted as a global mapping of systemic frictions rather than fixed universal values.
Third, this study did not conduct a formal risk-of-bias or quality assessment using standardized instruments such as those developed for clinical trials. It should be acknowledged that such tools are not typically applicable to the types of studies synthesized in this meta-analysis. Nevertheless, to provide transparency regarding the evidence base, a comprehensive descriptive overview of the methodological diversity of the included studies was presented in Section 2.2.1, including sample sizes, data collection methods, and geographic coverage. Furthermore, all studies included in this synthesis were sourced from peer-reviewed journals, which provides a baseline level of quality assurance. The absence of a formal risk-of-bias assessment is therefore acknowledged as a limitation inherent to the nature of the available evidence, and readers are encouraged to interpret the findings with this consideration in mind.
Building on these limitations, several directions for future research emerge. To address the issue of limited data availability for certain factors, future studies should conduct primary empirical research designed with methodological comparability in mind. The research could consider adopting standardized measurement scales for transaction cost drivers, which would enable more consistent data collection across different geographical and project contexts. Such efforts would enrich and strengthen the meta-analytic database, allowing for more reliable estimation of effect sizes for factors that are currently underrepresented in the literature. This would also facilitate more robust cross-study comparisons and enhance the generalizability of future findings.
To better understand the sources of the substantial statistical heterogeneity observed in this study, future research can employ advanced meta-regression techniques on an expanded set of primary studies. This approach would enable researchers to quantitatively examine how multiple contextual factors simultaneously influence the effect sizes of transaction cost drivers. By systematically accounting for these moderating variables, future syntheses can more precisely determine under what specific conditions certain drivers exert greater or lesser influence on transaction costs, thereby moving beyond the identification of heterogeneity toward explaining its underlying causes.
To move beyond analyzing transaction cost drivers in isolation, future investigations should examine the interactions and cascading effects among different factors. For example, researchers could explore how poor logistics (D3) exacerbates stakeholder conflict (D24), or how frequent design changes (D2) amplify the demand for skilled labor (D31) and associated wage premiums. Analytical methods such as structural equation modeling or system dynamics are well-suited to capturing these complex interrelationships. Understanding how drivers combine and compound one another would reveal the underlying mechanisms through which transaction costs accumulate in MiC projects and inform more holistic intervention strategies.

5. Conclusions

This study conducted a hybrid systematic review and meta-analysis, adhering to PRISMA guidelines, to identify, quantify, and contextualize the key drivers of transaction costs (TCs) in Modular Integrated Construction (MiC). Based on a synthesis of 37 empirical studies published between 2005 and 2025, 32 influencing factors were identified and categorized into a tripartite framework encompassing transaction attributes, the transaction environment, and transaction stakeholders. The meta-analysis quantified the pooled effect sizes of these factors, revealing that the most critical determinants are operational and procedural in nature: “Poor Logistics (D3),” “Design Change (D2),” and “Insufficient Quality Inspection Standards and Regulations (D15).”
A key finding of this research is the marked divergence between the frequency with which certain factors are discussed in the literature and their quantified impact on TCs. Factors such as “Lack of Relevant Technical Support (D8)” and “Increased Initial Investment Requirement (D1),” though commonly cited, ranked lower in terms of effect size. This discrepancy validates the necessity of meta-analytic synthesis for accurate priority-setting, moving beyond simple frequency counts to provide a more objective, evidence-based hierarchy of TC drivers.
Subgroup analyses further revealed that the perceived severity of these drivers is significantly moderated by contextual factors. The impact of institutional and regulatory barriers, such as insufficient government support and deficient standardization, was found to be more pronounced in developing economies. Temporal analysis indicated that coordination-related challenges, including design changes and stakeholder collaboration, have intensified as the industry has matured. Sensitivity analyses confirmed the general robustness of the core findings, though high residual heterogeneity underscores the context-dependent nature of TC impacts.
The study offers both theoretical and practical contributions. Theoretically, it extends Transaction Cost Economics by empirically validating the central role of asset specificity and uncertainty in MiC, while also demonstrating the powerful moderating influence of the institutional environment. Practically, it provides stakeholders with an evidence-based roadmap for intervention: prioritizing investments in integrated logistics and digital coordination tools, enforcing rigorous front-end planning and design freeze protocols, and developing MiC-specific quality assurance frameworks. These strategies should be tailored to the maturity of the institutional and market context in which a project operates.
This study is not without limitations. The meta-analysis was constrained by the availability and methodological heterogeneity of primary studies, and the geographical distribution of the evidence base indicates a need for more balanced global representation. Future research should focus on conducting primary studies with standardized measurement scales to enhance comparability, employing meta-regression to model multiple contextual moderators, and investigating the dynamic interactions among key TC drivers across the project lifecycle.

Supplementary Materials

The following supporting information can be downloaded at: https://www.mdpi.com/article/10.3390/buildings16051051/s1, PRISMA checklist [70].

Author Contributions

Conceptualization, J.Z.; methodology, Q.D.; validation, Z.Z.; formal analysis, J.Z. and Q.D.; investigation, Q.D.; Data curation, Z.Y.; writing—original draft preparation, J.Z.; writing—review and editing, Q.D.; visualization, Z.Y.; project administration, Z.Z. All authors have read and agreed to the published version of the manuscript.

Funding

This research has not received external funding.

Data Availability Statement

The original contributions presented in this study are included in the article/Supplementary Material. Further inquiries can be directed to the corresponding author.

Conflicts of Interest

Author Jingfeng Zhang was employed by the company China Zhejiang Construction International Group Co. Ltd. Authors Zhenning Yang and Zenan Zhang were employed by the company CR Construction Co. Ltd. The remaining author declares that the research was conducted in the absence of any commercial or financial relationships that could be construed as a potential conflict of interest.

References

  1. Hadi, A.; Cheung, F.; Adjei, S.; Dulaimi, A. Evaluation of lean off-site construction literature through the lens of industry 4.0 and 5.0. J. Constr. Eng. Manag. 2023, 149, 03123007. [Google Scholar] [CrossRef] [Scilit]
  2. Zhan, W.; Pan, W.; Law, W.; Shen, H. Stakeholders’ knowledge, attitudes, and intentions of adopting modular integrated construction for sustainable development in Hong Kong. J. Manag. Eng. 2024, 40, 04023070. [Google Scholar] [CrossRef] [Scilit]
  3. Building Department. Modular Integrated Construction. 2022. Available online: https://www.bd.gov.hk/en/resources/codes-and-references/modular-integrated-construction/index.html (accessed on 20 December 2025).
  4. Bello, A.O.; Khan, A.A.; Idris, A.; Awwal, H.M. Barriers to modular construction systems implementation in developing countries’ architecture, engineering and construction industry. Eng. Constr. Archit. Manag. 2024, 31, 3148–3164. (In English) [Google Scholar] [CrossRef] [Scilit]
  5. Tan, Y.; Chen, L.M.; Huang, M.F.; Li, J.; Zhang, G.R. Automated geometric quality inspection for modular boxes using BIM and LiDAR. Autom. Constr. 2024, 164, 105474. (In English) [Google Scholar] [CrossRef] [Scilit]
  6. Innella, F.; Arashpour, M.; Bai, Y. Lean methodologies and techniques for modular construction: Chronological and critical review. J. Constr. Eng. Manag. 2019, 145, 04019076. [Google Scholar] [CrossRef] [Scilit]
  7. Wang, D.; Zayed, T.; Eltoukhy, A.E.; Wu, H. Integrated Planning Approach for Optimizing Tower Crane and Truck Locations in Modular Integrated Construction. J. Constr. Eng. Manag. 2024, 150, 04024121. [Google Scholar] [CrossRef] [Scilit]
  8. Jaillon, L.; Poon, C.S. Sustainable construction aspects of using prefabrication in dense urban environment: A Hong Kong case study. Constr. Manag. Econ. 2008, 26, 953–966. [Google Scholar] [CrossRef] [Scilit]
  9. Lawson, R.M.; Ogden, R.G.; Bergin, R. Application of modular construction in high-rise buildings. J. Archit. Eng. 2012, 18, 148–154. [Google Scholar] [CrossRef] [Scilit]
  10. Pan, W.; Zhang, Z. Benchmarking the sustainability of concrete and steel modular construction for buildings in urban development. Sustain. Cities Soc. 2023, 90, 104400. [Google Scholar] [CrossRef] [Scilit]
  11. Greer, F.; Horvath, A. Modular construction’s capacity to reduce embodied carbon emissions in California’s housing sector. Build. Environ. 2023, 240, 110432. [Google Scholar] [CrossRef] [Scilit]
  12. Wuni, I.Y.; Shen, G.Q. Barriers to the adoption of modular integrated construction: Systematic review and meta-analysis, integrated conceptual framework, and strategies. J. Clean. Prod. 2020, 249, 119347. [Google Scholar] [CrossRef] [Scilit]
  13. Alhawamdeh, M.; Lee, A. A systematic review and meta-synthesis of the barriers of offsite construction projects. Int. J. Constr. Manag. 2025, 25, 1087–1099. [Google Scholar] [CrossRef] [Scilit]
  14. Oyefusi, O.N.; Arowoiya, V.A.; Chan, M. Hybrid MCDM approach for analyzing barriers and formulating strategies for the adoption of modular construction in developing countries. Eng. Constr. Archit. Manag. 2024, 32, 6627–6664. [Google Scholar] [CrossRef] [Scilit]
  15. Mao, C.; Shen, Q.; Pan, W.; Ye, K. Major barriers to off-site construction: The developer’s perspective in China. J. Manag. Eng. 2015, 31, 04014043. [Google Scholar] [CrossRef] [Scilit]
  16. Williamson, O.E. The Economic Institutions of Capitalism; Free Press: New York, NY, USA, 1985. [Google Scholar]
  17. Wu, H.; Qian, Q.K.; Straub, A.; Visscher, H. Stakeholder perceptions of transaction costs in prefabricated housing projects in China. J. Constr. Eng. Manag. 2021, 147, 04020145. [Google Scholar] [CrossRef] [Scilit]
  18. Wu, H.; Qian, Q.K.; Straub, A.; Visscher, H. Exploring transaction costs in the prefabricated housing supply chain in China. J. Clean. Prod. 2019, 226, 550–563. [Google Scholar] [CrossRef] [Scilit]
  19. Wu, H.; Qian, Q.K.; Straub, A.; Visscher, H.J. Factors influencing transaction costs of prefabricated housing projects in China: Developers’ perspective. Eng. Constr. Archit. Manag. 2022, 29, 476–501. [Google Scholar] [CrossRef] [Scilit]
  20. Gooding, L.; Gul, M.S. Energy efficiency retrofitting services supply chains: A review of evolving demands from housing policy. Energy Strategy Rev. 2016, 11, 29–40. [Google Scholar] [CrossRef] [Scilit]
  21. Wuni, I.Y.; Shen, G.Q.P.; Mahmud, A.T. Critical risk factors in the application of modular integrated construction: A systematic review. Int. J. Constr. Manag. 2019, 22, 133–147. (In English) [Google Scholar] [CrossRef] [Scilit]
  22. Ramesh, S.; Shahzad, W.; Sutrisna, M. Transaction cost of offsite construction (OSC): A New Zealand study. IOP Conf. Ser. Earth Environ. Sci. 2022, 1101, 042044. [Google Scholar] [CrossRef] [Scilit]
  23. Wu, H.; Qian, Q.K.; Straub, A.; Visscher, H.; Zhuang, T. How do developers influence the transaction costs of China’s prefabricated housing development process? An investigation through the Bayesian belief network approach. Systems 2024, 12, 147. [Google Scholar] [CrossRef] [Scilit]
  24. Zhang, S.; Rong, X.; Bakhtawar, B.; Tariq, S.; Zayed, T. Assessment of feasibility, challenges, and critical success factors of MiC projects in Hong Kong. J. Archit. Eng. 2021, 27, 04020047. [Google Scholar] [CrossRef] [Scilit]
  25. Chen, L.; Chan, A.P.; Owusu, E.K.; Darko, A.; Gao, X. Critical success factors for green building promotion: A systematic review and meta-analysis. Build. Environ. 2022, 207, 108452. [Google Scholar] [CrossRef] [Scilit]
  26. Page, M.J.; Moher, D.; Bossuyt, P.M.; Boutron, I.; Hoffmann, T.C.; Mulrow, C.D.; Shamseer, L.; Tetzlaff, J.M.; Akl, E.A.; Brennan, S.E.; et al. PRISMA 2020 explanation and elaboration: Updated guidance and exemplars for reporting systematic reviews. BMJ 2021, 372, n160. [Google Scholar] [CrossRef] [PubMed]
  27. Liberati, A.; Altman, D.G.; Tetzlaff, J.; Mulrow, C.; Gøtzsche, P.C.; Ioannidis, J.P.; Clarke, M.; Devereaux, P.J.; Kleijnen, J.; Moher, D. The PRISMA statement for reporting systematic reviews and meta-analyses of studies that evaluate healthcare interventions: Explanation and elaboration. BMJ 2009, 339, b2700. [Google Scholar] [CrossRef] [Scilit]
  28. Grant, M.J.; Booth, A. A typology of reviews: An analysis of 14 review types and associated methodologies. Health Inf. Libr. J. 2009, 26, 91–108. [Google Scholar] [CrossRef] [Scilit]
  29. O’Grady, T.; Chong, H.-Y.; Morrison, G.M. A systematic review and meta-analysis of building automation systems. Build. Environ. 2021, 195, 07770. [Google Scholar] [CrossRef] [Scilit]
  30. Higgins, J.P.; Green, S. Cochrane Handbook for Systematic Reviews of Interventions; Wiley: Hoboken, NJ, USA, 2008. [Google Scholar]
  31. Gaur, A.; Kumar, M. A systematic approach to conducting review studies: An assessment of content analysis in 25 years of IB research. J. World Bus. 2018, 53, 280–289. [Google Scholar] [CrossRef] [Scilit]
  32. Mariani, M.M.; Machado, I.; Nambisan, S. Types of innovation and artificial intelligence: A systematic quantitative literature review and research agenda. J. Bus. Res. 2023, 155, 113364. [Google Scholar] [CrossRef] [Scilit]
  33. Hussein, M.; Zayed, T. Crane operations and planning in modular integrated construction: Mixed review of literature. Autom. Constr. 2021, 122, 103466. [Google Scholar] [CrossRef] [Scilit]
  34. Nicolson, M.L.; Fell, M.J.; Huebner, G.M. Consumer demand for time of use electricity tariffs: A systematized review of the empirical evidence. Renew. Sustain. Energy Rev. 2018, 97, 276–289. [Google Scholar] [CrossRef] [Scilit]
  35. Hunter, J.E.; Schmidt, F.L. Methods of Meta-Analysis: Correcting Error and Bias in Research Findings; Sage: Thousand Oaks, CA, USA, 2004. [Google Scholar]
  36. Minunno, R.; O’Grady, T.; Morrison, G.M.; Gruner, R.L. Investigating the embodied energy and carbon of buildings: A systematic literature review and meta-analysis of life cycle assessments. Renew. Sustain. Energy Rev. 2021, 143, 110935. [Google Scholar] [CrossRef] [Scilit]
  37. Van der Kroon, B.; Brouwer, R.; Van Beukering, P.J. The energy ladder: Theoretical myth or empirical truth? Results from a meta-analysis. Renew. Sustain. Energy Rev. 2013, 20, 504–513. [Google Scholar] [CrossRef] [Scilit]
  38. Gurmu, A.T.; Mahmood, M.N. Critical Factors Affecting Quality in Building Construction Projects: Systematic Review and Meta-Analysis. J. Constr. Eng. Manag. 2024, 150, 04024004. (In English) [Google Scholar] [CrossRef] [Scilit]
  39. Phan, T.-H.D.; Brouwer, R.; Davidson, M.D. A global survey and review of the determinants of transaction costs of forestry carbon projects. Ecol. Econ. 2017, 133, 1–10. [Google Scholar] [CrossRef] [Scilit]
  40. Hong, J.; Shen, G.Q.; Li, Z.; Zhang, B.; Zhang, W. Barriers to promoting prefabricated construction in China: A cost–benefit analysis. J. Clean. Prod. 2018, 172, 649–660. [Google Scholar] [CrossRef] [Scilit]
  41. Gan, X.; Chang, R.; Zuo, J.; Wen, T.; Zillante, G. Barriers to the transition towards off-site construction in China: An Interpretive structural modeling approach. J. Clean. Prod. 2018, 197, 8–18. [Google Scholar] [CrossRef] [Scilit]
  42. Blismas, N.G.; Pendlebury, M.; Gibb, A.; Pasquire, C. Constraints to the use of off-site production on construction projects. Archit. Eng. Des. Manag. 2005, 1, 153–162. [Google Scholar] [CrossRef] [Scilit]
  43. Mao, C.; Xie, F.; Hou, L.; Wu, P.; Wang, J.; Wang, X. Cost analysis for sustainable off-site construction based on a multiple-case study in China. Habitat Int. 2016, 57, 215–222. [Google Scholar] [CrossRef] [Scilit]
  44. Li, H.; Arditi, D.; Wang, Z. Determinants of transaction costs in construction projects. J. Civ. Eng. Manag. 2015, 21, 548–558. [Google Scholar] [CrossRef] [Scilit]
  45. Kiss, B. Exploring transaction costs in passive house-oriented retrofitting. J. Clean. Prod. 2016, 123, 65–76. [Google Scholar] [CrossRef] [Scilit]
  46. Zhai, X.; Reed, R.; Mills, A. Factors impeding the offsite production of housing construction in China: An investigation of current practice. Constr. Manag. Econ. 2014, 32, 40–52. [Google Scholar] [CrossRef] [Scilit]
  47. Li, H.; Arditi, D.; Wang, Z. Factors that affect transaction costs in construction projects. J. Constr. Eng. Manag. 2013, 139, 60–68. [Google Scholar] [CrossRef] [Scilit]
  48. Coggan, A.; Buitelaar, E.; Whitten, S.; Bennett, J. Factors that influence transaction costs in development offsets: Who bears what and why? Ecol. Econ. 2013, 88, 222–231. [Google Scholar] [CrossRef] [Scilit]
  49. Goodier, C.; Gibb, A. Future opportunities for offsite in the UK. Constr. Manag. Econ. 2007, 25, 585–595. [Google Scholar] [CrossRef] [Scilit]
  50. O’Connor, J.T.; O’Brien, W.J.; Choi, J.O. Industrial project execution planning: Modularization versus stick-built. Pract. Period. Struct. Des. Constr. 2016, 21, 04015014. [Google Scholar] [CrossRef] [Scilit]
  51. Kamali, M.; Hewage, K. Life cycle performance of modular buildings: A critical review. Renew. Sustain. Energy Rev. 2016, 62, 1171–1183. [Google Scholar] [CrossRef] [Scilit]
  52. Wuni, I.Y.; Shen, G.Q.; Osei-Kyei, R.; Agyeman-Yeboah, S. Modelling the critical risk factors for modular integrated construction projects. Int. J. Constr. Manag. 2022, 22, 2013–2026. [Google Scholar] [CrossRef] [Scilit]
  53. Arif, M.; Egbu, C. Making a case for offsite construction in China. Eng. Constr. Archit. Manag. 2010, 17, 536–548. [Google Scholar] [CrossRef] [Scilit]
  54. Chiang, Y.-H.; Chan, E.H.-W.; Lok, L.K.-L. Prefabrication and barriers to entry—A case study of public housing and institutional buildings in Hong Kong. Habitat Int. 2006, 30, 482–499. [Google Scholar] [CrossRef] [Scilit]
  55. Yang, Y.; Pan, M.; Pan, W.; Zhang, Z. Sources of uncertainties in offsite logistics of modular construction for high-rise building projects. J. Manag. Eng. 2021, 37, 04021011. [Google Scholar] [CrossRef] [Scilit]
  56. Tam, V.W.; Tam, C.M.; Zeng, S.; Ng, W.C. Towards adoption of prefabrication in construction. Build. Environ. 2007, 42, 3642–3654. [Google Scholar] [CrossRef] [Scilit]
  57. Fan, K.; Chan, E.H.; Qian, Q.K. Transaction costs (TCs) in green building (GB) incentive schemes: Gross floor area (GFA) concession scheme in Hong Kong. Energy Policy 2018, 119, 563–573. [Google Scholar] [CrossRef] [Scilit]
  58. Tennakoon, T.M.M.P.; Chileshe, N.; Rameezdeen, R.; Ochoa, J.J.; Samaraweera, A. Modelling the effect of transaction cost determinants and governance on Australian offsite construction supply chain resilience. Eng. Constr. Archit. Manag. 2025, 32, 104–132. [Google Scholar] [CrossRef] [Scilit]
  59. Kim, D.Y.; Kim, R.G.; Kwak, H.S. A Closed-Loop Scheduling Framework for Prefabricated Bridge Girders: Bayesian Regression and TCTO-Based Optimization. Buildings 2025, 15, 4168. [Google Scholar] [CrossRef] [Scilit]
  60. Abd Shukor, A.S.; Idris, N.H.; Bakri, A.S. Assessing site waste management practices and cost between conventional and industrialised building system (IBS) projects in Malaysia. Int. J. Sustain. Constr. Eng. Technol. 2021, 12, 156–163. [Google Scholar] [CrossRef] [Scilit]
  61. Zhang, X.; Zhang, X. Automated component delivery management under uncertainty for prefabricated buildings to minimize cost and harmful emissions. Autom. Constr. 2024, 162, 105388. [Google Scholar] [CrossRef] [Scilit]
  62. Chaitongrat, T.; Janthachai, K.; Kusonkhum, W.; Boonchai, P.; Ikhwali, M.; Khotdee, M. Comparing Data Mining Methods for Predicting Cost Construction Projects: A Case Study of Cost Management Datasets from Thailand. J. Infrastruct. Policy Dev. 2024, 8, 2801. [Google Scholar] [CrossRef] [Scilit]
  63. Shalenny, V.; Andronov, A. Contractual and technological methods for ensuring the reliability and efficiency of seismic protection systems for the precast-monolithic civil buildings. IOP Conf. Ser. Mater. Sci. Eng. 2020, 913, 032052. [Google Scholar] [CrossRef] [Scilit]
  64. Liu, M.; Luo, M. Cost estimation model of prefabricated construction for general contractors based on system dynamics. Eng. Constr. Archit. Manag. 2025, 32, 621–638. [Google Scholar] [CrossRef] [Scilit]
  65. Karunaratne, T.; Ajiero, I.R.; Joseph, R.; Farr, E.; Piroozfar, P. Evaluating the economic impact of digital twinning in the AEC industry: A systematic review. Buildings 2025, 15, 2583. [Google Scholar] [CrossRef] [Scilit]
  66. Su, S.; Li, L.; Sun, A.; Cao, X.; Yuan, J. How to combine different types of prefabricated components in a building to reduce construction costs and carbon emissions? J. Build. Eng. 2024, 98, 111114. [Google Scholar] [CrossRef] [Scilit]
  67. Liu, G.; Qin, Z.; Wu, H.; Jia, L.; Zhuo, J. Optimizing process efficiency in prefabricated building supply chain: The role of hybrid governance behaviors in reducing transaction costs. Eng. Constr. Archit. Manag. 2025. [Google Scholar] [CrossRef] [Scilit]
  68. Couto, J.P.; Mendonca, P.; Reis, A.P. Prefabricated building systems: Evaluation of the construction practitioners’perception on the environmental and economic benefits. Environ. Eng. Manag. J. 2018, 17, 2103–2115. [Google Scholar]
  69. Antinori, C.; Sathaye, J. Assessing Transaction Costs of Project-Based Greenhouse Gas Emissions Trading; Lawrence Berkeley National Laboratory: Berkeley, CA, USA, 2007.
  70. Page, M.J.; McKenzie, J.E.; Bossuyt, P.M.; Boutron, I.; Hoffmann, T.C.; Mulrow, C.D.; Moher, D. The PRISMA 2020 statement: An updated guideline for reporting systematic reviews. BMJ 2021, 372, n71. [Google Scholar] [CrossRef] [Scilit]
Figure 1. Research framework.
Buildings 16 01051 g001
Figure 2. Adapted PRISMA process for selecting literature.
Buildings 16 01051 g002
Figure 3. Publication year distribution of included studies.
Buildings 16 01051 g003
Figure 4. Forest Plot of Key Transaction Cost Drivers.
Buildings 16 01051 g004
Table 1. Research Boolean Query Key Words.
DatabasePeriodKey Words
1WoS2005–2025(“modular construction” OR “offsite construction” OR “off-site construction” OR “prefabricated building *” OR “prefabrication” OR “industrialized building *” OR “MMC” OR “Modern Methods of Construction” OR “volumetric modular” OR “panelized” OR “precast” OR “DfMA”) AND (“transaction cost *” OR “transaction-cost *” OR “TCE” OR “governance” OR “asset specific *” OR “asset-specific *” OR “opportunism” OR “hold-up” OR “contract *” OR “make or buy” OR “make-or-buy” OR “coordination cost *” OR “search cost *” OR “negotiation cost *” OR “monitor * cost *” OR “enforcement cost *” OR “adaptation cost *” OR “uncertaint *” OR “incomplet * contract *” OR “standardi * interface *” OR “alliance” OR “relational contract *” OR “framework agreement *” OR “early contractor involvement” OR “ECI”)
2Scopus2005–2025(“modular construction” OR “offsite construction” OR “off-site construction” OR “prefabricat *” OR “industrialized building *” OR “MMC” OR “Modern Methods of Construction” OR “volumetric modular” OR “panelized” OR “precast” OR “DfMA” OR “design for manufacture and assembly”) AND (“transaction cost *” OR “transaction-cost *” OR TCE OR governance OR “asset specific *” OR “asset-specific *” OR opportunism OR “hold-up” OR contract * OR “make or buy” OR “make-or-buy” OR “coordination cost *” OR “search cost *” OR “negotiation cost *” OR “monitor * cost *” OR “enforcement cost *” OR “adaptation cost *” OR uncertaint * OR “incomplet * contract *” OR “standardiz * interface *” OR alliance OR “relational contract *” OR “framework agreement *” OR “early contractor involvement” OR ECI)
3IEEExplore2005–2025(“Document Title”:”modular construction” OR “Abstract”:”prefabricat *” OR “Index Terms”:”industrialized construction” OR “Abstract”:”MMC”) AND (“Abstract”:”transaction cost” OR “Abstract”:”TCE” OR “Abstract”:”governance” OR “Abstract”:”asset specificity”)
The asterisk (*) indicates a truncation (wildcard) in the search terms.
Table 2. Overview of included literature.
Study IDPublication YearCountryReference
Phan et al., 2017 (Netherlands)2017Netherlands[39]
Hong et al., 2018 (China)2018China[40]
Gan et al., 2018 (China)2018China[41]
Blismas et al., 2005 (UK)2005UK[42]
Mao et al., 2016 (China)2016China[43]
Li et al., 2015 (China)2015China[44]
Kiss 2016 (Sweden)2016Sweden[45]
Zhai et al., 2014 (China)2014China[46]
Li et al., 2013 (USA)2013USA[47]
Coggan et al., 2013 (Australia)2013Australia[48]
Goodier & Gibb 2007 (UK)2007UK[49]
O’Connor et al., 2016 (USA)2016USA[50]
Kamali & Hewage 2016 (Canada)2016Canada[51]
Mao et al., 2015 (China)2015China[15]
Wuni et al., 2022 (Hong Kong)2022Hong Kong[52]
Arif & Egbu 2010 (China)2010China[53]
Chiang et al., 2006 (Hong Kong)2006Hong Kong[54]
Yang et al., 2021 (Hong Kong)2021Hong Kong[55]
Tam et al., 2007 (Hong Kong)2007Hong Kong[56]
Fan et al., 2018 (Hong Kong)2018Hong Kong[57]
Wu et al., 2022 (China)2022China[19]
Wu et al., 2019 (China)2019China[18]
Tennakoon et al., 2025 (Australia)2025Australia[58]
Wu et al., 2021 (China)2021China[17]
Kim et al., 2025 (Korea)2025Korea[59]
Abd Shukor et al., 2021 (Malaysia)2021Malaysia[60]
Zhang & Zhang 2024 (China)2024China[61]
Chaitongrat et al., 2024 (Thailand)2024Thailand[62]
Shalenny & Andronov 2020 (Russia)2020Russia[63]
Liu & Luo 2025 (China)2025China[64]
Karunaratne et al., 2025 (UK)2025UK[65]
Wu et al., 2024 (China)2024China[23]
Su et al., 2024 (China)2024China[66]
Liu et al., 2025 (China)2025China[67]
Ramesh et al., 2022 (New Zealand)2022New Zealand[22]
Couto et al., 2018 (Portugal)2018Portugal[68]
Antinori & Sathaye 2007 (USA)2007USA[69]
Table 3. Influencing factors of TCs in MiC.
CategoryIDDeterminant of TCFrequency
TransactionD1Increased Initial Investment Requirement17
D2Design Change12
D3Poor Logistics13
D4Lack of Manufacturers and Suppliers3
D5Incompliance with Green Practices2
D6Difficulty in Changing from Traditional Methods6
D7Complexity of MiC Application2
Transaction EnvironmentD8Lack of Relevant Technical Support20
D9Poor Construction Conditions5
D10Deficiency in Standardization and Regulatory Frameworks9
D11Insufficient Government Support and Incentives10
D12Deficiency in Necessary Equipment for MiC5
D13Insufficient Market Demand and Client Interest3
D14Economies of Scale8
D15Insufficient Quality Inspection Standards and Regulations5
D16Absence of Legal Regulations6
D17Low Level of Standardization2
D18Insufficient Project Financing for Supporting MiC10
D19Insufficient Supervision and Oversight13
D20Project Location Evaluation and Accessibility7
D21Lack of Materials and Modules6
D22Competitive Pricing Setting12
D23Absence of a Stable Work Environment and Organizational Culture2
Transaction StakeholderD24Insufficient Stakeholder Collaboration10
D25Limited Practical Experience in MiC4
D26Resistance to Change2
D27Shortage of Skilled Professionals8
D28Deficiency in Professional Training5
D29Inadequate Awareness of Modular Construction6
D30Limited Technical Knowledge and Expertise4
D31Require Skilled Labor with Higher Wages18
D32Limited Capacity for Innovation6
Table 4. Top 15 determinants of TCs in MiC ranked by pooled mean effect size.
RankIDDeterminant of TCkPooled Mean95% CII2 (%)
1D3Poor Logistics33.87[3.07, 4.68]97.6
2D2Design Change73.85[3.45, 4.25]99.5
3D15Insufficient Quality Inspection Standards and Regulations33.82[3.08, 4.56]99.1
4D24Insufficient Stakeholder Collaboration53.78[3.22, 4.34]99.3
5D27Shortage of Skilled Professionals33.69[2.43, 4.95]98.3
6D29Inadequate Awareness of Modular Construction43.69[3.41, 3.96]84.7
7D8Lack of Relevant Technical Support73.62[3.11, 4.13]98.1
8D11Insufficient Government Support and Incentives73.53[3.21, 3.85]95.5
9D1Increased Initial Investment Requirement53.53[3.24, 3.82]78
10D14Economies of Scale33.48[3.09, 3.88]75.5
11D19Insufficient Supervision and Oversight63.42[2.91, 3.93]98.1
12D22Competitive Pricing Setting43.33[2.68, 3.97]98.3
13D18Insufficient Project Financing for Supporting MiC53.27[2.59, 3.95]97.9
14D10Deficiency in Standardization and Regulatory Frameworks43.18[2.52, 3.83]97.1
15D20Project Location Evaluation and Accessibility33.05[2.40, 3.70]90.8
Note: k = number of studies included in the meta-analysis; CI = confidence interval; I2 = heterogeneity statistic.
Disclaimer/Publisher’s Note: The statements, opinions and data contained in all publications are solely those of the individual author(s) and contributor(s) and not of MDPI and/or the editor(s). MDPI and/or the editor(s) disclaim responsibility for any injury to people or property resulting from any ideas, methods, instructions or products referred to in the content.