Article

Boundary Strategies Enhance Spatial Cognitive Efficiency in Indoor Navigation: A VR-Based Investigation

1
Zhejiang Key Laboratory of Intelligent Control of Transit Infrastructure Risk, Transportation and Municipal Engineering Institute, Power China Huadong Engineering Corporation Limited, Hangzhou 311122, China
2
State Key Laboratory of Subtropical Building and Urban Science, School of Architecture, South China University of Technology, Guangzhou 510641, China
*
Authors to whom correspondence should be addressed.
Buildings 2026, 16(5), 1001; https://doi.org/10.3390/buildings16051001
Submission received: 12 January 2026 / Revised: 12 February 2026 / Accepted: 27 February 2026 / Published: 4 March 2026
(This article belongs to the Special Issue BioCognitive Architectural Design)

Abstract

Effective indoor navigation remains a challenge in complex built environments such as hospitals and airports, where disorientation can lead to anxiety, inefficiency, and safety risks. While prior research has focused on outdoor wayfinding or single-metric performance assessments, few studies have examined spatial cognitive efficiency—a multidimensional metric defined as the standardized difference between spatial knowledge acquisition (P) and cognitive resource expenditure (R). In this study, P was derived from expert-rated sketch maps that captured participants’ environmental understanding, while R was indexed by navigation path length, which reflected their exploration effort. This study employed virtual reality to investigate how individual differences and environmental cues shape cognitive efficiency during indoor navigation. Thirty participants explored a high-fidelity virtual environment while behavioral, sketch-based, and questionnaire data were collected. Results revealed a non-significant linear correlation between P and R, consistent with cognitive efficiency as a distinct construct. High-efficiency participants relied more on boundary cues and exhibited “low-speed, short-distance” exploration patterns, whereas landmark-dependent strategies showed lower stability. These findings underscore the theoretical and practical value of cognitive efficiency as a multidimensional metric, offering evidence-based guidance for designing cognitively supportive indoor navigation systems.

1. Introduction

Human spatial cognition is well-documented, yet key questions remain regarding the cognitive mechanisms of spatial representation in daily environments—specifically, how spatial attributes and relationships are processed—and the individual differences in cognitive strategies that lead to varied performance across spatial tasks [1,2]. While most spatial cognition research has focused on large-scale outdoor settings, its findings may not directly apply to indoor environments due to structural differences. Indoor spaces are typically more constrained, characterized by narrow corridors, limited visibility, and dense layouts [3], which impose unique cognitive demands. In increasingly complex indoor settings such as hospitals, airports, and subterranean facilities, disorientation can trigger negative emotions (e.g., anxiety), cause time loss during wayfinding [4,5], and even pose safety risks [6]. Therefore, a systematic investigation of spatial navigation performance in these environments is crucial to advance our understanding of human–environment interactions and to develop interventions that mitigate spatial anxiety and improve wayfinding efficiency. In the long term, this research can also inform training protocols for emergency responders like firefighters [7] and guide the design of more effective indoor navigation systems [8].
Wayfinding represents a central domain in spatial cognition research, reflecting how individuals acquire, represent, and utilize spatial knowledge to navigate environments. Historically, research has focused on four interrelated themes: the representation of spatial knowledge [9], the selection of cognitive strategies [10], individual differences in wayfinding performance [6], and the formation of cognitive maps [11]. Recent advances in interdisciplinary approaches and navigation technologies have driven significant diversification in wayfinding research, especially in complex indoor environments, which has highlighted its growing practical relevance. Nevertheless, despite rapid growth in subfields such as indoor wayfinding [12], sign salience [13], eye-tracking [7], and virtual reality applications [14], the majority of studies continue to address two foundational questions: how spatial knowledge is acquired and how environmental features shape wayfinding behavior. Consequently, performance assessment often relies excessively on behavioral metrics, such as task duration, path length, or error rates, that reflect only whether a goal was achieved, not how it was accomplished. Critically, these approaches neglect the dynamic interplay between cognitive resource consumption and spatial knowledge acquisition—the very essence of cognitive efficiency.
Cognitive efficiency refers to the relationship between the extent of spatial knowledge acquired and the cognitive effort invested [15], often conceptualized as a trade-off between learning gains and mental workload. Efficient wayfinding thus supports the rapid acquisition of functional spatial representations while minimizing cognitive load, a capacity that is particularly important in time-critical scenarios such as building evacuations during emergencies [6]. Specifically, research on cognitive efficiency can inform interventions that accelerate spatial learning, mitigate excessive cognitive load in complex environments, and guide the design of spatial layouts that support efficient navigation. Given the focus bias in prior work, this study aims to establish a cognitive efficiency measurement framework for spatial knowledge assessment and use VR technology to investigate the mechanisms by which individual and environmental factors influence spatial cognitive efficiency in indoor settings.

1.1. Literature Review

Wayfinding in both indoor and outdoor environments serves the same fundamental purpose: enabling safe and efficient navigation from origin to destination. However, significant differences between the two environments make the understanding and acquisition of indoor spatial knowledge more challenging. The Landmark–Route–Survey (LRS) model traditionally conceptualizes spatial knowledge as comprising three hierarchical levels: landmark, route, and survey knowledge [16]. Individuals construct cognitive maps by exploring environments and integrating self-motion–derived spatial information [17]. Cognitive mapping is a dynamic process involving acquisition, encoding, storage, retrieval, and decoding of spatial features and relative positions, which ultimately shapes spatial behavior [18]. Although individuals may encode similar spatial information, there is little evidence that they do so in identical ways. Consequently, one of the challenges in cognitive map research is inferring the structure of an individual’s internal spatial representation from external behavioral or physiological data [19]. Based on the hierarchical differences in spatial knowledge, researchers employ distinct measurement approaches: landmark knowledge is assessed via recognition or recall tasks, while route/survey knowledge relies on global environmental metrics (e.g., judgments of relative distance and direction). However, Ruddle et al. (2006) noted that many current spatial cognition studies continue to rely on single metrics (e.g., completion time, path length, error rates) as proxies to evaluate cognitive performance [20]. While these metrics reflect the outcomes of task completion, they fail to capture heterogeneity in cognitive resource allocation [21]. For example, neuroimaging studies show that equivalent behavioral outcomes can be associated with markedly different patterns of neural activity and cerebral blood flow, reflecting divergent levels of cognitive effort [22]. Thus, an ideal measure of wayfinding efficiency should jointly account for navigational success and the cognitive effort required to achieve it [21]. In other words, the core feature of efficient wayfinding is the integration of “forming a complete spatial representation” with “saving time and reducing mental workload”. Given the unique challenges posed by indoor environments—such as spatial enclosure and complex cue configurations—and the pivotal role of cognitive efficiency in effective navigation, the present study focuses on identifying the individual and environmental factors that shape spatial cognitive efficiency in indoor settings.
The spatial cognition literature reveals considerable inconsistency in how cognitive efficiency is defined and measured in wayfinding tasks. In most studies, wayfinding efficiency is operationally defined using behavioral performance metrics, such as completion time and error rate [6,23]. While this approach effectively captures performance differences and aligns with practical demands, such as reaching a destination quickly and accurately, it fails to account for individual differences in cognitive resource allocation, particularly latent cognitive costs (e.g., mental effort) and variability in information processing strategies. Crucially, individuals exhibit distinct cognitive strategies during navigation: some optimize efficiency by deeply understanding the spatial structure of the environment, leading to low cognitive load and rapid transfer of spatial knowledge to new routes [24,25]; others rely on rote adherence to external guidance (e.g., signs, instructions), sustaining high cognitive load throughout the task [26]. Although these strategies can yield comparable task performance, they reflect fundamentally distinct cognitive efficiency profiles—an essential distinction for understanding individual differences in spatial ability. An alternative approach assesses efficiency by comparing observed paths to an optimal benchmark—typically the shortest Euclidean or topological path [27,28]. Although this method provides an objective benchmark and enhances comparability across conditions, it remains purely outcome-oriented—a limitation evident when near-optimal paths are achieved at the cost of high cognitive effort, such as through sustained attention and frequent path checking [10]. Collectively, current research suffers from a dissociation between task performance and cognitive performance. Existing evaluation frameworks prioritize task completion outcomes while largely ignoring the contribution of cognitive effort to spatial cognition. This dissociation compromises the validity of current cognitive efficiency measurement, as efficiency inherently requires balancing knowledge acquisition with cognitive effort minimization.
The allocation and utilization of cognitive resources are fundamentally shaped by adaptive spatial strategies—typically heuristic in nature—that individuals deploy to mitigate information overload in complex environments [18]. Given the limited capacity of working memory, these strategies serve as mechanisms of cognitive adaptation, optimizing resource allocation to thus enhance survival prospects in competitive contexts [29]. Spatial strategies refer to deliberate cognitive frameworks that enable individuals to: (1) locate their position within the spatial environment, (2) identify target locations, and (3) plan optimal routes to reach them [2]. This definition highlights two interdependent mechanisms. First, top-down cognitive mechanisms—such as biological factors (e.g., gender [27], age [30]) and higher-order traits (e.g., cognitive style [31])—account for individual differences in strategy selection. Second, bottom-up behavioral mechanisms reflect how spatial knowledge is constructed through observable, recurrent patterns of interaction with the environment, including route choices [28], visual sampling behaviors [7], and exploratory actions [32]. Collectively, these mechanisms underpin spatial planning and navigation—the dual cognitive tasks that are central to wayfinding [33]. Crucially, they operate as resource allocation heuristics that enable individuals to balance cognitive and behavioral demands during navigation [18]. Therefore, understanding how spatial strategies can be optimized provides a promising avenue for reducing cognitive load in complex environments and enhancing overall spatial cognitive efficiency.
While individual differences in spatial strategies are largely attributed to intrinsic factors [6], a growing body of evidence indicates that environmental factors—in particular the distinct characteristics of indoor and outdoor environments—exert substantially greater cognitive demands during spatial knowledge acquisition. Early spatial cognition research focused primarily on large-scale outdoor environments [16], with subsequent studies seeking to extend this paradigm to architectural (i.e., indoor) scales to investigate how spatial navigation differs in enclosed environments [34]. Consistent findings indicate greater difficulties in the formation of cognitive maps indoors than in outdoor environments [16], arising from fundamental differences in how individuals process spatial information across these contexts [35]. These differences manifest in two key dimensions. First, dimensional perception: Spatial representations of outdoor environments typically exhibit a 2D-centric bias in cognitive maps [36], with vertical dimensionality either reduced to visual attributes or overlooked (e.g., cities navigated using 2D maps). In contrast, indoor environments possess an inherent 3D spatial structure due to their high degree of enclosure [36], coupled with multi-level layouts (e.g., floors connected by stairs or elevators) that require individuals to mentally integrate vertical spatial relationships—a process that significantly increases cognitive load [37]. Second, availability of reference frames: Outdoor settings offer stable, large-scale landmarks (e.g., mountains, lakes) that function as robust reference frames for global spatial integration [38]. Indoor landmarks, by contrast, are typically small-scale features (e.g., decorative fountains, prominent artworks) with limited global reference utility. Additionally, when combined with restricted fields of view (e.g., corridor obstructions, wall or ceiling occlusions), this compels individuals to rely primarily on local landmark information for navigation [36]. Collectively, these environmental differences prompt adaptive adjustments in spatial cognitive strategies to accommodate variations in dimensionality and reference frames. Critically, the field has yet to reach a consensus on which specific environmental elements (e.g., vertical layering, landmark density, visual occlusion) trigger significant strategy adjustments—a knowledge gap that directly hinders the development of indoor navigation systems optimized for efficiency.

1.2. Research Framework

1.2.1. Theoretical Model

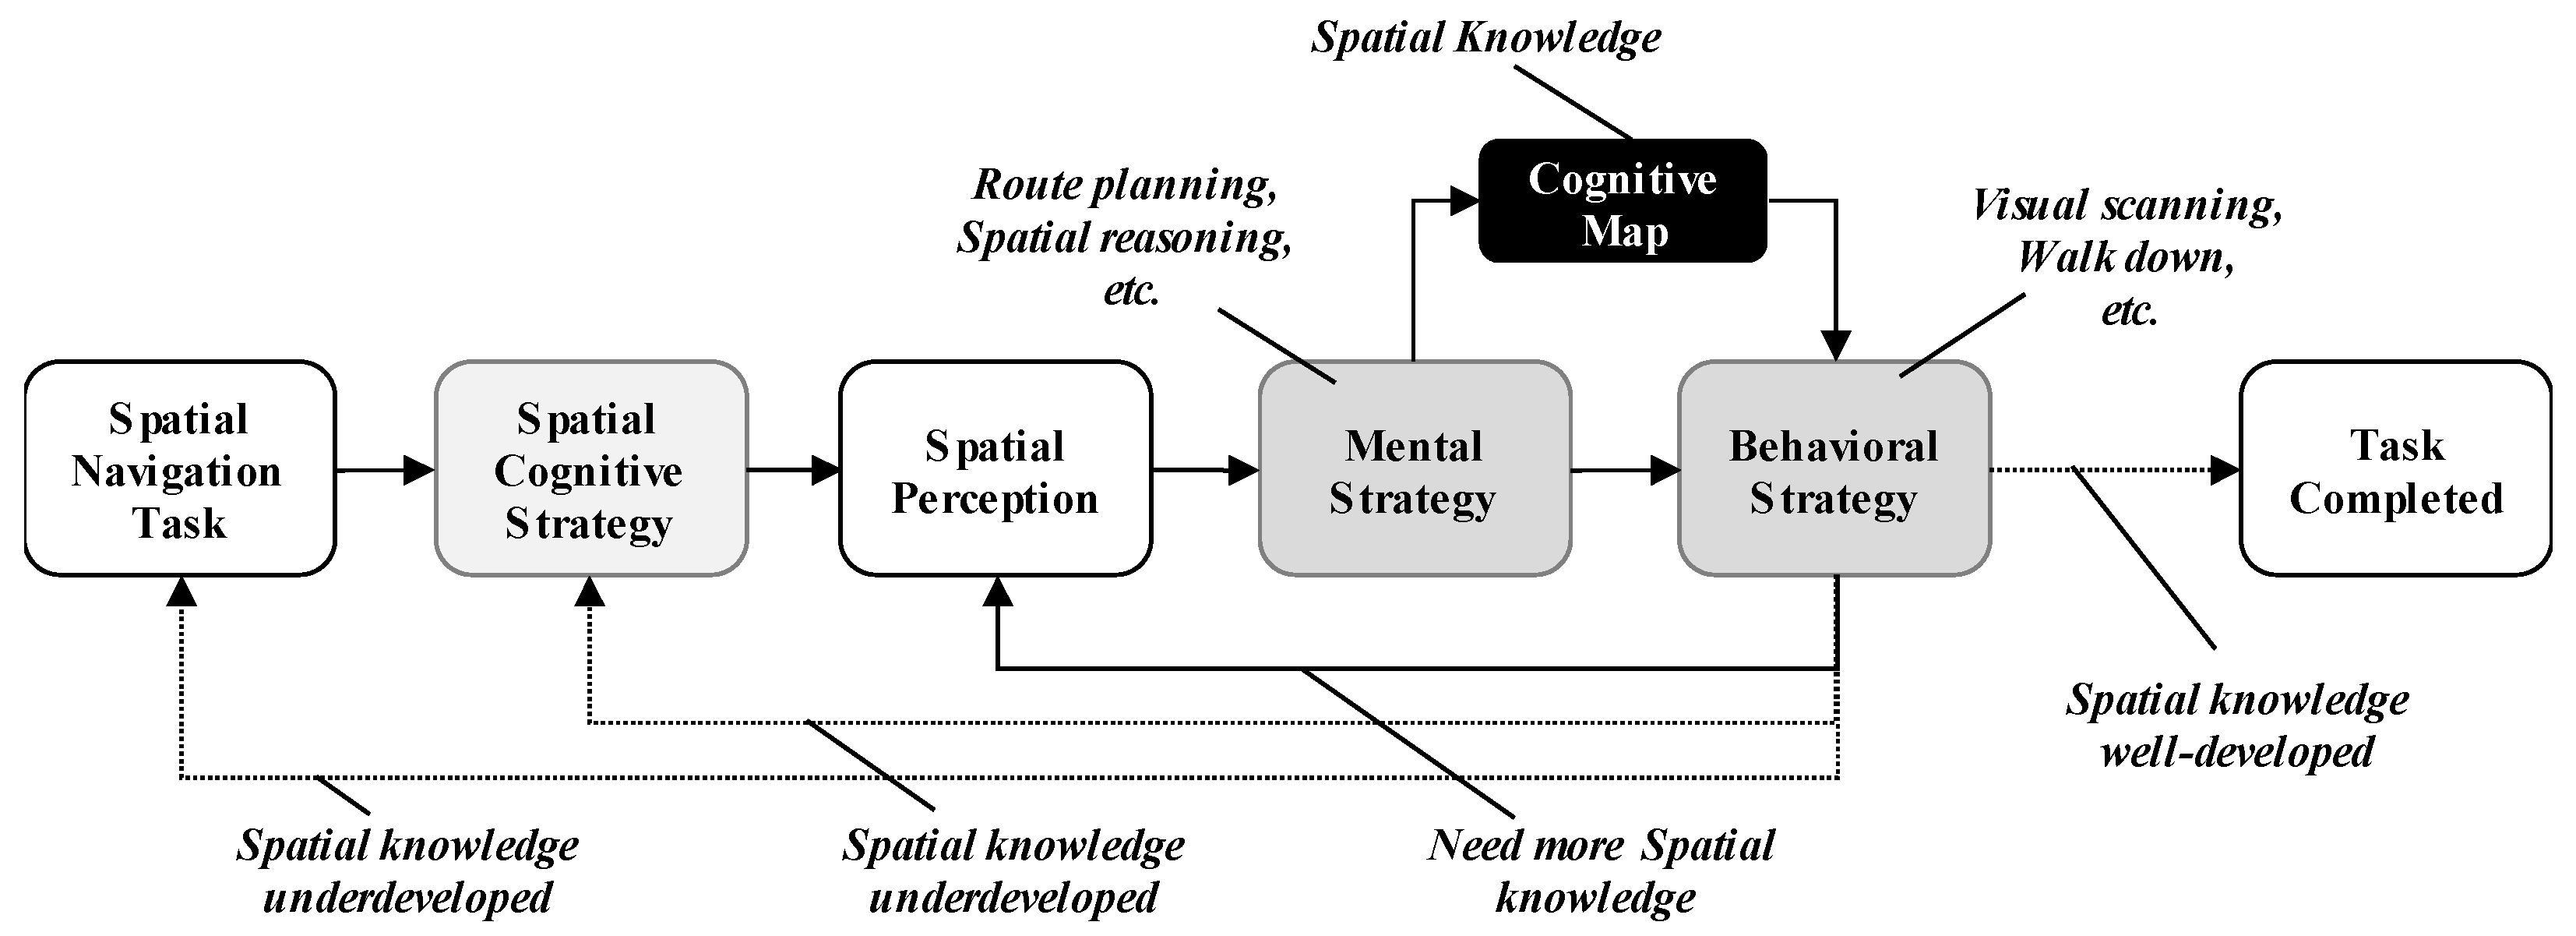
Previous research synthesizing findings on cognitive efficiency, cognitive strategies, and environmental differences between indoor and outdoor environments highlights a core research insight: indoor environmental factors modulate individual cognitive strategies, which subsequently impact cognitive efficiency. However, the field lacks an integrated framework to systematically measure and explain the mechanisms by which specific environmental features drive differential cognitive strategies and associated efficiency outcomes, underscoring the need for a theoretically grounded model to address this gap. To this end, the spatial navigation model developed by Jul & Furnas (1997) provides a solid and robust theoretical foundation [39,40]. The model posits that cognitive strategies emerge from goal-directed processing and manifest along two interdependent dimensions: mental strategies—reflecting internal cognitive assessments such as route planning and spatial reasoning—and behavioral strategies—expressed through observable spatial behaviors such as navigation trajectories and visual scanning patterns (Figure 1). Critically, cognitive maps serve as quantifiable proxies for these two strategy types [40], facilitating empirical evaluation of their dynamic interplay. The model’s key strength lies in its ability to illuminate the reciprocal interaction between strategy selection and cognitive map construction in complex spatial environments, offering a direct theoretical framework for exploring the triadic relationship between environmental characteristics, cognitive strategies, and spatial knowledge development—which constitutes the central focus of this study.

1.2.2. Research Roadmap

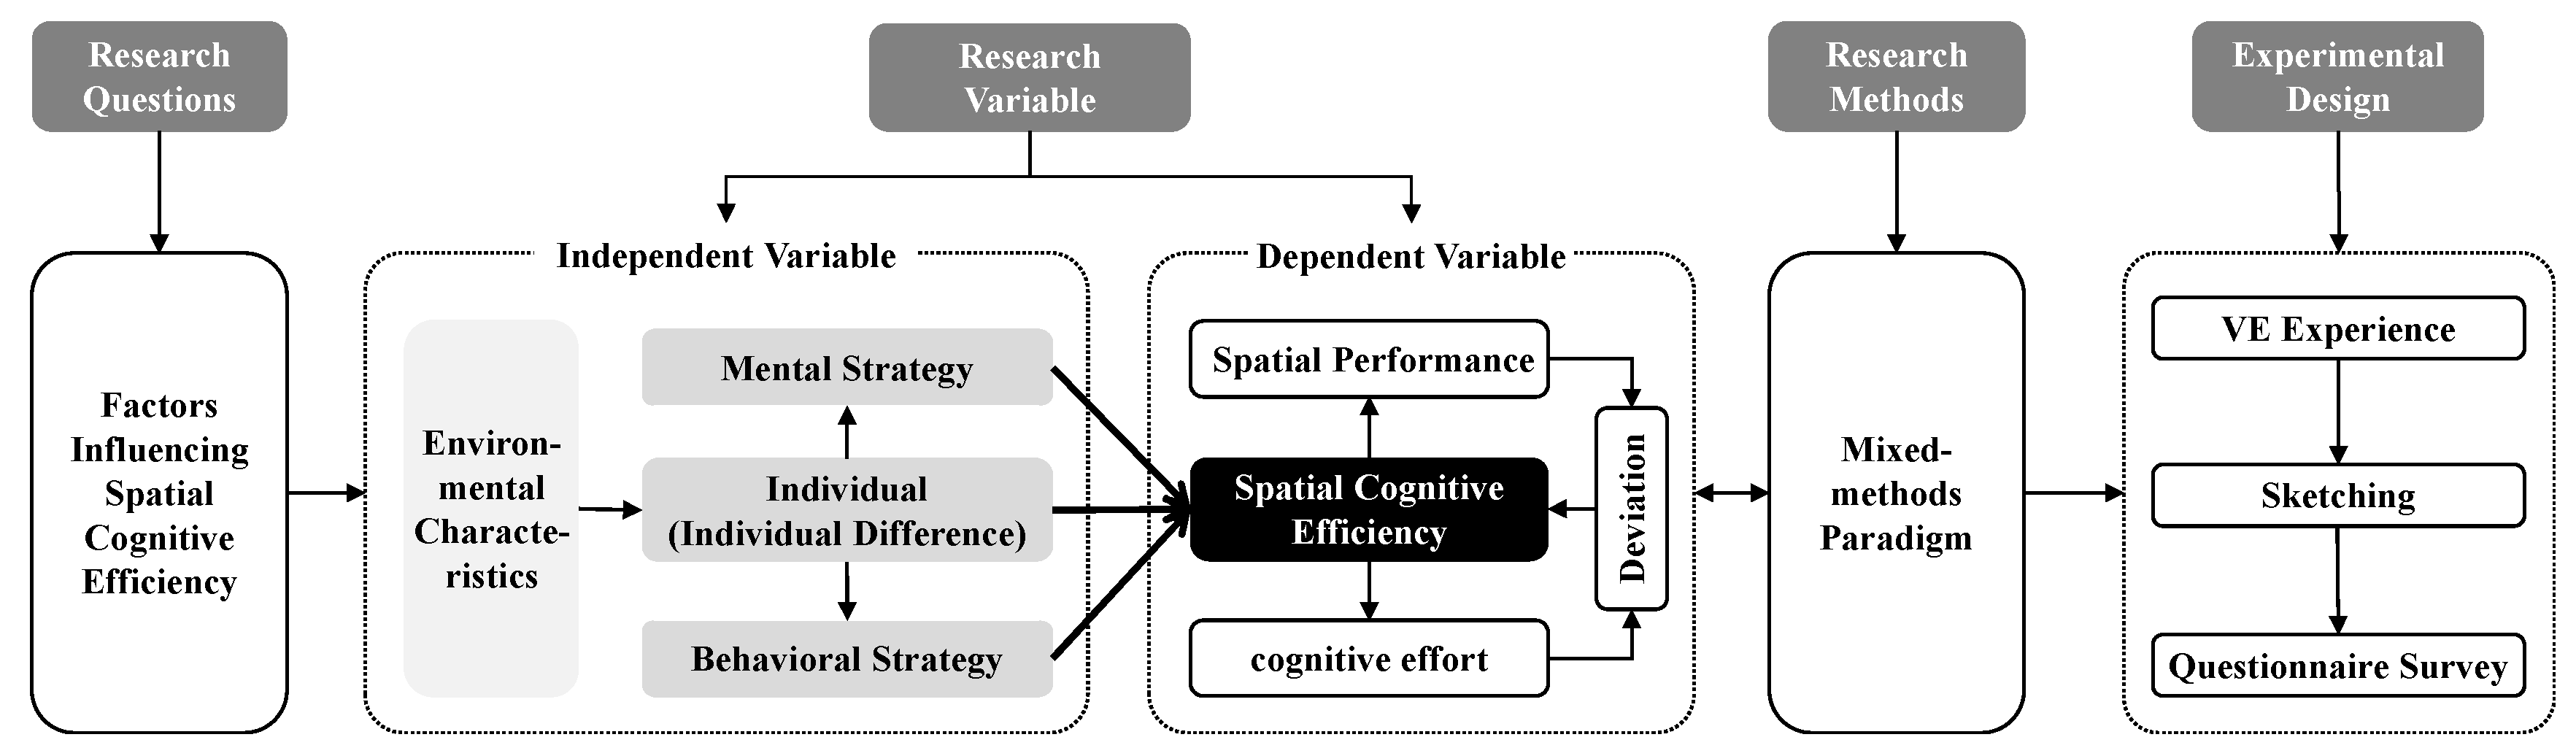
Based on the above analysis, this study proposes a conceptual framework (Figure 2) in which cognitive efficiency—operationally defined by the “deviation model” as a function of spatial performance and cognitive effort (see Section 1.2.3)—serves as the dependent variable. Cognitive strategies (mental and behavioral), environmental characteristics (e.g., landmark density, spatial enclosure), and individual differences (e.g., gender, age) constitute the independent variables. This framework outlines a pathway through which environmental features, cognitive strategies (shaped by environmental context), and individual differences may collectively influence cognitive efficiency. To test this framework, a high-fidelity virtual indoor environment was developed using Unreal Engine, in which key spatial attributes were systematically manipulated. An experiment was conducted to elucidate spatial learning processes. Data were collected through sketch map analysis to quantify spatial knowledge accuracy (a core component of spatial performance) and standardized questionnaires to gauge individual strategy preferences and demographic characteristics. These mixed-methods data collection strategies enable a comprehensive examination of the interplay among environmental features, cognitive strategies, individual differences, and cognitive efficiency.

1.2.3. Operationalization of Variables

(1)
Dependent Variable
The dependent variable in this study is individuals’ spatial cognitive efficiency. Building on Paas’s (1993) cognitive efficiency theory [41], spatial cognitive efficiency (Esce) is defined as the standardized difference between spatial performance (P) and cognitive effort (R). As a conceptual model of cost-effectiveness analysis [41], the mathematical formula for Esce, referred to as the deviation model, is presented in Equation (1):
E s c e = ( z P z R ) / 2 ,
where Esce denotes spatial cognitive efficiency, zP and zR represent the z-standardized scores (or values) of spatial performance (P) and cognitive effort (R), respectively. The denominator 2 standardizes the difference under the assumption that zP and zR are independent standard normal variables, yielding a unitless effect size interpretable in standard deviation units. Positive values indicate that performance gains outweigh resource costs; whereas negative values indicate the opposite. This metric has been successfully applied across domains—including cognitive instruction [41], design cognition [42], and geospatial reasoning [43]—which supports its validity and utility as a cross-contextual index of cost–benefit trade-offs in complex tasks.
(2)
Independent Variable
This study treats individuals’ cognitive strategies as the primary independent variable, operationalized along two dimensions—mental strategies (STR1) and behavioral strategies (STR2)—consistent with prior taxonomies [18]. Mental strategies are further classified into holistic and analytical approaches [10]. Holistic strategies represent an environmental information processing mechanism centered on spatial relationships, which maintains five categories of survey-based spatial knowledge [44,45]—i.e., orientation, environmental boundaries, overall shape, spatial scale, and spatial discrepancies—within a unified mental representation. In contrast, analytic strategies represent and manipulate spatial information by reducing it to an essentially non-spatial, listlike format [10], primarily encompassing two types of knowledge: landmark knowledge and route knowledge (e.g., simplifying navigation paths by linking salient landmarks in sequence).
To quantify mental strategies, we derive two complementary indices. First, participants’ mental representation strength across the seven spatial knowledge components (five survey-related and two route-related) is assessed as the primary indicator of an individual’s tendency toward holistic versus analytical processing (STR1a). Second, given the limited capacity of cognitive resources, individuals selectively attend to environmental features based on perceived relevance. We therefore measure their subjective importance ratings of fundamental indoor elements (e.g., walls, floor patterns, ceiling height)—factors shown to influence attentional allocation during navigation—as a secondary indicator reflecting strategic prioritization (STR1b).
Behavioral strategies (STR2) encompass two components: (1) visual strategies, indexed by head movement patterns [20] and gaze behaviors [46], and (2) motor strategies, reflected in bodily actions such as reorientations, pauses, and path adjustments [20]. In this study, visual strategies are operationalized using head rotation parameter measurements (e.g., total head rotation count during navigation), while motor strategies are quantified through motion trajectory analysis (e.g., total traversed path length).
Finally, to account for potential confounding influences, we include key individual difference variables—such as gender, age, academic major, and sense of direction (self-reported)—as covariates in our analyses.

1.2.4. Hypotheses

The present study aims to validate cognitive efficiency as a multidimensional assessment metric for spatial task performance and to investigate how individual and environmental factors influence spatial cognitive efficiency in indoor environments. Based on these objectives, we propose the following hypotheses:
H1. 
Spatial knowledge acquisition (P) and cognitive effort (R) exhibit relative independence (i.e., no strong linear association). This would demonstrate that cognitive efficiency is a multidimensional construct not fully captured by unidimensional performance metrics (e.g., task duration or error count).
H2. 
Cognitive efficiency differs by specific types of mental strategies. This would imply that intrinsic cognitive processing modes—particularly those that effectively leverage environmental cues—are key contributors to efficient spatial learning.
H3. 
Cognitive efficiency is associated with specific behavioral strategies, indicating that observable navigation behaviors serve as proxies for underlying cognitive efficiency.
Additionally, given prior evidence suggesting that individual differences variables—such as gender, age, academic major and self-reported sense of direction (SOD)—may be related to spatial cognitive performance, this study will exploratorily examine their associations with cognitive efficiency while controlling for these factors, aiming to identify potential patterns of moderation or covariation.

2. Materials and Methods

2.1. Participants

Thirty-seven undergraduate volunteers were recruited from the Wushan Campus (Wushan Xiaoqu) of South China University of Technology (SCUT). Five participants took part in a pilot study to refine the experimental procedures, and the remaining 32 participated in the main experiment. Two participants were excluded due to motion sickness symptoms (e.g., dizziness), resulting in a final sample of 30 participants (19 male, 11 female; majority (80%) aged 20–25 years; 13 majoring in architecture or design-related disciplines). The narrow age range and diversity in disciplinary background helped to ensure participants possessed the baseline capacity to process visual and spatial information in the high-fidelity virtual environment, while also enabling a preliminary exploration of how academic training might influence spatial learning strategies. All participants reported normal or corrected-to-normal vision and hearing. Prior to participation, all provided written informed consent, which detailed the study purpose, procedures, potential risks, data confidentiality, and the right to withdraw without penalty. Although the School of Architecture did not have a formal institutional ethics review board at the time of the study, the research was conducted in accordance with recognized ethical guidelines. Participants received a fixed monetary compensation upon completion.

2.2. Virtual Environment

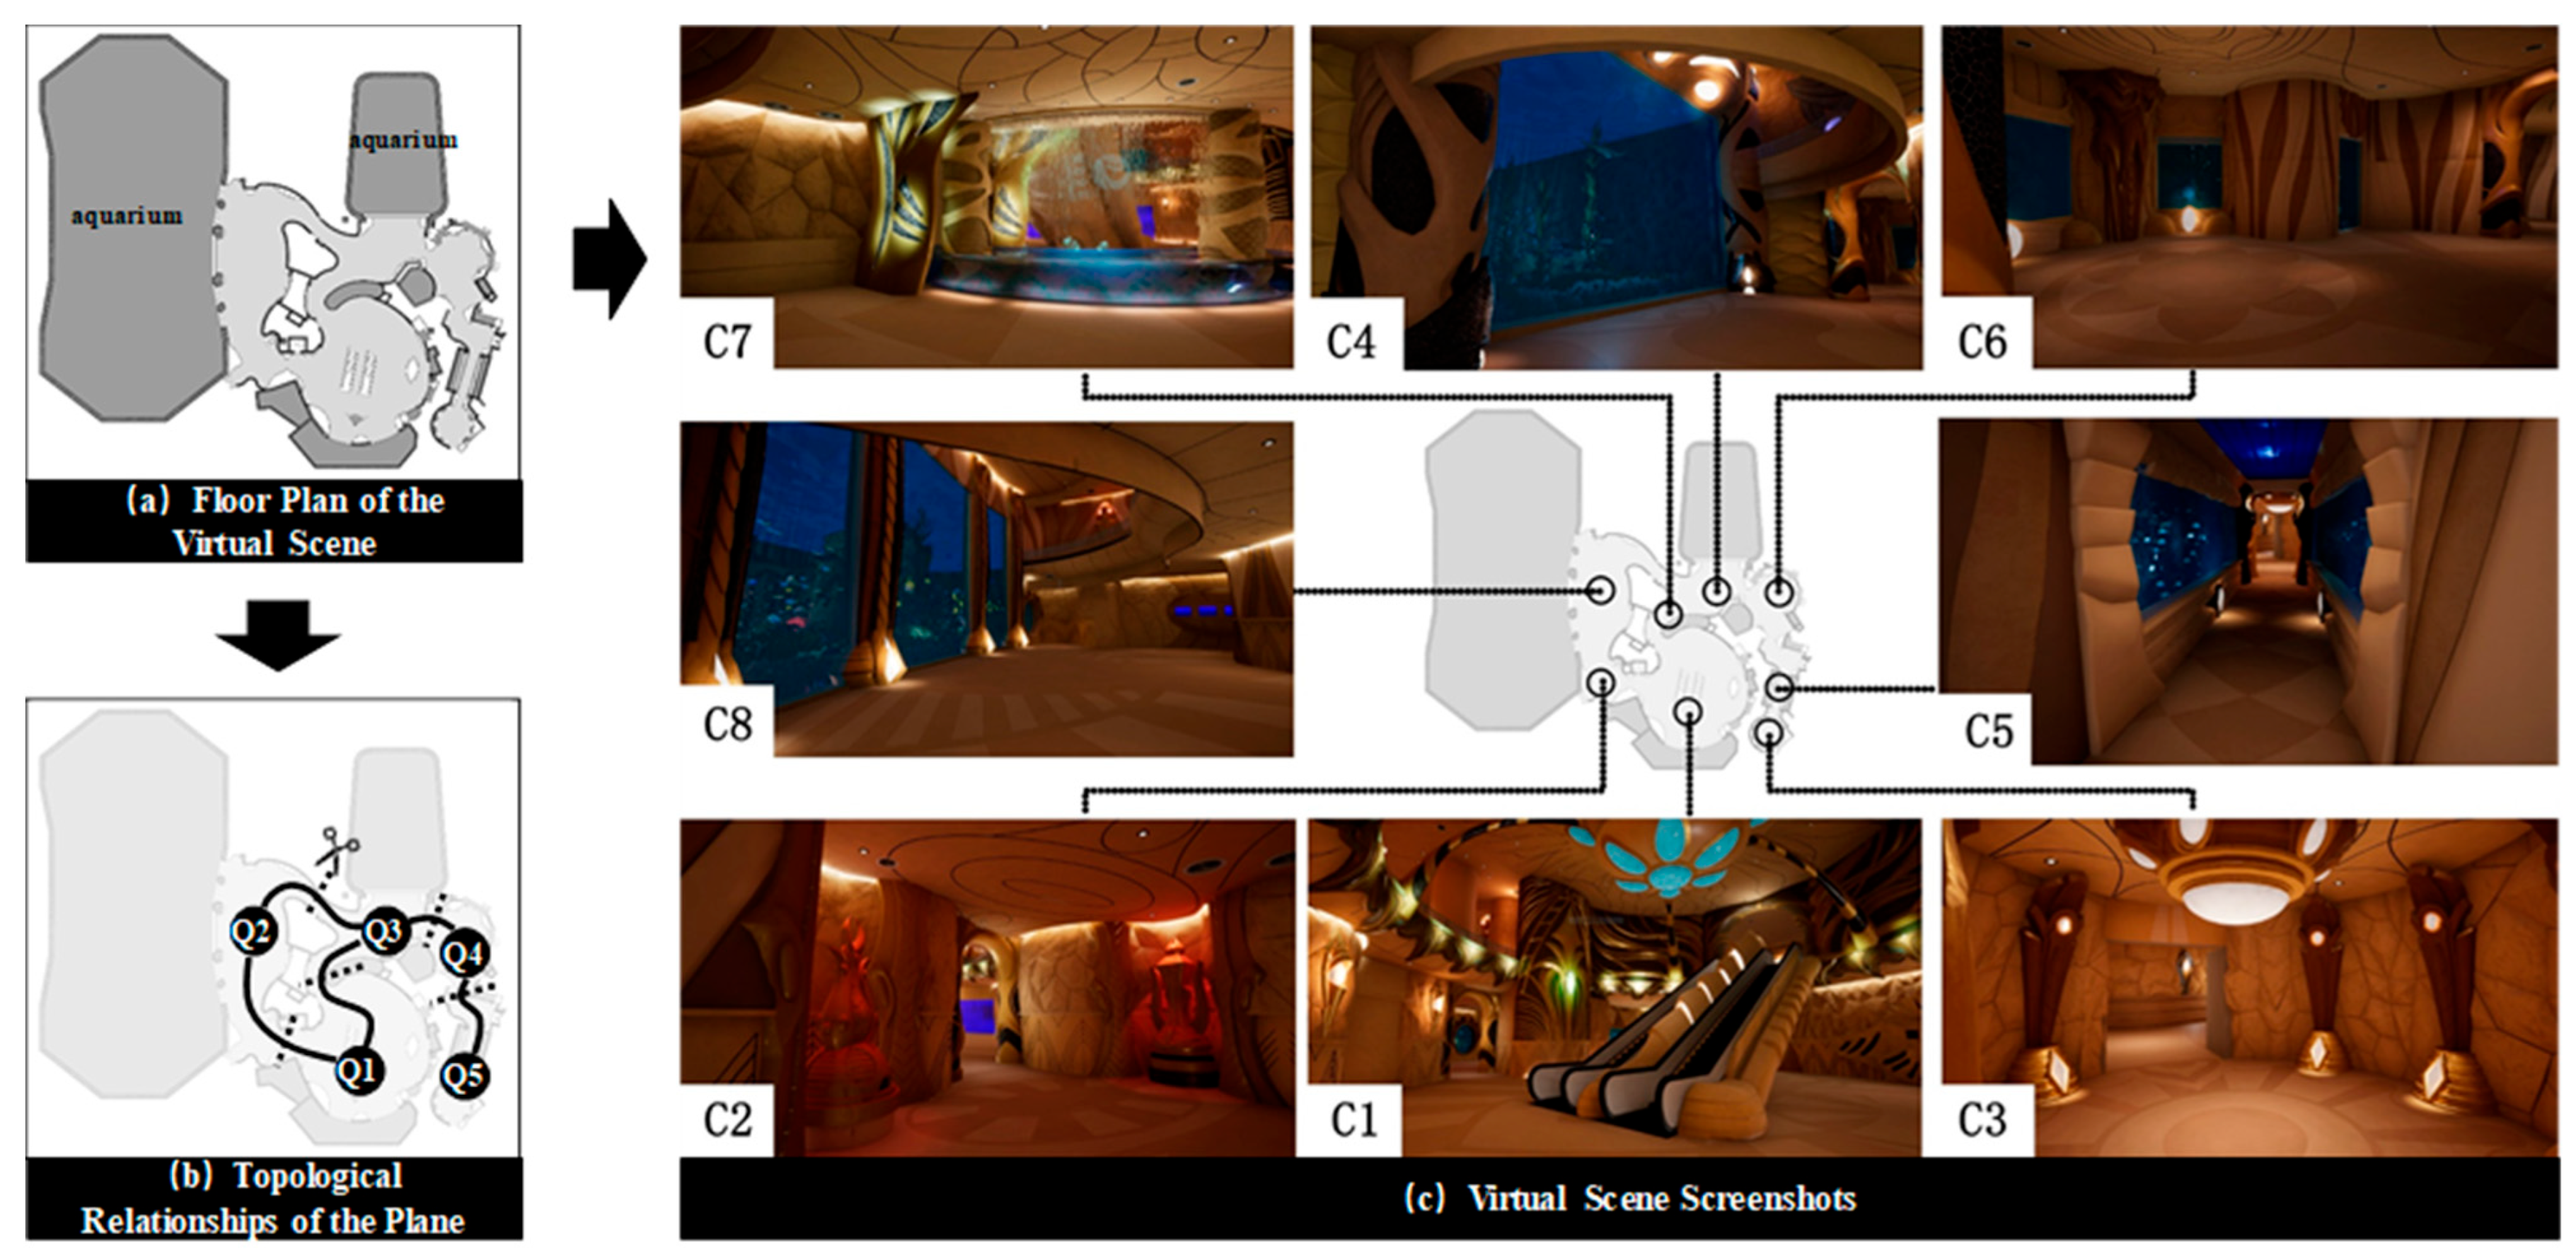
The virtual environment was constructed using a custom simulation platform developed by the Digital Laboratory of the School of Architecture, SCUT, based on the Unreal Engine (UE v4.27). This two-level virtual structure featured a themed underwater Atlantis environment with navigation restricted to the ground level. The navigable space was functionally segmented into five zones: Entrance Hall (Q1), Grand Aquatic Zone (Q2), Medium Aquatic Zone (Q3), Compact Aquatic Zone (Q4), and Exit Hall (Q5) (Figure 3a). These zones formed a primary path (Q1 → Q2 → Q3 → Q4 → Q5) with two shortcut connections (Q2 ↔ Q3, Q3 ↔ Q4), as illustrated in the topological map (Figure 3b). To enhance immersion, the environment included interactive water effects (e.g., dynamic water curtains), virtual aquariums, and suspended luminous elements (Figure 3c).
The selection of a high-fidelity virtual environment with a unified “underwater Atlantis” theme was based on two key considerations. First, to enhance ecological validity, the environment required sufficient visual richness and complexity to simulate real-world indoor navigation challenges (e.g., in large malls or exhibition halls), rather than an overly simplistic setting (e.g., plain white corridors) that might fail to elicit participants’ spatial cognitive strategies effectively. Second, to ensure rigorous experimental control, all visual elements (e.g., aquariums, sculptures, luminous installations) were embedded within a coherent thematic narrative. This approach helped standardize sensory input across participants and minimize confounding effects from individual differences in prior knowledge about real-world objects (e.g., artworks or signage). Thus, the design aimed to balance realism with precise experimental control.

2.3. Experimental Procedure

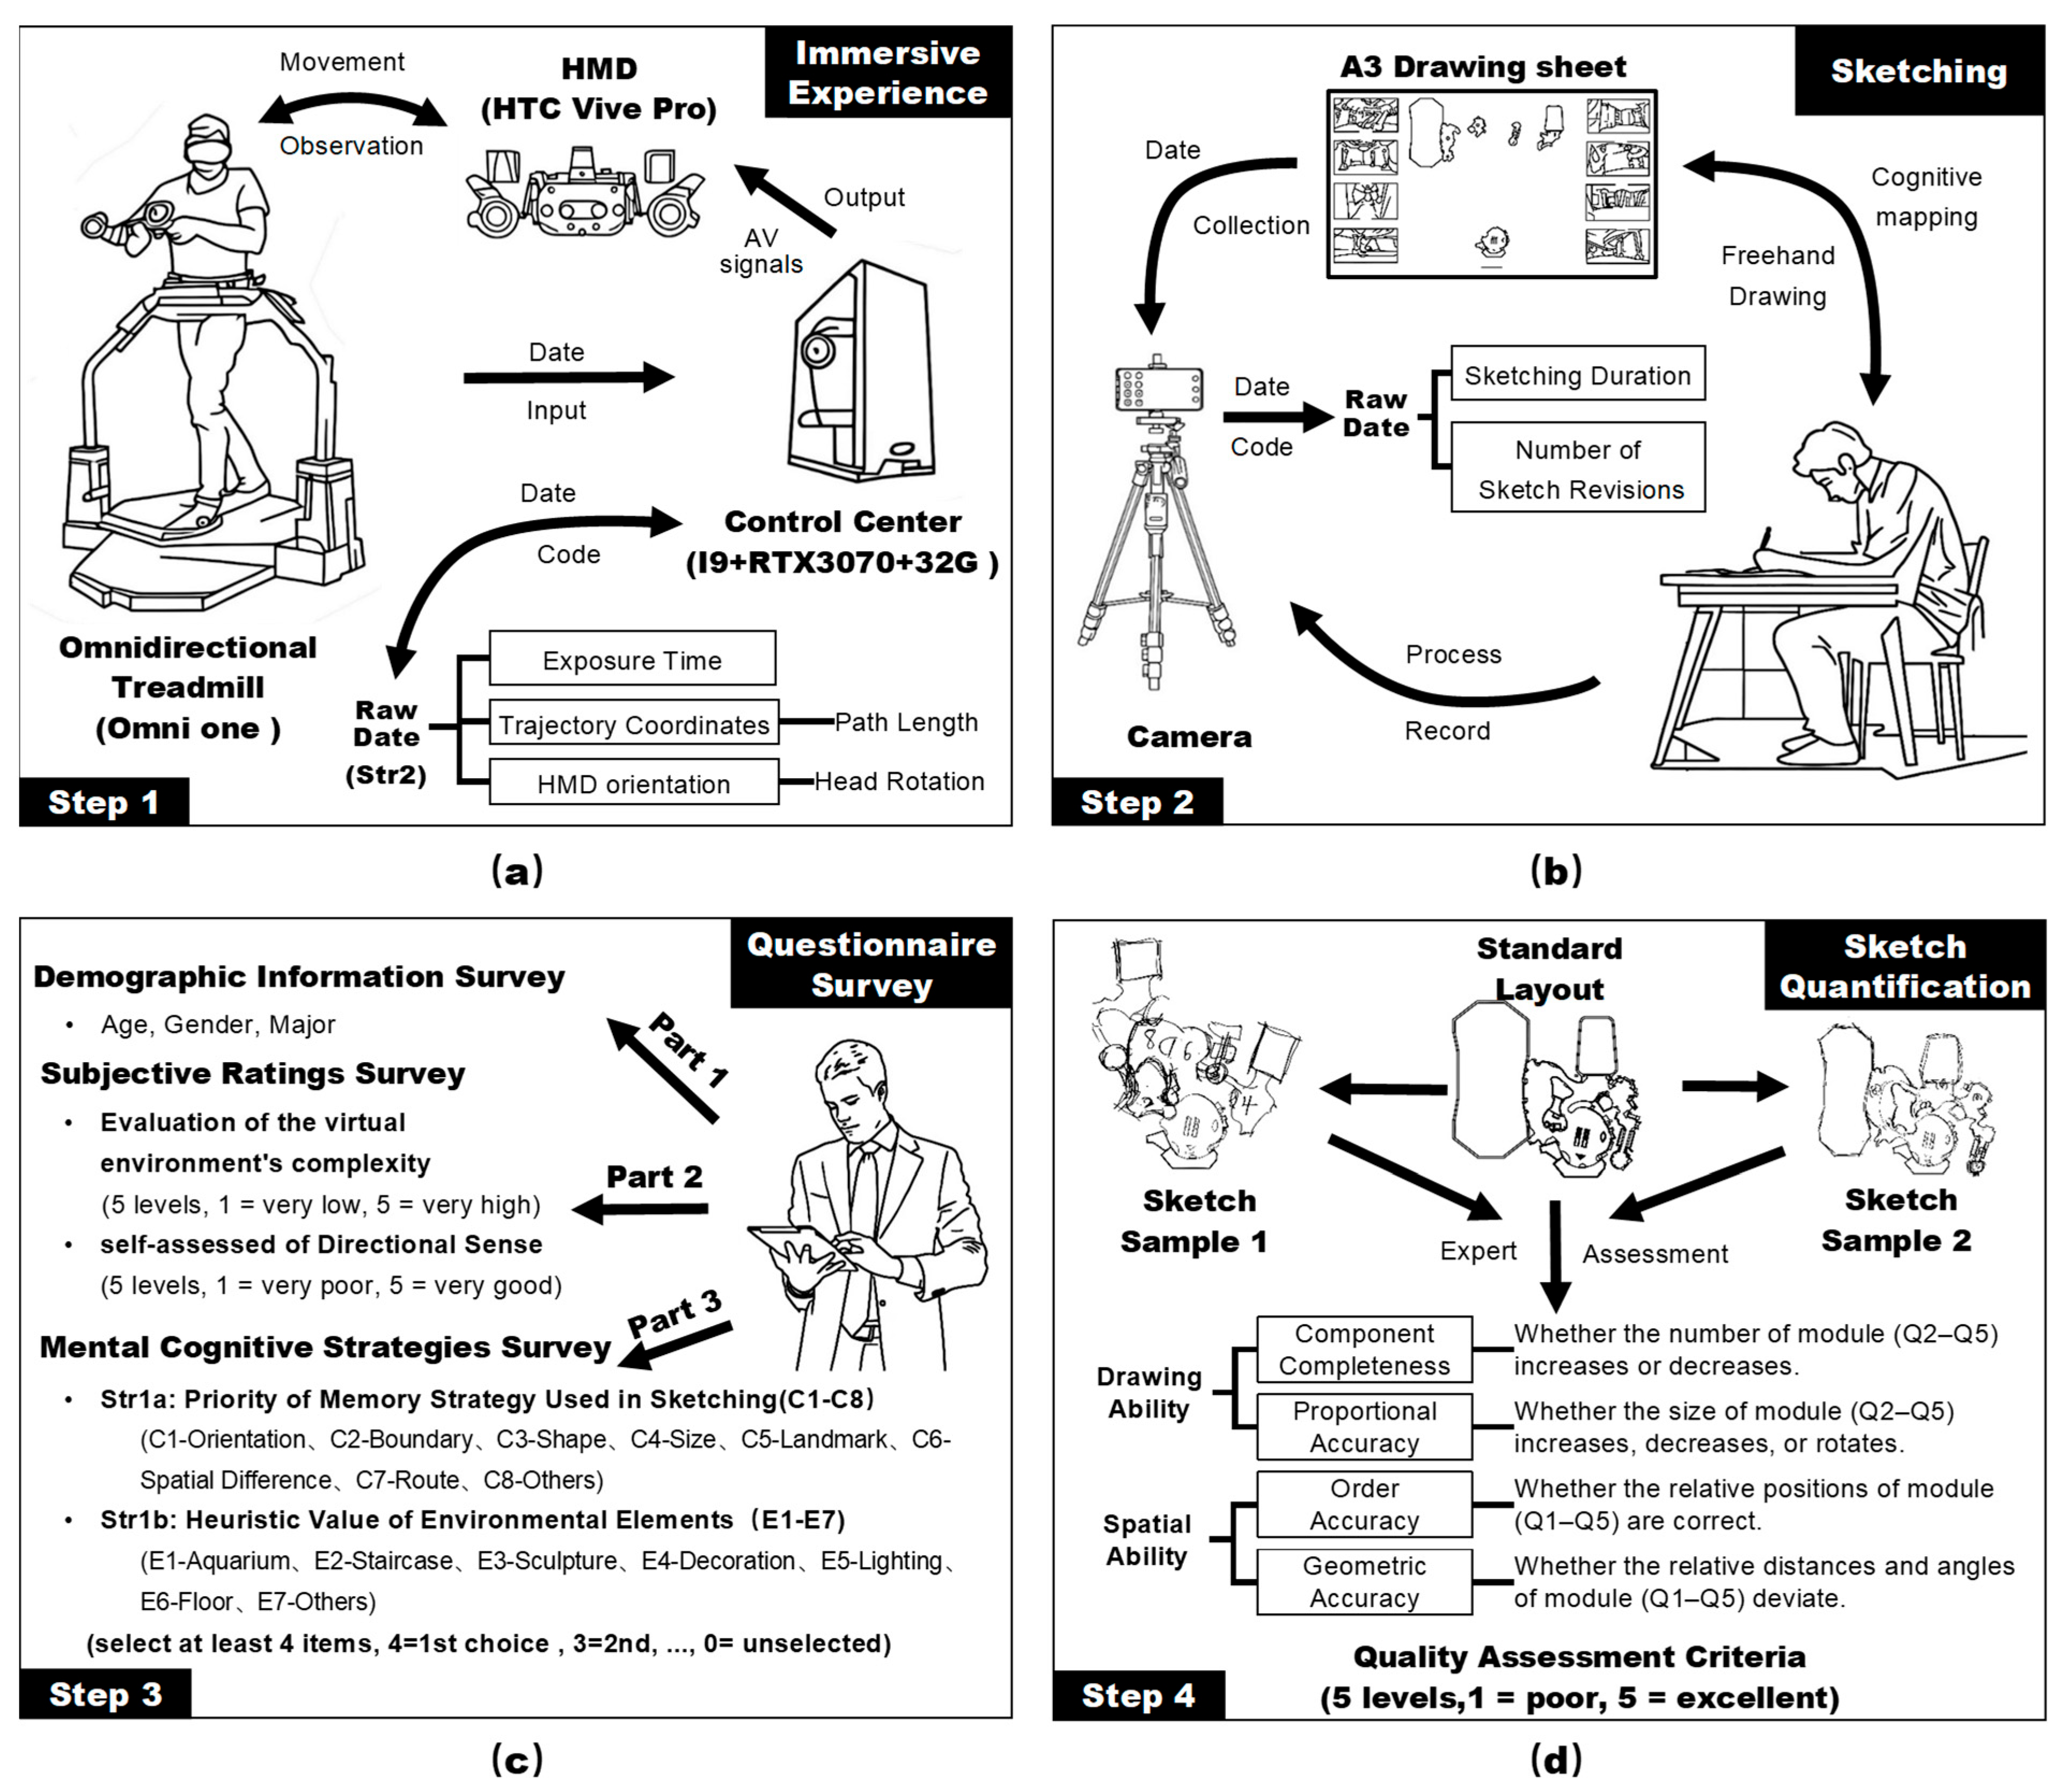
Participants were first equipped with treadmill-specific footwear, the HTC Vive Pro head-mounted display (HMD) manufactured by HTC Corporation (Taoyuan City, Taiwan, China), and body-tracking sensors, and all devices were calibrated for proper fit and tracking accuracy. A 5-min training session was then conducted to familiarize participants with equipment operation and the transitions between task phases. After confirming that participants experienced no physical discomfort, they proceeded to the formal experimental phase, which consisted of three sequential tasks (Figure 4a–c).

2.3.1. Immersive Experience

An immersive virtual reality (VR) system was used for navigation, comprising an HTC Vive Pro HMD (2160 × 1200 pixels per eye, 90 Hz refresh rate) that provided a first-person perspective to support spatial cognition assessment. Navigation was achieved via the Virtuix Omni treadmill (Virtuix Inc., Austin, TX, USA), which mapped physical walking and turning movements to virtual locomotion.
The virtual environment was rendered in real time using Unreal Engine (v4.27). To ensure a smooth and comfortable experience, the system maintained a stable frame rate of 120 FPS throughout the experiment, synchronized with the HMD’s refresh rate. The scene had an average polygon count of approximately 500,000 and employed Physically Based Rendering (PBR) materials with 4K-resolution texture maps. Lighting combined static baked illumination (via Lightmass) and dynamic light sources to achieve realistic shading, depth perception, and visual consistency. Collectively, these technical specifications collectively ensured high visual fidelity and interactive stability during exploration.
All participants began the formal experimental phase by freely navigating the virtual environment in a self-paced manner, without predefined time limits, until they verbally confirmed the completeness of their cognitive map (i.e., self-reported full familiarity with the environment’s layout). Exploration always started from the central point of the Entrance Hall (Q1). Spatial, navigational, and behavioral data—including exposure duration, real-time movement trajectory coordinates, and head orientation—were automatically recorded at 0.2-s intervals, as illustrated in Figure 4a.

2.3.2. Sketching

Following the immersive exploration, participants immediately completed a cognitive mapping task to assess their acquired spatial knowledge by drawing a sketch of the virtual environment with the aid of provided visual cues. They were given an A3-sized worksheet divided into two sections: a cue panel and a drawing area. The cue panel included two types of stimuli: (1) five die-cut modules representing the functional zones (Q1–Q5), randomly arranged. These modules served a dual purpose: to assess participants’ understanding of the macro-level topological structure (i.e., inter-zone connectivity) and to minimize confounding effects from individual differences in drawing proficiency by providing standardized shape outlines. (2) Eight numbered screenshots (C1–C8), each corresponding to a specific landmark location within the environment (e.g., an aquarium, a sculpture), with their respective numbers also marked directly on the corresponding Q1–Q5 modules. These screenshots acted as visual cues to support recall of specific environmental features and landmark details within each zone.
Participants were instructed to use Q1 as a fixed reference point, place the remaining four modules onto the drawing area according to their perceived spatial relationships, and then complete the sketch using freehand drawing to connect the modules and add missing details. They completed this task at their own pace without any time constraints. The entire sketching process was continuously video-recorded to enable quantitative analysis of behavioral metrics, such as total task duration and the number of module repositioning events, as shown in Figure 4b.

2.3.3. Questionnaire

After completing the cognitive mapping task, participants filled out a standardized self-report questionnaire at their own pace without time constraints. This questionnaire consisted of three main sections, as detailed below.
Demographic Information
This section collected basic participant information through open-ended questions. Participants were asked to report their gender, age, and academic major. These variables serve as common individual difference measures for subsequent exploratory analysis related to the study’s hypotheses.
Subjective Ratings
This section assessed participants’ subjective perceptions using two items on 5-point Likert scales. The first item measured the perceived complexity of the experimental virtual environment (“How would you rate the complexity of the virtual scene in the experiment you just completed?”), with anchors ranging from 1 (very low) to 5 (very high). The second item measured self-assessed sense of direction (“How would you rate your own sense of direction?”), with anchors ranging from 1 (very poor) to 5 (very good). These ratings provide insights into individual differences in perceived cognitive load and navigational self-concept.
Mental Cognitive Strategies Assessment
This section evaluated the strategies participants employed during the cognitive mapping task through two ranking questions. The first question (STR1a) addressed the priority of memory strategies used in sketching: “Which of the following methods do you consider the most helpful for you to complete the sketch drawing task?” Participants were asked to rank at least four items from a list of eight strategies (C1—Orientation, C2—Boundary, C3—Shape, C4—Size, C5—Landmark, C6—Spatial Difference, C7—Route, C8—Others). Rankings were assigned values as follows: 4 points for the first choice, 3 for the second, 2 for the third, 1 for the fourth, and 0 for unselected items. This question aimed to capture the tendency toward holistic versus analytic processing.
The second question (STR1b) assessed the heuristic value of specific environmental elements: “Which of the environmental elements in the scene do you consider the most inspirational for you to complete the sketch drawing task?” Participants ranked at least four items from a list of seven elements (E1—Aquarium, E2—Staircase, E3—Sculpture, E4—Decoration, E5—Lighting, E6—Floor, E7—Others) using the same scoring scheme (4 = 1st, 3 = 2nd, 2 = 3rd, 1 = 4th, 0 = unselected). This item measured the heuristic prioritization of environmental cues during cognitive map formation. Together, these two strategy assessments serve as independent variables for testing Hypothesis 2.

2.4. Data Processing

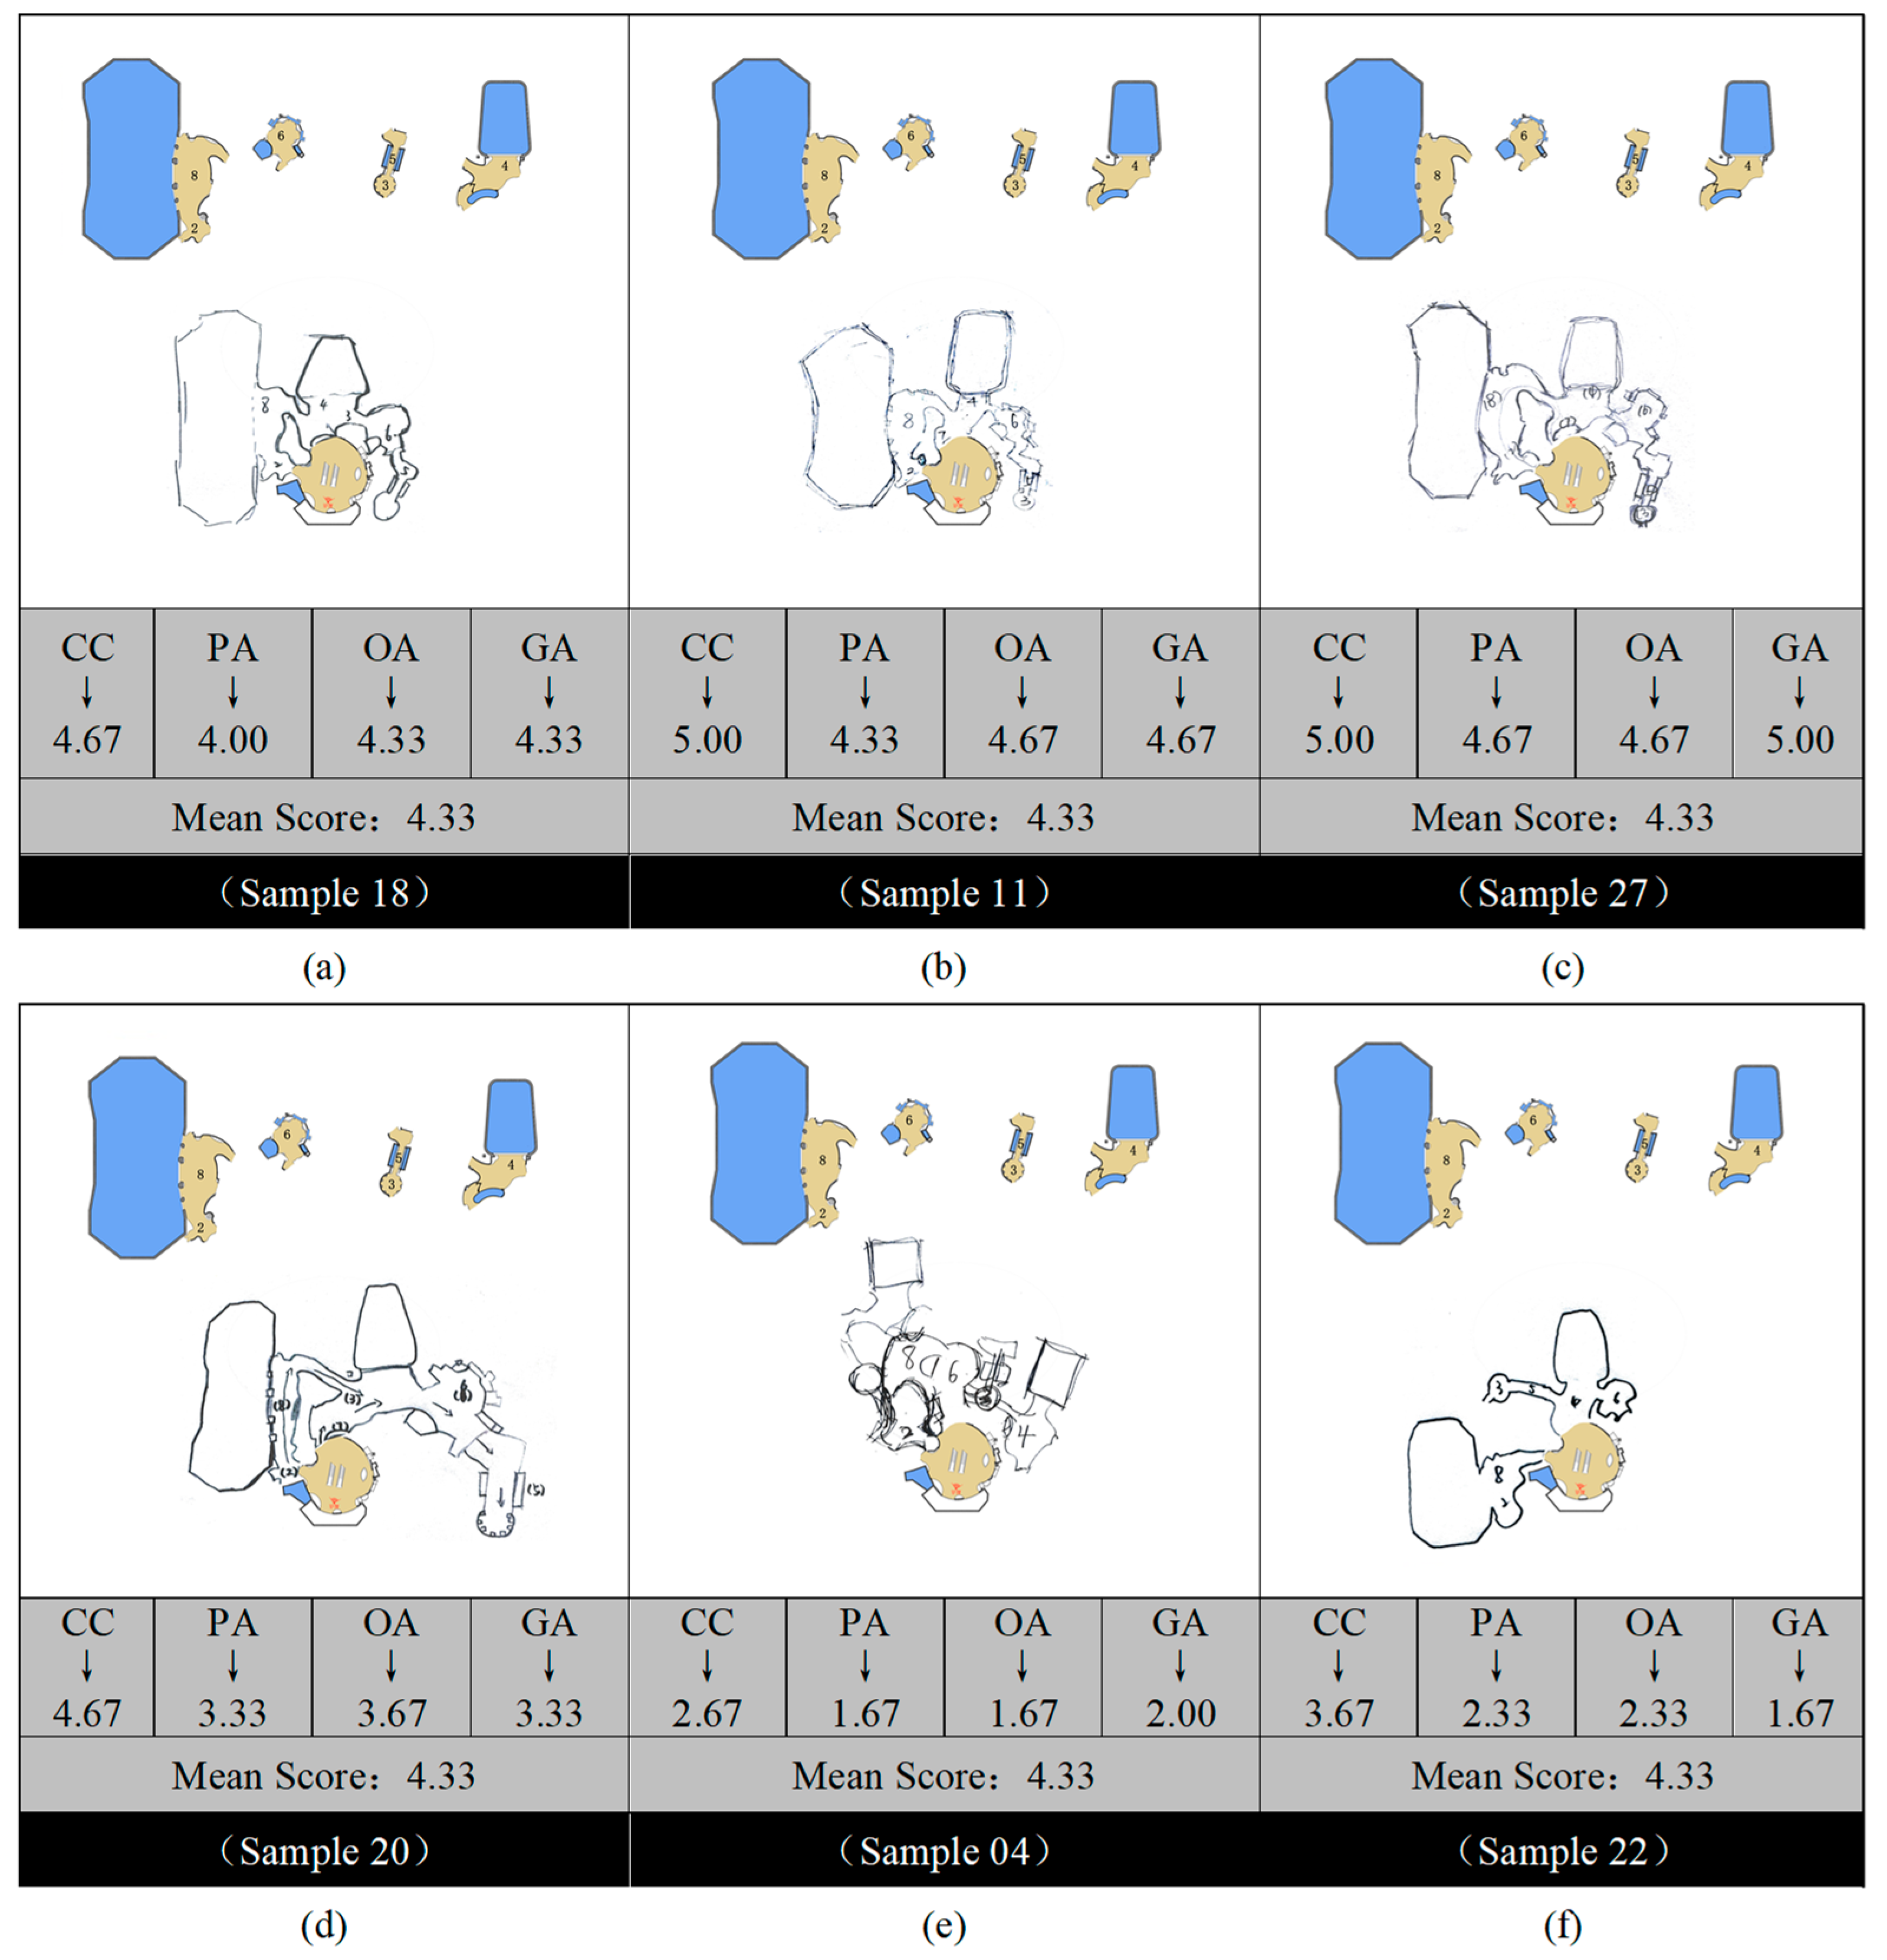
The experimental data collection framework and corresponding coding protocols are systematically outlined in Figure 4. Head rotations were operationally defined as instances where the angle between the gaze direction and locomotion direction exceeded 15° at any point along the trajectory. Notably, hand-drawn cognitive maps—serving as abstract representations of spatial knowledge—lack the inherent numerical attributes required for direct quantitative analysis. To facilitate computational evaluation, three faculty members from the School of Architecture independently assessed the 30 sketches using a 5-point Likert scale across four validated dimensions: (1) Component Completeness (CC), (2) Proportional Accuracy (PA), (3) Order Accuracy (OA), and (4) Geometric Accuracy (GA). Detailed scoring criteria for each dimension are provided in Figure 4d. For each participant, a composite sketch quality score was derived by calculating the mean rating across all four dimensions. Specifically, CC and PA were employed to evaluate drawing execution proficiency (e.g., detail reproduction and proportional control), which are established determinants of sketch quality variation [47,48]. In contrast, OA and GA targeted higher-order spatial cognitive abilities, such as topological reasoning and working memory. Representative sketches with annotated ratings are presented in Figure 5 to illustrate the application of these scoring criteria.
Given the context-dependent variability in spatial knowledge increment (P) and cognitive resource consumption (R) metrics, indicator selection must align with experimental design to ensure valid measurement of the research hypotheses. Here, cognitive map drawing quality—a validated metric for spatial representation accuracy [48]—was adopted as the optimal P indicator. For R, exposure time—a commonly used metric [20]—was excluded due to confounding by equipment proficiency (unreliable data). Head movement frequency was further rejected as it strongly correlated with exposure time, thus precluding independent assessment of cognitive effort. Consequently, path length was selected as the R indicator due to two key advantages: (1) consistent path length ensures comparable spatial exposure (i.e., identical environmental coverage), whereas task duration permits regional under-exploration due to variable movement speeds (e.g., slow traversal within a single zone without progressing to new areas, reducing overall spatial exposure); (2) Path length captures self-regulated spatial refinement via targeted re-traversal (e.g., “walking an additional lap” to confirm environmental familiarity vs. “spending extra time”), a mechanism unattainable via prolonged exposure time alone.
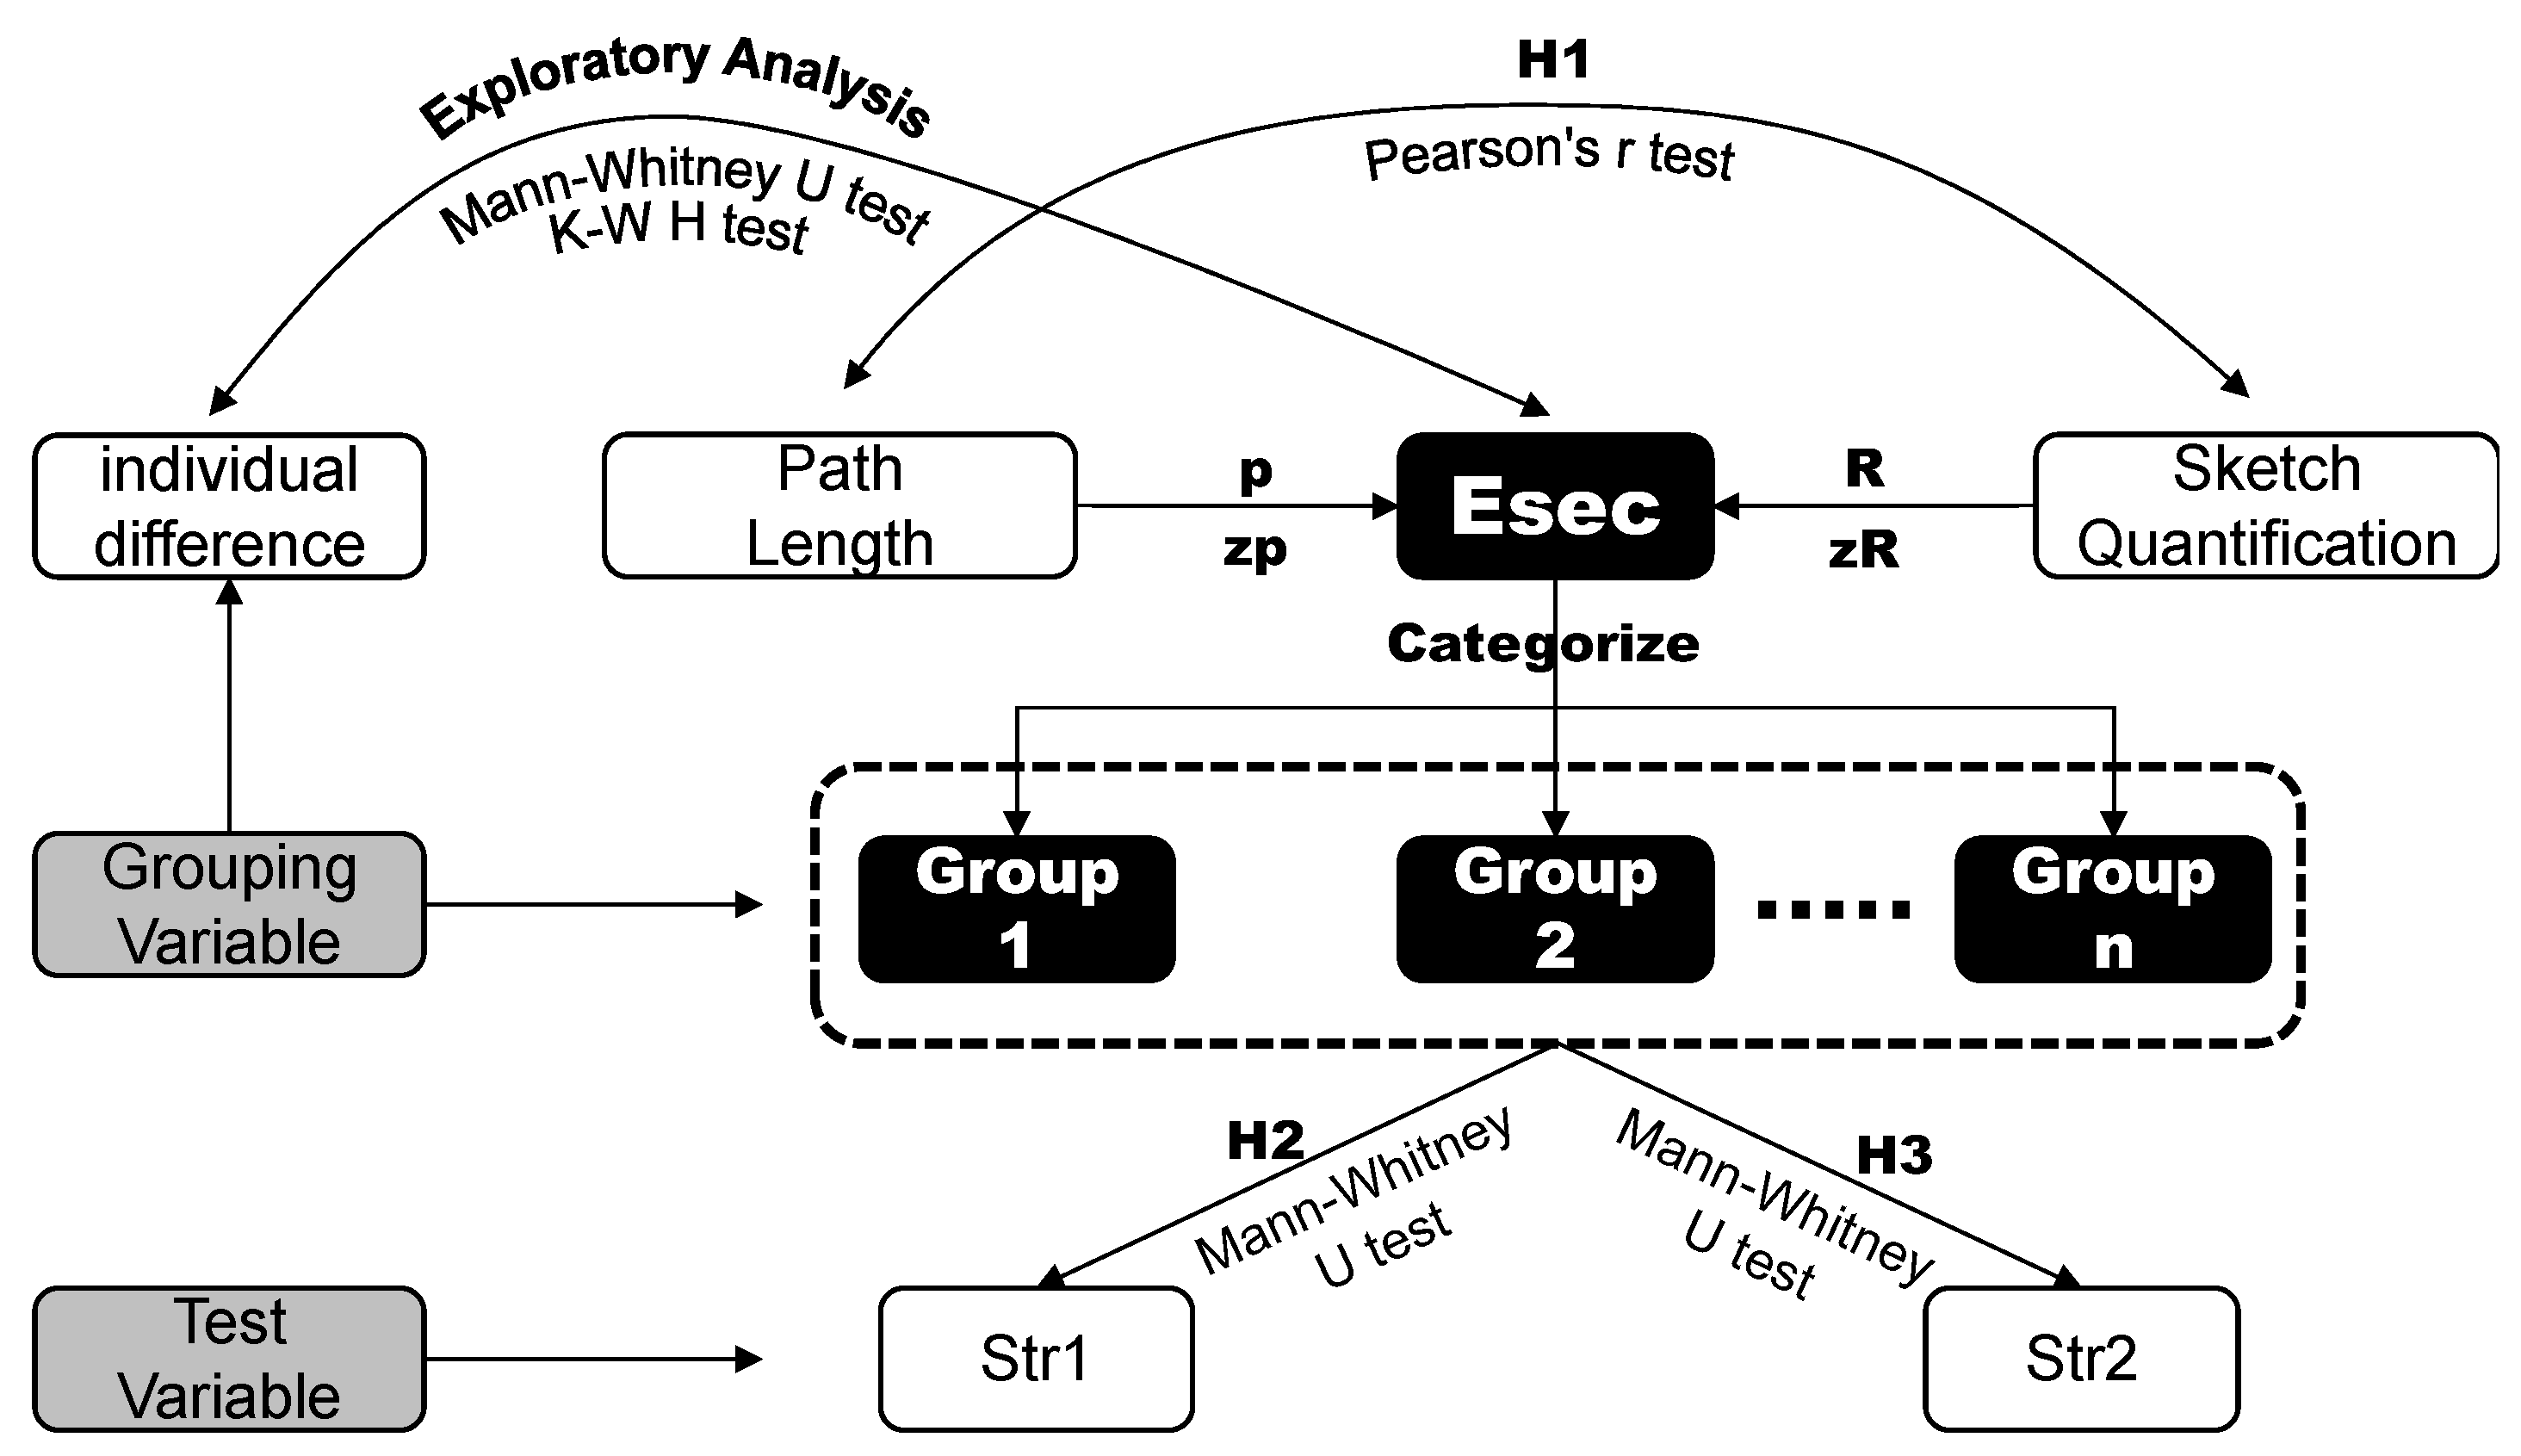
The statistical testing procedures for hypotheses H1–H3 and exploratory analyses are outlined in Figure 6. Shapiro–Wilk tests indicated that the data for H2, H3, and the exploratory analyses violated the normality assumption (p < 0.05), necessitating the use of non-parametric tests. Accordingly, Mann–Whitney U tests were employed for comparisons involving binary grouping variables, and Kruskal–Wallis H tests were used for comparisons involving categorical independent variables with three or more levels. For H1, which examines the correlation between spatial knowledge acquisition (P) and cognitive effort expenditure (R), a Pearson’s correlation coefficient (r) was computed using a two-tailed test. Inter-rater reliability for the sketch quality scores was assessed using Kendall’s coefficient of concordance (W), based on ratings from three independent experts across all 30 sketches. All analyses were conducted using IBM SPSS Statistics (Version 23.0), with the significance level set at 0.05.

3. Results

3.1. Task Performance

3.1.1. Descriptives

Descriptive statistics for all experimental sessions are presented in Table 1. Substantial inter-individual variability was observed in both exposure time (M = 392.15 s, SD = 129.73 s) and path length (M = 291.95 m, SD = 110.03 m). The mean movement speed during Task 1 (virtual navigation) was 0.79 m/s (SD = 0.29 m/s), notably slower than the typical overground walking speed of 1.2–1.4 m/s reported in natural environments. Similarly, sketch completion time during Task 2 (cognitive mapping) exhibited considerable variation across participants (M = 245.67 s, SD = 203.98 s). Inter-rater reliability of sketch quality scores—assessed using Kendall’s coefficient of concordance (W)—was high across all four dimensions: Component Completeness (CC: W = 0.75, p < 0.001), Proportional Accuracy (PA: W = 0.83, p < 0.001), Order Accuracy (OA: W = 0.82, p < 0.001), and Geometric Accuracy (GA: W = 0.88, p < 0.001). All coefficients exceeded the conventional threshold of W > 0.70, confirming robust agreement among raters and thereby supporting the reliability of the quantified sketch metrics.

3.1.2. Spatial Cognition Efficiency

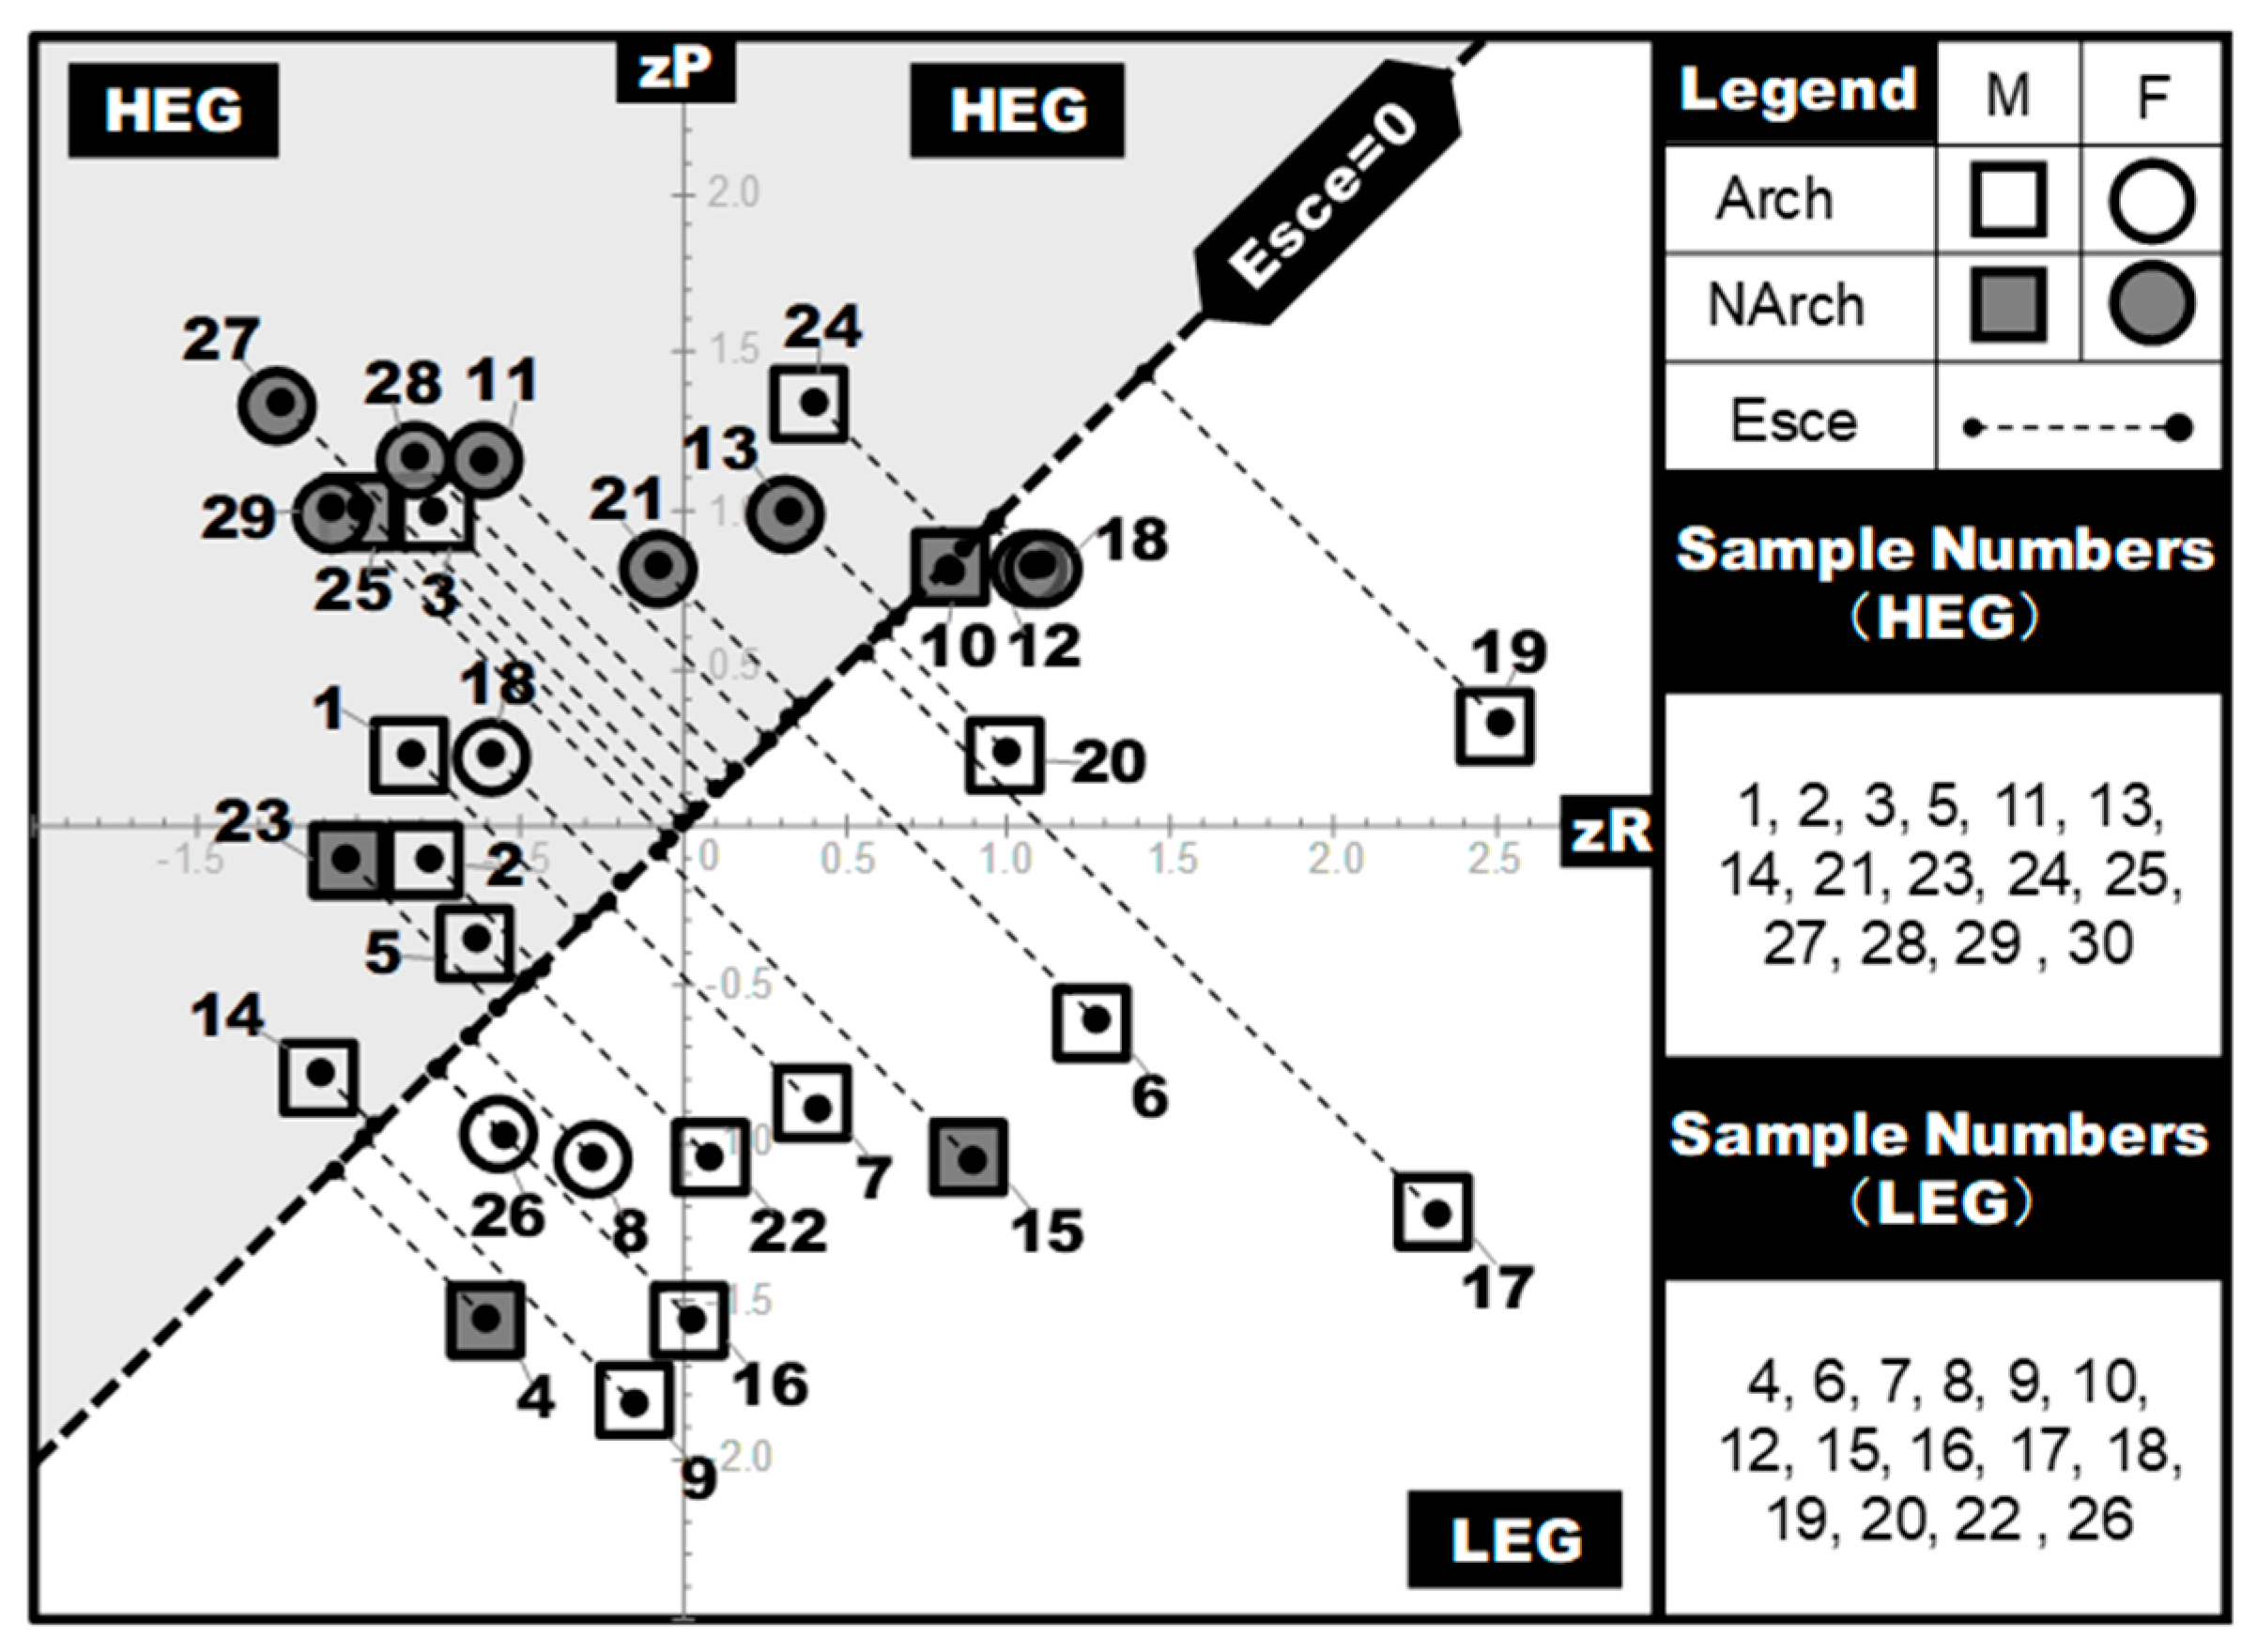
Figure 7 illustrates the cognitive efficiency distribution for the 30 participants. The x-axis represents the z-score of cognitive effort (zR), and the y-axis represents the z-score of spatial performance (zP), with each data point labeled by its participant ID. The equilibrium line (Esce = 0), defined by zP = zR, serves as the zero-efficiency baseline. Cognitive efficiency (Esce) for each participant is quantified as the orthogonal distance from their data point to this line, calculated as Equation (1).
This baseline divides the coordinate plane into two distinct regions: the upper-left quadrant (where zP > zR and Esce > 0), indicating high cognitive efficiency (higher performance relative to effort, with efficiency increasing toward the corner); and the lower-right quadrant (where zP < zR and Esce < 0), indicating low cognitive efficiency (lower performance relative to effort, with efficiency decreasing toward the corner). Based on this criterion, participants were categorized into a High-Efficiency Group (HEG, Esce > 0) and a Low-Efficiency Group (LEG, Esce < 0), revealing distinct individual efficiency profiles.

3.2. Hypothesis Validation

To test H1, a Pearson correlation was computed between P and R. Results revealed a negligible and non-significant linear relationship between the two variables (r(28) = −0.134, p = 0.481), which is consistent with H1.
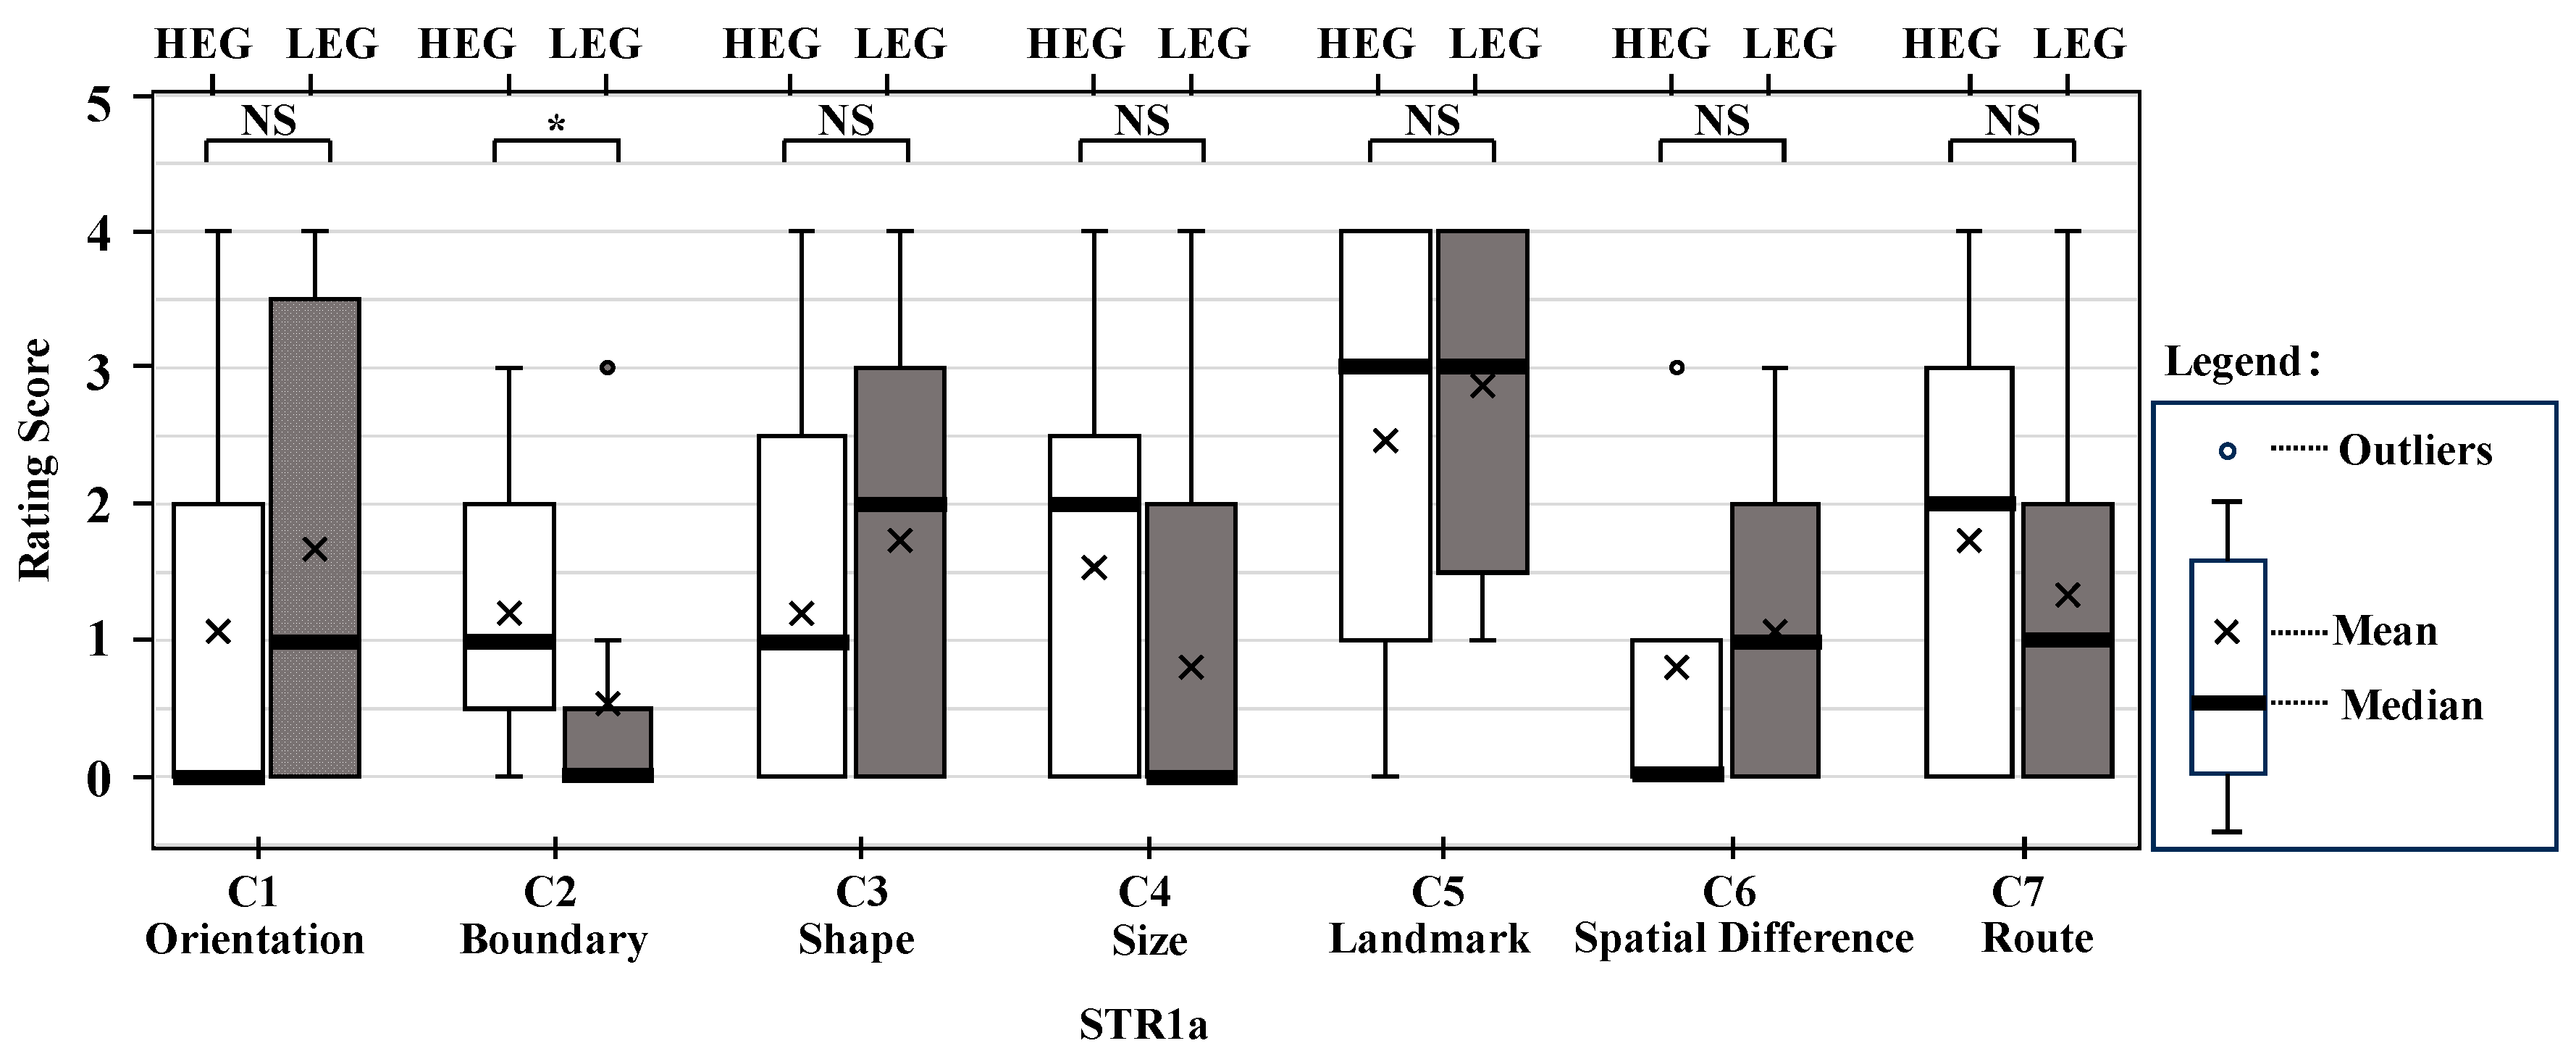
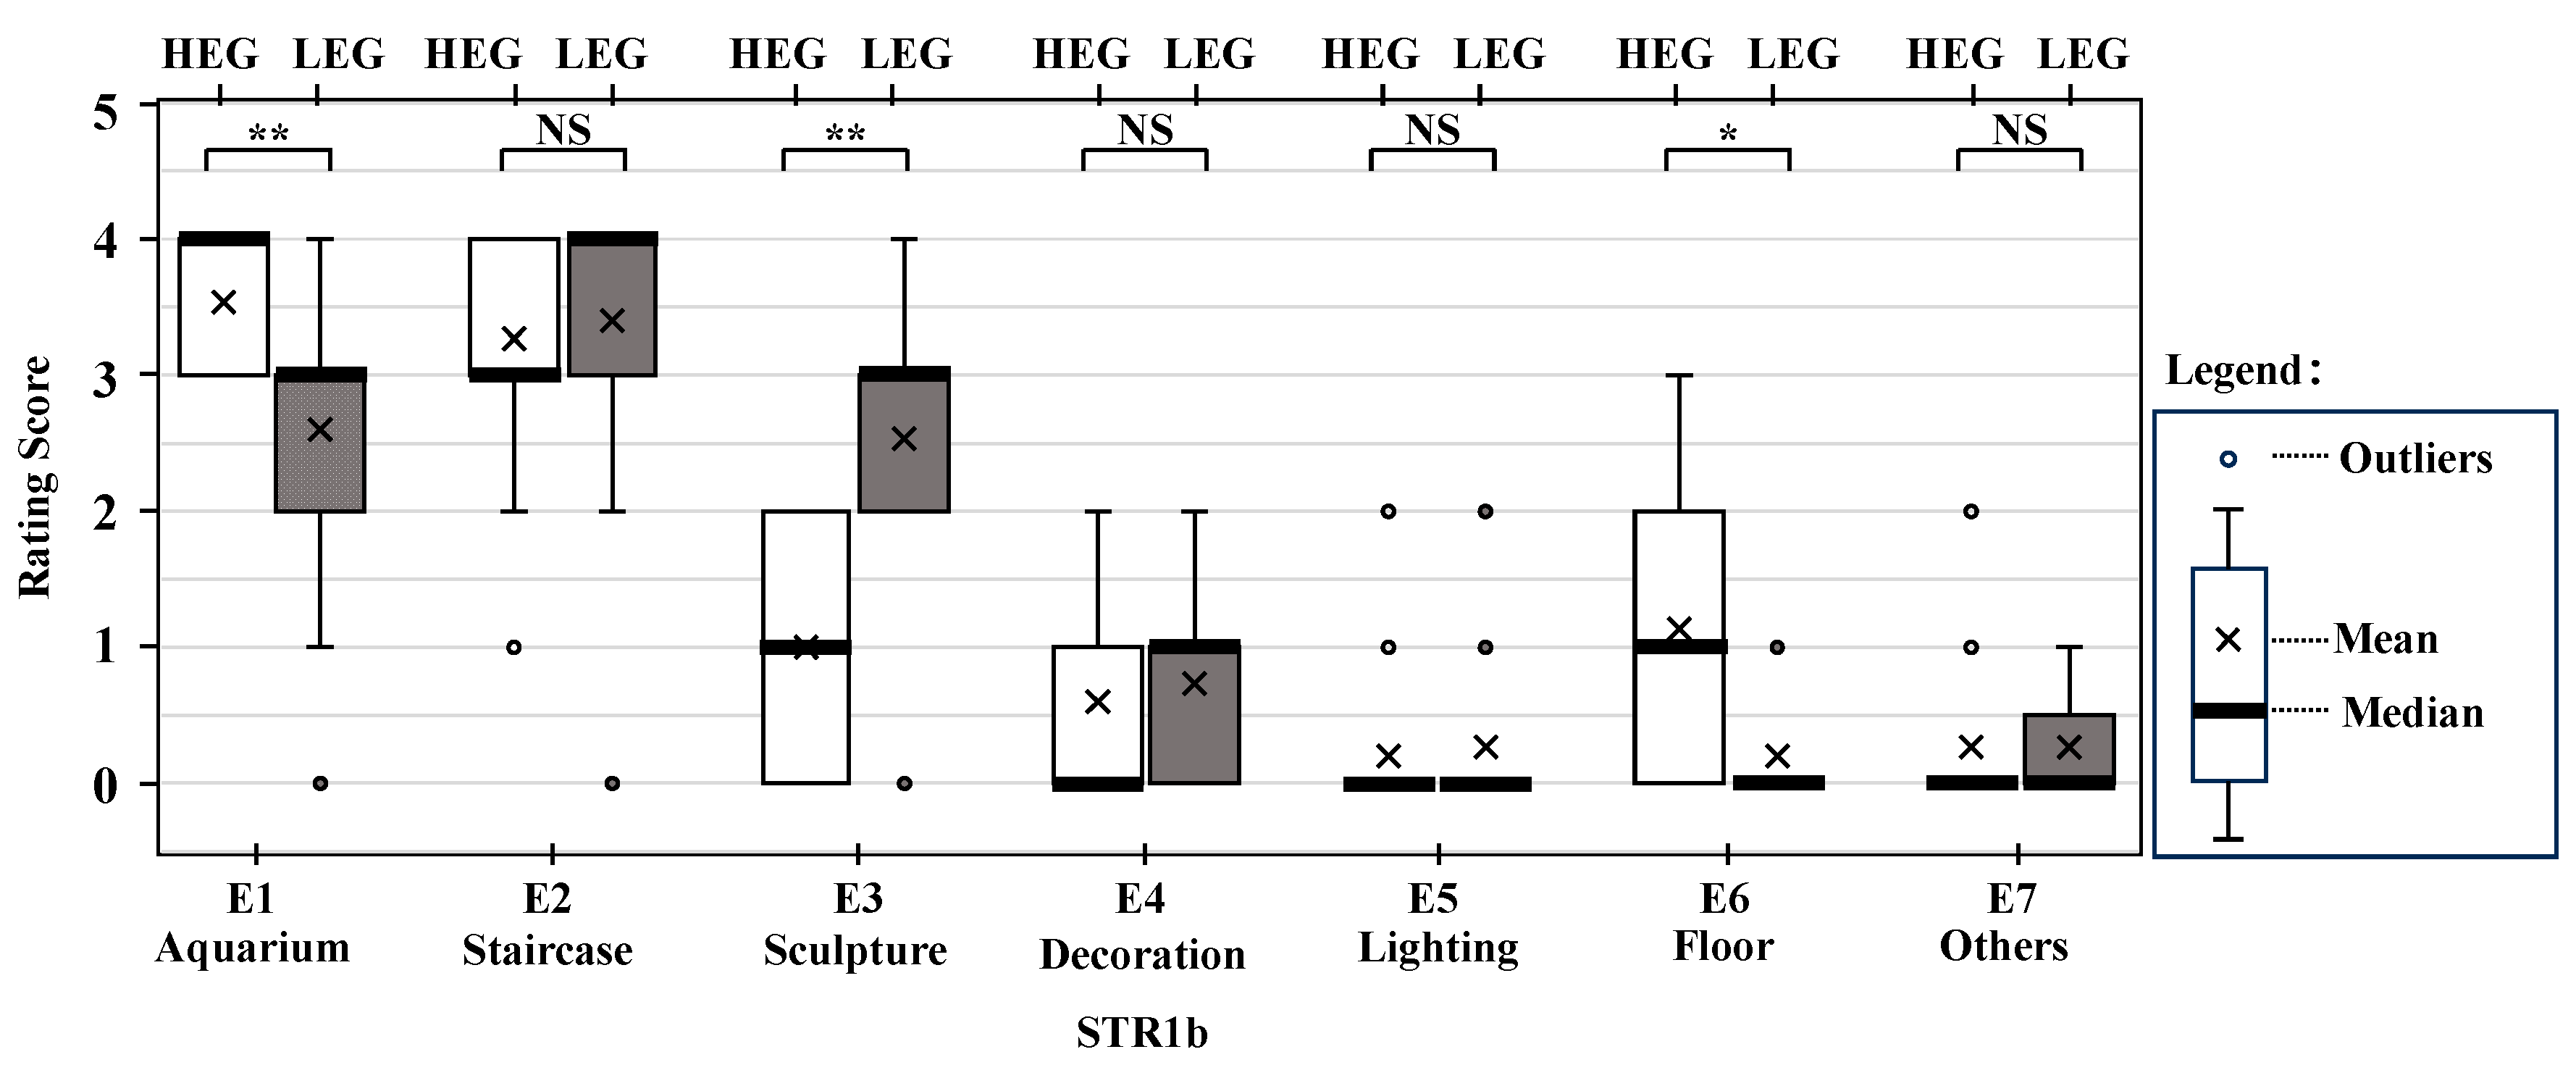
To test H2, Mann–Whitney U tests were conducted to compare the HEG and LEG on their ratings of mental strategies (STR1). For STR1a (Figure 8), the HEG assigned significantly higher importance to the “boundaries” cue than the LEG (U = 64.00, p = 0.045), while no significant differences were found for other environmental cues. In STR1b (Figure 9), the HEG rated “aquariums” (U = 50.00, p = 0.005), and “floors” (U = 58.50, p = 0.011), as more important than the LEG. Conversely, the LEG assigned significantly greater importance to “sculptures” than the HEG (U = 30.00, p = 0.001). These findings support H3, indicating that cognitive efficiency is associated with the prioritization of distinct categories of environmental cues during spatial learning.
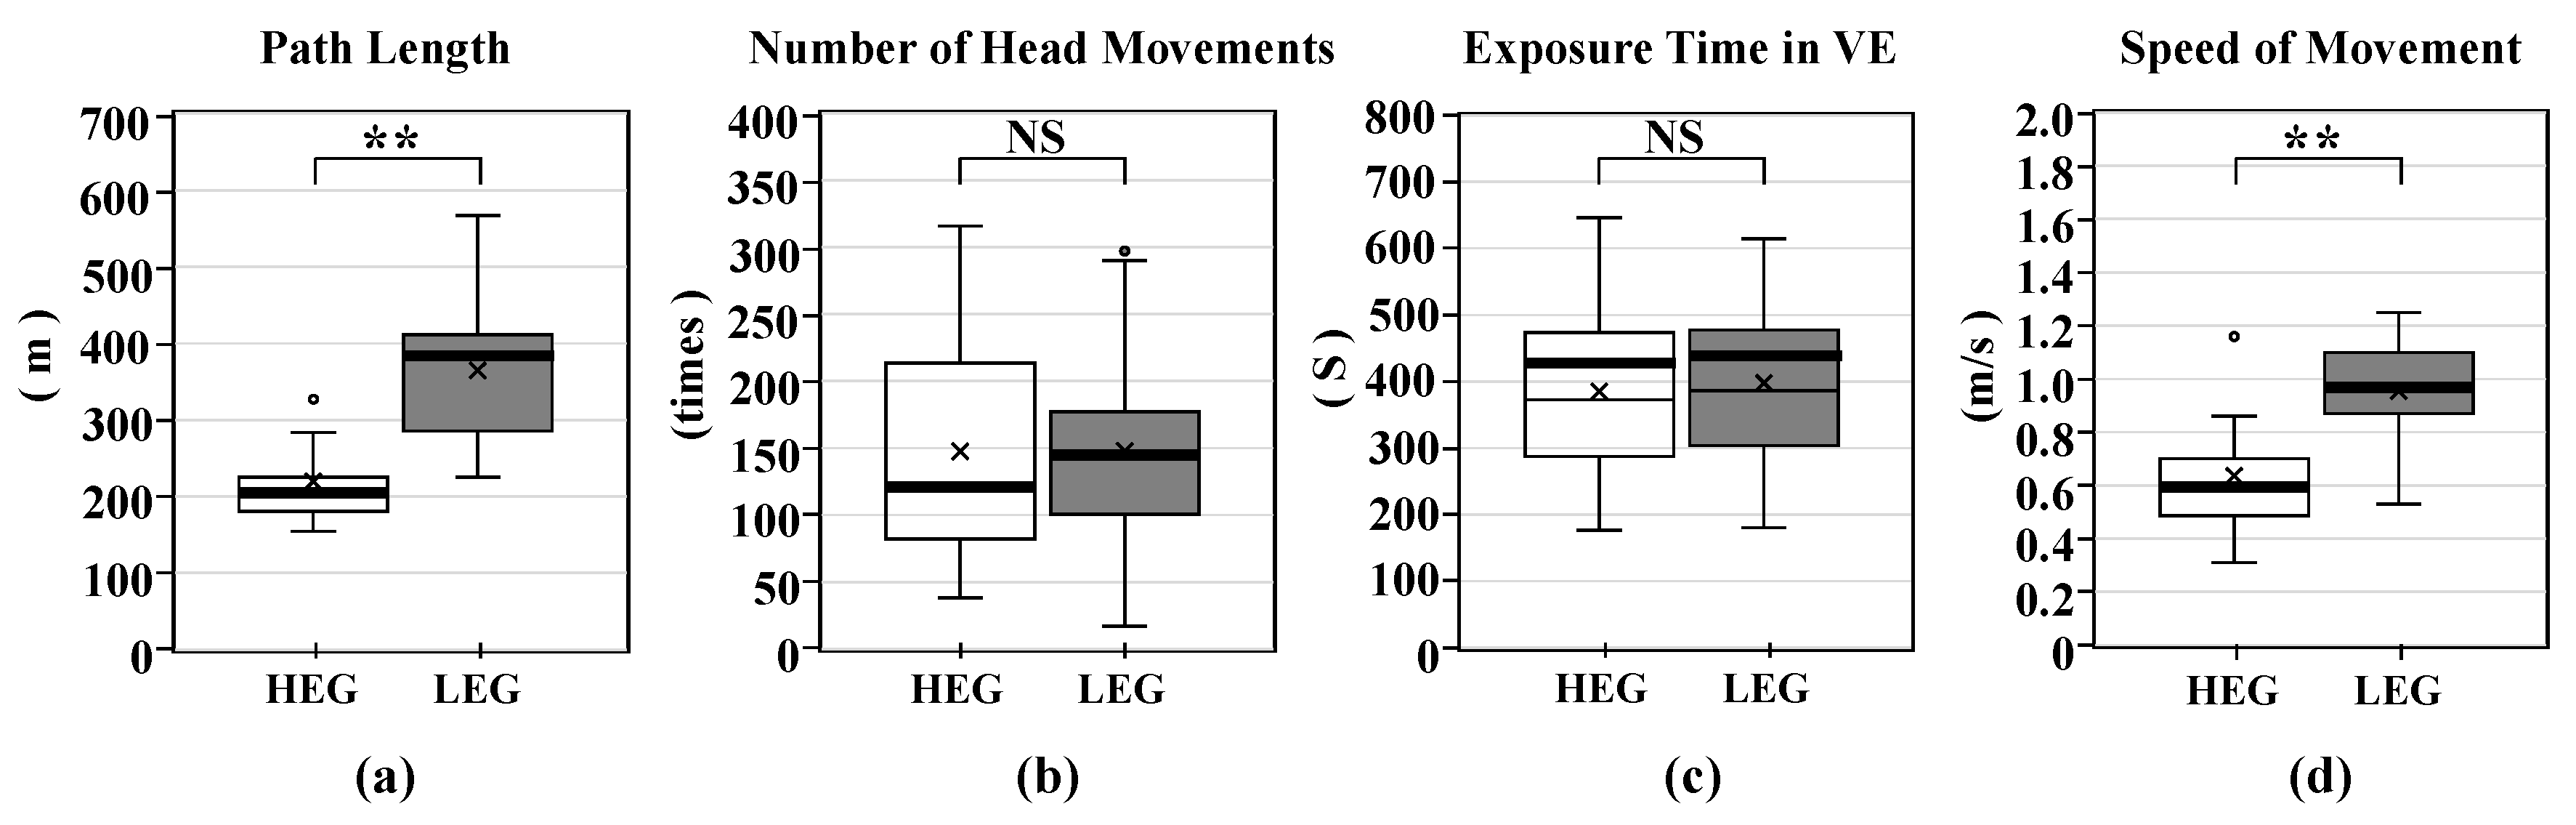
For H3, Mann–Whitney U tests were conducted to compare the HEG and LEG on behavioral strategies (STR2). The HEG traveled a significantly shorter path length than the LEG (U = 17.00, p = 0.001, Figure 10a), whereas no group differences were found in total exposure time (U = 104.00, p = 0.744, Figure 10c) or head rotation frequency (U = 108.00, p = 0.870, Figure 10b). Despite comparable exposure time, the HEG exhibited a significantly lower mean movement speed (U = 41.00, p = 0.002, Figure 10d). These findings support H4, indicating that distinct cognitive efficiency profiles are associated with divergent behavioral strategies during spatial exploration.
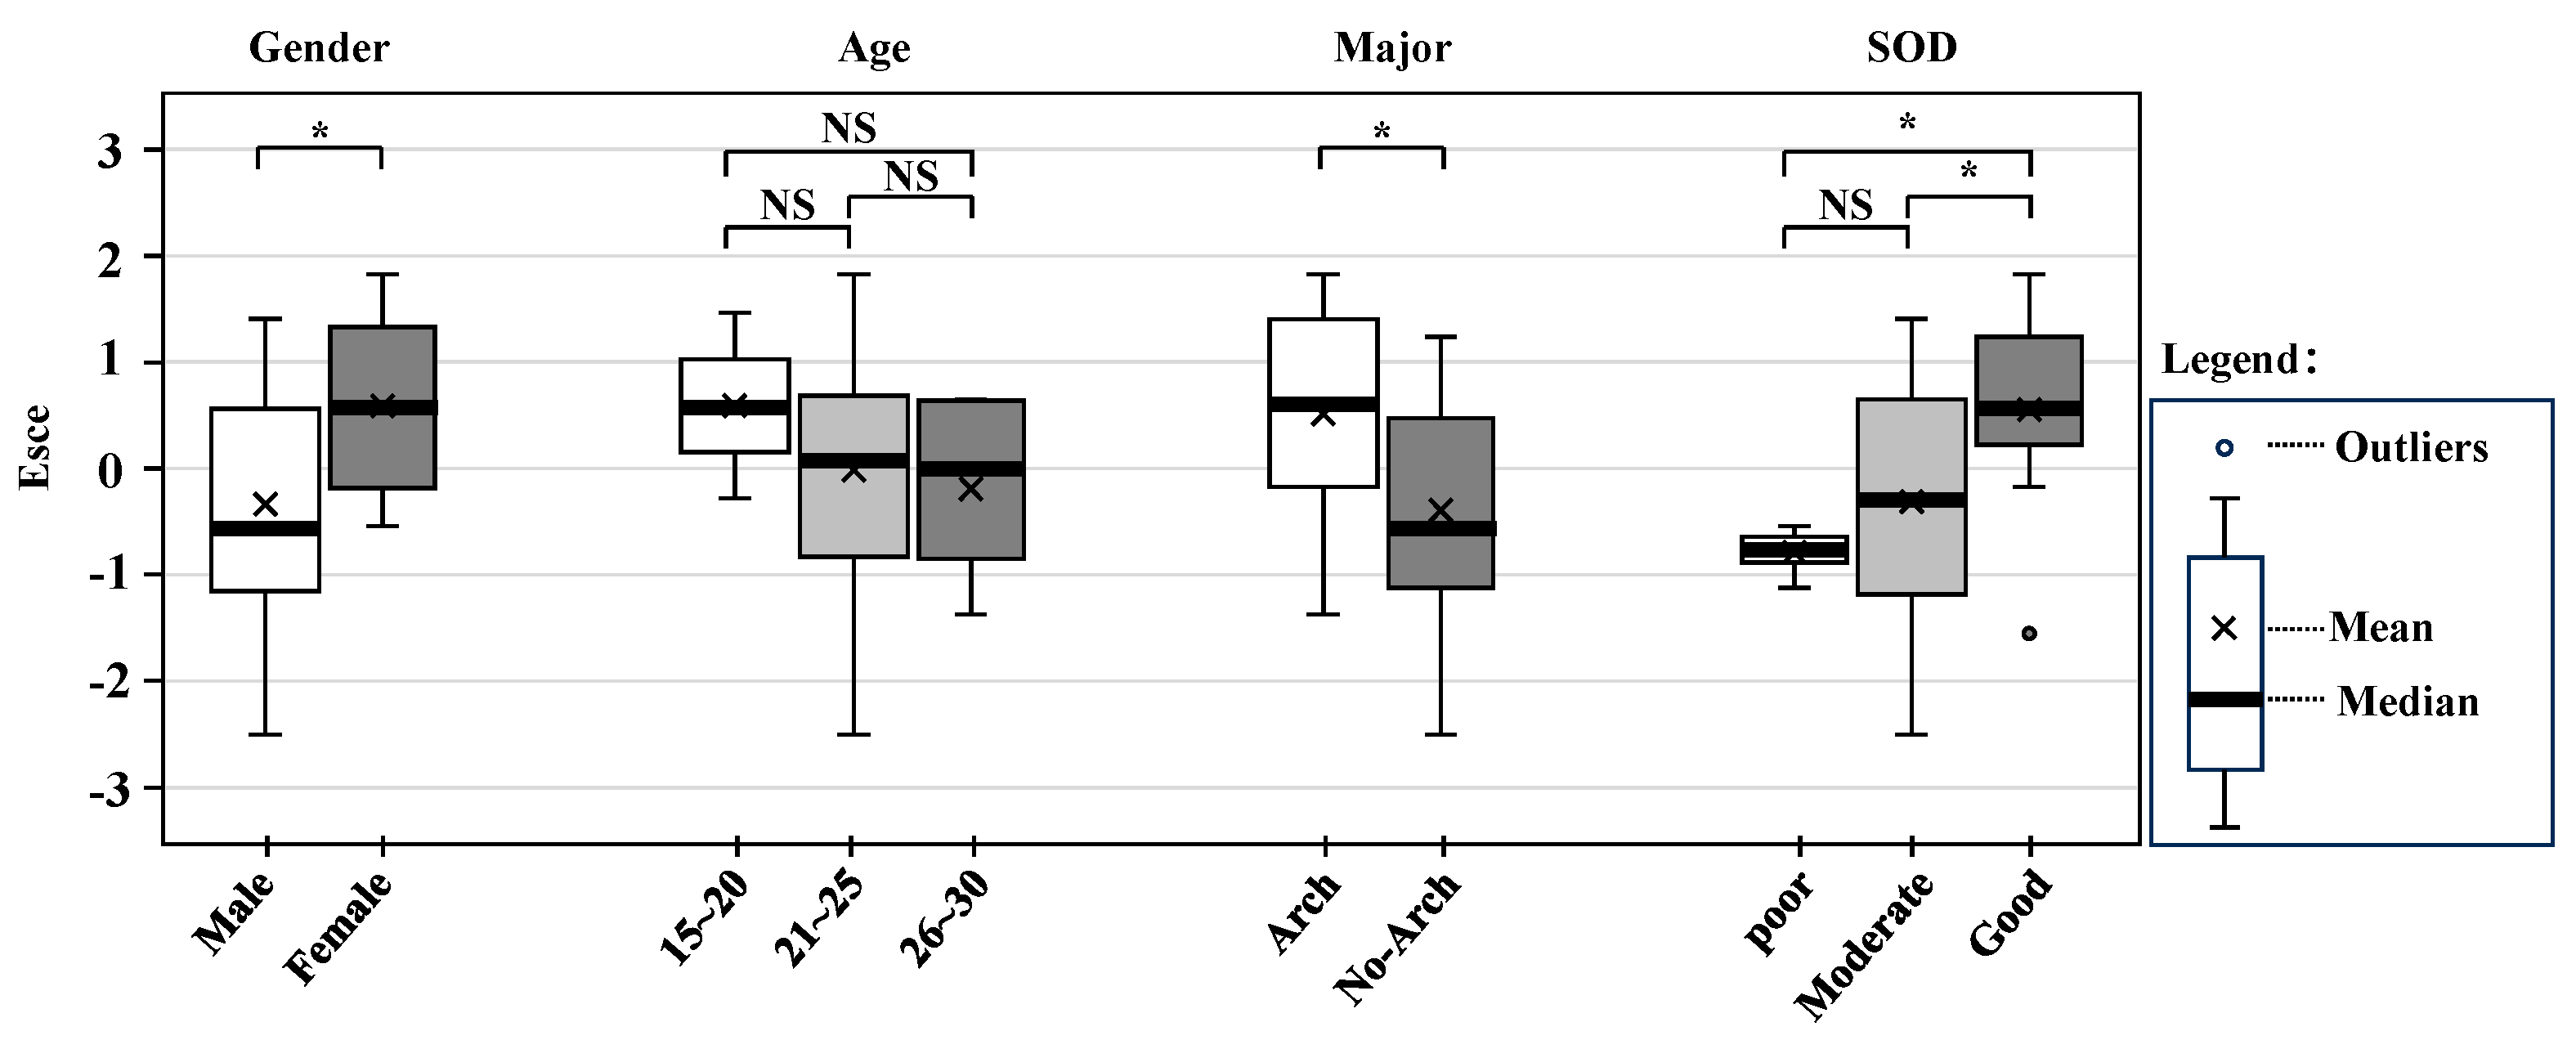
To explore the effects of individual difference factors, non-parametric analyses were employed to examine differences in cognitive efficiency (Esce) across individual factors (Figure 11). Mann–Whitney U tests revealed that female participants exhibited significantly higher Esce than males (U = 54.00, p = 0.030), and architecture majors demonstrated greater efficiency than non-majors (U = 56.00, p = 0.023). Kruskal–Wallis H tests indicated no significant association between age group and Esce (H(2) = 0.828, p = 0.668), but significant effects for self-reported sense of direction (H(2) = 6.973, p = 0.031) and perceived task difficulty (H(2) = 7.001, p = 0.030). Post hoc Dunn’s tests with Bonferroni correction showed that participants with a strong sense of direction had higher Esce than those with a poor sense (p = 0.050), while the difference from the moderate group was not significant (p = 0.150). Similarly, individuals who rated the task as high difficulty exhibited lower Esce than those in the low-difficulty group (p = 0.040). Collectively, the exploratory analyses of individual differences revealed that cognitive efficiency is systematically associated with gender, academic background, spatial self-perception, and subjective task appraisal, with no significant effect of age group observed.

4. Discussion

4.1. Key Findings and Overview

In complex indoor environments, efficient wayfinding and navigation depend on an individual’s capacity to encode spatial information with minimal cognitive resource allocation—constructing comprehensive spatial representations while minimizing effort expenditure. This study employed virtual reality (VR) to investigate how individual differences in spatial cognitive strategies correlate with cognitive efficiency during indoor navigation. The results revealed a non-significant linear correlation between spatial knowledge acquisition (P) and cognitive resource consumption (R), consistent with their relative independence and supporting the utility of cognitive efficiency as a multidimensional metric that captures complementary aspects of spatial performance beyond unidimensional assessments. The observed variability in cognitive efficiency was primarily associated with spatial cognitive strategies—encompassing both mental (heuristic cue prioritization) and behavioral (exploration patterns) components. Crucially, participants who prioritized structural boundary cues demonstrated significantly higher cognitive efficiency compared to those relying on isolated landmarks. This finding suggests that boundary-based spatial encoding—as opposed to reliance on perceptually variable or context-dependent landmarks—supports more stable and efficient spatial representations in indoor settings. These results not only advance the theoretical framework of indoor spatial cognition by delineating the mechanistic role of environmental structure in cognitive efficiency but also provide empirical validation for practical applications. Specifically, they inform the design of navigation systems (e.g., by enhancing the salience of boundary-related cues) and the optimization of complex built environments (e.g., improving architectural legibility) to reduce cognitive load and enhance user experience in spaces such as hospitals, airports, and large commercial complexes.
It is worth noting that, within the scope of exploratory analyses and given the current sample size (n = 30), significant associations emerged between cognitive efficiency and several individual difference variables, including self-reported sense of direction, gender, and academic major, whereas age showed no statistically significant relationship. It should be noted that these associations, while statistically significant within our sample, are based on a relatively small and homogeneous group of participants. Therefore, they should be interpreted as exploratory findings that highlight potential avenues for future research with larger and more diverse populations, rather than as definitive evidence of causal relationships.

4.2. Relative Independence of P and R: Supporting Cognitive Efficiency as a Multidimensional Metric

Verification of Hypothesis 1 (H1) revealed no significant linear relationship between an individual’s spatial performance (P) and cognitive effort (R). This finding challenges the conventional assumption that greater cognitive input invariably enhances task performance, yet aligns with Guo et al. (2023) [49]. By comparing the effects of 2D and 3D maps on spatial cognitive performance, Guo et al. (2023) [49] demonstrated that 3D maps increased cognitive resource consumption (cognitive effort) due to information overload—as indicated by increased pupillary diameter, a well-validated physiological marker of cognitive load—while simultaneously impairing spatial orientation performance (spatial performance). In contrast, 2D maps achieved a low cognitive effort–high spatial performance outcome through information simplification, thereby further questioning the linear efficacy assumption. Complementing this, Qiu et al. (2023) [24] elucidated a key mechanism from a resource allocation perspective: reduced cognitive resource consumption did not necessarily lead to worse performance as some participants maintained or even improved spatial performance through optimized resource allocation efficiency, such as by minimizing invalid attentional shifts. These collective results underscore that cognitive performance evaluation must integrate two dimensions—resource input and performance output—rather than relying on isolated metrics. Consequently, traditional approaches that consider only P (ignoring the rationality of cognitive cost) or only R (failing to reflect performance efficacy) are inadequate. This distinction underscores the theoretical advancement of the cognitive efficiency metric. Unlike unidimensional measures that assess only outcome or cost in isolation, cognitive efficiency explicitly quantifies the trade-off between the two, addressing the more nuanced question: “At what cognitive cost was this level of performance achieved?” This perspective aligns with contemporary frameworks emphasizing the resource-rationality of human behavior. Cognitive efficiency, as a holistic metric that synthesizes the P–R balance, effectively overcomes these limitations by concurrently capturing the effectiveness of resource input and the rationality of performance output. This confirms the scientific validity of using cognitive efficiency as a criterion for evaluating spatial task performance.

4.3. Boundary-Based Strategies and Enhanced Cognitive Efficiency: Mechanisms and Evidence

Analysis of heuristic strategies for environmental elements (STR1b) revealed that participants with different levels of cognitive efficiency employed distinct cognitive strategies toward key environmental elements—namely, aquariums, floors, and sculptures. This was reflected in their differential assessment of each element’s perceived salience and functional usability. This finding aligns with Jamshidi et al. (2020) [12], who demonstrated that the perceived usability of indoor environmental elements modulates wayfinding performance. Specifically, the functional usability of indoor landmarks—determined by their visual salience, sensory discriminability, and distinctiveness—enhances spatial memory accuracy, thereby directly or indirectly improving wayfinding performance [35]. In the present experiment, aquariums served as core landmarks for distinguishing between scenarios (Q1–Q5). Their distinct shapes and sizes across scenarios facilitated recall and discrimination, thereby enhancing performance in the sketch map task. Floor contours, by directly encoding the planar geometry of each scenario, also positively influenced cognitive efficiency. In contrast, sculptures—although landmark elements—reduced cognitive efficiency among participants with low baseline efficiency. Present only in Scenarios Q2 and Q5, sculptures were few in number and low in perceptual distinctiveness, which led to memory confusion. Under these conditions, reliance on such landmarks hindered mental map construction, compelling participants to resort to higher-order spatial knowledge (e.g., integrating route and configurational information) [10]. This increased the difficulty of forming a coherent cognitive map structure. This context-dependent instability in the efficacy of landmark strategies supports Berry et al. (2014), who showed that landmark-based navigation yields inconsistent cognitive performance in indoor environments [36].
Research on heuristic strategies for environmental boundary cues (STR1a) demonstrated that the perceived salience of boundary elements is critical for enhancing cognitive efficiency, which is consistent with the findings of Zhang et al. (2025) [25]. Their study established that virtual environmental boundaries provide a stable allocentric reference frame. This eliminates the need for egocentric-allocentric mental rotation—a cognitively demanding process required when using traditional north-up maps—thereby reducing cognitive switching costs and improving task accuracy. Doeller et al. [50] further elucidated this mechanism from a neurobiological perspective: learning the relative positions of boundaries occurs implicitly and automatically, whereas learning the relative positions of landmarks necessitates explicit associative learning rules. Collectively, these findings reinforce the conclusion that boundary-based cues enhance both the efficiency and accuracy of spatial tasks. Crucially, Ratliff et al. (2008) and Lakusta et al. (2010) [51,52] resolved an apparent paradox observed in this study: despite landmarks being subjectively prioritized in participants’ heuristic strategies (M = 2.67, Table 1), boundary elements—not landmarks—were objectively superior for enhancing cognitive efficiency. Their spatial reorientation experiments revealed a key dissociation: environmental interference and elevated cognitive load selectively disrupt landmark-based navigation but leave the utilization of boundary-based geometric cues unaffected [51]. Conversely, spatial cognitive deficits impair boundary-based navigation but not landmark-based navigation [52]. This dual dissociation—between the effects of cognitive interference and cognitive deficit—accounts for the difference in perceived salience of boundary elements between participants with high and low cognitive efficiency. Most importantly, this framework resolves the apparent contradiction. Although boundary elements are fundamentally more efficient for spatial cognition (as evidenced by their role in reducing cognitive load), landmarks continue to be subjectively prioritized in heuristic strategies due to their high perceptual salience in everyday navigation contexts. This explains why landmarks remained the top choice in self-reported strategies, despite the superior objective efficiency of boundary elements.

4.4. Behavioral Correlates of Efficient Exploration

Analysis of behavioral strategies (STR2) revealed two distinct spatial exploration patterns between high-efficiency (HEG) and low-efficiency (LEG) groups. This observation aligns with the framework proposed by Gazit et al. (2003) [53], which posits three spatial exploration patterns—while not a direct match, the underlying principle remains consistent: spatial cognitive responses emerge from the interaction between personality traits and cognitive decision-making. The HEG exhibited a path-efficient exploration style, characterized by lower movement speed and minimized path length. This pattern reflects a deliberate choice to prioritize path precision over speed, driven by high confidence in cognitive mapping, either through rapid cognitive map construction or an act-first, adjust-later heuristic. While this efficient exploration pattern is consistent with adept cognitive map formation, alternative explanations warrant consideration. For instance, individual differences in risk tolerance or prior VR/gaming experience might also contribute to a preference for rapid, direct exploration. Future studies incorporating personality measures or pre-test assessments could help disentangle these contributing factors.
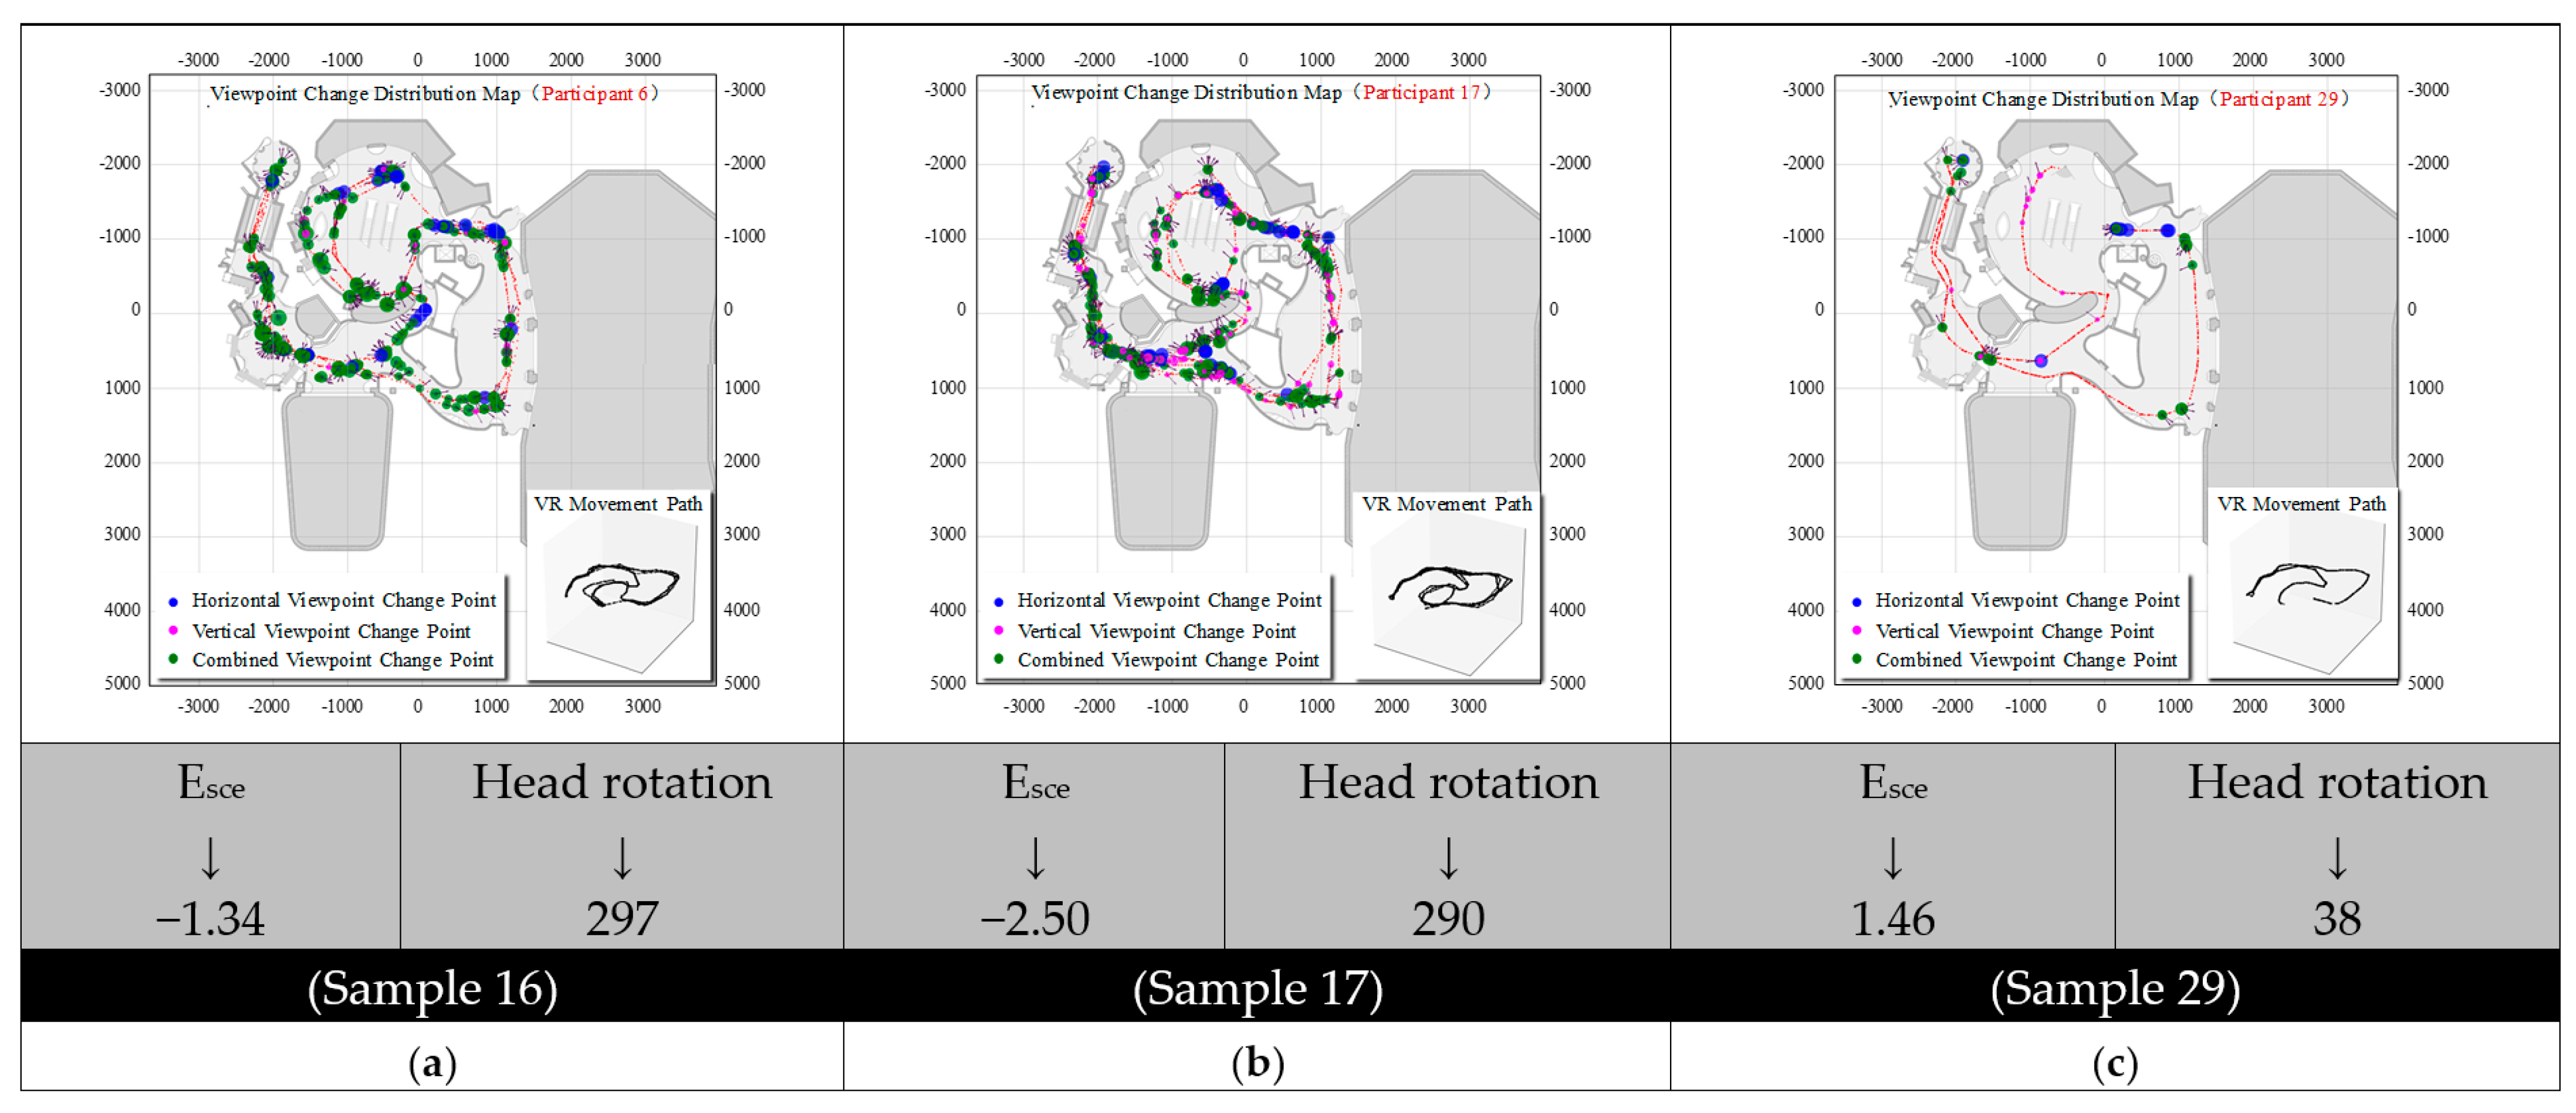
In contrast, the LEG displayed a cautious exploration pattern, marked by higher movement speed, prolonged environmental exposure time, increased head movement frequency, and risk-averse navigation behavior (Figure 12). This pattern likely stems from low confidence in cognitive processing, causing rapid but inefficient exploration: LEG’s accelerated movement (higher speed) was an attempt to quickly construct spatial maps, yet limited cognitive capacity resulted in repetitive path adjustments and longer path lengths despite extended exposure.
Notably, the superior performance of the HEG did not stem from reliance on a single strategy, but rather from strategic flexibility—the dynamic integration of boundary-based and landmark-based strategies according to specific task demands. This finding directly supports Gluck et al. (2003) [10], who demonstrated that individuals with poor performance do not necessarily employ “incorrect” strategies, whereas high performers tend to possess a repertoire of diverse strategies and the ability to select the most appropriate one based on contextual requirements.

4.5. Research Implications and Design Insights

The findings of this study, which highlight the critical role of boundary strategies in enhancing spatial cognitive efficiency, carry significant implications not only for theory but also for the practical optimization of real-world indoor navigation systems. The core insight suggests a paradigm shift in design: moving from a predominantly “landmark-centric” model that relies on point-like features towards a “structure-first” approach that prioritizes the construction and presentation of the global spatial boundary framework. However, when translating this finding into practical design, it is crucial to consider its contextual applicability and technical feasibility. The conclusions of this study are most potent in indoor environments with a clear layout and well-defined physical or visual boundaries (e.g., hospital corridors, airport piers, library stacks). In these contexts, navigation systems can integrate the “boundary-first” principle in several ways.
Concrete Design Example: Taking a navigation app for a large hospital as an example, while a conventional design might only place digital landmarks at each clinic door, an optimized design based on our findings could be: on the app’s digital map, use a light tint contrasting with the background to clearly fill the contour of the entire corridor area, making it perceived as an integrated “navigation channel.” Simultaneously, turn-by-turn instructions could be shifted from “turn left at the ‘Cardiac Center’ sign” to “proceed 50 m along the ‘Main Medical Corridor’ (the boundary) on the east side, and turn left at the end.” This instruction directs the user’s attention to a stable, continuous spatial structure rather than discrete point targets, helping to reduce instantaneous cognitive load at complex decision points. Importantly, this is not to replace landmark information entirely but to emphasize embedding landmark information (like “Cardiac Center”) within a clear spatial framework defined by boundaries, achieving complementary advantages.

4.6. Limitations and Future Work

Although this study controlled for environmental variables using virtual reality (VR) technology and identified key factors influencing indoor spatial cognitive efficiency, several limitations should be acknowledged.
First, the sample size was limited and lacked diversity—only excluding key subgroups such as older adults with age-related spatial cognitive decline, but also comprising participants exclusively from a single university in southern China, resulting in a culturally and geographically homogeneous cohort. Given that spatial perception, scale interpretation, and navigation preferences can be shaped by cultural norms and socio-spatial contexts, the cross-cultural generalizability of our findings remains to be established.
Second, the ecological validity of the VR environment was fundamentally constrained by its reliance on visual input alone, lacking multisensory integration (e.g., directional audio, haptic feedback). Since real-world spatial experiences are inherently multisensory, this limitation may significantly undermine the experiment’s capacity to simulate the “immersive realism” central to our initial argumentation. Consequently, the current findings should be interpreted as a preliminary step toward understanding vision-dominated spatial cognition, rather than a comprehensive model of embodied spatial experience.
Third, while prior research indicates that treadmill-based locomotion offers advantages over common virtual movement techniques (e.g., joysticks) in simulating natural walking and reducing simulator sickness [54]—which was the rationale for selecting a treadmill in this study—its potential impact on the present findings cannot be overlooked. The treadmill system (e.g., Virtuix Omni) employed here may have introduced biomechanical constraints on navigational behavior. Specifically, the physical effort required to execute frequent directional changes on the omnidirectional treadmill surface could have discouraged sharp turns, prompting participants to adopt straighter or suboptimal trajectories. Consequently, path length—a core behavioral metric interpreted as a proxy for cognitive effort—may partially reflect motor adaptation to the device rather than purely cognitive strategy selection. While this constraint likely affected all experimental conditions uniformly (preserving the validity of relative between-group comparisons), it necessitates caution when interpreting absolute path length values as a direct index of cognitive load.
Fourth, cognitive resource expenditure was measured solely through path length as a behavioral proxy, without incorporating multimodal physiological measures (e.g., EEG, pupillometry) that could distinguish inefficient resource allocation from necessary cognitive effort. Future research should address these limitations to advance a more nuanced and mechanistic understanding of indoor spatial cognitive efficiency.

5. Conclusions

Using cognitive efficiency as a central metric, this study investigated the mechanisms through which various factors influence indoor spatial cognitive efficiency via a VR-based experimental design. The investigation yielded the following principal findings:
(1)
The non-significant linear correlation between spatial knowledge acquisition (P) and cognitive effort (R) supports the utility of cognitive efficiency as a multidimensional metric and addresses the limitations of assessing P or R in isolation.
(2)
Individual differences in cognitive efficiency originate from a dissociation between internal heuristic strategies and external behavioral strategies.
(3)
In indoor settings, boundary elements serve as stable spatial anchors that enhance cognitive efficiency by reducing the cognitive effort required for reference frame recalibration. In contrast, the effectiveness of landmark-based strategies is highly contingent upon environmental context and congruence.
The results of this study suggest significant potential in incorporating the concept of “boundary-first” cognitive strategies into indoor navigation design. It offers a key insight for optimizing navigation systems: under appropriate circumstances, emphasizing the presentation of the global spatial boundary structure could be as crucial as, if not more fundamental than, marking individual landmarks. Future designs could explore ways to flexibly integrate boundary and landmark information to adapt to varying environmental complexities and user strategy preferences, thereby enhancing the navigation experience more holistically.

Author Contributions

J.X.: Conceptualization, Methodology, Software, Investigation, Data curation, Visualization, Writing—original draft, Writing—review & editing, Funding acquisition. S.W.: Supervision, Data curation, Software, Funding acquisition, Writing—review & editing. F.F.: Writing—original draft, Writing—review & editing. All authors have read and agreed to the published version of the manuscript.

Funding

This work was supported by the Research Projects: the independent project of State Key Laboratory of Subtropical Building and Urban Science under [Grant number 2022KB10]; the National Natural Science Foundation of China under [Grant number 51978270].

Institutional Review Board Statement

The ethics approval was effectively waived due to the absence of a formal review committee at our institution. We emphasize that the research involved only non-sensitive, anonymized data collected through voluntary surveys and non-invasive VR navigation tasks, with no collection of personal identifiers, health records, or confidential information. All participants provided informed consent, and the study posed minimal risk.

Informed Consent Statement

Informed consent was obtained from all subjects involved in the study.

Data Availability Statement

The original contributions presented in this study are included in the article. Further inquiries can be directed to the corresponding authors.

Acknowledgments

This study was supported by the State Key Laboratory of Subtropical Building and Urban Science and the Zhejiang Key Laboratory of Intelligent Control of Transit Infrastructure Risk. We acknowledge their support in providing the essential research platform and facilitating the experimental work.

Conflicts of Interest

Authors Jian Xu and Fei Fang were employed by the company Power China Huadong Engineering Corporation Limited. The remaining author declares that the research was conducted in the absence of any commercial or financial relationships that could be construed as a potential conflict of interest.

References

  1. Montello, D.R.; Raubal, M. Functions and applications of spatial cognition. In Handbook of Spatial Cognition; Waller, D., Nadel, L., Eds.; American Psychological Association: Washington, DC, USA, 2012; pp. 249–264. [Google Scholar] [CrossRef] [Scilit]
  2. Pissaloux, E.; Velázquez, R. On Spatial Cognition and Mobility Strategies. In Mobility of Visually Impaired People: Fundamentals and ICT Assistive Technologies; Pissaloux, E., Velázquez, R., Eds.; Springer: Cham, Switzerland, 2018; pp. 137–166. [Google Scholar] [CrossRef] [Scilit]
  3. De Cock, L.; Ooms, K.; Van de Weghe, N.; Vanhaeren, N.; Pauwels, P.; De Maeyer, P. Identifying what constitutes complexity perception of decision points during indoor route guidance. Int. J. Geogr. Inf. Sci. 2021, 35, 1232–1250. [Google Scholar] [CrossRef] [Scilit]
  4. Carpman, J.R.; Grant, M.A. Wayfinding: A broad view. In Handbook of Environmental Psychology, 1st ed.; Bechtel, R.B., Churchman, A., Eds.; John Wiley & Sons: New York, NY, USA, 2002; pp. 427–442. [Google Scholar]
  5. Hund, A.M.; Minarik, J.L. Getting from here to there: Spatial anxiety, wayfinding strategies, direction type, and wayfinding efficiency. Spat. Cogn. Comput. 2006, 6, 179–201. [Google Scholar] [CrossRef] [Scilit]
  6. Montello, D.R.; Sas, C. Human factors of wayfinding in navigation. In International Encyclopedia of Ergonomics and Human Factors, 2nd ed.; Karwowski, W., Ed.; CRC Press: Boca Raton, NW, USA, 2006; pp. 2003–2008. [Google Scholar] [CrossRef] [Scilit]
  7. Ye, Y.; Shi, Y.; Xia, P.; Du, J. Cognitive characteristics in firefighter wayfinding tasks: An eye-tracking analysis. Adv. Eng. Inform. 2022, 53, 101668. [Google Scholar] [CrossRef] [Scilit]
  8. Zhang, J.; Xia, X.; Liu, R.; Du, J. Enhancing human indoor cognitive map development and wayfinding performance with immersive augmented reality-based navigation systems. Adv. Eng. Inform. 2021, 50, 101432. [Google Scholar] [CrossRef] [Scilit]
  9. Montello, D.R. A new framework for understanding the acquisition of spatial knowledge in large-scale environments. In Spatial and Temporal Reasoning in Geographic Information Systems; Egenhofer, M.J., Golledge, R.G., Eds.; Oxford University Press: New York, NY, USA, 1998; pp. 143–154. [Google Scholar]
  10. Gluck, J.; Fitting, S. Spatial strategy selection: Interesting incremental information. Int. J. Test. 2003, 3, 293–308. [Google Scholar] [CrossRef] [Scilit]
  11. O’Neill, M. A biologically based model of spatial cognition and wayfinding. J. Environ. Psychol. 1991, 11, 299–320. [Google Scholar] [CrossRef] [Scilit]
  12. Jamshidi, S.; Ensafi, M.; Pati, D. Wayfinding in interior environments: An integrative review. Front. Psychol. 2020, 11, 549. [Google Scholar] [CrossRef] [Scilit]
  13. Li, C.; Guo, H.; Yin, M.; Wang, Y. A systematic review of factors influencing signage salience in indoor environments. Sustainability 2023, 15, 13658. [Google Scholar] [CrossRef] [Scilit]
  14. Dong, W.; Qin, T.; Yang, T.; Wang, J. Wayfinding behavior and spatial knowledge acquisition: Are they the same in virtual reality and in real-world environments? Ann. Am. Assoc. Geogr. 2022, 112, 226–246. [Google Scholar] [CrossRef] [Scilit]
  15. Hoffman, B. Cognitive efficiency: A conceptual and methodological comparison. Learn. Instr. 2012, 22, 133–144. [Google Scholar] [CrossRef] [Scilit]
  16. Siegel, A.W.; White, S.H. The development of spatial representations of large-scale environments. In Advances in Child Development and Behavior; Reese, H.W., Ed.; Academic Press: New York, NY, USA, 1975; Volume 10, pp. 9–55. [Google Scholar] [CrossRef] [Scilit]
  17. Downs, R.M.; Stea, D.; Boulding, K.E. Image and Environment: Cognitive Mapping and Spatial Behavior; Transaction Publishers: Piscataway, NJ, USA, 2017. [Google Scholar] [CrossRef] [Scilit]
  18. Makány, T. Strategies of Human Spatial Cognition: Cognitive and Behavioural Trade-Offs. Ph.D. Thesis, University of Southampton, Southampton, UK, 2009. [Google Scholar]
  19. Billinghurst, M.; Weghorst, S. The use of sketch maps to measure cognitive maps of virtual environments. In Virtual Reality Annual International Symposium, Research Triangle Park, NC, USA, 11–15 March 1995; IEEE: New York, NY, USA, 1995; pp. 40–47. [Google Scholar] [CrossRef] [Scilit]
  20. Ruddle, R.A.; Lessels, S. Three levels of metric for evaluating wayfinding. Presence Teleoperators Virtual Environ. 2006, 15, 637–654. [Google Scholar] [CrossRef] [Scilit]
  21. Feldon, D. The benefits of an efficiency metric in the evaluation of task performance. In 26th Annual Proceedings: Selected Papers Presented at the 2003 National Convention of the Association for Educational Communications and Technology; Simonson, M.R., Crawford, M., Eds.; Association for Educational Communications and Technology: Washington, DC, USA, 2003; Volume 26, p. 119. [Google Scholar]
  22. Jaušovec, N. Differences in EEG alpha activity related to giftedness. Intelligence 1996, 23, 159–173. [Google Scholar] [CrossRef] [Scilit]
  23. Fang, H.; Xin, S.; Zhang, Y.; Wang, Z.; Zhu, J. Assessing the influence of landmarks and paths on the navigational efficiency and the cognitive load of indoor maps. ISPRS Int. J. Geo-Inf. 2020, 9, 82. [Google Scholar] [CrossRef] [Scilit]
  24. Qiu, X.; Yang, Z.; Yang, J.; Wang, Q.; Wang, D. Impact of AR navigation display methods on wayfinding performance and spatial knowledge acquisition. Int. J. Hum. Comput. Interact. 2024, 40, 2676–2696. [Google Scholar] [CrossRef] [Scilit]
  25. Zhang, X.; Iwaki, S. Virtual environmental boundaries reduce cognitive workload for reorientation during turn-by-turn navigation. Res. Sq. 2025. [Google Scholar] [CrossRef] [Scilit]
  26. Liu, X.; Zhang, Y.; Sun, B. Navigating by design: Effects of individual differences and navigation modality on spatial memory acquisition. Behav. Sci. 2025, 15, 959. [Google Scholar] [CrossRef] [Scilit]
  27. Zhou, Y.; Cheng, X.; Zhu, L.; Qin, T.; Dong, W.; Liu, J. How does gender affect indoor wayfinding under time pressure? Cartogr. Geogr. Inf. Sci. 2020, 47, 367–380. [Google Scholar] [CrossRef] [Scilit]
  28. Battles, A.; Fu, W.T. Navigating indoor with maps: Representations and processes. In Proceedings of the 36th Annual Meeting of the Cognitive Science Society, Quebec City, Canada, 23–26 July 2014. [Google Scholar]
  29. Bereczkei, T. Evolutionary psychology: A new perspective in the behavioral sciences. Eur. Psychol. 2000, 5, 175–190. [Google Scholar] [CrossRef] [Scilit]
  30. Ai, L.; Yang, Y.; Wang, Q. The effects of different navigational aids on wayfinding and spatial memory for older adults. Psychol. Aging 2023, 38, 670–683. [Google Scholar] [CrossRef] [Scilit]
  31. Lugli, L.; Ragni, M.; Piccardi, L.; Nori, R. Hypermedia navigation: Differences between spatial cognitive styles. Comput. Hum. Behav. 2017, 66, 191–200. [Google Scholar] [CrossRef] [Scilit]
  32. Viswanathan, V.; Lees, M.; Sloot, P.M.A. The influence of memory on indoor environment exploration: A numerical study. Behav. Res. Methods 2016, 48, 621–639. [Google Scholar] [CrossRef] [Scilit]
  33. Chen, J.L.; Stanney, K.M. A theoretical model of wayfinding in virtual environments: Proposed strategies for navigational aiding. Presence 1999, 8, 671–685. [Google Scholar] [CrossRef] [Scilit]
  34. Arthur, P.; Passini, R. Wayfinding: People, Signs, and Architecture; McGraw-Hill: New York, NY, USA, 1992. [Google Scholar]
  35. Giudice, N.A.; Walton, L.A.; Worboys, M. The informatics of indoor and outdoor space: A research agenda. In Proceedings of the 2nd ACM SIGSPATIAL International Workshop on Indoor Spatial Awareness; Winter, S., Jensen, C.S., Li, K.-J., Eds.; ACM: New York, NY, USA, 2010; pp. 47–53. [Google Scholar] [CrossRef] [Scilit]
  36. Berry, P.L.J.; Bell, S. Pointing accuracy: Does individual pointing accuracy differ for indoor vs. outdoor locations? J. Environ. Psychol. 2014, 38, 175–185. [Google Scholar] [CrossRef] [Scilit]
  37. Hölscher, C.; Brösamle, M.; Vrachliotis, G. Challenges in multilevel wayfinding: A case study with the space syntax technique. Environ. Plan. B Plan. Des. 2012, 39, 63–82. [Google Scholar] [CrossRef] [Scilit]
  38. Montello, D.R. Navigation. In The Cambridge Handbook of Visuospatial Thinking; Shah, P., Miyake, A., Eds.; Cambridge University Press: Cambridge, UK, 2005; pp. 257–294. [Google Scholar] [CrossRef] [Scilit]
  39. Jul, S.; Furnas, G.W. Navigation in electronic worlds: A CHI 97 workshop. ACM SIGCHI Bull. 1997, 29, 44–49. [Google Scholar] [CrossRef] [Scilit]
  40. Darken, R.P.; Peterson, B. Spatial orientation, wayfinding, and representation. In Handbook of Virtual Environment Technology; Stanney, K., Ed.; Lawrence Erlbaum Associates: Mahwah, NJ, USA, 2001; pp. 493–518. [Google Scholar]
  41. Paas, F.G.; Van Merriënboer, J.J. The efficiency of instructional conditions: An approach to combine mental effort and performance measures. Hum. Factors 1993, 35, 737–743. [Google Scholar] [CrossRef] [Scilit]
  42. Sun, G.; Yao, S.; Carretero, J.A. Evaluating cognitive efficiency by measuring information contained in designers’ cognitive processes. In Proceedings of the ASME 2013 International Design Engineering Technical Conferences and Computers and Information in Engineering Conference, Portland, OR, USA, 4–7 August 2013. [Google Scholar] [CrossRef] [Scilit]
  43. Bunch, R.L.; Lloyd, R.E. The cognitive load of geographic information. Prof. Geogr. 2006, 58, 209–220. [Google Scholar] [CrossRef] [Scilit]
  44. Raubal, M.; Winter, S. Enriching wayfinding instructions with local landmarks. In Geographic Information Science (GIScience 2002); Egenhofer, M.J., Mark, D.M., Eds.; Springer: Berlin, Germany, 2002; pp. 243–259. [Google Scholar] [CrossRef] [Scilit]
  45. Montello, D.R. Behavioral methods for spatial cognition research. In Handbook of Environmental Psychology; Gifford, R., Ed.; Wiley: Hoboken, NJ, USA, 2016; pp. 161–181. [Google Scholar] [CrossRef] [Scilit]
  46. Fortenbaugh, F.C.; Hicks, J.C.; Hao, L.; Turano, K.A. High-speed navigators: Using more than what meets the eye. J. Vis. 2006, 6, 565–579. [Google Scholar] [CrossRef] [Scilit]
  47. Murray, D.; Spencer, C. Individual differences in the drawing of cognitive maps: The effects of geographical mobility, strength of mental imagery and basic graphic ability. Trans. Inst. Br. Geogr. 1979, 4, 385–391. [Google Scholar] [CrossRef] [Scilit]
  48. Hátlová, K.; Hanus, M. A systematic review into factors influencing sketch map quality. ISPRS Int. J. Geo-Inf. 2020, 9, 271–292. [Google Scholar] [CrossRef] [Scilit]
  49. Guo, H.; Yang, N.; Wang, Z.; Li, X.; Zhang, Y.; Liu, Y. Effects of spatial reference frames, map dimensionality, and navigation modes on spatial orientation efficiency. ISPRS Int. J. Geo-Inf. 2023, 12, 476–500. [Google Scholar] [CrossRef] [Scilit]
  50. Doeller, C.F.; Burgess, N. Distinct error-correcting and incidental learning of location relative to landmarks and boundaries. Proc. Natl. Acad. Sci. USA 2008, 105, 5909–5914. [Google Scholar] [CrossRef] [Scilit]
  51. Ratliff, K.R.; Newcombe, N.S. Is language necessary for human spatial reorientation? Reconsidering evidence from dual task paradigms. Cogn. Psychol. 2008, 56, 142–163. [Google Scholar] [CrossRef] [Scilit]
  52. Lakusta, L.; Dessalegn, B.; Landau, B. Impaired geometric reorientation caused by genetic defect. Proc. Natl. Acad. Sci. USA 2010, 107, 2813–2817. [Google Scholar] [CrossRef] [Scilit]
  53. Gazit, E.; Chen, D. Using the observer to analyze learning in virtual worlds. Behav. Res. Methods Instrum. Comput. 2003, 35, 400–407. [Google Scholar] [CrossRef] [Scilit]
  54. Zanbaka, C.; Babu, S.; Xiao, D.; Ulinski, A.; Hodges, L.F.; Lok, B. Effects of travel technique on cognition in virtual environments. In Proceedings of the IEEE Virtual Reality 2004, Chicago, IL, USA, 27–31 March 2004; IEEE: New York, NY, USA; pp. 149–286. [CrossRef] [Scilit]
Figure 1. A conceptual model of spatial navigation (adapted from Jul and Furnas, 1997 [39]).
Buildings 16 01001 g001
Figure 2. Conceptual Framework of the Study.
Buildings 16 01001 g002
Figure 3. Virtual Environment Configuration: Three-Dimensional Scene and Topological Layout. (a) Floor plan of the virtual scene, illustrating the spatial layout of five functional zones (Q1–Q5); (b) Topological representation of the plane, showing the connectivity between zones (Q1–Q5) and the path structure; (c) Virtual Scene Screenshots, Representative screenshots (C1–C8) of the virtual scene, capturing distinct visual features and landmark locations (e.g., escalators, water features, decorative elements) that served as cues during cognitive mapping.
Buildings 16 01001 g003
Figure 4. Integrated Experimental Framework Incorporating Cognitive Mapping Assessment. (a) Immersive experience phase; (b) Cognitive mapping task; (c) Questionnaire survey; (d) Sketch quantification.
Buildings 16 01001 g004
Figure 5. Expert-based Scoring comparison of six representative sketch samples (Samples 18, 11, 27, 20, 04, and 22), labeled as (af), respectively. Each sketch is evaluated on four dimensions: CC = Component Completeness; PA = Proportional Accuracy; OA = Order Accuracy; GA = Geometric Accuracy. Arrow labels indicate the mean scores for each metric derived from three independent expert evaluations.
Buildings 16 01001 g005
Figure 6. Statistical Validation Protocol for Hypotheses H1–H3 and Exploratory Analysis of individual difference variables.
Buildings 16 01001 g006
Figure 7. Distribution of Individual Cognitive Efficiency Scores (M: Male; F: Female; Arch: Architecture-Related Majors; N-Arch: Non-Architecture Majors; HEG: high-efficiency group; LEG: low-efficiency group).
Buildings 16 01001 g007
Figure 8. Boxplot Analysis of Importance Ratings for Mental Strategies (STR1a) Between HEG and LEG (Note: HEG = High−Efficiency Group; LEG = Low−Efficiency Group. Boxplots show ratings for elements E1−E7. * p < 0.05, NS = not significant (Mann–Whitney U test)).
Buildings 16 01001 g008
Figure 9. Boxplot Analysis of Importance Ratings for Environmental Elements (STR1b) Between HEG and LEG (Note: HEG = High−Efficiency Group; LEG = Low−Efficiency Group. Boxplots show ratings for elements E1−E7. * p < 0.05, ** p < 0.01, NS = not significant (Mann–Whitney U test)).
Buildings 16 01001 g009
Figure 10. Boxplot of Behavioral Differences in STR2 between HEG and LEG. (a) Path length; (b) Number of head movements; (c) Exposure time in VE; (d) Movement speed (Note: HEG = High-Efficiency Group; LEG = Low-Efficiency Group. NS = not significant. ** p < 0.01 (Mann–Whitney U test)).
Buildings 16 01001 g010
Figure 11. Boxplot Analysis of the Effects of Individual Factors on Cognitive Efficiency (Esce). (Note: HEG = High-Efficiency Group; LEG = Low-Efficiency Group; SOD = Sense of Direction. Boxplots show ratings for elements E1–E7. * p < 0.05, NS = not significant (Mann–Whitney U test)).
Buildings 16 01001 g011
Figure 12. Head rotation frequency and Esce values in representative participants. ((ac) Spatial–temporal distribution of head rotation events in Participants 6, 17, and 29, with higher point density indicating increased head movement frequency).
Buildings 16 01001 g012
Table 1. Descriptive Statistics of the Experimental Variables.
Measurement IndicatorUnitMSD
Self-evaluation DataRating of Directional SensePoints3.30.7
Rating of Task DifficultyPoints2.90.61
VE Experience Behavioral DataExposure Time in VE s392.15129.73
Path Lengthm291.95110.03
Speed of Movement m/s0.790.29
Sketch Process & Outcome DataTime Spent on Sketchings652.5203.98
Proportional AccuracyPoints3.260.91
Order Accuracy Points3.411.24
Geometric AccuracyPoints3.21.15
STR1a DataC1—OrientationPoints1.371.69
C2—BoundaryPoints0.871.07
C3—ShapePoints1.471.46
C4—SizePoints1.171.34
C5—LandmarkPoints2.671.52
C6—Spatial DifferencePoints0.931.14
C7—RoutePoints1.531.57
C8—OthersPoints00
STR1b DataE1—AquariumPoints3.070.94
E2—StaircasePoints3.331.03
E3—SculpturePoints1.771.22
E4—DecorationPoints0.670.76
E5—LightingPoints0.230.57
E6—FloorPoints0.670.96
E7—OthersPoints0.270.52
STR2 DataNumber of Head Movementstimes147.686.11
Disclaimer/Publisher’s Note: The statements, opinions and data contained in all publications are solely those of the individual author(s) and contributor(s) and not of MDPI and/or the editor(s). MDPI and/or the editor(s) disclaim responsibility for any injury to people or property resulting from any ideas, methods, instructions or products referred to in the content.