1. Introduction
The proliferation of information in contemporary life imposes mounting cognitive load and fragments attention, fuelling scholarly interest in how environmental conditions shape cognitive states [
1,
2]. Cognitive experience is formed through interaction with the physical environment, and the structural characteristics of space are closely linked to core cognitive processes such as attention and information processing [
3,
4,
5]. From this perspective, architectural space is not merely a physical backdrop. It is an environmental medium that actively shapes cognitive experience [
6]. To characterise such environments quantitatively, architectural and urban research has developed a range of analytical approaches [
7,
8]. Spatial openness, the level of visual exposure experienced at a given location, has been proposed as a critical variable for explaining the link between spatial perception and cognitive states [
9,
10]. Benedikt’s isovist provides a geometric framework for representing visible space from a particular observation point [
11]. This foundation was subsequently extended through Visibility Graph Analysis (VGA), which examines the relationship between spatial visual connectivity and human behaviour [
12].
However, conventional visibility-based analyses are largely confined to two-dimensional planes and fail to capture the vertical dimension of the visual field [
13,
14,
15]. Spatial experience is fundamentally three-dimensional. Humans perceive their environment through both horizontal sight lines and vertical visual structures, which together produce a volumetric understanding of space [
10,
16]. Three-dimensional visibility analyses have recently been proposed in response, with the volume of visible space serving as a metric that directly reflects total visual exposure at a given point [
9,
10,
13]. Building upon these developments, this study adopts 3D isovist volume as the quantitative variable representing spatial openness.
Two conflicting perspectives have emerged regarding how openness shapes cognitive states. Some studies report that open spaces enhance attentional focus and cognitive efficiency by increasing access to visual information [
17,
18]. Others argue that excessive visual exposure induces attentional dispersion and cognitive overload [
1]. Such contradictory findings suggest that openness may not bear a simple linear relationship with cognitive responses but rather exhibits nonlinear characteristics that vary with stimulation level [
19]. Investigating this empirically requires methods that can quantitatively measure cognitive states. Electroencephalography (EEG) has been widely employed for this purpose, given its high temporal resolution in capturing neural activity associated with attention, cognitive load, and engagement [
16,
19]. Frequency band ratio-based indices have proven particularly effective for interpreting cognitive states quantitatively, and engagement in this study is defined as an EEG-derived index (β/(θ + α)) [
20,
21].
Despite these methodological capabilities, a structural gap persists in seminal literature. Spatial analysis research has succeeded in quantifying the visual structure of space yet has not directly linked these metrics to neural responses [
9,
10,
14]. Conversely, EEG-based investigations can precisely measure cognitive states but have not adequately reflected the geometric structure of space [
22,
23,
24]. Integrated frameworks that bridge these two approaches remain scarce. Moreover, empirical analysis requires an experimental context in which visual stimuli and cognitive responses are simultaneously activated, eliciting concurrent demands for attentional focus and visual exploration. Such characteristics are most prominently observed in exhibition spaces, where viewers focus on specific objects whilst exploring the surrounding environment [
25].
Against this backdrop, this study examines the relationship between 3D isovist-based spatial openness and EEG-based engagement. Openness is defined as a quantitative variable and directly coupled with EEG-based engagement metrics. Two hypotheses are proposed:
This study proposes an analytical framework that integrates spatial openness with neural responses and provides quantitative evidence to inform user-centered spatial design.
2. Theoretical Framework
2.1. Spatial Experience and Cognitive Response
Cognitive experience is shaped through interaction with the environment. Spatial settings act not merely as backdrops but as stimuli that modulate cognitive states [
3,
6]. Environmental psychology has demonstrated that properties such as openness and complexity are key factors influencing attention, cognitive processing, and affective responses [
19,
26,
27]. Open and natural environments, for instance, exert positive effects on attentional restoration and the reduction in cognitive fatigue, phenomena explained through Attention Restoration Theory (ART) [
28,
29]. The level and structure of environmental stimulation thus influence cognitive activation, manifesting in attentional focus, information processing, and engagement.
Whilst previous research has analysed these effects in isolation, integrated explanations of how physical spatial structure relates to cognitive responses remain limited. Few studies have connected the geometric characteristics of space with cognitive responses within a unified framework, and a more refined understanding therefore calls for an integrated approach that bridges these two domains.
2.2. Quantifying Spatial Openness in Architecture
Analysing the cognitive effects of spatial environments requires methods that can quantitatively represent the physical structure of space [
7,
8]. Architectural and urban research has developed a range of approaches for this purpose, among which visibility-based analysis has served as a fundamental method for explaining spatial experience [
11,
12]. Benedikt’s (1979) isovist concept provides a geometric framework for representing visible space from a particular observation point [
11]. This was subsequently extended through Visibility Graph Analysis (VGA), which examines the visual connectivity of space [
12].
However, conventional visibility-based analyses remain largely two-dimensional and underrepresent the vertical visual field [
13,
14,
15].
Table 1 summarises the principal visibility-based spatial analysis approaches and their respective limitations. Building upon recent three-dimensional extensions [
9,
10,
13], we adopt 3D isovist volume as the primary measure of spatial openness [
14].
Reflecting the quantity of visual information to which an observer is simultaneously exposed, openness can be read as the intensity of visual stimulus provided by the environment [
19]. As openness increases, visual exposure expands, raising the information load on the cognitive system and, in turn, the overall level of stimulation. Notwithstanding the availability of such quantitative variables, the existing literature has yet to establish a framework that integrates geometric metrics with neurophysiological responses. To address this gap, we adopt 3D isovist volume as an independent variable and couple it with EEG data.
2.3. EEG-Based Measures of Cognitive Engagement in Space
A broad body of research has established that spatial environments influence cognitive states, yet quantifying this relationship requires methods that can estimate internal states such as attention, cognitive load, and engagement [
3,
22]. Electroencephalography (EEG) is widely employed for this purpose, owing to its high temporal resolution in capturing neural activity that reflects these processes [
30,
31].
EEG signals are associated with distinct cognitive states according to their frequency bands [
31,
32]. The theta band is related to cognitive effort and working memory; the alpha band is associated with inhibition and resting states; and the beta band reflects active states linked to attentional focus and task performance (
Table 2). Relative ratios between these bands are more robust indicators of cognitive states than single bands alone [
20,
21].
Ratio-based indices such as β/(θ + α) capture the relative balance between task-related cortical activation and background activity and have been employed as quantitative indicators of cognitive engagement [
20,
21,
33]. This index is adopted herein as the EEG-derived engagement index and serves as the dependent variable.
However, most existing EEG-based studies have focused on individual environmental elements such as lighting, colour, and temperature. Investigations that quantitatively define complex variables such as spatial geometric structure and directly link them to neural responses remain scarce [
23,
24,
34]. Although EEG has been successfully used to measure cognitive states, systematic analyses examining how these responses relate to the structural characteristics of space are still lacking [
22,
35]. This study therefore couples the EEG-based engagement index with spatial openness, enabling an integrated analysis of the geometric structure of space (stimulus) and cognitive states (response).
2.4. Nonlinear Cognitive Engagement with Spatial Stimuli
The relationship between environmental stimuli and cognitive responses is rarely a simple linear one. Different responses emerge depending on the level of stimulation [
19]. Berlyne proposed that the relationship between stimulus intensity (arousal potential) and human response follows an inverted U-shaped pattern [
19]. At low stimulus levels, cognitive activation is insufficient; at excessive levels, cognitive overload sets in; and the highest responses appear at intermediate levels [
19].
From this perspective, openness can be interpreted as an environmental variable representing the intensity of visual stimulation [
9,
18]. Low openness may produce insufficient stimulation through restricted visual input, whilst high openness may induce cognitive overload and attentional dispersion [
19]. Openness thus operates as a dual-natured stimulus, simultaneously eliciting cognitive activation and cognitive burden, and raising the possibility of a nonlinear relationship with engagement [
19].
Such nonlinear relationships have also been reported in architectural and environmental psychology. Stamps (2005) demonstrated that spatial enclosure is determined by the combination of visual and locomotor permeability, and that permeability levels may nonlinearly influence preference and perceived safety [
36,
37]. Vartanian et al. (2015) further reported that openness affects not only aesthetic evaluations, but also neural responses associated with approach-avoidance behaviour [
38]. Taken together, these findings indicate that openness does not operate in a single direction; it elicits different cognitive and behavioural responses depending on stimulation level [
19,
38].
Such nonlinear responses can be explained through the balance between understanding and exploration proposed by Kaplan and Kaplan (1989) [
29]. Understanding provides cognitive stability through rapid comprehension of environmental structure. Exploration, by contrast, involves the pursuit of novel information and the expansion of environmental awareness [
29]. Understanding-oriented processing predominates at low stimulus levels; exploration-oriented processing becomes more prominent at high levels. The balance between these two mechanisms is a critical determinant of cognitive experience quality [
28,
29].
Taken together, these perspectives indicate that openness modulates visual stimulation intensity, and that cognitive responses shift with the balance between insufficient and excessive stimulation (
Table 3). The resulting relationship is therefore more likely nonlinear than strictly linear.
2.5. Conceptual Model and Hypotheses
Drawing upon the preceding discussion: spatial environments function as external stimuli, shaping cognitive states through the interplay between physical structure and human response. Spatial openness may simultaneously influence attentional focus and exploratory behaviour, serving as a key variable that reflects visual exposure. This study quantifies openness through 3D isovist volume (independent variable) and measures engagement via the EEG-based index β/(θ + α) (dependent variable), integrating spatial structure and cognitive states within a unified framework.
A nonlinear structure is anticipated. At low openness, limited stimulation may reduce cognitive activation; at high openness, excessive stimulation may induce attentional dispersion.
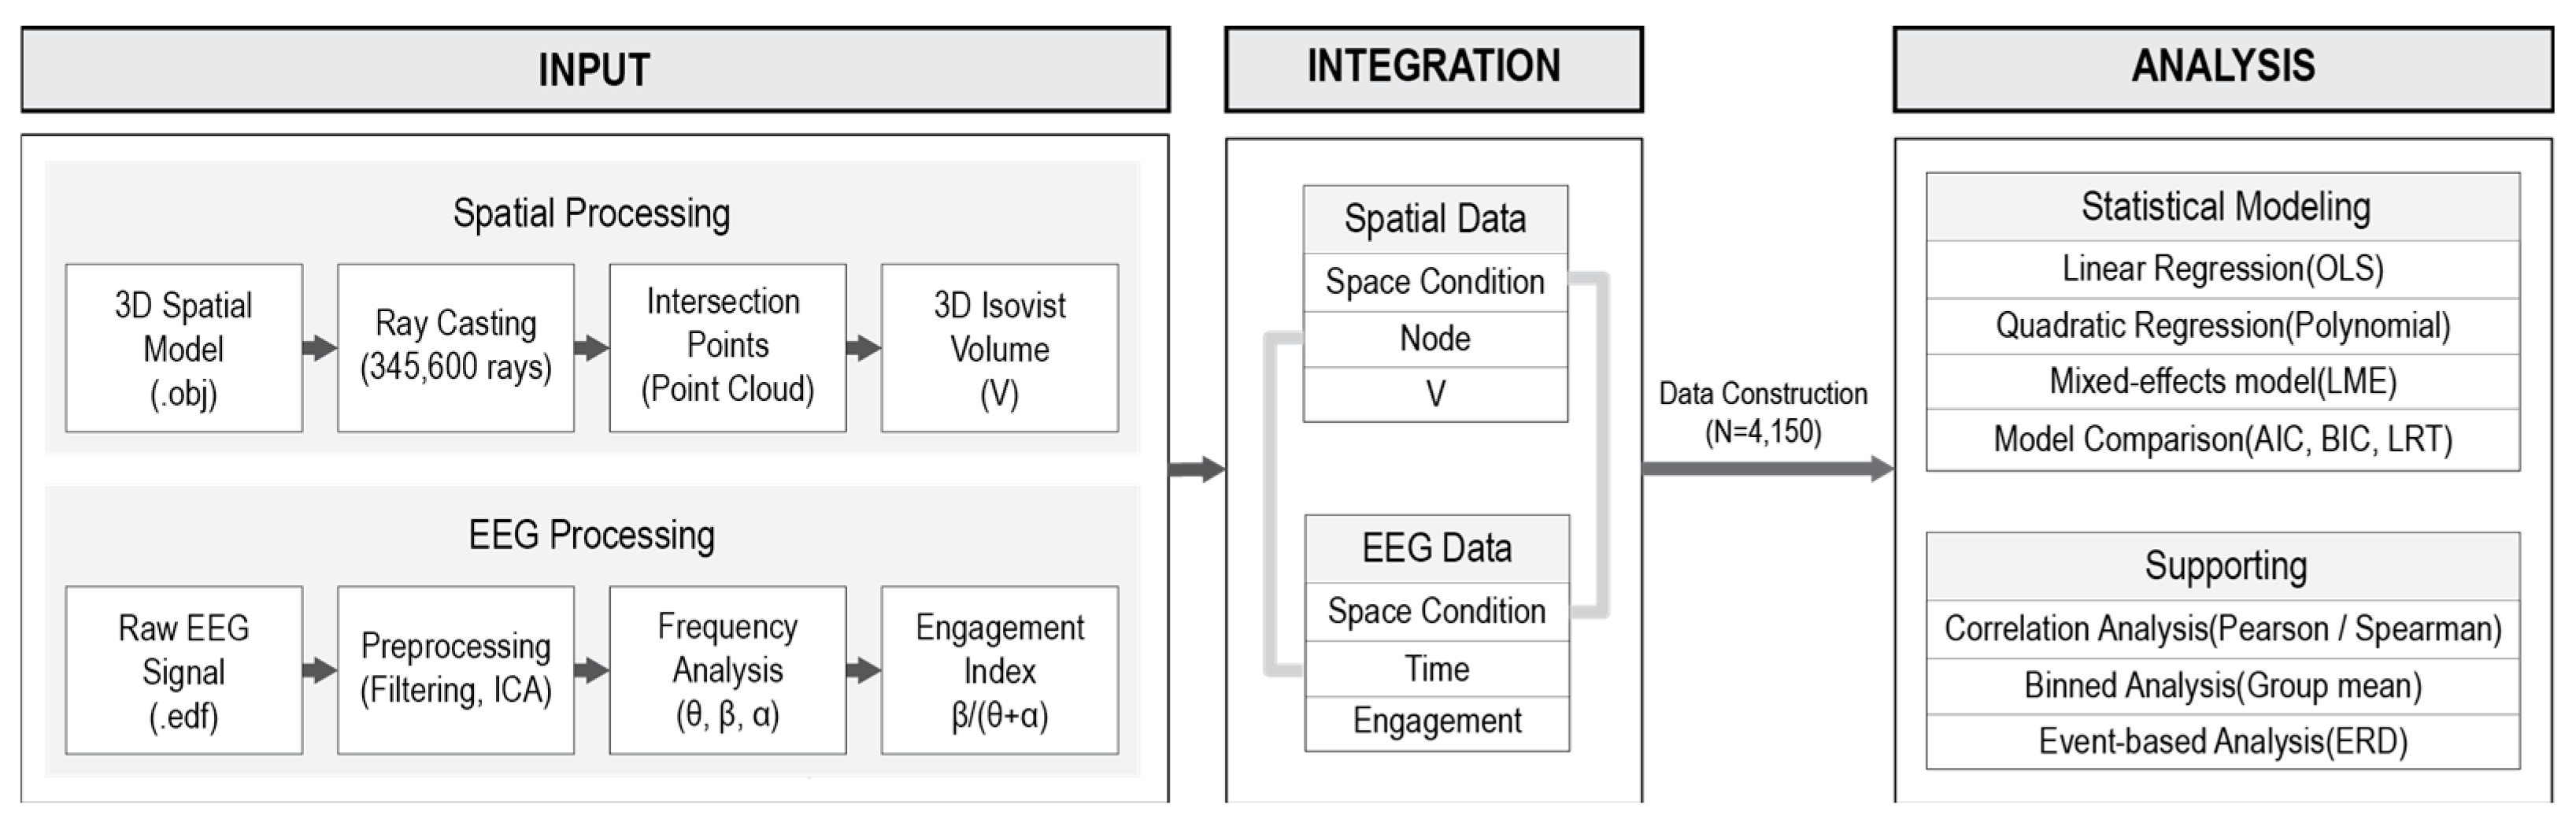
Figure 1 presents the conceptual model, from which the following hypotheses are derived:
Spatial openness has a significant effect on cognitive engagement.
The relationship between spatial openness and cognitive engagement is nonlinear, with engagement peaking at intermediate levels of openness.
3. Materials and Methods
3.1. Experimental Design
3.1.1. Participants
We recruited twenty-six adults. Sample sizes of 20–40 are generally considered adequate for EEG-based research, and we determined the present sample through statistical power analyses conducted with G*Power (version 3.1.9.7) based on effect sizes reported in the seminal literature [
39]. All participants had normal or corrected-to-normal vision and reported no neurological or psychiatric history. These criteria minimise physiological variability during EEG recording and ensure the reliability of cognitive responses.
Prior to the experiment, all participants received an explanation of the research objectives and procedures and provided written informed consent. The study was approved by the Institutional Review Board (IRB) of Hanyang University (Approval No.: HYUIRB-202511-022, 24 November 2025).
3.1.2. Equipment
We conducted the experiment in a controlled laboratory environment to minimise extraneous environmental factors [
40,
41]. We configured the experimental space for consistent lighting, acoustic, and thermal conditions, minimising visual and auditory interference beyond the VR stimuli.
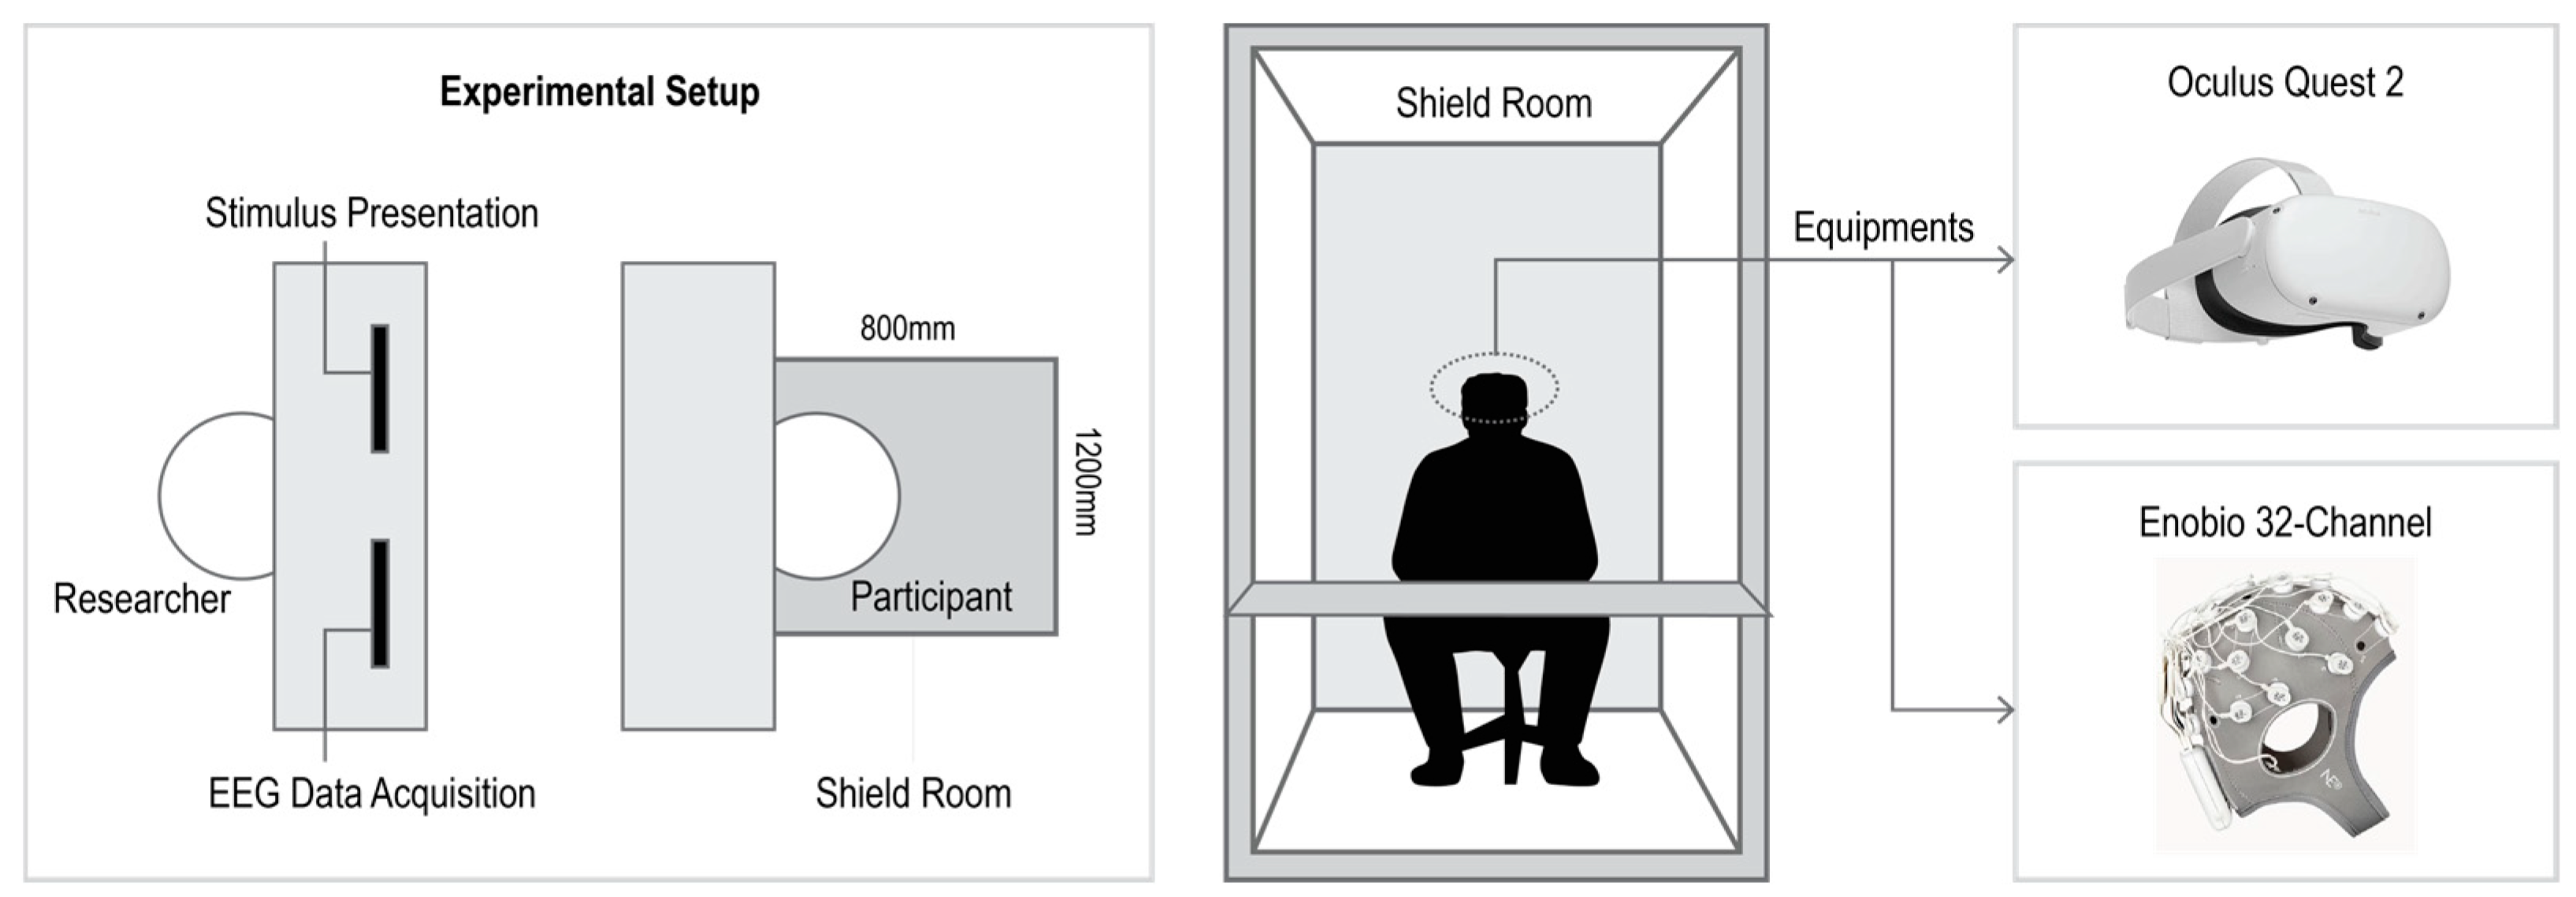
EEG signals were recorded using the Enobio wireless EEG system (Neuroelectrics, Barcelona, Spain). Electrodes were positioned following the international 10–20 placement system, and brain activity was continuously recorded throughout the experiment. The acquired data was subsequently used for offline analysis. Spatial stimuli were delivered through the Oculus Quest 2 (Meta Platforms, Inc., Menlo Park, CA, USA), a head-mounted display (HMD) device for visual experience of virtual architectural spaces. The apparatus presented spatial structure and openness under controlled conditions [
5,
40].
Figure 2 illustrates the experimental setup and equipment.
3.1.3. Procedure
We selected an exhibition space as the experimental stimulus. Exhibition spaces are environments in which voluntary exploration and visual information processing are central and are recognised as spatial typologies that simultaneously demand attentional focus and exploratory behaviour [
25]. The viewer’s visual field changes continuously along the viewing path, providing stimulation that combines diverse spatial elements. These characteristics make exhibition spaces well suited to systematically presenting varying levels of openness and analysing the corresponding cognitive responses [
25].
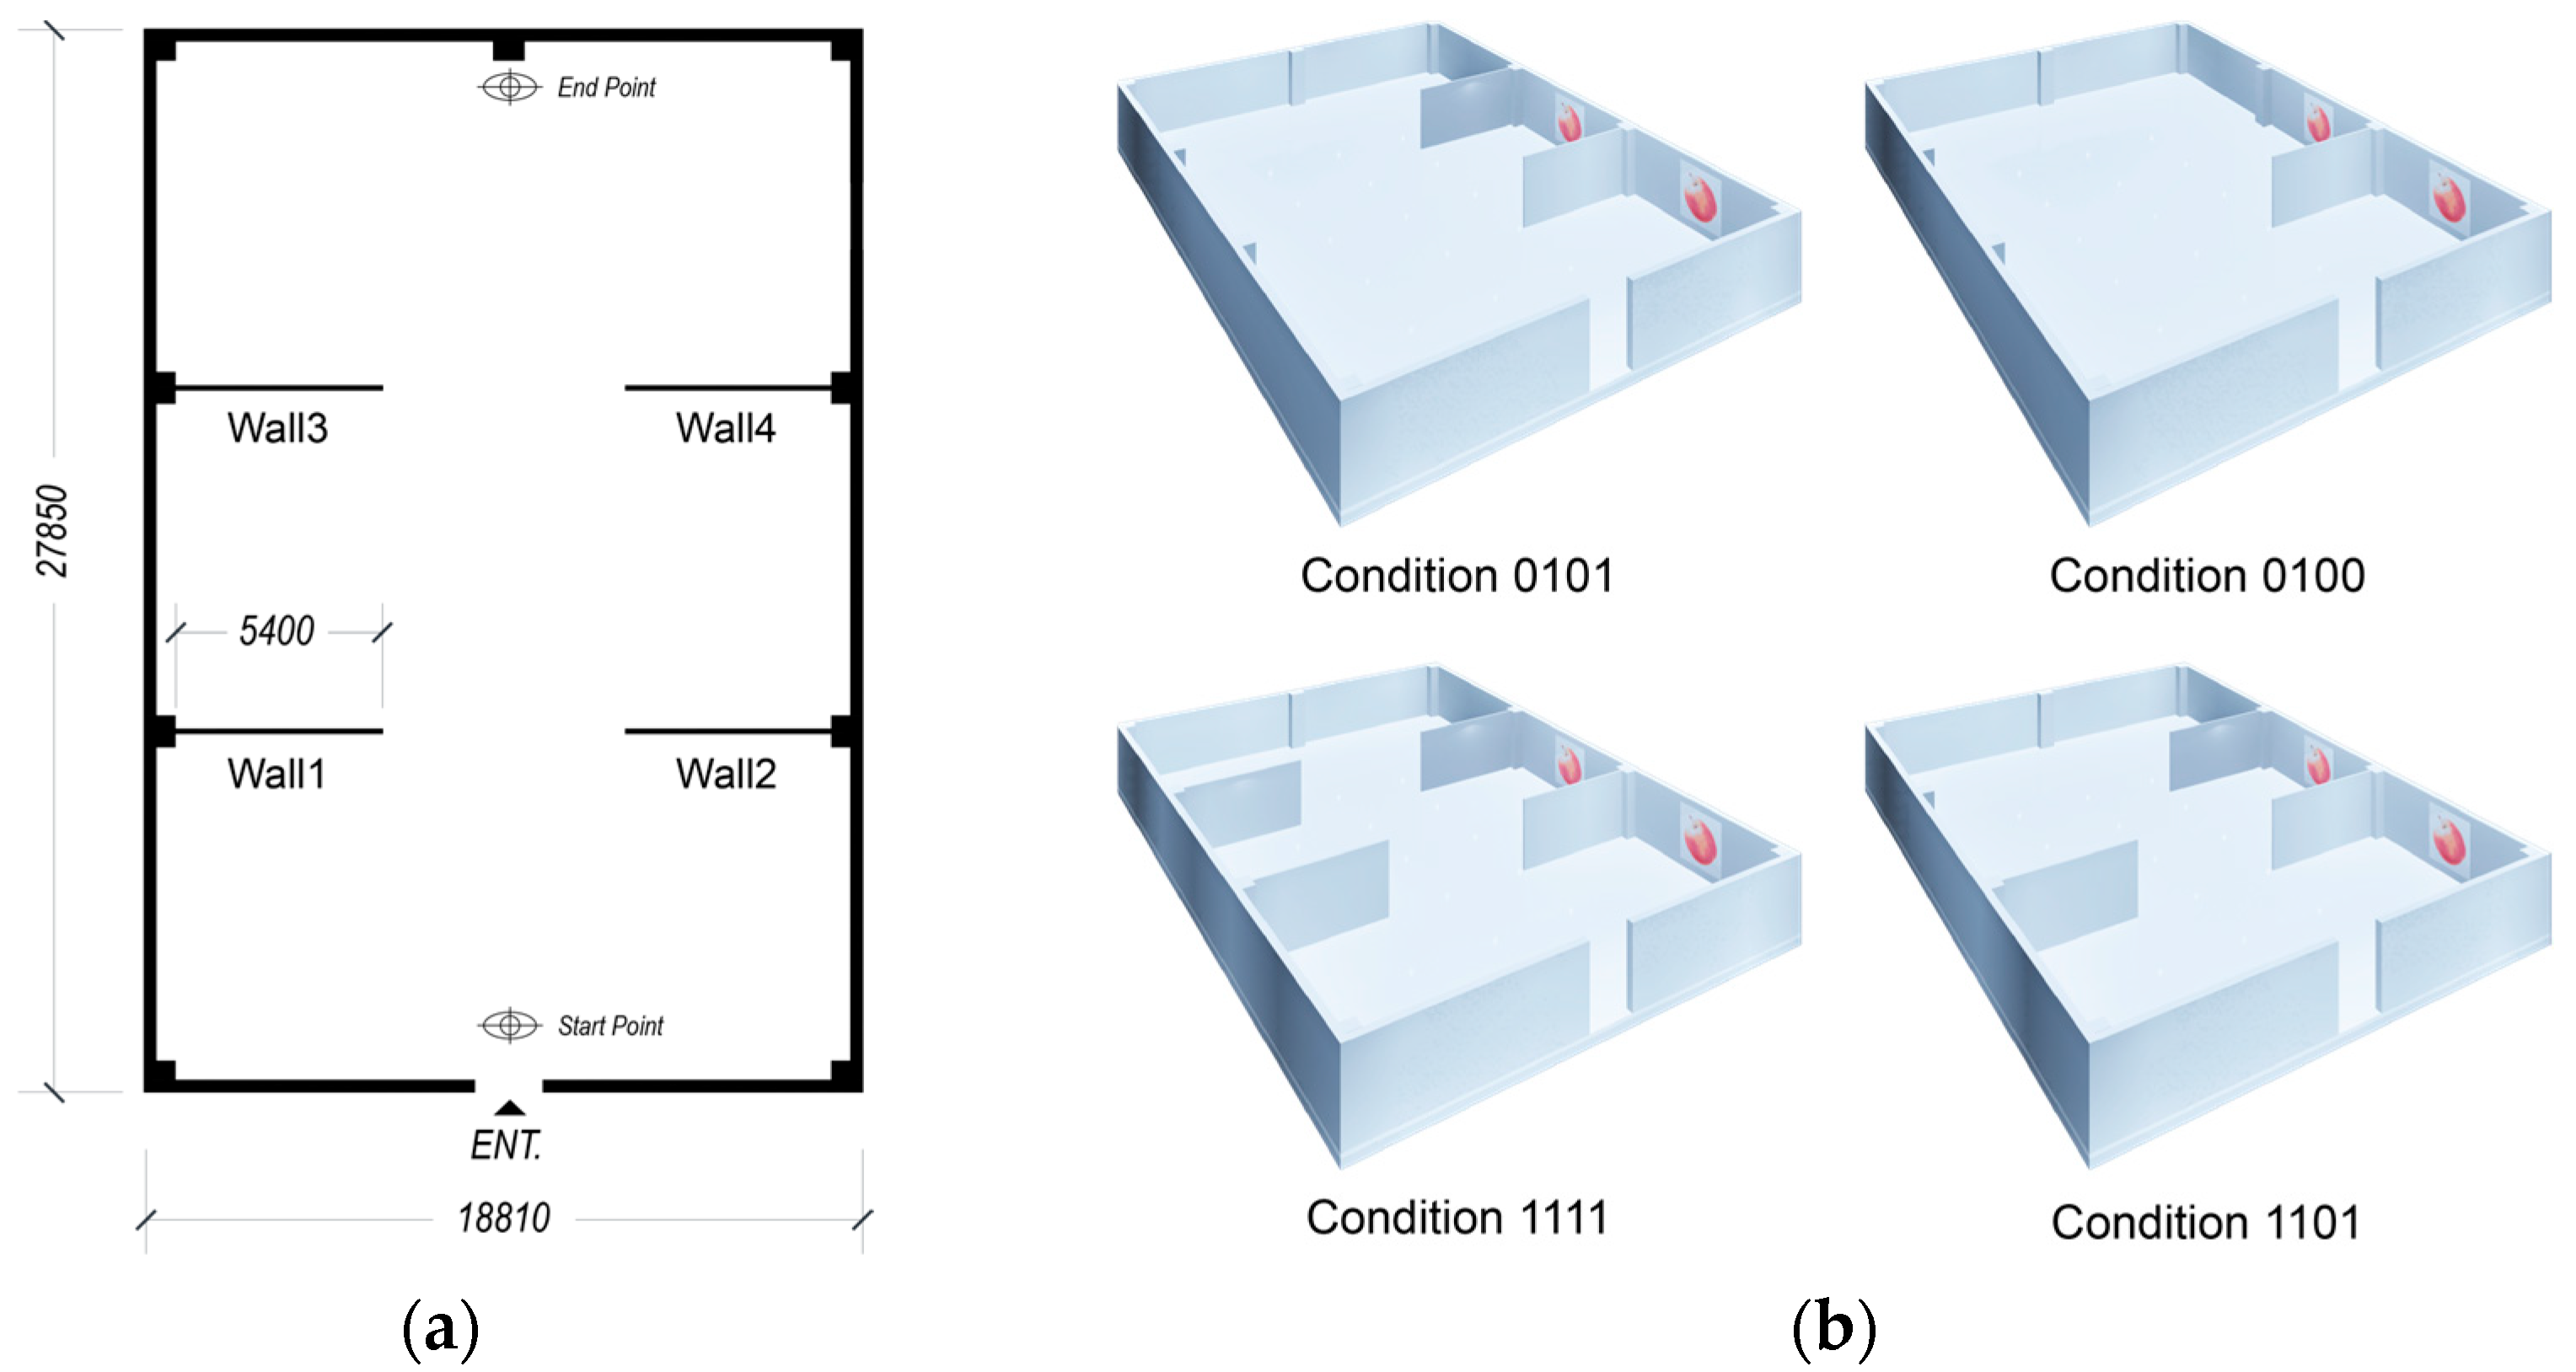
The experimental stimuli comprised virtual environments modelled in three dimensions based on the Gallery H exhibition space. Spatial conditions were configured by defining the open or closed state of four boundary walls (Walls 1–4) as binary variables (0/1), generating 16 spatial conditions (2
4) in total.
Table 4 and
Figure 3 present the configuration and representative examples. As
Figure 3b shows, spatial openness was systematically varied by modifying only the open or closed state of the walls, whilst the underlying geometry was kept identical.
The 16 conditions were organised into four sets, with conditions arranged so that spatially similar ones were not presented consecutively.
Table 4 summarises this configuration.
Each set comprised four spatial conditions, each presented for 30 s and followed by a 15-s rest interval. Conditions were arranged using randomisation and counterbalancing to minimise order effects. The total experimental duration was approximately 16 min. About one minute of baseline EEG was recorded before the experiment began, after which participants sequentially experienced the different spatial conditions. Within each 30-s condition, the viewpoint advanced automatically along the pre-scripted path at constant velocity, without acceleration, deceleration, or pauses. Accordingly, every 3-s temporal window maps onto an equal-length spatial segment, providing a deterministic basis for the node-based pairing detailed in
Section 3.4.1.
EEG signals were continuously recorded and stored alongside temporal and positional information from the virtual space. In the analysis phase, EEG data and spatial information were aligned based on observation points.
Figure 4 presents the complete experimental procedure.
3.2. Spatial Openness Quantification
Spatial openness is defined here as the three-dimensional isovist volume (hereafter, openness). To quantify spatial variation in openness, a node-based approach was adopted: each space was decomposed into multiple observation nodes, and visual exposure was calculated at each. We define ten observation nodes per spatial condition, evenly spaced along the pre-scripted walkthrough path. The number was fixed at ten so that each node corresponds to a 3-s segment of the 30-s exposure, yielding a one-to-one mapping between spatial sampling and temporal EEG windowing (
Section 3.4.1). Nodes were positioned at average eye height, consistent with established practice in architectural visibility studies [
9,
14].
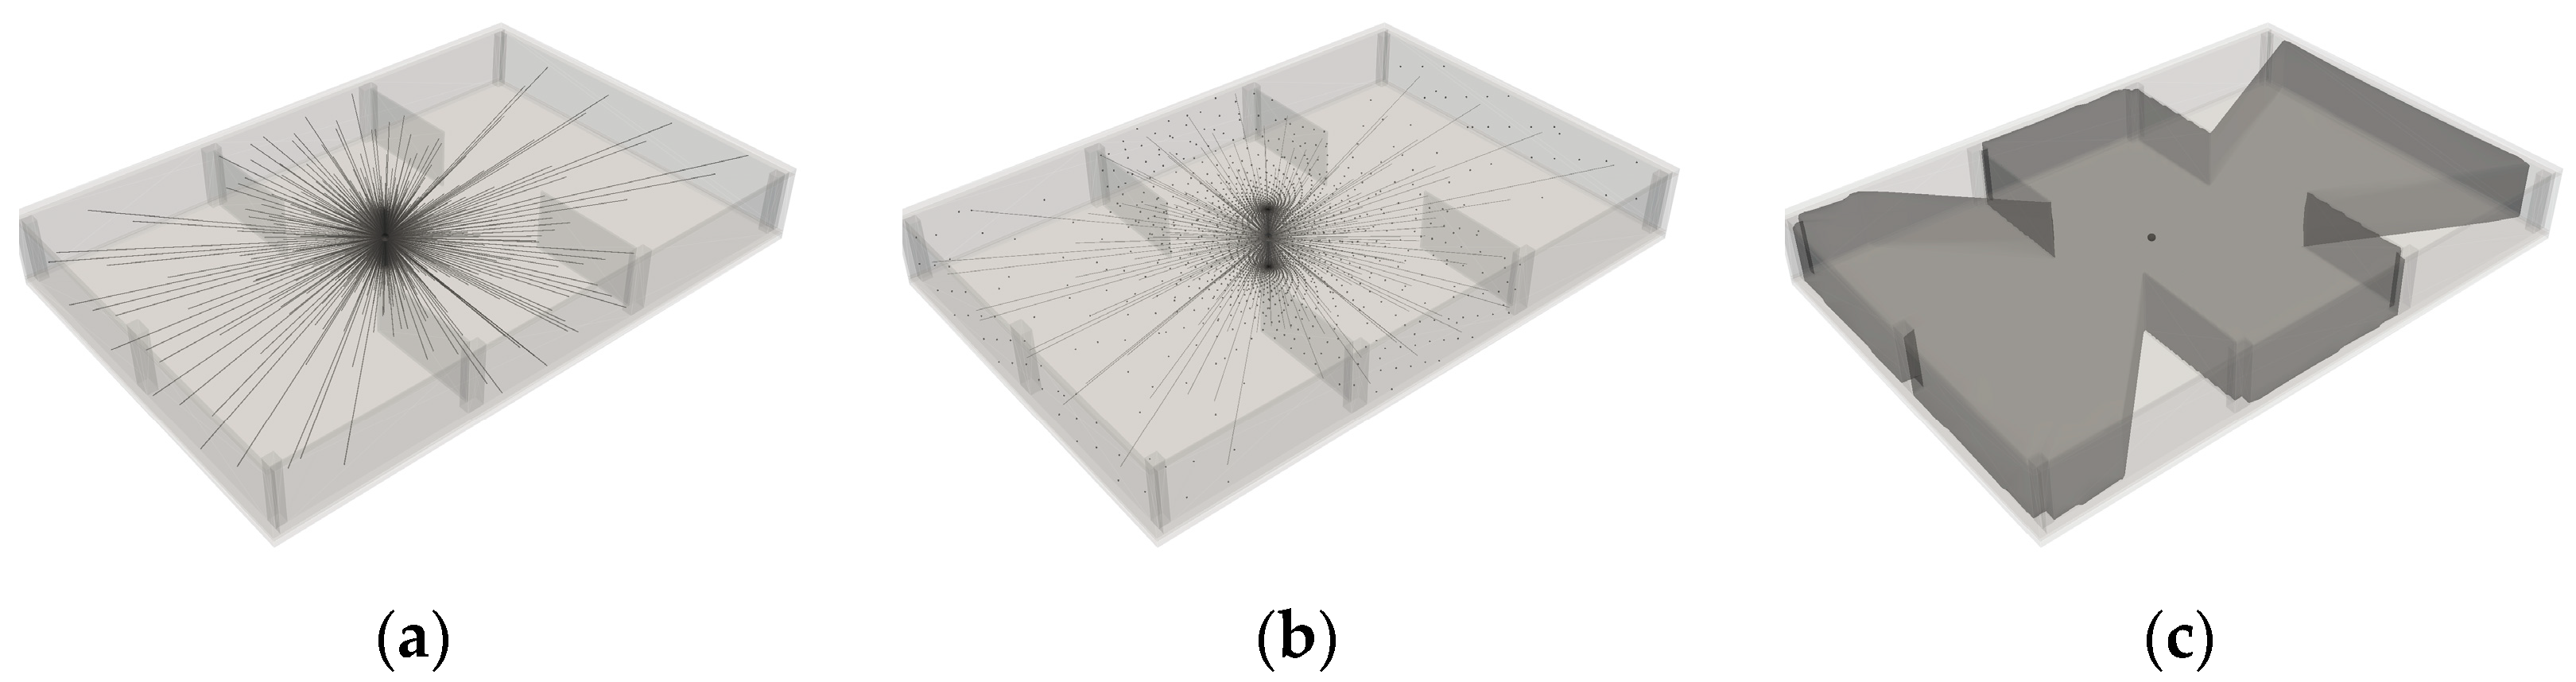
Openness at each node was computed from the three-dimensional visible region. High-density ray casting-based 3D visibility estimation was applied: rays were emitted from each node in all directions (azimuth 360°, elevation −90° to +90°) to sample the visible region. A total of 345,600 rays were employed to approximate the visual field at high resolution; each traced to the first intersection with the surrounding geometry. From this set of intersection points, the visible space was reconstructed as a three-dimensional closed surface mesh. The volume of the reconstructed mesh was then computed through surface integration based on the divergence theorem:
3D isovist volume thus represents the level of visual exposure at a given observation point. Larger volumes indicate a broader range of visually accessible space, corresponding to higher openness. We acknowledge that 3D isovist volume captures the quantity of visible space but not qualitative properties such as directional anisotropy, vertical-horizontal balance, or compactness. Yet volumetric openness has been validated as a practical and perceptually meaningful metric for built-up environments [
9], and we adopt it here as a tractable first-order approximation of spatial openness.
The computation was implemented as a custom Python (version 3.11) pipeline, encompassing high-density ray sampling, intersection-based mesh reconstruction, mesh cleaning, and post-processing. These steps ensure consistent computation of 3D isovist volume at each node.
Figure 5 illustrates the complete process schematically.
3.3. EEG Data Processing and Analysis
EEG data were processed through standardised preprocessing and frequency analysis to enable quantitative analysis of engagement. The pipeline removes signal noise and reliably estimates cognitive states through frequency band-based metrics.
3.3.1. Preprocessing
Raw EEG data were filtered using a 1–30 Hz bandpass filter and a 60 Hz notch filter to remove low-frequency drift and power line noise. Average referencing was then applied, and the data were resampled at 250 Hz. Independent Component Analysis (ICA), implemented in MNE-Python [
42], was applied to remove ocular- and muscle-related artifacts; the algorithm automatically identified the corresponding components. Visual inspection then confirmed and removed any residual artifactual components.
The preprocessed signals were segmented into non-overlapping 3-s windows to ensure temporal stability and reliable frequency analysis. Window lengths of 1 to 5 s are typical in EEG frequency analysis, reflecting a balance between temporal and frequency resolution [
23,
30]. Preliminary analyses comparing 1-, 3-, and 5-s windows showed that 3-s windows yielded the most reliable distinction of neural responses across conditions whilst preserving adequate frequency resolution for the alpha band (8–13 Hz). The 3-s duration also exceeds typical visual-to-frontal processing latencies (300–1000 ms). We therefore adopted this duration, yielding ten 3-s segments per 30-s condition that align directly with the ten spatial nodes.
Following ICA-based artifact removal, no further amplitude-based segment rejection was applied, consistent with recent practice in naturalistic EEG paradigms employing continuous frequency-band analyses [
43,
44]. Segments were excluded only when the underlying recording was shorter than the required analysis window. Of 4160 theoretical observations (26 participants × 16 conditions × 10 time-windows), 10 were excluded for one participant’s single condition. All 26 participants were retained, yielding a final dataset of 4150 observations (99.76% of the theoretical maximum).
Power spectral density (PSD) was calculated for each segment using Welch’s method, and power values were extracted for the theta (4–8 Hz), alpha (8–13 Hz), and beta (13–30 Hz) bands.
The analysis focused on the Frontal ROI (F3, F4, Fz). Frontal regions are consistently associated with attentional control and engagement processing in EEG studies, particularly for the β/(θ + α) ratio [
21,
45]. Posterior and parietal regions are implicated in visual processing and spatial perception, and they may carry information complementary to the frontal engagement index in an architectural context. We therefore identify a systematic comparison of frontal, parietal, and occipital ROIs as a priority for future work.
3.3.2. EEG-Based Engagement Index
To quantitatively assess cognitive states across spatial conditions, an EEG index based on inter-frequency band ratios was employed. Relative ratios between bands reflect cognitive states more robustly than single bands alone [
20,
21]. The following engagement index served as the primary analytical variable:
This index captures the relative balance between task-related neural activity and background activity and indicates the extent of cognitive resource allocation to external tasks.
Although first validated by Pope et al. (1995) [
21] and Mikulka et al. (2002) [
20] for vigilance and operator engagement during automated tasks, the β/(θ + α) ratio has since been applied beyond active-task paradigms. Dan and Reiner [
46] used the index to assess cognitive load during the processing of 3D virtual environments. Ishtiaque et al. [
47] reported significant correlations between frontal β/(α + θ) ratios and self-reported engagement under dynamic visual stimulus exposure, with the strongest associations at frontal–prefrontal sites. Most directly relevant, Gerner et al. [
48] applied the frontocentral β/(α + θ) ratio to architecturally designed indoor environments and showed that it distinguishes cognitive states (rest vs. task) and yields more pronounced contrasts in nature-inspired than in urban-inspired conditions. We accordingly adopt β/(θ + α) at frontal sites as the index for the present architectural–spatial paradigm.
3.3.3. Event-Related Desynchronization (ERD) Analysis
To corroborate the primary engagement-index findings, Event-Related Desynchronisation (ERD) was computed as a supplementary analysis of neural responses to changes in spatial openness. ERD quantifies the reduction in frequency-band synchronisation relative to a specific event [
49].
ERD was calculated for the theta, alpha, and beta bands. Power changes in each band were computed as relative differences from a pre-event baseline. ERD values were derived from EEG signals aligned to the event onset and used to analyse neural responses before and after openness transitions. This analysis complements the primary findings based on the engagement index.
3.4. Data Integration Framework
A hierarchical data structure was constructed to integrate openness and EEG-based cognitive responses within a unified framework. The data forms a multi-level structure of subject, spatial condition, observation node, and time window, with repeated measurements at each level. The complete dataset comprises 26 participants, 16 spatial conditions, 10 observation nodes per condition, and 10 temporal segments per condition, yielding approximately 4150 observations.
Table 5 summarises this hierarchical structure.
3.4.1. Node-Based Pairing
We ensured spatial–EEG alignment by experimental design rather than post hoc position tracking. The virtual walkthrough followed a fixed, pre-scripted path divided into ten equal segments of exactly three seconds, each segment corresponding to one pre-defined observation node. Node positions and segment boundaries were established prior to data collection.
The viewpoint moved at constant velocity along the path, without acceleration or deceleration, so that each 3-s temporal window maps onto an equal-length spatial segment. EEG recording was initiated simultaneously with VR stimulus onset by manual triggering at the start of each trial. Hardware-precision triggering was not employed; however, the 30-s exposure and 3-s analysis windows tolerate the sub-second alignment errors typical of manual synchronisation, which fall well below the temporal resolution of frequency-band analysis. Similar manual synchronisation has been used in recent VR-EEG architectural studies employing window-based spectral analysis [
40,
41].
The implications of this manual synchronisation differ across the two analysis streams. For the primary engagement-index analysis, Welch’s method averages spectral power within 3-s windows; sub-second timing errors are short relative to the window length and are unlikely to affect band-power estimates.
For the supplementary event-based ERD analysis (
Section 3.3.3), onset alignment is more critical. However, the ERD epochs span −2 to +4 s around each event and compare pre-, at-event, and post-event phases at the second scale rather than estimating sub-second latency or trial-level amplitudes. The phase-level comparisons reported in
Section 4.5 are therefore robust to the timing errors involved. Accordingly, we interpret the ERD findings as evidence of the direction of neural response to openness transitions, not as precise latency estimates. We treat the ERD analysis as corroborative rather than confirmatory evidence (see
Section 5.1) and identify hardware-precision triggering as a methodological priority for future work on single-trial neural dynamics.
The openness value at the midpoint of each path segment was assigned as the representative spatial stimulus for the corresponding 3-s EEG window. The midpoint minimises the maximum temporal–spatial distance to any moment within the segment; because the camera moved at constant velocity, within-segment variation in openness was constrained, supporting the adequacy of midpoint-based approximation.
3.4.2. Dataset Structure
Through node-based matching, each observation contains openness and engagement values within a single temporal segment. The final dataset is organised as a multi-level structure incorporating participant, spatial condition, observation node, and temporal segment information. Each observation directly pairs spatial stimuli with cognitive responses at a specific point in time. The structure accommodates repeated measurements within the same participant and reflects variation across conditions, nodes, and segments simultaneously.
3.5. Statistical Analysis
A range of statistical analyses, encompassing both linear and nonlinear models, was conducted to examine the relationship between openness and EEG-based cognitive engagement. All analyses used the dataset at node level, with interpretation accounting for the repeated-measures structure.
3.5.1. Regression Modeling
EEG data were segmented into 3-s temporal windows, and engagement values from each window served as the unit of observation. Linear and nonlinear regression models were compared to examine the relationship between openness and engagement. This approach follows the theoretical assumption discussed in
Section 2.4: that the relationship may follow an inverted U-shaped structure. The relationship between openness and EEG-based engagement was examined through a hierarchy of mixed-effects models. We first fitted a linear model:
We then introduced a quadratic term to analyse the curvilinear form:
We additionally fitted an autocorrelation-corrected model to address potential clustering arising when the same participant views the same spatial condition:
where
represents subject-level random effects (
~ N (0, σ
2_subject)) and
represents subject-by-condition random effects (
~ N (0, σ
2_subject: condition)).
The quadratic term tests for nonlinear changes in cognitive response as a function of openness. The sign and significance of the quadratic coefficient indicate the shape of the relationship (e.g., inverted U). We fitted all models with the lme4 package in R and compared them by AIC, BIC, and likelihood ratio tests. We computed marginal and conditional R
2 values following Nakagawa and Schielzeth [
50]. All analyses were conducted at the observation level (
n = 4150).
Two robustness checks assess the stability of the nonlinear pattern. First, the quadratic model was fitted separately for each participant, evaluating consistency at the individual level. Second, openness was decomposed into between-condition (condition-level means) and within-condition (node-level deviations from condition means) components, allowing the inverted-U relationship to be tested separately across spatial configurations and across nodes within the same configuration.
3.5.2. Event-Based Analysis Procedure
An event-based EEG analysis was conducted as a supplementary procedure. It tests whether the nonlinear openness–engagement relationship is also evident in neural response patterns over time.
Openness was measured at regular temporal intervals, and events were defined by the magnitude of change between adjacent segments (Δopenness). Positive changes were classified as opening events, negative changes as closing events, and negligible changes as stable states.
Each event time point was defined as the centre of the corresponding segment, and EEG data were aligned to these time points. Epochs spanning −2 to +4 s around each event were constructed, and only those falling entirely within the EEG data were retained.
In the event-based analysis, ERD metrics were employed. EEG signals aligned to event onset were first averaged at the participant level and subsequently aggregated at the group level. Additionally, we fitted a linear mixed-effects model incorporating event type (opening, closing, stable) and temporal factors to quantitatively evaluate differences in EEG responses.
4. Results
4.1. Basic Relationship Between Openness and EEG
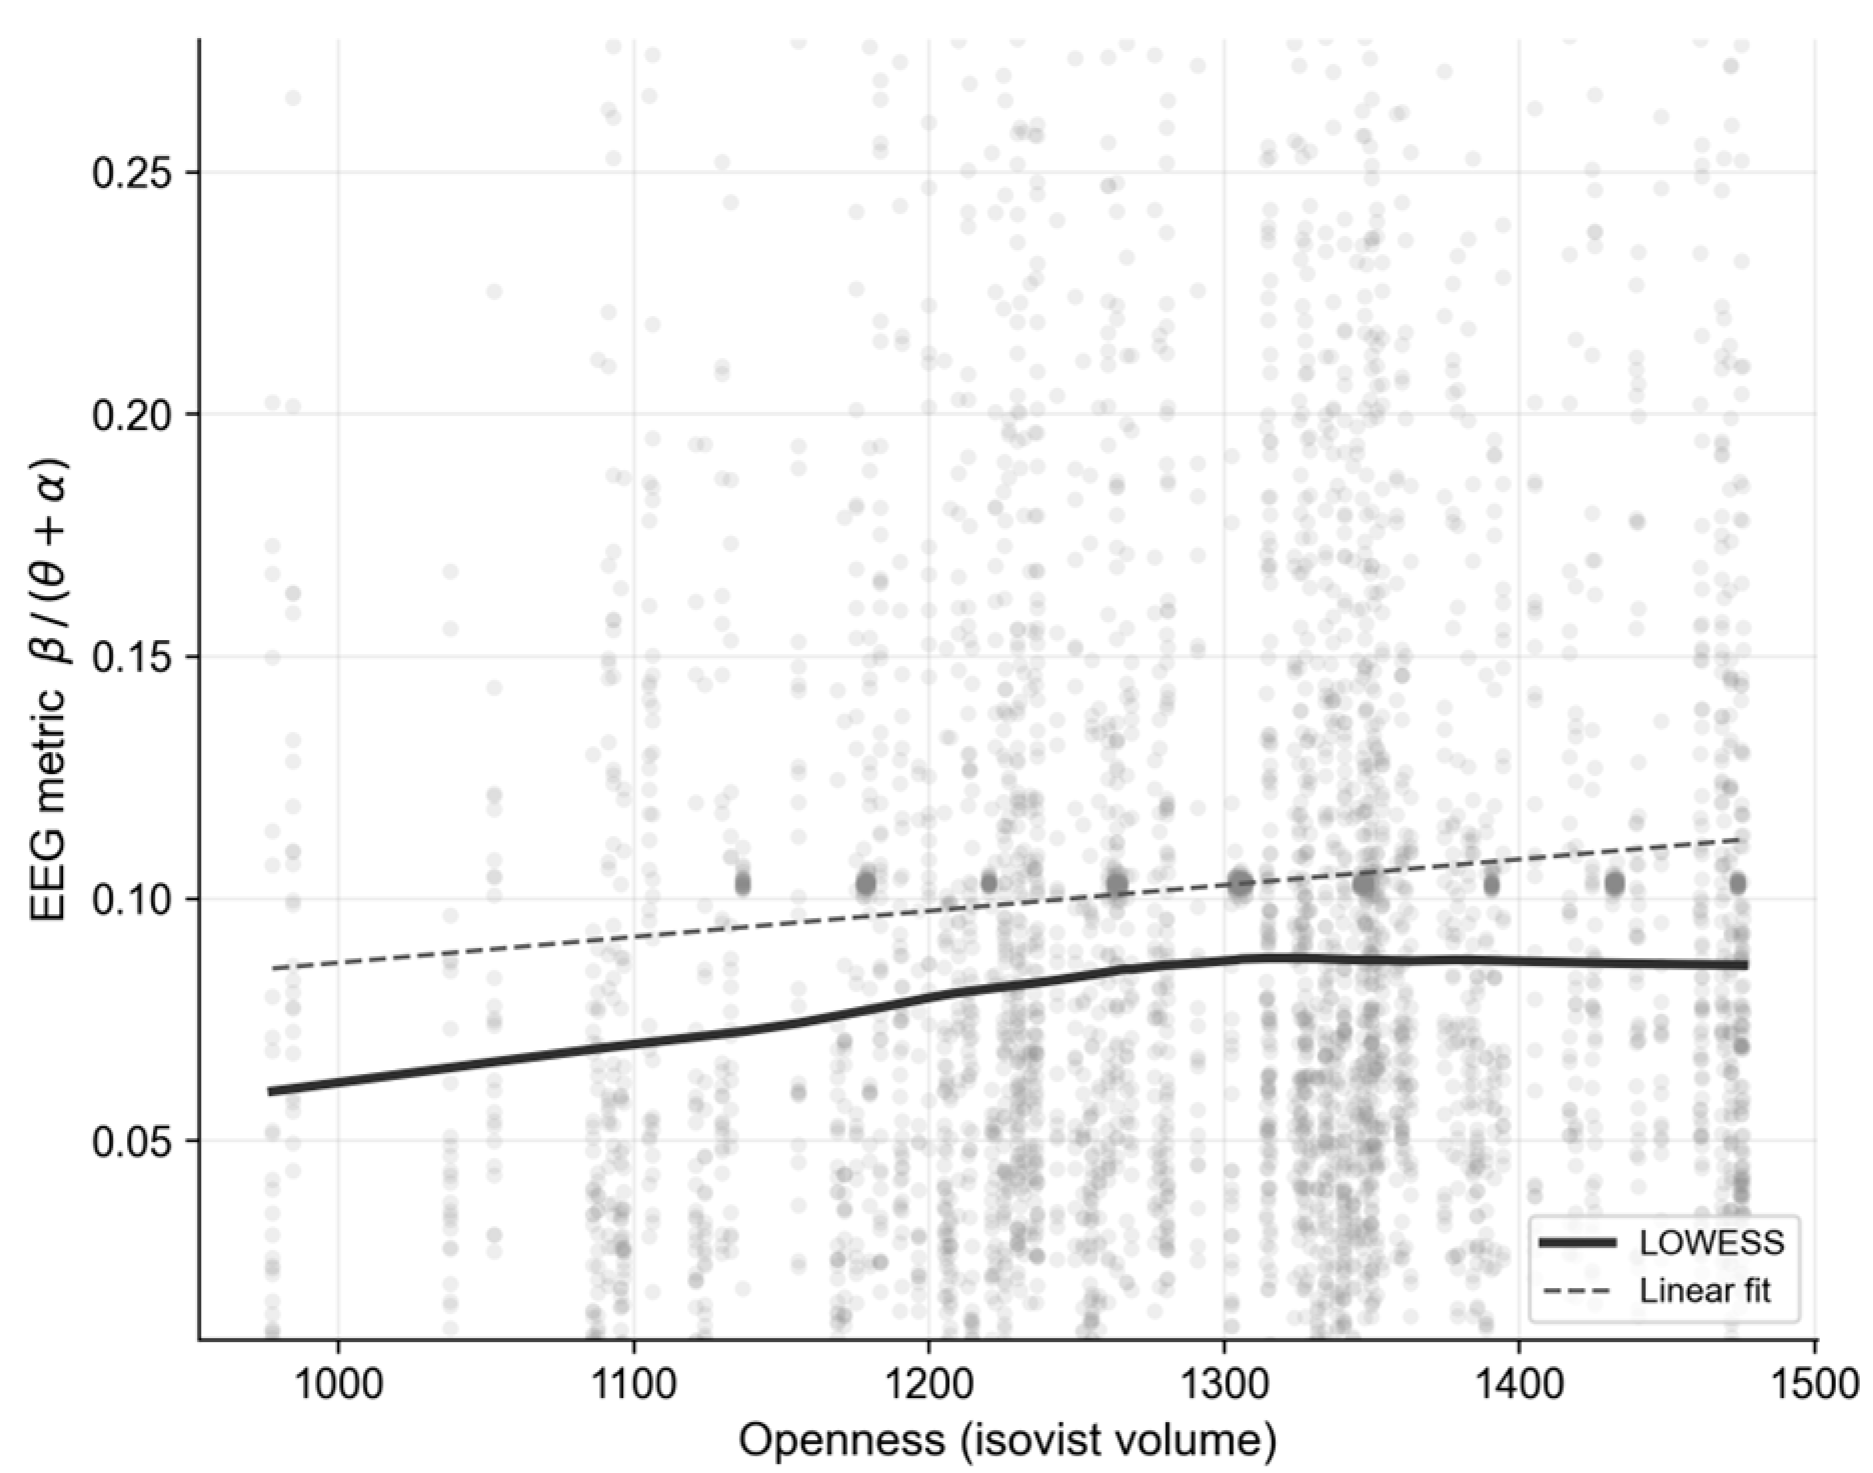
Visual inspection of the openness and engagement relationship (
Figure 6) suggested a non-monotonic rather than linear pattern. The LOWESS fit indicated that engagement was lower at the extremes of the openness range and higher at intermediate levels, motivating the formal comparison of linear and quadratic mixed-effects specifications presented in
Section 4.2. All formal inference rests on the mixed-effects framework described in
Section 3.5.
4.2. Nonlinear Relationship: Evidence of an Inverted-U Pattern
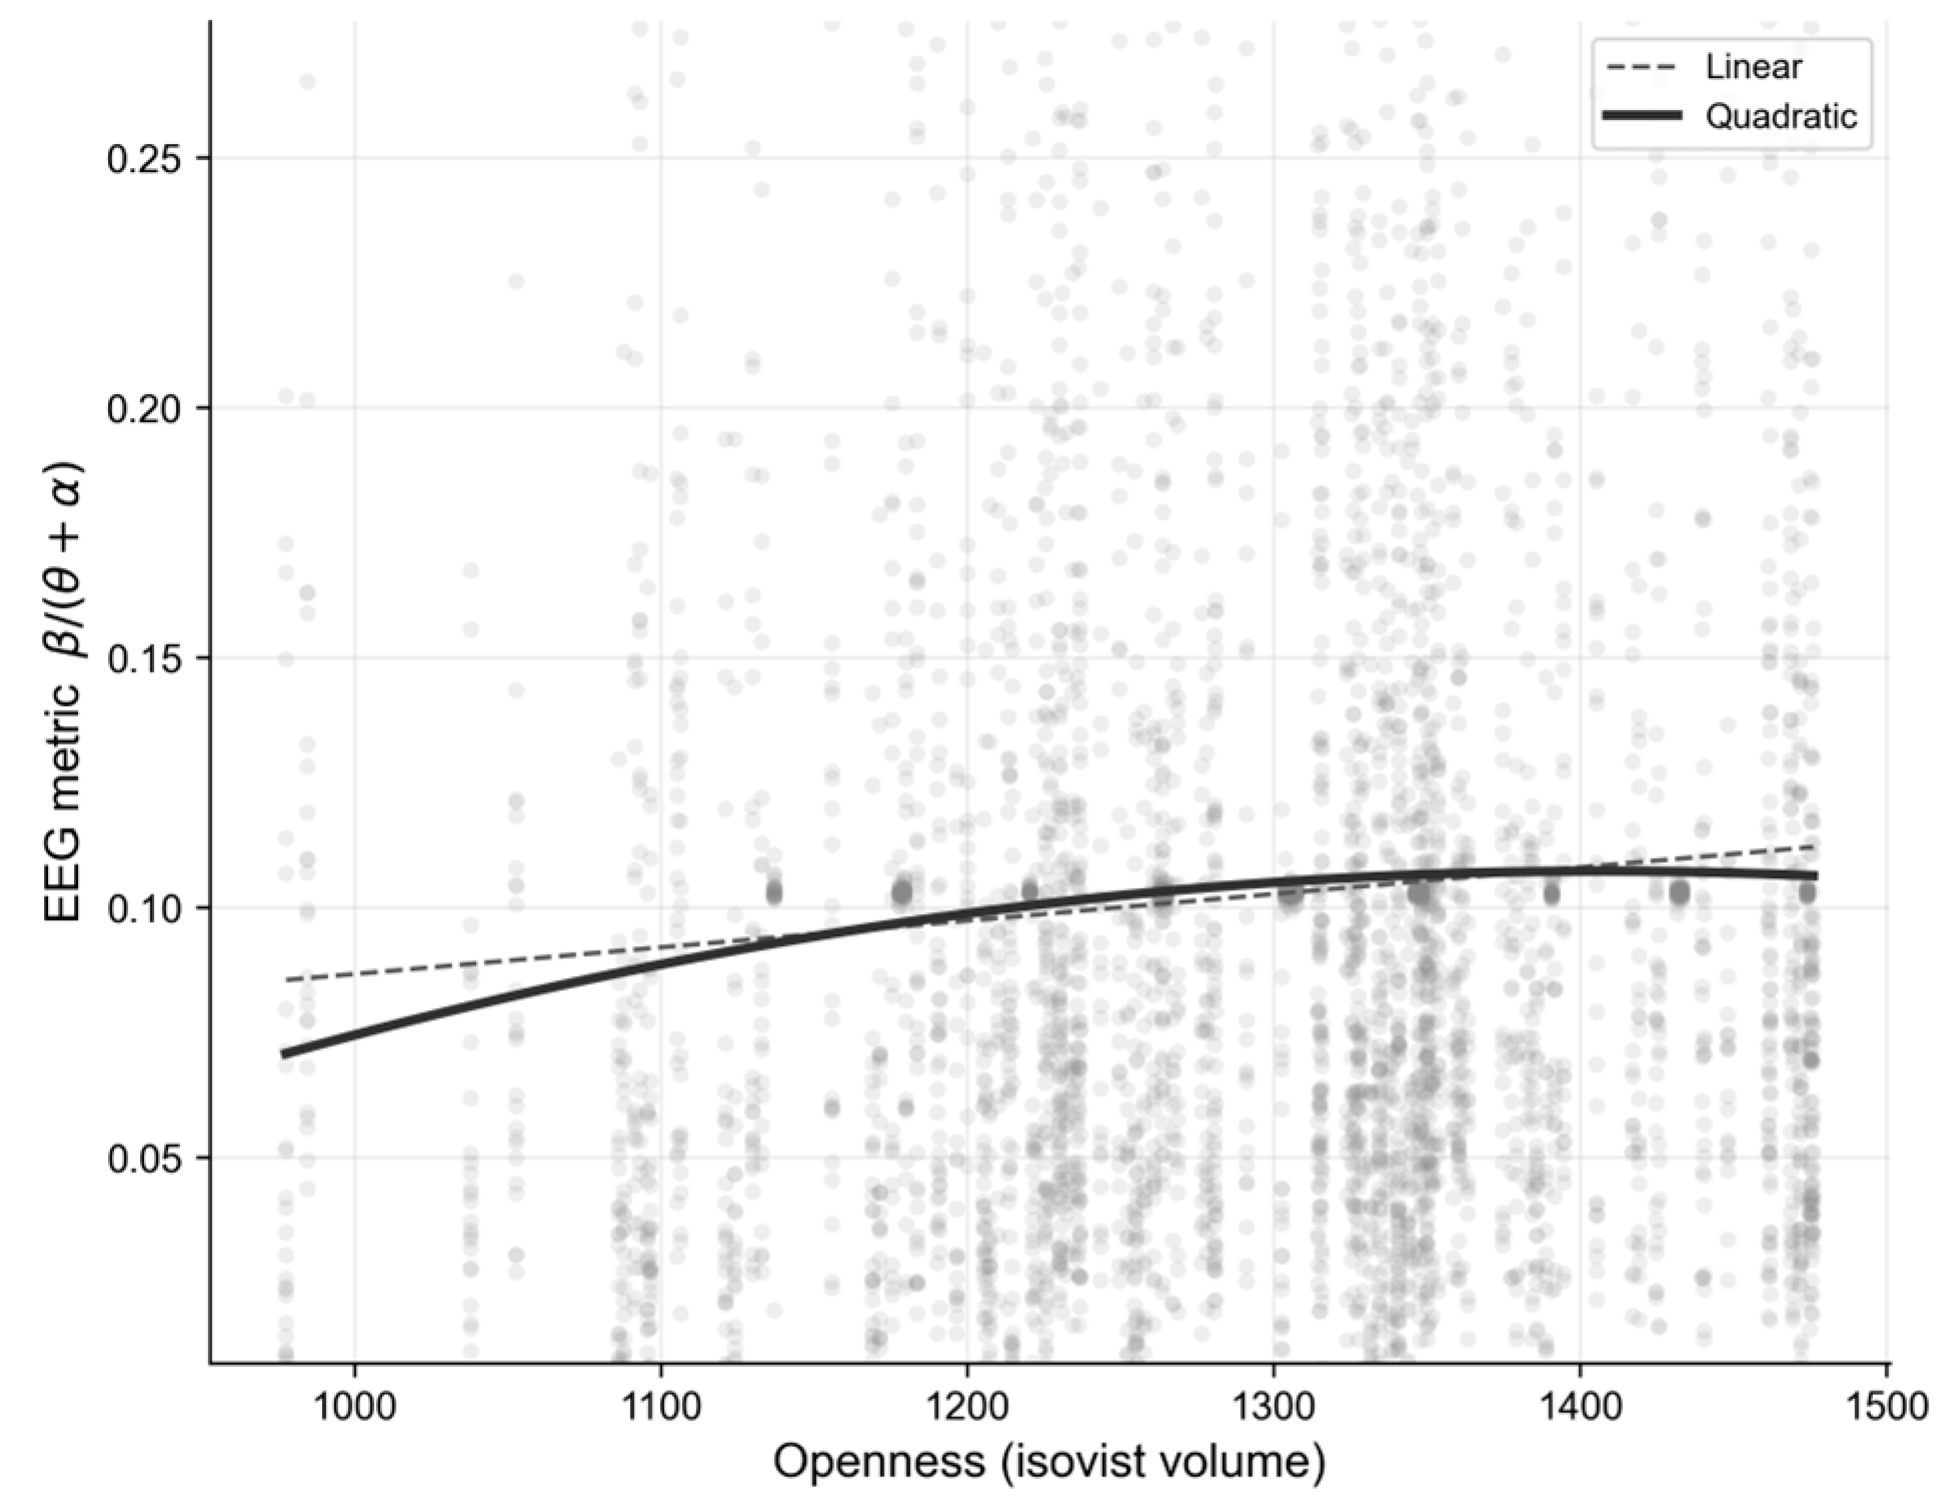
To examine the nonlinear form of the openness and engagement relationship, we fitted and compared linear and quadratic mixed-effects models. The quadratic coefficient was negative and statistically significant (β = −0.0044, SE = 0.0010,
p < 0.001), indicating an inverted-U pattern in which engagement first rises and then falls as openness increases (
Figure 7). The likelihood ratio test confirmed that the quadratic model fitted the data significantly better than the linear (χ
2(1) = 19.13,
p = 1.2 × 10
−5), supported by a lower AIC (linear: −9511.3; quadratic: −9515.9).
Table 6 summarises the comparison.
The marginal R
2 of the quadratic model was 0.020, indicating that openness explains approximately 2.0% of the variance in engagement after accounting for individual differences (conditional R
2 = 0.105). The incremental contribution of the quadratic term was small (ΔR
2 = 0.0041; Cohen’s f
2 = 0.0042). Such explanatory power is typical of naturalistic EEG studies mapping a single geometric stimulus dimension onto a frequency-band index. EEG-derived ratio indices carry substantial inter- and intra-individual variability, which inherently constrains the variance attributable to any single environmental predictor [
30]. The substantive question is therefore not the absolute size of the effect but its consistency and replicability, both of which are addressed in
Section 4.3 and
Section 4.4.
Taken together, these findings support the conclusion that the openness and engagement relationship is nonlinear, with engagement maximised at intermediate openness.
4.3. Autocorrelation Correction
To address potential concerns regarding sample-size inflation given the large number of node-level observations (n = 4150), we additionally fitted a model with nested random effects accounting for the clustering of observations within the same participant viewing the same spatial condition.
The results confirmed a non-trivial level of clustering, with 8.2% of total variance attributable to between-subject differences and 7.8% to subject-by-condition variation. After this correction, the quadratic coefficient remained negative and significant (β = −0.0039, SE = 0.0011,
p = 3.4 × 10
−4, 95% CI [−0.0060, −0.0017]). Marginal R
2 rose from 0.016 in the linear specification to 0.020 in the quadratic, and to 0.034 once nested random effects were introduced; conditional R
2 rose correspondingly from 0.101 to 0.105 to 0.188 (
Table 7). Hence the inverted-U pattern is robust to autocorrelation correction.
4.4. Consistency Across Subjects and Space
Although the absolute effect size is small (
Section 4.2), the consistency of the inverted-U pattern across individual participants provides stronger evidence of replicability than the group-level coefficient alone.
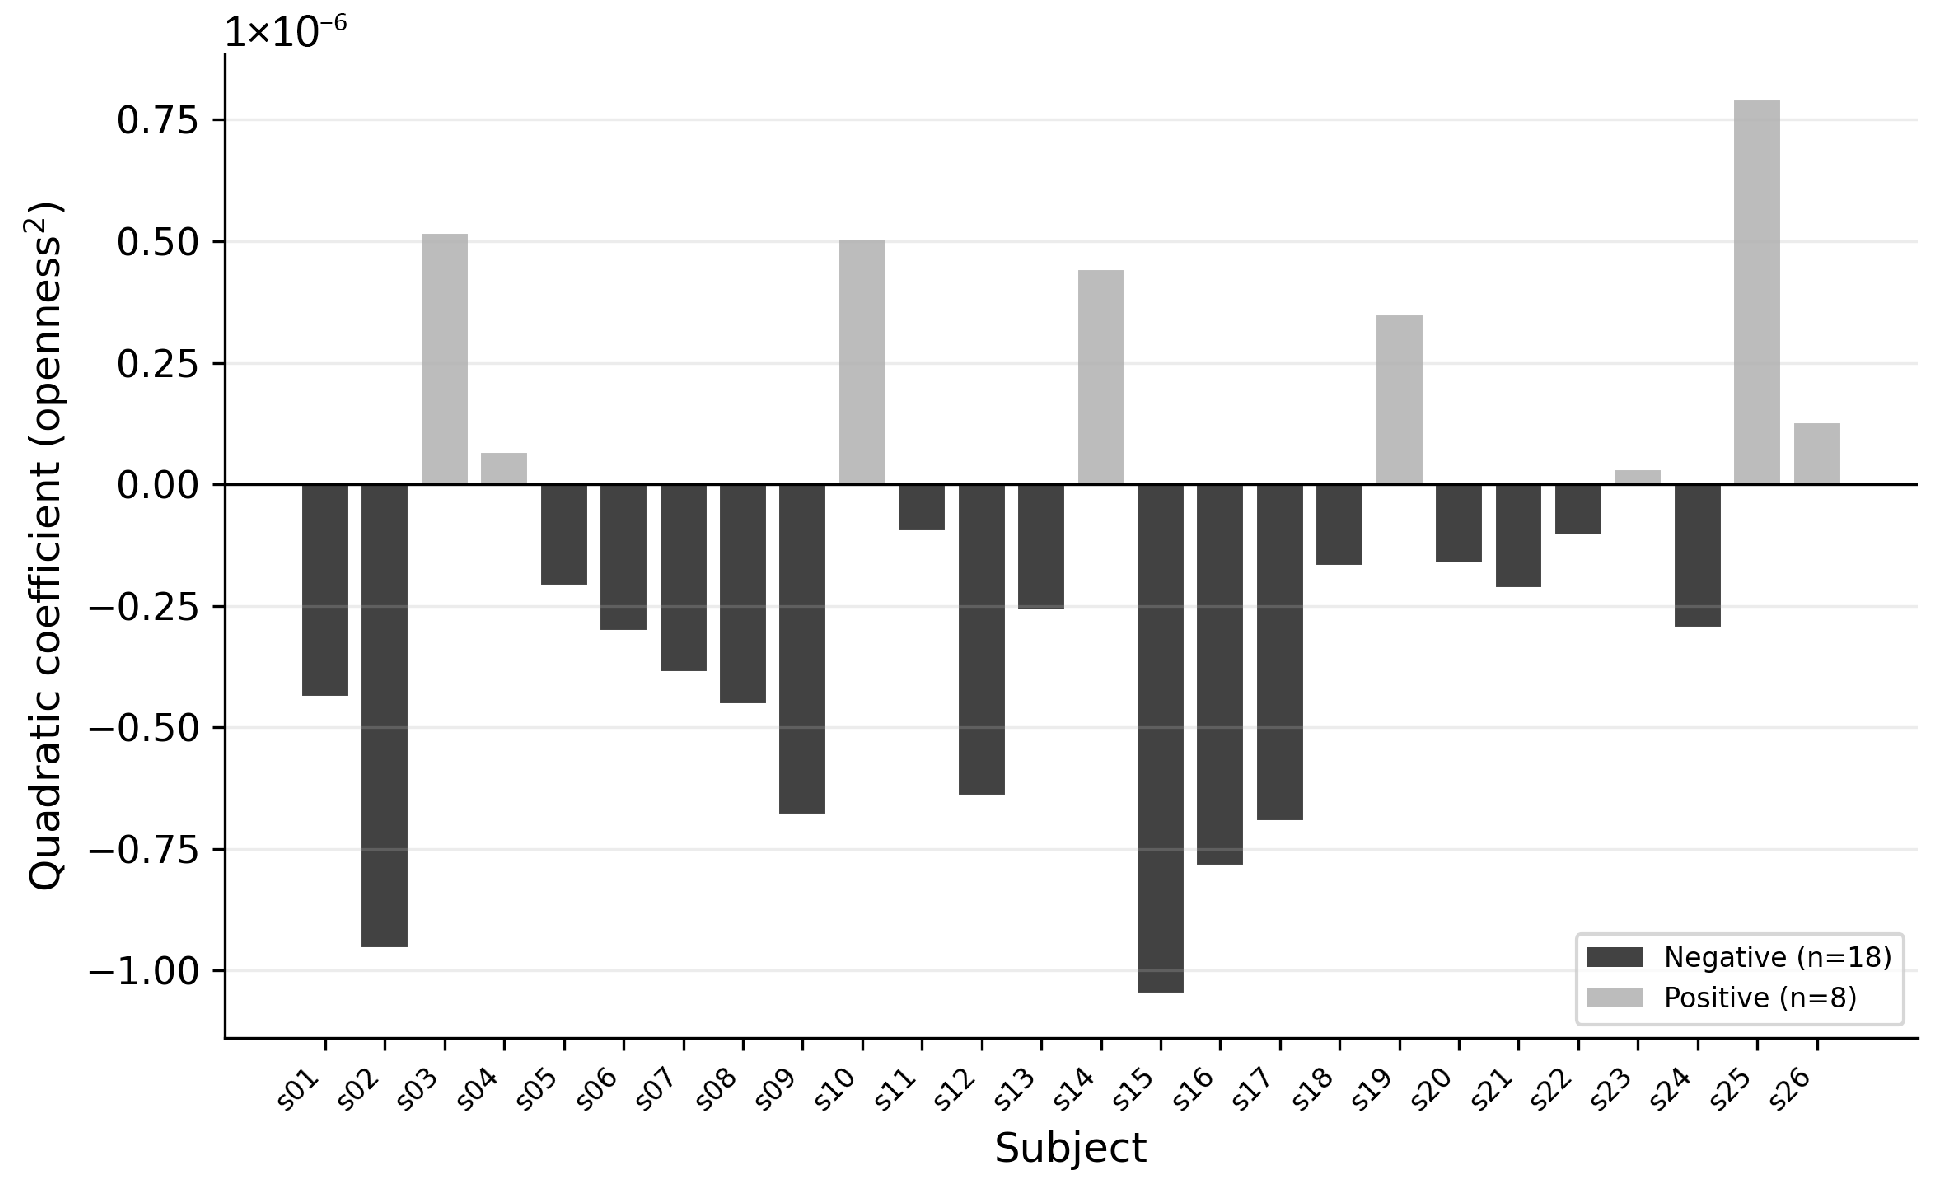
At the participant level, 18 of the 26 participants (69.2%) exhibited negative quadratic coefficients. Notably, every statistically significant result was negative; no positive coefficients were observed. A binomial test confirmed that this distribution was unlikely to have arisen by chance (
p = 0.038) (
Figure 8).
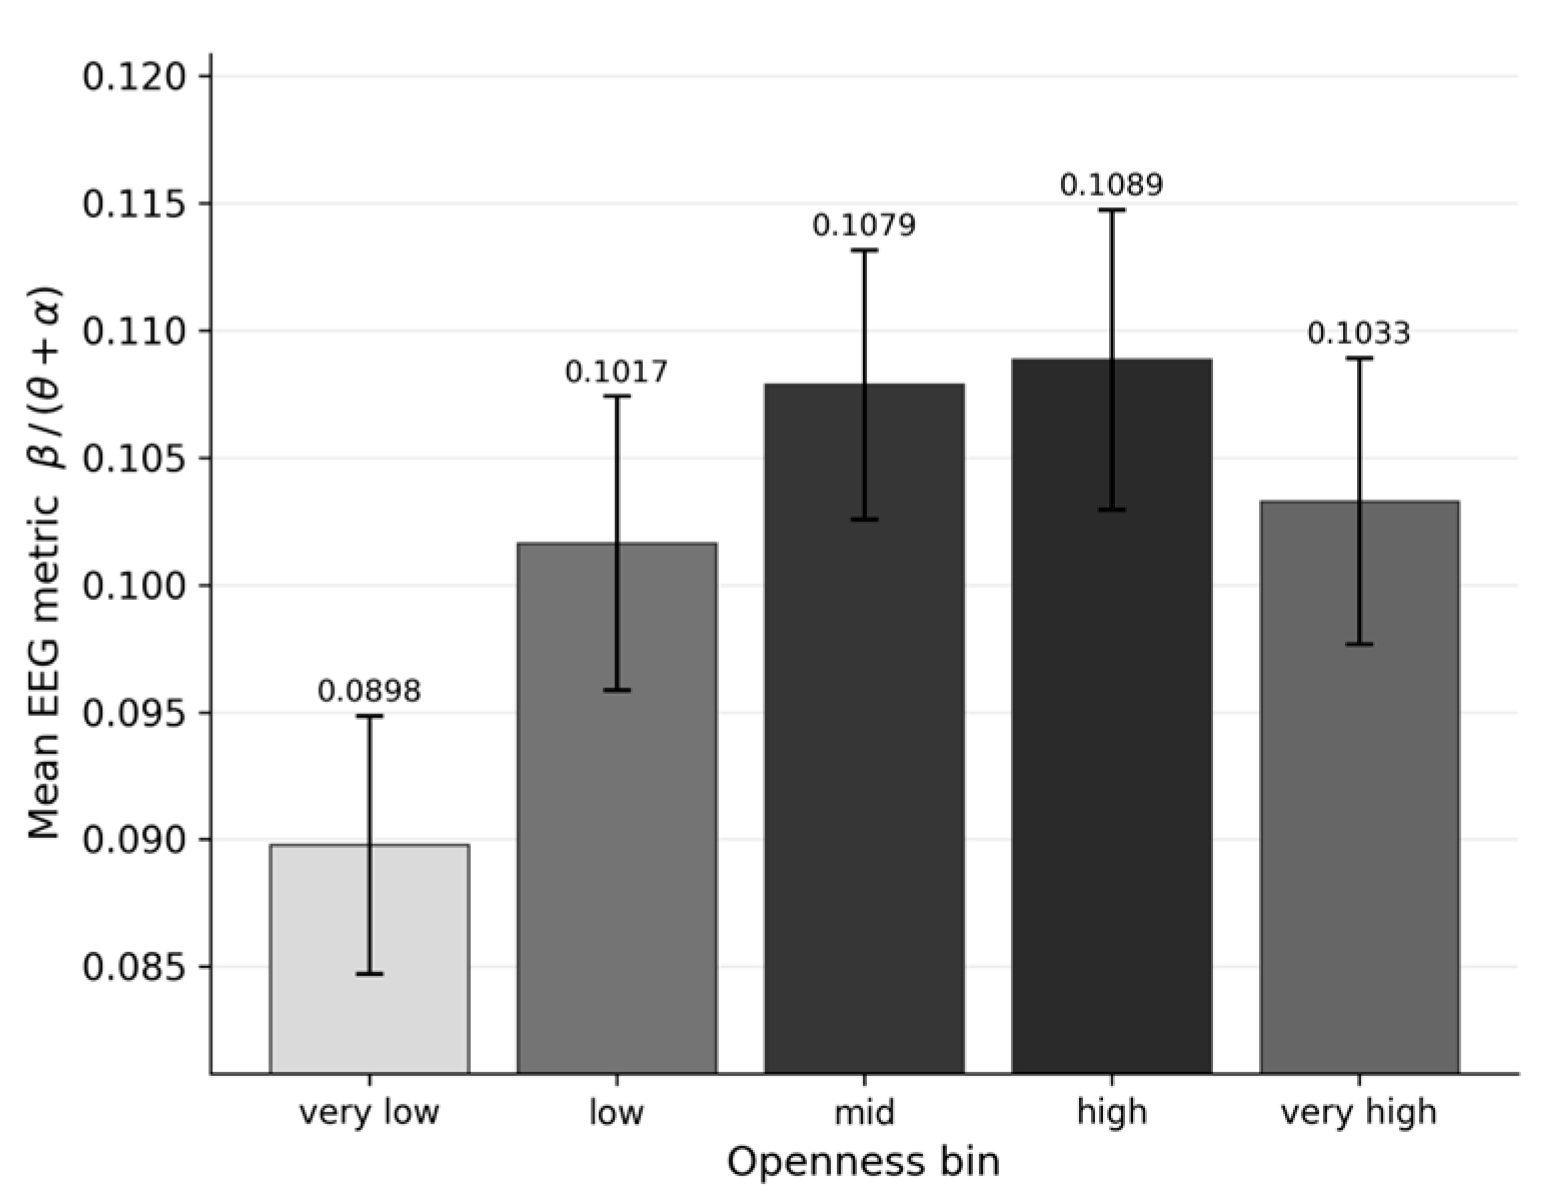
Analyses based on binned openness levels showed that the nonlinear pattern was not confined to ranges but was consistently observed across the full spectrum. EEG engagement was approximately 0.09–0.10 at low openness levels, rose to approximately 0.108 at intermediate levels, and decreased to approximately 0.103 at high levels (
Figure 9). Engagement does not increase monotonically with openness but forms an inverted U-shaped pattern with a maximum at intermediate levels. Its recurrence across the full range indicates a stable structural pattern rather than a localised artefact.
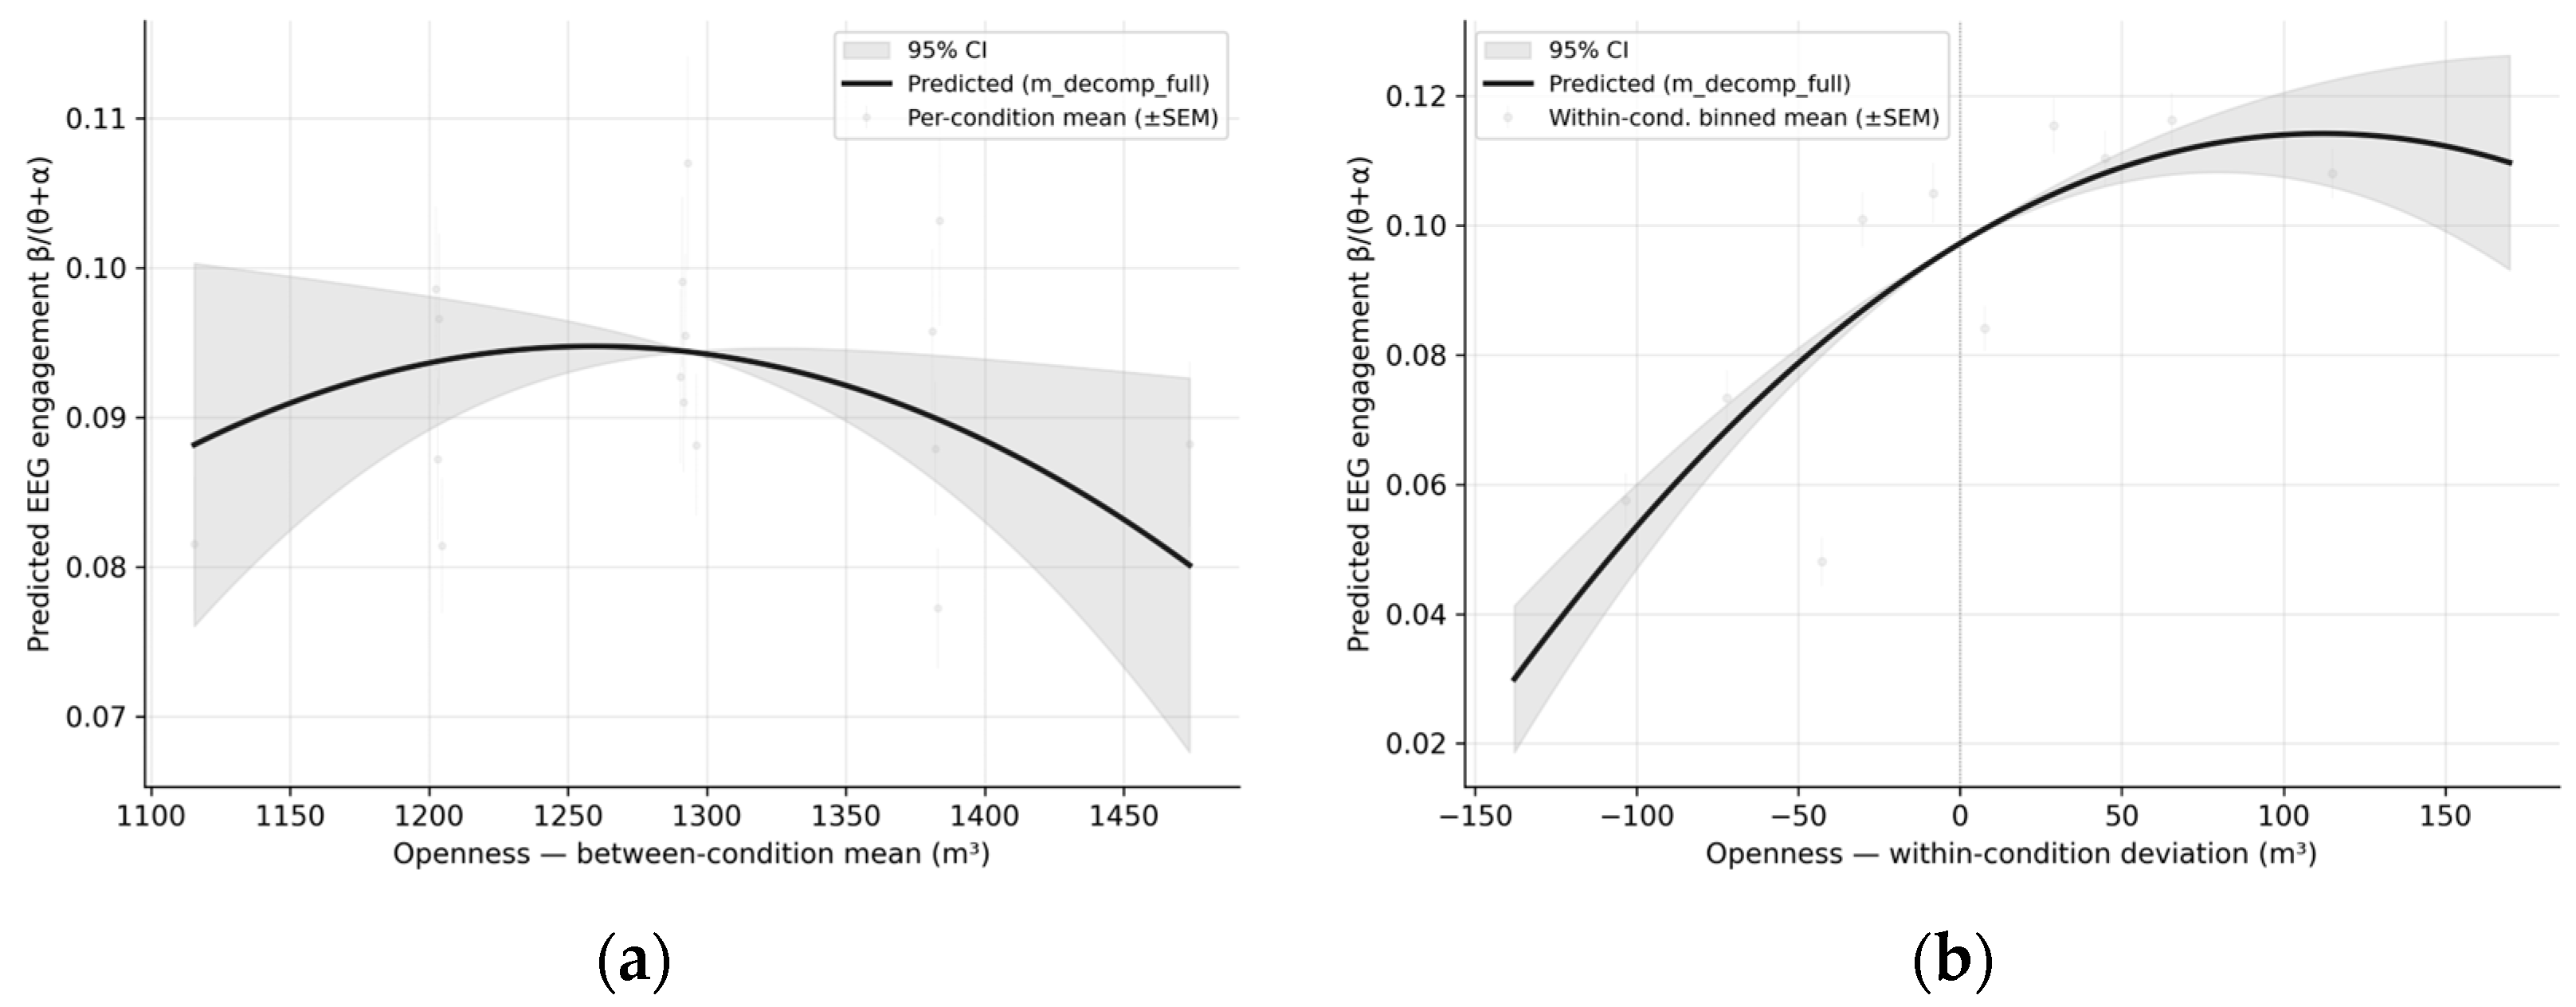
Further robustness analyses decomposed openness into between-condition and within-condition components, examining whether the inverted-U held separately across spatial configurations and across nodes within the same condition. The pattern was directionally consistent in both (
Figure 10).
4.5. Event-Based ERD Patterns
As a supplementary corroboration of the primary findings, the event-based ERD analysis examines whether the nonlinear openness and engagement relationship manifests at the level of transient neural responses to openness transitions.
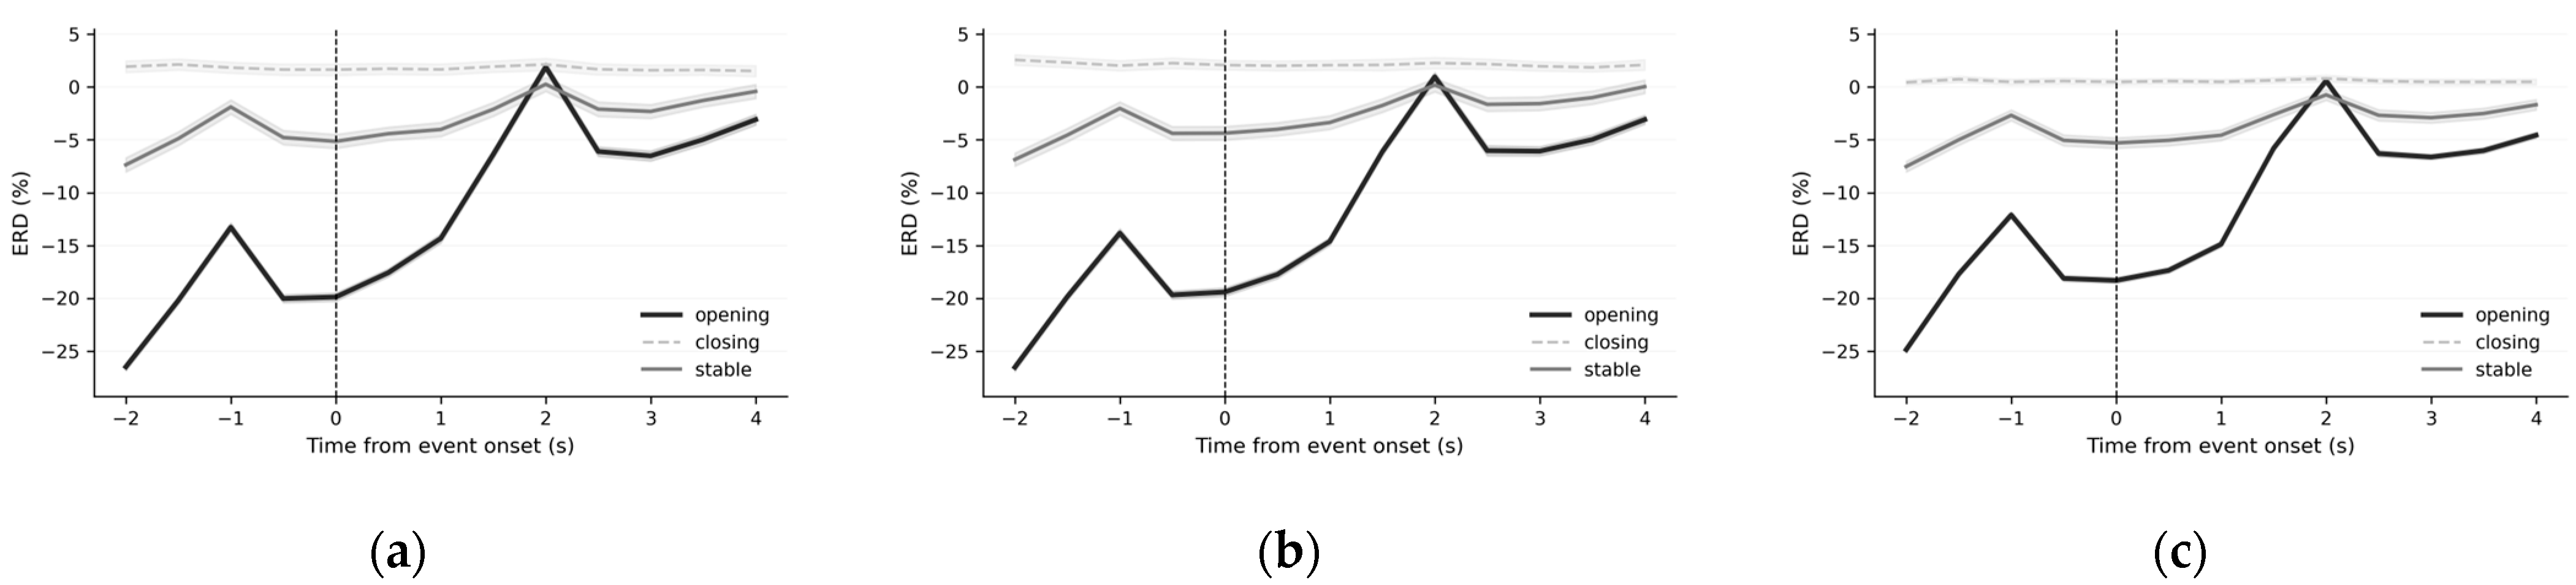
The strongest neural responses occurred at opening transitions in which openness increased across all major ERD indices. Alpha ERD at the event onset averaged −19.46, the largest change compared to stable (−4.47) and closing (2.06) conditions. The post-event value in the opening condition recovered to −9.32, and the pre-to-post change reached +10.64, the largest among the three.
Closing conditions showed limited changes, with alpha ERD values remaining constant across phases (pre = 2.26, at-event = 2.06, post = 2.10). Stable conditions yielded intermediate responses, with an at-event value of −4.47 falling between those opening and closing. Theta and beta ERD followed similar patterns, with the strongest desynchronisation and subsequent recovery again observed in the opening condition (
Figure 11). These findings provide complementary evidence that the nonlinear openness–engagement relationship is not merely a statistical tendency but is also confirmed at the level of neural response patterns.
5. Discussion
5.1. Nonlinear Relationship Between Spatial Openness and Cognitive Engagement
The present analyses provide evidence that the openness and engagement relationship is better described by a nonlinear (inverted-U) than by a linear function, and that this pattern remains significant after correction for spatial–temporal autocorrelation. Although the absolute effect size is small (marginal R2 ≈ 2–3%), the inverted-U structure is consistent across participants, holds in both between-condition and within-condition decompositions of openness, and is corroborated by the event-based ERD analysis.
Cognitive responses do not rise monotonically with openness; the highest responses emerge within a specific range.
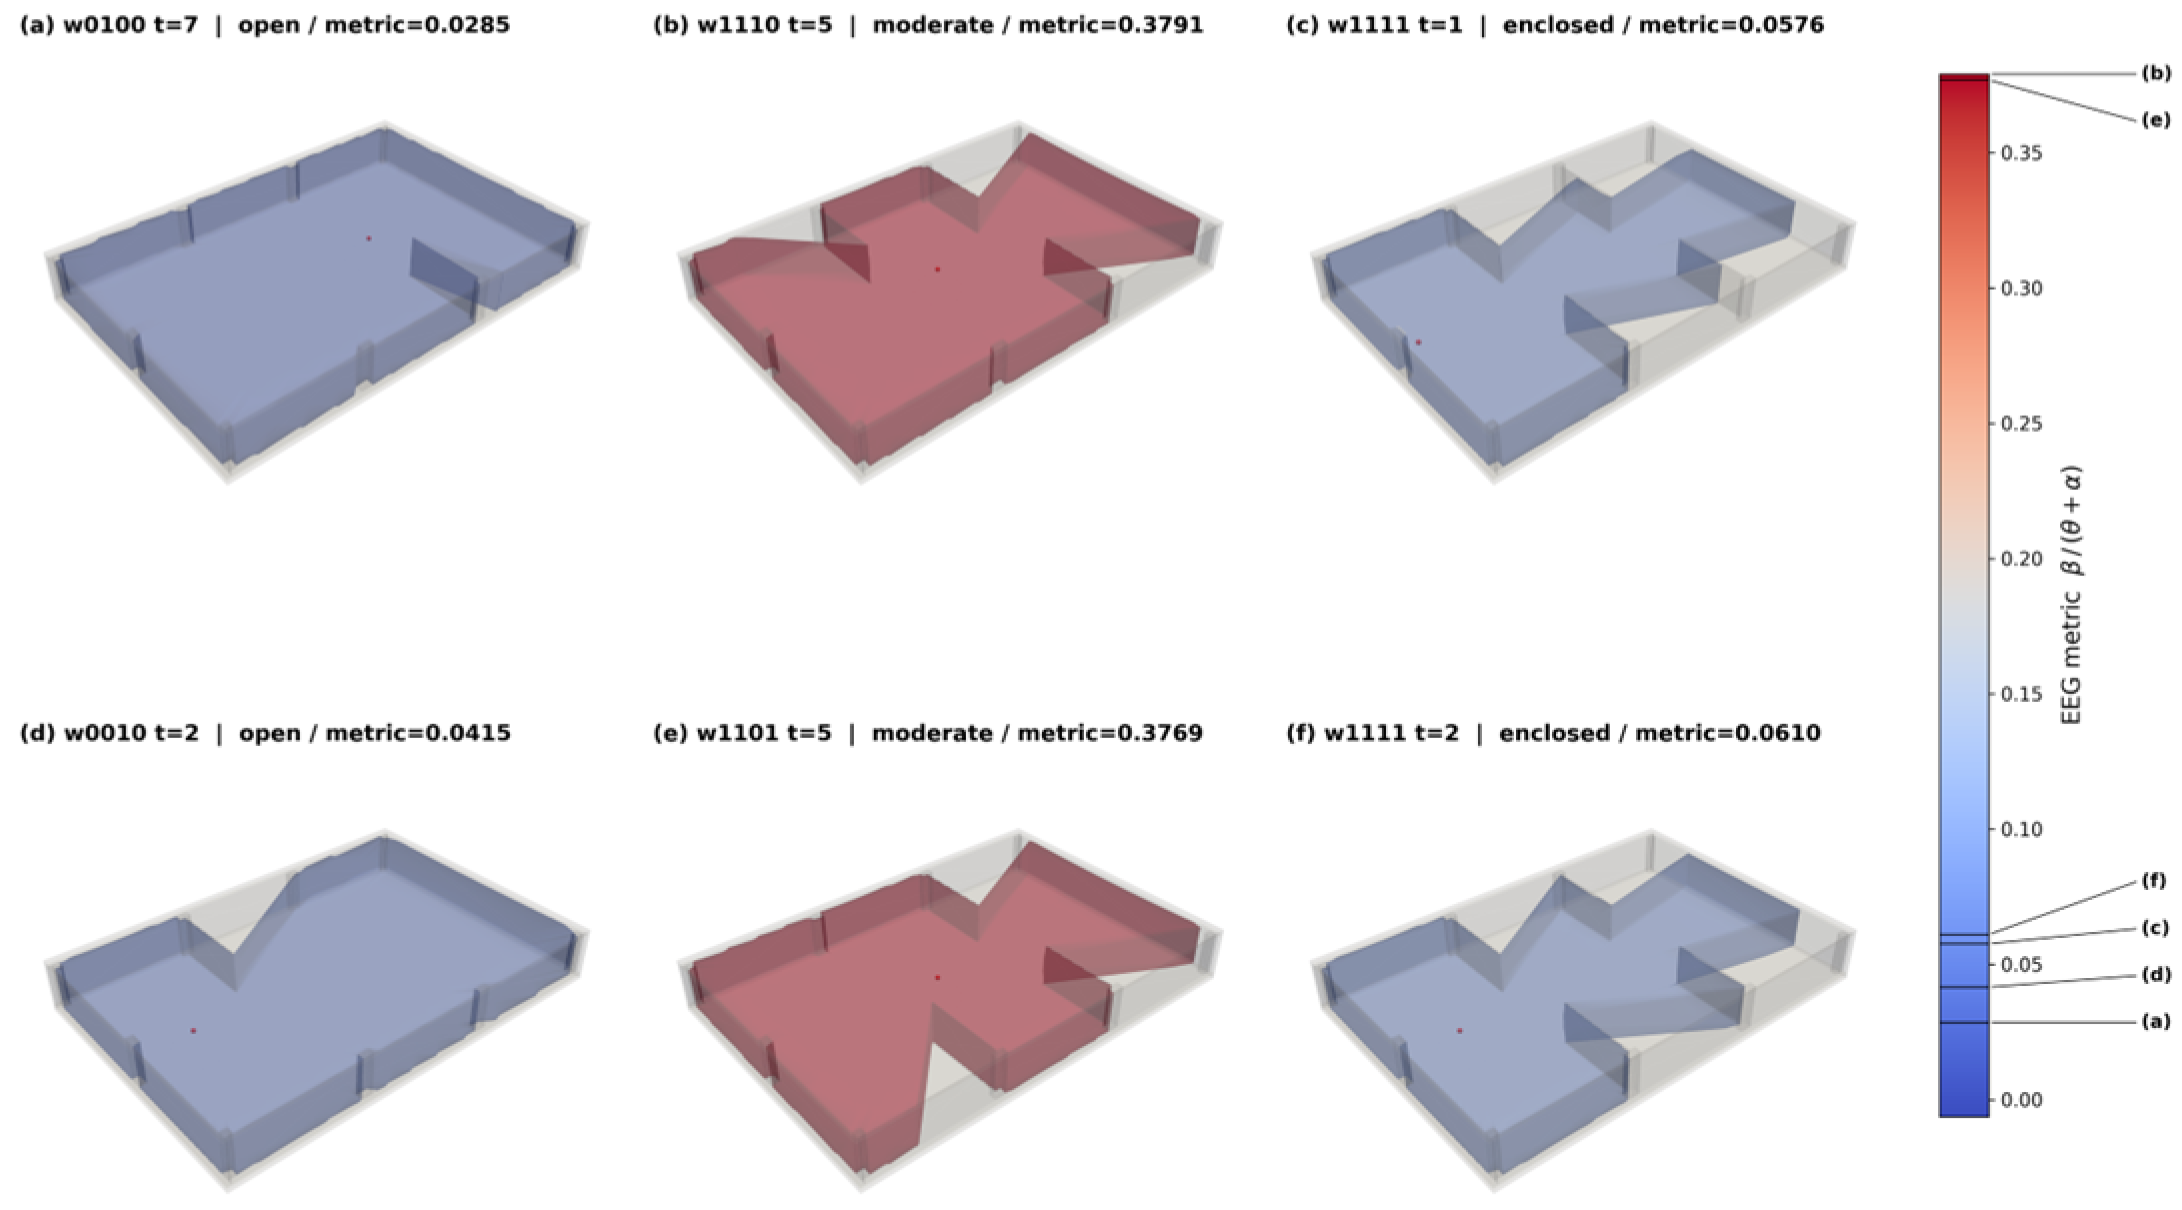
Figure 12 visually confirms this nonlinear distribution across different spatial configurations.
The pattern can be understood as reflecting variations in visual exposure and associated cognitive processing demands. Lower openness may correspond to reduced cognitive activation, whereas higher openness may be linked to increased attentional dispersion. Intermediate openness levels, by contrast, are associated with higher engagement, indicating a possible balance between information accessibility and attentional focus.
The consistency of this pattern at the individual level is noteworthy. Eighteen of 26 participants (69.2%) exhibited negative quadratic coefficients, with no participant showing a significant positive coefficient (binomial test, p = 0.038), indicating that the pattern is not an artefact of group-level averaging but is replicated at the individual level. Openness also varies across observation nodes within the same spatial condition, underscoring the need for node-level analysis rather than average values. Spatial experience thus possesses localised characteristics that vary with position and cannot be reduced to a single aggregate value.
The remaining eight participants exhibited positive quadratic coefficients, although none reached individual statistical significance. Individual differences in response to environmental stimulation [
19,
38] make such variability expected, and it does not contradict the population-level inverted-U. Importantly, no participant exhibited a significant positive coefficient, whereas several exhibited significant negative ones.
The event-based analysis further corroborates the nonlinear relationship. The strongest ERD responses occurred at transitions where openness increased, suggesting that changes in openness elicit distinguishable neural differences and confirming that the nonlinear pattern is observable not only in statistical trends but also in temporally aligned neural responses. It should be noted, however, that the event-based analysis is supplementary, providing ancillary evidence rather than directly testing the central hypotheses. Whether the ERD responses functionally drive (rather than merely co-occur with) the observed engagement lies beyond the scope of this study and warrants more refined experimental designs in future work.
These transient responses also resemble the cognitive engagement evoked by spatial transitions in real-world walking, for instance moving from a closed corridor into an open atrium. The present paradigm does not directly study locomotor exploration; nevertheless, the result suggests that the inverted-U framework may extend to dynamic sequential exposure, a hypothesis that warrants verification using mobile EEG paradigms.
5.2. Theoretical Implications: Optimal Stimulation and Cognitive Balance
The results are closely connected to existing theories explaining the relationship between environmental stimuli and cognitive responses. When openness is interpreted as the intensity of visual stimulation, the nonlinear pattern identified here is directionally consistent with theoretical frameworks describing how stimulus levels relate to human responses.
These results are broadly consistent with Berlyne’s optimal stimulation theory, which posits that cognitive arousal is insufficient when stimulation is too low, whilst cognitive burden accumulates and responses diminish when stimulation is excessive [
19]. We do not claim definitive empirical validation, since the modest effect size and the constraints of the VR setting preclude such a strong inference, yet the convergence of pattern direction with theoretical prediction is suggestive. The observed pattern is congruent with this structure, suggesting that openness functions as a stimulus variable capable of modulating cognitive states. The EEG-based quantification additionally places this observation at the neurophysiological level.
The findings also link to the environmental cognition theory of Kaplan and Kaplan [
29], who argued that humans simultaneously face two competing cognitive demands when experiencing an environment: understanding and exploration. Openness may simultaneously alter the structural clarity of the environment and its potential for exploration, and the balance between these two demands appears closely related to cognitive engagement. The inverted-U pattern observed here is consistent with the existence of such a balance, although the present paradigm does not separately measure understanding- and exploration-related processes and therefore cannot identify their relative contributions directly.
Finally, the findings carry preliminary implications for spatial design. Openness is generally regarded as a positive attribute, yet the findings challenge the assumption that user experience improves linearly with increasing openness. Excessive visual exposure may induce attentional dispersion and cognitive burden, potentially degrading spatial experience. Spatial design should therefore aim not at maximising openness per se but at balancing visual exposure with spatial boundaries.
Table 8 maps these findings onto the existing theoretical frameworks.
6. Conclusions
We propose an analytical framework integrating 3D isovist-based geometric measurement with EEG-based neurophysiological measurement within a node-based pairing scheme. Mixed-effects analyses reveal a small but statistically detectable inverted-U relationship between openness and engagement (marginal R2 ≈ 2–3%) that remains significant after correction for spatial–temporal autocorrelation and is consistent across participants, suggesting that openness operates as a stimulus dimension with a non-monotonic cognitive effect rather than a uniformly positive one. The principal contributions are twofold:
Methodological contribution: We present an integrated analytical framework directly coupling 3D isovist volume with EEG-based engagement. This contribution stands as a methodological proof of concept independent of the magnitude of any specific empirical effect.
Empirical contribution: The analyses provide preliminary evidence for a nonlinear (inverted-U) openness–engagement relationship. Without claiming definitive validation of any single theoretical framework, this observation offers a first quantitative neurophysiological reference against which Berlyne’s optimal-stimulation theory and Kaplan and Kaplan’s understanding–exploration framework may be tested in future, more decisive studies.
The findings carry tentative implications for spatial design: maximising openness may not uniformly enhance engagement, and designs balancing visual exposure with spatial boundaries warrant consideration as a working hypothesis. Direct translation into prescriptive design guidelines, however, requires further empirical work in real built environments before specific design rules can be substantiated.
Notwithstanding these contributions, the study has several limitations. Methodologically, the empirical effect is small, the inverted-U was confirmed only for the β/(θ + α) index at the Frontal ROI, and 3D isovist volume captures the quantity but not the qualitative geometry (directional anisotropy, vertical-horizontal balance, compactness) of visible space. Ecologically, the VR setting with its fixed-velocity, pre-scripted walkthrough cannot reproduce the voluntary locomotion and dynamic sequential exposure of real architectural experience. Finally, generalisation is restricted on three counts. The study draws on a single exhibition typology and does not test alternative engagement indices or cortical regions (e.g., posterior and parietal areas implicated in spatial perception). In addition, the study lacks hardware-precision triggering, so that trial-level event-based analyses (e.g., ERD) remain subject to sub-second alignment errors that bias transient response estimates conservatively.
Future work should therefore integrate shape-based isovist metrics to capture qualitative geometry and compare frontal, parietal, and occipital ROIs to characterise region-specific responses to spatial openness. The pattern should also be tested across alternative engagement indices and replicated under voluntary locomotion in real built environments (e.g., offices, residential interiors, urban plazas) using mobile EEG with hardware-precision triggers.
More broadly, the findings suggest that architectural openness can be treated not only as a geometric attribute but also as a neurophysiological stimulus that varies across spatial positions and modulates engagement. By coupling 3D isovist measurement with EEG-based engagement at the level of individual observation nodes, we provide a concrete methodological route for future investigations of architectural space as a modulator of cognitive states.
Author Contributions
Conceptualization, S.H.P.; methodology, S.H.P.; software, S.H.P.; formal analysis, S.H.P.; data curation, S.H.P.; investigation, S.H.P.; visualization, S.H.P.; writing—original draft preparation, S.H.P.; writing—review and editing, S.H.P. and H.J.J.; supervision, H.J.J.; project administration, H.J.J.; funding acquisition, H.J.J. All authors have read and agreed to the published version of the manuscript.
Funding
This research was supported by the National Research Foundation of Korea (NRF) grant funded by the Korea government (MSIT) ( RS-2022-NR070619).
Institutional Review Board Statement
The study was conducted in accordance with the Declaration of Helsinki and approved by the Ethics Committee of Hanyang University (protocol code HYUIRB-2025-11-022, 24 November 2025).
Informed Consent Statement
Informed consent was obtained from all subjects involved in the study.
Data Availability Statement
The raw EEG datasets generated during the current study are not publicly available due to privacy and ethical restrictions, but derived data supporting the findings of this study are available from the corresponding author upon reasonable request.
Conflicts of Interest
The authors declare no conflicts of interest.
References
- Eppler, M.J.; Mengis, J. The Concept of Information Overload: A Review of Literature from Organization Science, Accounting, Marketing, MIS, and Related Disciplines. Inf. Soc. 2004, 20, 325–344. [Google Scholar] [CrossRef] [Scilit]
- Arnold, M.; Goldschmitt, M.; Rigotti, T. Dealing with Information Overload: A Comprehensive Review. Front. Psychol. 2023, 14, 1122200. [Google Scholar] [CrossRef] [Scilit]
- Coburn, A.; Vartanian, O.; Chatterjee, A. Buildings, Beauty, and the Brain: A Neuroscience of Architectural Experience. J. Cogn. Neurosci. 2017, 29, 1521–1531. [Google Scholar] [CrossRef] [Scilit]
- Djebarra, Z.; Fich, L.B.; Petrini, L.; Gramann, K. Sensorimotor Brain Dynamics Reflect Architectural Affordances. Proc. Natl. Acad. Sci. USA 2019, 116, 14769–14778. [Google Scholar] [CrossRef] [Scilit]
- Ergan, S.; Radwan, A.; Zou, Z.; Tseng, H.; Han, X. Quantifying Human Experience in Architectural Spaces with Integrated Virtual Reality and Body Sensor Networks. J. Comput. Civ. Eng. 2019, 33, 04018062. [Google Scholar] [CrossRef] [Scilit]
- Chatterjee, A.; Vartanian, O. Neuroaesthetics. Trends Cogn. Sci. 2014, 18, 370–375. [Google Scholar] [CrossRef] [Scilit] [PubMed]
- Hillier, B. Space Is the Machine; Cambridge University Press: Cambridge, UK, 1996. [Google Scholar]
- Penn, A. Space Syntax and Spatial Cognition: Or Why the Axial Line? Environ. Behav. 2003, 35, 30–65. [Google Scholar] [CrossRef] [Scilit]
- Fisher-Gewirtzman, D.; Wagner, I.A. Spatial Openness as a Practical Metric for Evaluating Built-Up Environments. Environ. Plan. B Plan. Des. 2003, 30, 37–49. [Google Scholar] [CrossRef] [Scilit]
- Fisher-Gewirtzman, D.; Shach-Pinsly, D.; Wagner, I.A.; Burt, M. View-Oriented Three-Dimensional Visual Analysis Models for the Urban Environment. Urban Des. Int. 2005, 10, 23–37. [Google Scholar] [CrossRef] [Scilit]
- Benedikt, M.L. To Take Hold of Space: Isovists and Isovist Fields. Environ. Plan. B Plan. Des. 1979, 6, 47–65. [Google Scholar] [CrossRef] [Scilit]
- Turner, A.; Doxa, M.; O’Sullivan, D.; Penn, A. From Isovists to Visibility Graphs: A Methodology for the Analysis of Architectural Space. Environ. Plan. B Plan. Des. 2001, 28, 103–121. [Google Scholar] [CrossRef] [Scilit]
- Morello, E.; Ratti, C. A Digital Image of the City: 3D Isovists in Lynch’s Urban Analysis. Environ. Plan. B Plan. Des. 2009, 36, 837–853. [Google Scholar] [CrossRef] [Scilit]
- Omrani Azizabad, S. Three-Dimensional Embodied Visibility Graph Analysis: Investigating and Analyzing Values along an Outdoor Path. Environ. Plan. B Urban Anal. City Sci. 2025, 52, 525–540. [Google Scholar] [CrossRef] [Scilit]
- Lin, T.P.; Lin, H.; Hu, M.Y. 3D Visibility Analysis in Urban Environment. Int. Arch. Photogramm. Remote Sens. Spat. Inf. Sci. 2013, XL-4/W3, 49–53. [Google Scholar] [CrossRef] [Scilit]
- Yang, P.P.-J.; Putra, S.Y.; Li, W. Viewsphere: A GIS-Based 3D Visibility Analysis for Urban Design Evaluation. Environ. Plan. B Plan. Des. 2007, 34, 971–992. [Google Scholar] [CrossRef] [Scilit]
- Rhee, J.H.; Schermer, B.; Han, G.; Park, S.Y.; Lee, K.H. Effects of Nature on Restorative and Cognitive Benefits in Indoor Environment. Sci. Rep. 2023, 13, 13199. [Google Scholar] [CrossRef] [Scilit]
- Badia, S.B.; Carvalheiro, C.; Sampaio, A. Using the EEG VR LEC Evaluation Method to Explore the Combined Influence of Temperature and Spatial Openness on the Physiological Recovery of Post-Disaster Populations. Build. Environ. 2023, 243, 110637. [Google Scholar] [CrossRef] [Scilit]
- Berlyne, D.E. Aesthetics and Psychobiology; Appleton-Century-Crofts: New York, NY, USA, 1971. [Google Scholar]
- Mikulka, P.J.; Scerbo, M.W.; Freeman, F.G. Effects of a Biocybernetic System on Vigilance Performance. Hum. Factors 2002, 44, 654–664. [Google Scholar] [CrossRef] [Scilit]
- Pope, A.T.; Bogart, E.H.; Bartolome, D.S. Biocybernetic System Evaluates Indices of Operator Engagement in Automated Task. Biol. Psychol. 1995, 40, 187–195. [Google Scholar] [CrossRef] [Scilit]
- Bower, I.; Tucker, R.; Enticott, P.G. Impact of Built Environment Design on Emotion Measured via Neurophysiological Correlates and Subjective Indicators: A Systematic Review. J. Environ. Psychol. 2019, 66, 101344. [Google Scholar] [CrossRef] [Scilit]
- Han, X.; Yang, J.; Wang, Y.; Feng, Y.; Li, Z. Analysis of Human Electroencephalogram Features in Different Indoor Environments. Build. Environ. 2020, 186, 107328. [Google Scholar] [CrossRef] [Scilit]
- Gao, Z.; Wang, G.; Pang, L.; Li, J.; Chen, R. EEG-Based Investigation of the Impact of Room Size and Window Placement on Cognitive Performance. J. Build. Eng. 2022, 53, 104540. [Google Scholar] [CrossRef] [Scilit]
- Bitgood, S. An Attention-Value Model of Museum Visitors; Center for Advancement of Informal Science Education: Washington, DC, USA, 2010. [Google Scholar]
- Shemesh, A.; Talmon, R.; Karp, O.; Amir, I.; Bar, M.; Grobman, Y.J. Affective Response to Architecture—Investigating Human Reaction to Spaces with Different Geometry. Archit. Sci. Rev. 2017, 60, 116–125. [Google Scholar] [CrossRef] [Scilit]
- Frontczak, M.; Wargocki, P. Literature Survey on How Different Factors Influence Human Comfort in Indoor Environments. Build. Environ. 2011, 46, 922–937. [Google Scholar] [CrossRef] [Scilit]
- Kaplan, S. The Restorative Benefits of Nature: Toward an Integrative Framework. J. Environ. Psychol. 1995, 15, 169–182. [Google Scholar] [CrossRef] [Scilit]
- Kaplan, R.; Kaplan, S. The Experience of Nature: A Psychological Perspective; Cambridge University Press: Cambridge, UK, 1989. [Google Scholar]
- Klimesch, W. EEG Alpha and Theta Oscillations Reflect Cognitive and Memory Performance: A Review and Analysis. Brain Res. Rev. 1999, 29, 169–195. [Google Scholar] [CrossRef] [Scilit]
- Klimesch, W. Alpha-Band Oscillations, Attention, and Controlled Access to Stored Information. Trends Cogn. Sci. 2012, 16, 606–617. [Google Scholar] [CrossRef] [Scilit]
- Luo, K.; Wei, D.; He, B.; Fei, Y. Association between the Indoor Visual Environment and Cognition in Older Adults: A Systematic Review. Buildings 2024, 14, 3066. [Google Scholar] [CrossRef] [Scilit]
- Deng, M.; Wang, X.; Menassa, C.C. Measurement and Prediction of Work Engagement under Different Indoor Lighting Conditions Using Physiological Sensing. Build. Environ. 2021, 203, 108098. [Google Scholar] [CrossRef] [Scilit]
- Park, J.Y.; Min, B.-K.; Jung, Y.-C.; Pak, H.; Jeong, Y.-H.; Kim, E. Illumination Influences Working Memory: An EEG Study. Neuroscience 2013, 247, 386–394. [Google Scholar] [CrossRef] [Scilit] [PubMed]
- Banaei, M.; Hatami, J.; Yazdanfar, A.; Gramann, K. Electroencephalographic Correlates of Sensorimotor Integration and Embodiment during the Appreciation of Virtual Architectural Environments. Front. Psychol. 2015, 6, 1944. [Google Scholar] [CrossRef] [Scilit]
- Stamps, A.E. Isovists, Enclosure, and Permeability Theory. Environ. Plan. B Plan. Des. 2005, 32, 735–762. [Google Scholar] [CrossRef] [Scilit]
- Stamps, A.E. Enclosure and Safety in Urbanscapes. Environ. Behav. 2005, 37, 102–133. [Google Scholar] [CrossRef] [Scilit]
- Vartanian, O.; Navarrete, G.; Chatterjee, A.; Fich, L.B.; Gonzalez-Mora, J.L.; Leder, H.; Modroño, C.; Nadal, M.; Rostrup, N.; Skov, M. Architectural Design and the Brain: Effects of Ceiling Height and Perceived Enclosure on Beauty Judgments and Approach-Avoidance Decisions. J. Environ. Psychol. 2015, 41, 10–18. [Google Scholar] [CrossRef] [Scilit]
- Faul, F.; Erdfelder, E.; Lang, A.-G.; Buchner, A. G*Power 3: A Flexible Statistical Power Analysis Program for the Social, Behavioral, and Biomedical Sciences. Behav. Res. Methods 2007, 39, 175–191. [Google Scholar] [CrossRef] [Scilit]
- Han, L.; Min, S.; Fang, Y.; He, Y.; Chen, L. Building Environment Information and Human Perceptual Feedback Collected through VR and EEG Method. Energy Build. 2020, 224, 110259. [Google Scholar] [CrossRef] [Scilit]
- Kim, S.; Park, H.; Choo, S. Effects of Changes to Architectural Elements on Human Relaxation-Arousal Responses: Based on VR and EEG. Int. J. Environ. Res. Public Health 2021, 18, 4305. [Google Scholar] [CrossRef] [Scilit]
- Gramfort, A.; Luessi, M.; Larson, E.; Engemann, D.A.; Strohmeier, D.; Brodbeck, C.; Goj, R.; Jas, M.; Brooks, T.; Parkkonen, L.; et al. MEG and EEG Data Analysis with MNE-Python. Front. Neurosci. 2013, 7, 267. [Google Scholar] [CrossRef] [Scilit]
- Hofmann, S.M.; Klotzsche, F.; Mariola, A.; Nikulin, V.; Villringer, A.; Gaebler, M. Decoding Subjective Emotional Arousal from EEG during an Immersive Virtual Reality Experience. eLife 2021, 10, e64812. [Google Scholar] [CrossRef] [Scilit]
- Klug, M.; Berg, T.; Gramann, K. Optimizing EEG ICA Decomposition with Data Cleaning in Stationary and Mobile Experiments. Sci. Rep. 2024, 14, 14119. [Google Scholar] [CrossRef] [Scilit]
- Marcantoni, I.; Assogna, R.; Del Borrello, G.; Di Stefano, M.; Morano, M.; Romagnoli, S.; Leoni, C.; Bruschi, G.; Sbrollini, A.; Morettini, M.; et al. Ratio Indexes Based on Spectral Electroencephalographic Brainwaves for Assessment of Mental Involvement: A Systematic Review. Sensors 2023, 23, 5968. [Google Scholar] [CrossRef] [Scilit]
- Dan, A.; Reiner, M. EEG-Based Cognitive Load of Processing Events in 3D Virtual Worlds Is Lower than Processing Events in 2D Displays. Int. J. Psychophysiol. 2017, 122, 75–84. [Google Scholar] [CrossRef] [Scilit] [PubMed]
- Ishtiaque, F.; Miya, M.T.I.; Mashrur, F.R.; Rahman, K.M.; Vaidyanathan, R.; Anwar, S.F.; Sarker, F.; Ali, N.A.; Tat, H.H.; Mamun, K.A. Machine Learning-Based Viewers’ Preference Prediction on Social Awareness Advertisements Using EEG. Front. Hum. Neurosci. 2025, 19, 1542574. [Google Scholar] [CrossRef] [Scilit] [PubMed]
- Gerner, N.; Pickerle, D.; Höller, Y.; Hartl, A. Neurophysiological Markers of Design-Induced Cognitive Changes: A Feasibility Study with Consumer-Grade Mobile EEG. Brain Sci. 2025, 15, 432. [Google Scholar] [CrossRef] [Scilit]
- Pfurtscheller, G.; Lopes da Silva, F.H. Event-Related EEG/MEG Synchronization and Desynchronization: Basic Principles. Clin. Neurophysiol. 1999, 110, 1842–1857. [Google Scholar] [CrossRef] [Scilit]
- Nakagawa, S.; Schielzeth, H. A General and Simple Method for Obtaining R2 from Generalized Linear Mixed-Effects Models. Methods Ecol. Evol. 2013, 4, 133–142. [Google Scholar] [CrossRef] [Scilit]
Figure 1.
Overview of the spatial–neural data processing and integration framework.
Figure 1.
Overview of the spatial–neural data processing and integration framework.
Figure 2.
Experimental setup for VR-based spatial exposure and EEG recording.
Figure 2.
Experimental setup for VR-based spatial exposure and EEG recording.
Figure 3.
(a) Experimental layout; (b) Examples of Experimental Spaces.
Figure 3.
(a) Experimental layout; (b) Examples of Experimental Spaces.
Figure 4.
Experiment Procedure.
Figure 4.
Experiment Procedure.
Figure 5.
3D isovist volume computation process. (a) Rays uniformly emitted from an observation node across the full spherical field of view; (b) Intersection points between rays and surrounding geometry; (c) Reconstructed closed mesh representing the isovist volume used as a quantitative measure of spatial openness.
Figure 5.
3D isovist volume computation process. (a) Rays uniformly emitted from an observation node across the full spherical field of view; (b) Intersection points between rays and surrounding geometry; (c) Reconstructed closed mesh representing the isovist volume used as a quantitative measure of spatial openness.
Figure 6.
Scatter plot of engagement versus openness. Linear and LOWESS fits are shown.
Figure 6.
Scatter plot of engagement versus openness. Linear and LOWESS fits are shown.
Figure 7.
Quadratic regression of EEG engagement across spatial openness.
Figure 7.
Quadratic regression of EEG engagement across spatial openness.
Figure 8.
Subject-level quadratic coefficients of openness.
Figure 8.
Subject-level quadratic coefficients of openness.
Figure 9.
Mean engagement across binned openness levels.
Figure 9.
Mean engagement across binned openness levels.
Figure 10.
Between- and within-condition decomposition of the openness–engagement relationship. (a) Between-condition component: Condition-level mean engagement across condition-level mean openness. (b) Within-condition component: Node-level deviations from condition means.
Figure 10.
Between- and within-condition decomposition of the openness–engagement relationship. (a) Between-condition component: Condition-level mean engagement across condition-level mean openness. (b) Within-condition component: Node-level deviations from condition means.
Figure 11.
Event-based analysis of event-related desynchronization (ERD) across changes in spatial openness. (a) Theta ERD; (b) alpha ERD; (c) beta ERD.
Figure 11.
Event-based analysis of event-related desynchronization (ERD) across changes in spatial openness. (a) Theta ERD; (b) alpha ERD; (c) beta ERD.
Figure 12.
Spatial distribution of openness and associated metrics across different spatial configurations.
Figure 12.
Spatial distribution of openness and associated metrics across different spatial configurations.
Table 1.
Overview of visibility-based spatial analysis approaches and their limitations.
Table 1.
Overview of visibility-based spatial analysis approaches and their limitations.
| Approach | Key Study | Spatial Representation | Limitation |
|---|
| Isovist | Benedikt (1979) [11] | 2D visible area from a viewpoint | Ignore vertical dimension |
| VGA | Turner et al. (2001) [12] | 2D visibility network | Limited representation of embodied perception |
| 3D Visibility Models | Fisher-Gewirtzman et al. (2005) [10] | View-oriented 3D visibility | Static viewpoint-based analysis |
| Embodied 3D Visibility | Omrani Azizabad et al. (2025) [14] | Path-based 3D visibility analysis | Lacks direct linkage to neurophysiological responses |
Table 2.
EEG frequency bands and their cognitive meanings.
Table 2.
EEG frequency bands and their cognitive meanings.
| Component | Frequency Band | Cognitive Interpretation |
|---|
| Theta | 4–8 Hz | Cognitive effort, working memory load |
| Alpha | 8–13 Hz | Cortical inhibition, relaxed or idle state |
| Beta | 13–30 Hz | Active attention, task engagement |
Table 3.
Theoretical frameworks explaining nonlinear relationships between environmental stimuli and cognitive response.
Table 3.
Theoretical frameworks explaining nonlinear relationships between environmental stimuli and cognitive response.
| Theory | Key Concept | Mechanism | Response Pattern |
|---|
| Berlyne (1971) [19] | Arousal potential | Stimulus intensity regulates cognitive activation | Inverted-U |
| Kaplan & Kaplan (1989) [29] | Understanding vs. Exploration | Balance between comprehension and exploratory demand | Balance-dependent response |
| Stamps (2005) [37] | Enclosure/Permeability | Spatial configuration influences perceived openness and safety | Context-dependent response |
| Vartanian et al. (2015) [38] | Neural response to space | Architectural features modulate brain activity and affective processing | Differential neural activation |
Table 4.
Grouping of 16 Conditions into Four Sets (Notation: Wall1, 2, 3, 4; 0 = Open, 1 = Closed).
Table 4.
Grouping of 16 Conditions into Four Sets (Notation: Wall1, 2, 3, 4; 0 = Open, 1 = Closed).
| Set | Spatial Conditions |
|---|
| 1 | 0000, 0001, 0101, 1111 |
| 2 | 0100, 1001, 0010, 1011 |
| 3 | 0011, 0110, 1100, 0111 |
| 4 | 1000, 1010, 1101, 1110 |
Table 5.
Hierarchical structure of the experimental dataset.
Table 5.
Hierarchical structure of the experimental dataset.
| Level | Description | Size |
|---|
| Subject | Participant identifier | 26 |
| Condition | Spatial configuration | 16 |
| Node | Observation points within each space | 10 per condition |
| Time | Time windows (3-s segments) | 10 per condition |
Table 6.
Comparison of linear and quadratic models based on AIC, BIC, and LRT.
Table 6.
Comparison of linear and quadratic models based on AIC, BIC, and LRT.
| Metric | Linear Model | Quadratic Model | Interpretation |
|---|
| AIC | −9511.3 | −9515.9 | Quadratic model shows better fit |
| BIC | −9479.7 | −9477.9 | Linear model slightly lower |
| LRT | - | χ2(1) = 19.13, p = 1.2 × 10⁻⁵ | Quadratic model improves fit |
Table 7.
Quadratic model coefficients before and after autocorrelation correction.
Table 7.
Quadratic model coefficients before and after autocorrelation correction.
| Model | Quadratic β2 | SE | p-Value | 95% CI | Marginal R2 | Conditional R2 |
|---|
| Quadratic mixed-effects model | −0.0044 | 0.0010 | <0.001 | [−0.0063, −0.0024] | 0.020 | 0.105 |
| Nested random-effects model | −0.0039 | 0.0011 | 3.4 × 10⁻⁴ | [−0.0060, −0.0017] | 0.034 | 0.188 |
Table 8.
Preliminary theoretical interpretation of spatial openness and engagement levels. EEG values represent group-level means and should not be interpreted as universal thresholds.
Table 8.
Preliminary theoretical interpretation of spatial openness and engagement levels. EEG values represent group-level means and should not be interpreted as universal thresholds.
| Openness | Berlyne (1971) [19] | Kaplan & Kaplan (1989) [29] | This Study (EEG) |
|---|
| Low | Low Stimulation | Understanding dominant | Low (~0.09~0.10) |
| Medium | Optimal Stimulation | Balance of understanding and exploration | High (~0.108) |
| High | High Stimulation | Exploration dominant | Decrease (~0.103) |
| Disclaimer/Publisher’s Note: The statements, opinions and data contained in all publications are solely those of the individual author(s) and contributor(s) and not of MDPI and/or the editor(s). MDPI and/or the editor(s) disclaim responsibility for any injury to people or property resulting from any ideas, methods, instructions or products referred to in the content. |