Article

Internal and External Landscape Features of 18 Parks in Hangzhou, China That Cool the Park and the Surrounding Urban Areas: Strategies for Other Cities


1
College of Life and Environment Sciences, Huangshan University, Huangshan 242700, China
2
College of Landscape Architecture, Zhejiang Agriculture and Forestry University, Hangzhou 311300, China
3
School of Architecture & Urban Planning, Anhui Jianzhu University, Hefei 230601, China
*
Author to whom correspondence should be addressed.
Buildings 2026, 16(3), 630; https://doi.org/10.3390/buildings16030630
Submission received: 30 December 2025 / Revised: 24 January 2026 / Accepted: 29 January 2026 / Published: 2 February 2026
(This article belongs to the Special Issue Advanced Research on Intelligent Building Construction and Management)

Abstract

As one of China’s “New Four Furnaces”, the city of Hangzhou faces significant heat challenges exacerbated by rapid urbanization. Urban parks offer effective nature-based solutions, but optimizing their multi-dimensional cooling performance—encompassing cooling area (PCA), efficiency (PCE), intensity (PCI), and gradient (PCG)—remains a key challenge. This study quantitatively analyzed the internal and external landscape features of 18 parks in Hangzhou, revealing that park cooling performance is not simply a case of “bigger is better.” We found that parks with more complex shapes and irregular boundaries exhibited higher cooling efficiency per unit area (PCE) compared to larger parks with smooth, simple shapes, though sometimes at the expense of peak PCI. Furthermore, the surrounding built environment is critical: high building density within a 300 m buffer zone was found to significantly impede the spatial extent of the cooling effect (PCA). Based on these findings, we propose that to effectively mitigate urban heat, cities should (1) shift focus away from creating large, isolated parks with smooth boundaries; (2) prioritize a network of smaller, morphologically diverse parks with irregular edges that extend into the community; and (3) enhance each park’s cooling reach through strategies like green streets and tree-lined paths. These approaches offer tangible, actionable guidance for designing high-performance cooling green infrastructure in dense urban environments.

1. Introduction

Urbanization constitutes a systematic evolutionary process characterized by interconnected demographic, economic, spatial, and socio-cultural transformations [1]. A defining contemporary trend is the accelerating concentration of global population and socio-economic activities within cities, fundamentally altering the equilibrium between the built and natural environments [2]. Statistical data reveal that the global urbanization rate rose from 43.4% in 1991 to 55.7% in 2019, with projections indicating a rise to 68% by 2050 [3]. This process is particularly rapid in developing nations, exemplified by China, driving dramatic urban spatial expansion and inducing profound transformations in urban landscape patterns. Concurrently, global climate change, manifested predominantly through rising mean temperatures and an increased frequency of extreme weather events, poses a substantial and escalating threat to public health [4].
The combined pressures of urbanization and global climate change are exacerbating urban thermal environmental issues. On one hand, the widespread conversion of natural surfaces to impervious materials enhances the land surface’s absorption and storage of solar radiation and its emission of longwave radiation. This directly elevates surface temperatures and disrupts the urban thermal balance [5,6]. On the other hand, urban expansion and intensification of development, driven by the needs of growing populations and industries, have increased greenhouse gas emissions. This has already contributed to a rise in the global average temperature of approximately 1.1 °C [7]. High energy consumption and thermal accumulation in cities further impair public health and quality of life [8]. The interaction of these processes accelerates ecological degradation, manifested notably in the urban heat island (UHI) effect and persistent heatwaves [9]. Addressing these challenges urgently requires collaborative efforts between policymakers and researchers to develop systematic solutions.
In response to the severe urban thermal environment, diverse mitigation strategies have been proposed by both academia and practitioners. These encompass (1) utilizing blue-green infrastructure to reduce ambient urban temperatures through its cooling effects [10,11]; (2) optimizing urban morphology to enhance ventilation [12]; and (3) applying high-albedo construction materials [13]. Among these approaches, harnessing the cooling effects of blue-green infrastructure is widely acknowledged as one of the most effective strategies, consistent with sustainable development goals [14]. Beyond thermal mitigation, urban blue-green infrastructure delivers critical ecosystem services, including microclimate regulation, carbon sequestration, air purification, water conservation, and biodiversity protection [15]. Moreover, it holistically enhances residents’ health and well-being, as well as urban livability, by fostering physical activity, improving environmental quality, generating economic benefits, and strengthening social cohesion [16].
Urban parks, as representative blue-green infrastructure, effectively mitigate local temperatures, enhance human thermal comfort, and reduce heat-related health risks through mechanisms such as canopy shading, increased surface albedo, and vegetation transpiration [17,18,19]. Evidence suggests that park visits can substantially alleviate heat stress symptoms and support human adaptation to a warming climate [20]. Given these benefits, urban parks are increasingly recognized as a sustainable, nature-based solution with strong potential for cooling, offering a functional response to urban heat challenges [21,22]. As public demand grows for ecologically livable environments, the cooling services delivered by urban parks have gained significant societal attention [23]. There is a pressing need for rationally planned urban spaces that enable equitable and efficient access to public resources, thereby minimizing health risks and social tensions associated with uneven distribution of environmental amenities [24]. Consequently, a systematic investigation into the factors influencing the cooling performance of urban parks is essential for optimizing their thermal mitigation effects. Therefore, this study aims to address the following key research questions: (1) How can the multi-dimensional cooling performance of urban parks—encompassing their cooling area, efficiency, intensity, and gradient—be comprehensively quantified? (2) What are the key internal and external landscape characteristics that drive these cooling performance indicators, and what complex trade-offs exist among them? (3) Based on these findings, what targeted optimization strategies can be proposed to enhance the cooling benefits of urban parks in high-density urban environments?
This study investigated 18 urban parks in the Hangzhou metropolitan area. Utilizing Landsat 8 OLI_TIRS remote sensing imagery and Gaode satellite data, it integrated remote sensing and geographic information system (GIS) technologies to assess the relative importance (weight) of diverse factors affecting park cooling effects. The research primarily involved four key components: (1) retrieving land surface temperature (LST) and quantifying park cooling indicators; (2) quantifying the internal and external landscape characteristics of the parks; (3) analyzing the influence of these landscape characteristics on park cooling effects; and (4) proposing targeted optimization strategies based on the analytical findings.

2. Materials and Methods

2.1. Regional Overview

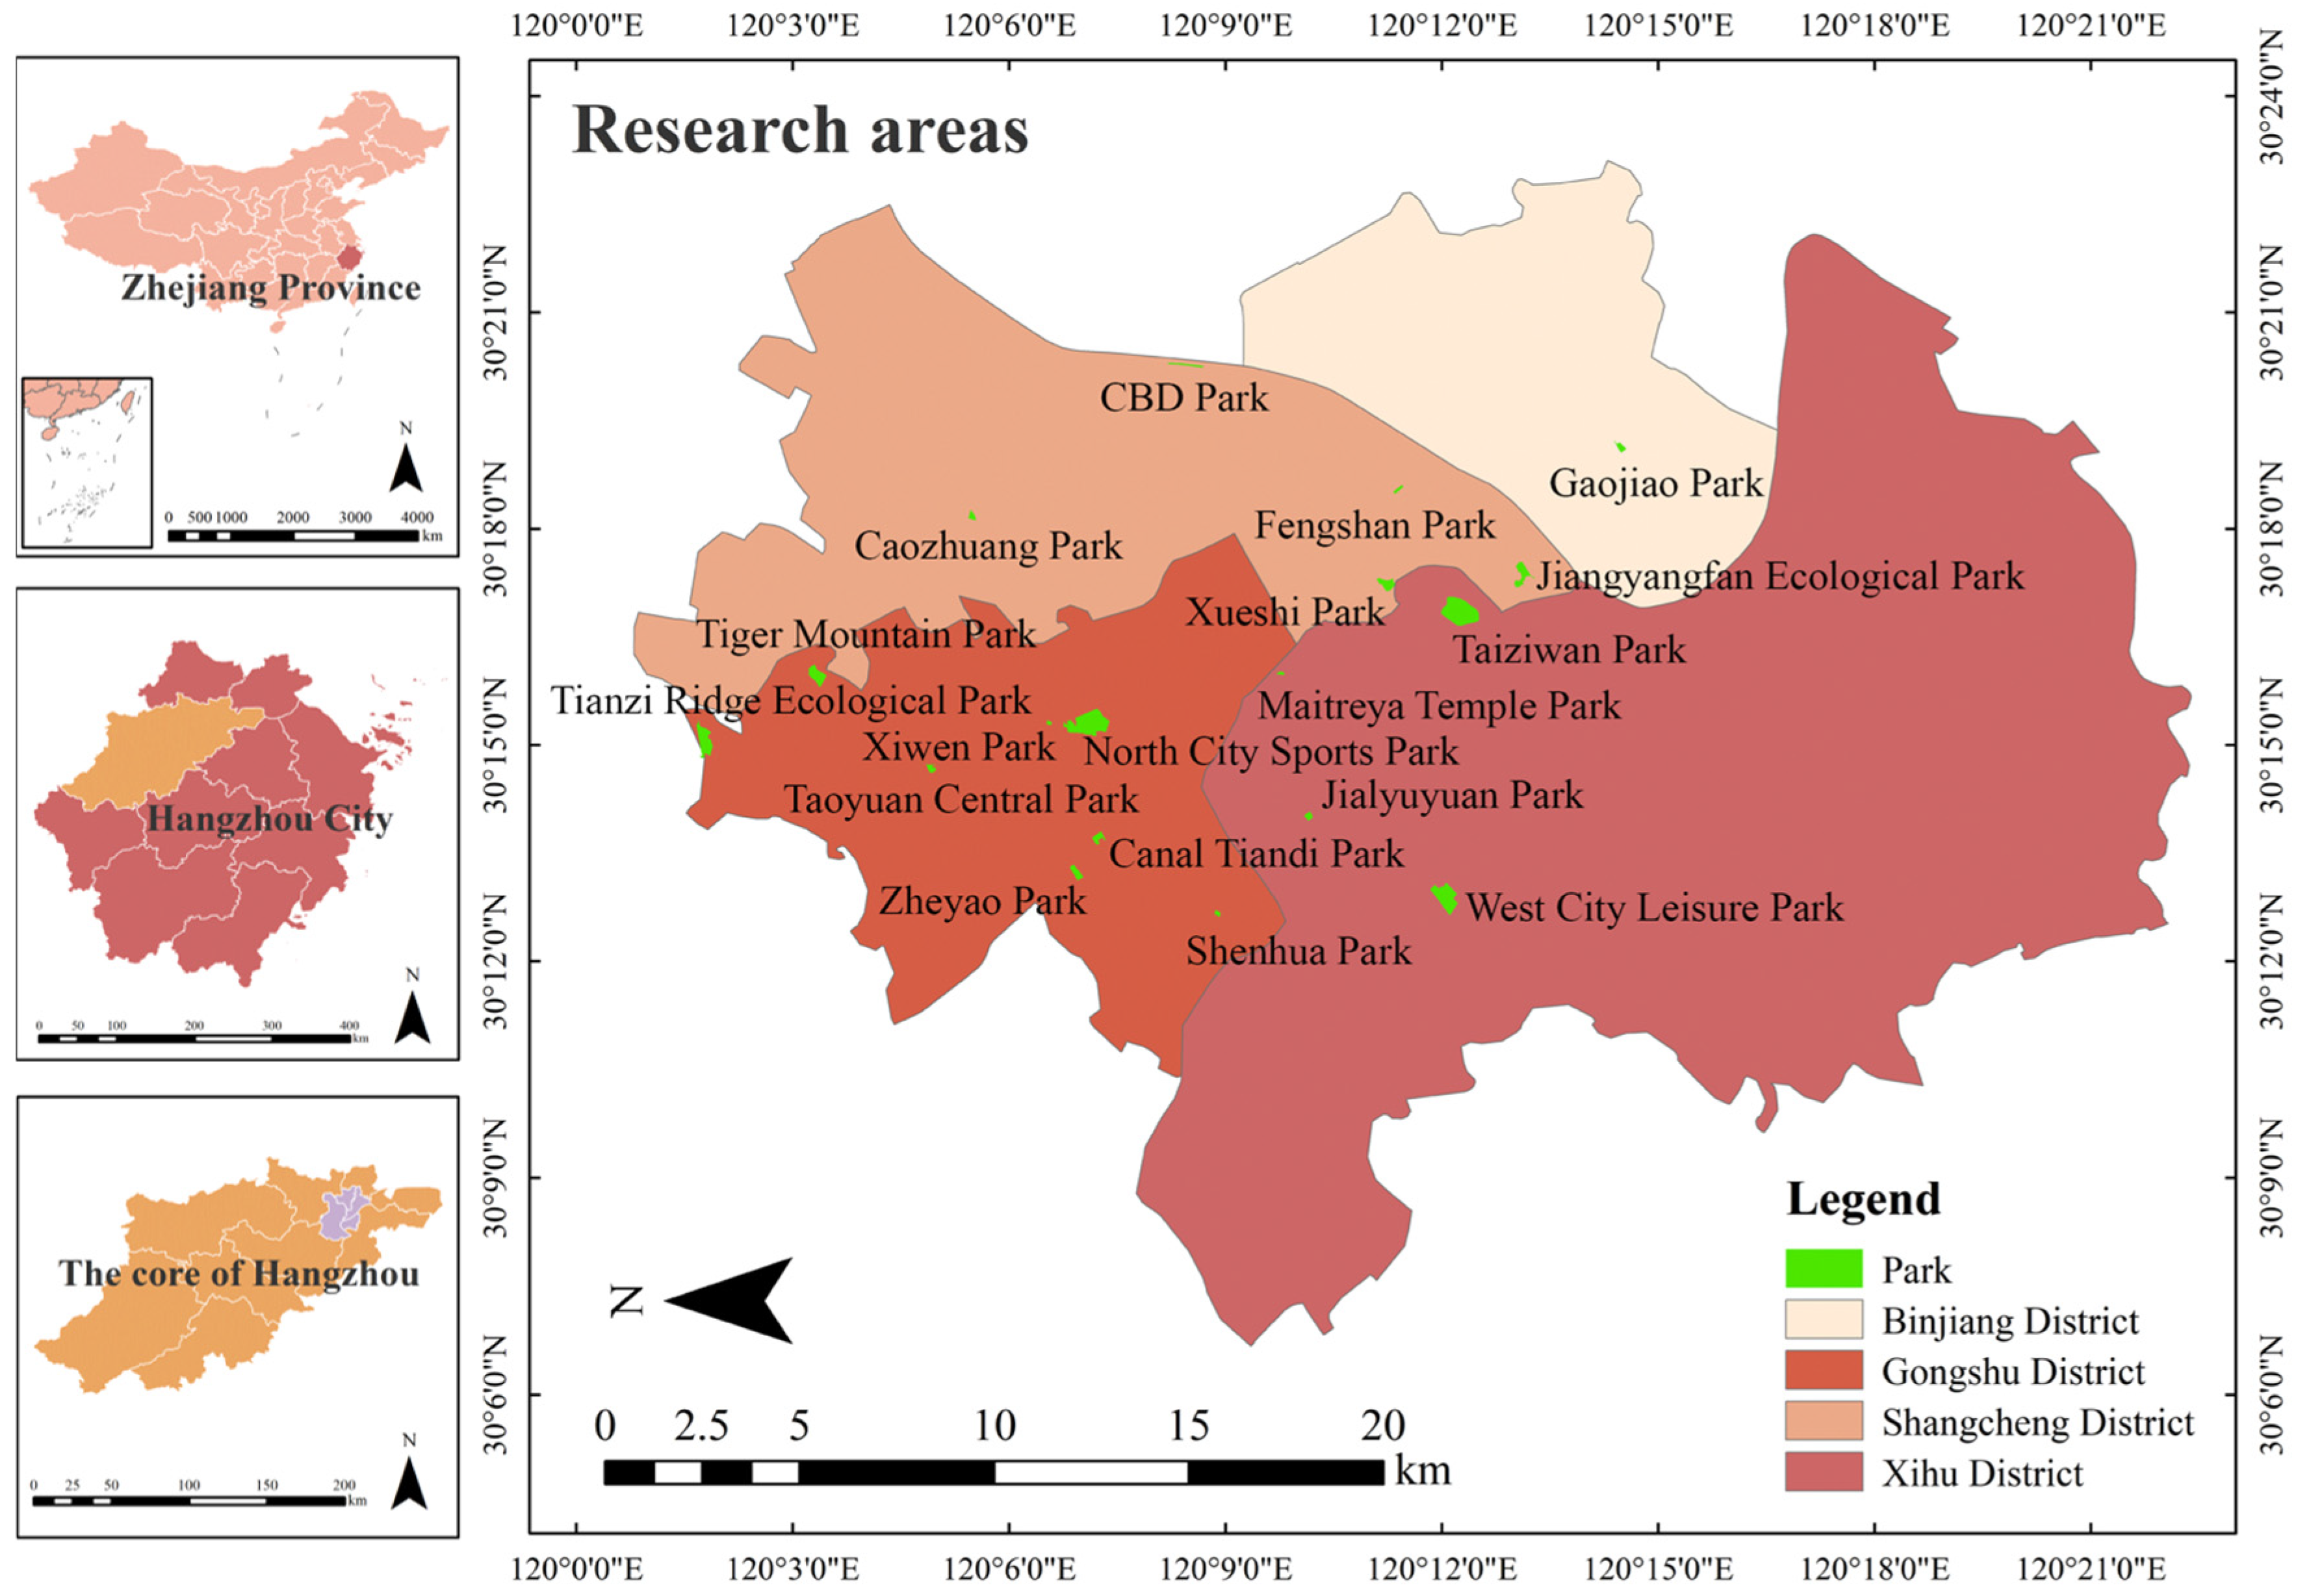
The study area is located in Hangzhou City, southeastern China (29°11′–30°33′ N, 118°21′–120°30′ E). Characterized by a subtropical monsoon climate, the region experiences hot and humid summers, with extreme high temperatures reaching 39.8–42.9 °C. Consequently, Hangzhou is classified as one of China’s “New Four Furnaces” and faces significant urban heat challenges. To enhance the representativeness of the study and minimize thermal interference from suburban areas, the research scope was confined to Hangzhou’s core urban zone. This zone was delineated based on four central districts—Shangcheng, Gongshu, Xihu, and Binjiang—as specified in the Hangzhou Territorial Space Master Plan (2021–2035) [25] (Figure 1). Within this defined area, 18 urban parks were selected as study sites (Table 1). The spatial boundary of each park was digitized using data sourced from the AutoNavi Map (AMap) platform (version 16.09.0; AutoNavi Software Co., Ltd., Beijing, China) [26] and mapped within the ArcGIS 10.8 software environment. To ensure a consistent meteorological background for a robust cross-sectional comparison of the parks, a single, cloud-free Landsat 8 image from a representative high-temperature day (27 September 2021) was selected for analysis.

2.2. Research Methods

2.2.1. Land Surface Temperature Retrieval

Urban parks provide a measurable cooling effect, offering a vital ecosystem service that can mitigate climate change impacts and support sustainable urban development. Given the logistical challenges and high costs associated with collecting in situ air temperature measurements, land surface temperature (LST) data serve as a practical and efficient proxy for evaluating urban park cooling performance [27]. Accordingly, this study employed LST data to characterize the cooling effects of urban parks. To capture these effects under pronounced thermal conditions, we selected study dates characterized by high daily air temperatures and obtained the corresponding LST imagery for analysis.
This study utilized land surface temperature (LST) data derived from satellite imagery with a spatial resolution of 30 m. LST was selected as a robust proxy for near-surface air temperature due to the infeasibility of acquiring high-density, city-wide air temperature data and the strong spatial correlation between the two variables established in the previous literature. Hangzhou, situated within a subtropical monsoon climate zone and frequently influenced by tropical cyclones, experiences a scarcity of cloud-free days during summer. Consequently, most summertime satellite imagery of the region fails to meet the stringent quality requirements for research. To acquire more representative and reliable LST data, a clear day in September was selected for analysis. This approach not only aligns with the local climatic characteristics but also ensures the scientific validity of the data for subsequent analysis. The specific LST images employed were obtained from Landsat 8 OLI_TIRS satellite data (Path 119, Row 39) for 21 September 2021, sourced from the Geospatial Data Cloud platform [28]. Meteorological records for that date indicate an average temperature of 27 °C, a maximum temperature of 33 °C, a cloud cover of 0.62%, and no precipitation (0 mm). Furthermore, no typhoon activity was recorded, suggesting minimal influence from large-scale ocean–atmosphere circulation patterns on the local climatic conditions during the data acquisition period.
This study applied the radiative transfer equation to calculate land surface thermal radiation intensity. This was achieved by subtracting atmospheric effects from the radiation received by the sensor. Subsequently, land surface temperature (LST) was estimated based on this calculated intensity [29,30]. To account for phenological characteristics, the Normalized Difference Vegetation Index (NDVI) was calculated using surface reflectance data derived from Landsat imagery of the study area (Formula (1)). Furthermore, vegetation coverage ( P v ) was derived from the NDVI values and was then used to estimate land surface emissivity (Formula (2)).
NDVI = Band NIR     Band RED Band NIR   +   Band RED
Here, Band NIR and Band RED represent the near-infrared band and the red band of Landsat imagery, respectively. In this study, NDVI data corresponding to the image acquisition dates were utilized to estimate the time required to reach the maximum rate of NDVI change.
P v = ( NDVI     NDVI bare NDVI veg     NDVI bare ) 2
NDVI veg ” and “ NDVI bare ” represent the normalized difference vegetation index values for fully vegetated and completely bare soil surfaces, respectively. Subsequently, based on the vegetation coverage ( P v ), the land surface emissivity (ε) was estimated using Formula (3) [31]. This provided fundamental data for subsequent processing steps.
ε = 0.985 P v + 0.960 ( 1 P v ) + 0.06 P v   ( 1     P v ) 0.004 P v + 0.986
Subsequently, ENVI 5.6 (L3Harris Geospatial, Boulder, CO, USA), a commercial software package for geospatial imagery analysis, was employed for subsequent modeling and analysis [32]. Land surface temperature (LST) was retrieved using the radiative transfer equation via the software’s built-in FLAASH module, thereby deriving blackbody radiation data corresponding to LST (Formula (4)).
D t = [ L L τ ( 1 ε ) L ] / τ ε
In Formula (4), D t (unit: W·m−2·sr−1·µm−1) represents blackbody radiation. L↓ (unit: W·m−2·sr−1·µm−1) and L↑ (unit: W·m−2·sr−1·µm−1) represent downwelling radiance and upwelling radiance values, respectively. “τ” denotes atmospheric transmittance. The values of L↓, τ and L↑ can be obtained by using the Atmospheric Correction Parameter Calculator [33], entering the geographical location of the target city and the observation time to retrieve the corresponding data. Then, through Planck’s Law (Formula (5)), retrieve and determine the Land Surface Temperature (LST) of the study area.
T s = K 2 ln ( K 1 / D t ( T s ) + 1 )
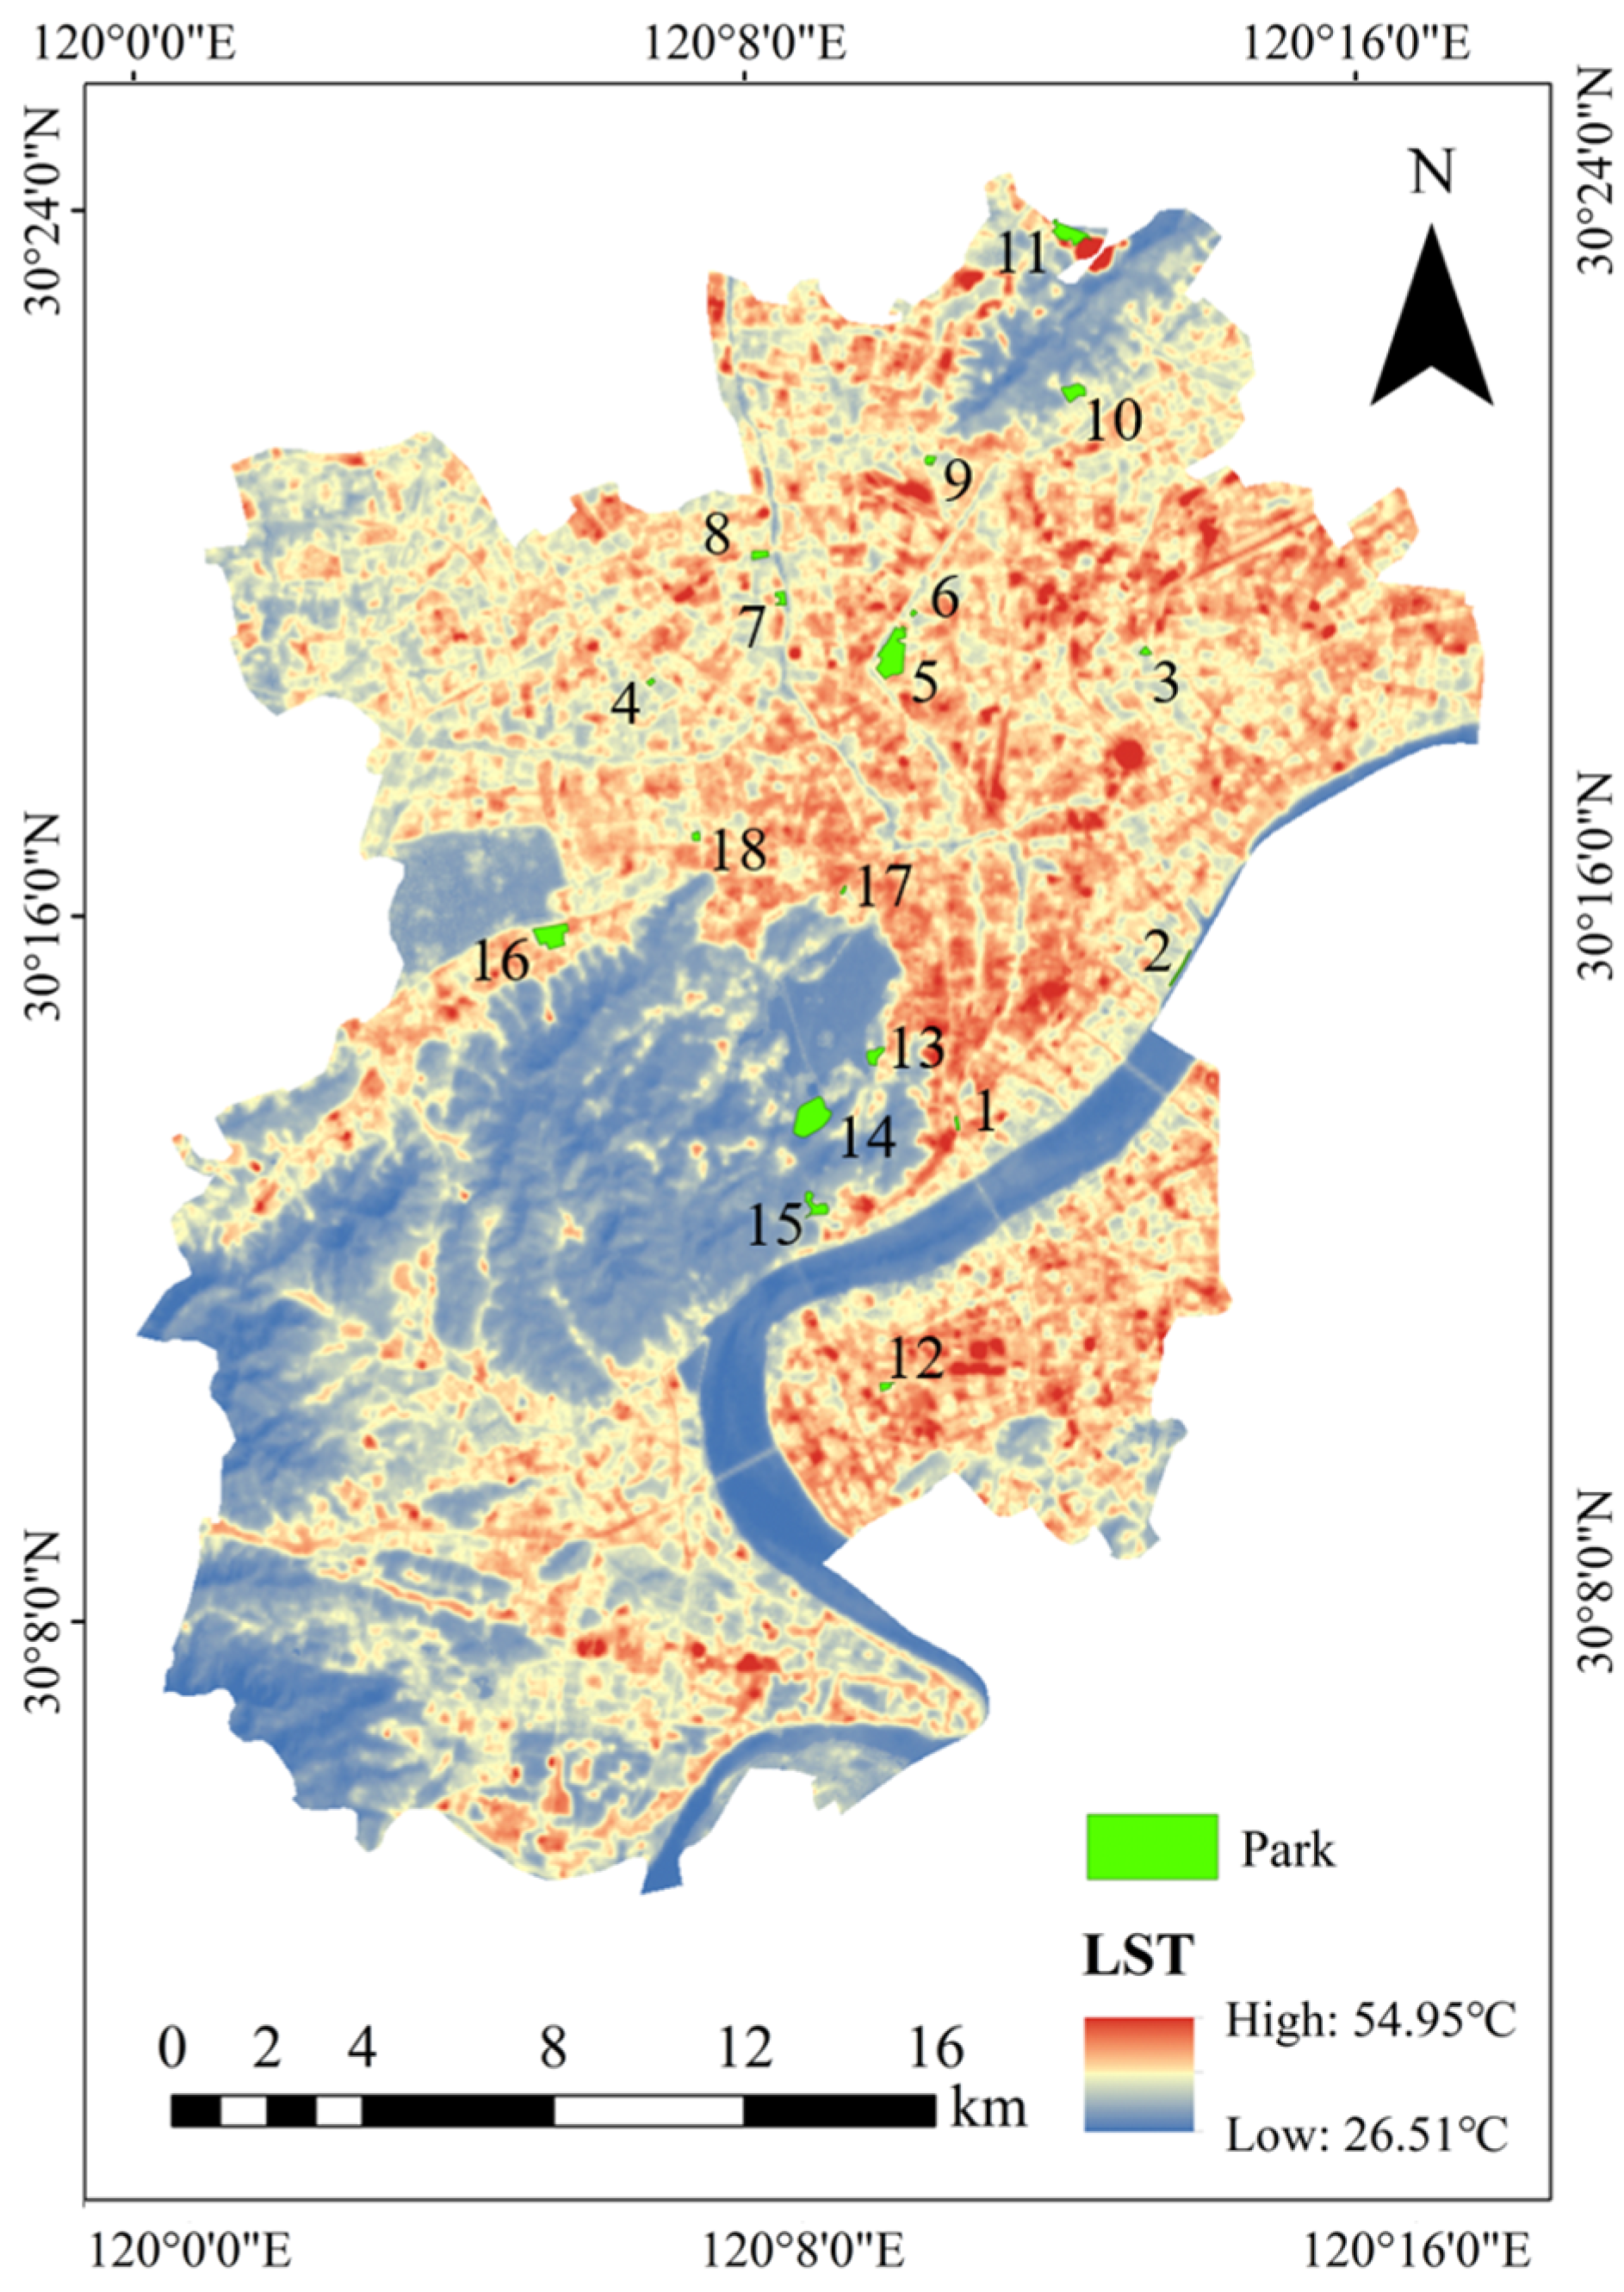
Here, T s represents the surface temperature value in Kelvin. To convert it to degrees Celsius, 273.15 is subtracted. K 1   and   K 2 denote the calibration constants for the Landsat data [34]. The surface temperature data obtained in this study demonstrated strong temporal continuity and spatial heterogeneity. This provided a solid foundation for building a stable and reliable model of urban cooling spaces. By applying the radiative transfer method procedures described above, we acquired the surface temperature vector map necessary for this research. This dataset supported subsequent quantitative assessments of urban park cooling effects, analysis of influencing factors, and related quantitative studies. Consequently, it supplied essential data support for optimizing urban park cooling effects and resource allocation. The retrieved Landsat 8 surface temperature data for the study area are shown in Figure 2.

2.2.2. Quantification of Park Cooling Indicators

Building on prior studies, this research adopted perspectives of maximization and accumulation. Four key indicators—Park Cooling Area (PCA), Park Cooling Efficiency (PCE), Park Cooling Intensity (PCI), and Park Cooling Gradient (PCG)—were employed to comprehensively quantify and evaluate the cooling effects of urban parks within the Hangzhou metropolitan area. This approach provides a theoretical foundation for subsequent investigations into the relationships between influencing factors and urban park cooling performance. The specific metrics are defined as follows: (1) Park Cooling Area (PCA) is defined as the maximum buffer area within which the park’s cooling effect is detectable [35], directly representing its spatial extent of influence. (2) Park Cooling Efficiency (PCE) is defined as the ratio of the maximum cooling range ( S max ) to the park area ( S park ) [36], reflecting the cooling benefit per unit area. (3) Park Cooling Intensity (PCI) is quantified as the difference between the initial inflection point temperature and the average park temperature [37]; this metric captures residents’ intuitive perception of cooling, where higher values correspond to a more pronounced thermal sensation. (4) Park Cooling Gradient (PCG) is defined as the average cooling intensity per unit distance, calculated by dividing PCI by the park’s maximum cooling distance [38]. This indicator characterizes the park’s overall cooling rate and capacity.
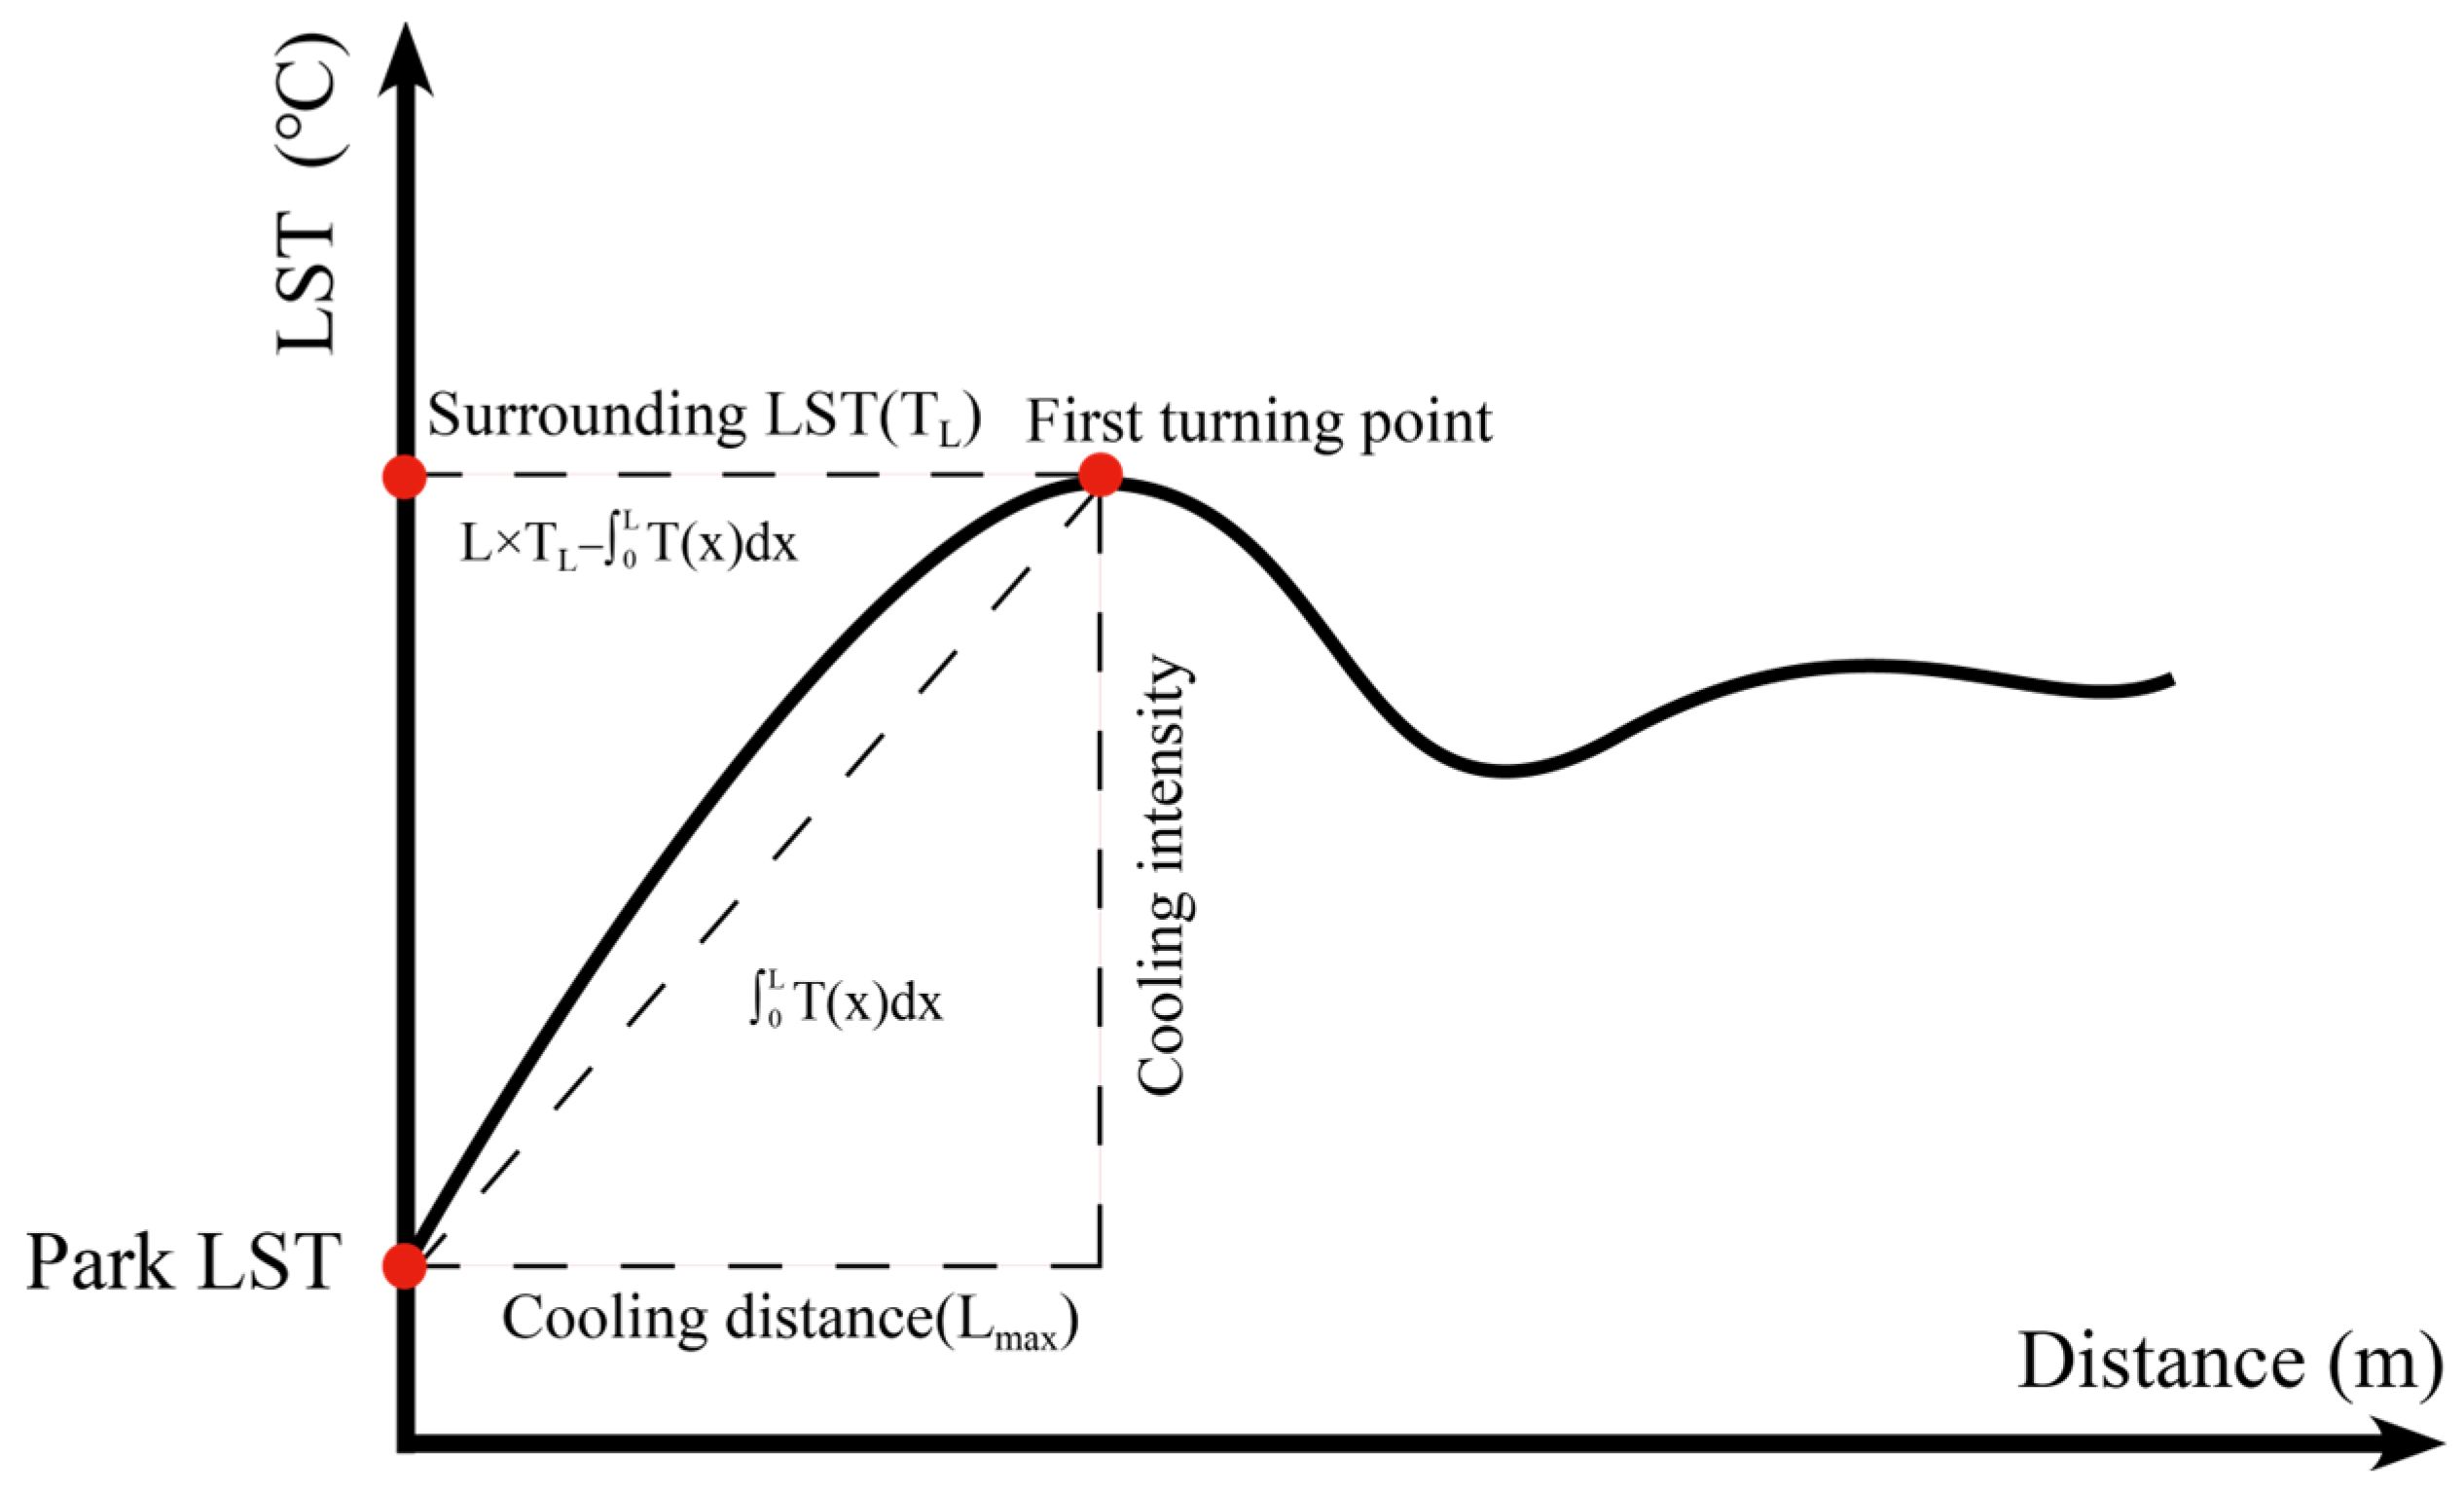
The quantification of the aforementioned indicators is contingent upon the precise determination of the park cooling distance. This distance is defined as the point on the temperature profile where a notable inflection or stabilization occurs [39], corresponding to the maximum spatial extent of the cooling effect (Figure 3). Through the fitting of land surface temperature (LST) data from urban parks in Hangzhou, this study empirically confirmed the existence of a maximum effective cooling distance, thus providing a basis for further analysis. The methodological procedures were as follows. First, informed by prior studies suggesting a maximum cooling distance of approximately 900 m [40,41] and consistent with the 30 m resolution of the satellite imagery employed, a series of 30 contiguous buffers, each 30 m in width, was generated outward from each park boundary. Subsequently, the average LST for each buffer zone was calculated and plotted to construct corresponding LST profile graphs. It should be noted that the analysis specifically targeted the cooling impact of parks on adjacent built-up land within these buffers. The temperature profiles were modeled using a third-order polynomial function, T(x) (Formula (6)), where the x-axis denotes the distance from the park boundary and the y-axis denotes the LST value. This approach establishes a functional relationship between LST and distance from the park edge [42].
T = a x 3 + b x 2 + c x  
As the distance from the park boundary increased, the land surface temperature initially exhibited a rising trend, but the slope of the curve gradually flattened until it approached zero. The point where the curve’s slope was zero was defined as the first inflection point, denoted as “ x 1 ”. The distance from the park boundary to “ x 1 ” was defined as the maximum cooling range, indicating that within this buffer zone, the land surface temperature showed an initial declining trend as the distance from the park increased [43]. The park’s cooling distance is denoted by “ L ”, while “ L max ” refers to the maximum distance at which the cooling effect can be observed. This derivative-based approach was chosen for its objectivity, as it identifies the point where the park’s influence statistically dissipates without relying on arbitrary temperature thresholds. Subsequently, based on the magnitude of the urban park cooling distance, the park’s cooling effect was quantified using four indicators: cooling area, cooling efficiency, cooling intensity, and cooling gradient. This quantification was conducted to analyze the park cooling effect from the perspectives of maximization and accumulation.

2.2.3. Quantifying the Internal and External Landscape Features of Parks

Research indicates that both internal and external landscape characteristics significantly influence the cooling effect of urban parks [44]. Accordingly, this study selected nine landscape characteristics—both within and surrounding the parks—to analyze their impact on urban park cooling (Table 2). These comprised internal characteristics (park area, park perimeter, park shape complexity, proportion of green space, and proportion of water body within the park) and external characteristics (road network density, building density, proportion of green space, and proportion of water bodies within a 300 m buffer zone around each park). This buffer size was chosen based on its common use and validated effectiveness in previous park cooling studies for capturing neighborhood-scale influences [45]. The selection aimed to (1) evaluate how these factors relate to four quantitative cooling indicators (PCA, PCE, PCI, and PCG), (2) explore the mechanisms underlying park cooling formation, (3) identify planning and design strategies that can effectively enhance cooling performance, and (4) improve the practical applicability of cooling effect assessments. Shape complexity was quantified using the Landscape Shape Index (LSI), calculated as follows (Formula (7)):
L S I = P 2 π × S p a r k
Here, P denotes the park perimeter, and Spark represents the park area. A higher LSI value indicates a more irregular park shape [46], signifying a greater degree of shape complexity [47].
To further investigate the relationships between urban park cooling indicators and their potential influencing factors, this study employed Pearson correlation analysis to identify significant positive or negative correlations. Initially, based on a land cover vector map (https://www.tianditu.gov.cn/), vector data for water bodies, vegetation, roads, and buildings within the core urban area of Hangzhou (encompassing Shangcheng, Gongshu, Binjiang, and Xihu Districts) were extracted and clipped using ArcGIS (version 10.8.1; Esri Inc., Redlands, CA, USA) [48]. This procedure generated the following dataset for each of the 18 urban parks for subsequent analysis: internal water body area, internal green space area, road length within a 300 m buffer, building area within a 300 m buffer, green space area within a 300 m buffer, and water body area within a 300 m buffer. The selection of a 300 m buffer for analysis was based on two considerations. First, it aligns with the 30 m spatial resolution of the land surface temperature (LST) satellite imagery, ensuring consistency and scientific rigor in the data analysis. Second, factors within this approximate range exert a relatively strong influence on park cooling effects, with their impact attenuating as distance from the park increases. The results of the Pearson correlation analysis revealed that the internal and external landscape characteristics of the studied urban parks exhibited varying degrees and directions of influence on the different cooling indicators, with several factors demonstrating a statistically significant impact on the parks’ cooling effect. Given the inherent mathematical correlation among park area, perimeter, and LSI, we performed this correlation analysis as an exploratory step. In the subsequent discussion, these metrics were not treated as fully independent drivers; rather, their effects were interpreted collectively as indicators of park ‘scale’ and ‘shape complexity’.

3. Result

3.1. Results of Park Cooling Effect Indicators

This study employed four cooling indicators to quantify and assess the cooling effects of urban parks. Analysis revealed significant variations in these indicators across the 18 studied parks. As summarized in Table 3, the mean values for Park Cooling Area (PCA), Park Cooling Efficiency (PCE), Park Cooling Intensity (PCI), and Park Cooling Gradient (PCG) were 207.01 hectares, 58.61, 0.018, and 0.64 °C, respectively. The observed ranges were 46.40–526.23 hectares for PCA, 3.21–273.22 for PCE, 0.005–0.032 for PCI (it is important to note that PCI is a dimensionless ratio representing the total accumulated thermal load reduction—e.g., a PCI of 0.02 signifies a 2% reduction—not a direct temperature difference), and 0.15–1.17 °C for PCG. Following normalization to a scale of 0.1–0.9, the calculated variances were 0.059 (PCE), 0.080 (PCG), 0.095 (PCA), and 0.084 (PCI). These results suggest that the four indicators exhibited comparable levels of dispersion and variability.
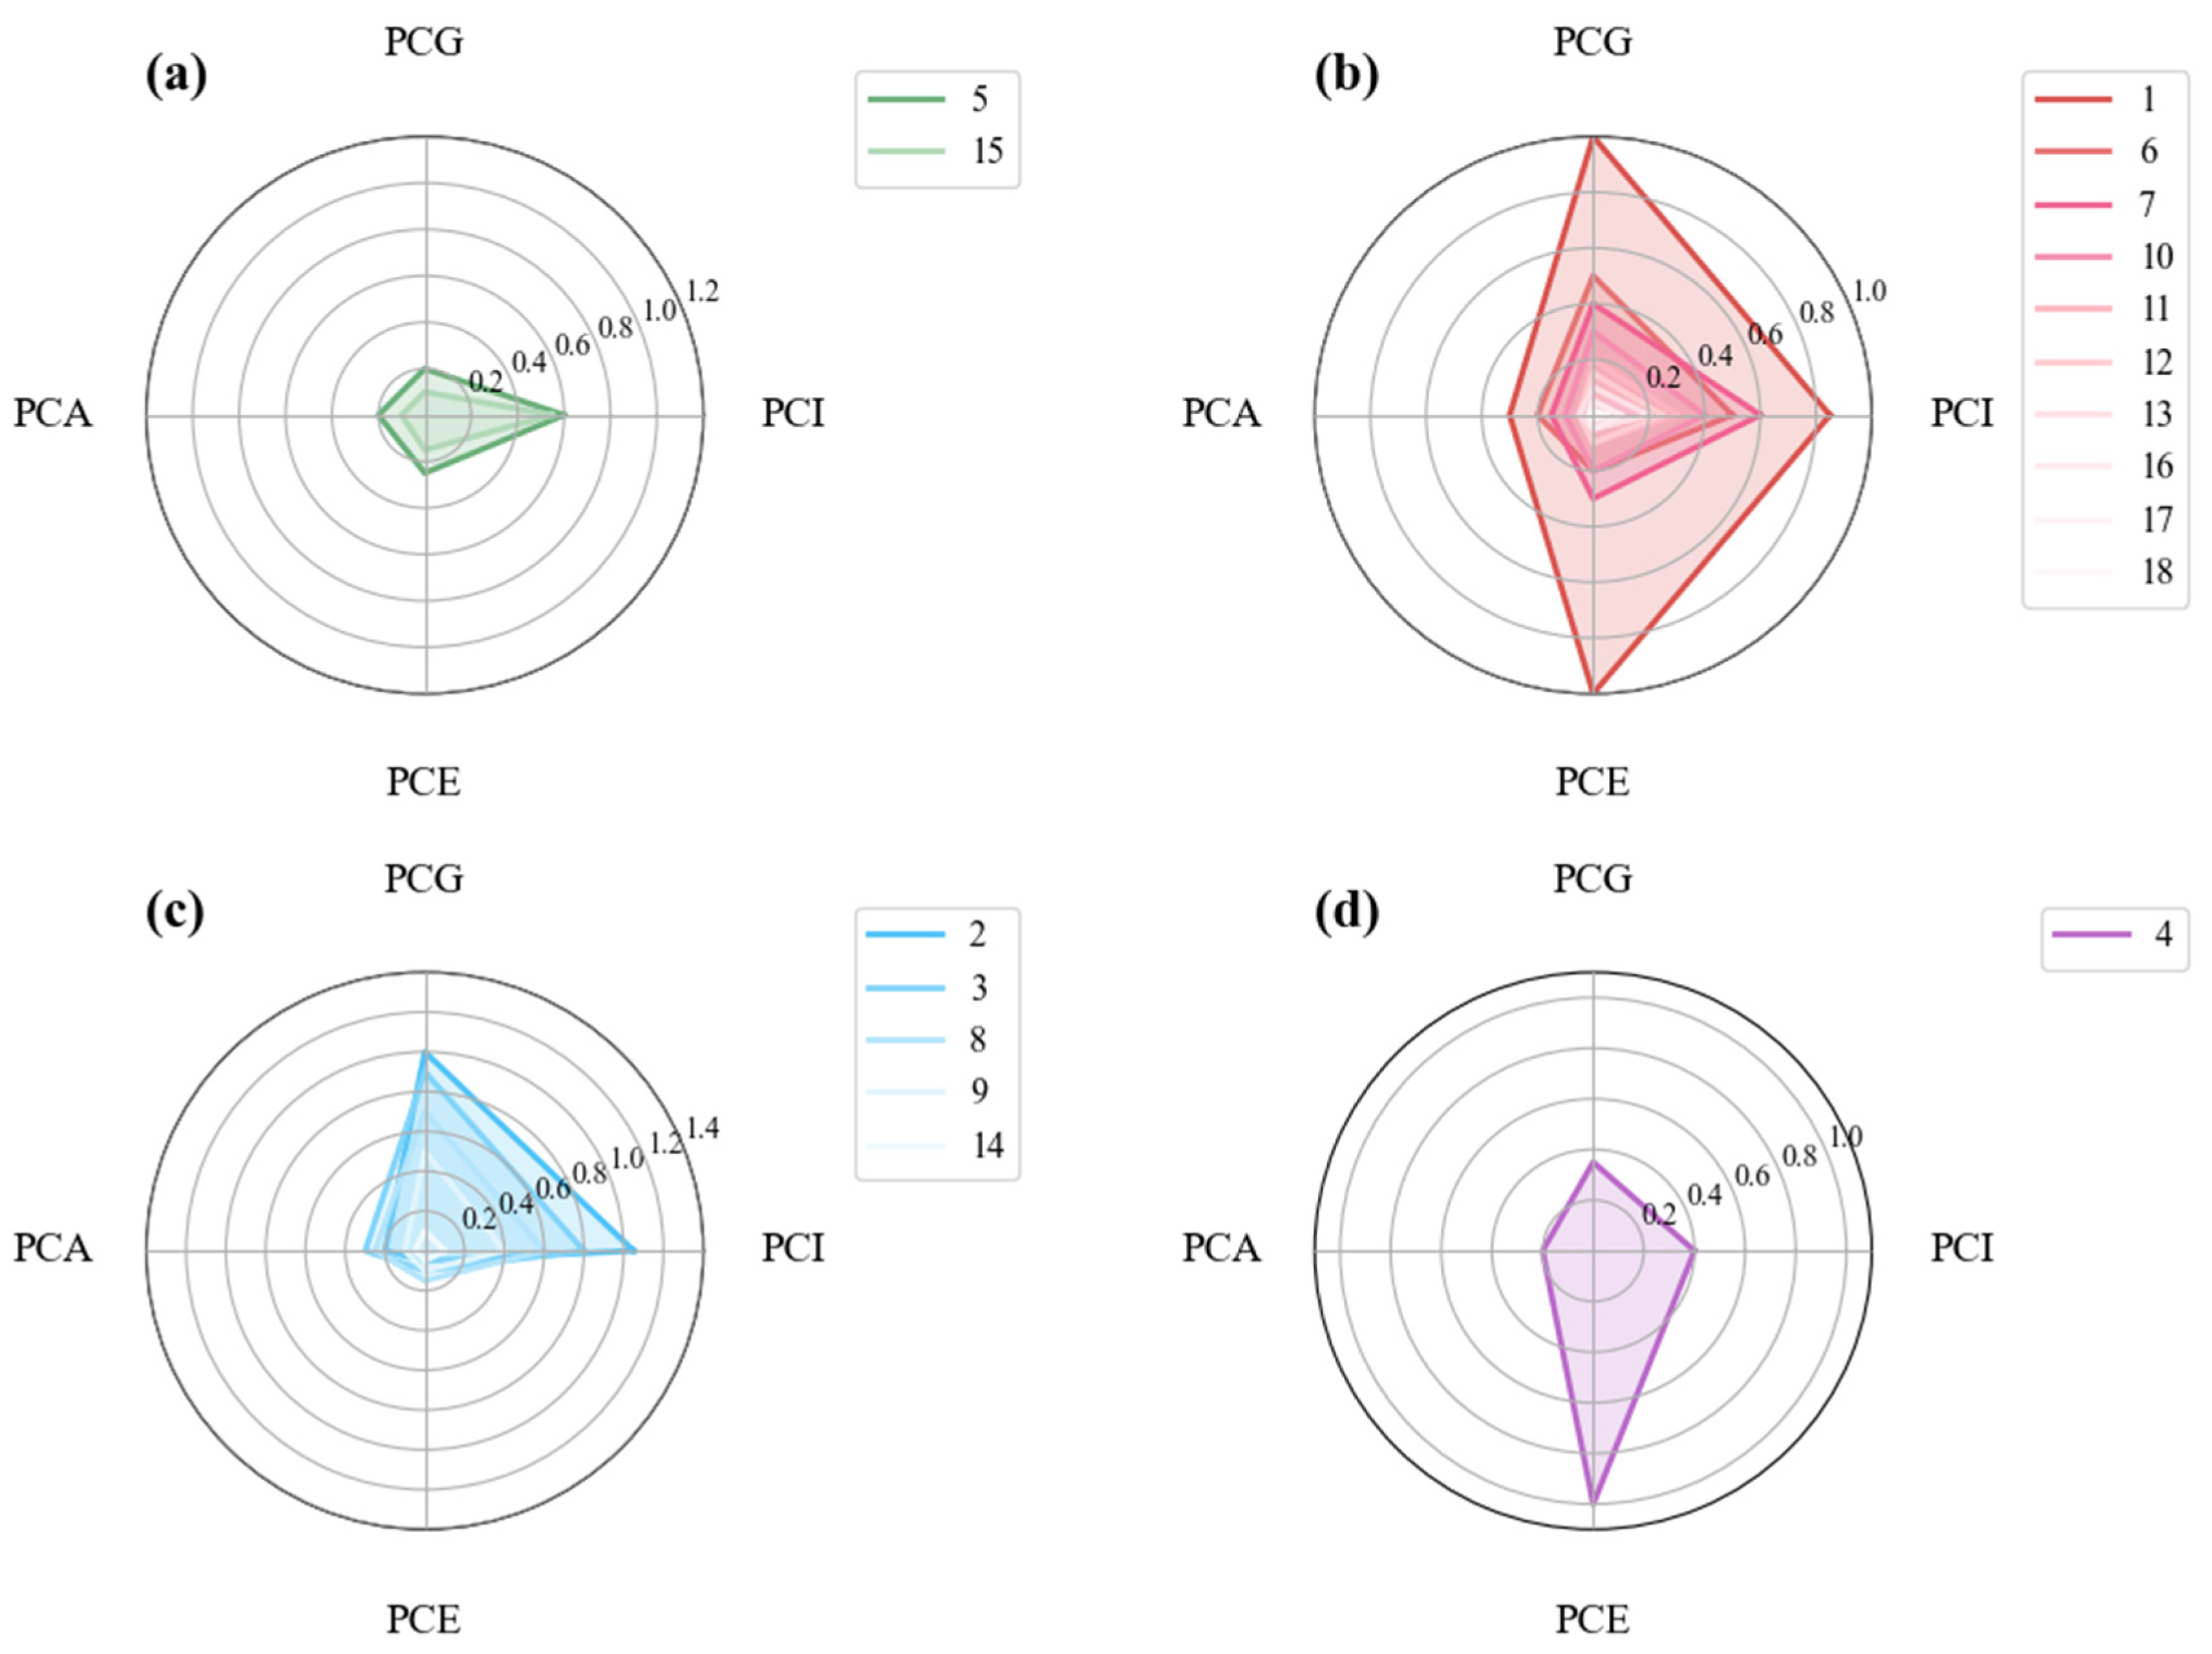
This study utilized the K-means clustering method to classify the 18 urban parks according to the similarity of their cooling indicators. First, the four cooling indicators—Park Cooling Area (PCA), Park Cooling Efficiency (PCE), Park Cooling Intensity (PCI), and Park Cooling Gradient (PCG)—were normalized. Subsequently, the parks were grouped into distinct clusters based on comparable patterns of high or low values across these normalized indicators. The optimal number of clusters, determined to be five, was identified through a comprehensive approach incorporating the silhouette coefficient, elbow, and gap statistic methods [25]. The cluster analysis of the 18 parks (Figure 4) revealed spatial heterogeneity and structural characteristics in their cooling functions. Conducting landscape structure analysis on parks with varying emphases in cooling effects supports the optimization of blue-green infrastructure development in urban parks, with the objective of enhancing or even maximizing their cooling performance.
Based on the cluster analysis of the cooling effects of 18 urban parks, it was found that all parks were assigned to four of the five statistically optimal clusters, with the fifth cluster, representing a uniformly low-performance profile, remaining empty. Consequently, their performance could be classified into four main types. The first type, represented by Chengbei Sports Park and Jiangyangfan Ecological Park, was dominated by Park Cooling Area (PCA) and Park Cooling Gradient (PCG). These parks are typically comprehensive parks with larger areas and substantial water bodies. The second type, which constituted the largest group and included ten parks such as Fengshan Park and Xiwen Park, excelled in PCG due to their superior blue-green infrastructure. The third type, represented by parks like CBD Park and Prince Bay Park, was characterized by relatively high PCG and Park Cooling Intensity (PCI), mostly comprising irregularly shaped parks with dense vegetation. The fourth type, represented by Shenhua Park, was dominated by Park Cooling Efficiency (PCE), manifesting as small parks with complex shapes but high cooling economic efficiency. It is noteworthy that all studied parks belonged to these four well-performing categories, in contrast to a hypothetical fifth category of parks that would perform poorly across all metrics due to sparse vegetation and limited water bodies. This cluster analysis not only revealed the significant spatial heterogeneity in the cooling effects of urban parks but also provided an important scientific basis for optimizing urban park planning and design to effectively mitigate the threats of urban heat island effects and heatwave events [49,50].

3.2. Results of Internal Landscape Characteristics in Parks

Internal landscape characteristics were quantified for the 18 parks using key metrics: area, perimeter, landscape shape index (LSI), and the proportions of water bodies and green space (Table 4). Analysis of these metrics revealed significant inter-park variations in scale, spatial morphology, and landscape composition.
The study parks exhibited considerable variation in site area, reflecting the diversity of the research sample. Prince Bay Park and Chengbei Sports Park were the largest, with areas of 422,275.76 m2 and 415,861.51 m2, respectively. In contrast, Xiwen Park and Mituo Temple Park were notably smaller, each covering approximately 10,000 m2. A positive correlation was observed between park perimeter and area. Chengbei Sports Park had the longest perimeter (3445.79 m), whereas Xiwen Park had the shortest (403.06 m). The Landscape Shape Index (LSI), which quantifies shape complexity and boundary irregularity, ranged from 1.09 to 3.02 across the parks. CBD Park exhibited the highest LSI value (3.02), significantly exceeding those of other parks, indicating the most tortuous boundary morphology and complex spatial geometry. Conversely, Prince Bay Park (LSI = 1.09) and Shenhua Park (LSI = 1.13) had values close to 1, suggesting relatively regular, smooth boundaries and simple shapes. Regarding landscape composition, green space constituted the dominant land cover in most parks. The green space ratio exceeded 40% in all samples, with a high mean coverage. Notably, Prince Bay Park had both the largest area and the highest green space ratio (87.99%), followed by Jiangyangfan Ecological Park (approximately 18.9%). In contrast, no substantial water bodies were present in CBD Park, Shenhua Park, Xiwen Park, or Mituo Temple Park (water proportion: 0%), a characteristic potentially related to their urban settings and functions. In summary, the 18 parks provided strong gradient variation in scale, morphological complexity, and habitat composition, thereby offering a robust dataset for subsequent analysis of the relationship between internal park landscape features and the cooling effect.
In summary, the 18 parks provide a strong gradient of variation in their internal characteristics. The park areas ranged from 1.01 ha to 42.21 ha, with a mean of 11.28 ha. The proportion of green space was consistently high across all parks (Mean = 64.31%, Min = 42.06%), whereas the proportion of water bodies showed greater variability (Mean = 9.76%, ranging from 0% to 32.25%). This wide range and diversity in scale, morphology, and composition offered a robust dataset.

3.3. Results of External Landscape Features in Parks

Regarding the external buffer zone landscape characteristics of the 18 parks, road density and building density were selected to quantify the intensity of surrounding urban development, while the proportion of green space and the proportion of water bodies were selected to evaluate the condition of the external ecological matrix (Table 5).
Statistical analysis revealed significant spatial heterogeneity in the external environments of the studied parks. Concerning artificial construction elements, pronounced disparities were observed in surrounding road density and building density among parks, reflecting the diversity of their urban contexts. Road density served as an indicator not only of traffic accessibility but also of the degree of landscape fragmentation by impervious surfaces. The data indicated that the road densities around Xiwen Park, Chengbei Sports Park, and Jialvyuan Park all exceeded 0.06 km/km2, with the highest value reaching 0.073 km/km2, suggesting their locations within densely networked urban built-up areas. In contrast, Tianziling Ecological Park and Jiangyangfan Ecological Park exhibited markedly lower road densities (approximately 0.01–0.015 km/km2), indicative of minimal anthropogenic disturbance. A comparable pattern was observed for building density. The vicinity of Mituo Temple Park exhibited the highest building density (22.69%), followed by Xiwen Park (20.11%) and Jialvyuan Park (19.62%). This spatial pattern confirms that these parks are embedded within high-density building clusters and represent typical community parks or urban core parks. Conversely, the building densities around Jiangyangfan Ecological Park and Prince Bay Park were merely 1.39% and 4.53%, respectively, denoting a more open spatial configuration in their immediate surroundings. External green spaces and water bodies constitute the ecological matrix facilitating material and energy exchange between the parks and their environs.
The proportion of external green space varied considerably across the sampled parks. Jiangyangfan Ecological Park and Prince Bay Park exhibited the highest proportions, reaching 76.44% and 74.84%, respectively. These high values suggest strong ecological connectivity with adjacent scenic areas or natural hills. Conversely, Tianziling Ecological Park had the lowest external green space proportion (10.22%), while most other parks ranged between 18% and 30%. The proportion of external water bodies demonstrated even greater variability, largely determined by proximity to major urban water systems. CBD Park and Xueshi Park showed significantly higher external water body proportions (45.94% and 34.84%, respectively) than other samples, reflecting distinct waterfront characteristics. In contrast, Mituo Temple Park had no substantial water body in its vicinity (0%), and both Shenhua Park and Tianziling Ecological Park exhibited minimal external water body proportions (<2%). Overall, the external environments of the sampled parks covered a comprehensive spectrum from high-density built-up areas (e.g., Mituo Temple Park, Xiwen Park) to high-naturalness scenic zones (e.g., Jiangyangfan Ecological Park, Prince Bay Park). This environmental gradient provided an ideal basis for examining how external landscape characteristics serve as driving mechanisms influencing the internal ecological performance of parks.

3.4. Results of Factors Influencing the Cooling Effect of Parks

The cooling effect of urban parks was found to be influenced by multiple factors, with significant positive or negative correlations identified between specific park characteristics and the quantified cooling indicators (Table 6).
The internal landscape characteristics of urban parks were found to exert complex influences on their cooling effects. First, while larger park area and perimeter significantly expanded the Park Cooling Area (PCA), they were associated with reduced Park Cooling Efficiency (PCE) and Park Cooling Intensity (PCI) per unit area, as well as a decreased Park Cooling Gradient (PCG). This indicates that unlimited expansion of park size is not optimal and suggests the existence of a threshold for maximizing cooling benefits [51]. Second, parks with more complex shapes exhibited higher PCE values but lower PCI and PCG values, implying that fragmented designs may enhance cooling efficiency per unit area at the expense of overall cooling intensity and gradient. Third, a higher proportion of green space within parks showed positive correlations with PCA and PCE but negative correlations with PCI and PCG. This suggests that increased vegetation coverage, while extending the cooling range and improving efficiency, may attenuate the peak cooling intensity. Finally, the proportion of water bodies within parks showed negative correlations with all cooling indicators. The mechanism underlying this apparent cooling suppression requires further investigation. Therefore, in park planning and design, it is essential to rationally determine park size, optimize vegetation configuration, and carefully consider water body design to balance cooling benefits with resource utilization efficiency.
The external landscape characteristics of parks also critically influenced their cooling effect. Specifically, a higher proportion of impervious surfaces (e.g., roads, buildings) within the 300 m buffer was associated with a greater temperature difference between the park internal and exterior, thus enhancing PCE, PCI, and PCG. However, excessively high building density impeded cold air diffusion, resulting in reduced PCA. In contrast, external green spaces and water bodies demonstrated a dual nature. First, they could generate a cumulative cooling effect when integrated with the park, significantly extending the cooling range (which was positively correlated with PCA). This synergy offers a potential optimization strategy for land-constrained cities. Second, by lowering the ambient temperature, they reduced the temperature difference between the park and its surroundings, thereby diminishing the park’s relative cooling efficiency and intensity, as well as residents’ perception of the cooling gradient (negatively correlated with PCE, PCI, and PCG) [52]. These findings indicate that the cooling performance of parks does not occur in isolation but emerges from close interaction with the surrounding environment. Therefore, to maximize cooling effectiveness, urban planning must shift from the conventional paradigm of creating large, isolated “nodes” with smooth boundaries towards a new approach that prioritizes morphologically complex, irregular green spaces that actively integrate with the wider urban matrix.

4. Discussion

4.1. Threshold of Cooling Efficiency in Urban Parks

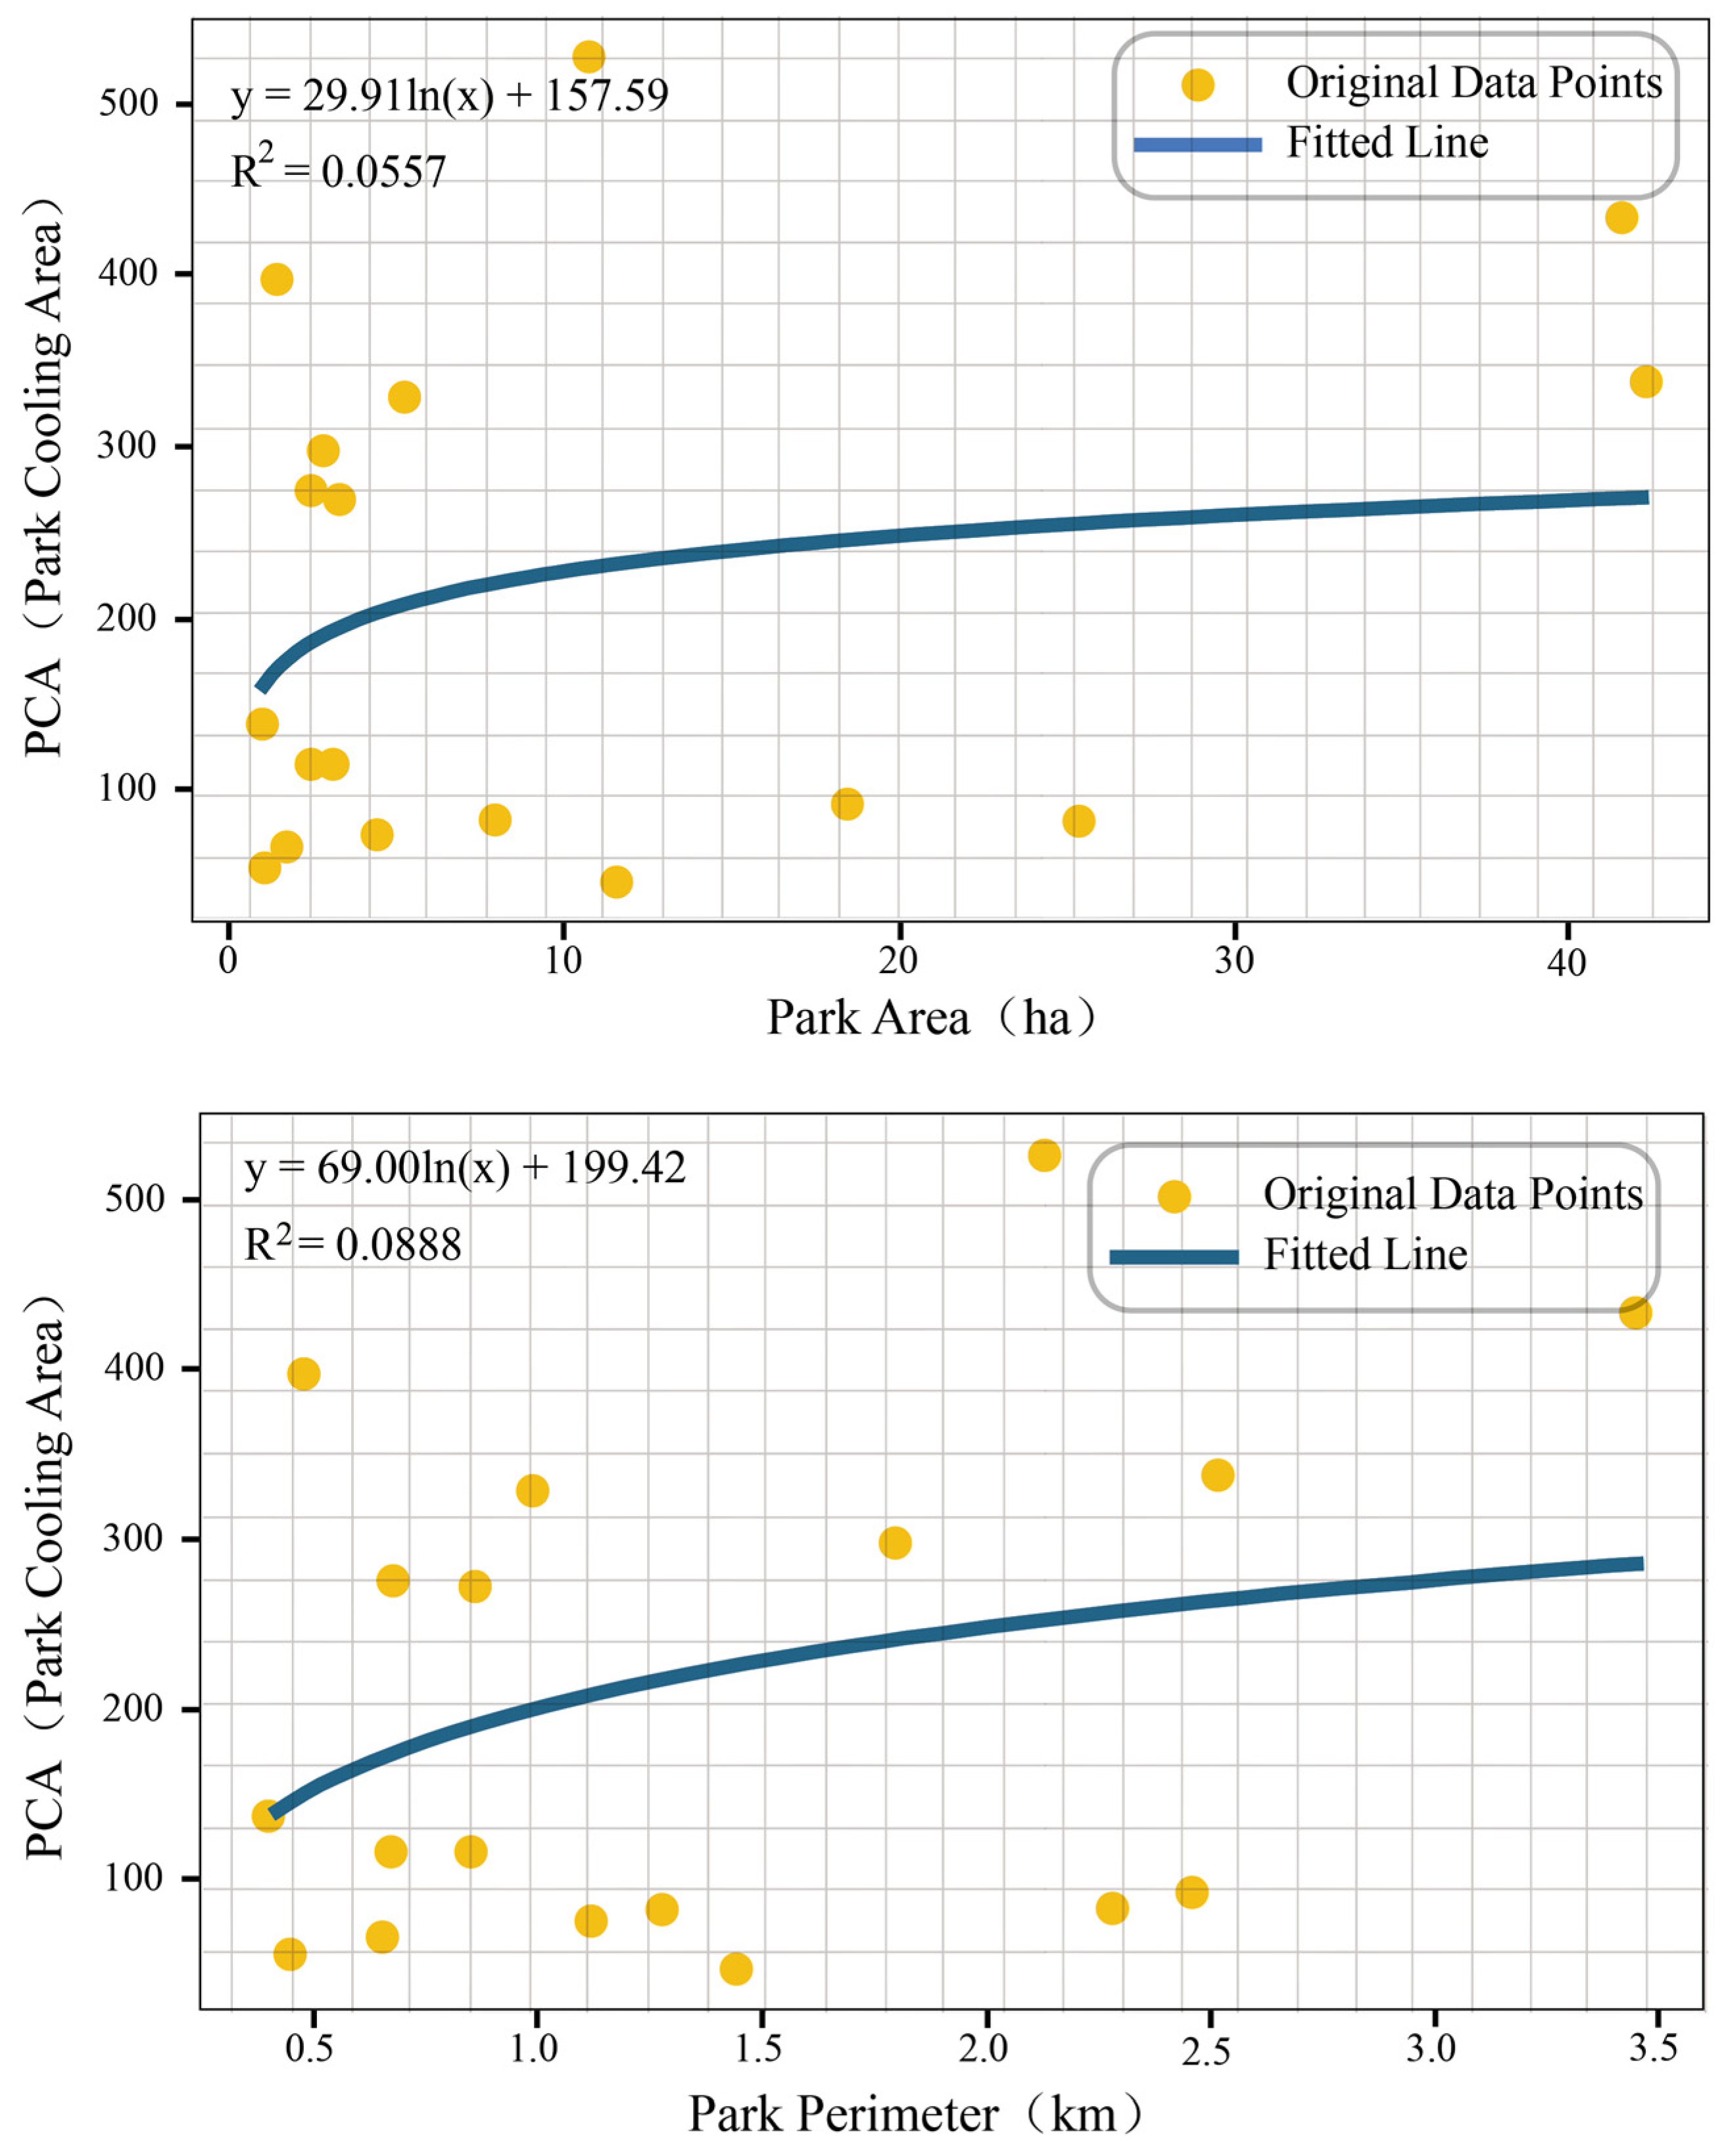
To determine the Threshold Value of Efficiency (TVoE)—a term we define as the point of diminishing returns for park scale—this study employed logarithmic curves to fit the relationships between park area and park perimeter (Figure 5). The slope of the fitted curve indicated that the efficiency threshold for park area was 29.91 hectares. Specifically, when park area exceeded 29.91 hectares, the increase in Park Cooling Area (PCA) was less than the increase in park area. The efficiency threshold for park perimeter was 69.00 km. The trend of the fitted curve between PCA and perimeter suggested that when park size surpasses a certain range, further expansion in area is not associated with a significant increase in the cooling area. This indicates that, from the perspective of PCA, very large parks may be less cost-effective than smaller parks. In this study, the fitted curves between urban park cooling extent and park area/perimeter exhibited relatively low confidence levels. Therefore, while this 29.91-hectare threshold provides a valuable reference, it should be interpreted cautiously as an indicative benchmark rather than a definitive limit, reflecting the general trend of cooling benefits amidst the observed statistical variations. On one hand, this might be influenced by the quantity and attributes of the research samples; on the other hand, it might be because factors such as park shape complexity (e.g., Landscape Shape Index, LSI) and the spatial distribution of internal vegetation and water bodies appear to be more closely linked to the variation in cooling effect. Future research should conduct further quantitative analysis on the relationship between urban park cooling area and park area/perimeter to obtain more precise and compelling data, exploring the planning and layout principles for optimizing park cooling effects. This finding has transformative implications for urban park design, suggesting the need for a paradigm shift away from merely pursuing increases in area or perimeter. To maximize cooling cost-effectiveness, planning must prioritize morphological complexity over sheer size. This involves creating spatial models of a “compact core + edge infiltration” and designing parks with high perimeter-to-area ratios and elongated, penetrating configurations that increase the interface with the urban fabric for enhanced thermal exchange. Furthermore, as discussed in our strategies, these parks should be interconnected via linear green infrastructure, such as green streets and tree-lined paths, to extend their cooling services deep into the city. These principles provide a new, evidence-based pathway for mitigating the urban heat island effect and enhancing urban livability.

4.2. Strategies for Optimizing Park Cooling Effects

For all cities aiming to mitigate the urban heat island effect, our findings provide three clear directives for optimizing park cooling services: (1) regulating internal artificial constructions, (2) enhancing the ecological matrix, and (3) establishing a network of radiating green infrastructure. This approach aims to jointly mitigate the urban heat island (UHI) effect through spatial morphological adjustments and biological community structural improvements.
From the perspective of built environment management (Directive 1), it is necessary to address park boundary morphology and spatial geometric characteristics, the construction of buffers against high-density built-up areas, and the enhancement of blue-green infrastructure connectivity.
Regarding park boundary morphology and spatial geometric characteristics, the boundary fragmentation and high LSI values observed in some parks (e.g., CBD Park, LSI > 3.0) in Table 4 suggest that edge effects should be carefully considered in planning. Although complex boundaries facilitate the infiltration of cool air into the surroundings, they also intensify the intrusion of external heat flow [53]. Therefore, in optimizing the built environment, the integrity and compactness of the park’s core area should be maintained. By constructing a spatial model of “compact core + edge infiltration,” the stability of the internal cool island may be better supported while utilizing ventilation corridors to deliver cool air to surrounding high-density building areas (areas with building density > 20% in Table 5).
Regarding the construction of buffers against high-density built-up areas, some parks (e.g., Xiwen Park, Jialvyuan Park) were found to be surrounded by dense road networks (road density > 0.06) and building clusters, facing intense external thermal radiation stress. A multi-layered, three-dimensional protection system should be established at the park edges. This system would utilize vertical greening, sound-insulating and heat-insulating walls, or micro-topography treatments to mitigate heat conduction from the external hardscape environment [54,55]. Simultaneously, the construction intensity of internal artificial facilities should be controlled, the proportion of non-ecological hard paving should be strictly limited, and the application of permeable concrete and permeable bricks should be promoted to enhance the evaporative cooling potential of the surface.
Regarding the enhancement of blue-green infrastructure connectivity, considering the differences in water body and green space ratios shown in Table 5, built environment interventions should aim to mitigate the park isolation effect. For parks with high surrounding construction intensity and a lack of external water body support (e.g., Mituo Temple Park), linear landscapes such as green streets and tree-lined pedestrian paths should be constructed to physically connect them with city-scale wind corridors and the surrounding blue-green network, forming an integrated urban ventilation and cooling network.
From the perspective of optimizing ecological substrates (Directive 2), it is essential to integrate scientific principles, spatial planning, and social equity. Firstly, priority should be given to the use of native tree species (e.g., Cinnamomum camphora, Ginkgo biloba) combined with multi-layered configurations of trees, shrubs, and grasses. Spatial arrangements should be rationally designed based on functional zoning and pedestrian flow density; for instance, increasing tall canopy trees in high-activity areas to provide sufficient shading. Importantly, plant configuration must reflect social equity. In communities with pronounced heat island effects and low-income populations, high-transpiration and high-shading plants (e.g., Platanus spp., Firmiana simplex) should be prioritized, while small green spaces and water bodies can be incorporated to extend the coverage of cooling services. In summary, comprehensive approaches—such as strategic water layout, vertical greening, bamboo–grass combinations, and ecological corridor design—can significantly enhance the extent and quality of park cooling effects. These measures not only effectively mitigate heat but also balance ecological functions with landscape value, providing residents with a more comfortable and healthy urban environment, thereby contributing to improved urban livability and climate resilience.
Finally, regarding the establishment of a radiating green network (Directive 3), our findings highlight the necessity of extending cooling services beyond park boundaries through green-treed streets and tree-lined paths that radiate out from the parks. These linear green infrastructures act as thermal conduits, delivering cool air from the park core into the surrounding dense urban fabric. By prioritizing mature tree canopies and protected bike lanes along these corridors, cities can effectively cool areas that lack the space for even small pocket parks, thereby enhancing the overall thermal comfort and climate resilience of the entire city.

4.3. Research Deficiencies and Prospects

Focusing on the park cooling effect, this study quantified the influencing factors of the cooling effect, thereby providing a scientific basis for enhancing the cooling effect of urban parks and for their rational planning. However, the current research still has certain shortcomings and limitations. First, the land surface temperature (LST) data acquired from the Landsat 8 OLI_TIRS satellite have limited spatial resolution, resulting in relatively low accuracy [56,57]. These resolution limitations may have a significant impact on the research findings; future studies should prioritize improving the spatial resolution of LST data. Furthermore, research on the diurnal variation in the park cooling effect is constrained by the detection and imaging time of satellite imagery, an aspect that could also be addressed and further optimized in future research. Additionally, it is important to acknowledge that our use of LST serves as a proxy for air temperature, and the 2D landscape metrics simplify the city’s complex 3D morphology. Our correlation-based approach is also exploratory and does not establish causality. Therefore, the results presented throughout this discussion should be interpreted as observed associations that warrant further mechanistic investigation. Finally, future studies should also consider factors such as seasonality, regional characteristics, and vegetation, conducting comparative or more refined investigations to advance research on the park cooling effect. This would contribute to mitigating the ecological impacts of rapid urbanization and global climate change, promoting the equitable distribution of public social resources, and enhancing residents’ physical and mental well-being and environmental livability.

5. Conclusions

This study employed Pearson correlation analysis to quantify the relationships between the cooling effect indicators of 18 urban parks in Hangzhou and their internal and external landscape characteristics. The aim was to explore the factors influencing park cooling effects, thereby providing a scientific basis for planning and design strategies to enhance urban ecological service resilience. The results revealed that all 18 parks exhibited significant cooling effects, with the cooling radiation distance extending several times beyond the park area. Furthermore, correlations between nine indicators—encompassing internal park landscape structure (park area, perimeter, green space ratio, water body ratio, shape complexity, and vegetation growth status) and the surrounding environment (building density, road network density, and green space ratio)—and the cooling effects were quantified. The analysis demonstrated that both internal park characteristics and external environmental factors significantly influenced the cooling effect. These findings provide a scientific basis for optimizing the cooling performance of urban parks. It is suggested that, within limited urban spaces, scientifically informed park planning and design can provide more equitable cooling services. This approach would help mitigate the threats posed by rapid urbanization and global climate change to residents’ well-being and livelihoods, thereby contributing to more livable urban environments.
Specifically, to “scientifically inform park planning”, our findings provide two clear directives for cities like Hangzhou. First, to enhance the performance of existing parks, planners must prioritize morphological complexity over sheer size, designing parks with irregular boundaries and optimizing internal vegetation to boost cooling efficiency. Second, to expand cooling services, the focus should be on developing a network of strategically placed, smaller-to-medium-sized parks, which our results suggest are more cost-effective, rather than concentrating resources on a few mega-parks. Adopting this dual strategy of optimizing quality and expanding quantity offers a tangible pathway for any city to better mitigate urban heat.

Author Contributions

Methodology, T.M., M.Y. and W.N.; software, S.Z. and X.J.; validation, M.Y.; formal analysis, W.N.; investigation, S.Z.; resources, M.Y. and X.J.; data curation, S.Z.; writing—original draft preparation, T.M.; writing—review and editing, T.M.; visualization, X.J.; supervision, M.Y.; project administration, W.N. All authors have read and agreed to the published version of the manuscript.

Funding

This research received no external funding.

Data Availability Statement

The data that has been used is confidential.

Conflicts of Interest

The authors declare that they have no known competing financial interests or personal relationships that could have appeared to influence the work reported in this paper.

References

  1. Acuto, M.; Parnell, S.; Seto, K.C. Building a global urban science. Nat. Sustain. 2018, 1, 2–4. [Google Scholar] [CrossRef]
  2. Aram, F.; García, E.H.; Solgi, E.; Mansournia, S. Urban green space cooling effect in cities. Heliyon 2019, 5, e01339. [Google Scholar] [CrossRef]
  3. Arias, P.; Bellouin, N.; Coppola, E.; Jones, R.; Krinner, G.; Marotzke, J.; Naik, V.; Palmer, M.; Plattner, G.-K.; Rogelj, J.; et al. Climate Change 2021: The Physical Science Basis. In Contribution of Working Group I to the Sixth Assessment Report of the Intergovernmental Panel on Climate Change; Technical Summary; Cambridge University Press: Cambridge, UK, 2021. [Google Scholar]
  4. Chen, Y.; Yue, W.; La Rosa, D. Which communities have better accessibility to green space? An investigation into environmental inequality using big data. Landsc. Urban Plan. 2020, 204, 103919. [Google Scholar] [CrossRef]
  5. Dong, J.; Peng, J.; He, X.; Corcoran, J.; Qiu, S.; Wang, X. Heatwave-induced human health risk assessment in megacities based on heat stress-social vulnerability-human exposure framework. Landsc. Urban Plan. 2020, 203, 103907. [Google Scholar] [CrossRef]
  6. Du, C.; Jia, W.; Chen, M.; Yan, L.; Wang, K. How can urban parks be planned to maximize cooling effect in hot extremes? Linking maximum and accumulative perspectives. J. Environ. Manag. 2022, 317, 115346. [Google Scholar] [CrossRef]
  7. Du, H.; Cai, W.; Xu, Y.; Wang, Z.; Wang, Y.; Cai, Y. Quantifying the cool island effects of urban green spaces using remote sensing Data. Urban For. Urban Green. 2017, 27, 24–31. [Google Scholar] [CrossRef]
  8. Du, H.; Song, X.; Jiang, H.; Kan, Z.; Wang, Z.; Cai, Y. Research on the cooling island effects of water body: A case study of Shanghai, China. Ecol. Indic. 2016, 67, 31–38. [Google Scholar] [CrossRef]
  9. Dymond, J.R.; Shepherd, J.D.; Law, R.; Martin, B.; Schindler, J.; Belliss, S. A cost-effective method for mapping land cover at national scale. Sci. Remote Sens. 2026, 13, 100376. [Google Scholar] [CrossRef]
  10. Fang, W.; Cao, J.; Biswas, A.; Feng, Q.; Wang, Y. Impacts of coordinated development policies on urban heat islands in the Beijing-Tianjin-Hebei urban agglomeration, China. Sustain. Cities Soc. 2024, 112, 105614. [Google Scholar] [CrossRef]
  11. Gao, J.; Zhang, L.; Meng, Q.; Hu, X.; Livesley, S.J. Multi-perspective evaluation framework of three-dimensional cooling and energy saving potential of urban parks based on numerical simulation. Sustain. Cities Soc. 2025, 119, 106109. [Google Scholar] [CrossRef]
  12. Gu, Z.; Liu, Y.; Yuan, L.; Tan, M. A Review on the Methodology of Urban Park Cool Island Impact Mechanism Research. Chin. Landsc. Archit. 2016, 32, 113–115. [Google Scholar]
  13. Guo, A.; Yue, W.; Yang, J.; Li, M.; Zhang, Z.; Xie, P.; Zhang, M.; Lu, Y.; He, T. Quantifying the cooling effect and benefits of urban parks: A case study of Hangzhou, China. Sustain. Cities Soc. 2024, 113, 105706. [Google Scholar] [CrossRef]
  14. Hao, N.; Li, X.; Han, D.; Nie, W. Quantifying the Impact of Street Greening during Full-Leaf Seasons on Emotional Perception: Guidelines for Resident Well-Being. Forests 2024, 15, 119. [Google Scholar] [CrossRef]
  15. Hu, N.; Wang, G.; Ma, Z.; Ren, Z.; Zhao, M.; Meng, J. The cooling effects of urban waterbodies and their driving forces in China. Ecol. Indic. 2023, 156, 111200. [Google Scholar] [CrossRef]
  16. Imran, H.; Kala, J.; Ng, A.; Muthukumaran, S. Effectiveness of green and cool roofs in mitigating urban heat island effects during a heatwave event in the city of Melbourne in southeast Australia. J. Clean. Prod. 2018, 197, 393–405. [Google Scholar] [CrossRef]
  17. Kabisch, N.; Frantzeskaki, N.; Pauleit, S.; Naumann, S.; Davis, M.; Artmann, M.; Haase, D.; Knapp, S.; Korn, H.; Stadler, J.; et al. Nature-based solutions to climate change mitigation and adaptation in urban areas: Perspectives on indicators, knowledge gaps, barriers, and opportunities for action. Ecol. Soc. 2016, 21, 39. [Google Scholar] [CrossRef]
  18. Karlessi, T.; Santamouris, M.; Synnefa, A.; Assimakopoulos, D.; Didaskalopoulos, P.; Apostolakis, K. Development and testing of PCM doped cool colored coatings to mitigate urban heat island and cool buildings. Build. Environ. 2011, 46, 570–576. [Google Scholar] [CrossRef]
  19. Kim, K.; Yi, C.; Lee, S. Impact of urban characteristics on cooling energy consumption before and after construction of an urban park: The case of Gyeongui line forest in Seoul. Energy Build. 2019, 191, 42–51. [Google Scholar] [CrossRef]
  20. Lin, W.; Yu, T.; Chang, X.; Wu, W.; Zhang, Y. Calculating cooling extents of green parks using remote sensing: Method and test. Landsc. Urban Plan. 2015, 134, 66–75. [Google Scholar] [CrossRef]
  21. Liu, H.; Huang, B.; Cheng, X.; Yin, M.; Shang, C.; Luo, Y.; He, B.-J. Sensing-based park cooling performance observation and assessment: A review. Build. Environ. 2023, 245, 110915. [Google Scholar] [CrossRef]
  22. Liu, R.; Zhang, X.; Wang, W.; Wang, Y.; Liu, H.; Ma, M.; Tang, G. Global-scale ERA5 product precipitation and temperature evaluation. Ecol. Indic. 2024, 166, 112481. [Google Scholar] [CrossRef]
  23. Liu, Z.; Fu, L.; Wu, C.; Zhang, Z.; Zhang, Z.; Lin, X.; Li, X.; Hu, Y.; Ge, H. Spatialized importance of key factors affecting park cooling intensity based on the park scale. Sustain. Cities Soc. 2023, 99, 104952. [Google Scholar] [CrossRef]
  24. Meng, Q.; Gao, J.; Zhang, L.; Hu, X.; Qian, J.; Jancsó, T. Coupled cooling effects between urban parks and surrounding building morphologies based on the microclimate evaluation framework integrating remote sensing data. Sustain. Cities Soc. 2024, 102, 105235. [Google Scholar] [CrossRef]
  25. Mitraka, Z.; Chrysoulakis, N.; Kamarianakis, Y.; Partsinevelos, P.; Tsouchlaraki, A. Improving the estimation of urban surface emissivity based on sub-pixel classification of high resolution satellite imagery. Remote Sens. Environ. 2012, 117, 125–134. [Google Scholar] [CrossRef]
  26. Naserikia, M.; Hart, M.A.; Nazarian, N.; Bechtel, B.; Lipson, M.; Nice, K.A. Land surface and air temperature dynamics: The role of urban form and seasonality. Sci. Total Environ. 2023, 905, 167306. [Google Scholar] [CrossRef]
  27. United Nations, Department of Economic and Social Affairs. World Urbanization Prospects: The 2018 Revision; United Nations: New York, NY, USA, 2019; pp. 101–103. [Google Scholar]
  28. Niclòs, R.; Puchades, J.; Coll, C.; Barberà, M.J.; Pérez-Planells, L.; Valiente, J.A.; Sánchez, J.M. Evaluation of Landsat-8 TIRS data recalibrations and land surface temperature split-window algorithms over a homogeneous crop area with different phenological land covers. ISPRS J. Photogramm. Remote Sens. 2021, 174, 237–253. [Google Scholar] [CrossRef]
  29. Nie, W.; Yang, F.; Xu, B.; Bao, Z.; Shi, Y.; Liu, B.; Wu, R.; Lin, W. Spatiotemporal Evolution of Landscape Patterns and Their Driving Forces Under Optimal Granularity and the Extent at the County and the Environmental Functional Regional Scales. Front. Ecol. Evol. 2022, 10, 954232. [Google Scholar] [CrossRef]
  30. Peng, J.; Dan, Y.; Qiao, R.; Liu, Y.; Dong, J.; Wu, J. How to quantify the cooling effect of urban parks? Linking maximum and accumulation perspectives. Remote Sens. Environ. 2021, 252, 112135. [Google Scholar] [CrossRef]
  31. Peng, S.; Piao, S.; Ciais, P.; Friedlingstein, P.; Ottle, C.; Bréon, F.-M.; Nan, H.; Zhou, L.; Myneni, R.B. Surface urban heat island across 419 global big cities. Environ. Sci. Technol. 2012, 46, 696–703. [Google Scholar] [CrossRef] [PubMed]
  32. Phuyal, P.; Kramer, I.M.; Kadel, I.; Wouters, E.; Magdeburg, A.; Groneberg, D.A.; Kuch, U.; Ahrens, B.; Dhimal, M.L.; Dhimal, M.; et al. On people’s perceptions of climate change and its impacts in a hotspot of global warming. PLoS ONE 2025, 20, e0317786. [Google Scholar] [CrossRef] [PubMed]
  33. Qiu, K.; Jia, B. The roles of landscape both inside the park and the surroundings in park cooling effect. Sustain. Cities Soc. 2020, 52, 101864. [Google Scholar] [CrossRef]
  34. Ramanathan, V.; Head, P.; Eltahir, E.; Daigger, G.T.; Smith, C.E.; Yokohari, M.; Childs, P.; Ma, J.; Yu, K. Climate Design: Holistic Solution for Climate Resilience. Landsc. Arch. Front. 2025, 13, 87–97. [Google Scholar]
  35. Ren, C.; Yang, R.; Cheng, C.; Xing, P.; Fang, X.; Zhang, S.; Wang, H.; Shi, Y.; Zhang, X.; Kwok, Y.T.; et al. Creating breathing cities by adopting urban ventilation assessment and wind corridor plan—The implementation in Chinese cities. J. Wind Eng. Ind. Aerodyn. 2018, 182, 170–188. [Google Scholar] [CrossRef]
  36. Shi, M.; Chen, M.; Jia, W.; Du, C.; Wang, Y. Cooling effect and cooling accessibility of urban parks during hot summers in China’s largest sustainability experiment. Sustain. Cities Soc. 2023, 93, 104519. [Google Scholar] [CrossRef]
  37. Su, W.; Chang, Q. Nature-based Solutions for Urban Heat Mitigation and Implementation Path Thereof: A Case Study of Beijing. Landsc. Archit. 2022, 29, 26–32. [Google Scholar]
  38. Sun, F.; Xiang, J.; Tao, Y.; Tong, C.; Che, Y. Mapping the social values for ecosystem services in urban green spaces: Integrating a visitor-employed photography method into SolVES. Urban For. Urban Green. 2019, 38, 105–113. [Google Scholar] [CrossRef]
  39. Sun, R.; Chen, L. How can urban water bodies be designed for climate adaptation? Landsc. Urban Plan. 2012, 105, 27–33. [Google Scholar] [CrossRef]
  40. Tang, B.; Lü, Y.; Wang, H. Identifying conservation priority areas of ecosystem services by simulating preference scenarios. Ecol. Front. 2025, 45, 1613–1624. [Google Scholar] [CrossRef]
  41. Tian, H.; Qin, Y.; Li, Z.; Han, C.; Ding, Q.; Li, Q.; Ren, Q.; Dai, W.; Qin, H.; Chen, H.; et al. Changes of ecosystem services in Beijing and its multi-scale response to urbanization. Acta Ecol. Sin. 2025, 45, 2209–2224. [Google Scholar]
  42. Tian, P.; Li, J.; Cao, L.; Pu, R.; Wang, Z.; Zhang, H.; Chen, H.; Gong, H. Assessing spatiotemporal characteristics of urban heat islands from the perspective of an urban expansion and green infrastructure. Sustain. Cities Soc. 2021, 74, 103208. [Google Scholar] [CrossRef]
  43. Tong, Z.; Yang, J.; Liu, Y.; Zhang, Z.; Liu, S.; Lu, Y.; Pang, B.; An, R. Cooling and optimizing urban heat island based on a thermal knowledge-informed multi-type ant colony model. Remote Sens. Environ. 2024, 306, 114138. [Google Scholar] [CrossRef]
  44. Wolch, J.R.; Byrne, J.; Newell, J.P. Urban green space, public health, and environmental justice: The challenge of making cities ‘just green enough’. Landsc. Urban Plan. 2014, 125, 234–244. [Google Scholar] [CrossRef]
  45. Xiao, Y.; Piao, Y.; Wei, W.; Pan, C.; Lee, D.; Zhao, B. A comprehensive framework of cooling effect-accessibility-urban development to assessing and planning park cooling services. Sustain. Cities Soc. 2023, 98, 104817. [Google Scholar] [CrossRef]
  46. Huang, X.; Wang, X.; Li, J.; Zhang, M.; Chen, S.; Xu, B.; Nie, W. Multi-Scale Applicability Analysis of Three Ecological Network Construction Methods in Resilience Assessment. Land Degrad. Dev. 2025, 36, 1594–1613. [Google Scholar] [CrossRef]
  47. Xu, H.; Shi, T.; Wang, M.; Fang, C.; Lin, Z. Predicting effect of forthcoming population growth–induced impervious surface increase on regional thermal environment: Xiong’an New Area, North China. Build. Environ. 2018, 136, 98–106. [Google Scholar] [CrossRef]
  48. Xu, T.; Zhang, L.; Xie, H.Q.; Xu, L. The multifaceted effects of high-temperature exposure on human health in a changing climate. Ecol. Front. 2025, 45, 1874–1876. [Google Scholar] [CrossRef]
  49. Yan, M.; Chen, L.; Leng, S.; Sun, R. Effects of local background climate on urban vegetation cooling and humidification: Variations and thresholds. Urban For. Urban Green. 2023, 80, 127840. [Google Scholar] [CrossRef]
  50. Yang, M.; Nie, W.; Wu, R.; Yan, H.; Tian, S.; Wang, K.; Shi, L.; Cheng, X.; Ji, T.; Bao, Z. Towards more equitable cooling services of urban parks: Linking cooling effect, accessibility and attractiveness. J. Environ. Manag. 2024, 370, 122475. [Google Scholar] [CrossRef] [PubMed]
  51. Yao, R.; Wang, L.; Huang, X.; Niu, Z.; Liu, F.; Wang, Q. Temporal trends of surface urban heat islands and associated determinants in major Chinese cities. Sci. Total. Environ. 2017, 609, 742–754. [Google Scholar] [CrossRef]
  52. Yu, K. Climate Design for One Planet. Landsc. Arch. Front. 2024, 12, 4–7. [Google Scholar] [CrossRef]
  53. Yu, Z.; Guo, X.; Jørgensen, G.; Vejre, H. How can urban green spaces be planned for climate adaptation in subtropical cities? Ecol. Indic. 2017, 82, 152–162. [Google Scholar] [CrossRef]
  54. Yue, X.; Lin, J.; Yang, Y. Mitigation Role of Urban Green Space in Reducing Heat Island Effect—A Case Study of Central Urban Area of Baoding City. Landsc. Archit. 2018, 25, 66–70. [Google Scholar]
  55. Zhang, N.; Zhen, W.; Shi, D.; Zhong, C.; Li, Y. Quantification and mapping of the cooling effect of urban parks on the temperate monsoon climate zone. Sustain. Cities Soc. 2024, 101, 105111. [Google Scholar] [CrossRef]
  56. Zhang, Q.; Zhou, D.; Xu, D.; Rogora, A. Correlation between cooling effect of green space and surrounding urban spatial form: Evidence from 36 urban green spaces. Build. Environ. 2022, 222, 109375. [Google Scholar] [CrossRef]
  57. Zhu, W.; Sun, J.; Yang, C.; Liu, M.; Xu, X.; Ji, C. How to Measure the Urban Park Cooling Island? A Perspective of Absolute and Relative Indicators Using Remote Sensing and Buffer Analysis. Remote Sens. 2021, 13, 3154. [Google Scholar] [CrossRef]
Figure 1. The location of the research areas.
Buildings 16 00630 g001
Figure 2. Spatial distribution pattern of LST (The park numbers in the image are consistent with those in Table 1).
Buildings 16 00630 g002
Figure 3. Visualization of LST change curve of park cooling process.
Buildings 16 00630 g003
Figure 4. Radar charts illustrating the four distinct ‘Cooling Bundle’ profiles identified among the urban parks: (a) Type 1, (b) Type 2, (c) Type 3, and (d) Type 4. Park identification numbers in the legends correspond to those in Table 1.
Buildings 16 00630 g004
Figure 5. Relationship between the PCA and park areas well as park perimeter.
Buildings 16 00630 g005
Table 1. The attributes of 18 urban parks.
Serial NumberEnglish NameArea/Hectares
(Area/Acres)
Serial NumberEnglish NameArea/Hectares
(Area/Acres)
1Fengshan Park1.66 (4.11)10Tiger Mountain Park11.57 (28.60)
2CBD Park2.84 (7.02)11Tianzi Ridge Ecological Park18.49 (45.69)
3Caozhuang Park2.47 (6.10)12Gaojiao Park3.00 (7.41)
4Shenhua Park1.45 (3.58)13Xueshi Park7.97 (19.69)
5North City Sports Park41.59 (102.77)14Taiziwan Park42.21 (104.30)
6Xiwen Park1.01 (2.50)15Jiangyangfan Ecological Park10.75 (26.56)
7Canal Tiandi Park4.46 (11.02)16West City Leisure Park25.37 (62.69)
8Zheyao Park5.27 (13.02)17Mituosi Park1.04 (2.57)
9Taoyuan Central Park3.17 (7.83)18Jialvyuan Park2.55 (6.30)
Table 2. The influencing factors on the park cooling effect.
CategorySub-CategoryInfluencing FactorsDefinition
InternalPark GeometryPark—Shape—areaThe area of urban parks
Park—Shape—circumferenceThe circumference of the urban park
Park—Complex in shapeThe complexity of the shapes of urban parks
Park CompositionPark—water body—proportionThe proportion of water bodies in urban parks
Park—green space—proportionThe proportion of vegetation in urban parks
ExternalSurrounding
Environment (300 m Buffer)
Buffer zone—Road—densityThe road network density within the 300 m buffer zone of the urban park
Buffer zone—Building—densityThe building density within the 300 m buffer zone of the urban park
Buffer zone—Green space—proportionThe proportion of vegetation within the 300 m buffer zone of the urban park
Buffer zone—Water body—proportionThe proportion of water bodies within the 300 m buffer zone of urban parks
Table 3. The indicator data of park cooling effect.
Serial NumberPark NamePark Cooling Area (PCA) (ha(Acres))Park Cooling Efficiency (PCE)Park Cooling Intensity (PCI)Park Cooling Gradient (PCG)
1Fengshan Park64.1631 (158.5512)38.59500.01230.4704
2CBD Park297.9927 (736.3347)105.09410.02290.7754
3CaoZhuang Park274.6435 (678.6534)111.26870.03151.1688
4Shenhua Park396.8403 (980.6094)273.22330.01470.5219
5Chengbei Sports Park433.3634 (1070.8643)10.42090.01960.7257
6Xiwen Park138.3300 (341.8228)137.19980.02741.0031
7Canal heaven and earth park73.4091 (181.4011)16.44940.01470.5189
8Zheyao Park328.0625 (810.6617)62.21170.02440.8756
9Taoyuan Central Park270.9284 (669.4795)85.51840.0291.0584
10Hushan Park46.4007 (114.6593)4.00880.00450.1504
11Tianziling Ecological Park91.4336 (225.9348)4.94470.01030.3997
12Higher Education Park114.5708 (283.1118)38.19910.01950.7399
13Bachelor’s Park81.3710 (201.0700)10.21580.0070.2317
14Prince Bay Park337.8643 (834.8770)8.00480.01790.5554
15Jiangyangfan Ecological Park526.2382 (1300.3551)48.93650.01950.6405
16Chengxi Leisure Park81.4635 (201.3000)3.21130.00450.1596
17Mituo Temple Park54.5149 (134.7088)52.52180.01640.6248
18Jialvyuan Park114.5641 (283.0950)44.89380.0240.8795
SummaryMean212.5855 (525.3129)64.16270.01720.6417
Max526.2382 (1300.3551)273.22330.03151.1688
Min46.4007 (114.6593)3.21130.00450.1504
Table 4. The data of internal landscape characteristics in parks.
Serial NumberPark NameArea (m2)Circumference (m)LSIProportion of Water BodyProportion of Green Space
1Fengshan Park16,624.7000657.60211.44000.18940.6028
2CBD Park28,354.85281798.86843.01740.00000.5523
3Caozhuang Park24,682.9006680.09591.22060.18820.5656
4Shenhua Park14,524.3951481.70731.12750.00000.7935
5Chengbei Sports Park415,861.51333445.79061.50790.10820.5377
6Xiwen Park10,082.3765403.06151.13240.00000.5993
7Canal heaven and earth park44,627.15451118.84781.49400.05160.6621
8Zheyao Park52,733.2407988.55771.21370.17000.6080
9Taoyuan Central Park31,680.7006860.75691.36450.00970.6818
10Hushan Park115,748.30211441.25931.19470.32250.5469
11Tianziling Ecological Park184,911.31702457.51311.61110.00300.6476
12Higher Education Park29,993.0922845.79321.37710.07110.6629
13Bachelor’s Park79,652.38771277.62871.27730.09500.6633
14Prince Bay Park422,075.76092516.58241.09300.04790.8799
15Jiangyangfan Ecological Park107,534.84092129.03631.83130.08350.7941
16Chengxi Leisure Park253,679.64102281.80881.27760.09340.7239
17Mita Temple Park10,379.4862449.29351.24510.00000.4206
18Jialvyuan Park25,518.9378672.81261.18830.11680.6636
Table 5. The data of park external environment.
Serial NumberPark NameRoad DensityBuilding DensityGreen Space RatioWater Body Proportion
1Fengshan Park0.04830.16900.18120.0263
2CBD Park0.03040.04840.18970.4594
3Caozhuang Park0.05270.11870.26370.0336
4Shenhua Park0.04120.11870.29930.0194
5Chengbei Sports Park0.06070.15270.18300.1070
6Xiwen Park0.07320.20110.21200.2124
7Canal heaven and earth park0.03770.15310.22680.1759
8Zheyao Park0.03550.07880.18420.1151
9Taoyuan Central Park0.02460.08320.25000.0707
10Hushan Park0.03070.08040.48420.0544
11Tianziling Ecological Park0.01100.05770.10220.0070
12Higher Education Park0.04180.18530.27820.0313
13Bachelor’s Park0.02960.10450.25440.3484
14Prince Bay Park0.01990.04530.74840.1698
15Jiangyangfan Ecological Park0.01550.01390.76440.0448
16Chengxi Leisure Park0.03940.15370.24630.0725
17Mita Temple Park0.04650.22690.16830.0000
18Jialvyuan Park0.06030.19620.20100.0624
Table 6. Pearson correlation coefficients of the influenced factors and the park cooling indexes.
Indicator CategoryInfluencing FactorsPark Cooling Area (PCA)Park Cooling Efficiency (PCE)Park Cooling Intensity (PCI)Park Cooling Gradient (PCG)
Internal park landscape Park—Shape—area0.298−0.478 *−0.274−0.313
Park—Shape—circumference0.362−0.517 *−0.301−0.343
Park—Complex in shape0.2330.0060.0960.057
Park—water body—proportion−0.158−0.341−0.230−0.215
Park—green space—proportion0.3830.107−0.103−0.172
External park landscapeBuffer zone—Road—density−0.1670.2710.3440.400
Buffer zone—Building—density−0.517 *0.0730.0460.131
Buffer zone—Green space—proportion0.458−0.111−0.077−0.165
Buffer zone—Water body—proportion0.044−0.0110.053−0.007
Note: * Significant at the 0.05 level (two-tailed).
Disclaimer/Publisher’s Note: The statements, opinions and data contained in all publications are solely those of the individual author(s) and contributor(s) and not of MDPI and/or the editor(s). MDPI and/or the editor(s) disclaim responsibility for any injury to people or property resulting from any ideas, methods, instructions or products referred to in the content.