Article

Influence of Conductors on the Dynamic Responses of Reinforced Concrete Pole–Conductor Systems Under Seismic Action

1
Yunnan Power Grid Company Ltd., Kunming 650217, China
2
School of Civil Engineering, Zhengzhou University, Zhengzhou 450001, China
*
Author to whom correspondence should be addressed.
Buildings 2026, 16(3), 618; https://doi.org/10.3390/buildings16030618
Submission received: 30 December 2025 / Revised: 24 January 2026 / Accepted: 30 January 2026 / Published: 2 February 2026
(This article belongs to the Special Issue Structural Engineering in Building)

Abstract

With the expansion of the power system scale and the increasing complexity of distribution network structures, the safety of power facilities has become increasingly prominent under natural disasters, such as earthquakes. As the core support of distribution networks, the seismic performance of reinforced concrete pole–conductor systems directly affects the safe operation of power systems. Compared with single-pole structures, the coupling effect between poles and conductors significantly complicates the mechanical characteristics of the system. This paper focuses on a typical 10 kV distribution line-reinforced concrete pole–conductor system. A refined “three-pole two-conductor” finite element model considering the geometric nonlinearity of conductors is established via ANSYS (Analysis System) software. Through modal analysis and nonlinear dynamic time–history analysis, the natural vibration frequencies, displacement responses of poles, and root stress distribution patterns under different conductor spans (60 m, 80 m, and 100 m) and span-to-height ratios (5–6.7) were systematically investigated. The results indicate that the mass–sag effect of conductors reduces the natural vibration frequency of the pole–conductor system by 10–18%, and its dynamic influence exhibits nonlinear differences as the span increases. When the span-to-height ratio is within the range of 5–6.7, the vibration of conductors significantly amplifies the stress at the pole roots, suggesting that a dynamic amplification factor of up to 1.17 was observed in this study, which can serve as a reference for the seismic design of similar distribution lines.

1. Introduction

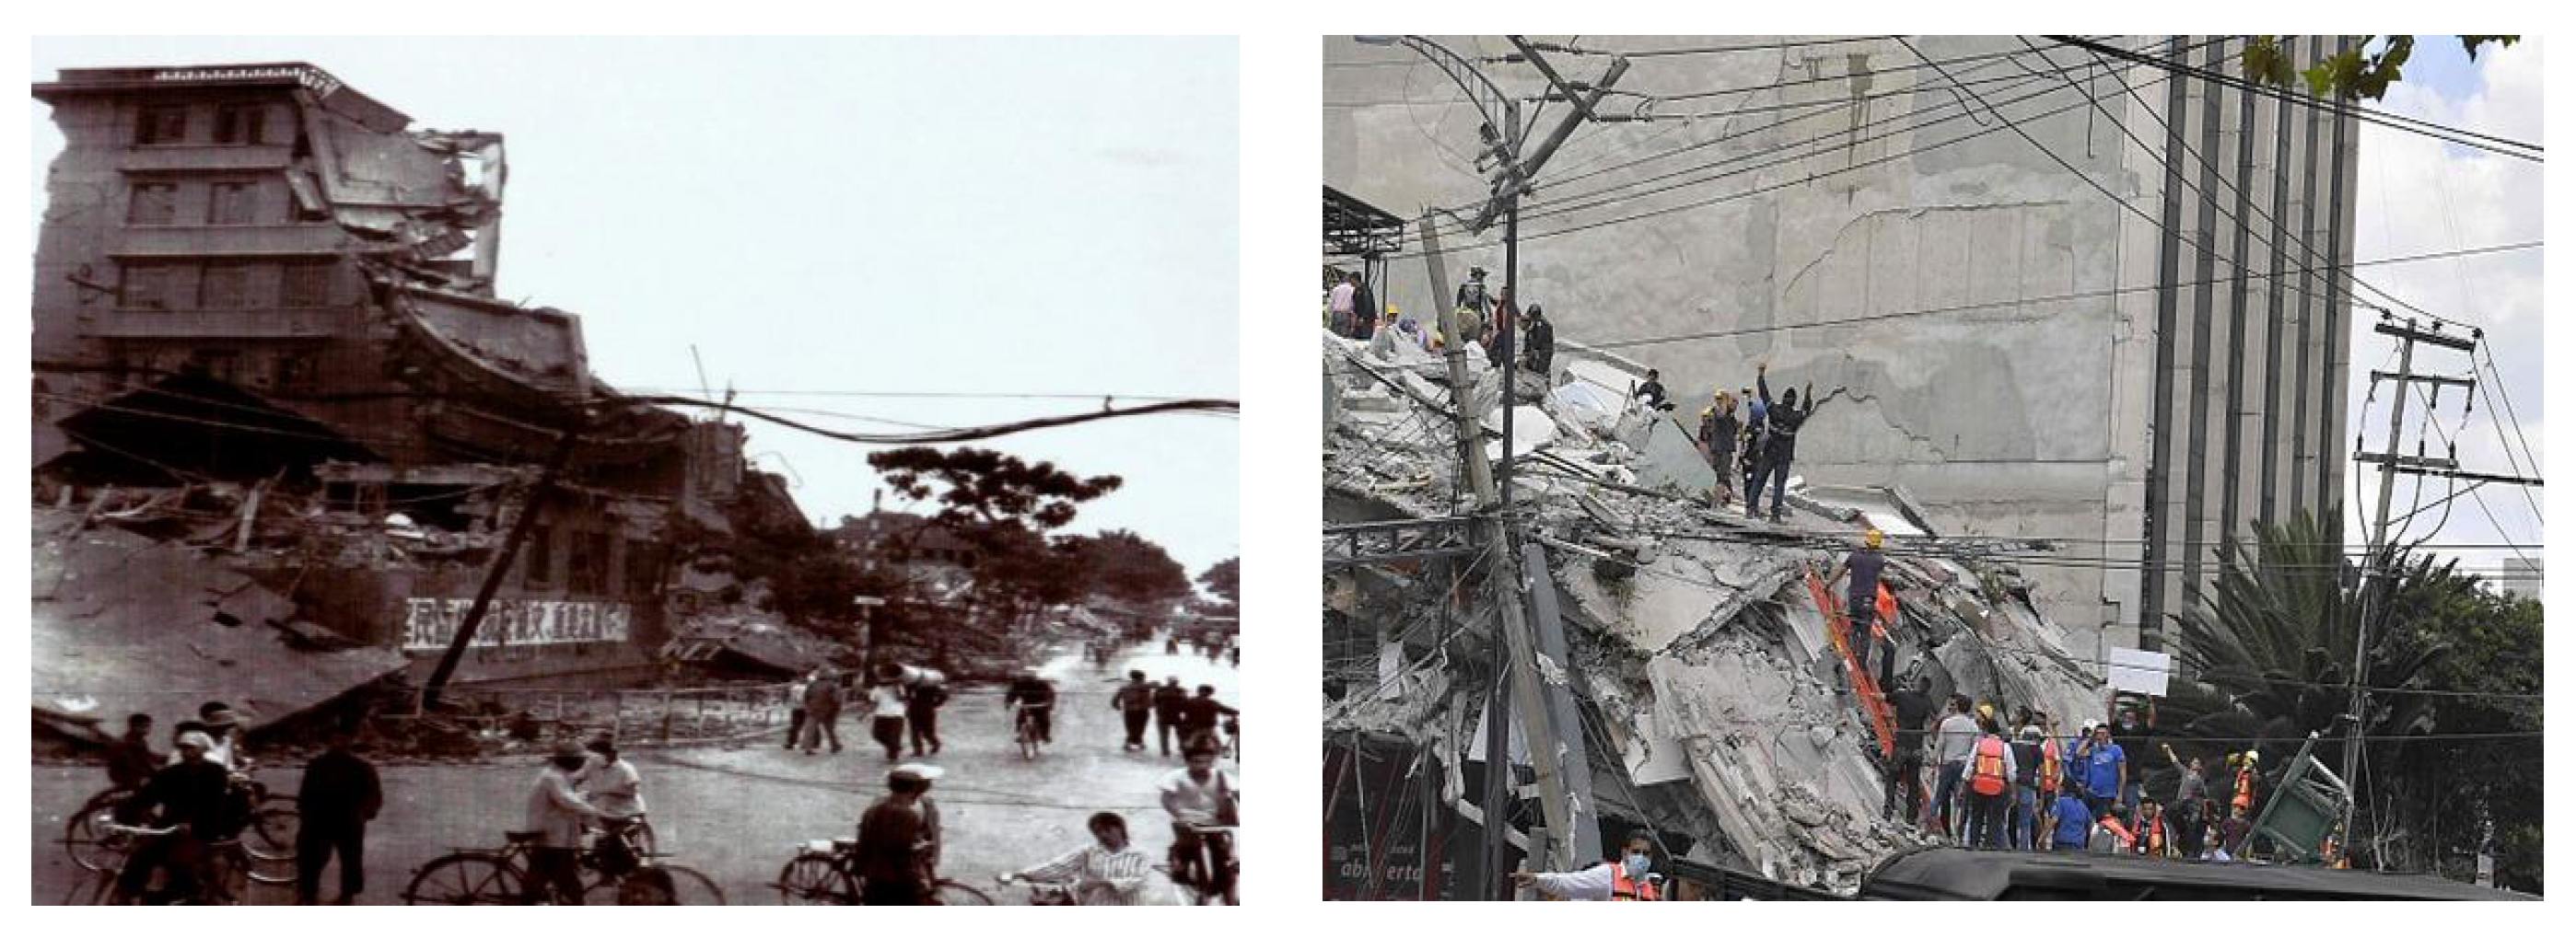
As the critical “last mile” link connects the main power grid to end users, the operational status of distribution lines plays a decisive role in the safety and reliability of the entire power system. With the continuous expansion of the power system scale and the increasing complexity of distribution network structures, the safety of power facilities has garnered increasing attention under natural disasters, such as earthquakes. Among these, the reinforced concrete pole–conductor system serves as the backbone support of distribution networks, characterized by its vast quantity, wide coverage, and random topological features. Once damaged, it can lead to power supply interruptions and significant economic losses. Historical seismic damage investigations indicate that tilting, fracture, and conductor collapse of 10–20 kV reinforced concrete poles (hereafter referred to as “poles”) are the primary causes of regional power outages [1], posing severe threats to the reliability of distribution systems. During the 1976 Tangshan earthquake, 2008 Wenchuan earthquake, and 2013 Lushan earthquake, more than 3000 10 kV and above lines were cumulatively shut down, resulting in direct economic losses amounting to tens of billions of yuan. In the 7.1-magnitude Puebla earthquake in Mexico in 2017, 34% of distribution poles and lines in the state of Mexico experienced irreversible damage, leading to direct economic losses of USD 1.8 billion. The typical post-earthquake failure modes of the concrete poles are shown in Figure 1.
Post-earthquake investigations generally indicate that, in addition to foundation liquefaction and guy wire loosening, the additional tension and impact loads caused by conductor swinging are significant triggers for the brittle fracture of poles [1,2,3,4]. However, current relevant design codes (GB 50260-2013, DL/T 5220-2021, and ASCE Manual No. 74) still simplify conductor effects as equivalent static loads or concentrated masses, neglecting their geometric nonlinearity, large displacements, and “beat-swing” coupling effects, leading to unsafe seismic designs.
Currently, domestic and international research focuses primarily on the seismic performance and macro vulnerability of single poles. Zekavati et al. [5] conducted a 1:2.5 scale test and OpenSees finite element analysis, first providing the moment–curvature capacity curve of distribution poles and proposing an ultimate curvature angle of 0.045 rad as the collapse criterion. Baghmisheh et al. [6] established a seismic vulnerability model for poles via the cloud method based on 120 sets of artificial ground motion records, identifying the section 0.5 m above ground as the weakest. Through low-cycle reversed loading tests, Zeynalian et al. [7] reported that reducing the stirrup spacing from 100 mm to 50 mm could increase the bending capacity at the pole base by 18%. Recent studies have also explored high-performance structural systems and resilient connections. For example, research on controllable joints in precast systems [8] and cable-based seismic resilience systems [9] provides valuable insights into how connection flexibility and auxiliary damping elements can influence the overall structural response. Although these studies focus on building structures, the underlying principles of utilizing nonlinearity for energy dissipation are relevant to the pole–conductor coupling mechanism discussed herein. In recent years, multi-hazard coupling research has emerged. Teoh [10] evaluated the failure probability under combined strong wind and ice loading, Darestani [11] developed a joint seismic–wind–wave vulnerability surface, and Stephens [12] reported that the nonlinear superposition effects of multi-hazard responses are significantly greater than those of single hazards. However, these studies simplified conductors as nodal masses or static loads, failing to explain the phenomenon of “conductors remaining intact while poles collapse first” observed in seismic damage.
With respect to the coupling effect of conductors, Chen and Dai [13] first adopted a cable–beam hybrid element and reported that neglecting the dynamic coupling of conductors could result in a fundamental frequency error exceeding 20%. Li et al. [14], based on coupled system models, reported that the geometric nonlinearity of conductors significantly alters the dynamic transmission path of the system and that neglecting the coupling effect could underestimate the structural response by more than 10–30%. Tian et al. [15], through shaking table tests, verified that when the “beat vibration” frequency of a conductor approaches the second-order frequency of the pole body, a bending moment amplification of 1.8 times occurs. Notably, the dynamic interaction between reinforced concrete poles and conductors differs significantly from that between lattice steel towers and conductors. Unlike steel towers, which are lightweight and dominated by elastic deformation, reinforced concrete poles have larger masses, higher stiffnesses, and distinct material nonlinearities, such as concrete cracking and bond-slip behavior. These factors fundamentally alter the energy dissipation mechanism and mode coupling effects of the system. However, existing research has focused predominantly on 220 kV and above high-voltage transmission tower-insulator string systems, with insufficient attention given to 10–20 kV distribution pole–conductor systems and has yet to provide dynamic amplification coefficients that can be directly referenced for design.
In terms of design specifications, the current “Code for Seismic Design of Electrical Installations” (GB 50260-2013) [16] adopts the “equivalent lateral static method,” simplifying the effect of conductors into a distributed force of 0.2–0.3 kN/m while neglecting their dynamic amplification effects. The “Design Code for 10 kV and Below Overhead Distribution Lines” (DL/T 5220-2021) [17] only provides structural requirements under 0.05 g seismic intensity and does not address the coupling verification of pole–conductor systems. Although ASCE Manual No. 74 [18] outlines combined wind-ice-earthquake load scenarios, it explicitly applies to voltage levels of 69 kV and above. With respect to medium- and low-voltage distribution lines, designers generally lack clear regulations and quantitative parameters for the dynamic response of “pole–conductor” coupled systems; instead, they rely on empirical amplification factors, which deviate significantly from seismic damage investigation results.
In summary, clarifying the amplification/damping mechanism of conductors on the seismic response of poles is a key step in establishing a refined seismic design theory for power distribution lines and is a prerequisite for the credibility of multi-hazard coupling analysis. To address the scientific issues and engineering needs, this paper takes a typical 10 kV power distribution line-reinforced concrete pole–conductor system as the research object. Based on the ANSYS finite element platform, a refined “three-pole two-conductor” model considering the geometric nonlinearity of conductors is established. Through modal analysis, the influences of different conductor spans (60 m, 80 m, and 100 m) and span-to-height ratios (5–6.7) on the natural vibration characteristics and seismic dynamic response of the system are revealed. Nonlinear dynamic time–history analysis is conducted to quantify the displacement response of poles and the stress distribution characteristics at the roots under different seismic wave inputs, aiming to reveal the dynamic amplification or damping mechanism of conductors on poles and to provide a scientific basis for optimizing power distribution line design and improving relevant seismic codes.

2. ANSYS Finite Element Model

In accordance with the current standard “Circular Concrete Poles” (GB/T 4623-2014) [19] and the typical design specifications of the 10 kV distribution network, this paper selects two commonly used specifications of prestressed reinforced concrete poles with heights of 12 m and 15 m. The corresponding burial depths are taken as 1/6 of the pole height, which are 1.9 m and 2.3 m. The geometric dimensions of the poles are designed as follows: root diameter of 350 mm, tip diameter of 190 mm, and wall thickness of 50 mm. These poles are designed with a tapered cross-section (taper ratio of 1/75), which is the standard configuration mandated by the Chinese National Standard GB/T 4623-2014 for circular concrete poles. Compared with uniform-section poles, tapered poles offer better material economy and mechanical efficiency for cantilever-like structures. The longitudinal reinforcement uses 12 HRB400-grade hot-rolled ribbed steel bars with a diameter of 16 mm. The stirrups (spiral reinforcement) are made of cold-drawn low-carbon steel wires with a diameter of 4 mm, and the pitch is set to 100 mm. The strength grade of the concrete is C50. In accordance with the “Code for Design of Concrete Structures” (GB 50010-2010) [20], its elastic modulus E c is taken as 3.45 × 10⁴ MPa, and the standard value of the axial compressive strength fck is taken as 32.4 MPa. The line arrangement adopts a bilateral equal span (Span) configuration. To study the influence of different spans, three working conditions are set: 60 m, 80 m, and 100 m.
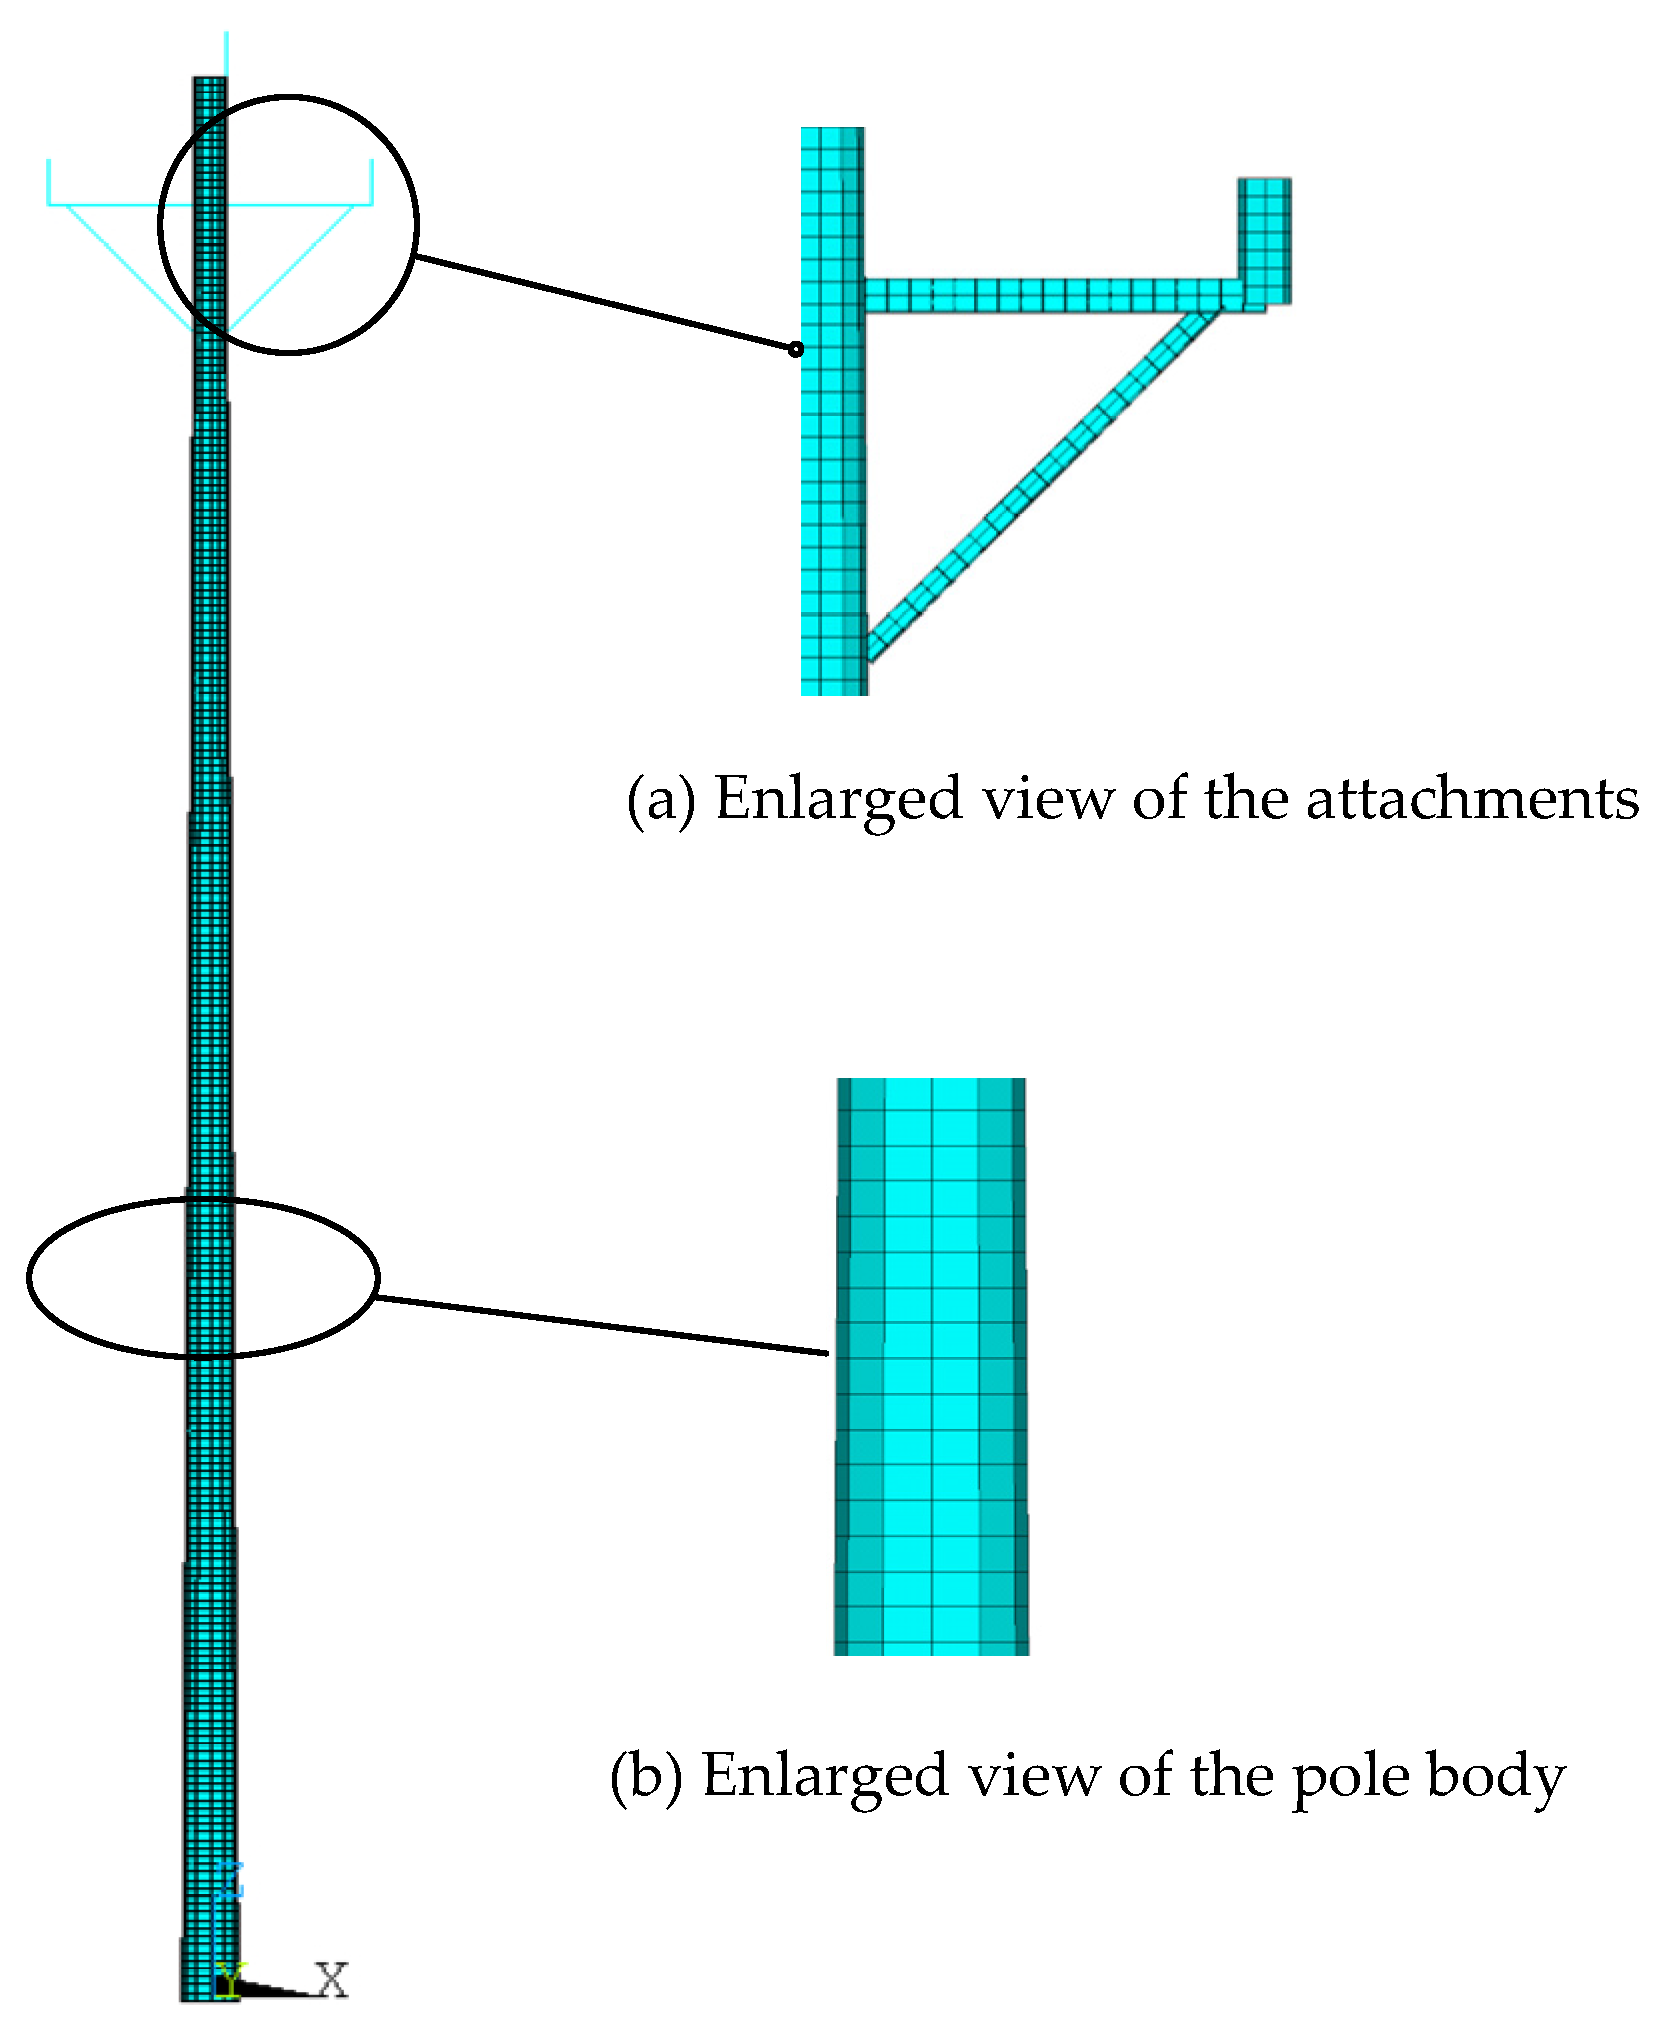
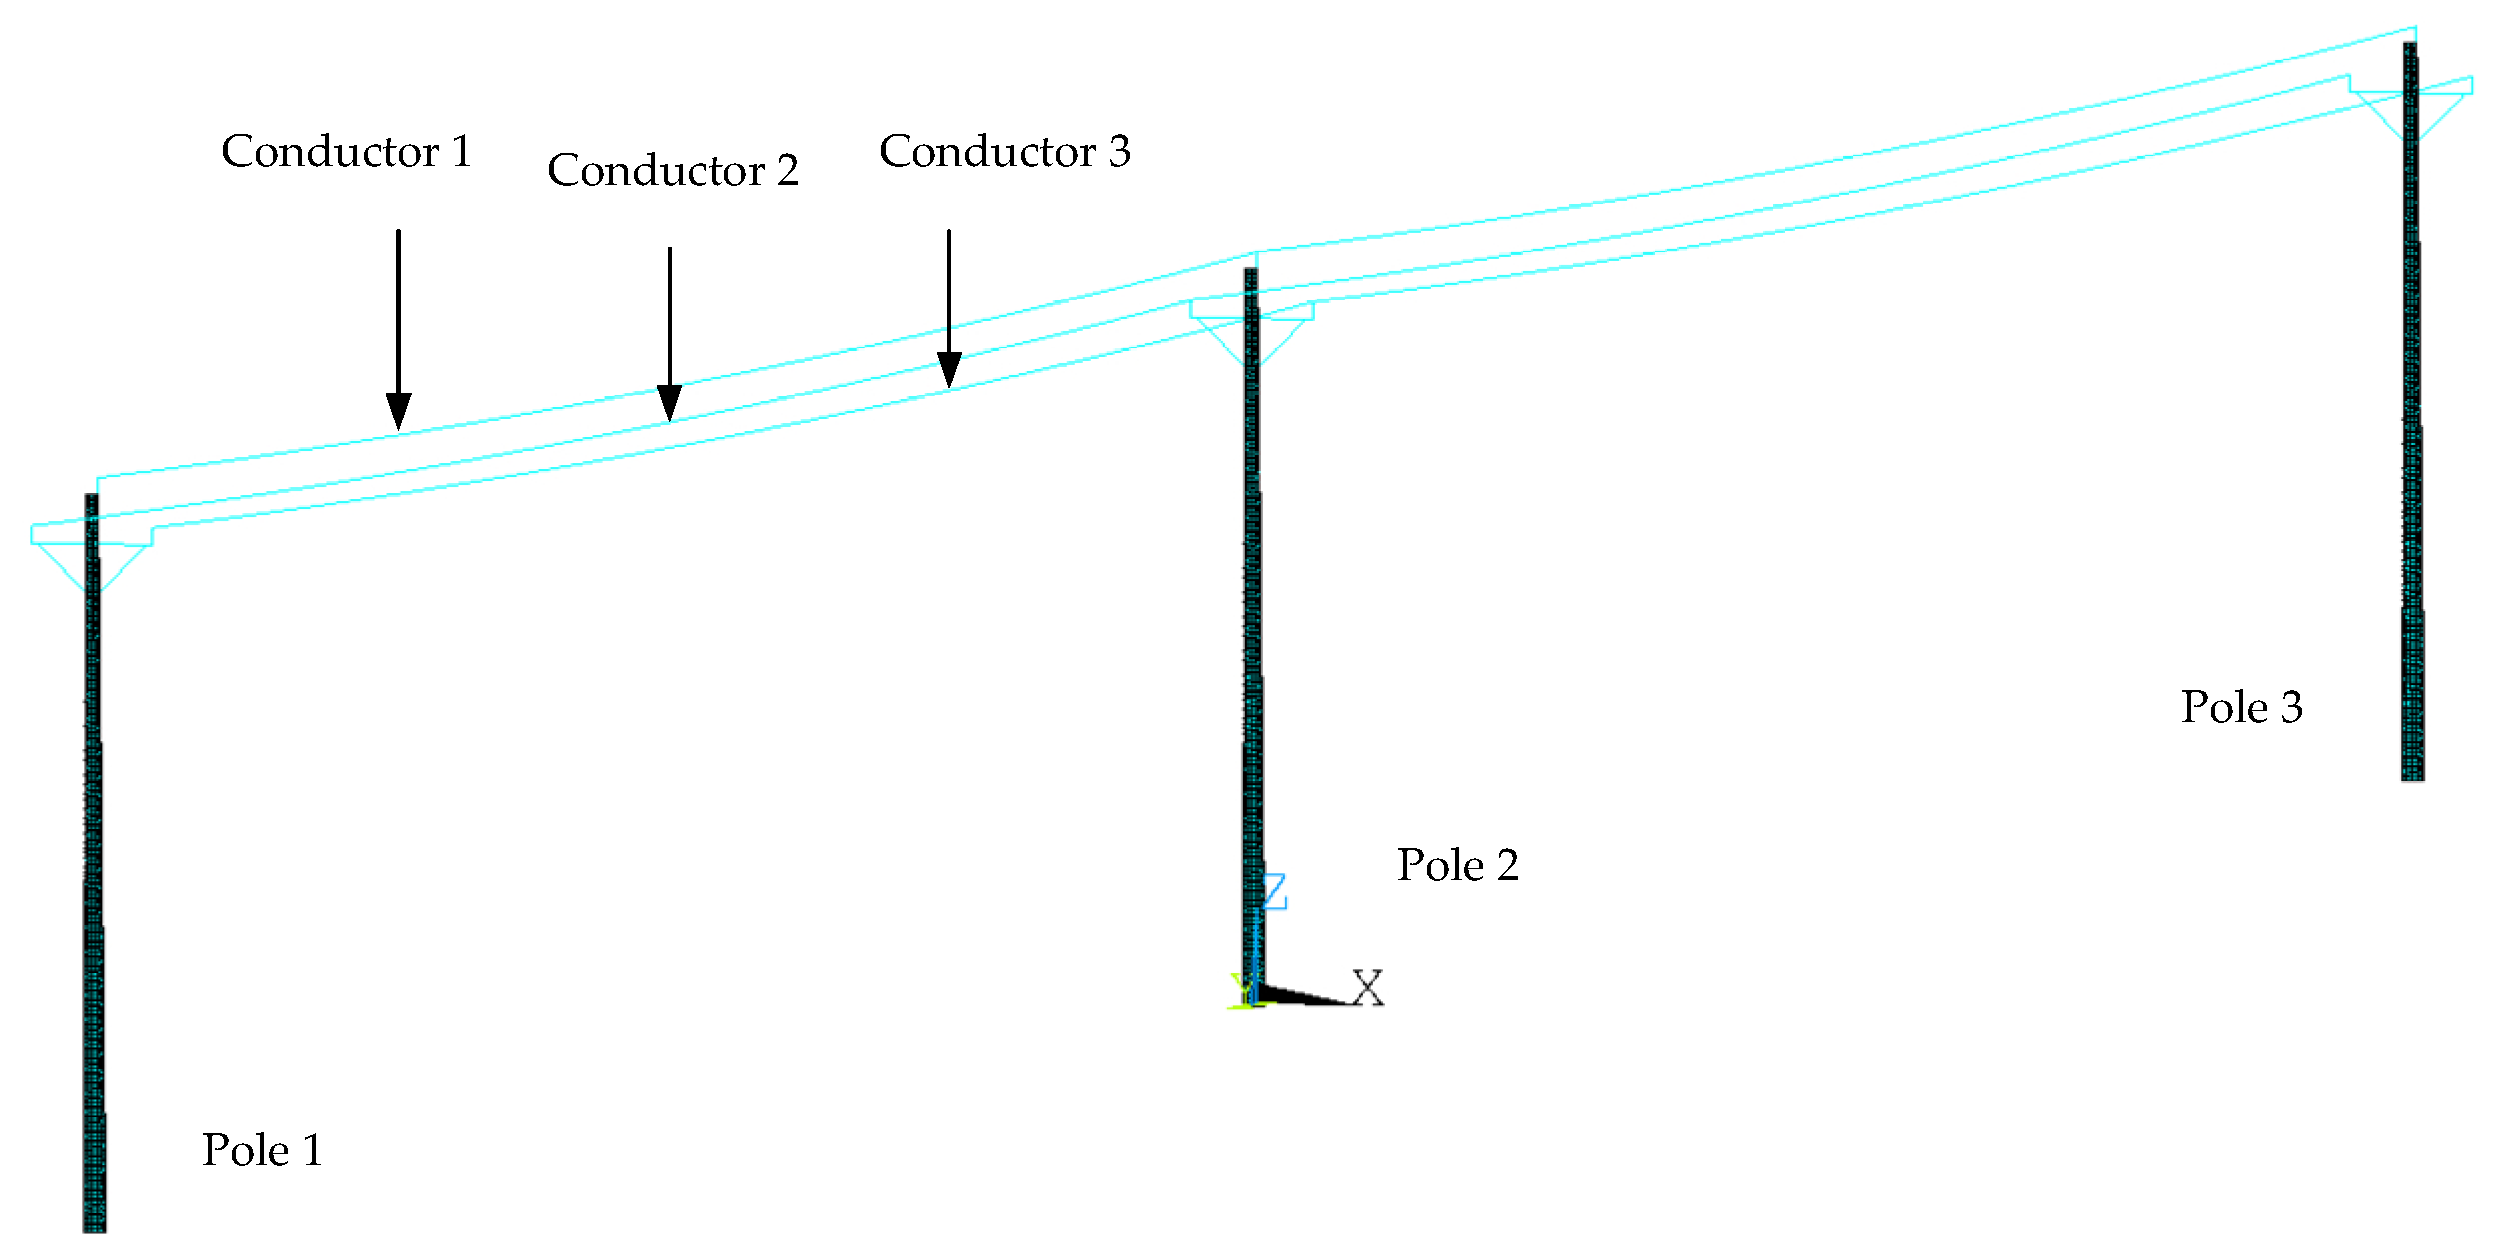
When reinforced concrete poles are modeled, a discrete finite element model is employed. The concrete is simulated via the SOLID65 element in ANSYS 2020 R1 software, whereas the reinforcement is modeled via the LINK8 element. The stress-strain constitutive relationship of the concrete is simulated via the multilinear isotropic hardening model (MISO), and the stress-strain constitutive relationship of the reinforcement is simulated via the bilinear isotropic hardening model (BISO). For the finite element modeling of the conductor, the LINK10 element is selected. The conductor is chosen as an aluminum conductor steel-reinforced (ACSR) according to actual engineering specifications, with the model LGJ-150/20, a diameter of 16.67 mm, and a cross-sectional area of 164 mm2. The Willam–Warnke failure criterion was adopted to simulate the cracking behavior of the concrete. The open shear transfer coefficient βt was set to 0.3, and the closed shear transfer coefficient βc was set to 0.9 to model the shear strength across cracks. The uniaxial tensile cracking stress ft was defined as 2.64 MPa (corresponding to the standard tensile strength of C50 concrete). The crushing capability was disabled in this study to facilitate convergence, focusing primarily on the tensile cracking distribution on the pole body. Given the slenderness of the 12 m and 15 m poles, geometric nonlinearity (large deflection effect) was activated in ANSYS via the NLGEOM ON command. This setting implicitly accounts for P-delta effects, ensuring that the secondary moments generated by the vertical loads (self-weight and vertical seismic components) under large lateral displacements are fully considered in the dynamic analysis. In terms of boundary conditions and load settings, it is assumed that the bottom of the pole is rigidly connected to the foundation, and full fixed constraints are applied to all nodes within the burial depth of the pole, ignoring soil–structure interactions. The rigid base assumption simplifies the actual soil–structure interaction (SSI). While this assumption represents a scenario with a firm soil or rock foundation and provides a conservative estimate for the base stress in terms of stiffness, it may underestimate the system’s damping ratio. Given that this study focuses on the relative coupling mechanism between the pole and conductors, the rigid base condition is considered acceptable for comparative analysis. Future studies will incorporate soil springs to refine the boundary conditions. The connection between the conductor and the pole cross-arm is achieved through node coupling, simulating the hinge effect of suspension insulators in actual engineering. The model applies gravitational acceleration to account for the structure’s self-weight, whereas initial strains are applied to the longitudinal reinforcement (LINK8 elements) to simulate the precompression stress effect in prestressed reinforced concrete poles. The finite element models of the reinforced concrete pole and the “three-pole two-conductor” system established via ANSYS software are shown in Figure 2 and Figure 3, respectively.

3. Modal Analysis

3.1. Modal Analysis of the Reinforced Concrete Pole

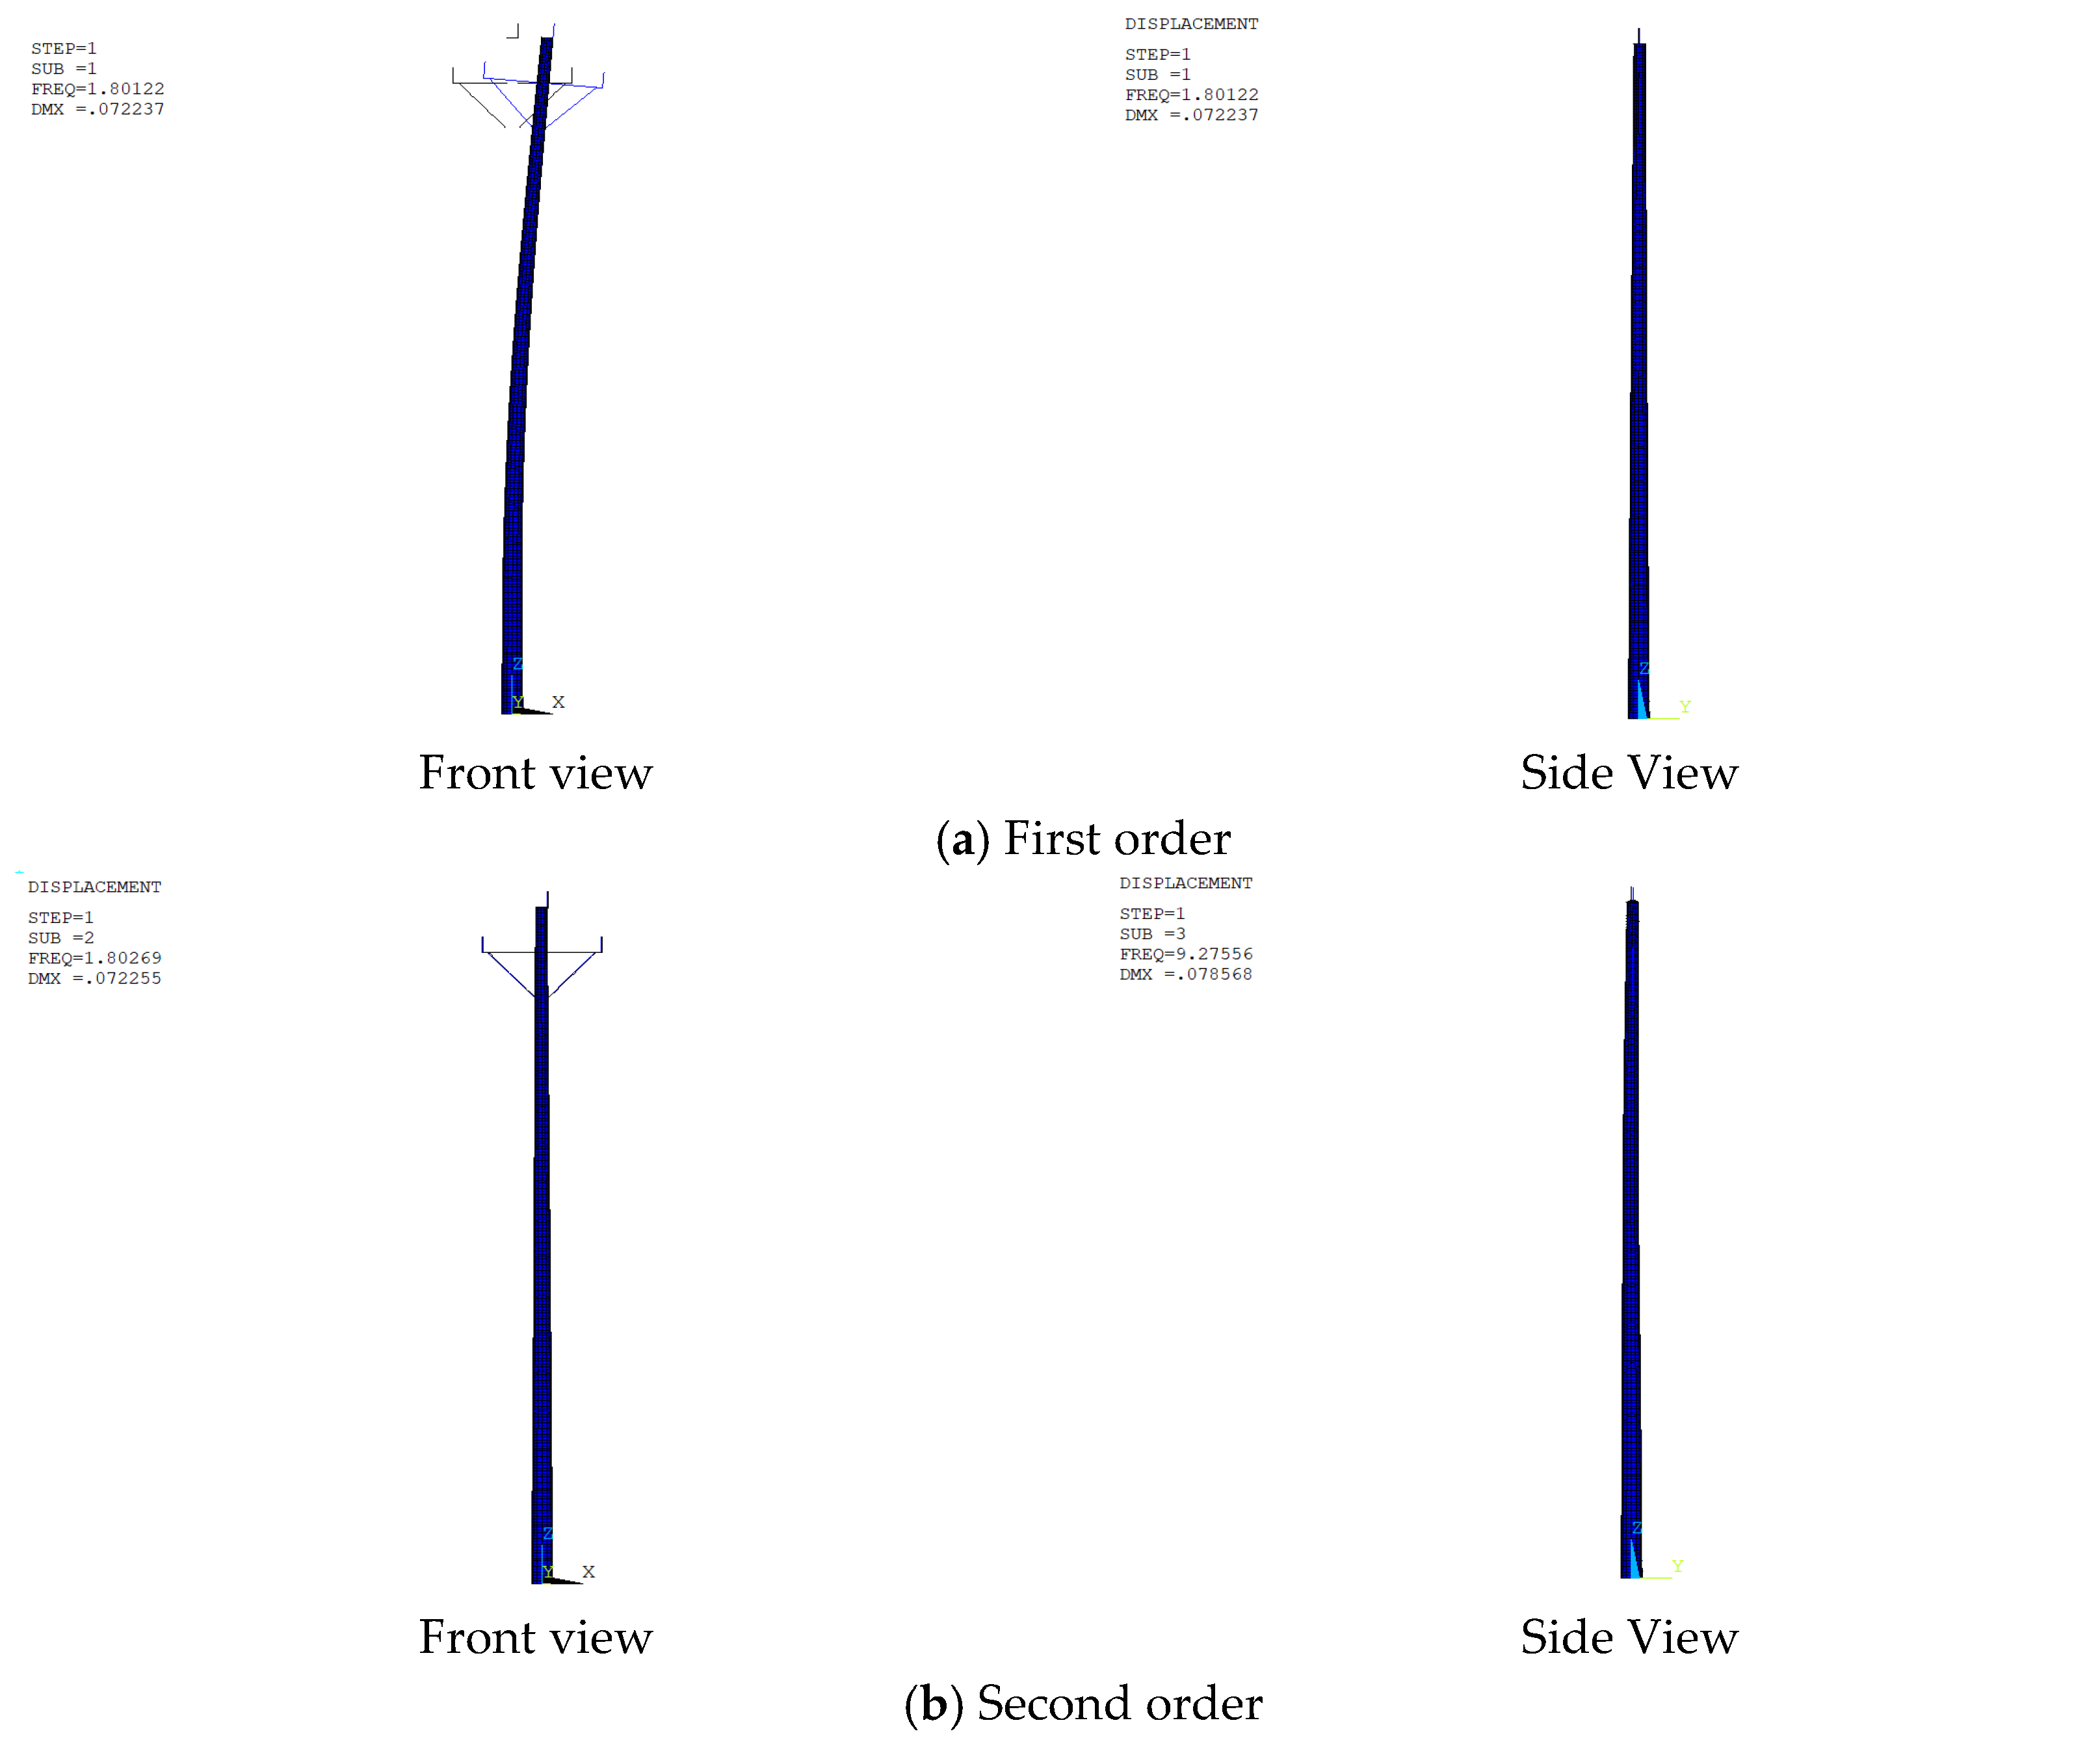
Modal analysis was performed on finite element models of reinforced concrete poles with heights of 12 m and 15 m and a concrete strength grade of C50. The first five modal results of the structure are shown in Table 1.
From the modal analysis results in Table 1, the following conclusions can be drawn:
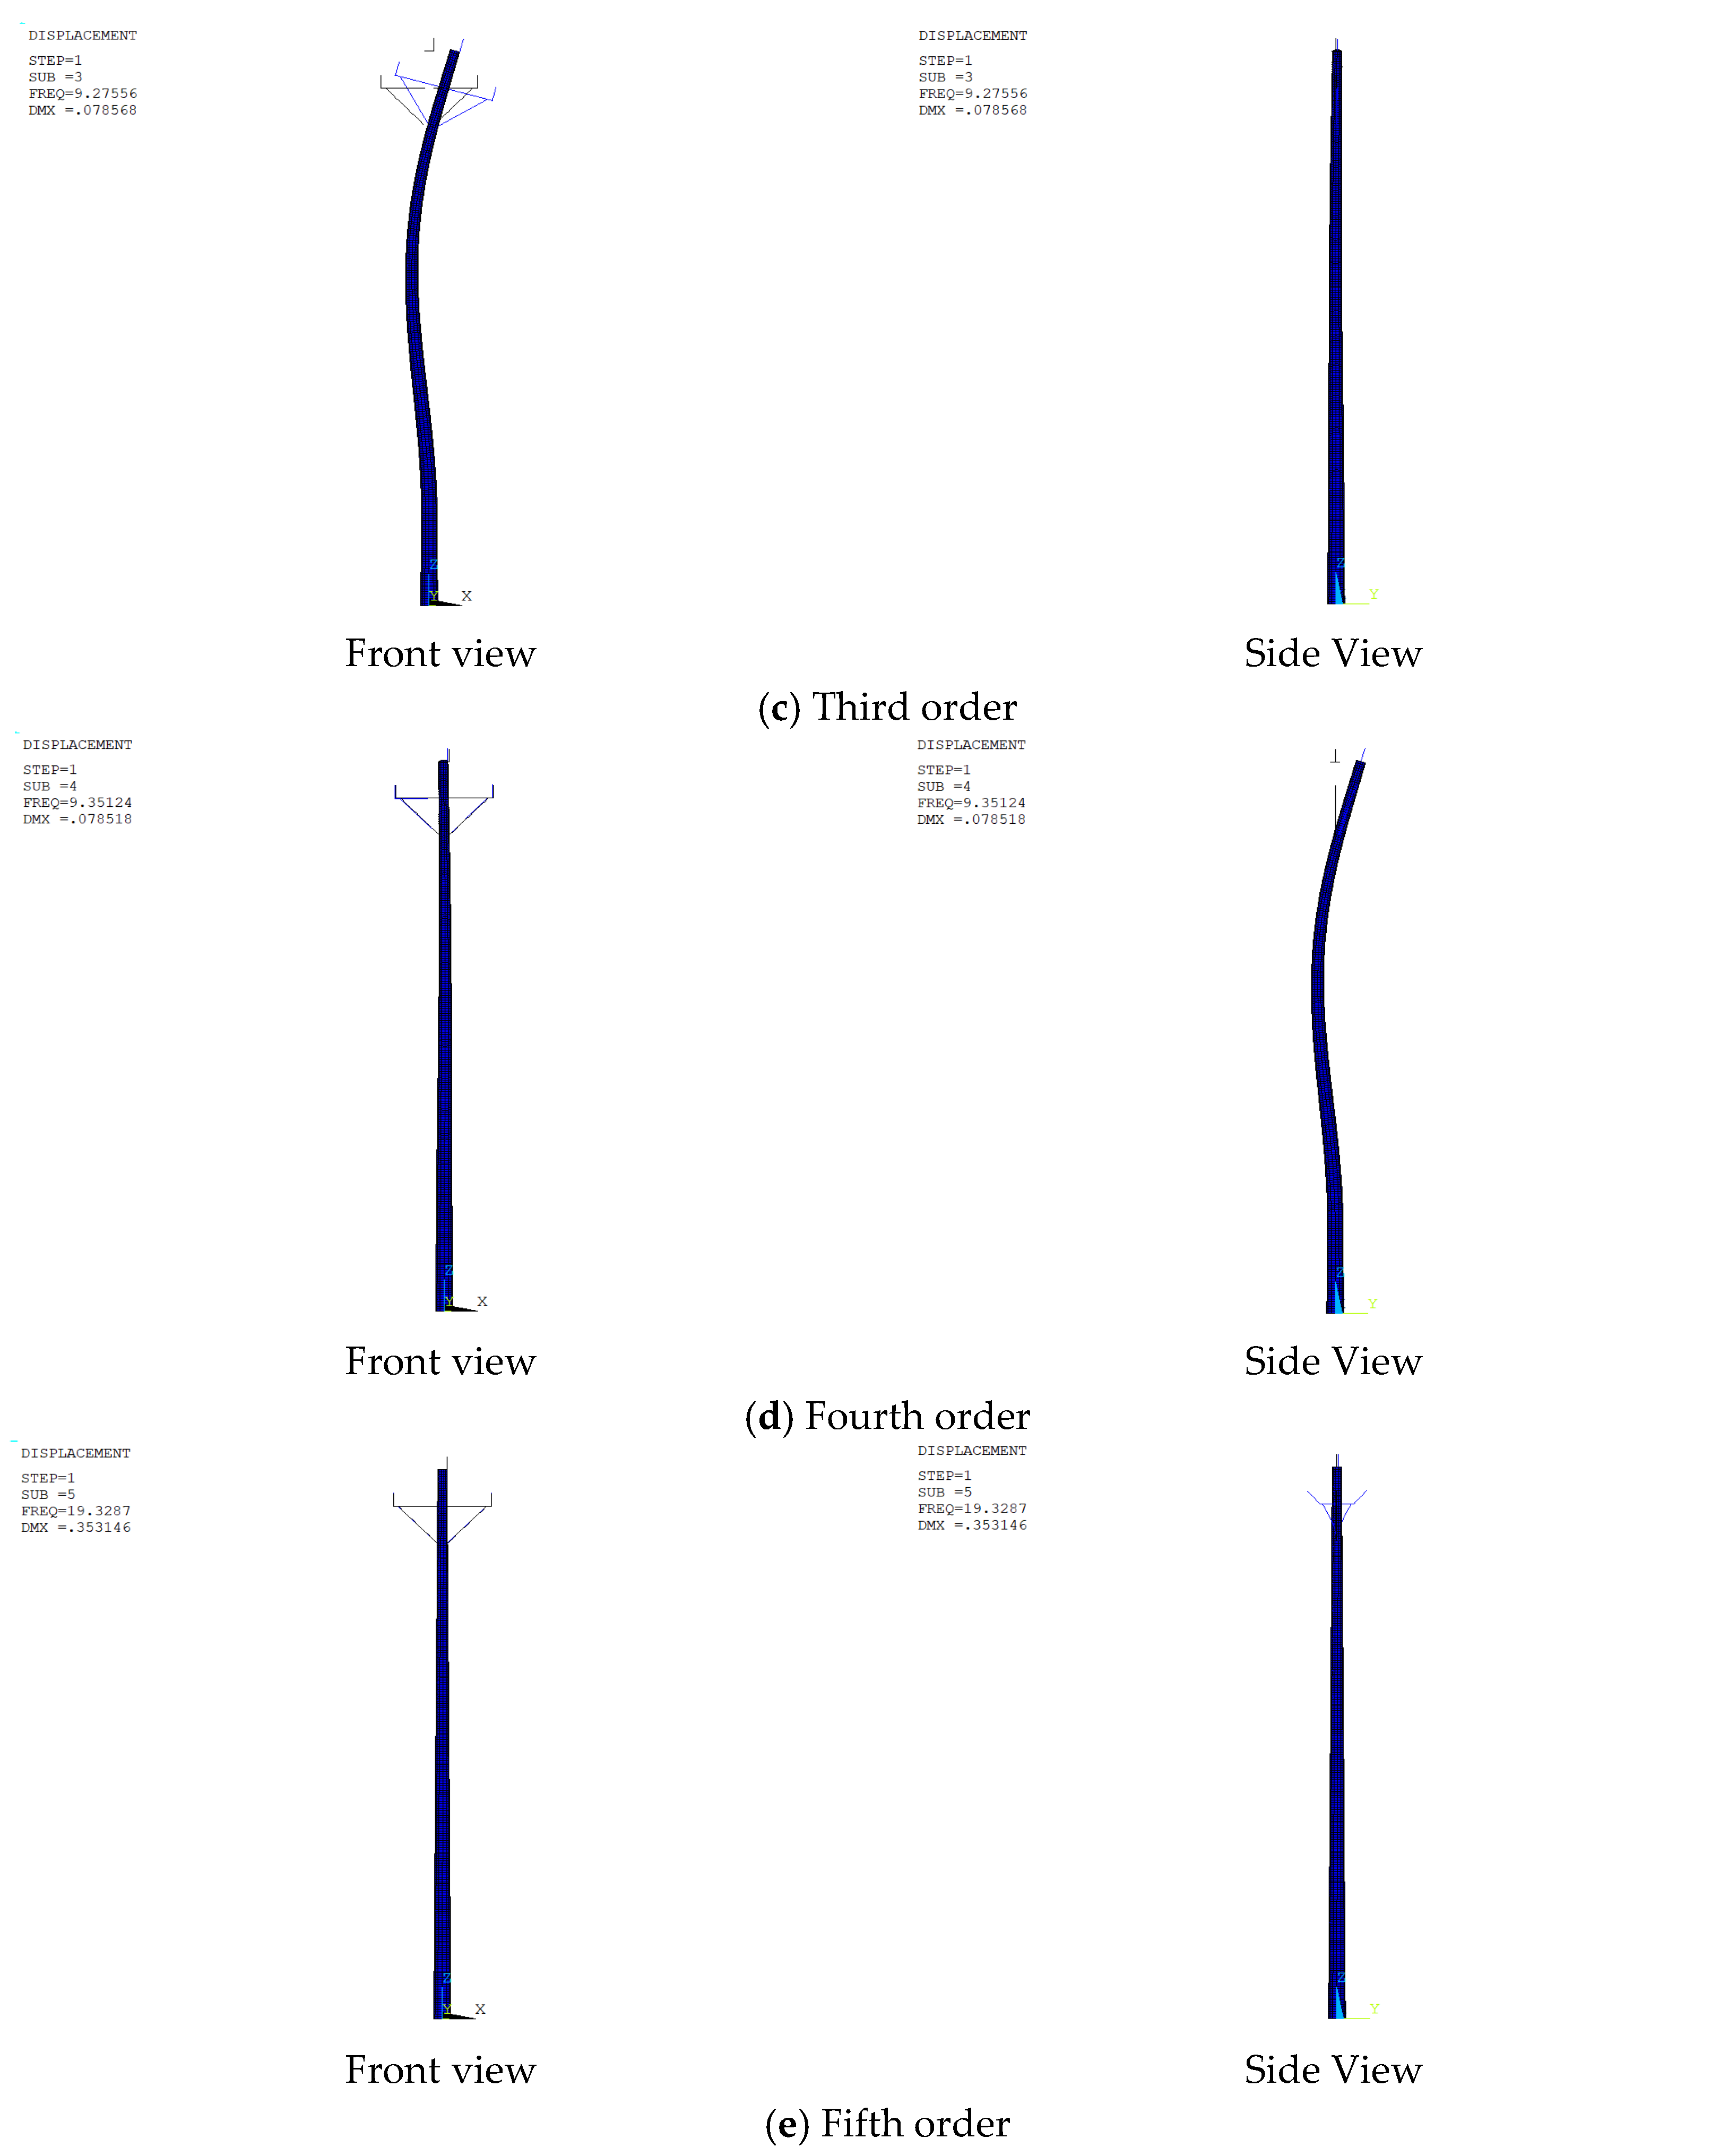
(1) The first two mode shapes of the reinforced concrete pole are bending vibrations in the X and Y directions. The third and fourth mode shapes are torsional vibrations along the X and Y axes, and the fifth mode is torsion of the pole around the Z-axis in the XY plane, with a significant increase in the frequency corresponding to the torsional mode shape.
(2) The X-direction and Y-direction frequencies of the same order for reinforced concrete poles are relatively close, and the Y-direction frequency of the same order is always higher than the X-direction frequency. As the height of the pole increases, the difference between the Y-direction and X-direction frequencies of the same order increases, indicating that the Y-direction stiffness of the pole is slightly greater than the X-direction stiffness.
(3) The third-order X-direction torsional frequency around the Z-axis of the reinforced concrete pole is significantly greater than the first-order X-direction bending frequency, indicating that the torsional stiffness of the pole is greater than its horizontal stiffness.
(4) Overall, the vibration modes of the reinforced concrete pole are primarily bending and torsion within the XY plane along the Z-axis, and the same-order vibration frequencies in the two directions are relatively close. This aligns with the characteristic that, except for the presence of the upper insulator, the main structure of the pole is symmetrical. The first five modal vibration modes of a reinforced concrete pole with a height of 12 m and a concrete strength grade C50 (abbreviated as C50 + 12 m) are shown in Figure 4.

3.2. Modal Analysis of the Reinforced Concrete Pole Wire System

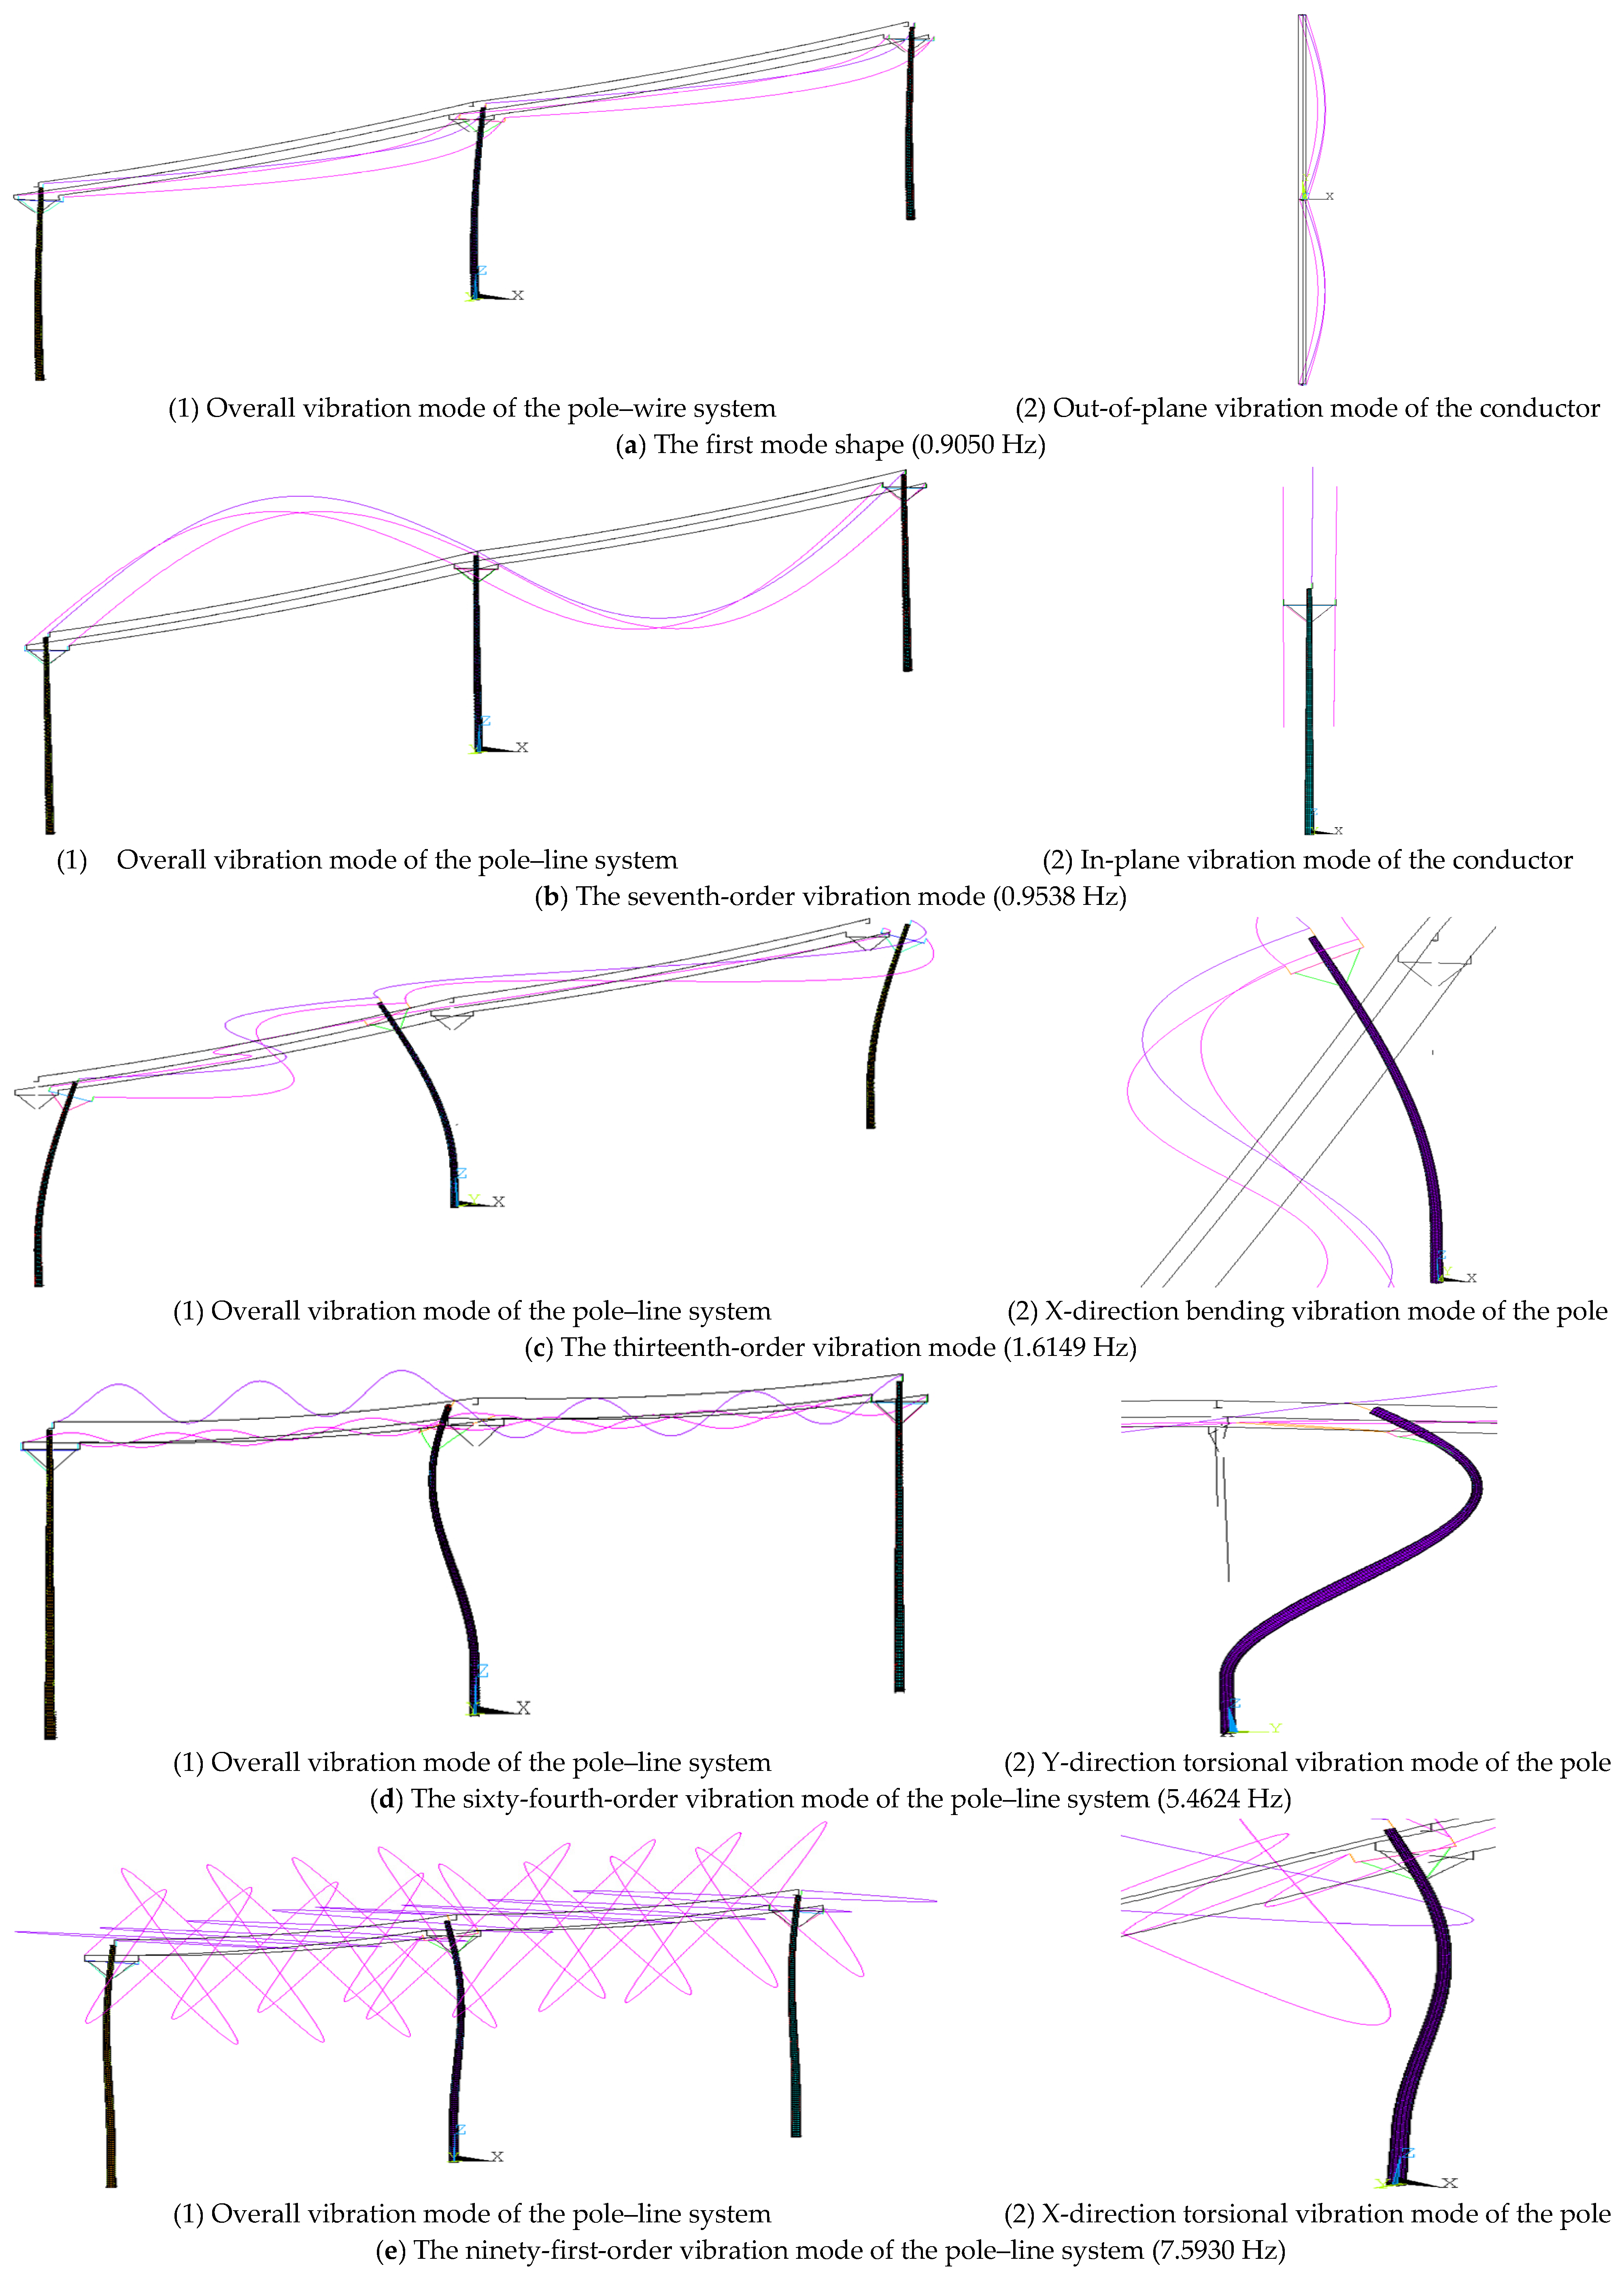
For the established pole heights of 12 m and 15 m, with conductor spans of 60 m, 80 m, and 100 m, a modal analysis was conducted on the reinforced concrete pole–conductor system structure with a concrete strength grade of C50. The first 200 partial mode shapes of the overall vibration for the reinforced concrete pole–conductor system structure with a concrete strength grade of C50, pole height of 12 m, and conductor span of 60 m (abbreviated as C50 + 12 m + 60 m) are shown in Figure 5.
The system mode shapes shown in Figure 5 can be divided into two main categories: (1) Low-frequency band (0.8–1.2 Hz) modes are dominated primarily by out-of-plane or in-plane swinging of the conductor, with the pole participating only through minor vibrations. (2) Mid- to high-frequency band modes gradually transition to bending and torsional modes dominated by the pole. Owing to the conductor’s smaller equivalent stiffness but larger equivalent mass, its introduction causes a significant low-frequency shift in the system’s first few mode shapes. Additionally, out-of-plane vibrations of the conductor are more prone to coupling with the pole’s torsion around the Z-axis and X-direction bending, which is one of the primary dynamic mechanisms leading to stress amplification effects in subsequent seismic responses.
By extracting the first 200 modal shapes of the reinforced concrete pole–conductor system structure, it can be observed that the overall vibration of the structure exhibits low-frequency, densely packed modal characteristics, with the low-frequency range being dominated primarily by the vibration of the conductors. This phenomenon occurs because, in the pole–conductor system, the mass contribution of the conductors to the reinforced concrete poles outweighs their stiffness contribution (taking the C50 + 12 m + 60 m system as an example, the conductor mass accounts for 23.8% of the total system mass, whereas the out-of-plane stiffness of the conductors is only 3.1% of the lateral stiffness of the poles, indicating a significantly greater mass contribution than the stiffness contribution). Consequently, the natural frequencies of the reinforced concrete pole–conductor system are reduced [21]. Since the pole–conductor system is an integrated structure, even when the vibration is predominantly in the conductors, slight vibrations in the poles can still be observed. Within the pole–conductor system, bending-torsional vibrations of the poles around the Z-axis along the X-direction are more likely to occur, suggesting a greater propensity for coupling with the out-of-plane vibrations of the conductors. This is because although conductors increase the system’s mass, their restraining effect on out-of-plane vibrations is minimal, resulting in a smaller stiffness contribution and a larger mass contribution in the X-direction, increasing the susceptibility of the pole–conductor system to bending-torsional vibrations in the X-direction.
A comparison between the vibration modes and natural frequencies of the reinforced concrete poles in the pole–conductor system and those of the standalone poles is presented in Table 2. To ensure a valid comparison between the single pole and the coupled system, the mode shapes were carefully matched based on their dominant deformation characteristics (e.g., matching the first-order X-direction bending mode of the single pole with the corresponding pole-dominated mode in the system). This approach prevents errors caused by mode reordering due to the introduction of conductors.
To ensure the accuracy of the finite element calculation results, this paper first verifies the reliability of the established model. To validate the reinforced concrete single-pole model, in reference to the measured data from the literature [22], the simulated load–deflection and moment–strain curves of the pole are compared with the experimental values. The results show good agreement, with the maximum errors controlled within 10%, confirming the precision of the single-pole model. To validate the conductor model, a shape-finding analysis of the conductor is conducted based on catenary theory. The deviation between the sag obtained from the finite element simulation and that obtained from the parabolic theoretical calculation is only 0.015%, meeting the accuracy requirements. Additionally, regarding pole–line coupling systems, existing studies [23,24,25] indicate that the “three-tower (pole) two-conductor” model can effectively capture the dynamic coupling characteristics of transmission lines and satisfy engineering calculation accuracy.
Based on the verified and reliable finite element model, the dynamic characteristics of the system were analyzed. As shown in Table 2, when the pole–line coupling system vibrates, the natural frequencies of the poles in the pole–line system differ significantly from those of the corresponding vibration modes of a single pole. The maximum deviation in the natural frequency of the poles reaches 41.59%. This finding indicates that, compared with those of a single pole, the stiffness matrix and mass matrix of the coupled pole–line system substantially change. Therefore, when the structural behavior of the pole–line system is analyzed, it is necessary to consider the interactions between poles and lines and establish a comprehensive finite element model for the entire pole–line system structure. In the seismic design of the pole–line system structure, the influence of pole–line coupling effects on the dynamic characteristics of the poles within the system must be considered.

4. Seismic Response Characteristics and Parameter Sensitivity Analysis of Reinforced Concrete Pole–Line Systems

4.1. Selection of Seismic Waves

For the time–history analysis, Rayleigh damping was employed. The mass coefficient α and stiffness coefficient β were calculated based on the first two dominant natural frequencies of the system. A damping ratio of 0.05 was selected for the reinforced concrete poles and conductors, which aligns with the standard value recommended in the Code for Seismic Design of Electrical Installations (GB 50260-2013) [16] for concrete structures.
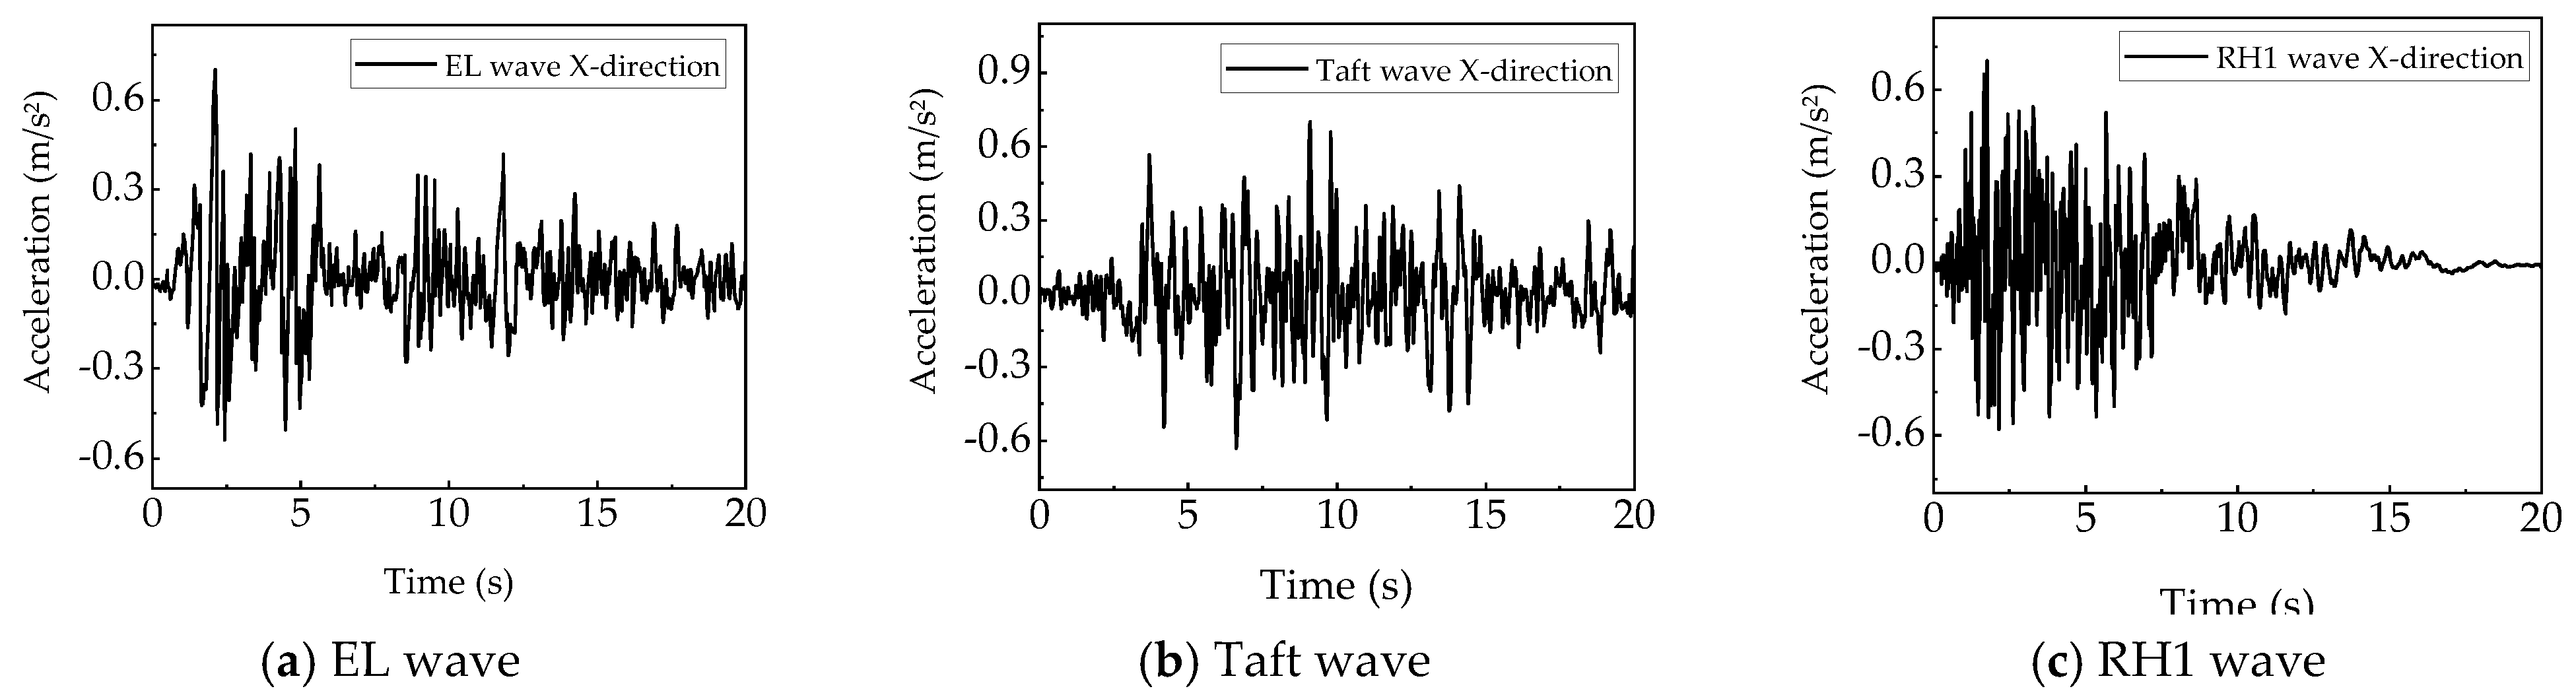
The 10 kV distribution line reinforced concrete pole–wire system analyzed in this paper is in a region with a seismic fortification intensity of eight degrees, belonging to the second earthquake group and site category II, with a characteristic period of T g = 0.40 s. In accordance with the code requirements for seismic wave selection, this study selects two natural seismic waves: the El Centro wave (abbreviated as the EL wave), the Taft wave, and one artificial seismic wave, the RH1TG035 wave (abbreviated as the RH1 wave). The time interval for all three seismic waves is 0.02 s, and the duration is set to 20 s, covering the segment with a significant acceleration response, and including the peak acceleration. The basic parameters of the selected seismic waves are summarized in Table 3.
According to the code, the acceleration peaks of the seismic waves are adjusted. The peak ground acceleration (PGA) of the selected seismic waves was 0.70 m/s2 (70 cm/s2). The amplitude modulation formula is shown in Equation (1).
γ = α 0 max α max
where γ is the amplitude modulation coefficient; α 0 max is the maximum acceleration time–history value for the eight-degree frequent earthquake specified by the code 70 cm/s2; and α max is the acceleration peak of the selected seismic wave.
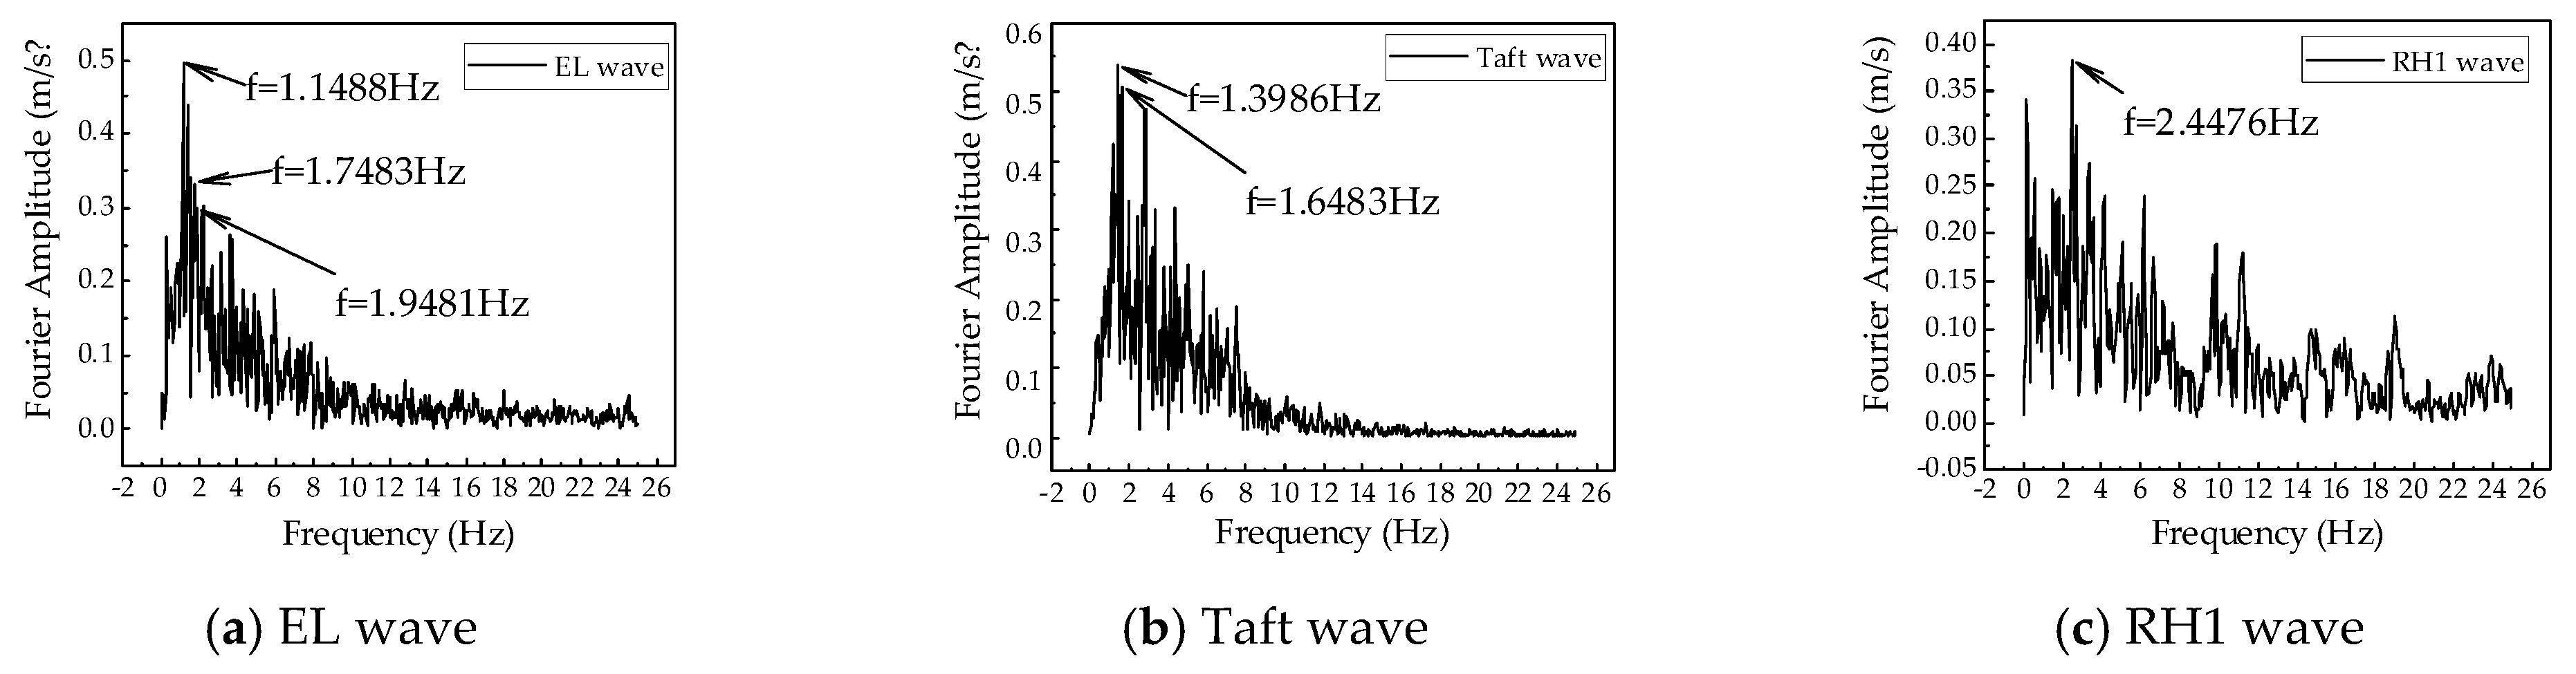
Based on the modal analysis results of the reinforced concrete pole and the pole–conductor system structure, the stiffness of the pole in the X direction is relatively weak. Therefore, when unidirectional seismic response analysis of a structure is conducted, a seismic wave is applied along the X-direction of the structure. Although bidirectional seismic input represents a more realistic scenario, this study focuses primarily on the specific coupling mechanism between the conductor’s in-plane swing and the pole’s weak-axis (X-direction) bending. Unidirectional input was chosen to isolate this interaction and quantify the amplification effect clearly. The effects of multidirectional excitation will be investigated in future work. The acceleration–time–history curves of the three amplitude-adjusted seismic waves along the X direction are shown in Figure 6. The seismic wave spectra obtained through the Fourier transform of the X-direction acceleration time–history curves of the three seismic waves are shown in Figure 7.
As shown in Figure 7, the energy distribution of the EL wave is relatively concentrated, mainly in the low-frequency range of 1–2.20 Hz. Within this range, the peak amplitude of the EL wave is close to the natural frequency of the single-pole structure of the concrete, making resonance more likely to occur. The Taft wave has a longer strong-motion duration with multiple acceleration peaks, and its high-frequency energy distribution is relatively concentrated, primarily in the 0.95–5.79 Hz range. The RH1 wave has a shorter strong-motion duration, more low-frequency energy, and a relatively uniform frequency distribution.
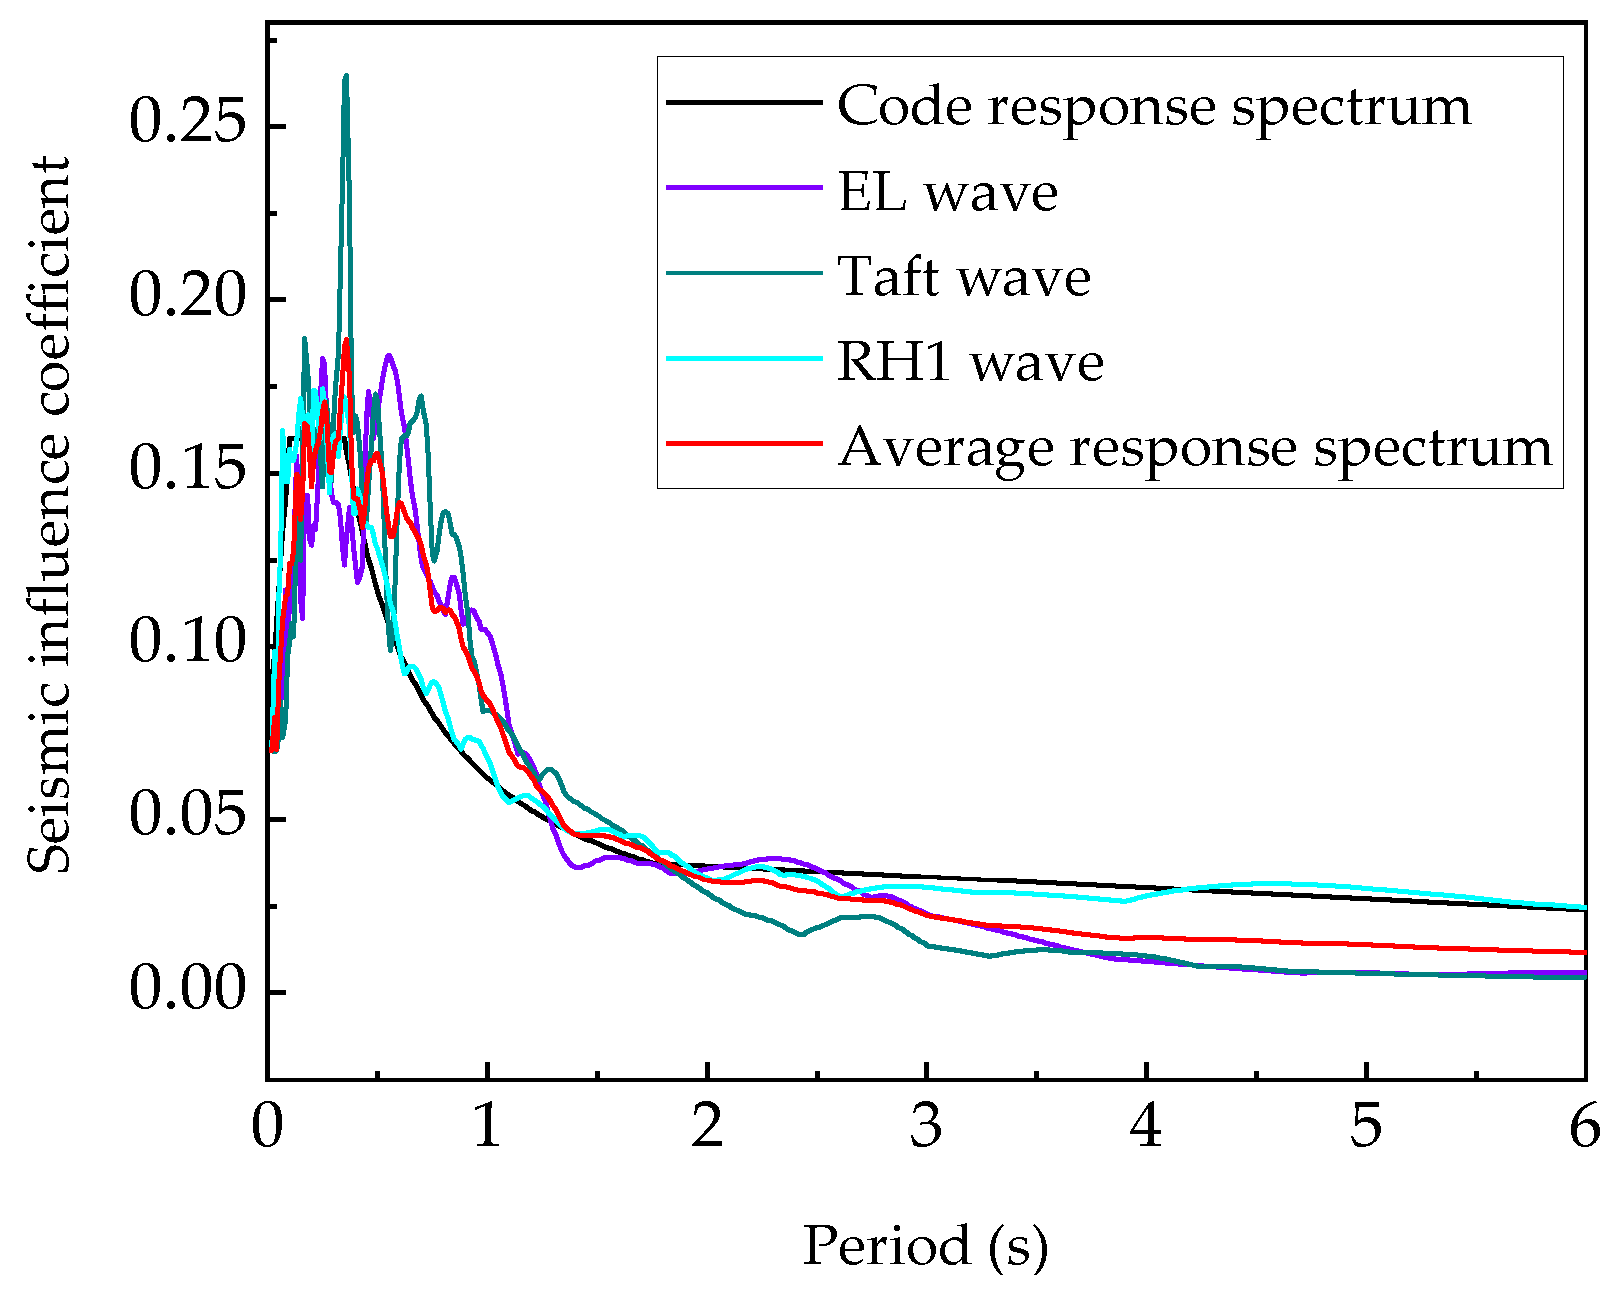
In accordance with China’s “Code for Seismic Design of Buildings” [26] (GB 50011-2010), the seismic influence coefficient curves of the three selected seismic waves and their average response spectrum curves are compared with the code response spectrum, as shown in Figure 8.
Figure 8 shows that the three selected seismic waves, their average response spectra, and the code response spectrum are in good agreement within the period range of T = 0~2 s. The natural vibration periods of the reinforced concrete single-pole and pole–wire system structures also fall within this range, indicating that the selected seismic waves are reasonable.

4.2. Comparison of the Dynamic Responses of the Reinforced Concrete Single Poles and Pole–Conductor Systems

In this section, the differences in the dynamic responses between reinforced concrete single poles and reinforced concrete pole–conductor systems under unidirectional seismic action are systematically compared, and the influence patterns of the conductor span, span-to-height ratio, and ground motion characteristics on structural responses are analyzed. To further quantify the impact of parameter variations on response outcomes, the dynamic amplification coefficient (DAC) is introduced as an evaluation metric. The dynamic amplification coefficient is defined as the ratio of the load effect (internal forces and deformations) of a structure under modified parameters to that under unchanged parameters under identical conditions. This coefficient represents the relationship between the internal forces and deformations of two structures, providing a reference for studying the influence of different parameters on structural dynamic responses under seismic action and for optimizing seismic design. The formula for the dynamic amplification coefficient is as follows:
η s = S i S 0
where ηs is the dynamic amplification coefficient; Si is the load effect (internal forces and deformations) of the structure when one structural parameter is modified under identical conditions; and S0 is the load effect (internal forces and deformations) of the structure when no parameters are modified.
To ensure the validity of the dynamic coefficient calculation, ensuring that the comparative models differ only in a single parameter (span of the conductor) while all other parameters, including material properties, boundary conditions, seismic input, and solution strategies, remain consistent, is essential. Additionally, since the modal participation coefficients of the rod-cable system change with variations in conductor mass and tension, the equivalent dynamic participation coefficients of systems with different spans are no longer the same. Therefore, the dynamic coefficient not only reflects changes in structural stiffness but also includes differences in energy distribution caused by mass participation and nonlinear vibrations. When the dynamic coefficient is greater than one, it indicates that the change in this structural parameter amplifies the dynamic response of the structure. When the dynamic coefficient is equal to one, it indicates that the change does not affect the dynamic response, and when the dynamic coefficient is less than one, it indicates that the change reduces the dynamic response.

4.2.1. Dynamic Response of a Reinforced Concrete Single Pole

According to the calculation results, the displacement response of each node of the reinforced concrete pole increases with height, and the displacement along the X-direction is more significant. The maximum stress at the pole occurs at the connection point with the ground. The peak displacement in the X-direction at the top of the reinforced concrete single pole and the peak stress at the ground connection are summarized in Table 4.

4.2.2. Dynamic Response of the Reinforced Concrete Pole–Line System

Table 5 lists the peak X-direction displacement at the top of the pole and the peak stress at the pole–ground connection in the pole–line system with a pole height of 12 m and a concrete strength grade C50 (abbreviated as C50 + 12 m) under the action of three seismic waves for different conductor spans.
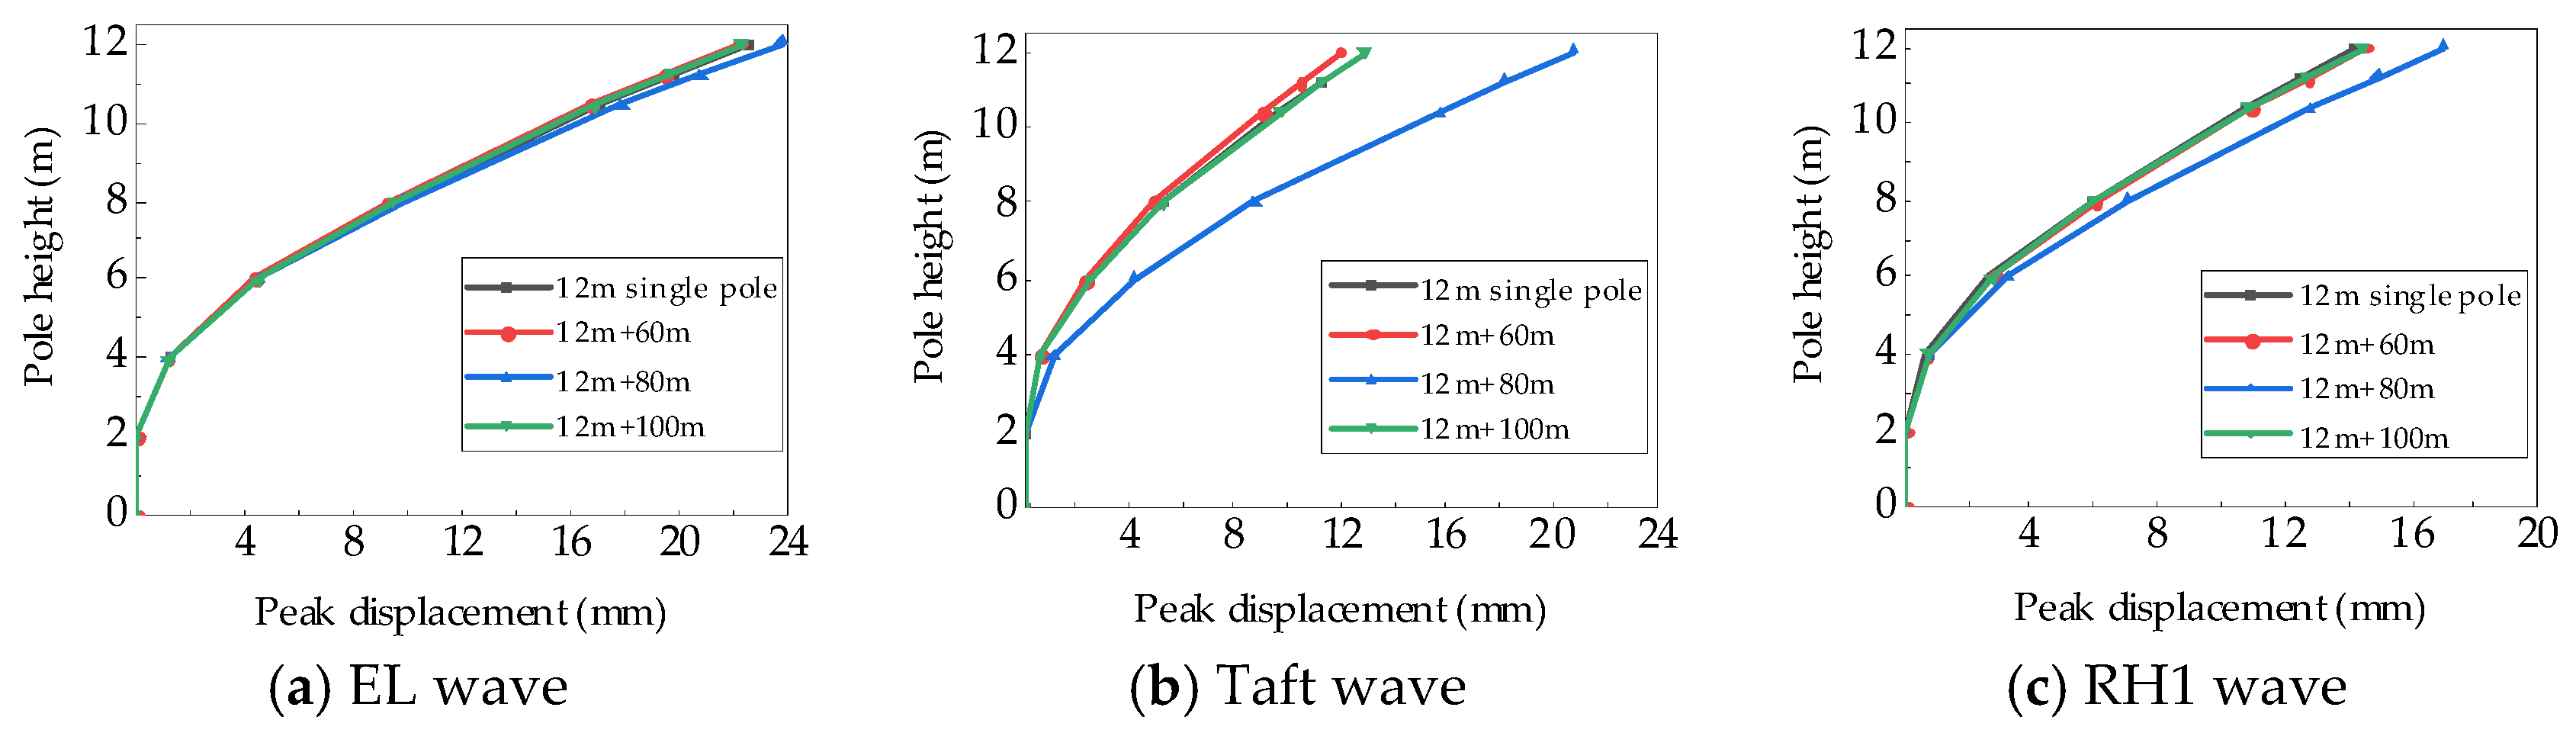
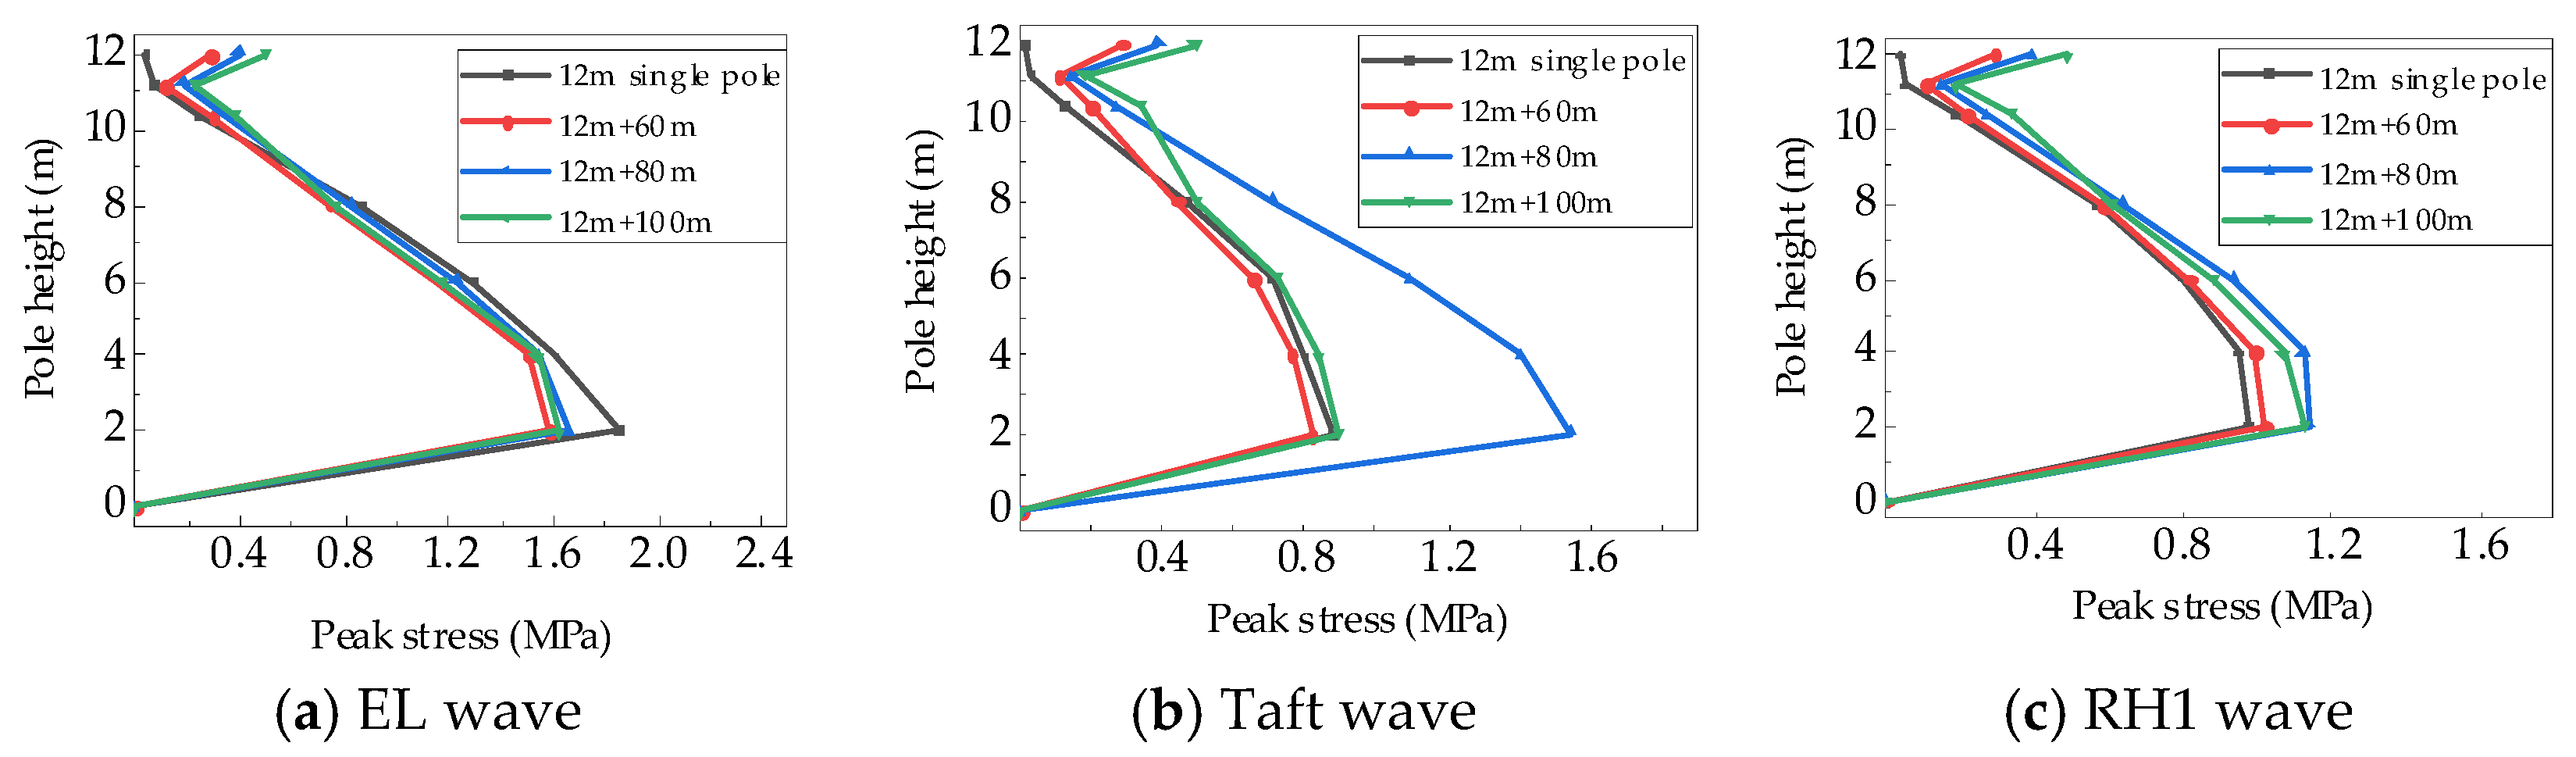
The X-direction displacement peaks and stress peaks at different heights of the pole for the reinforced concrete pole–conductor system with a concrete strength grade of C50, pole height of 12 m, and conductor spans of 60 m, 80 m, and 100 m, as well as for the C50 + 12 m reinforced concrete single pole under the action of three seismic waves, are shown in Figure 9 and Figure 10.
Figure 9 and Figure 10 reveal the following:
1. Under unidirectional seismic wave action, the overall trends of the peak displacement and peak stress of the pole body with varying heights are generally similar for both the reinforced concrete single pole and the pole–line system. The peak displacement increases with the height of the pole and tends to increase linearly.
2. For both the reinforced concrete single pole and the pole–line system, the maximum stress occurs at the connection between the pole and the ground. The stress gradually decreases as the pole height increases, but in the pole–line system, the stress at the top of the pole is slightly greater than that at the crossarm position. Additionally, as the span of the conductor increases, the stress at the top of the pole gradually increases. This phenomenon is attributed to the insulators on the pole–line system being connected to the conductors, which increases the mass borne by the upper part of the pole. During seismic action, the vibration of conductors leads to an increase in stress at the pole top.
3. Under different conductor spans, compared with those of a single pole, the displacement and stress responses of the pole in the pole–line system increase or decrease to varying degrees. This finding indicates that the influence of the conductor on the seismic response of the pole is not consistent under different seismic inputs. The primary reason is that the vibration modes of conductors under seismic action are complex and diverse. The swing direction of the conductor may sometimes align with or oppose the vibration direction of the pole, thereby amplifying or dampening the pole’s vibration.
Table 6 compares the average peak dynamic response values of the reinforced concrete pole in the pole–line system under three seismic waves with those of the single pole.
The calculation results in Table 6 indicate that under unidirectional seismic action, as the span of the conductor changes, the dynamic response of the reinforced concrete pole in the pole–conductor system shows either a reduction or amplification compared with that of a single pole. When the conductor spans are 60 m and 100 m, the X-direction displacement at the top of the pole in the pole–conductor system and the stress at the connection between the pole and the ground are reduced compared with those of a single pole. At conductor spans of 60 m and 100 m, the maximum displacement reduction factor is 0.98, and the maximum stress reduction factor is 0.92. Moreover, the vibration-damping effect is weaker when the conductor span is 100 m than when it is 60 m. When the conductor span is 80 m, the X-direction displacement at the top of the pole and the stress at the connection between the pole and the ground in the pole–conductor system both increase compared with those of a single pole, with a maximum displacement amplification factor of 1.26 and a maximum stress amplification factor of 1.17. These findings indicate that the presence of a conductor increases the dynamic response of the pole–conductor system in this case and that the influence of the conductor cannot be ignored in practical engineering.
The occurrence of the above phenomenon is the result of the combined effects of the mass effect and the nonlinear vibration effect of the conductor. Under seismic action, the conductor undergoes nonlinear deformation, and continuous tightening and loosening generate nonlinear forces on the utility pole, hindering excessive relative deformation of the pole. The reduction in the pole response can be attributed to the energy dissipation capability of the conductors’ geometric nonlinear motion. As demonstrated in previous research (e.g., Tian et al. [15]), the swinging of conductors consumes energy through varying tension, acting similarly to a tuned mass damper. While specific energy time histories are not presented here, the reduced peak displacement observed in the results supports this mechanism. Therefore, in a pole–conductor system with a conductor span of 60 m, the dynamic response of the utility pole tends to decrease compared with that of a single pole, indicating that the nonlinear vibration-damping effect of the conductor outweighs its mass effect in this scenario. As the conductor span increases, the mass of the overhead conductor borne by the insulators in the pole–conductor system model increases, leading to a higher overall mass and an elevated center of mass of the structure. Consequently, in the pole–conductor system with a conductor span of 80 m, the dynamic response of the utility pole exceeds that of the single pole, demonstrating that the mass effect of the conductor dominates over its nonlinear vibration effect at this stage. With further increases in the conductor span, the vibration of the conductor becomes more intense, and the nonlinear vibration-damping effect becomes more pronounced. Thus, when the conductor span is 100 m, the dynamic response of the utility pole in the pole–conductor system is slightly lower than that in the case with a span of 80 m. However, the dynamic response of the utility pole in the system with a conductor span of 100 m is only marginally smaller than that of the single pole, suggesting that the nonlinear vibration effect of the conductor slightly exceeds its mass effect under these conditions.
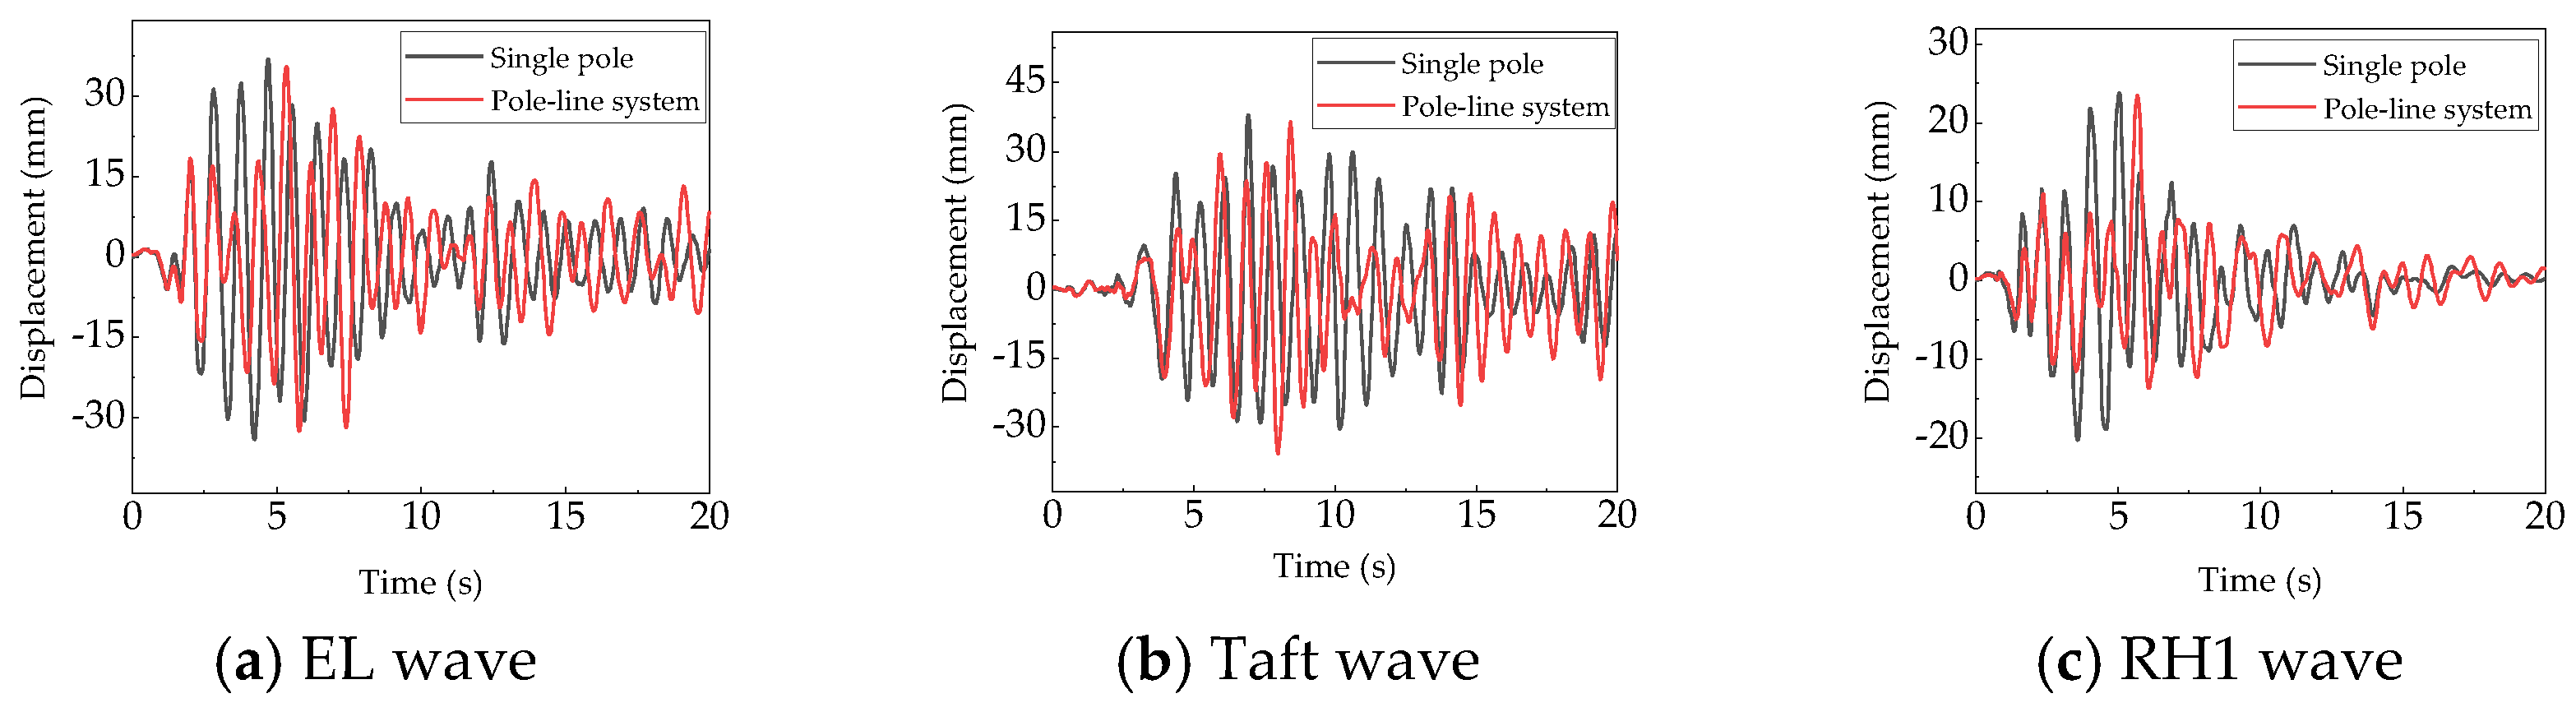
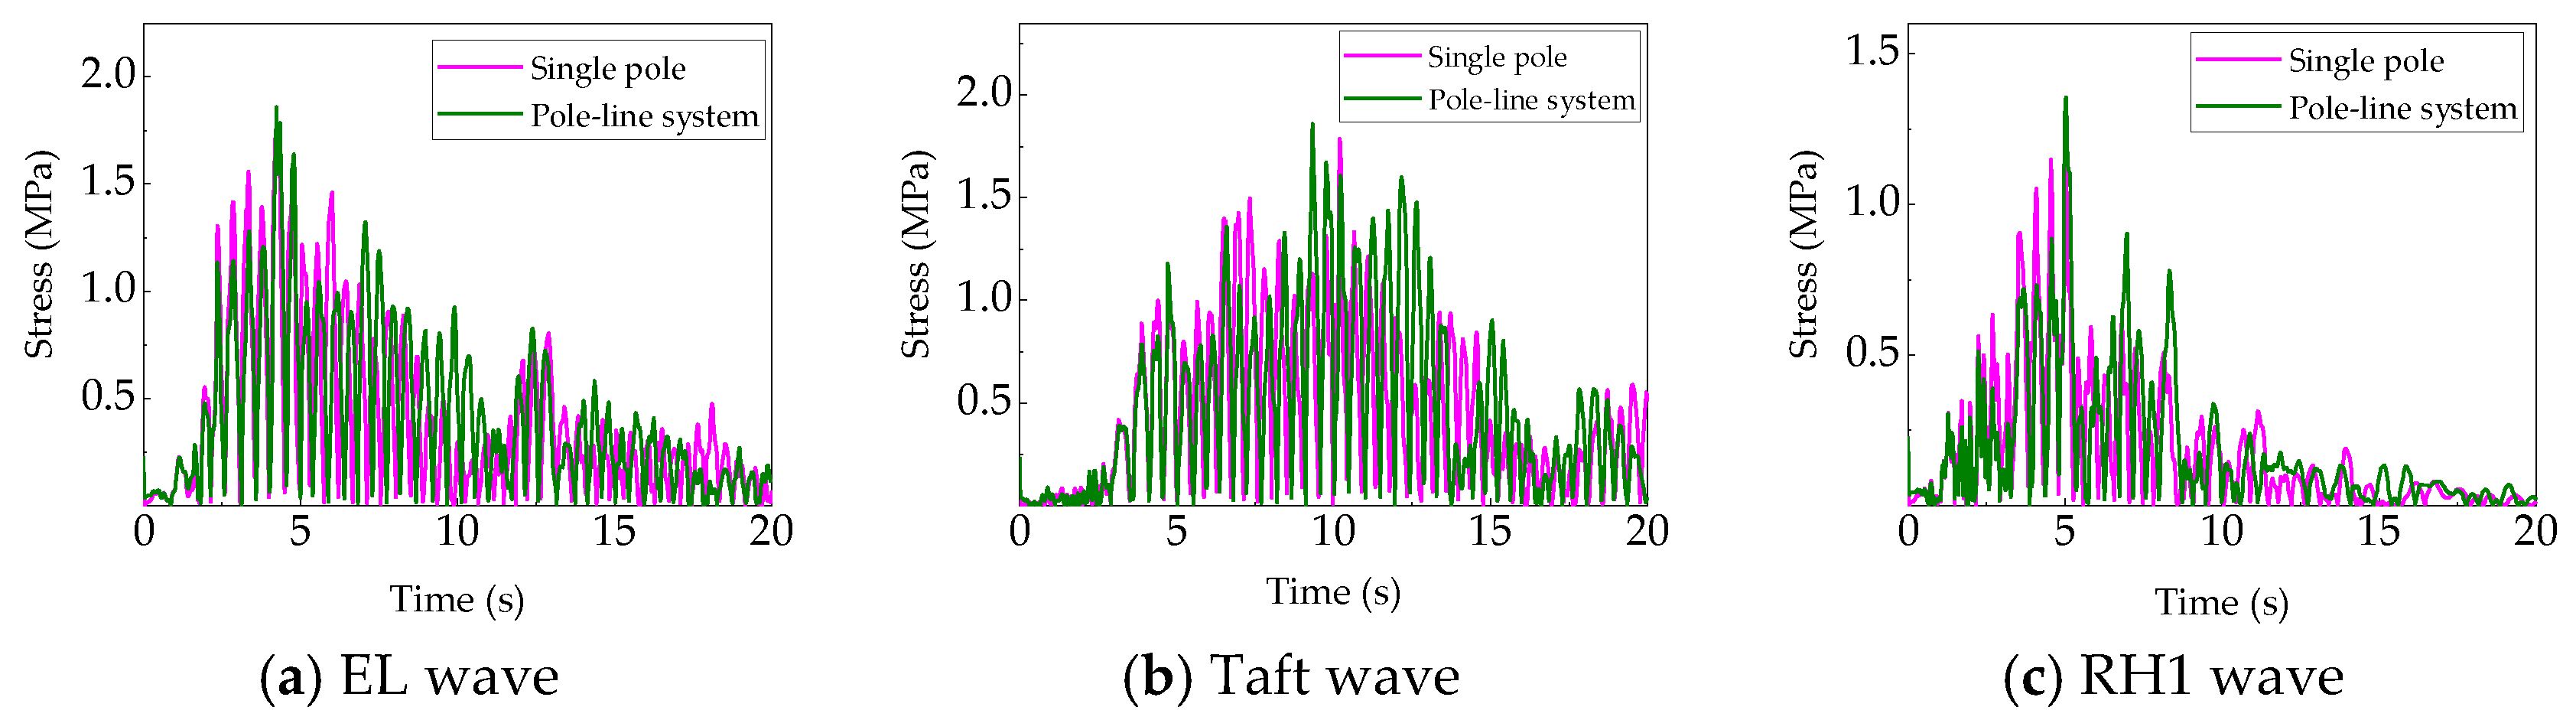
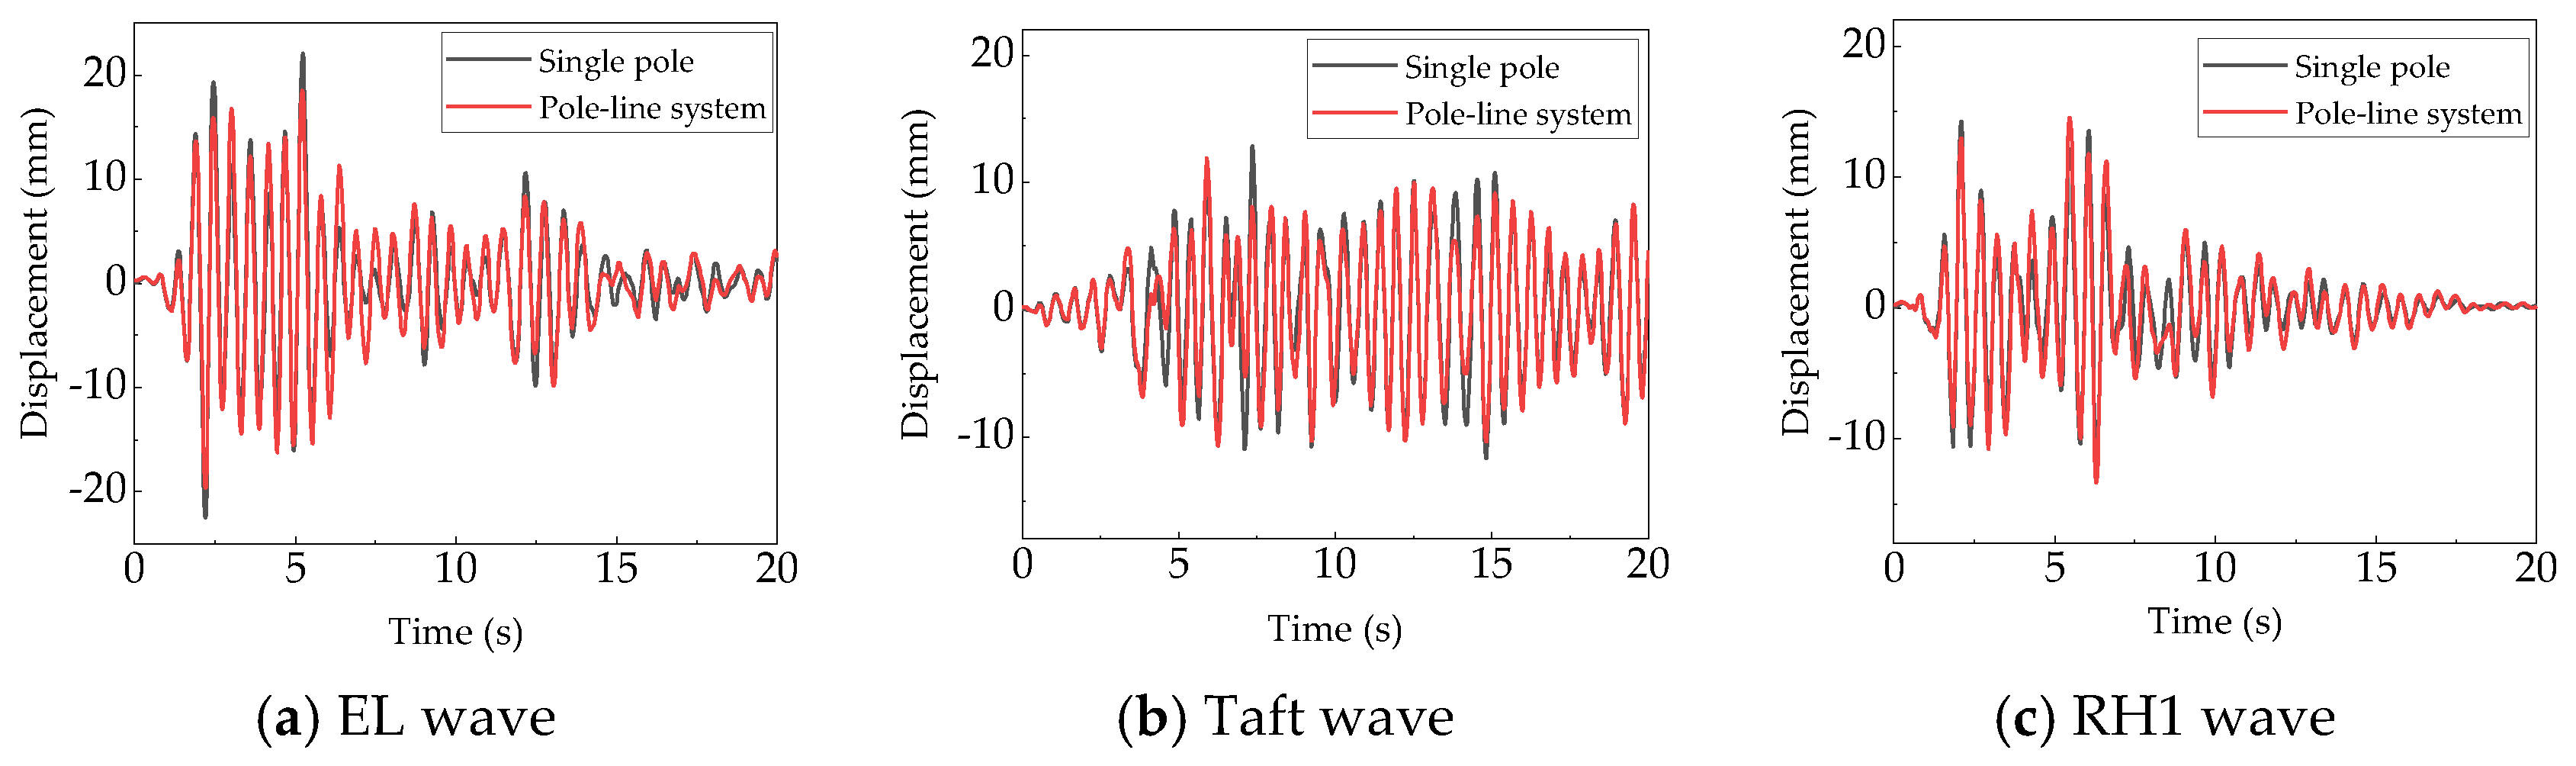
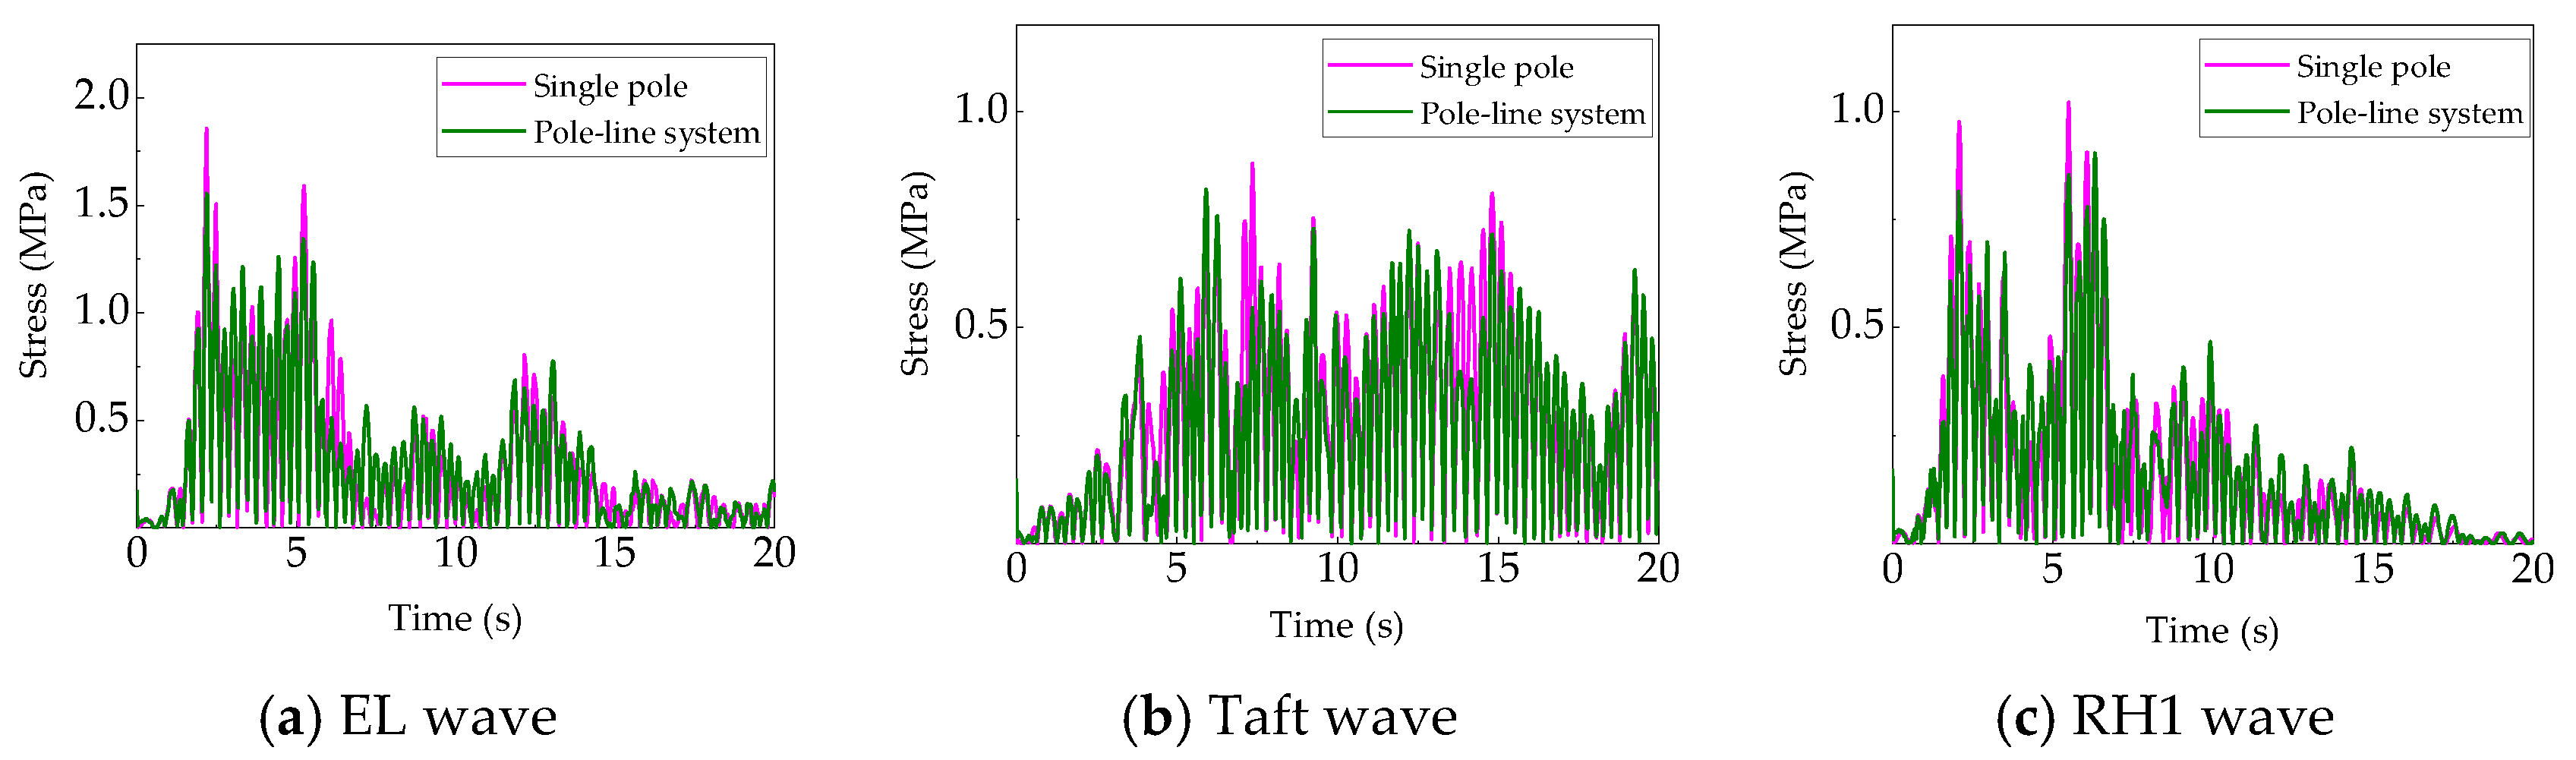
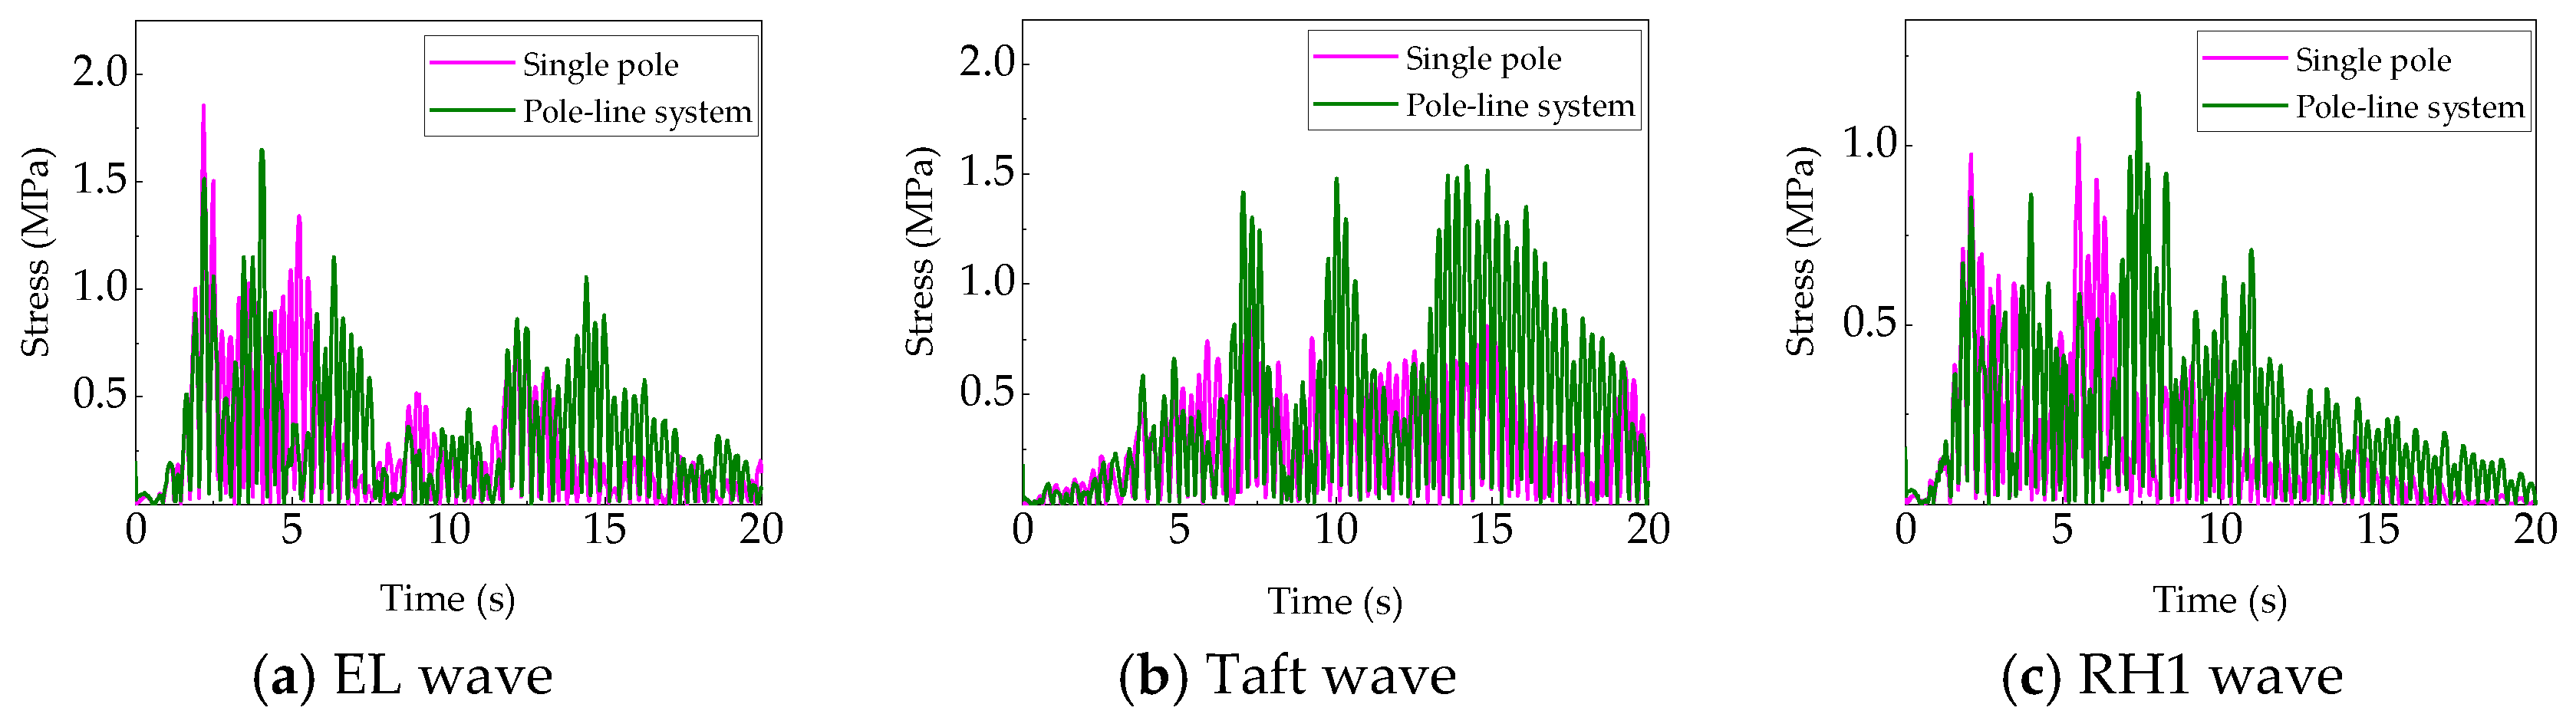
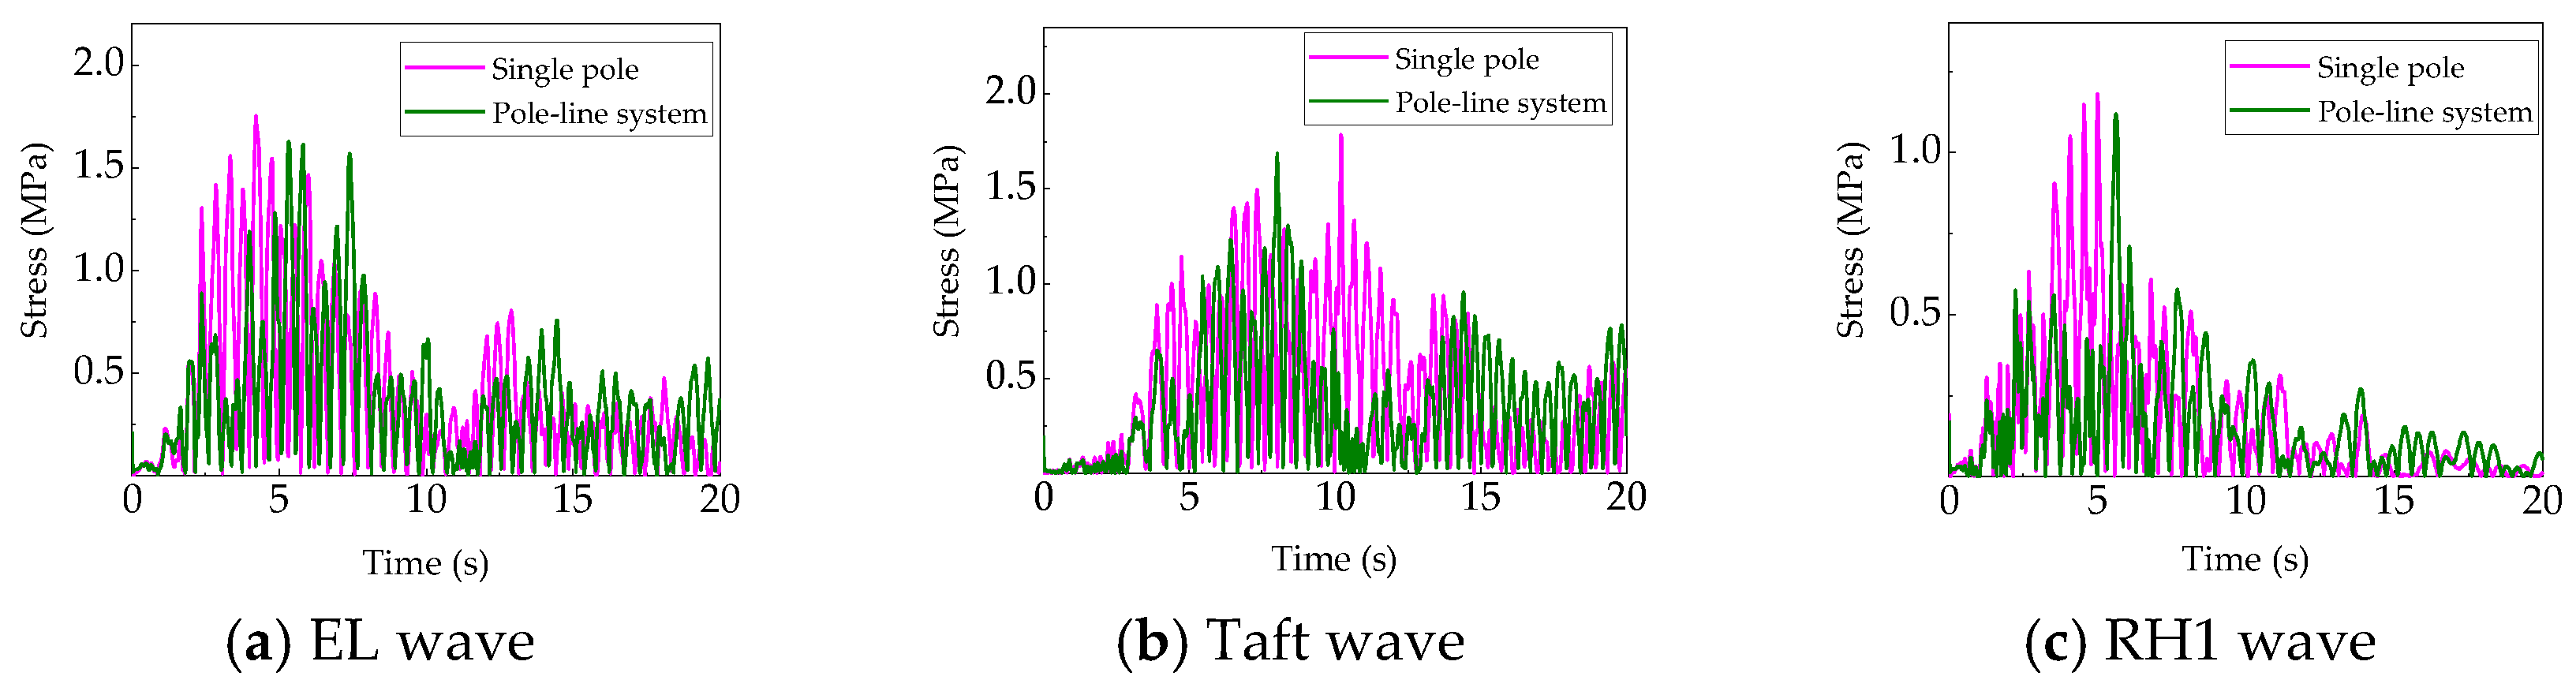
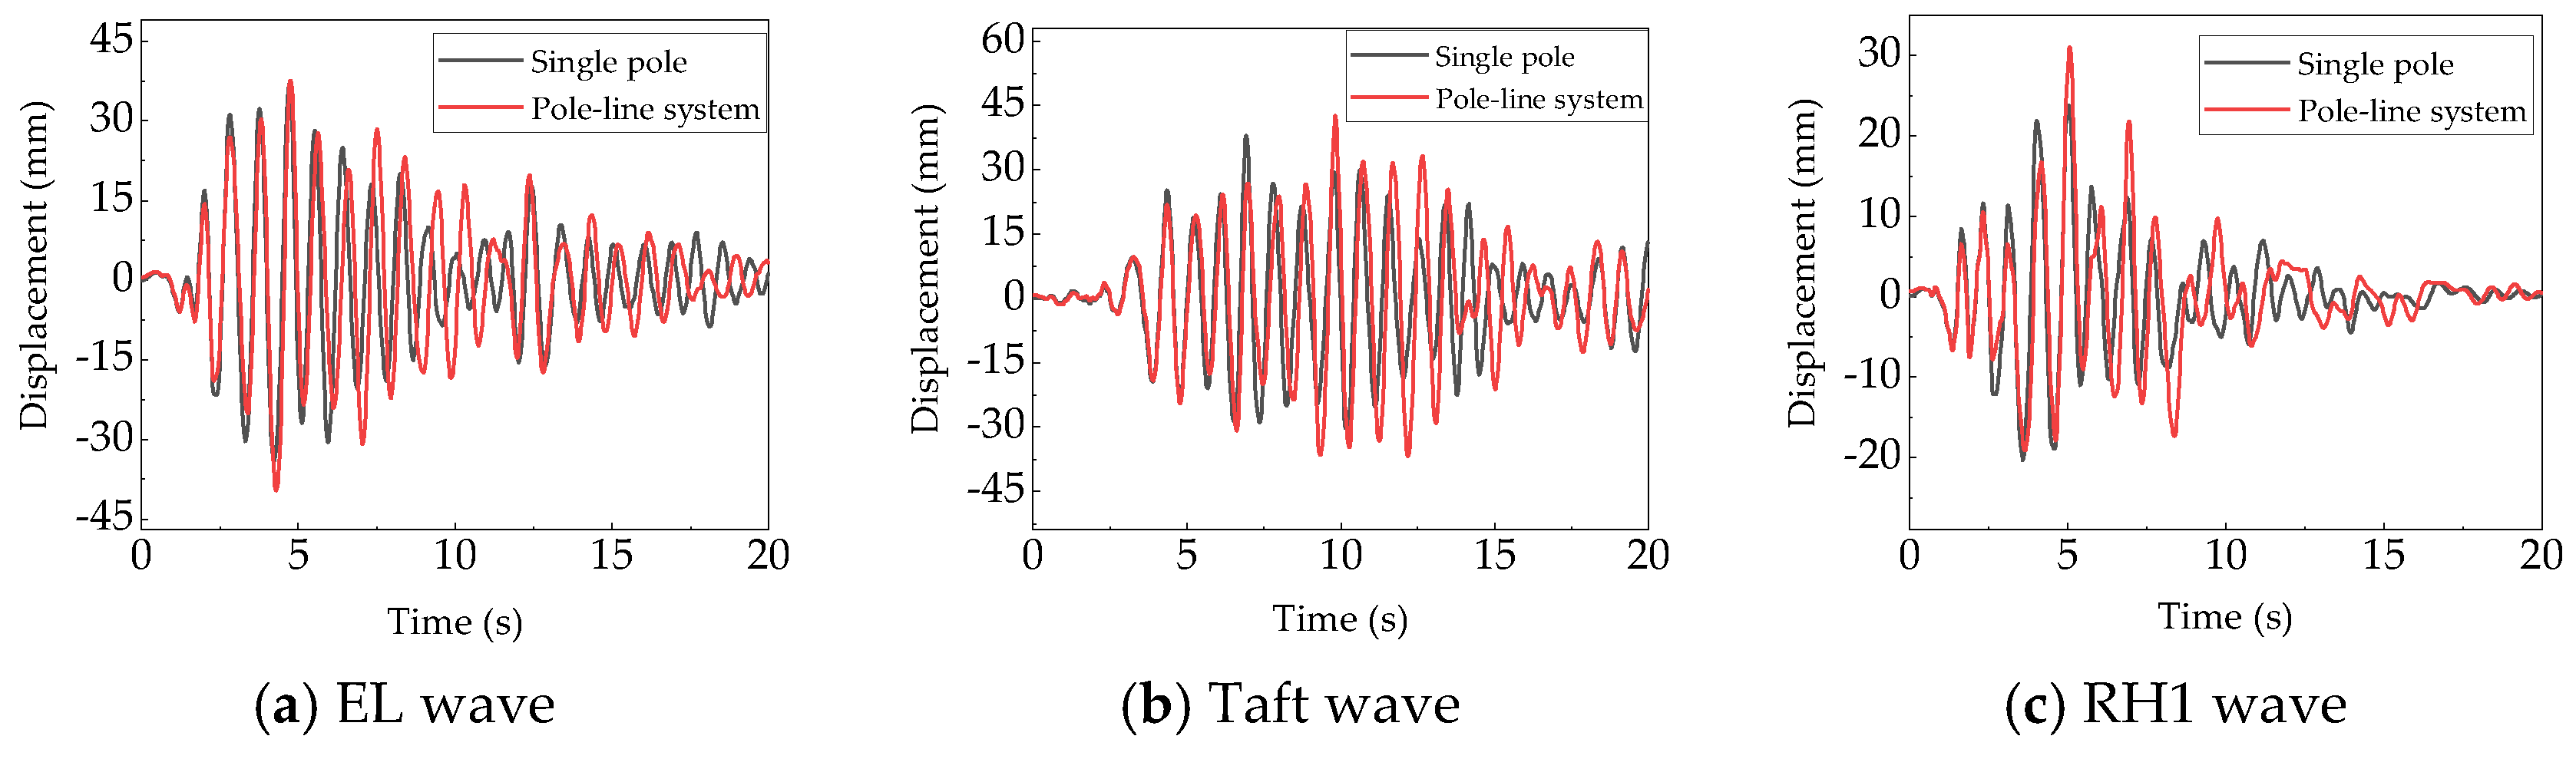
The displacement time–history in the X-direction at the top of the pole and the stress time–history at the connection between the pole and the ground in the reinforced-concrete single-pole and pole–wire system under the action of three seismic waves when the concrete strength grade is C50 are shown in Figure 11, Figure 12, Figure 13, Figure 14, Figure 15 and Figure 16.
The time–history response trends of the reinforced concrete single pole and pole–line systems under the same seismic wave action are generally similar, with only some differences in peak values shown in Figure 11, Figure 12, Figure 13, Figure 14, Figure 15 and Figure 16. The comparability between the calculation results of the two models is good, confirming that the computational methods, processes, and result processing adopted in this paper are relatively accurate.
Table 7 lists the peak X-direction displacement at the top of the pole and the peak stress at the pole–ground connection position of the pole–line system with a pole height of 15 m and a concrete strength grade C50 (abbreviated as C50 + 15 m) under the action of three seismic waves for different conductor spans.
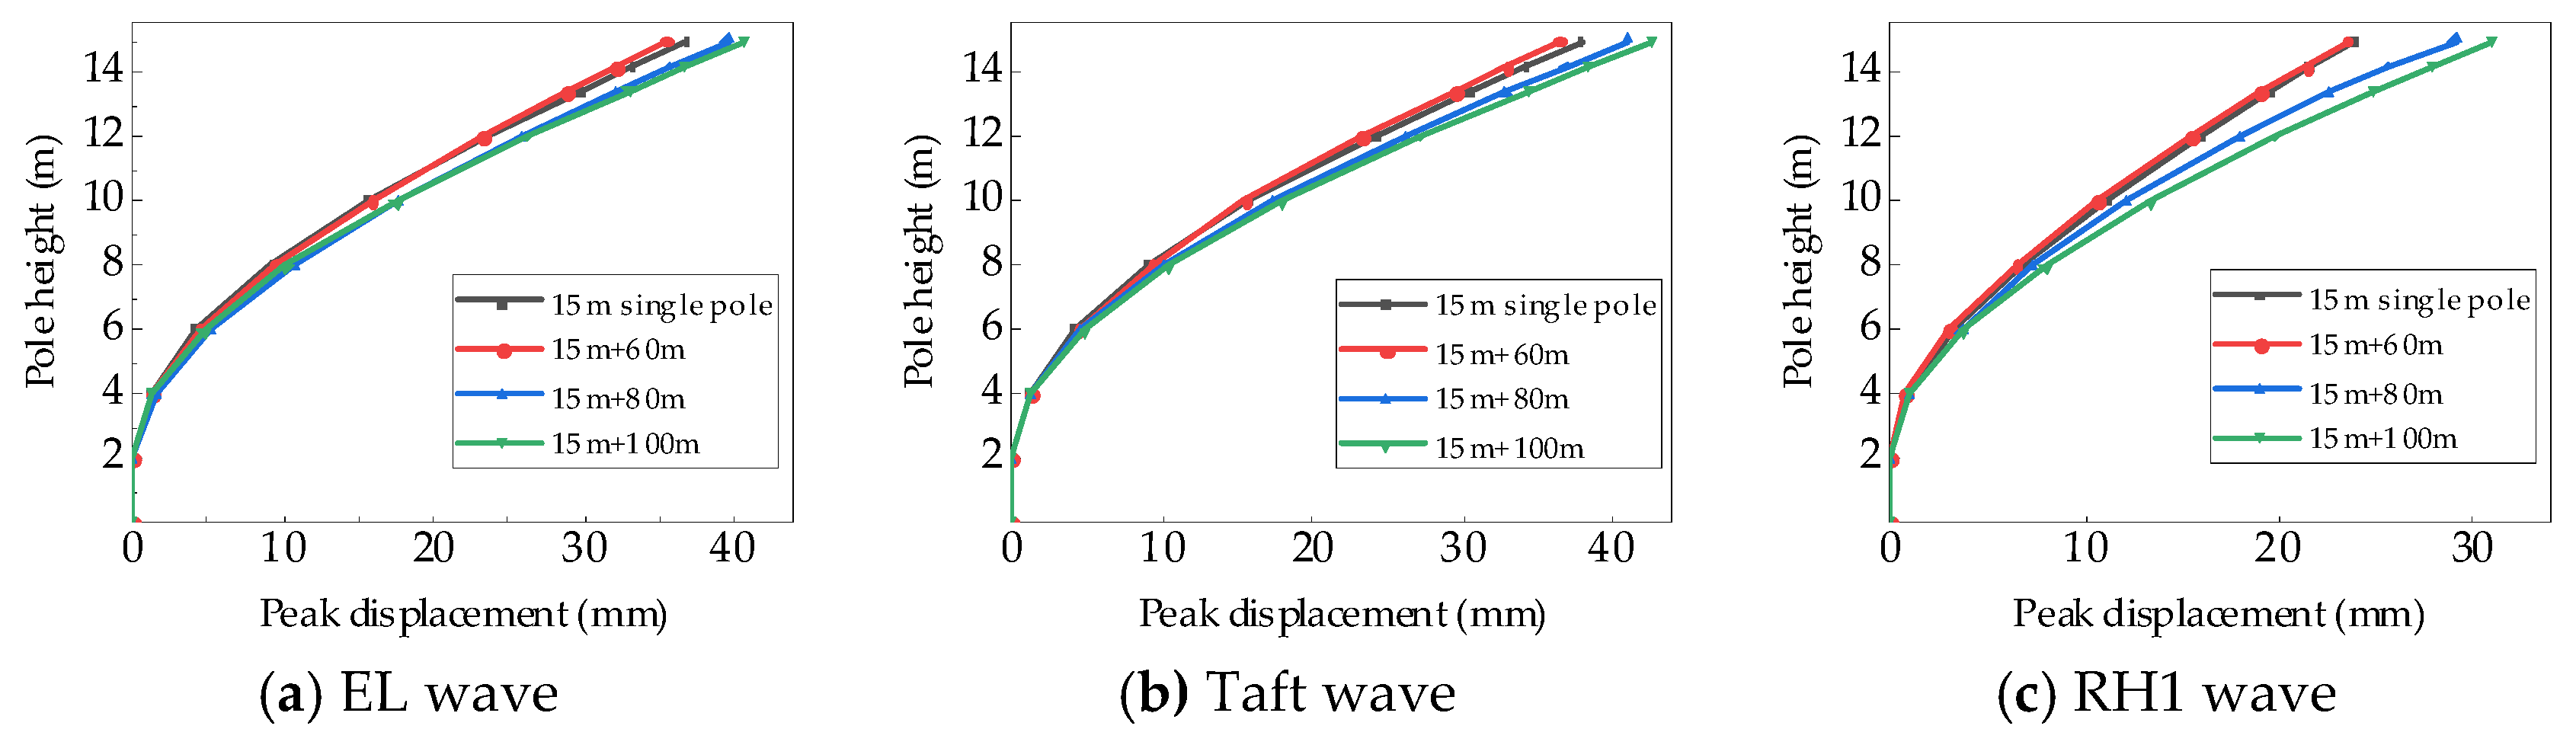
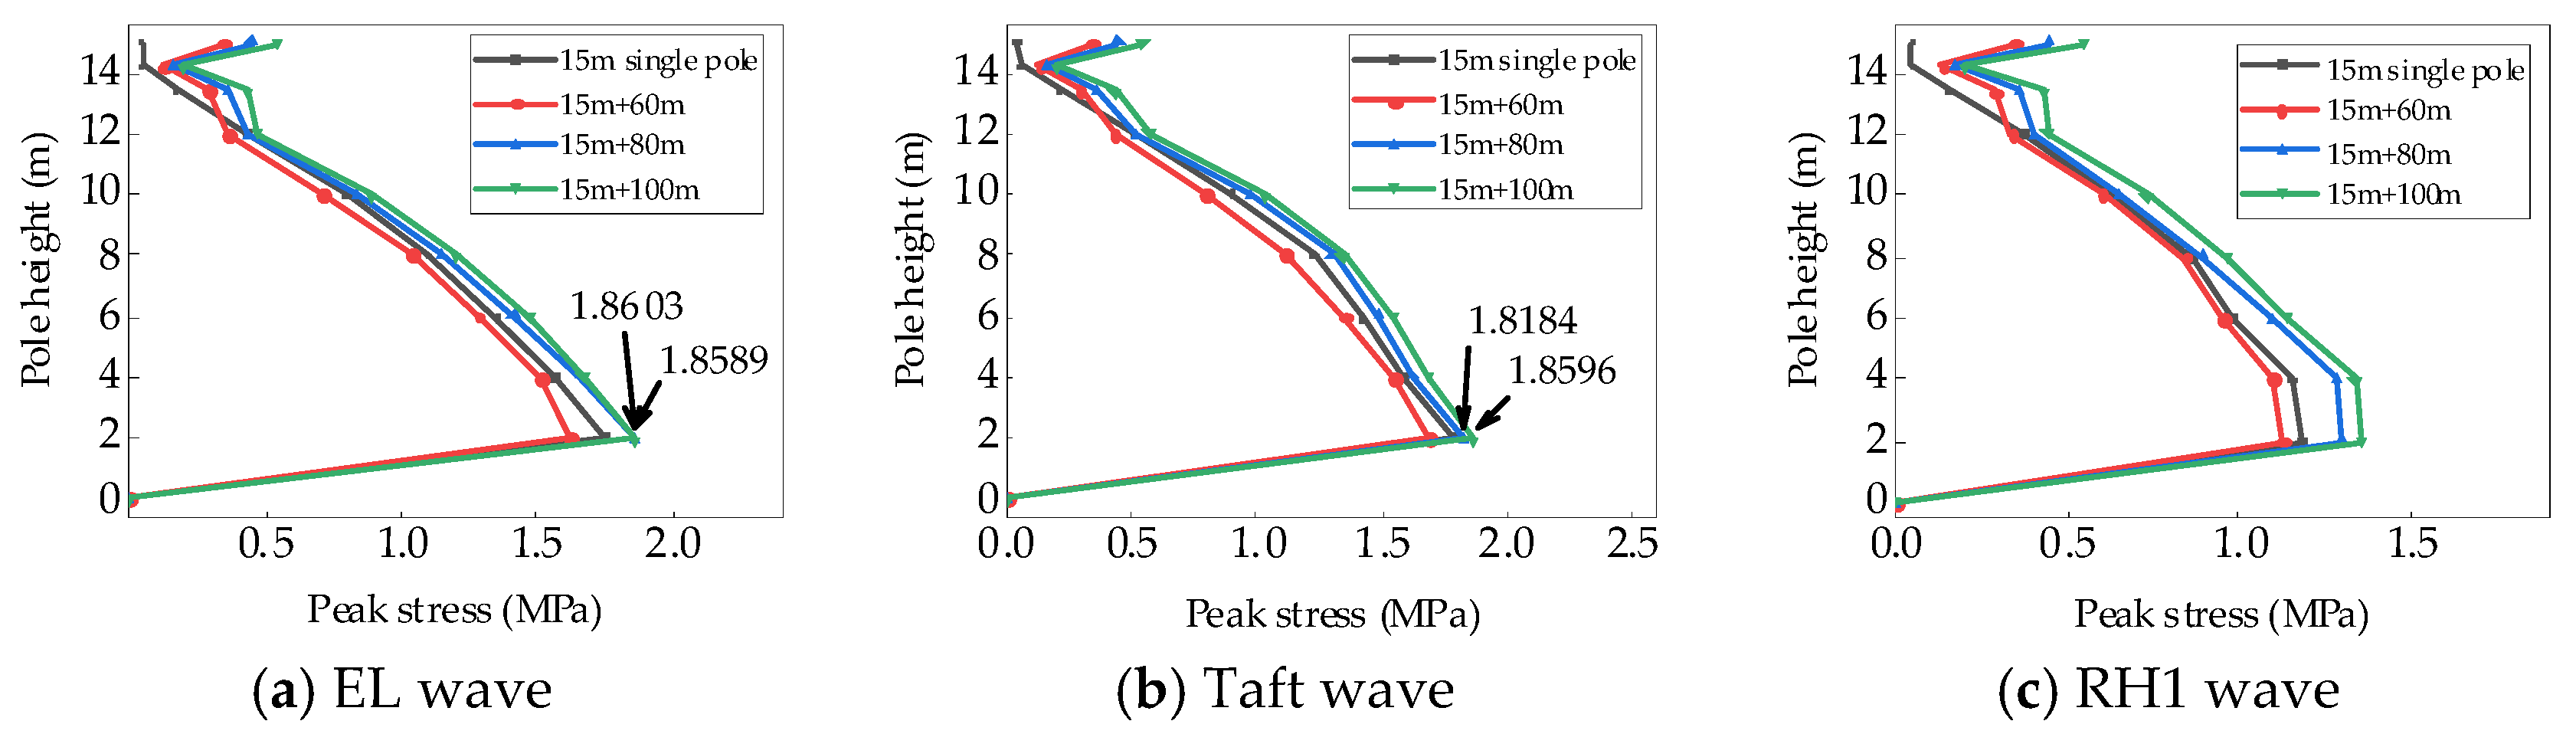
The peak X-direction displacement and peak stress are extracted at different heights along the concrete pole in the pole–conductor system and the C50 + 15 m reinforced concrete single pole under the action of three seismic waves, where the strength grade of the concrete is C50, the pole height is 15 m, and the conductor spans are 60 m, 80 m, and 100 m, as shown in Figure 17 and Figure 18.
As shown in Figure 18, under unidirectional seismic action, the overall trends of the displacement peaks and stress peaks of the reinforced concrete single pole and the pole in the pole–conductor system with height are generally similar. Under the EL wave and Taft wave, the maximum stresses at the ground connection of the pole in the pole–conductor system with conductor spans of 80 m are 1.8589 MPa and 1.8184 MPa, respectively, reaching 98.35% and 96.21% of the design tensile strength of the concrete; with conductor spans of 100 m, the values are 1.8603 MPa and 1.8596 MPa, reaching 98.43% and 98.39% of the design tensile strength of the concrete, respectively. Many cracks are generated on the tension side of the pole body within the 2 m area above the ground connection, indicating that the pole is approaching tensile failure.
Table 8 compares the average values of the dynamic response peaks of the reinforced concrete pole in the pole–conductor system with those of the single pole under three seismic waves.
The calculation results in Table 8 indicate that under unidirectional seismic action, as the conductor span changes, the dynamic response of the reinforced concrete pole in the pole–conductor system shows either a reduction or amplification compared with that of a single pole. When the conductor span is 60 m, the X-direction displacement at the top of the pole in the pole–conductor system and the stress at the ground connection of the pole are reduced compared with those of a single pole. The maximum displacement reduction factor is 0.95, and the maximum stress reduction factor is 0.94. This finding indicates that, compared with the mass effect, the nonlinear vibration effect of the conductor has a greater influence at this stage and that the nonlinear vibration of the conductor plays a certain role in energy dissipation. As the conductor span increases, when the spans are 80 m and 100 m, the X-direction displacement at the top of the pole and the stress at the ground connection in the pole–conductor system both increase compared with those of a single pole. Moreover, the amplification factor of the dynamic response in the pole–conductor system is greater for a span of 100 m than for spans of 80 m. For spans of 80 m and 100 m, the maximum displacement amplification factors are 1.07 and 1.16, respectively, whereas the maximum stress amplification factors are 1.05 and 1.07, respectively. The reason for this phenomenon is that as the conductor span increases, the mass of the overhead conductor borne by the insulators in the pole–conductor system increases, leading to a higher overall structural mass and an elevated center of gravity. At this point, the mass effect of the conductor outweighs the damping effect caused by its nonlinear vibration.
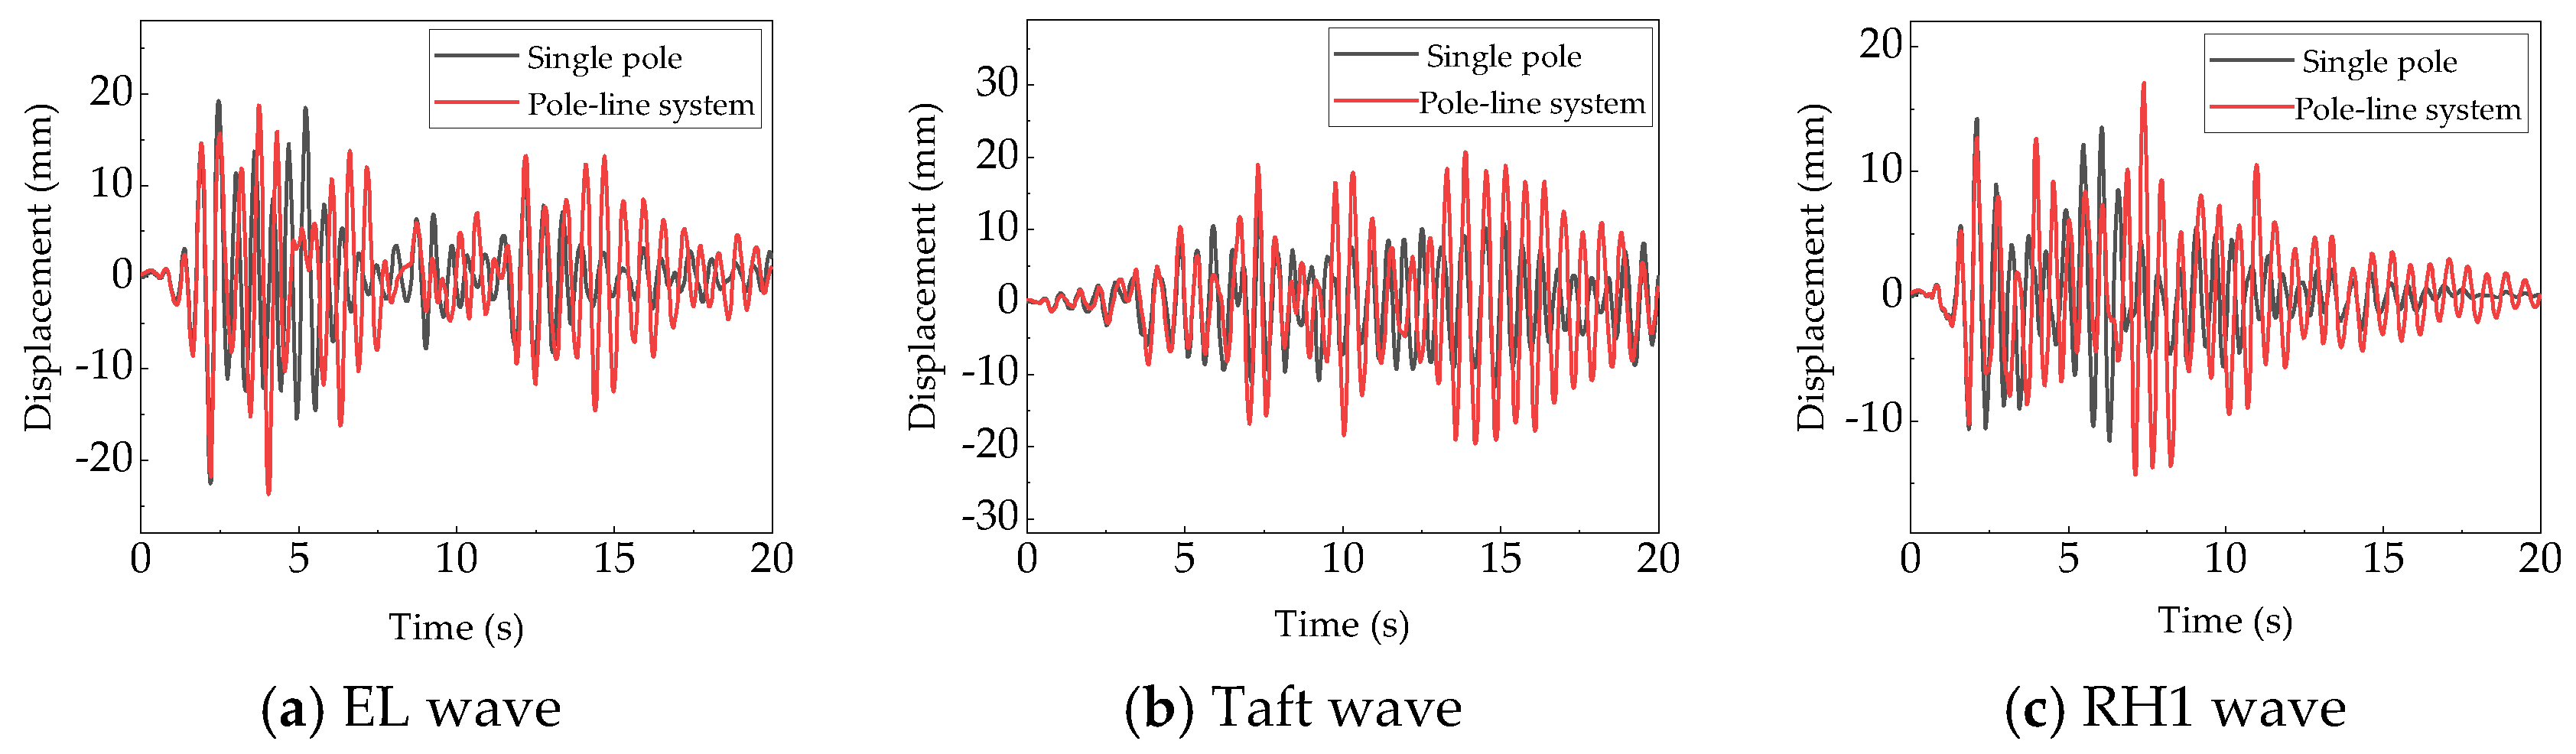
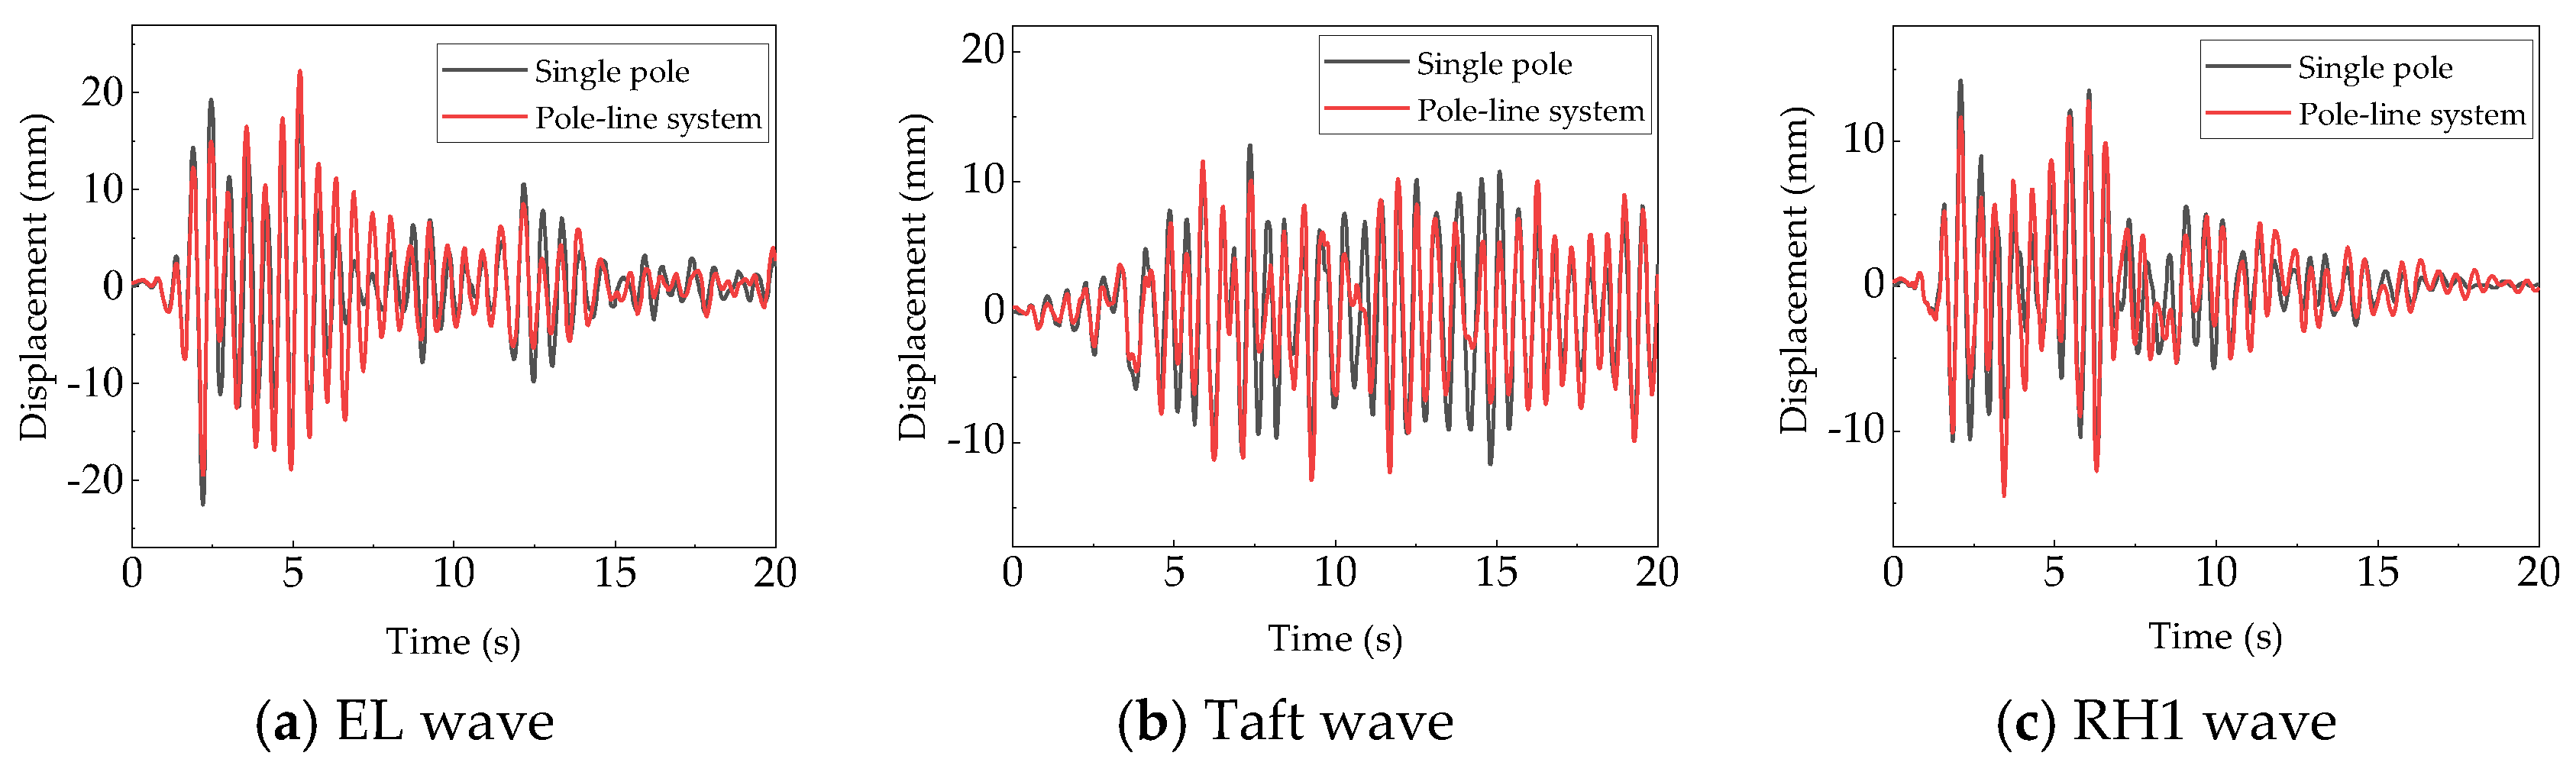
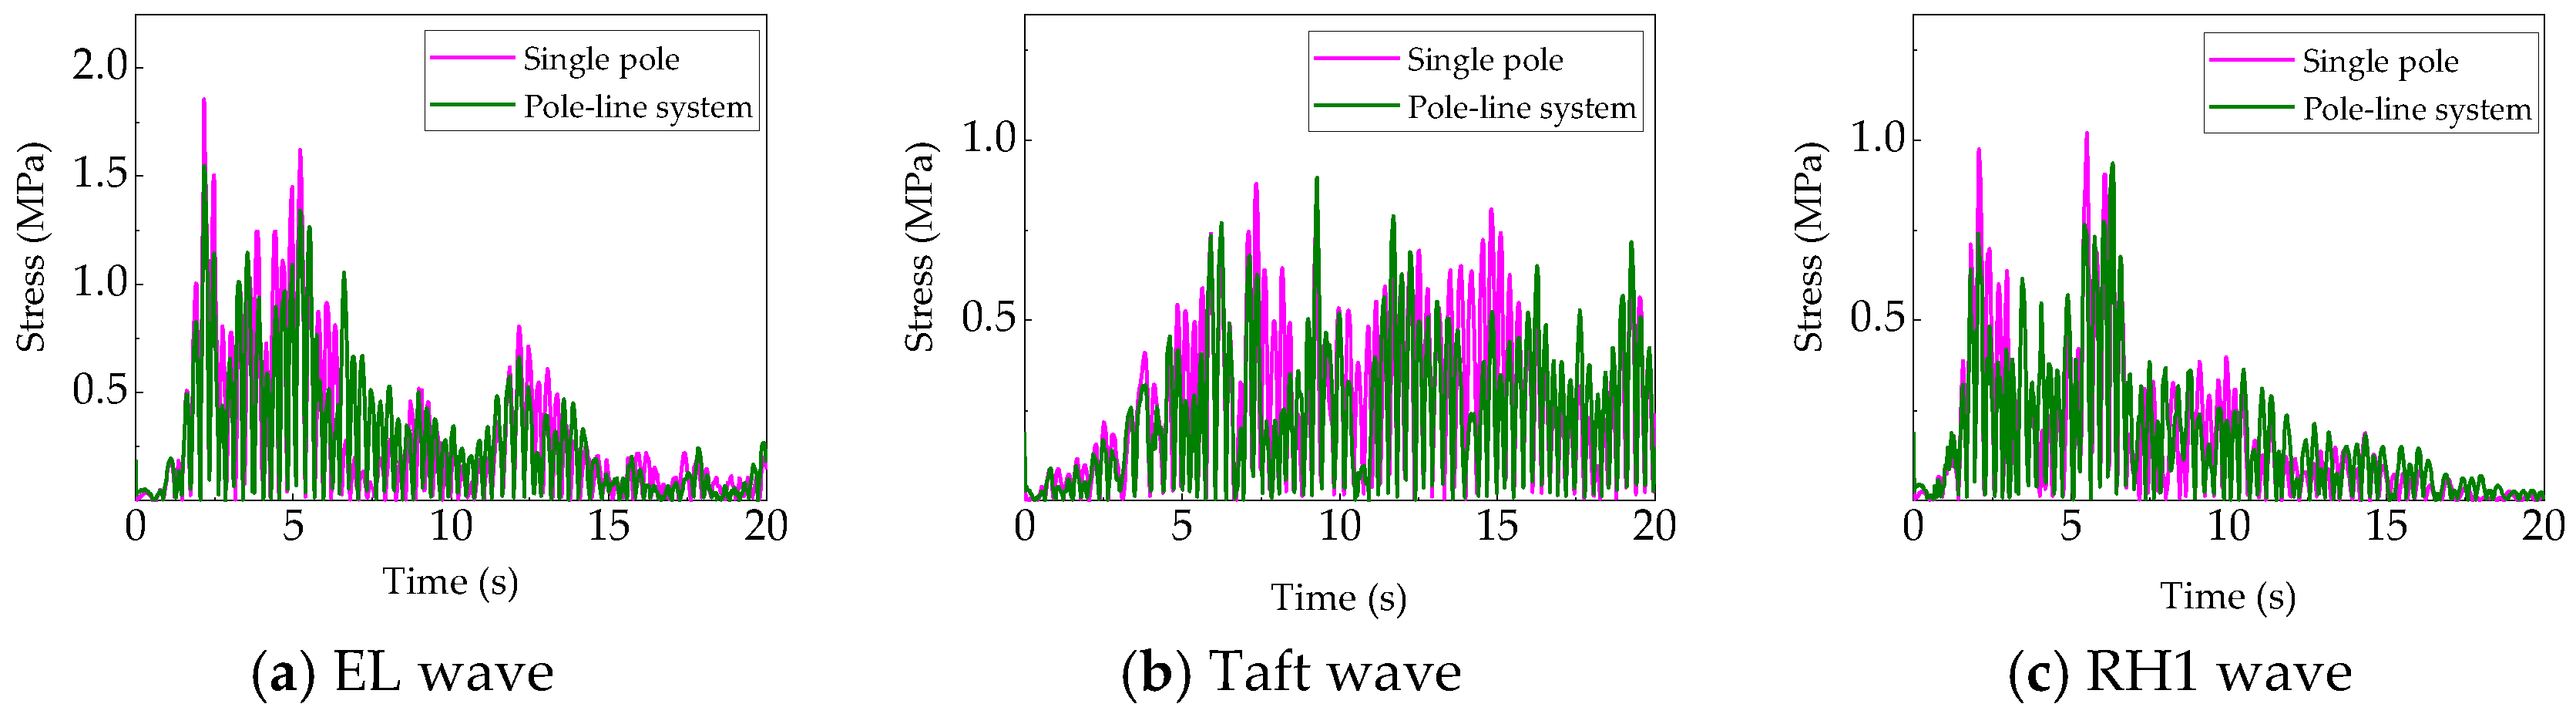
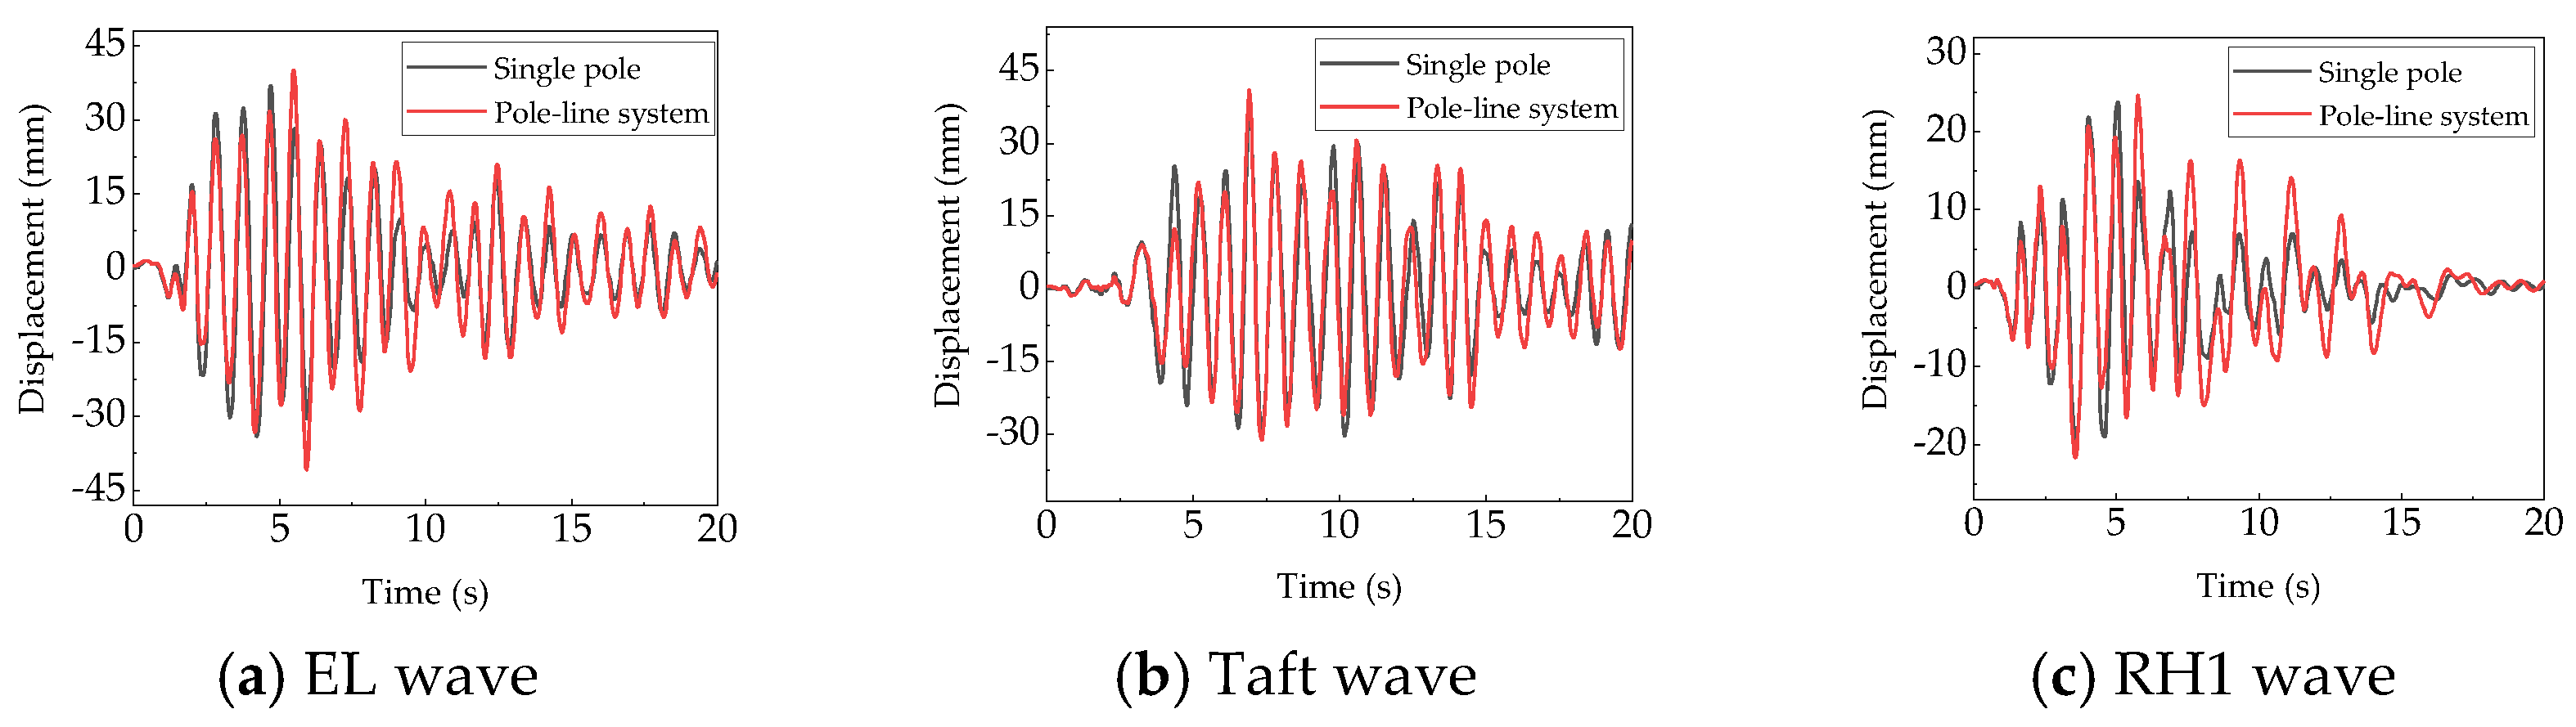
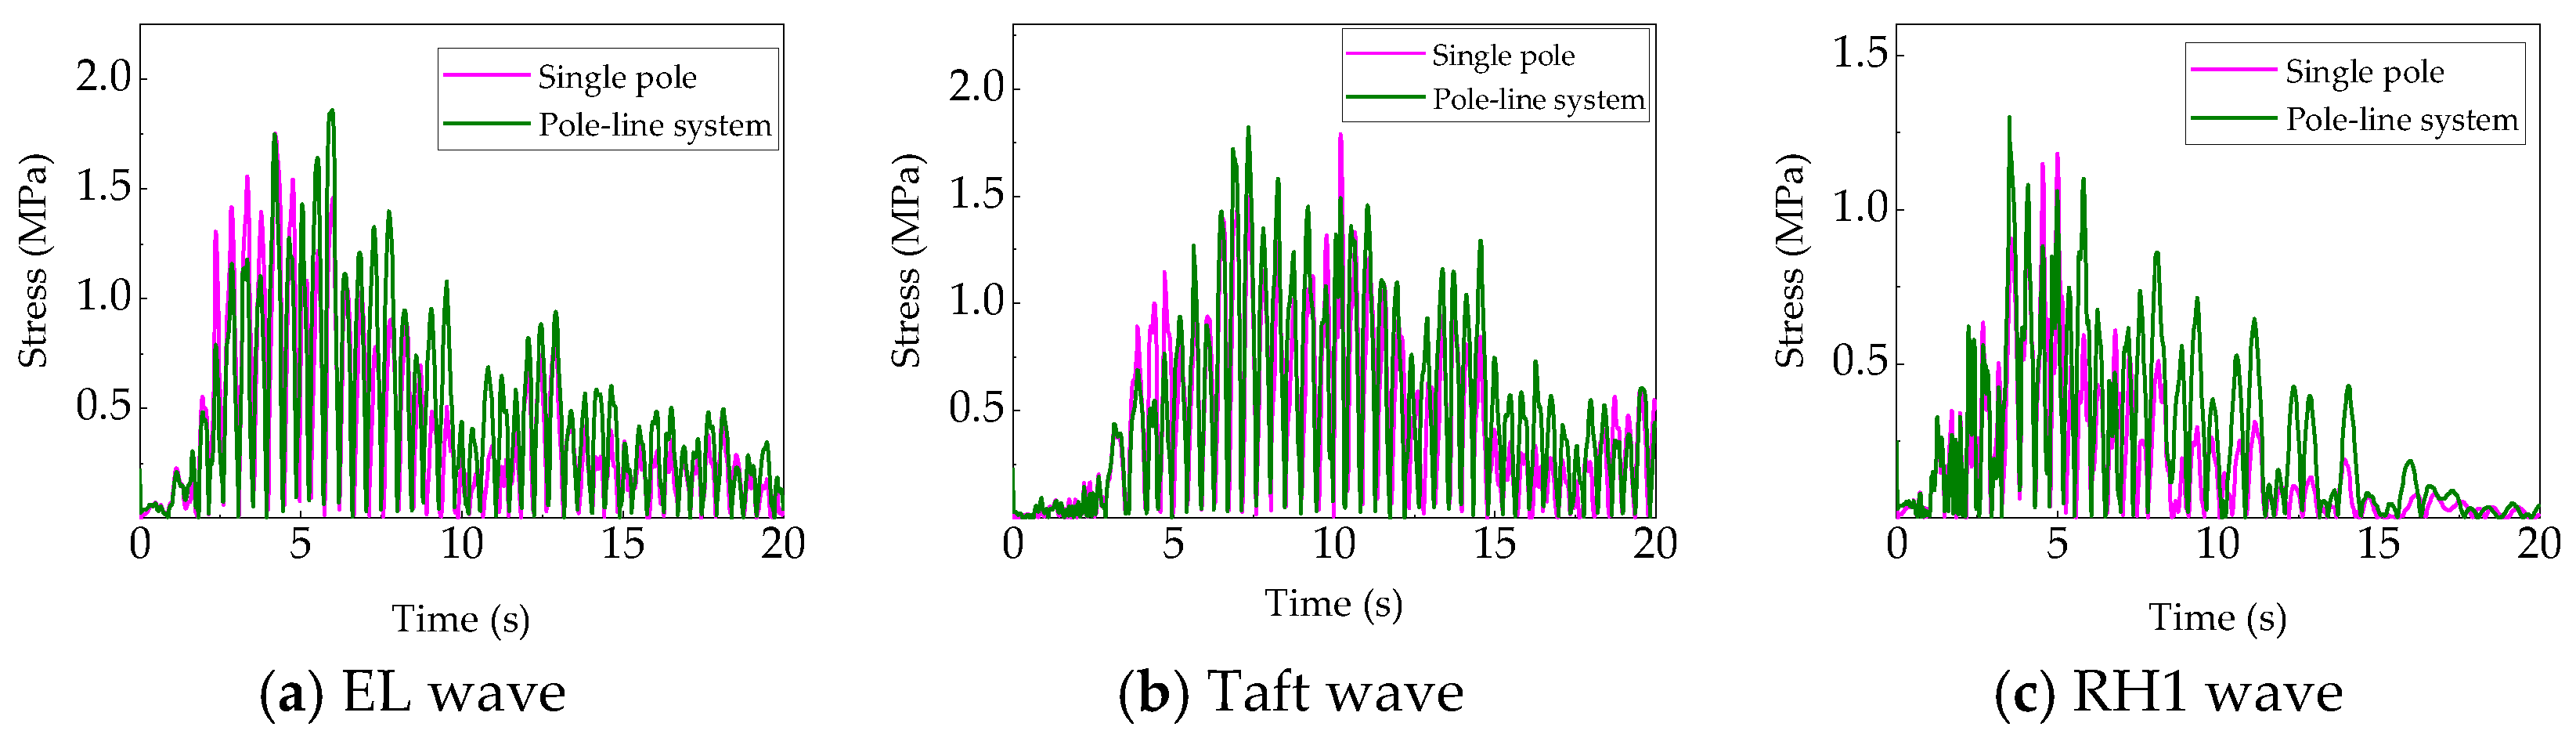
The displacement time histories in the X-direction at the top of the reinforced concrete single pole and pole–line system under the action of three seismic waves, as well as the stress time histories at the connection between the pole and the ground, are extracted, as shown in Figure 19, Figure 20, Figure 21, Figure 22, Figure 23 and Figure 24.
Based on the above analysis, under unidirectional seismic action, for reinforced concrete pole–line systems of the same height with different conductor spans, the combined effects of conductor mass and nonlinear vibration result in differences in the dynamic response of the pole–line system under seismic action. When the span-to-height ratio (ratio of conductor span to pole height) is less than 5, the maximum stress in the pole–line system is lower than that in a single pole, with a maximum reduction coefficient of 0.94. When the span-to-height ratio is between 5 and 6.7, the maximum stress in the pole–line system increases compared with that in a single pole, with a maximum amplification coefficient of 1.17. When the span-to-height ratio is 8.3, the maximum stress in the pole–line system decreases compared with that in a single pole, with a maximum reduction coefficient of 0.98. Therefore, in practical engineering, when the span-to-height ratio of the pole–line system is between 5 and 6.7, it is necessary to consider the stress amplification effect in the pole due to conductor vibration. During design, it is recommended that the dynamic amplification coefficient be no less than 1.17.

5. Conclusions

This paper takes a typical 10 kV distribution line as the engineering background. Using ANSYS software, finite element models of a single reinforced concrete pole and a coupled “three-pole two-conductor” system were established. Using dynamic time–history analysis, this study focuses on the influence of the conductor span on the dynamic response of a structure under seismic action and compares the mechanical differences between the pole–conductor system and a single pole. The main conclusions are as follows:
(1) The dynamic characteristics of the reinforced concrete pole–conductor system differ significantly from those of the single-pole model. The mass effect of the conductors significantly reduces the overall natural frequency of the system. The calculations reveal that when the conductor span increases from 60 m to 100 m, the first-order natural frequency of the system decreases by 10.34% to 18.14%. This significant reduction in frequency causes a drift in the fundamental period of the structure, and the magnitude of this change necessitates reverification of the avoidance requirements for characteristic periods (such as the 0.1 s limit or resonance intervals) specified in the “Code for Seismic Design of Electrical Installations” (GB 50260-2013). Therefore, when seismic design for such electrical facilities is being conducted, neglecting the coupling effect between poles and conductors will lead to significant errors, and the influence of coupling effects on the dynamic response of poles must be fully considered.
(2) Under seismic action, the influence of the conductor on the dynamic response of the pole in the reinforced concrete pole–conductor system varies with changes in the conductor span. When the span-to-height ratio is less than 5 or 8.3, the maximum stress at the ground connection of the pole in the pole–conductor system is reduced compared with that of a single pole, with maximum reduction coefficients of 0.94 and 0.98, respectively. When the span-to-height ratio is between 5 and 6.7, the maximum stress at the ground connection of the pole in the pole–conductor system increases compared with that of a single pole, with a maximum amplification factor of 1.17.
(3) Overall, in practical engineering, when the span-to-height ratio of the pole–conductor system is between 5 and 6.7, it is necessary to consider the stress amplification effect on the pole caused by conductor vibration. Based on the parameters considered in this study, a maximum dynamic amplification factor of 1.17 was observed. This suggests that for similar 10 kV distribution lines, the coupling effect is significant. It is recommended that designers consider an amplification factor of this magnitude as a reference for seismic safety checks rather than a universal mandate.
(4) This study is primarily based on numerical simulations verified against literature data. Future work will consider conducting shaking table tests to further validate the specific failure modes observed. Additionally, the coupling effects of concurrent wind and earthquake loads will be investigated to provide a more comprehensive multi-hazard assessment.

Author Contributions

Conceptualization, Y.Y., K.W. and G.Z.; methodology, Y.Y., K.W. and C.X.; software, X.L. and G.Z.; validation, J.H., T.M. and G.Z.; formal analysis, Y.Y., J.H. and C.X.; investigation, K.W., J.H., T.M. and X.L.; resources, G.Z.; data curation, Y.Y., T.M. and G.Z.; writing—original draft preparation, Y.Y., K.W., J.H., T.M. and C.X.; writing—review and editing, K.W., X.L. and G.Z. All authors have read and agreed to the published version of the manuscript.

Funding

This work was sponsored by the National Key R&D Program of China (Grant no. 2024YFC3015100) and the Science and Technology Project of the China Southern Power Grid (Grant no. YNKJXM20250086).

Institutional Review Board Statement

Not applicable.

Informed Consent Statement

Not applicable.

Data Availability Statement

Data are contained within this article.

Conflicts of Interest

Author Yijun Yan, Ke Wang, Jiang He, Teng Ma and Xiulan Li were employed by the company Yunnan Power Grid Company Ltd. The remaining authors declare that the research was conducted in the absence of any commercial or financial relationships that could be construed as a potential conflict of interest.

References

  1. Liu, H. Earthquake Damage in Tangshan Earthquake; Seismological Press: Beijing, China, 1986. (In Chinese) [Google Scholar]
  2. Zhou, G.; Tan, W.; Shi, W. Study on earthquake damage loss of lifeline engineering and hydraulic structures in Yunnan. J. Catastrophology 2005, 20, 90–95. (In Chinese) [Google Scholar]
  3. Zhang, D.; Zhao, W.; Liu, M. Analysis of seismic damage of electric power facilities in Wenchuan earthquake and its causes. J. Nanjing Univ. Technol. 2009, 31, 44–48. (In Chinese) [Google Scholar]
  4. You, H.; Zhao, F. Analysis of damage causes of electric power facilities in Lushan M7.0 earthquake. Electr. Power Constr. 2013, 34, 100–104. (In Chinese) [Google Scholar]
  5. Zekavati, A.; Jafari, M.A.; Rahnavard, A.; Yavartalab, A.; Samadi, M. Development of seismic capacity curve (S.C.C.) for power distribution concrete poles. In Proceedings of the International Conference on Electricity Distribution, Stockholm, Sweden, 10–13 June 2013. [Google Scholar]
  6. Baghmisheh, A.G.; Mahsuli, S. Seismic performance and fragility analysis of power distribution concrete poles. Soil Dyn. Earthq. Eng. 2021, 150, 106912. [Google Scholar] [CrossRef]
  7. Zeynalian, M.; Khorasgani, A.N.; Ronagh, M. Structural performance of concrete poles used in electric power distribution network. Arch. Civ. Mech. Eng. 2018, 18, 863–876. [Google Scholar] [CrossRef]
  8. Ghasemi, M.; Zhang, C.; Khorshidi, H.; Zhu, L.; Hsiao, P.C. Seismic upgrading of existing RC frames with displacement-restraint cable bracing. Eng. Struct. 2023, 282, 115764. [Google Scholar] [CrossRef]
  9. Zhang, X.; Phan, V.T.; Saiidi, M.S. Development and experimental verification of damage controllable precast concrete beam-column joints with low-bond high-strength reinforcement. Eng. Struct. 2022, 252, 113598. [Google Scholar]
  10. Teoh, Y.C.; Padgett, J.E.; DesRoches, R. Probabilistic assessment of distribution infrastructure performance under extreme wind hazards. J. Infrastruct. Syst. 2019, 25, 04019001. [Google Scholar]
  11. Darestani, M.Y.; Nasserian, M.; Ronagh, M. Parametric fragility models for transmission towers under combined earthquake and wind loading. Eng. Struct. 2022, 266, 114562. [Google Scholar]
  12. Stephens, M.; Koliou, M.; van de Lindt, J.W. Experimental assessment of power poles under combined earthquake and tsunami loading. Earthq. Spectra 2023, 39, 234–253. [Google Scholar]
  13. Chen, S.E.; Dai, K. Modal characteristics of two operating power transmission poles. Mech. Syst. Signal Process. 2010, 52, 559–577. [Google Scholar] [CrossRef]
  14. Li, H.N.; Shi, W.L.; Wang, G.X.; Jia, L.G. Simplified models and experimental verification for coupled transmission tower-line system. J. Sound Vib. 2005, 286, 569–585. [Google Scholar] [CrossRef]
  15. Tian, L.; Gai, X.; Qu, B. Shaking table tests on seismic response of transmission tower-line system subjected to near-fault ground motions. J. Constr. Steel Res. 2020, 168, 105996. [Google Scholar]
  16. GB 50260-2013; Code for Seismic Design of Electrical Installations. China Planning Press: Beijing, China, 2013. (In Chinese)
  17. DL/T 5220-2021; Code for Design of 10kV and Below Overhead Distribution Lines. China Electric Power Press: Beijing, China, 2021. (In Chinese)
  18. ASCE Task Committee on Electrical Transmission Line Structural Loading. Guidelines for Electrical Transmission Line Structural Loading (ASCE Manual No. 74), 4th ed.; American Society of Civil Engineers: Reston, VA, USA, 2020. [Google Scholar]
  19. GB/T 4623-2014; Circular Concrete Poles. Standards Press of China: Beijing, China, 2014. (In Chinese)
  20. GB 50010-2010; Code for Design of Concrete Structures. China Architecture & Building Press: Beijing, China, 2010. (In Chinese)
  21. Hou, J.; Chen, J.; Lei, J. Analysis of influence of conductors and ground wires on dynamic characteristics of transmission towers. Water Resour. Power 2012, 30, 199–201. (In Chinese) [Google Scholar]
  22. Fang, Y.; Dai, W.; Pang, E. Mechanical property testing and finite element analysis of tapered reinforced concrete poles. J. Hohai Univ. (Nat. Sci.) 2011, 39, 687–692. (In Chinese) [Google Scholar]
  23. Zhang, L. Study on Stochastic Wind Field and Wind-Resistant Reliability Analysis of High-Rise Structures. Ph.D. Thesis, Tongji University, Shanghai, China, 2006. (In Chinese) [Google Scholar]
  24. Guo, H. Study on Wind-Induced Response of Lattice Transmission Towers and Tower-Line Systems. Ph.D. Thesis, Dalian University of Technology, Dalian, China, 2010. (In Chinese) [Google Scholar]
  25. Duan, K. Wind-Induced Response Analysis of High-Voltage Transmission Tower-Line Systems under Downbursts. Master’s Thesis, Zhengzhou University, Zhengzhou, China, 2021. (In Chinese) [Google Scholar]
  26. GB 50011-2010; Code for Seismic Design of Buildings. China Architecture & Building Press: Beijing, China, 2016. (In Chinese)
Figure 1. Actual damage diagram of concrete poles after the earthquake.
Buildings 16 00618 g001
Figure 2. Finite element model of the reinforced concrete pole.
Buildings 16 00618 g002
Figure 3. Schematic diagram of the finite element model of the three-pole two-line system.
Buildings 16 00618 g003
Figure 4. The C50 + 12 m reinforced concrete pole’s first five-order modal vibration mode diagrams.
Buildings 16 00618 g004aBuildings 16 00618 g004b
Figure 5. The C50 + 12 m + 60 m partial mode shapes of the pole–conductor system.
Buildings 16 00618 g005
Figure 6. X-direction acceleration–time–history diagrams of seismic waves.
Buildings 16 00618 g006
Figure 7. Diagram of the seismic wave spectrum.
Buildings 16 00618 g007
Figure 8. Comparison of seismic wave acceleration response spectra.
Buildings 16 00618 g008
Figure 9. Peak displacements along the pole height for a single pole and the pole–conductor system.
Buildings 16 00618 g009
Figure 10. Peak stresses along the pole height fora single pole and the pole–conductor system.
Buildings 16 00618 g010
Figure 11. The 12 m + 60 m comparison of X-direction displacement time histories at the top of the pole–conductor system and a single pole.
Buildings 16 00618 g011
Figure 12. The 12 m + 60 m comparison of stress time histories between the pole–wire system and a single pole.
Buildings 16 00618 g012
Figure 13. The 12 m + 80 m comparison of X-direction displacement time–history diagrams at the top of the rod-line system and a single rod.
Buildings 16 00618 g013
Figure 14. The 12 m + 80 m comparison of stress time–history diagrams between the rod-line system and a single rod.
Buildings 16 00618 g014
Figure 15. The 12 m + 100 m comparison of X-direction displacement time–history diagrams at the top of the rod-line system and a single rod.
Buildings 16 00618 g015
Figure 16. The 12 m + 100 m stress comparison time–history diagram of the pole–line system and a single pole.
Buildings 16 00618 g016
Figure 17. Variations in peak displacement along the pole height for a single pole and pole–conductor systems.
Buildings 16 00618 g017
Figure 18. Peak stress variations along the pole height for a single pole and pole–conductor systems.
Buildings 16 00618 g018
Figure 19. The 15 m + 60 m comparison of X-direction displacement time histories between the pole–line system and a single pole.
Buildings 16 00618 g019
Figure 20. The 15 m + 60 m comparison of stress time histories between the pole–line system and a single pole.
Buildings 16 00618 g020
Figure 21. The 15 m + 80 m comparison of X-direction displacement time–history diagrams at the top of the rod-line system and a single rod.
Buildings 16 00618 g021
Figure 22. Comparison of the stress time–history diagrams between the rod-line system and a single rod at depths of 15 m + 80 m.
Buildings 16 00618 g022
Figure 23. The 15 m + 100 m comparison of X-direction displacement time–history diagrams at the top of the rod-line system and a single rod.
Buildings 16 00618 g023
Figure 24. The 15 m + 100 m stress comparison time–history diagram of the pole–line system and a single pole.
Buildings 16 00618 g024
Table 1. Natural frequencies and mode shapes of the reinforced concrete pole.
Mode OrderMode Shape DescriptionNatural Frequency of 12 m Pole (Hz)Natural Frequency of 15 m Pole (Hz)
1X-axis bending vibration1.80121.0949
2Y-axis bending vibration1.80271.2165
3Torsion around Z-axis in X-direction9.27565.6120
4Torsion around Z-axis in Y-direction9.35125.9610
5Torsion in XY-plane around Z-axis19.32914.731
Table 2. The C50 + 12 m + 60 m comparison of natural vibration frequencies of poles in the pole–line system and single poles.
ModePole in Pole–Line System
Natural Frequency (Hz) (a)
Single Pole Natural
Frequency (Hz) (b)
Relative Difference (%)
((a) − (b))/(b) × 100
Description of Vibration Modes for Poles in the Pole–Line System
11.61491.8012−10.34X-direction Bending Vibration
25.46249.3512−41.59Y-direction Torsional Vibration
37.59309.2756−18.14X-direction Torsional Vibration
Table 3. Basic parameters of the selected seismic waves in this study.
Seismic WaveDirectionPeak Acceleration (cm/s2)Duration (s)Time Interval (s)
EL WaveEast-West (Y-direction)210.10200.02
North-South (X-direction)341.70200.02
Vertical (Z-direction)190.40200.02
Taft WaveEast-West (Y-direction)175.90200.02
North-South (X-direction)152.70200.02
Vertical (Z-direction)102.90200.02
RH1 WaveEast-West (Y-direction)100200.02
North-South (X-direction)100200.02
Vertical (Z-direction)100200.02
Table 4. Dynamic response results of the reinforced concrete pole under seismic action.
Seismic WaveConcrete Strength Grade12 m15 m
1–7
(mm)
1–1
(MPa)
2–9
(mm)
2–1
(MPa)
EL waveC5022.561.857036.871.7530
Taft waveC5012.850.879937.961.7869
RH1 waveC5014.230.975423.781.1817
Table 5. C50 + 12 m peak dynamic responses of the pole–line system under different spans.
Seismic WaveConductor Span 60 mConductor Span 80 mConductor Span 100 m
1–7
(mm)
1–1
(MPa)
1–7
(mm)
1–1
(MPa)
1–7
(mm)
1–1
(MPa)
EL wave22.121.588923.741.651222.291.6214
Taft wave11.910.819620.741.539812.660.8970
RH1 wave14.541.021018.081.146214.471.1303
Table 6. The C50 + 12 m comparison of the dynamic response results between the single pole and pole–line Systems.
Structure TypeConductor Span 60 mConductor Span 80 mConductor Span 100 m
1–7
(mm)
1–1
(MPa)
1–7
(mm)
1–1
(MPa)
1–7
(mm)
1–1
(MPa)
Single Pole ( S 0 )16.551.237516.551.237516.551.2375
Pole–Line System ( S i )16.191.143220.851.445716.471.2162
Dynamic Coefficient η s 0.980.921.261.170.990.98
Table 7. The C50 + 15 m peak dynamic response values of the pole–line system under different spans.
Seismic WaveConductor Span 60 mConductor Span 80 mConductor Span 100 m
2–9
(mm)
2–1
(MPa)
2–9
(mm)
2–1
(MPa)
2–9
(mm)
2–1
(MPa)
EL wave34.511.626139.571.858940.791.8603
Taft wave35.531.685640.941.818442.661.8596
RH1 wave23.491.121524.671.301531.041.3551
Table 8. The C50 + 15 m comparison of the dynamic response results between the single pole and pole–wire systems.
Structural TypeConductor Span 60 mConductor Span 80 mConductor Span 100 m
2–9
(mm)
2–1
(MPa)
2–9
(mm)
2–1
(MPa)
2–9
(mm)
2–1
(MPa)
Single rod ( S 0 )32.871.573932.871.573932.871.5739
rod-line system ( S i )31.181.477735.061.659638.161.6917
dynamic coefficient η s 0.950.941.071.051.161.07
Disclaimer/Publisher’s Note: The statements, opinions and data contained in all publications are solely those of the individual author(s) and contributor(s) and not of MDPI and/or the editor(s). MDPI and/or the editor(s) disclaim responsibility for any injury to people or property resulting from any ideas, methods, instructions or products referred to in the content.