Article

Flash Flood Risk Analysis for Sustainable Heritage: Vulnerability Configurations and Disaster Resilience Strategies of Huizhou Covered Bridges


1
Department of Architecture, Hefei University of Technology, Hefei 230002, China
2
Key Laboratory of Huizhou Architecture in Anhui Province, Hefei 230000, China
*
Author to whom correspondence should be addressed.
Buildings 2026, 16(3), 616; https://doi.org/10.3390/buildings16030616
Submission received: 20 December 2025 / Revised: 20 January 2026 / Accepted: 26 January 2026 / Published: 2 February 2026

Abstract

Huizhou covered bridges represent a unique and irreplaceable component of China′s architectural heritage, yet they are increasingly threatened by flash floods. In the Huizhou region, complex mountainous terrain, concentrated intense rainfall, and structural aging jointly exacerbate flood damage risks. Existing flood risk assessment approaches often prioritize external hydrodynamic hazards or assume linear additive effects, overlooking the complex interactions among inherent structural and physical attributes. To address this limitation, this study integrates Random Forest (RF) and fuzzy-set Qualitative Comparative Analysis (fsQCA) to develop a flood risk assessment framework capable of capturing both nonlinear relationships and configurational (asymmetric) causal mechanisms. Based on field investigations of 89 covered bridges and 116 documented damage cases from 2020 to 2024, the RF model identifies six key risk factors (ACC = 0.79, AUC = 0.87), several of which exhibit pronounced nonlinear and threshold effects. Building on these results, fsQCA further reveals eight equivalent configurational pathways leading to covered bridge damage (solution coverage = 0.66, solution consistency = 0.94), highlighting multiple causal combinations rather than a single dominant driver. The results demonstrate that the disaster resilience of covered bridges emerges from interactions among structural characteristics, management conditions, and spatial scale attributes, rather than from any individual factor alone. Accordingly, this study advocates a shift in protection strategies from conventional “one-size-fits-all” structural reinforcement toward risk-pattern-oriented, precision-based non-structural interventions. By combining predictive modeling with configurational causal analysis, this research provides a system-level understanding of flood-induced damage mechanisms and offers actionable insights for flood risk mitigation and sustainable conservation of covered bridge heritage in Huizhou and comparable regions worldwide.

1. Introduction

In recent decades, global warming has intensified extreme weather events, resulting in more frequent and severe flash floods worldwide [1]. Characterized by sudden onset and strong destructive power, flash floods in mountainous regions are often accompanied by landslides, causing severe damage to bridges, critical infrastructure, and loss of life [2,3]. Such events are projected to increase further under future climate change scenarios [4]. In China, historic covered bridges—traditional bridges with roofed corridors—are typically located over surface waterways in mountainous areas, making them highly vulnerable to flash flood impacts. Aging structures further exacerbate their susceptibility to damage. Recognizing these threats, the National Cultural Heritage Administration of China has launched a dedicated protection initiative for covered bridges (2023–2025) [5].
The complex dynamic processes involved in flash floods have led to incomplete understanding of their associated damage mechanisms, particularly in quantifying structural damage to buildings [6]. The Pressure–State–Response (PSR) model provides a useful conceptual framework by linking external hazards, structural conditions, and mitigation responses [7]. When applied to covered bridges, Pressure (P) represents external hydrodynamic forces such as rainfall, terrain, flow velocity, and debris [8]. State (S) reflects the bridge’s physical condition, shaped by pressure stimuli and encompassing two core dimensions: vulnerability and exposure. These include factors like structural type, location, and maintenance condition [9]. Response (R) denotes the responses—namely measures and policies aimed at mitigating the identified flood damage to covered bridges. Because external pressures are inherent regional characteristics that are difficult to alter quickly, previous studies indicate minimal impact on flood resilience. In contrast, internal physical health status plays a significant role [10]. Accordingly, Zheng et al. emphasized that flood risk assessment should place greater weight on vulnerability and exposure, rather than relying solely on external hydrodynamic indicators [11].
The exposure and physical vulnerability of buildings have been identified as contributing factors in structural damage [12]. Exposure refers to the degree to which a bridge is vulnerable to flash flood threats due to its geographical location, layout, and environmental relationships, indicating the extent to which the building structure is exposed to flood forces. Previous studies have shown that factors such as building location, ground elevation, maximum flood depth, architectural openings, building height and susceptibility of shallow foundations to scour significantly influence exposure and flood damage severity [9,13,14,15,16]. Physical vulnerability describes a structure’s inherent susceptibility to damage during flash floods, measuring its ability to withstand destruction and maintain functionality under flood conditions. Structural performance, material properties, building scale, age, and usage type have all been identified as important determinants of physical vulnerability [17,18,19]. In the PSR framework, exposure and physical vulnerability jointly constitute the core of the State (S). Exposure describes the intensity of flash flood impact on covered bridges, whereas physical vulnerability reflects the degree of damage response of the bridges under such impacts.
The assessment of flood-induced structural damage in buildings can be broadly categorized into three approaches. The first method involves simulating the interaction between water flow and building structures, though this approach often relies on simplified assumptions that may introduce uncertainty into results. The second method examines historical flood events to hypothesize that future damage patterns will resemble past occurrences, using statistical analysis to identify destructive mechanisms. The third method establishes an indicator system that identifies and quantifies various disaster-causing factors, typically incorporating expert scoring, Analytic Hierarchy Process (AHP), and entropy weighting to determine their relative importance [20]. However, expert scoring and AHP heavily depend on decision-makers’ subjective experience, where differing evaluation criteria may lead to significant subjectivity and variability across studies [21]. While entropy weighting reduces human bias to some extent, its effectiveness is highly sensitive to the distribution of raw data, resulting in limited stability.
Compared to conventional indicator-weighting or regression-based approaches, data-driven machine learning methods are well suited for analyzing flood-induced damage characterized by nonlinear responses, limited sample sizes, and complex interactions among multiple risk factors [22]. RF was selected in this study because of its high computational efficiency, short modeling time, and robustness to overfitting when handling heterogeneous variables without strict statistical assumptions. In addition, RF provides variable importance measures, allowing the key factors influencing prediction accuracy to be explicitly identified. Previous studies have demonstrated the effectiveness of RF in flood risk assessment and damage prediction [23,24]. However, flood-induced building damage is rarely driven by a single factor; instead, it often results from multiple interacting conditions, and different combinations of factors may lead to the same outcome [14]. This causal complexity and equifinality cannot be fully captured by RF alone. To address this limitation, fsQCA was introduced as a complementary method. fsQCA identifies sufficient and necessary combinations of conditions, thereby revealing multiple parallel causal pathways underlying bridge damage. The integration of RF and fsQCA thus combines efficient prediction with configuration-based causal interpretation [25,26], making it particularly suitable for uncovering the damage mechanisms of covered bridges under flash flood conditions.
Furthermore, existing studies assessing flood-induced damage to historic buildings remain scarce and often limited [14]. Large-scale vulnerability assessments typically focus on external risk factors—such as flood depth and velocity—as indicators of danger intensity—while neglecting the critical impact of buildings’ inherent physical properties on damage risks [27,28]. Particularly for covered bridges, a special and important type of historic architecture, research remains insufficient. Therefore, further investigation into the physical risks of flash floods on covered bridges is essential.
Despite growing interest in flood-induced damage to buildings, several critical gaps remain in the existing literature, particularly with respect to historic covered bridges:
  • First, most flood damage studies prioritize external hazard indicators (e.g., flood depth, velocity, and duration), while the role of buildings’ internal physical attributes—especially exposure and physical vulnerability—remains underexplored.
  • Second, conventional statistical or indicator-weighting approaches tend to assume linear and additive effects, limiting their ability to capture nonlinear interactions and multiple parallel causal pathways that characterize flood damage processes.
  • Third, research specifically focusing on historic covered bridges is scarce, despite their unique structural systems, heritage constraints, and high vulnerability to flash floods in mountainous regions.
Motivated by these gaps, this study examines how the physical attributes of covered bridges—conceptualized as exposure and physical vulnerability within the PSR framework—jointly contribute to structural damage under flash flood conditions. A hybrid RF–fsQCA analytical framework is employed to integrate predictive modeling with configurational causal analysis, thereby identifying key risk factors and their critical combinations to support targeted, efficient, and rapid-response disaster prevention and conservation strategies for historic covered bridges.
It should be noted that the study area spans extensive remote mountainous regions, where flash floods occur rapidly, making it difficult to accurately obtain external hazard parameters such as flood depth, flow velocity, and duration. Moreover, as these external environmental pressures are unlikely to change in the short term, they are addressed only at the theoretical level and are therefore excluded from the quantitative analysis.

2. Materials and Methods

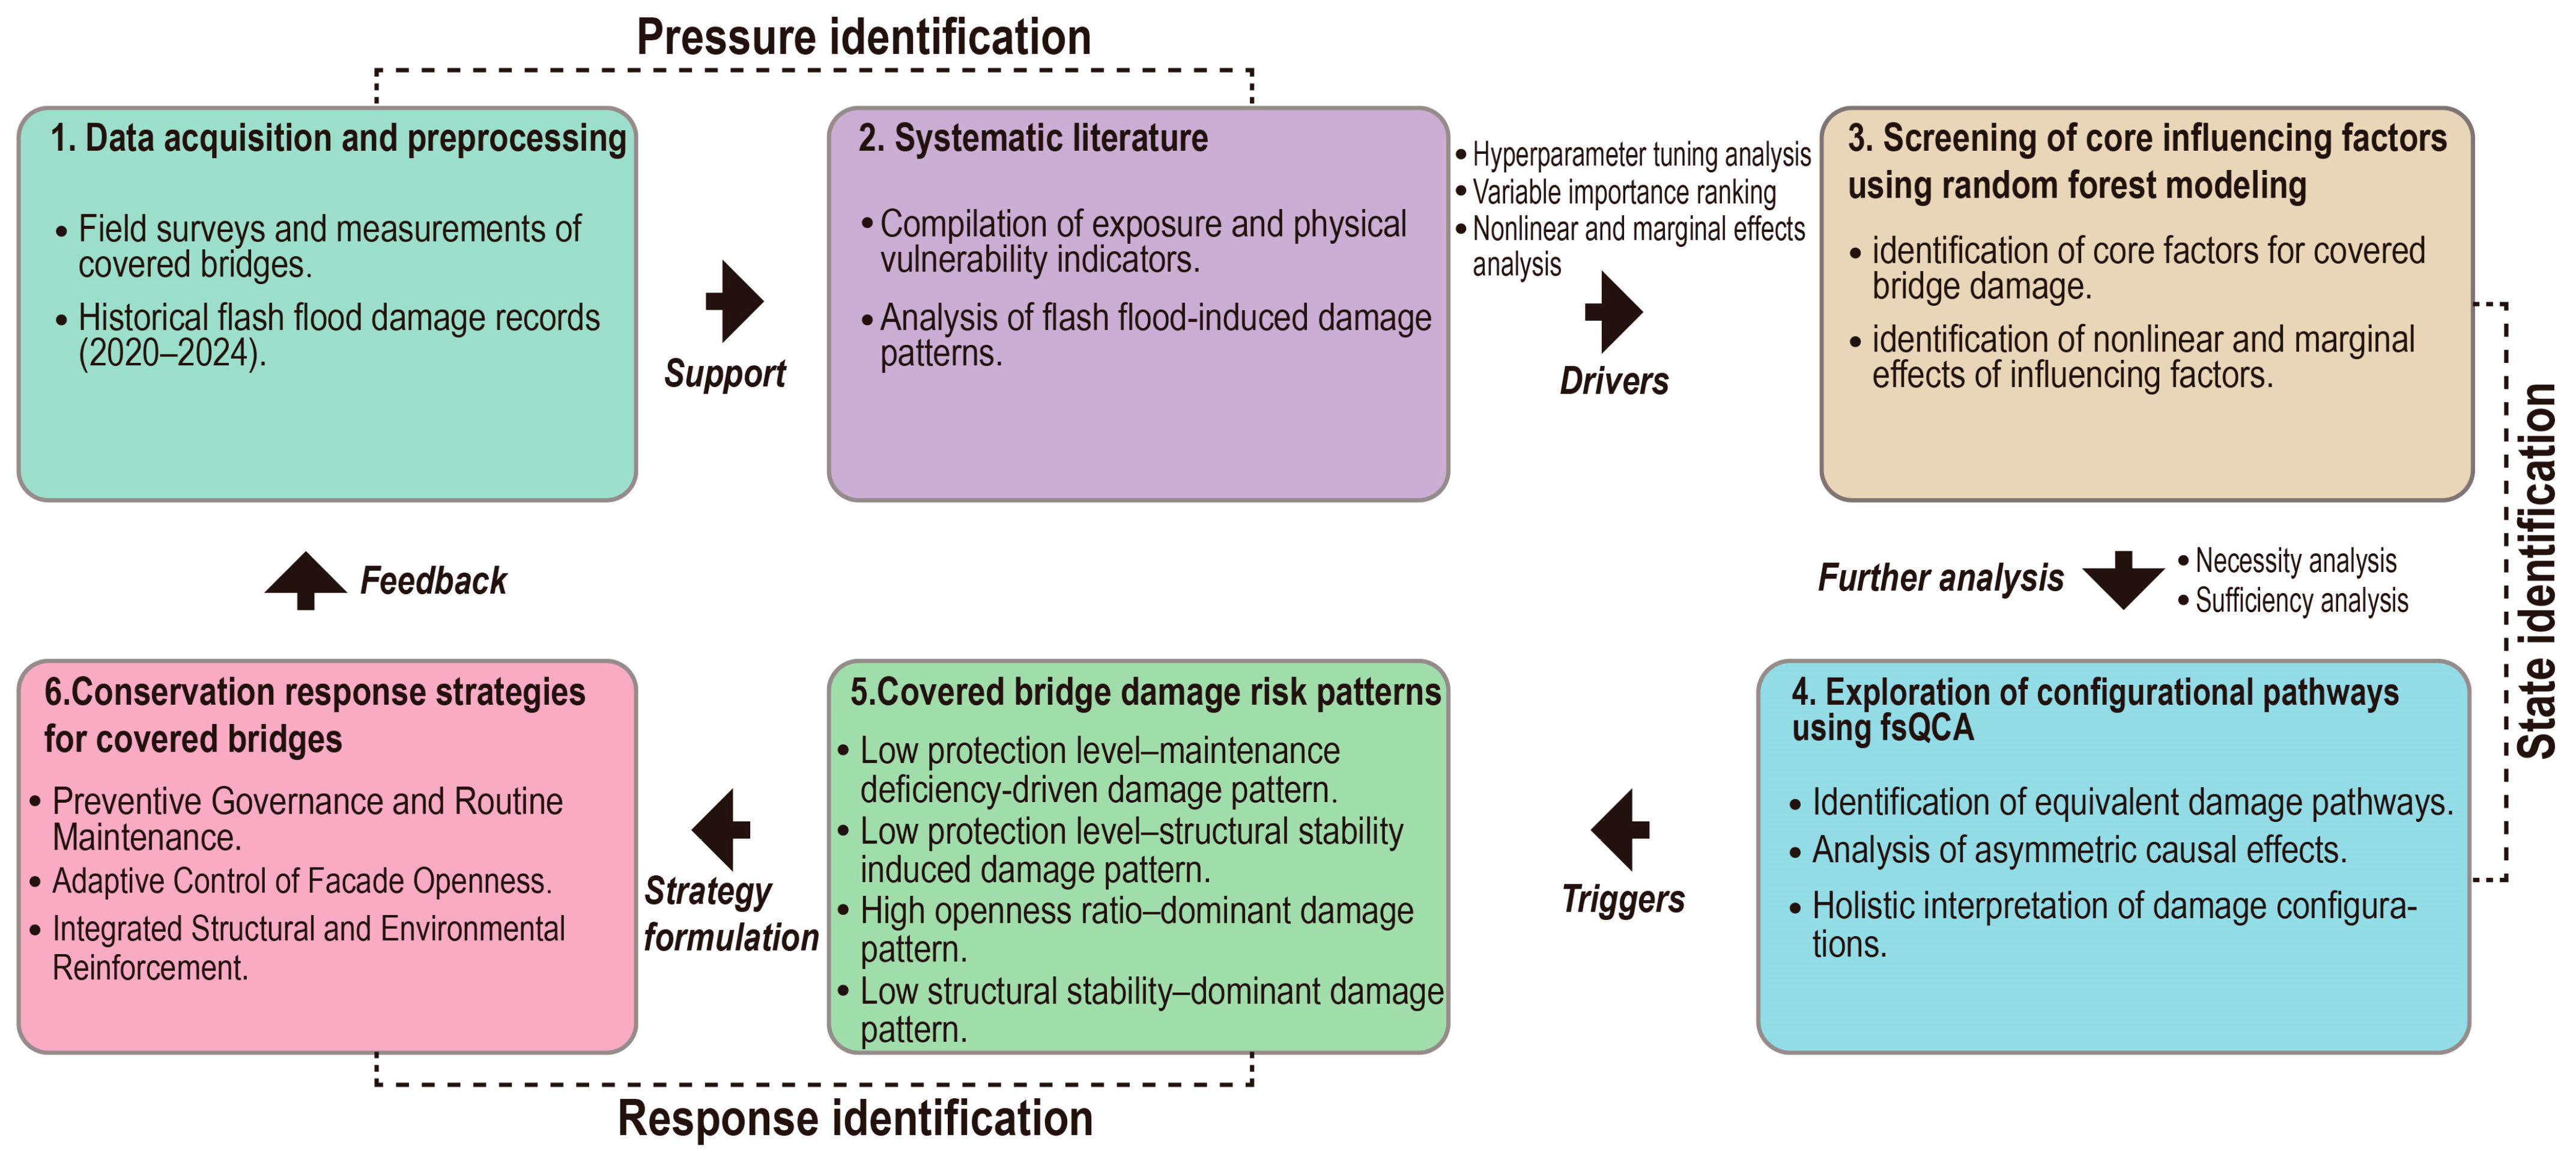
This study provides a method based on the theoretical concept of PSR model, utilizing the RF-fsQCA enhanced mixed method to analyze the flood damage mechanism of China’s Huizhou regional covered bridges, and proposes targeted protection strategies for covered bridge heritage. The research framework mainly includes three related aspects: pressure identification, state identification, and response identification for covered bridges (Figure 1). First, it reviews the methods and risk factors of flood damage to buildings according to field surveys and literature. Second, it uses RF to preliminarily identify important risk factors and nonlinear correlations. Then, fsQCA is employed to further analyze the causal paths of covered bridge damage and the configuration of risk factors. Finally, based on the causal paths, it summarizes the flood damage patterns and proposes targeted protection strategies for covered bridges.

2.1. Study Area

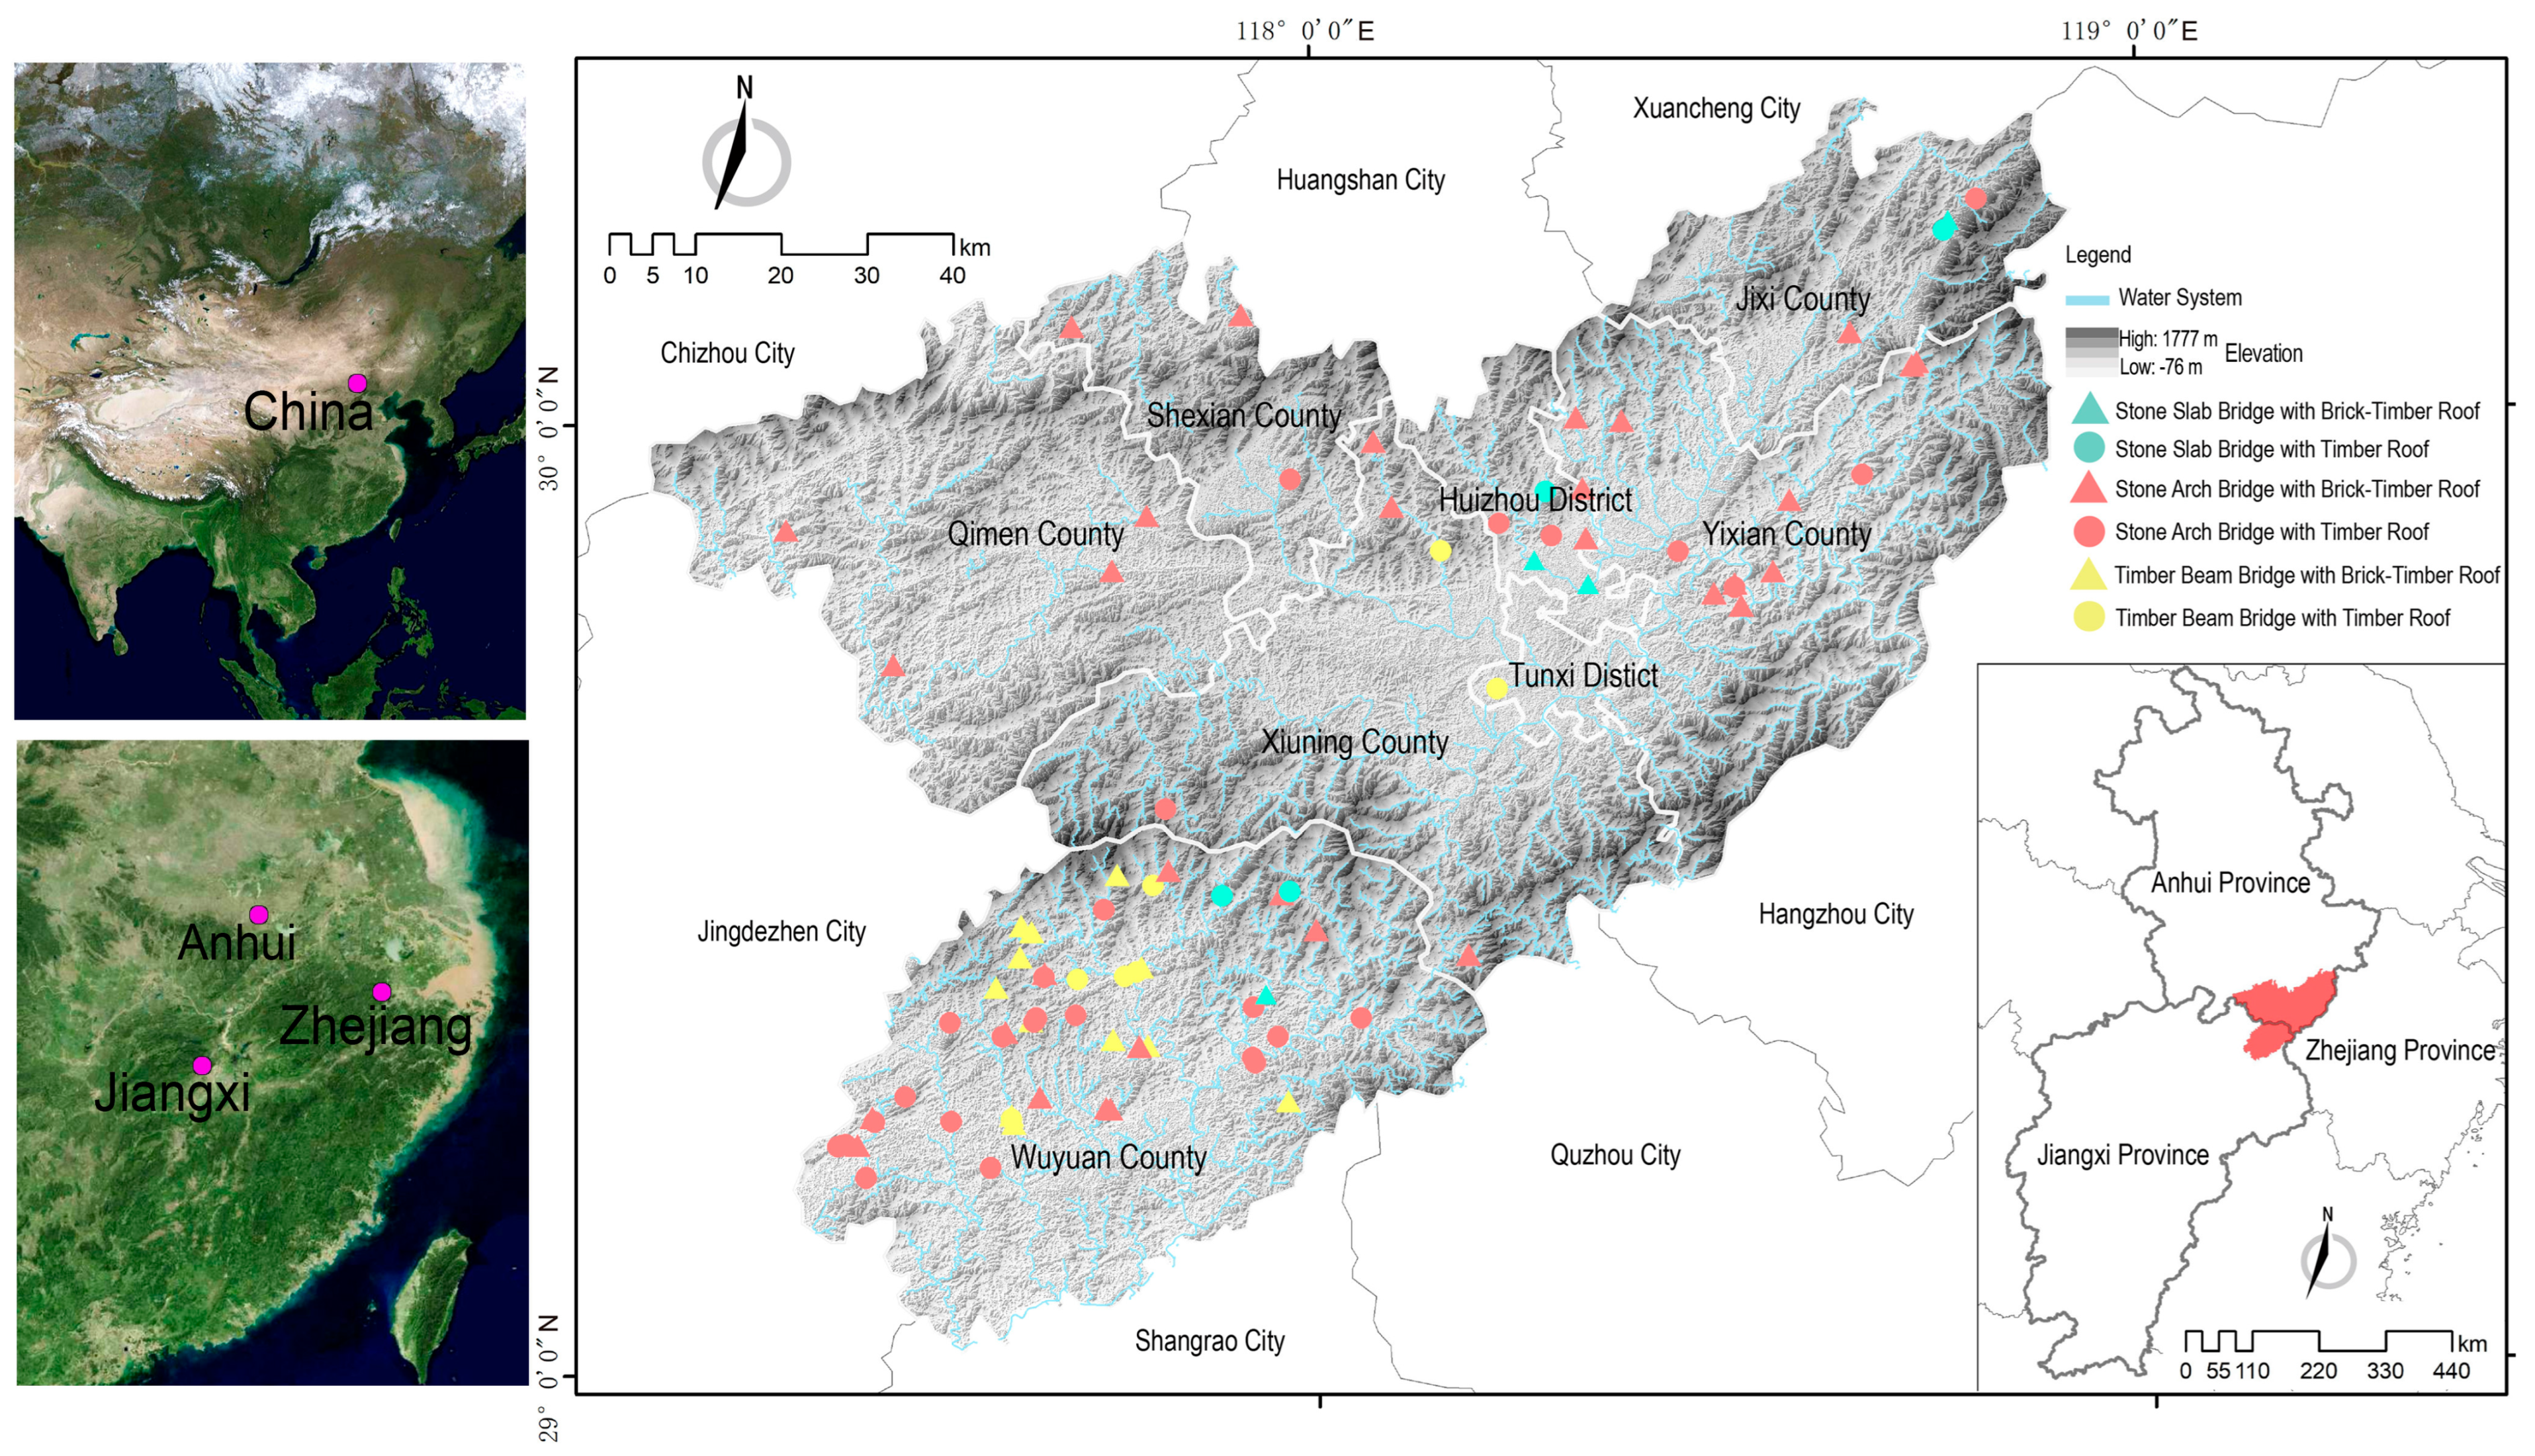
The Huizhou region is located in the mountainous junction area of Anhui, Jiangxi, and Zhejiang provinces in southeastern China. It primarily includes Yixian County, She County, Qimen County, Xiuning County, Huizhou District, and Tunxi District of Huangshan City in Anhui Province; Jixi County of Xuancheng City in Anhui Province; and Wuyuan County of Shangrao City in Jiangxi Province (Figure 2).
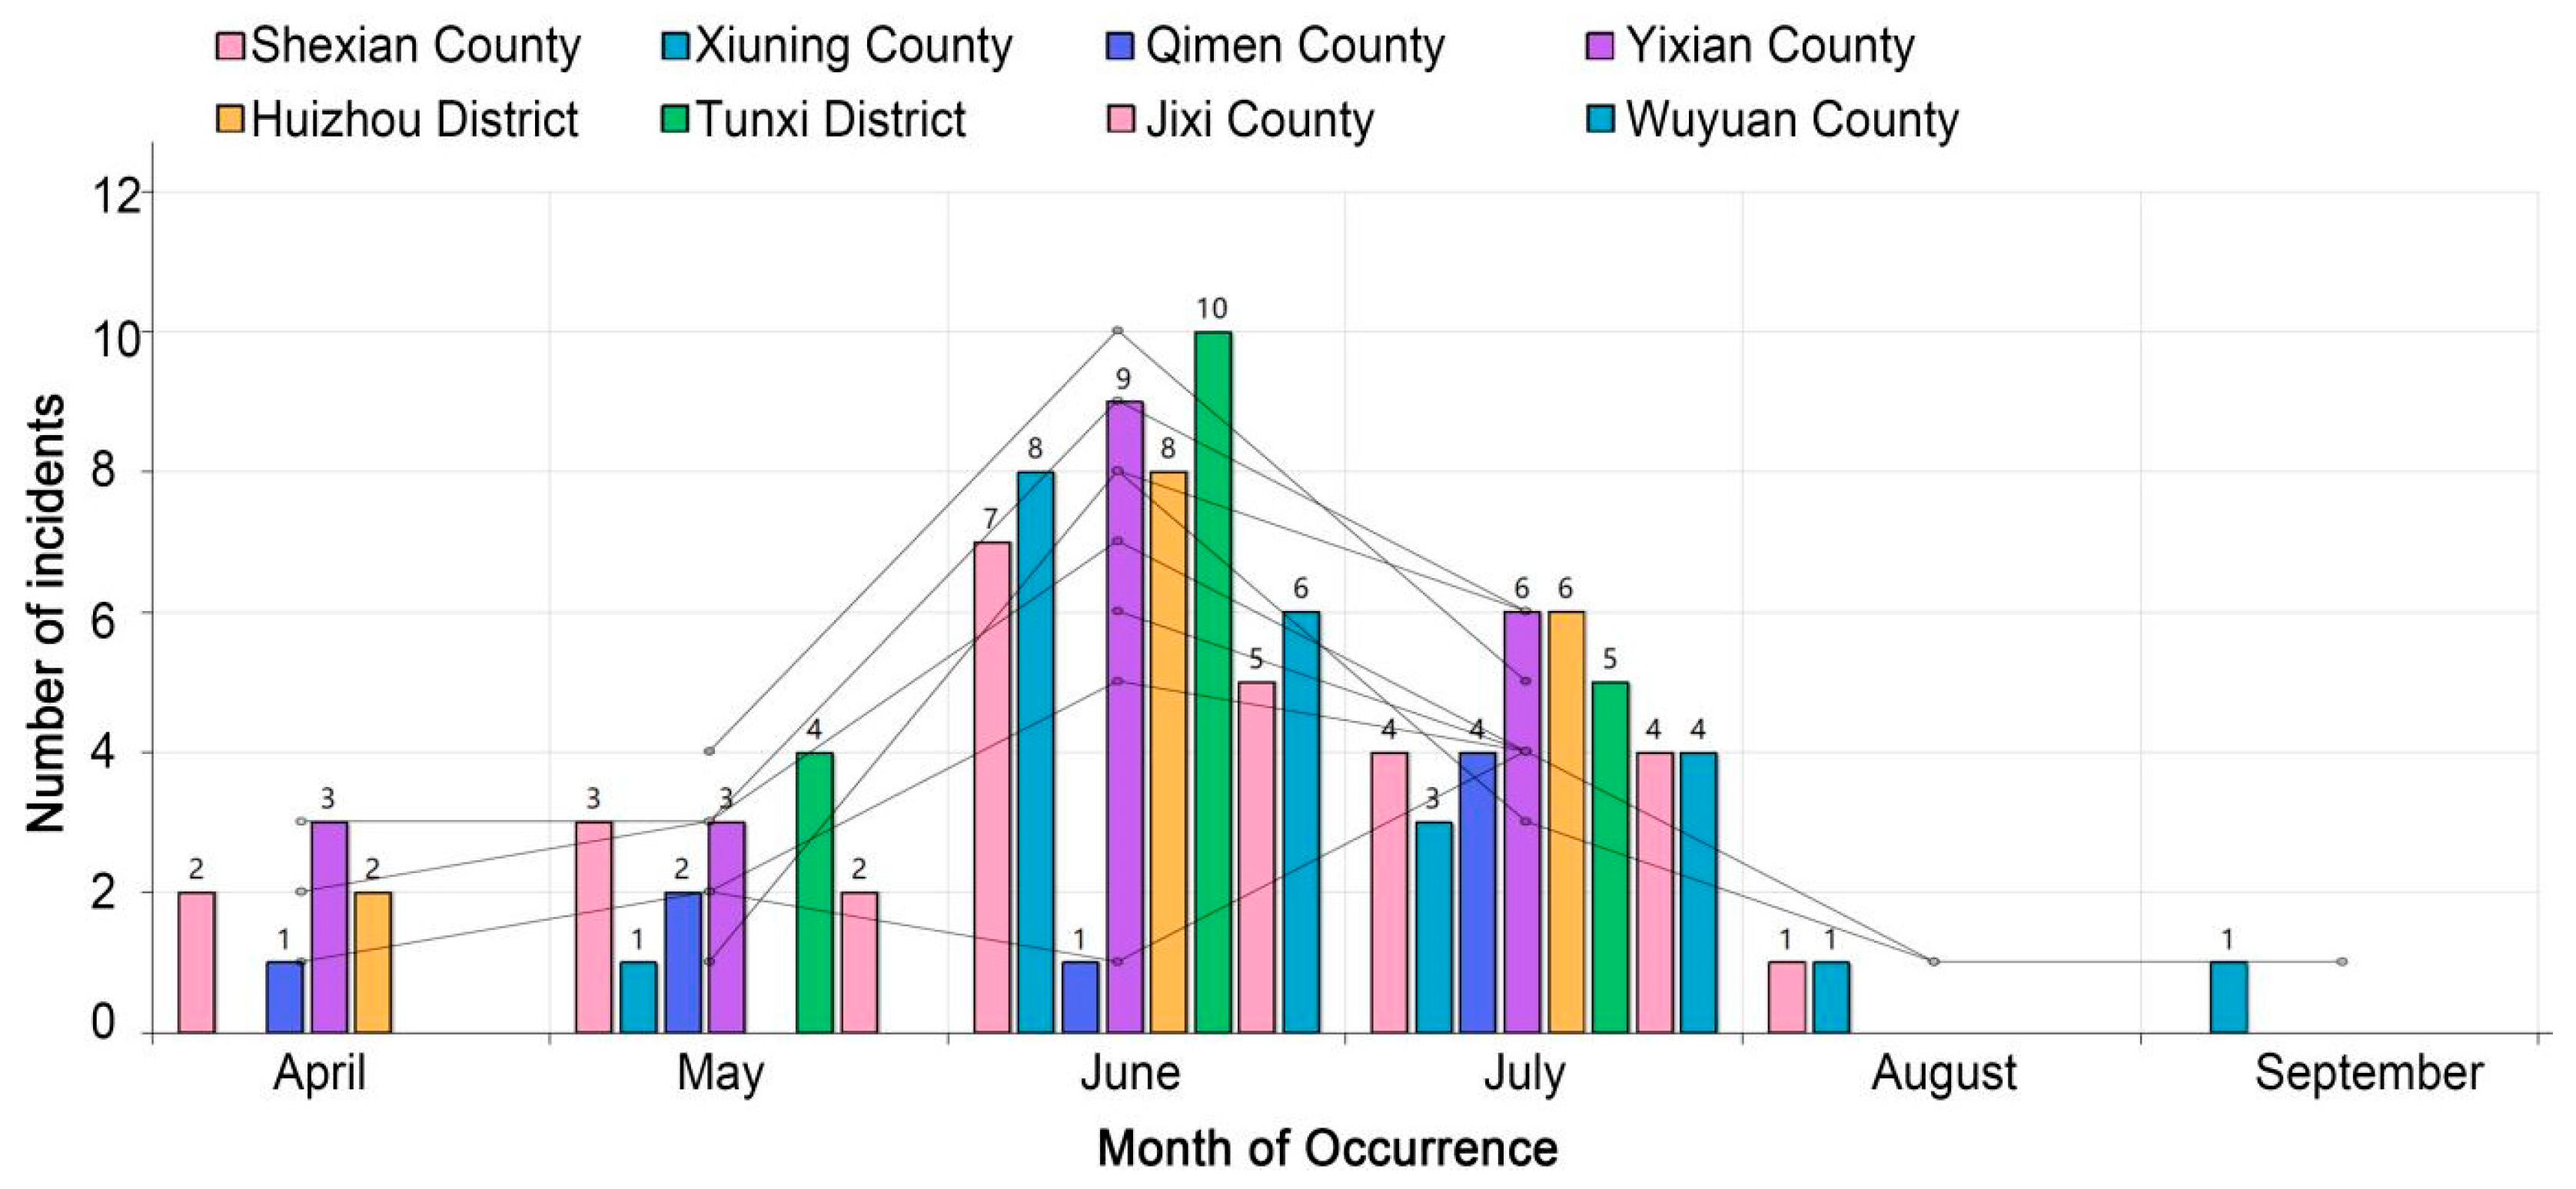
The region is located within the humid subtropical monsoon climate zone of East Asia, characterized by pronounced seasonal variability in precipitation. In early summer, the northward movement of the East Asian summer monsoon brings abundant moisture and persistent heavy rainfall to eastern and southern China [29]. When the rain belt shifts northward to the Yangtze River Basin in mid-June, the Meiyu (plum rain) season begins, resulting in peak precipitation during June and July [30]. Previous studies indicate that monthly rainfall during these months typically exceeds 200 mm [31]. In addition, the mountainous terrain in the Huizhou area further enhances rainfall intensity through orographic uplift, leading to frequent heavy rainstorms and short-duration, high-intensity precipitation events. As a result, flash floods are more likely to occur in these months [32], explaining the high number of flood events observed in June and extending into July in Figure 3.

2.2. Data Collection

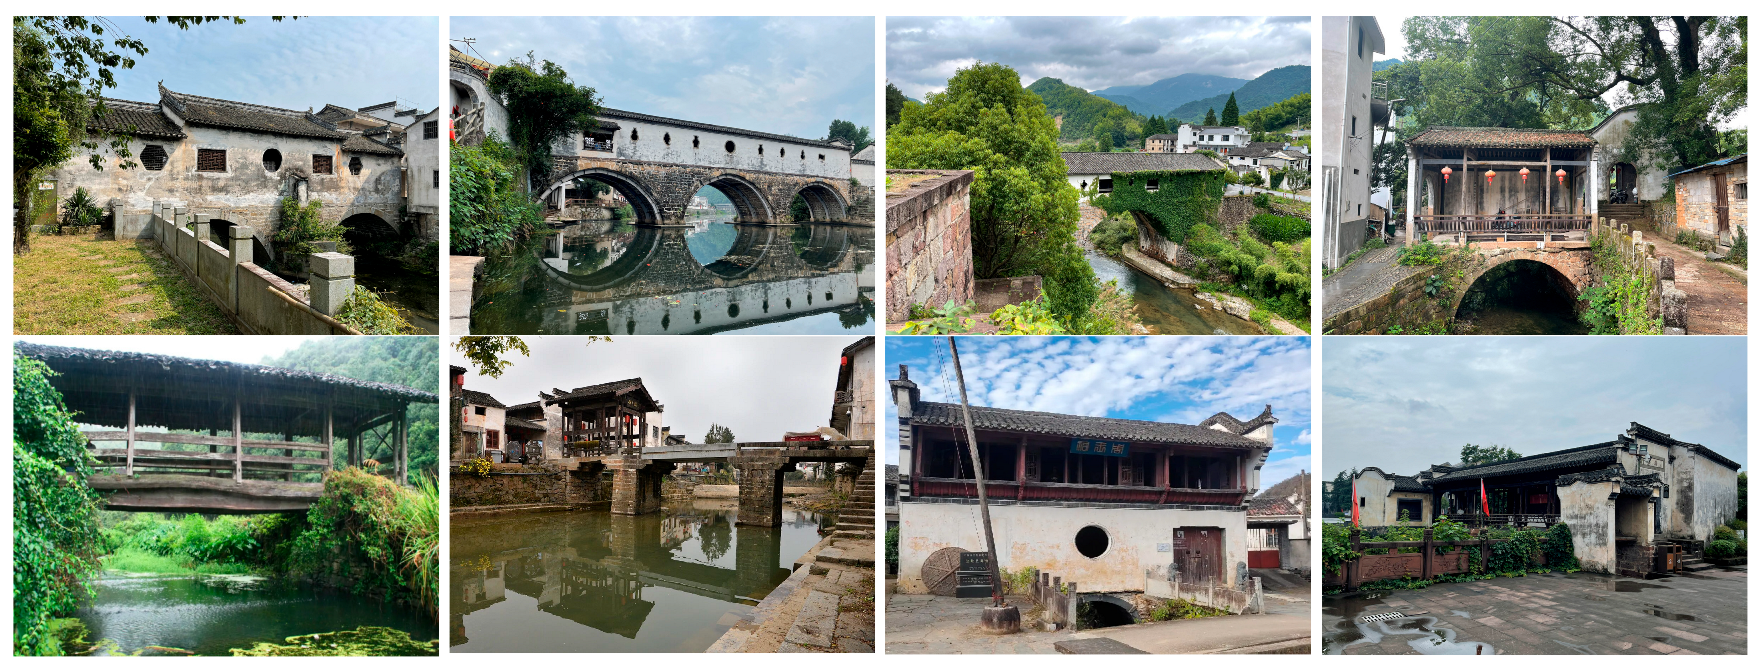
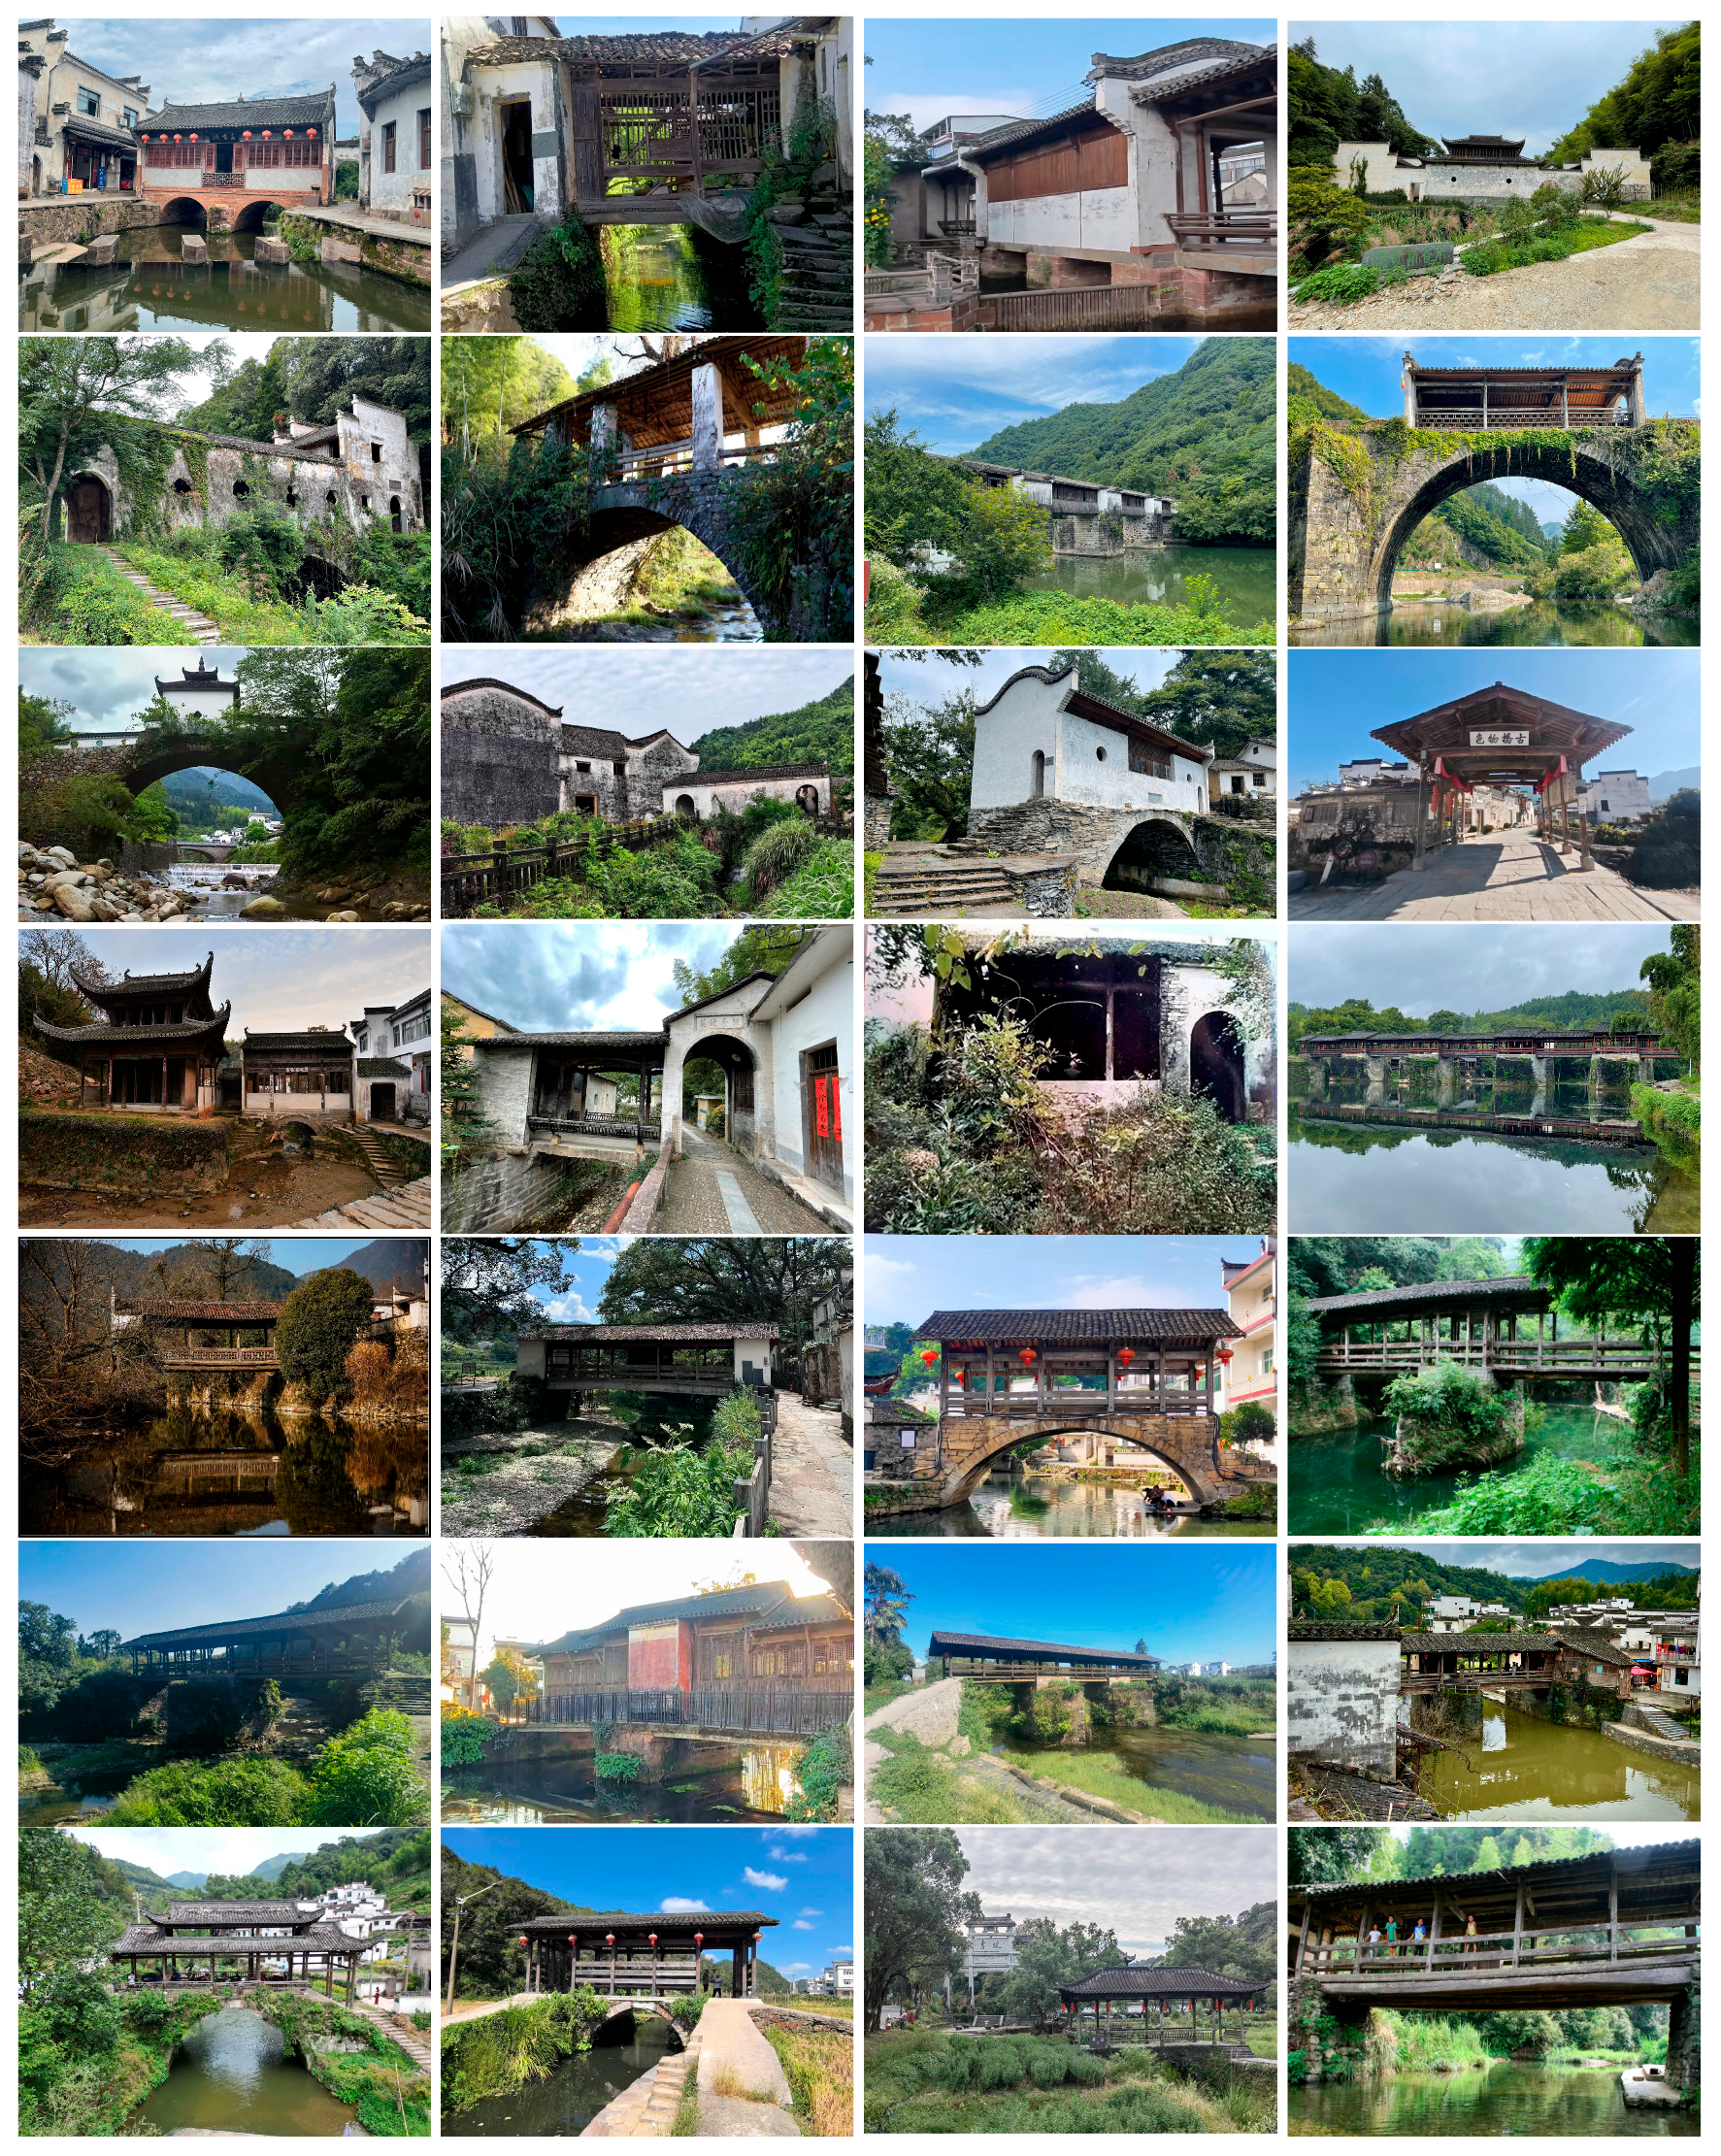
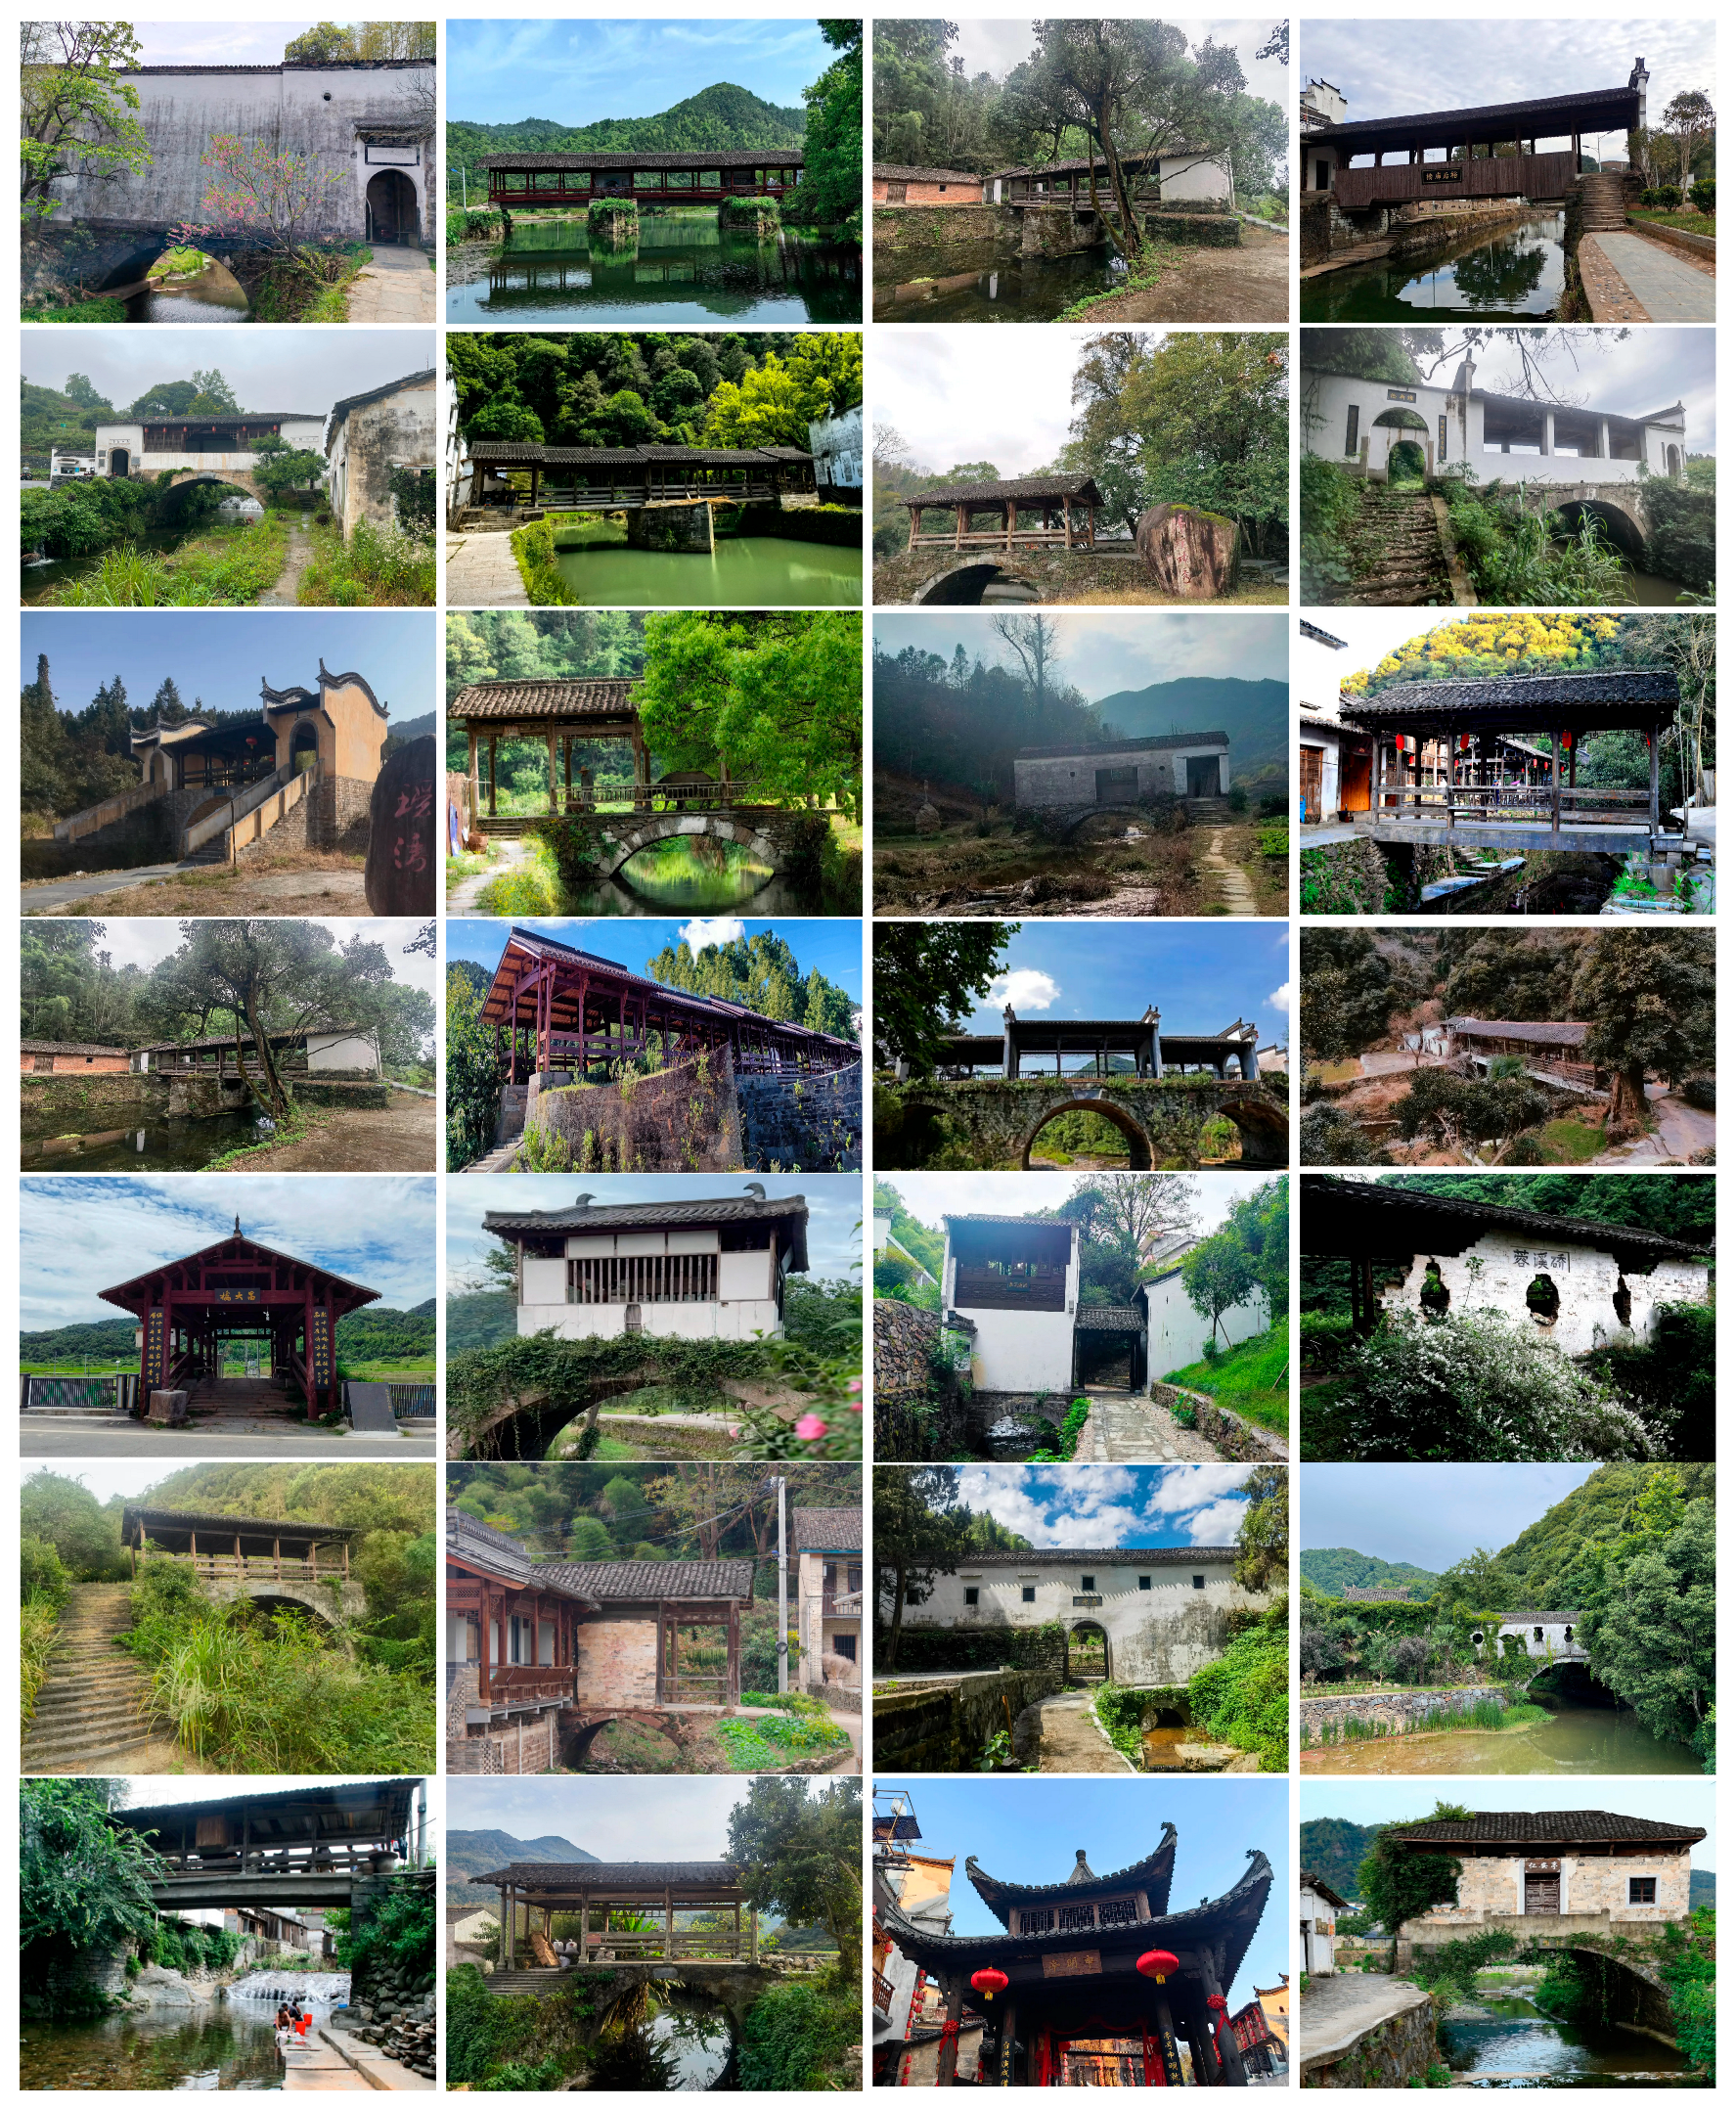
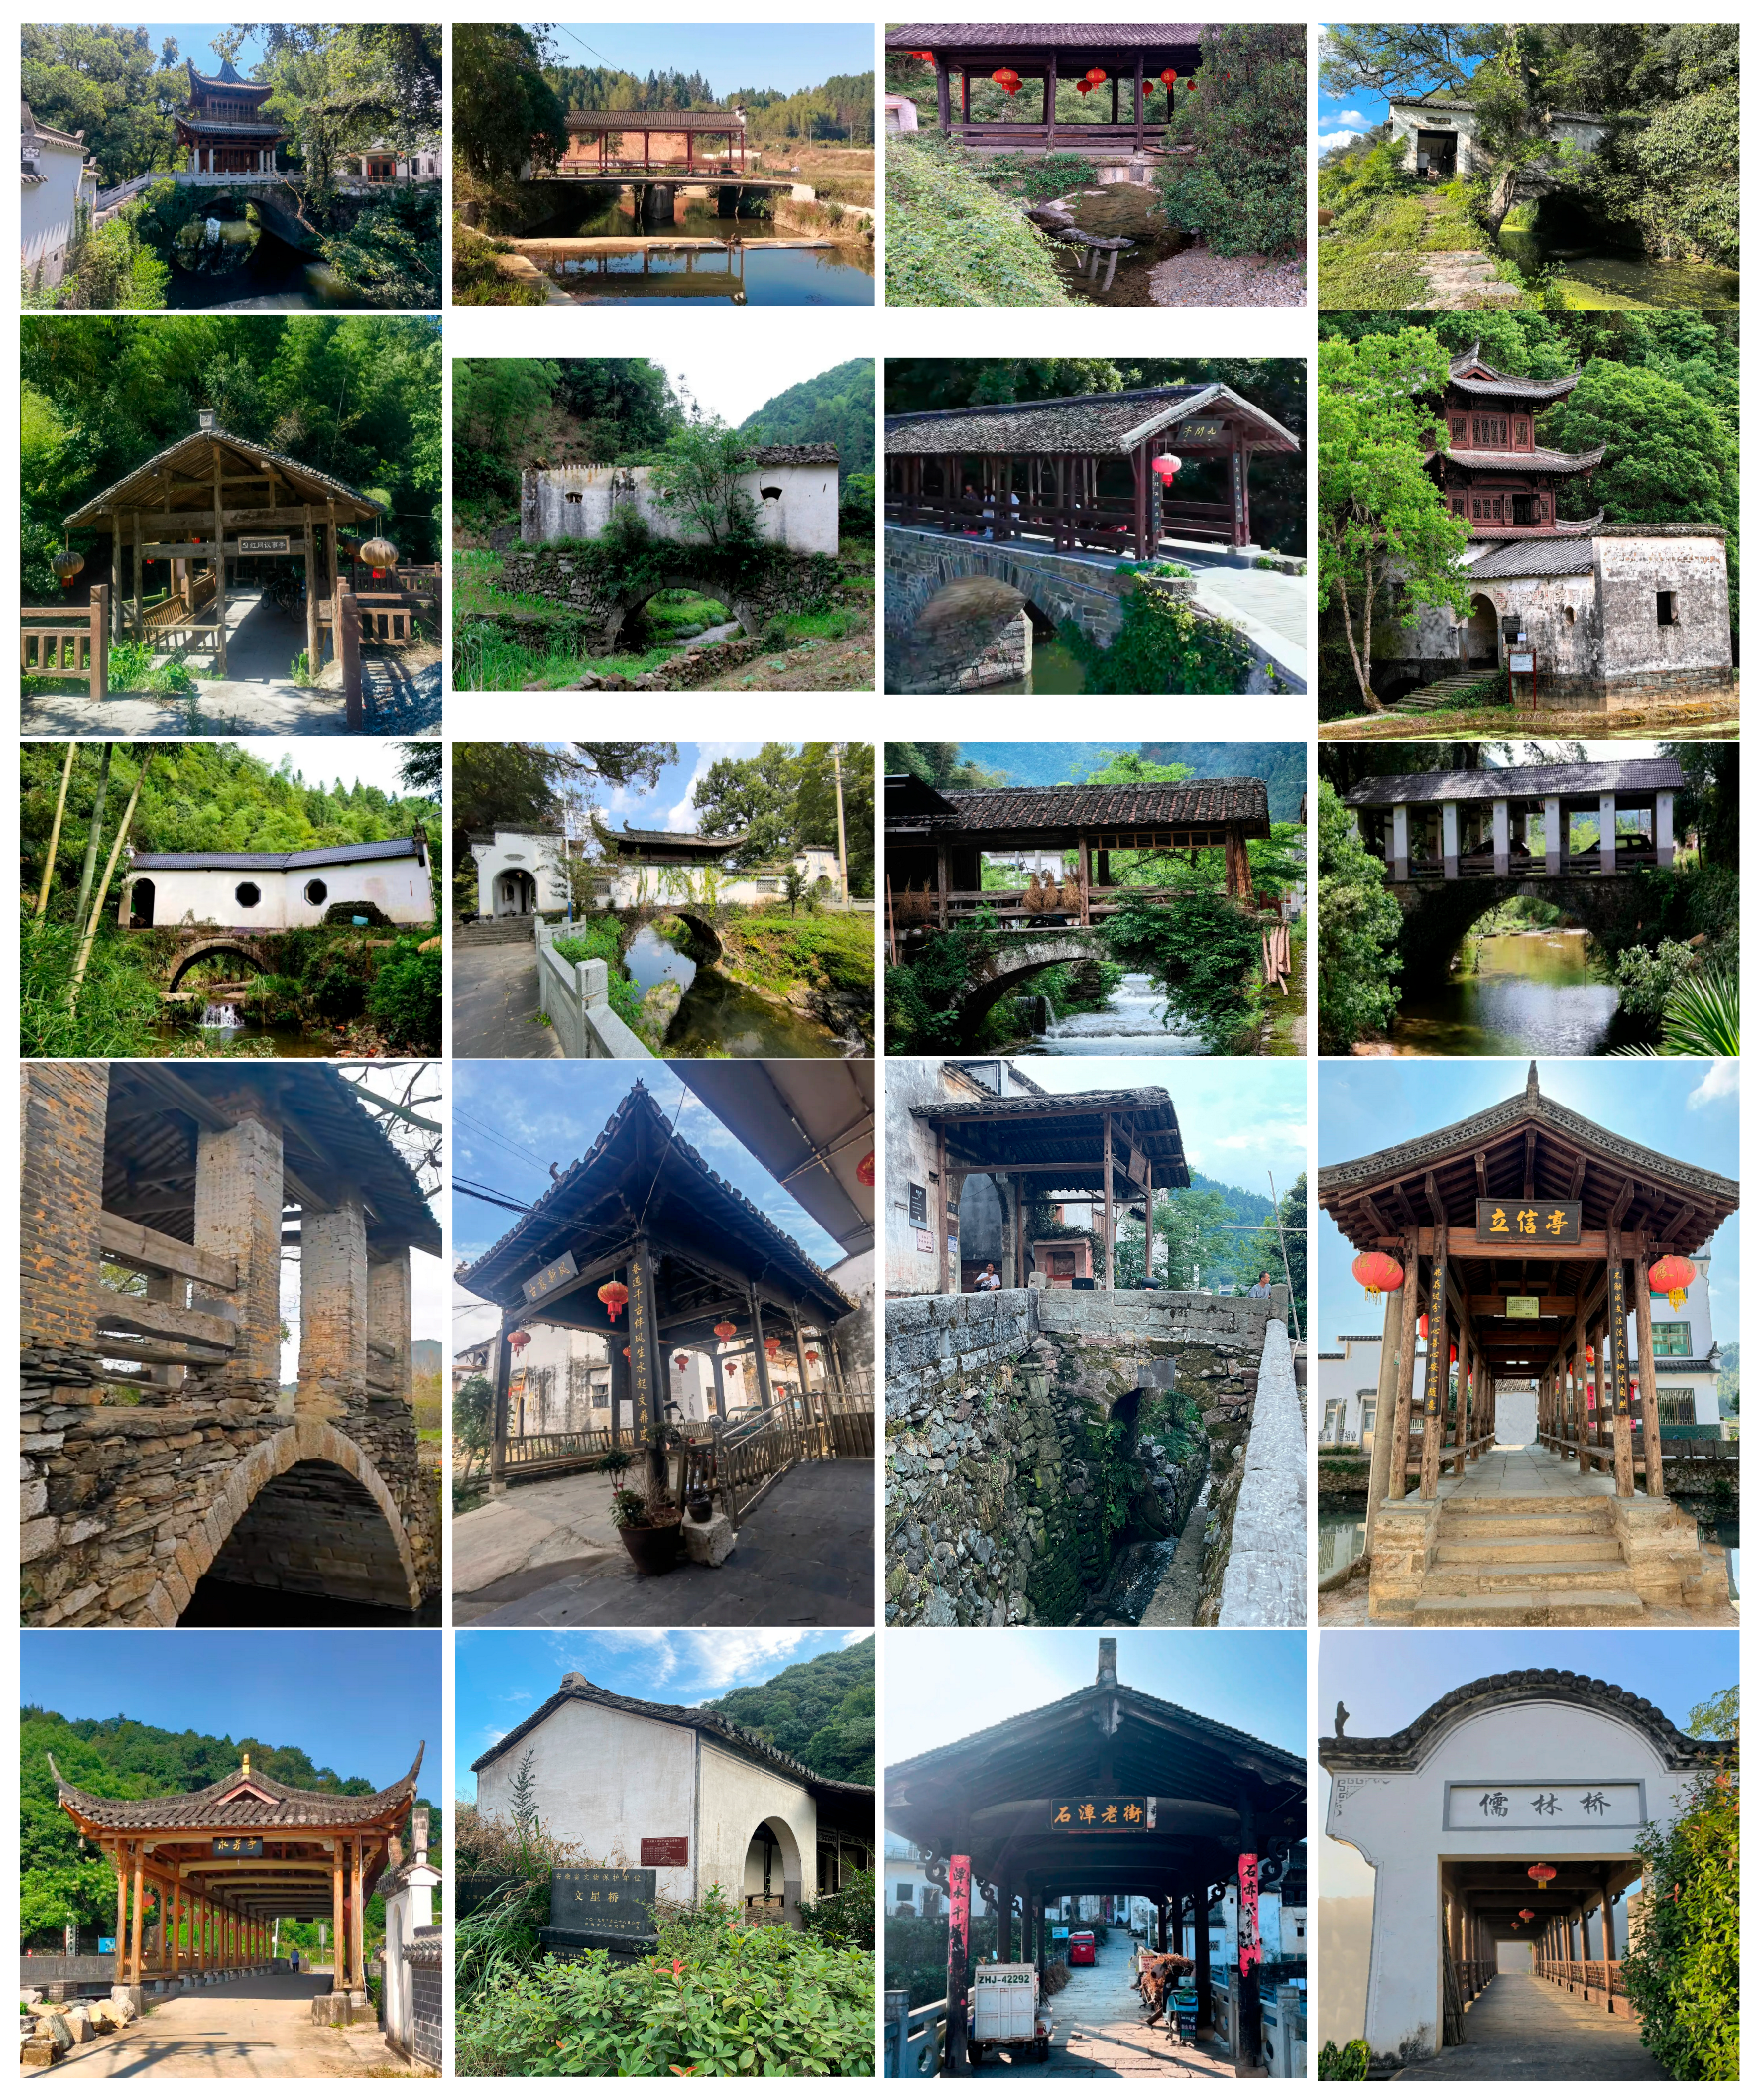
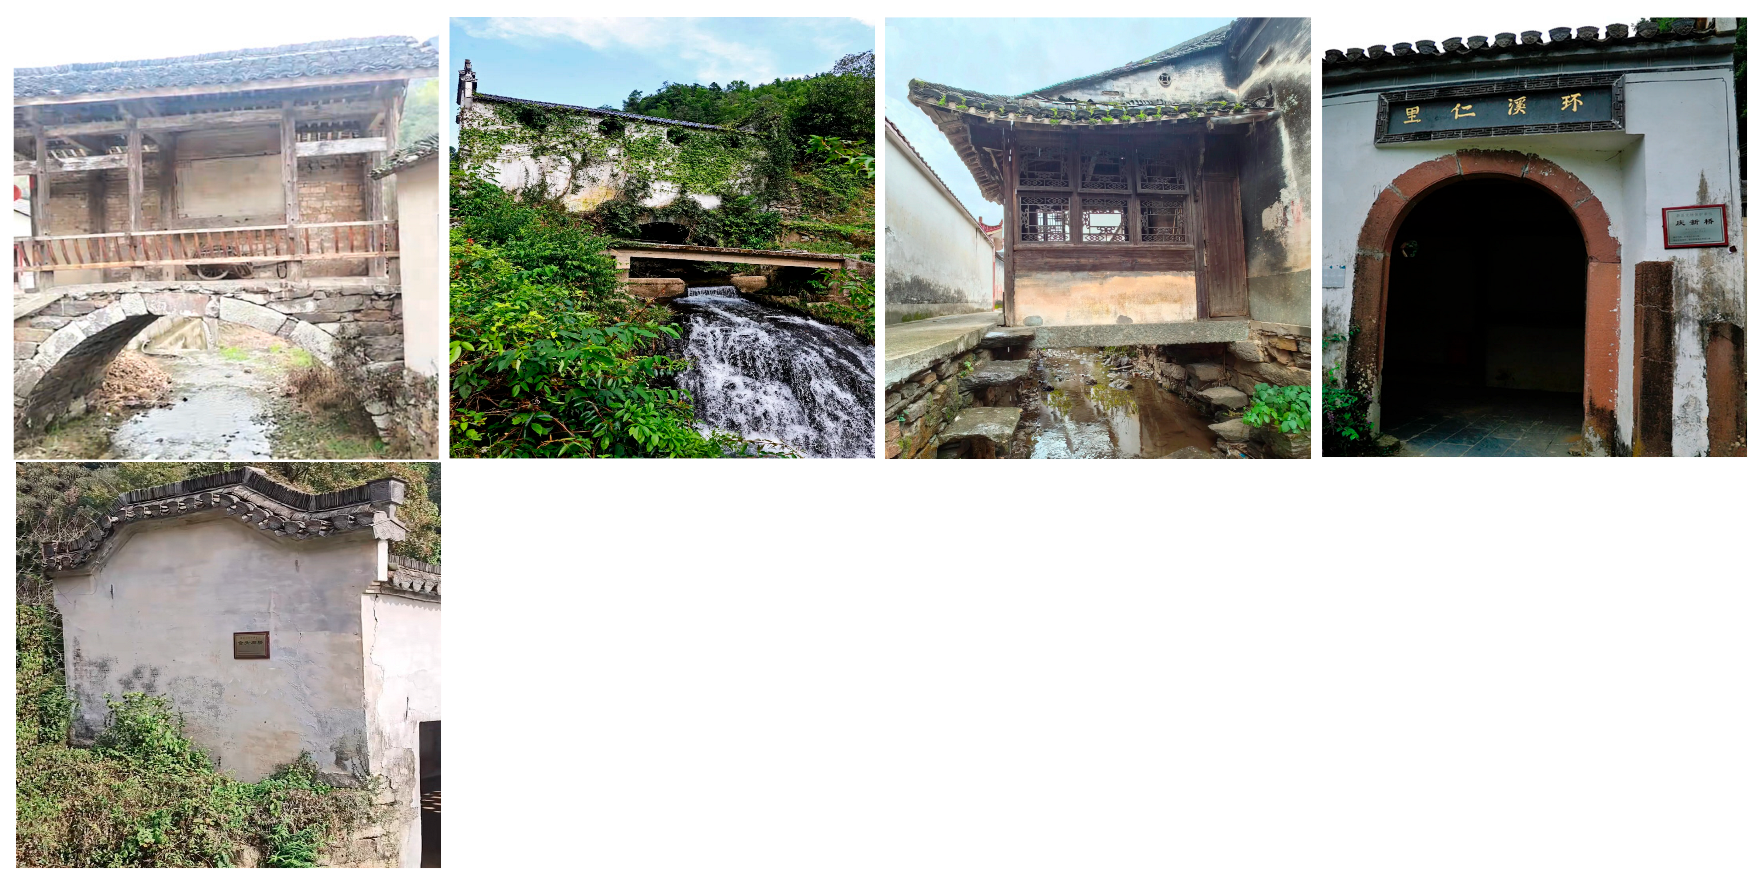
Firsthand data on 89 historic covered bridges in Huizhou were obtained through field surveys (Table 1, Figure A1), with incomplete data supplemented by publicly available local government records and multi-temporal satellite imagery. This resulted in a dataset documenting 116 cases of flash flood damage to these bridges over the five-year period from 2020 to 2024. The 89 bridges surveyed are historically significant and culturally valuable, representing typical examples of their type. Specifically, they include five bridges from the Song Dynasty (960–1279 AD), two from the Yuan Dynasty (1271–1368 AD), 34 from the Ming Dynasty (1368–1644 AD), and 48 from the Qing Dynasty (1644–1911 AD). Among them, four bridges are designated as National Key Cultural Relics Protection Units, four as Provincial-level Protection Units, and 32 as Municipal- or County-level Protection Units.
Based on Sekajugo et al.’s building damage classification framework [13], bridge damage in this study was evaluated according to two core criteria: structural safety and functional serviceability, with particular emphasis on whether the bridge remained safe for use or required evacuation and major repair. To ensure consistency and suitability for fsQCA analysis, damage was operationalized as a binary outcome derived from observable physical indicators and post-event usability. Undamaged bridges are defined as those with intact load-bearing structures and only minor superficial damage (e.g., small surface cracks or local coating loss) that does not compromise structural integrity, does not interrupt service, and can be restored through routine maintenance. In contrast, damaged bridges are identified by the presence of one or more objective conditions, including (i) severe wall or structural cracks posing safety hazards; (ii) mandatory evacuation or closure prior to repair; (iii) partial collapse of structural components, walls, or roofs; or (iv) total structural failure.

2.3. Indicator Identification

The flash flood risk factors considered in this study were identified through a synthesis of existing research on flood-induced damage to buildings, combined with the authors’ field investigation experience of historic covered bridges. Previous studies on flood risk assessment have demonstrated that a range of exposure- and vulnerability-related indicators can significantly influence damage severity in the built environment, particularly for residential and public buildings.
Although these indicators were not originally developed specifically for covered bridges, many of them describe fundamental physical and environmental processes—such as inundation intensity, structural resistance, and functional sensitivity—that are also relevant to bridge structures. In this study, these commonly used indicators were therefore selectively adapted and reinterpreted according to the architectural characteristics and structural systems of historic covered bridges. Ultimately, twelve risk factors were selected and adjusted from two dimensions—exposure and vulnerability (Table 2).

2.4. Analysis Methods

2.4.1. Random Forest Importance Analysis

Random Forest (RF) is a supervised ensemble machine learning algorithm that constructs multiple decision trees and integrates their results to improve predictive performance and model robustness. The RF analysis was implemented using using scikit-learn (Python Software Foundation, Wilmington, DE, USA). Unlike conventional regression models, RF does not require the assumption of linear relationships between explanatory variables and dependent outcomes. Instead, it is particularly effective in capturing complex nonlinear interactions and potential threshold effects among multiple predictors. Variable importance in RF is evaluated using the percentage increase in Mean Squared Error (%IncMSE), which quantifies the deterioration in prediction accuracy when the values of a given variable are randomly permuted. Mean Squared Error (MSE) is defined as:
M S E = 1 n i = 1 n ( y i y ^ i ) 2  
where y i and y ^ i denote the observed and predicted outcomes, respectively. The %IncMSE is calculated by randomly permuting the values of a given variable in the out-of-bag (OOB) samples and quantifying the resulting increase in prediction error. A larger %IncMSE indicates a greater deterioration in model performance, and therefore a higher importance of the variable in predicting the outcome [33].
Model performance was evaluated using the Area Under the Receiver Operating Characteristic Curve (AUC) and classification Accuracy (ACC). AUC describes the model’s discriminative ability, with values closer to 1 indicating stronger predictive performance, while ACC measures the proportion of correctly classified samples. The combined use of AUC and ACC effectively mitigates potential biases induced by imbalanced sample distributions [34].

2.4.2. fsQCA-Based Configuration Path Analysis

Although RF effectively identifies key predictors and their nonlinear contributions to damage outcomes, it functions primarily as a “black-box” model and cannot explicitly reveal the causal pathways formed by multiple concurrent conditions. However, flash flood damage to covered bridges is inherently a configurational process driven by the joint effects of multiple interacting risk factors rather than by any single variable acting independently. Fuzzy-set Qualitative Comparative Analysis (fsQCA) is grounded in set theory and Boolean algebra and is specifically designed to investigate causal complexity by identifying combinations of conditions that are sufficient and/or necessary for a given outcome. By examining both sufficiency and necessity relationships, fsQCA enables the identification of multiple equivalent causal pathways leading to the same damage outcome.
In this study, fsQCA was employed to complement the RF results using fsQCA 3.0 software (Compasss, Tucson, AZ, USA) by uncovering the configurational mechanisms underlying covered bridge damage. This hybrid RF–fsQCA framework allows both predictive accuracy and causal interpretability, thereby bridging the gap between machine learning-based risk identification and mechanism-oriented disaster analysis.

3. Results

3.1. Descriptive Statistics of Risk Factors

Table 3 presents the descriptive statistical analysis of 12 risk factors for 89 Huizhou covered bridges under 116 flash flood events. Given that the risk factors include both continuous and categorical variables, the original measured values from all 116 flood-event samples were used to calculate the mean, standard deviation (SD), minimum (Q1), median (Q2), and maximum (Q3) for continuous variables. The units of these statistics are consistent with the physical meaning of each variable. In addition, the frequency (N) and percentage (%) are reported for each category of categorical variables.
The analysis of exposure characteristics reveals that these covered bridges are predominantly located at village transportation nodes (40.5%) and along water outlets (26.7%). Foundation relative elevation (SD = 1.063), inundation depth (SD = 1.208), building height (SD = 1.723), openness ratio (SD = 0.338), and ground-floor area (SD = 76.370) demonstrate significant variability, indicating differences in both environmental conditions and structural exposure patterns. The facade morphology predominantly features open (45.7%) and semi-open (24.1%) designs.
The vulnerability characteristics of covered bridges reveal that stone arch bridges (with wooden frames or brick–wood trusses) constitute the majority, accounting for 68.1% of the sample, while wooden and stone beam bridges represent a smaller proportion (31.9%), which is the combined share of timber beam bridges and stone beam bridges with different roof truss configurations. The ground-floor area of covered bridges (SD = 76.370) exhibits significant variability, reflecting considerable differences in bridge dimensions. Historically, most covered bridges were constructed during the Ming and Qing dynasties (89.7%), with nearly half listed as protected cultural heritage sites at various levels (46.6%). The majority of surveyed covered bridges undergo regular maintenance (61.2%), and 75.9% continue to function effectively.

3.2. Importance Analysis of Flash Flood Risk Factors

The twelve flash flood risk factors were encoded and incorporated into the Random Forest (RF) model, with the damage status of covered bridges serving as the dependent variable. To reduce overfitting under limited sample conditions, ten-fold cross-validation combined with grid-search optimization was employed to tune key Random Forest hyperparameters (Table 4). The dataset was randomly split into training and testing subsets at an 8:2 ratio. To address class imbalance between damaged and undamaged samples, the class_weight parameter was set to “balanced”. All analyses were conducted using Python 3.8 with the scikit-learn library. Although higher training accuracy was initially achieved at a maximum tree depth of 10, the AUC decreased as tree depth increased, indicating reduced generalization ability. Given the limited sample size, a maximum tree depth of 3 was ultimately adopted to balance predictive accuracy and generalization performance. The resulting model achieved an Accuracy (ACC) of 0.7917 and an Area Under the Curve (AUC) of 0.8651, indicating robust overall predictive performance and satisfactory classification stability.
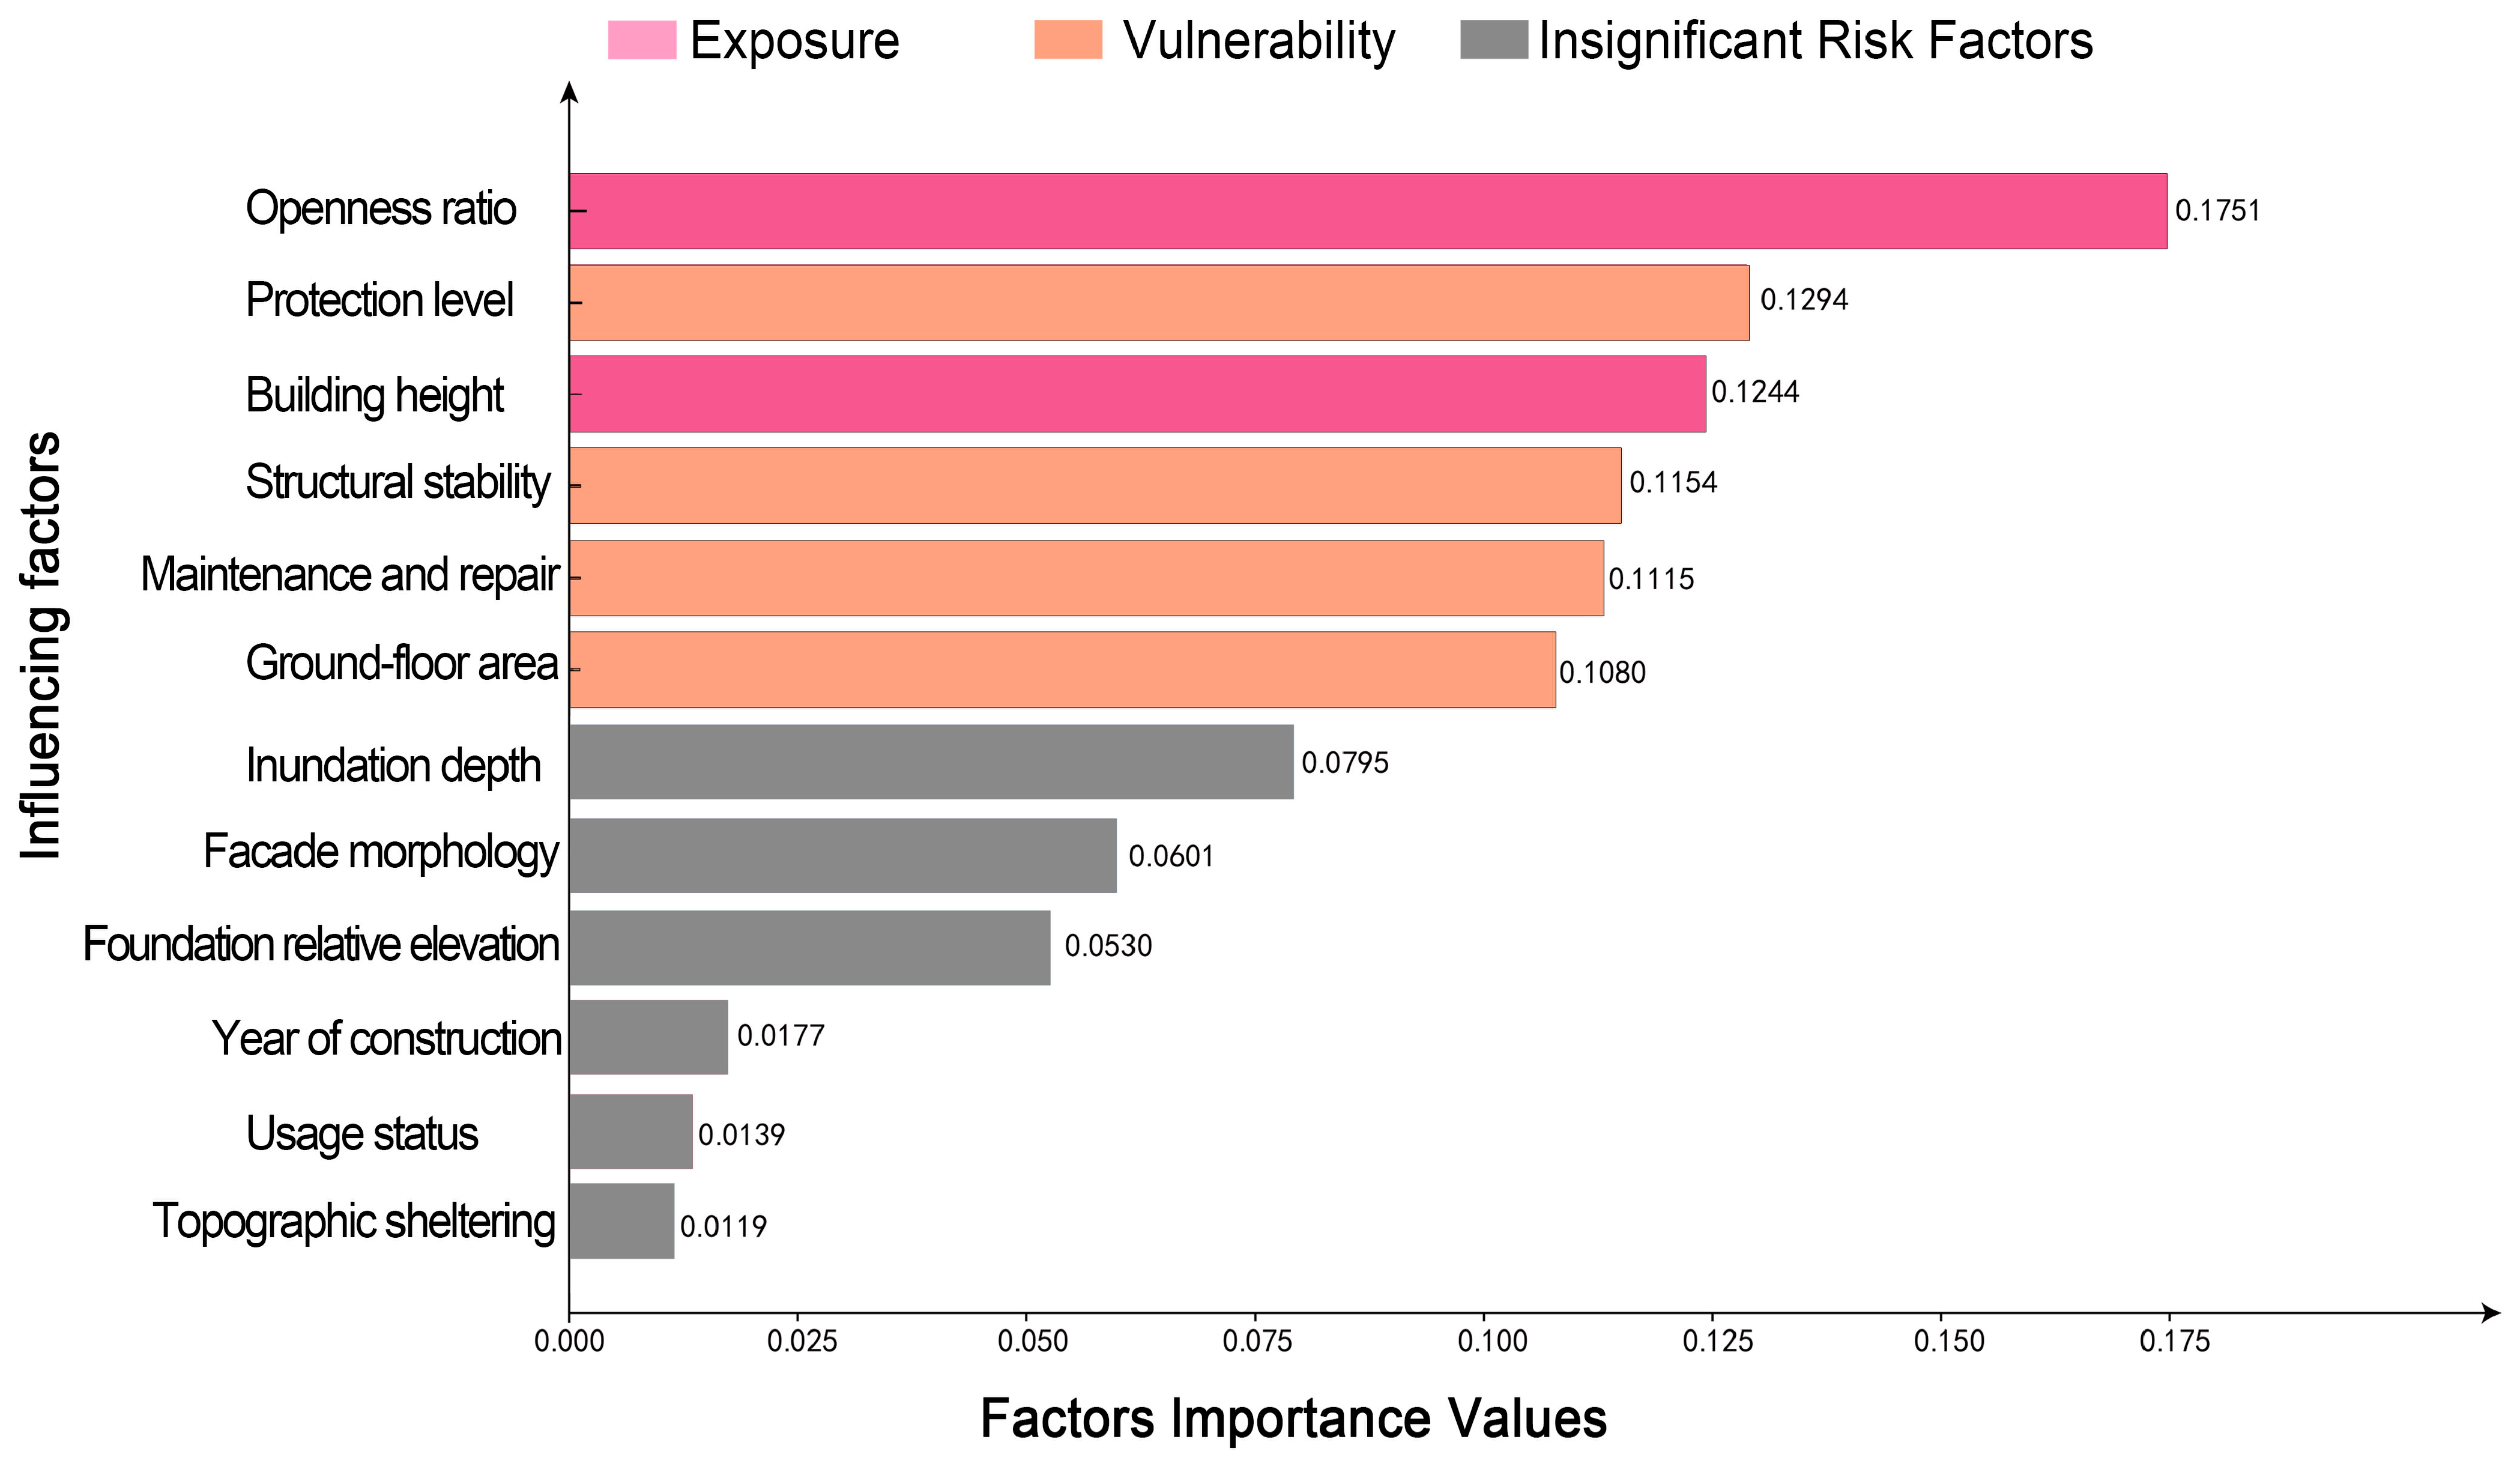
The variable importance results (Figure 4) show that six factors exhibit dominant contributions, all with importance values exceeding 0.10. These include openness ratio (0.1751), protection level (0.1294), building height (0.1244), structural stability (0.1154), maintenance condition (0.1115), and ground-floor area (0.1080). Together, these six variables account for more than 75% of the cumulative importance, indicating that they constitute the primary determinants of flash flood damage to covered bridges.
In contrast, flood peak depth (0.0795), facade form (0.0601), foundation elevation (0.0530), construction period (0.0177), functional usage status (0.0139), and topographic sheltering (0.0119) exhibit relatively low importance values, suggesting weaker statistical associations with damage outcomes at the regional scale.

3.3. Nonlinear and Marginal Effects Analysis of Covered Bridge Damage

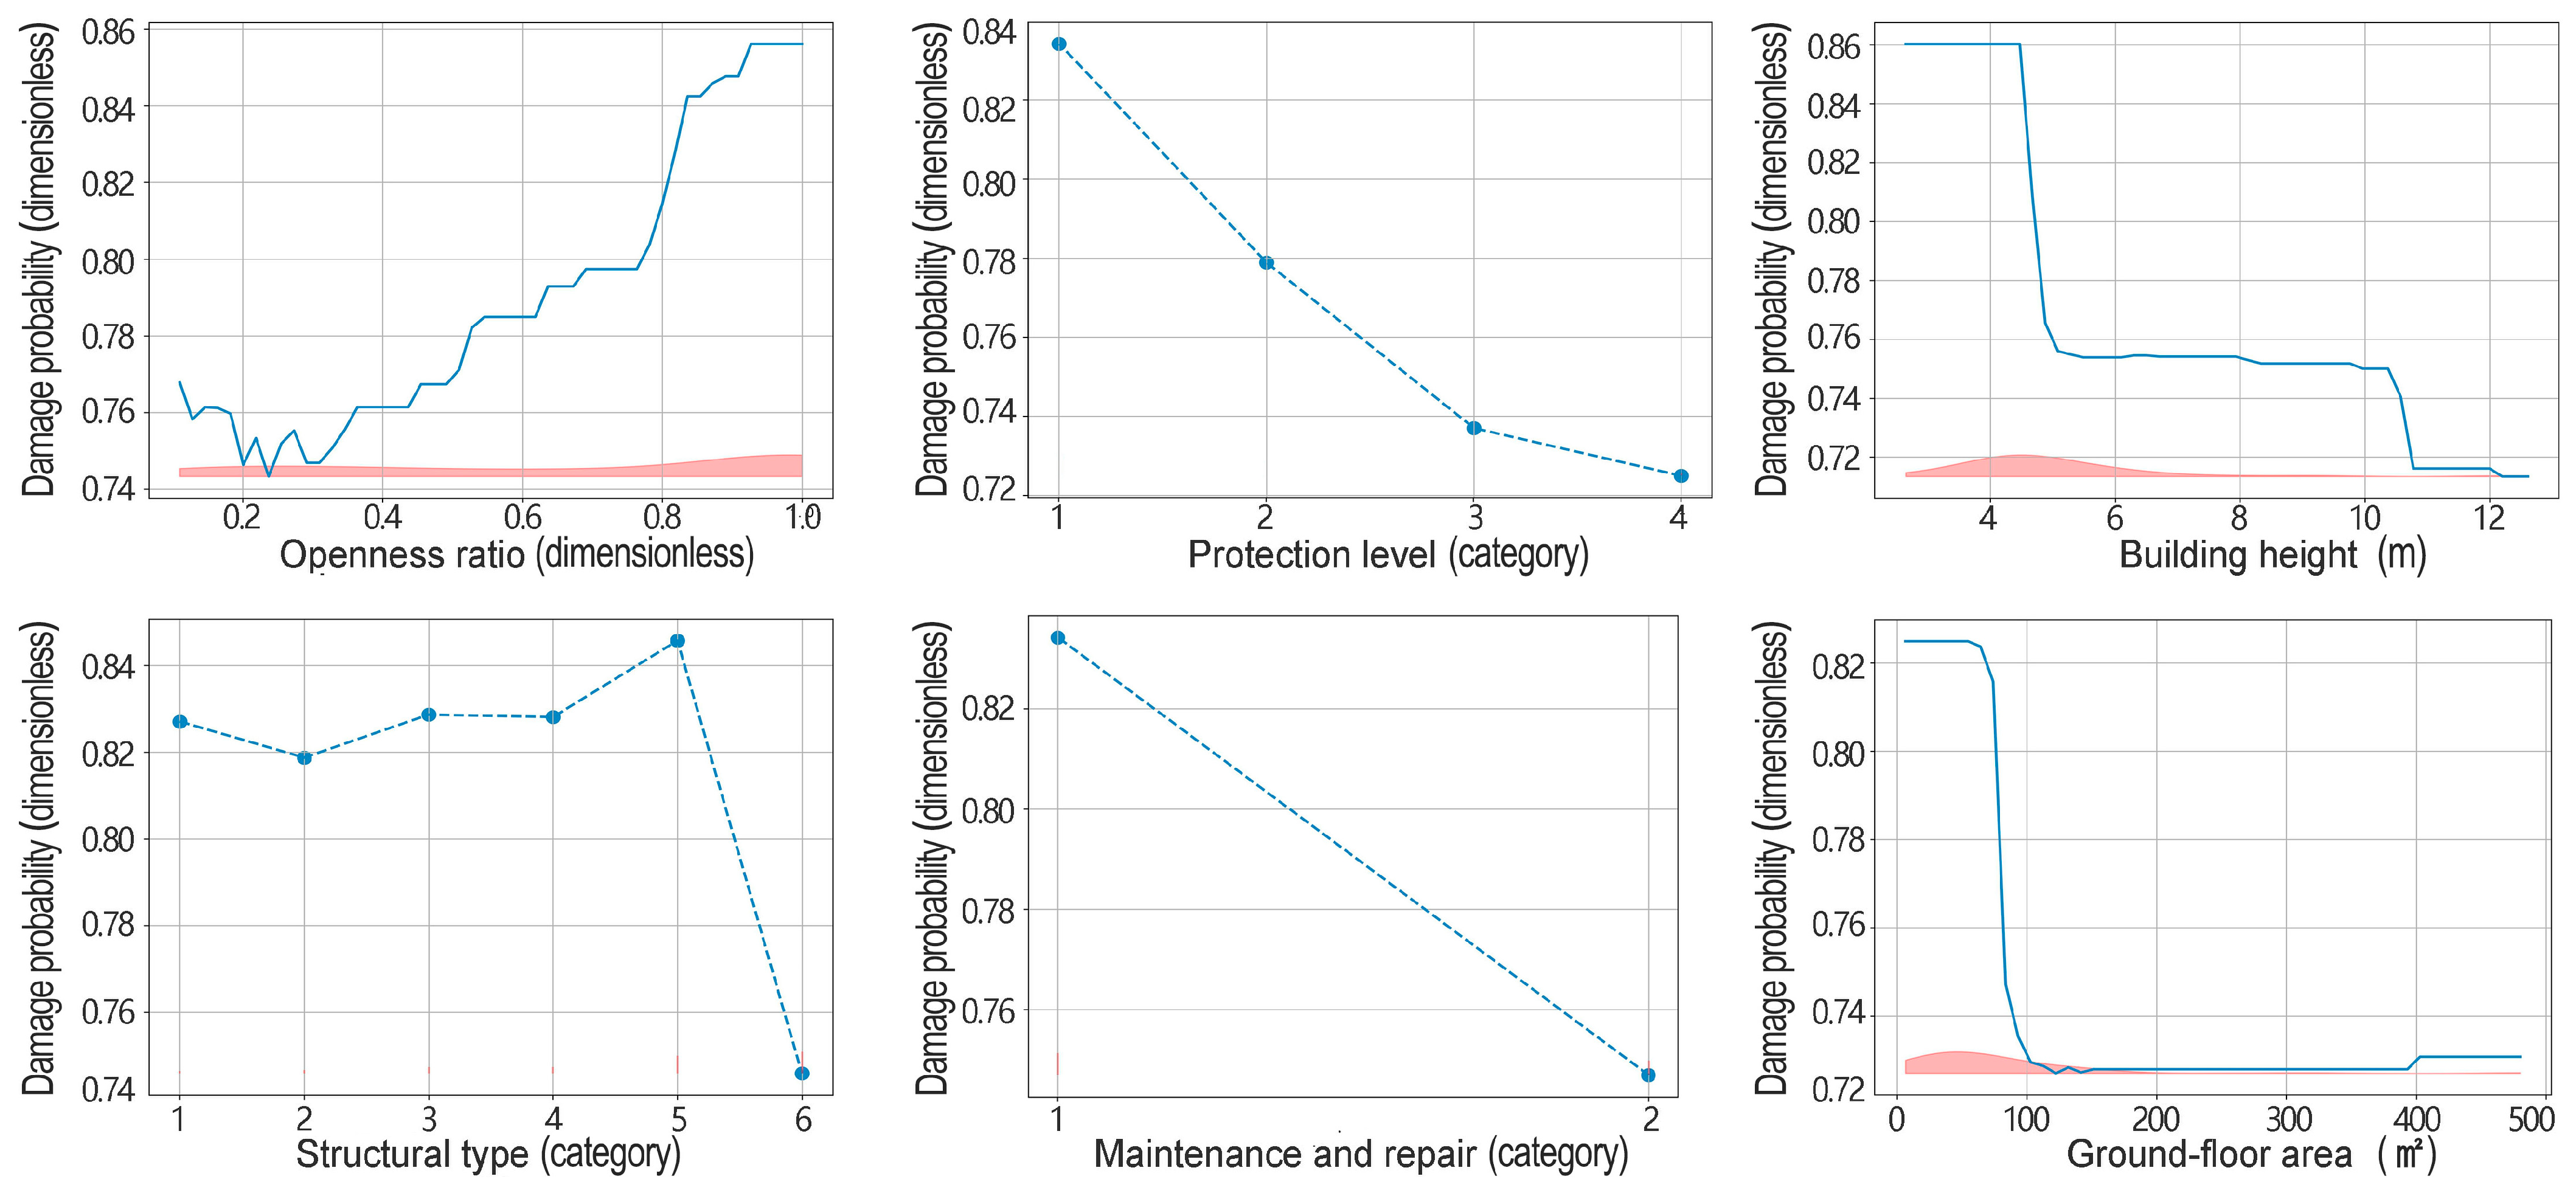
Partial dependence graphs are employed to visualize and interpret the marginal effects of key risk factors on covered bridge damage prediction probabilities. As shown in Figure 5, this diagram illustrates the relationships between critical factors and model predictions while fixing all other variables at their mean values. The Y-axis represents the damage probability, calculated as the natural logarithm ratio of predicted probabilities between flood-damaged and undamaged scenarios, while the X-axis shows the quantitative values of independent variables. For categorical variables, the x-axis values represent predefined classification codes, with detailed definitions provided in Table 2. The red shaded band illustrates the distribution of samples across the predictor range, with wider bands indicating greater data support for the estimated effects. This approach facilitates an intuitive interpretation of the independent effects of each predictive variable on damage likelihood within the constructed model.
Figure 5 demonstrates that the impact of different risk factors on the damage probability of covered bridges exhibits distinct patterns, including monotonic changes, threshold effects, and non-monotonic fluctuations. In terms of morphological and proportional characteristics, the openness ratio and the damage probability show an overall upward trend, with the lowest probability of damage occurring at a porosity of approximately 0.3. When the porosity is low, the probability of damage changes less significantly, while it increases more markedly in the higher porosity range.
Regarding management and maintenance characteristics, the protection level and the damage probability show a linear downward trend, indicating that higher protection levels reduce the likelihood of bridge damage. Maintenance and repair conditions demonstrate distinct grouping differences, with covered bridges under regular maintenance exhibiting significantly lower damage probability compared to those with irregular maintenance.
In terms of scale and structural characteristics, the impact of building height on damage probability exhibits distinct nonlinear patterns. As the height of the covered bridge increases beyond approximately 4 m, the damage probability drops sharply, then stabilizes between 4–10 m. The influence of ground-floor area demonstrates a clear threshold effect: damage probability decreases rapidly within small-scale areas (≤100 m2), but shows significantly reduced variation after exceeding this threshold, eventually stabilizing. Structural stability-related damage probability also shows inter-category fluctuations, with Stone arch bridges with brick–timber roof trusses showing the most pronounced differences and the lowest damage probability, while other structural types show no significant variations.

3.4. Configurational Path Analysis of Covered Bridge Damage

Given the complex and nonlinear nature of flash floods impacting covered bridges, damage often results from combinations of structural, spatial, and management factors rather than the effect of a single variable. While RF models effectively identify the relative importance of risk factors and their nonlinear marginal effects, they still have limitations in revealing how multiple conditions interact to cause damage. To supplement the analysis of RF models and further explore causal pathways among multiple conditions, this study employs fsQCA to deeply analyze the underlying configuration mechanisms behind covered bridge damage.
The six high-importance factors identified by the RF model—namely openness ratio, protection level, building height, structural stability, maintenance and repair, and ground-floor area—were selected as antecedent conditions in the fsQCA analysis. By conducting both necessity and sufficiency analyses, fsQCA was employed to reveal the configurational relationships among these antecedents and to compensate for the limitations of RF in explicating multi-condition causal pathways.

3.4.1. Variable Calibration

Prior to fsQCA modeling, all variables were calibrated into fuzzy sets with membership scores ranging from 0 to 1, where 1 denotes full membership, 0.5 indicates the crossover point, and 0 represents full non-membership [35,36]. Following the calibration strategy proposed by Vis et al., continuous variables were uniformly calibrated using the 95th percentile, 50th percentile, and 5th percentile values as threshold anchors [37]. For ordered categorical variables, direct calibration was applied based on their categorical codes. These thresholds define the qualitative breakpoints for each causal condition and outcome.

3.4.2. Necessity Analysis of Single Conditions

Single-condition necessity tests were conducted for the six antecedent variables (Table 5). In fsQCA, consistency measures the degree to which a condition constitutes a necessary condition for the outcome, while coverage indicates the explanatory power of that condition, that is, the proportion of outcome cases explained by it. Typically, a condition was defined as necessary when its consistency exceeded 0.90, or as quasi-necessary when its consistency ranged between 0.80 and 0.90 with coverage exceeding 0.75.
The results indicate that the absence of protection measures constitutes a necessary condition for covered bridge damage, whereas high structural stability and low openness ratio emerge as quasi-necessary conditions for damage prevention. These findings highlight the fundamental role of institutional protection and structural robustness in mitigating flash flood impacts.

3.4.3. Sufficiency Configuration Analysis

Prior to conducting configuration analysis, it is essential to establish consistency and frequency thresholds. Following Ragin’s methodological recommendations [38], the consistency threshold was set at 0.85, and the frequency threshold was set at 2 based on the sample size of 116 cases, ensuring that at least 75% of cases were retained for analysis. A truth table analysis was then performed to generate complex, parsimonious, and intermediate solutions, with the intermediate solution employed for configuration interpretation. Core and peripheral conditions were subsequently identified by comparing the intermediate and parsimonious solutions [39].
In the configurational analysis, the symbols are defined as follows. “●” denotes a core present condition, that is, a key factor that plays a dominant causal role in producing the outcome. “•” represents an auxiliary present condition, which facilitates or strengthens the outcome but is dependent on the presence of the core condition. “○” indicates a core absent condition, meaning that the absence of this condition constitutes the key triggering factor for the outcome. “◎” refers to an auxiliary absent condition, whose absence weakly promotes the outcome and can be substituted by other conditions. The symbol “/” denotes an irrelevant condition, whose presence or absence exerts no substantive influence on the configuration outcome.
In addition, the symbol “~” explicitly indicates the absence of a given condition, while “*” denotes that the condition functions as a core condition within the configuration. For example, “~openness ratio*” indicates that the openness ratio functions as a core absent condition, namely, its absence plays a dominant role in triggering the outcome; “openness ratio*” indicates that the openness ratio functions as a core present condition; “~openness ratio” represents the openness ratio as an auxiliary absent condition; and “openness ratio” represents the openness ratio as an auxiliary present condition.
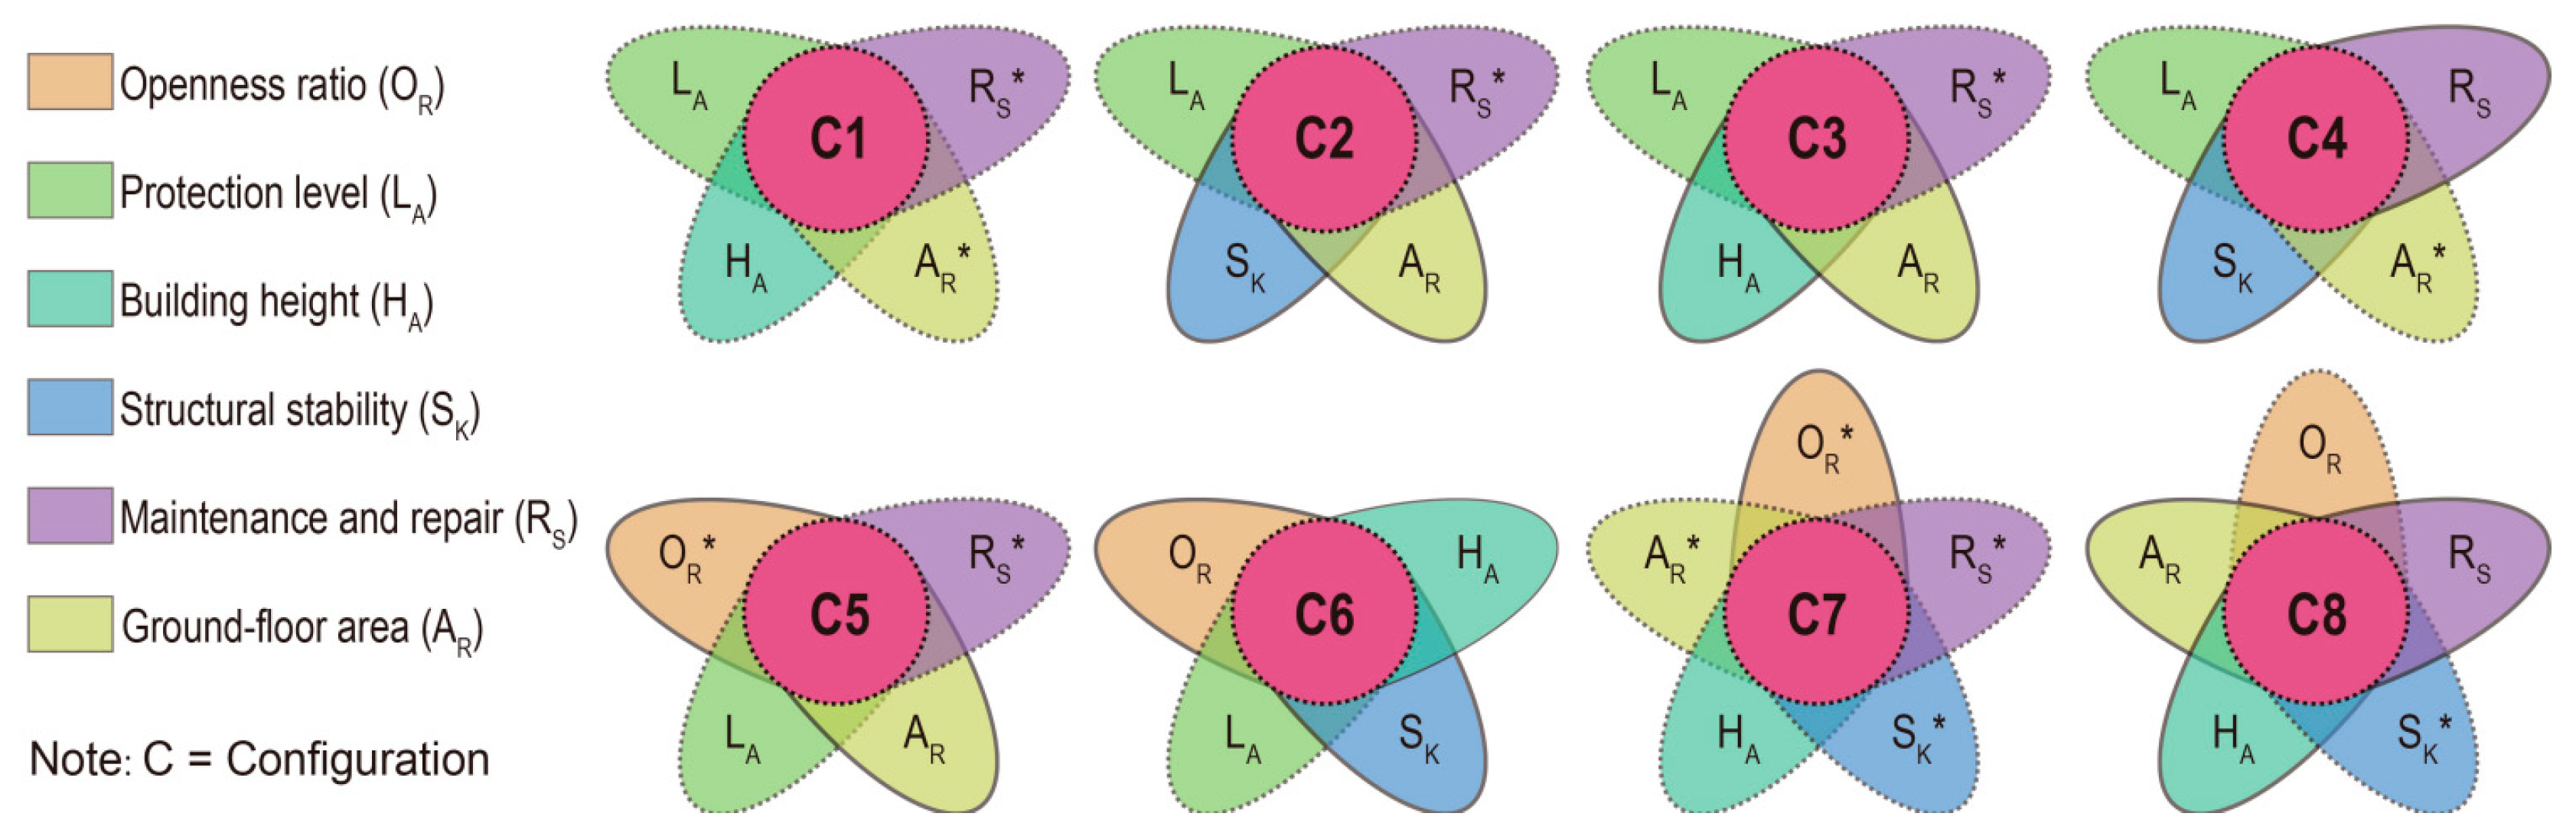
The fsQCA results yield eight sufficient configuration pathways for covered bridge damage (Table 6, Figure 6), all of which exhibit consistency values exceeding 0.80 and a combined solution coverage greater than 50%, indicating strong explanatory power [40].
To facilitate interpretation of the configurational analysis results, the coverage and consistency indicators reported in Table 6 are defined as follows. Raw coverage represents the proportion of “covered bridge damage” cases explained by a specific configuration, reflecting its empirical relevance. Unique coverage denotes the proportion of damage cases explained exclusively by that configuration, indicating its unique contribution. Consistency measures the degree to which cases conforming to a given configuration also exhibit the damage outcome, with higher values indicating greater reliability as a sufficient condition. Solution coverage reflects the total proportion of damage cases jointly explained by all valid configurations, representing overall explanatory power. Solution consistency evaluates the stability with which the entire solution set produces the outcome and serves as an indicator of the overall reliability of the sufficient-condition configurations.
  • “Low protection level–maintenance and repair deficiency” risk patterns.
The core risk path in Configuration 1 (~protection level, ~building height, ~maintenance and repair*, ~ground-floor area*), Configuration 2 (~protection level, structural stability, ~maintenance and repair*, ground-floor area), Configuration 3 (~protection level, building height, ~maintenance and repair*, ground-floor area), and Configuration 5 (openness ratio*, ~protection level, ~maintenance and repair*, ground-floor area) is the “low protection level–maintenance and repair deficiency” risk patterns.
In Configurations 1, 2, 3, and 5, the protection level consistently appears as a secondary missing condition, while maintenance and repair remains the primary missing condition. This indicates that the absence of institutional protection and routine maintenance is the key factor triggering catastrophic damage to covered bridges (with a maximum raw coverage of 0.3450). In addition, this risk path covers the widest range of damage cases and thus represents the most prevalent risk patterns (with a cumulative unique coverage of 0.1547 across multiple configurations).
2.
“Low protection level–structural stability-induced failure” risk patterns.
The core risk path for Configuration 6 (openness ratio, ~protection level, building height, structural stability) is identified as the “low protection level–structural stability-induced failure” risk patterns.
In Configurations 4 and 6, structural stability consistently appears as a supplementary condition, while protection level remains a secondary missing condition. This indicates that even when structural stability is present, a low level of protection can still render structural advantages ineffective. This effect is particularly pronounced for small-scale covered bridges with limited ground-floor area (Configuration 4 exhibits a unique coverage of 0.0806, the second highest among all single configurations, where ground-floor area acts as a core absent condition).
3.
“High openness rate–determined” risk patterns.
The core pathways in Configuration 5 (openness ratio, protection level, maintenance and repair, ground-floor area) and Configuration 7 (openness ratio, building height, structural stability, maintenance and repair, ground-floor area) are both classified as “high openness ratio–determined” risk patterns.
In both configurations, the openness ratio consistently serves as the primary condition. Although these configurations lack key elements such as maintenance and repair or ground-floor area, the openness ratio still functions as a strong structural vulnerability indicator for covered bridge damage.
4.
“Low structural stability–determined” risk patterns.
The core path of Configuration 8 (~openness ratio, building height, structural stability*, maintenance and repair, ground-floor area) is classified as the “low structural stability–determined” risk pattern.
Even when the openness ratio is low, the building height is large, the ground-floor area is large, and favorable conditions such as maintenance and repair are present, covered bridges may still be destroyed by mountain floods when structural stability serves as the core missing condition, that is, when structural stability is poor.
Figure 6. Configuration diagram of bridge damage path.
Buildings 16 00616 g006
Each configuration (C1–C8) represents a sufficient causal combination of conditions. Colored areas denote different antecedent conditions, while their overlaps indicate joint causation. Asterisks (*) mark core conditions, and dotted outlines indicate auxiliary conditions. This figure visually summarizes the multiple equivalent risk pathways identified in Table 6 and highlights the causal diversity underlying covered bridge damage.

3.4.4. Robustness Analysis

To assess the robustness of the configurational results, the consistency threshold was increased from 0.85 to 0.90 while keeping the frequency threshold unchanged. If the resulting configurations showed minimal changes or no significant fluctuations in consistency and coverage, this indicated high robustness of the original results; otherwise, it suggested weaker robustness [41]. The comparison indicates that all eight original configurations remain valid, with the overall solution consistency increasing to 0.9246 and the solution coverage rising to 0.6950. These findings confirm that the identified configurational pathways exhibit strong robustness and stability.

4. Discussion

This study integrates an RF–fsQCA hybrid framework to investigate flash flood damage mechanisms of covered bridges. Based on the exposure and vulnerability of the internal systems of the covered bridge, six core risk factors were first identified using RF importance features (openness ratio, protection level, building height, structural stability, maintenance and repair, and ground-floor area). Through partial dependence graphs, it was found that the risk factors exhibit linear trends, nonlinear fluctuations, and threshold relationships with the probability of covered bridge damage, indicating a complex nonlinear relationship between risk factors and damage probability. Given that covered bridge damage is influenced by multiple factors, further integration of fsQCA yielded eight covered bridge damage path configurations and identified four major flash flood risk patterns affecting covered bridges. These findings collectively demonstrate that flash flood-induced damage to covered bridges is dominated by multiple configurational causal paths rather than any single isolated risk factor, and that the impact of various risk factors within the covered bridge’s internal systems on damage outcomes exhibits differences and complex nonlinear relationships.

4.1. Single Factor Influence Mechanism of Corridor Bridge Damage

The nonlinear marginal effect analysis reveals that the openness ratio and the damage probability exhibit a U-shaped relationship with damage probability, while showing an overall positive correlation; the protection level and maintenance and repair have a significant inhibitory effect on the damage probability; the building height, the ground-floor area and the structural stability exhibit clear threshold effects on damage probability.
Specifically, when the openness ratio increases within the range of 0–0.3, damage probability decreases, reaching its minimum at approximately 0.3. Beyond this threshold, damage probability increases sharply. Numerical simulation studies often indicate that higher openness ratios allow more floodwater to enter structures while effectively reducing maximum hydrostatic pressure on the framework [42]. Similar conclusions were drawn by Zhen et al., whose model simulations showed that increased openness ratio (within the 0–0.35 range) reduces horizontal forces and overturning moments generated by floods [43]. However, it should be noted that the reduction in flood-induced loads does not necessarily imply enhanced structural safety, particularly for traditional covered bridges. Zhen et al. primarily demonstrated how increased opening design can alter the distribution of hydrodynamic pressure, thereby reducing the corresponding forces acting on building surfaces, under the premise that the overall structural system and wall integrity remain intact.
In Huizhou-style covered bridges, enclosing walls are not merely non-structural elements; rather, they play a crucial role in providing lateral restraint and maintaining the integrity of the timber–stone composite structural system. When the openness ratio exceeds a critical threshold, excessive openings may significantly weaken wall continuity and reduce structural stiffness. Under flood conditions, this loss of structural resistance may offset the benefits associated with reduced hydrostatic pressure. As a result, even when overall hydrodynamic loads are simultaneously reduced, an excessively high openness ratio may still increase the likelihood of damage.
A higher protection level and maintenance and repair significantly reduce the probability of damage, which aligns with the international cultural heritage protection guidelines and multiple building resilience studies. These findings confirm that institutional protective measures and routine maintenance ensure the durability and stability of covered bridges [44,45], effectively mitigating the destructive impact of flash floods on structures, thereby lowering the likelihood of covered bridge damage.
In terms of scale effects, both first-floor area and building height of covered bridges exhibit threshold effects that reduce damage probability. Beyond these thresholds, the probability of damage decreases significantly, followed by a relatively stable plateau phase. Existing studies across multiple scenarios have demonstrated a negative correlation between ground-floor area and building height with flood-induced damage severity [46,47]. Research indicates that buildings of different scales (including floor area, height, and number of floors) exhibit distinct damage response patterns under identical flood conditions. Small-scale buildings are more prone to severe damage at moderate to low flood depths, while large-scale structures show lower sensitivity to flood depth with more gradual responses [48]. This phenomenon provides a plausible explanation for the threshold effects observed in this study: the ground-floor area and building height of covered bridges reach their critical thresholds around 4 m and 100 square meters, respectively. Beyond these thresholds, the damage probability response becomes increasingly flat as the bridge size continues to increase.
Furthermore, the stability of different structures exhibits distinct responses to flood erosion, shear forces, and bending moments [49]. Reliability studies on bridges and arch structures demonstrate that when erosion depth does not reach the foundation’s bottom soil, the impact on structural responses remains minimal. In such cases, the reliability of arch bridges shows only a negligible decrease, which validates the inherent structural stability of arch bridges [50,51]. This explains why stone arch bridges with brick–timber roof trusses in this study exhibit the lowest damage probability.
These findings indicate that the observed damage responses of covered bridges are governed not only by individual factor magnitudes, but also by nonlinear interactions and threshold-dependent mechanisms. Moreover, the nonlinear and threshold effects revealed by the partial dependence analysis highlight the limitations of purely statistical or static approaches in fully capturing flash flood damage processes. Previous studies show that physical flume experiments and high-resolution numerical simulations can effectively elucidate localized hydrodynamic forces and flow–structure interactions under extreme flood conditions [52,53], providing a physical basis for interpreting the nonlinear responses observed in this study, particularly those related to openness ratio thresholds and structural stability.

4.2. Configuration Mode and Protection Strategy of Corridor Bridge Damage

As a significant category of architectural heritage, covered bridges possess irreplaceable authenticity, historical value, and site-specific characteristics. Their dimensions, forms, structures, and location attributes are inherently difficult to modify at low cost. Consequently, traditional homogeneous structural reinforcement strategies are neither economically optimal nor fully compliant with heritage conservation principles. Based on the revealed key mechanisms of covered bridge damage caused by flash floods and four risk patterns: (1) low protection level–maintenance and repair deficiency damage; (2) low protection level–structural stability damage; (3) high openness ratio–dominant damage; and (4) low structural stability–dominant damage. This section proposes targeted comprehensive disaster prevention strategies from two dimensions: “systemic intervention” and “precision reinforcement”. These strategies aim to block risk pathways and enhance the overall resilience of covered bridge systems.

4.2.1. System First: Establishing a Preventive Protection and Routine Maintenance System

To address the two fundamental risk patterns—’low protection level–maintenance and repair deficiency damage’ and ‘low protection level–structural stability-induced damage’—the core solution lies in systematically addressing institutional gaps and transitioning the protection model from ‘passive rescue’ to ‘active prevention’ [54]. This involves conducting comprehensive surveys and value assessments of Huizhou covered bridges to facilitate their inclusion in formal statutory protection lists, as well as establishing standardized, long-term professional inspection and maintenance mechanisms. Furthermore, to achieve sustainable scientific preservation, it is essential to integrate modern technology with traditional craftsmanship by forming a “technical protection team” composed of experts, engineers, and traditional artisans. This team will be responsible for regular health monitoring and minimal-intervention restoration, ensuring the timeliness and cultural appropriateness of preventive maintenance.

4.2.2. Flexibility Control: Dynamic Adaptive Design of Facade Openness

For the “high openness ratio–dominant damage” risk pattern, the core of regulation lies in intelligently managing the interaction interface between floodwaters and structures, rather than pursuing absolute closure. This approach primarily involves two aspects: First, adaptive flood defense during the flood season, which means appropriately installing removable flood barriers or louver systems for covered bridges with excessively high openness ratios (above 30%) during flood periods. By temporarily reducing the effective water flow area, this directly mitigates risks from water impact and floating debris collisions. Second, hydraulic-based precision diversion design. For covered bridges undergoing reconstruction or renovation, the facade openness ratio should not be mechanically required to be low [55,56]. Instead, through hydrodynamic simulations, an “optimal opening interval” should be identified to effectively divert floodwaters, alleviate static water pressure and buoyancy forces, thereby achieving dynamic balance between structural safety and flood discharge requirements.

4.2.3. System Protection: Strengthening Engineering and Environmental Protection of Vulnerable Nodes

For the risk category of “low structural stability–dominant damage” risk pattern, systematic reinforcement of the vulnerable bridge structure and its hydrological environment is required to establish a coordinated defense system. From an environmental perspective, comprehensive protection of the surrounding environment is therefore essential [57], including coordinated preservation of environmental elements directly connected to the bridge, such as docks, dams, and stepping stones. Additionally, installing peripheral protective facilities like anti-erosion piers and submerged check dams can effectively mitigate the scouring force of flash floods acting on the bridge’s foundations and structural components. For the covered bridge itself, targeted reinforcement of identified high-risk covered bridges is required. Under the premise of strictly adhering to the original design and construction techniques, priority is given to reinforcing bridges located in extreme flood recurrence zones through methods such as foundation reinforcement and critical node strengthening, thereby effectively enhancing the structural resistance of the bridge.

5. Conclusions

This study investigates the complex damage mechanisms and interacting influencing factors affecting Huizhou covered bridges under flash flood conditions. By constructing and applying a hybrid RF-fsQCA analytical framework, we systematically describe the key driving mechanisms of covered bridge damage from both single-factor effects and multi-factor configurations. The results demonstrate that covered bridge damage under flash floods is not dominated by a single risk factor, but rather results from the combined effects of six core risk factors—openness ratio, protection level, maintenance and repair, building height, ground-floor area, and structural stability—in different configurational combinations. Partial dependence analysis reveals significant nonlinear and threshold effects between these factors and damage probabilities. Building on this, fsQCA further identifies multiple equivalent configuration paths leading to bridge damage, which are categorized into four representative flash flood risk patterns. These findings highlight the distinct nonlinear and configurational characteristics of covered bridge damage mechanisms, demonstrating the applicability and effectiveness of the RF-fsQCA integrated approach in analyzing heritage risk mechanisms of covered bridges under flash flood disasters.
Several limitations of this study should be acknowledged. First, while twelve key risk factors were identified, additional latent variables may still influence flash flood damage processes, such as detailed material mechanical properties, micro-scale structural connections, and high-resolution hydrodynamic parameters at the bridge site. Second, the present study is based on a static risk assessment perspective, whereas flash floods represent highly dynamic and transient processes. The current model cannot fully capture potential transitions in dominant risk configurations under different flood recurrence scenarios, such as “decadal” versus “centennial” extreme events.
Future research should therefore integrate multi-source heterogeneous data to refine variable representation, including the combination of physical flume experiments, high-resolution numerical simulations, and real-time hydrological monitoring. In addition, a dynamic modeling perspective should be incorporated to investigate how flash flood risk configurations of covered bridges evolve across different temporal scales and extreme-event intensities. By embedding high-precision hydrological–hydraulic models into the RF–fsQCA framework, future studies can provide forward-looking decision support for adaptive heritage protection strategies.
The proposed hybrid RF–fsQCA approach and the insights derived from this study can be generalized to other flood-prone regions or areas facing similar structural vulnerability conditions. By optimizing the method with locally relevant variables, it can be applied to other traditional bridges, buildings, and heritage sites exposed to natural hazards. This broad applicability enhances the potential of the RF–fsQCA framework as a scientific decision-support tool for risk assessment and heritage conservation across diverse environmental contexts.
Ultimately, such efforts will contribute to the establishment of a more systematic theoretical framework for the resilience of covered bridge heritage under climate change, while also offering a representative Chinese case to the global field of sustainable heritage conservation.

Author Contributions

Conceptualization, M.Y. and X.X.; methodology, X.X.; software, M.Y.; validation, M.Y. and X.X.; formal analysis, M.Y.; investigation, M.Y.; resources, X.X.; data curation, X.X.; writing—original draft preparation, M.Y.; writing—review and editing, X.X.; visualization, M.Y.; supervision, X.X.; project administration, X.X.; funding acquisition, X.X. All authors have read and agreed to the published version of the manuscript.

Funding

This research was funded by the Key Laboratory of Huizhou Architecture in Anhui Province Project, grant number HPJZ-2023-02; the Key Provincial Teaching and Research Project for Institutions of Higher Education in Anhui Province, grant number 2024jyxm0053; and the University Synergy Innovation Program of Anhui Province, grant number GXXT-2023-082. The APC was funded by the authors.

Data Availability Statement

The data presented in this study are available from the corresponding author upon reasonable request and are not publicly available due to privacy considerations and cultural heritage protection requirements.

Acknowledgments

The authors would like to acknowledge the support provided by the Key Laboratory of Huizhou Architecture in Anhui Province for this research project.

Conflicts of Interest

The authors declare no conflicts of interest.

Appendix A

Figure A1. Field photographs of covered bridges investigated in this study.
Buildings 16 00616 g0a1aBuildings 16 00616 g0a1bBuildings 16 00616 g0a1cBuildings 16 00616 g0a1dBuildings 16 00616 g0a1e

References

  1. Rust, M. Climate-Change Report Points to Rise of Flash Flooding. The Wall Street Journal, 10 August 2021. [Google Scholar]
  2. Hapuarachchi, H.; Wang, Q.; Pagano, T. A review of advances in flash flood forecasting. Hydrol. Process. 2011, 25, 2771–2784. [Google Scholar] [CrossRef]
  3. Paprotny, D.; Sebastian, A.; Morales-Nápoles, O.; Jonkman, S.N. Trends in flood losses in Europe over the past 150 years. Nat. Commun. 2018, 9, 1985. [Google Scholar] [CrossRef] [PubMed]
  4. Scoccimarro, E.; Gualdi, S.; Bellucci, A.; Zampieri, M.; Navarra, A. Heavy precipitation events over the Euro-Mediterranean region in a warmer climate: Results from CMIP5 models. Reg. Environ. Change 2016, 16, 595–602. [Google Scholar] [CrossRef]
  5. Notice on Carrying out the Three-Year Action for Corridor Bridge Protection (Wen Wu Bao Fa [2023] No. 16). Available online: http://www.ncha.gov.cn/art/2023/6/2/art_2318_46154.html (accessed on 28 October 2024).
  6. Leal, M.; Reis, E.; Pereira, S.; Santos, P.P. Physical vulnerability assessment to flash floods using an indicator-based methodology based on building properties and flow parameters. J. Flood Risk Manag. 2021, 14, e12712. [Google Scholar] [CrossRef]
  7. Wang, Q.; Li, S.; Li, R. Evaluating water resource sustainability in Beijing, China: Combining PSR model and matter-element extension method. J. Clean. Prod. 2019, 206, 171–179. [Google Scholar] [CrossRef]
  8. Zhen, Y.; Liu, S.; Zhong, G.; Zhou, Z.; Liang, J.; Zheng, W.; Fang, Q. Risk assessment of flash flood to buildings using an indicator-based methodology: A case study of mountainous rural settlements in Southwest China. Front. Environ. Sci. 2022, 10, 931029. [Google Scholar] [CrossRef]
  9. Papathoma-Köhle, M. Vulnerability curves vs. vulnerability indicators: Application of an indicator-based methodology for debris-flow hazards. Nat. Hazards Earth Syst. Sci. 2016, 16, 1771–1790. [Google Scholar] [CrossRef]
  10. Ji, J.; Chen, J. Urban flood resilience assessment using RAGA-PP and KL-TOPSIS model based on PSR framework: A case study of Jiangsu province, China. Water Sci. Technol. 2022, 86, 3264–3280. [Google Scholar] [CrossRef]
  11. Zheng, C.; Yang, W.; Jiang, X.; Lian, J.; Hu, D.; Yan, X.; Yan, L. A novel integrated Urban flood risk assessment approach coupling GeoDetector-Dematel and clustering method. J. Environ. Manag. 2024, 354, 120308. [Google Scholar] [CrossRef]
  12. Rodríguez Castro, D.; Shahi, K.R.; Sairam, N.; Fischer, M.; Mohor, G.S.; Thieken, A.; Dewals, B.; Kreibich, H. Key Drivers of Flash Flood Damage to Private Households. J. Flood Risk Manag. 2025, 18, e70088. [Google Scholar] [CrossRef]
  13. Sekajugo, J.; Kagoro-Rugunda, G.; Mutyebere, R.; Kabaseke, C.; Mubiru, D.; Kanyiginya, V.; Vranken, L.; Jacobs, L.; Dewitte, O.; Kervyn, M. Exposure and physical vulnerability to geo-hydrological hazards in rural environments: A field-based assessment in East Africa. Int. J. Disaster Risk Reduct. 2024, 102, 104282. [Google Scholar] [CrossRef]
  14. Salazar, L.G.F.; Romão, X.; Figueiredo, R. A Hybrid Approach for the Assessment of Flood Vulnerability of Historic Constructions and Their Contents; Springer Nature: Cham, Switzerland, 2024; pp. 1117–1133. [Google Scholar]
  15. Buka-Vaivade, K.; Nicoletti, V.; Gara, F. Advancing bridge resilience: A review of monitoring technologies for flood-prone infrastructure. Open Res. Eur. 2025, 5, 26. [Google Scholar] [CrossRef] [PubMed]
  16. Loli, M.; Kefalas, G.; Dafis, S.; Mitoulis, S.A.; Schmidt, F. Bridge-specific flood risk assessment of transport networks using GIS and remotely sensed data. Sci. Total Environ. 2022, 850, 157976. [Google Scholar] [CrossRef] [PubMed]
  17. Mazzorana, B.; Simoni, S.; Scherer, C.; Gems, B.; Fuchs, S.; Keiler, M. A physical approach on flood risk vulnerability of buildings. Hydrol. Earth Syst. Sci. 2014, 18, 3817–3836. [Google Scholar] [CrossRef]
  18. Amirebrahimi, S.; Rajabifard, A.; Mendis, P.; Ngo, T. A framework for a microscale flood damage assessment and visualization for a building using BIM–GIS integration. Int. J. Digit. Earth 2016, 9, 363–386. [Google Scholar] [CrossRef]
  19. Müller, A.; Reiter, J.; Weiland, U. Assessment of urban vulnerability towards floods using an indicator-based approach—A case study for Santiago de Chile. Nat. Hazards Earth Syst. Sci. 2011, 11, 2107–2123. [Google Scholar] [CrossRef]
  20. Xu, H.; Ma, C.; Lian, J.; Xu, K.; Chaima, E. Urban flooding risk assessment based on an integrated k-means cluster algorithm and improved entropy weight method in the region of Haikou, China. J. Hydrol. 2018, 563, 975–986. [Google Scholar] [CrossRef]
  21. Yankson, P.W.K.; Owusu, A.B.; Owusu, G.; Boakye-Danquah, J.; Tetteh, D. Assessment of coastal communities’ vulnerability to floods using indicator-based approach: A case study of Greater Accra Metropolitan Area, Ghana. Nat. Hazards 2017, 89, 661–689. [Google Scholar] [CrossRef]
  22. Zhao, G.; Pang, B.; Xu, Z.; Yue, J.; Tu, T. Mapping flood susceptibility in mountainous areas on a national scale in China. Sci. Total Environ. 2018, 615, 1133–1142. [Google Scholar] [CrossRef]
  23. Lee, S.; Kim, J.-C.; Jung, H.-S.; Lee, M.J.; Lee, S. Spatial prediction of flood susceptibility using random-forest and boosted-tree models in Seoul metropolitan city, Korea. Geomatics. Nat. Hazards Risk 2017, 8, 1185–1203. [Google Scholar] [CrossRef]
  24. Chen, W.; Li, Y.; Xue, W.; Shahabi, H.; Li, S.; Hong, H.; Wang, X.; Bian, H.; Zhang, S.; Pradhan, B.; et al. Modeling flood susceptibility using data-driven approaches of naïve Bayes tree, alternating decision tree, and random forest methods. Sci. Total Environ. 2020, 701, 134979. [Google Scholar] [CrossRef]
  25. Wu, D.; Li, T.; Cai, H.; Cai, S. Machine Learning-Based Prediction of Resilience in Green Agricultural Supply Chains: Influencing Factors Analysis and Model Construction. Systems 2025, 13, 615. [Google Scholar] [CrossRef]
  26. Li, Z.; Zhao, Y.; Duan, T.; Dai, J. Configurational patterns for COVID-19 related social media rumor refutation effectiveness enhancement based on machine learning and fsQCA. Inf. Process. Manag. 2023, 60, 103303. [Google Scholar] [CrossRef]
  27. Dall’Osso, F.; Dominey-Howes, D.; Tarbotton, C.; Summerhayes, S.; Withycombe, G. Revision and improvement of the PTVA-3 model for assessing tsunami building vulnerability using “international expert judgment”: Introducing the PTVA-4 model. Nat. Hazards 2016, 83, 1229–1256. [Google Scholar] [CrossRef]
  28. Figueiredo, R.; Romão, X.; Paupério, E. Flood risk assessment of cultural heritage at large spatial scales: Framework and application to mainland Portugal. J. Cult. Herit. 2020, 43, 163–174. [Google Scholar] [CrossRef]
  29. Yihui, D.; Chan, J.C. The East Asian summer monsoon: An overview. Meteorol. Atmos. Phys. 2005, 89, 117–142. [Google Scholar] [CrossRef]
  30. Luo, Y.; Xia, R.; Chan, J.C. Characteristics, physical mechanisms, and prediction of pre-summer rainfall over South China: Research progress during 2008–2019. J. Meteorol. Soc. Japan. Ser. II 2020, 98, 19–42. [Google Scholar] [CrossRef]
  31. What’s the Weather, Huizhou Climate & Monthly Temperature Overview—China. Available online: https://whatstheweather.net/huizhou-climate-monthly-temperature-overview-china/ (accessed on 8 January 2026).
  32. Hallegatte, S.; Green, C.; Nicholls, R.J.; Corfee-Morlot, J. Future flood losses in major coastal cities. Nat. Clim. Change 2013, 3, 802–806. [Google Scholar] [CrossRef]
  33. Breiman, L. Random forests. Mach. Learn. 2001, 45, 5–32. [Google Scholar] [CrossRef]
  34. Li, J. Area under the ROC Curve has the most consistent evaluation for binary classification. PLoS ONE 2024, 19, e0316019. [Google Scholar] [CrossRef]
  35. Woodside, A.G. Moving beyond multiple regression analysis to algorithms: Calling for adoption of a paradigm shift from symmetric to asymmetric thinking in data analysis and crafting theory. J. Bus. Res. 2013, 66, 463–472. [Google Scholar] [CrossRef]
  36. Crespo, N.F.; Rodrigues, R.; Samagaio, A.; Silva, G.M. The adoption of management control systems by start-ups: Internal factors and context as determinants. J. Bus. Res. 2019, 101, 875–884. [Google Scholar] [CrossRef]
  37. Vis, B. The comparative advantages of fsQCA and regression analysis for moderately large-N analyses. Sociol. Methods Res. 2012, 41, 168–198. [Google Scholar] [CrossRef]
  38. Ragin, C.C. Redesigning Social Inquiry: Fuzzy Sets and Beyond; University of Chicago Press: Chicago, IL, USA, 2009. [Google Scholar]
  39. Fiss, P.C. Building Better Causal Theories: A Fuzzy Set Approach to Typologies in Organization Research. Acad. Manag. J. 2011, 54, 393–420. [Google Scholar] [CrossRef]
  40. Schneider, C.Q.; Wagemann, C. Set-Theoretic Methods for the Social Sciences: A Guide to Qualitative Comparative Analysis; Cambridge University Press: Cambridge, UK, 2012. [Google Scholar]
  41. Luo, S.; Zhou, P.; Shen, Y. How can new farmers improve their entrepreneurial performance? Qualitative comparative analysis based on fuzzy sets. Front. Sustain. Food Syst. 2024, 8, 1372250. [Google Scholar] [CrossRef]
  42. Zhu, Z.; Gou, L.; Peng, D.; Pang, B. Quantifying the role of openings in the impact of a dam-break-induced flood on a porous building. J. Hydrol. 2022, 614, 128596. [Google Scholar] [CrossRef]
  43. Zhen, Y.; Fang, Q.; Liu, S.; Zhou, Z.; Zhong, G.; Zhuang, Q.; Liang, J. Exploring the effect of building openings and orientation on induced loads due to extreme flood events. J. Fluids Struct. 2023, 121, 103933. [Google Scholar] [CrossRef]
  44. Drdacky, M.; Binda, L.; Hennen, C.; Köpp, C.; Lanza, L.G.; Helmerich, R. Cultural Heritage Protection Against Flooding; Institute of Theoretical and Applied Mechanics: Prague, Czech Republic, 2011; pp. 1–230. [Google Scholar]
  45. Pham, L.; Palaneeswaran, E.; Stewart, R. Role of maintenance in reducing building vulnerability to extreme events. In Proceedings of the IABSE Symposium 2019 Guimarães Towards a Resilient Built Environment—Risk and Asset Management, Guimaraes, Portugal, 27–29 March 2019. [Google Scholar]
  46. Shrestha, B.B.; Kawasaki, A.; Zin, W.W. Development of flood damage assessment method for residential areas considering various house types for Bago Region of Myanmar. Int. J. Disaster Risk Reduct. 2021, 66, 102602. [Google Scholar] [CrossRef]
  47. Paulik, R.; Wild, A.; Zorn, C.; Wotherspoon, L. Residential building flood damage: Insights on processes and implications for risk assessments. J. Flood Risk Manag. 2022, 15, e12832. [Google Scholar] [CrossRef]
  48. Taramelli Righini, M.; Valentini, E.; Alfieri, L.; Gatti, I.; Gabellani, S. Building-scale flood loss estimation through vulnerability pattern characterization: Application to an urban flood in Milan, Italy. Nat. Hazards Earth Syst. Sci. 2022, 22, 3543–3569. [Google Scholar] [CrossRef]
  49. Tubaldi, E.; White, J.C.; Patelli, E.; Mitoulis, S.A.; de Almeida, G.; Brown, J.; Cranston, M.; Hardman, M.; Koursari, E.; Lamb, R.; et al. Invited perspectives: Challenges and future directions in improving bridge flood resilience. Nat. Hazards Earth Syst. Sci. 2022, 22, 795–812. [Google Scholar] [CrossRef]
  50. Cabanzo, C.M.; Santamaría, M.; Sousa, H.S.; Matos, J.C. In-Plane Fragility and Parametric Analyses of Masonry Arch Bridges Exposed to Flood Hazard Using Surrogate Modeling Techniques. Appl. Sci. 2022, 12, 1886. [Google Scholar] [CrossRef]
  51. Zampieri, P.; Zanini, M.A.; Faleschini, F.; Hofer, L.; Pellegrino, C. Failure analysis of masonry arch bridges subject to local pier scour. Eng. Fail. Anal. 2017, 79, 371–384. [Google Scholar] [CrossRef]
  52. Sielicki, P.W.; Łodygowski, T. Masonry wall behaviour under explosive loading. Eng. Fail. Anal. 2019, 104, 274–291. [Google Scholar] [CrossRef]
  53. Deyazada, M.; Vandoren, B.; Dragan, D.; Degée, H. Experimental investigations on the resistance of masonry walls with AAC thermal break layer. Constr. Build. Mater. 2019, 224, 474–492. [Google Scholar] [CrossRef]
  54. La, R.; Guo, H.; Zhang, W.; Li, L.; He, Z.; Chen, H. Comprehensive disaster risk assessment of historical and cultural heritage: An empirical study based on the improved Pressure-State-Response (PSR) model. Saf. Environ. Eng. 2024, 31, 1–10. [Google Scholar]
  55. Manawasekara, C.; Mizutani, N.; Aoki, S. Influence of Openings and Orientation on Tsunami Generated Forces on Buildings. J. Disaster Res. 2016, 11, 670–679. [Google Scholar] [CrossRef]
  56. Faisal, N.A.A.; Ghani, A.N.A.; Salim, N.A.A. The ability of wall openings to reduce flood induced forces on residential building. GEOMATE J. 2018, 14, 63–69. [Google Scholar]
  57. Huang, L. Taking Multiple Measures to Protect Covered Bridges from Wind and Rain. Guangming Daily, 5 July 2023. [Google Scholar]
Figure 1. Research framework for flood damage analysis of covered bridges based on the PSR model.
Buildings 16 00616 g001
Figure 2. Spatial distribution of mountainous flash flood disasters affecting covered bridges.
Buildings 16 00616 g002
Figure 3. Time distribution of mountainous flash flood disasters in covered bridge.
Buildings 16 00616 g003
Figure 4. Importance ranking of risk factors for bridge damage.
Buildings 16 00616 g004
Figure 5. Nonlinear effect of variables on the probability of flash flood damage.
Buildings 16 00616 g005
Table 1. Overview of 89 Huizhou Covered Bridges.
No.Covered BridgeSiteNo.Covered BridgeSite
1Gaoyang Bridge Xucun Village, Shexian County46Ju’ an Covered BridgeHong Village, Wuyuan County
2Bei’an BridgeShexian County47Zhongcun Covered BridgeDuanshen Township, Wuyuan County
3Deyue BridgeShuizhukeng Village, Shexian County48Rongkun Covered BridgeYuantou Village, Wuyuan County
4Rongshou Covered BridgeShuizhukeng Village, Shexian County49Yaojia BridgeShangwu Village, Wuyuan County
5Shetou Covered BridgeShangfeng Village, Shexian County50Lixin BridgeYantian Village, Wuyuan County
6Huanxiu Covered BridgeChengkan Village, Shexian51Qingyuan Covered BridgeTianwan Village, Qiukou Town, Wuyuan County
7Qingxin Covered BridgeZhanglingshan Area, Shexian 52Jiangbanbian BridgeChengcun Village
8Hong Covered BridgeYansi Town, Huizhou District53Leshou Covered BridgeTunxi District
9Gaoyang BridgeTangmo Village, Huizhou District54Guifu BridgeWangxi Village
10Yuliang Covered BridgeHuizhou District55Wenxing Covered BridgeLiaoyuan Area
11Guanyin Covered BridgeHuizhou District56Longxi BridgeDongkeng Village
12Huiyuan Covered BridgeQimen County57Xinting Covered Bridge
13Anfu Covered BridgeQimen County58Shitan Bridge
14Huacheng BridgeQimen County59Xiangel BridgeGuocun Village
15Gongbei Covered BridgeDiling Village, Xiuning County60Baixi Bridge
16Congtan Covered BridgeXiuning County61Changda Covered BridgeHuangsha Area
17Yunxi Covered BridgeSanxi Area, Xiuning County62Sifeng Covered BridgeKaoshui Area, Wuyuan County
18Yangti Covered BridgeZixi Village, Xiuning County63Xuekeng Covered BridgeRouchuan Area
19Lesheng Covered BridgeShexi Village, Yixian County64Rongxi Bridge
20Xiating Covered BridgePingshan Village, Yixian County65Gaodao BridgeHuangcun Village
21Lingyang BridgeYixian County66Xinfu Covered BridgeQiankou Town
22Qinghong Covered BridgeHu Family Area, Jixi County67Zhenyou Covered BridgeZhuangyuan Town
23Wanshan BridgeJixi County68Taoyuan Covered Bridge
24Rainbow BridgeQinghua Town, Wuyuan County69Shuikou Covered BridgeBaishiyuan Area
25Dafu BridgeTuochuan Village, Wuyuan County70Maolin Covered BridgeYoushan Village
26Linqing BridgeShibao Village, Wuyuan County71Shenming Covered BridgeLikeng Village
27Tizhu BridgeYoushan Village, Wuyuan County72Rulin BridgeYancun Village
28Shuikou BridgeZhou Village, Gutan Town, Wuyuan County73Chongnian BridgeXiaoxiqi Village
29Covered Bridge, Huanggangmiao VillageWuyuan County74Shuikou Covered BridgeXianwangtan Area
30Zhucun BridgeWuyuan County75Cifu Covered BridgeWangkou Village
31Caixia Covered BridgeWuyuan County76Xingyang Covered BridgeKongcun Village
32Tongji Covered Bridge Sixi Village, Wuyuan County77Jiangjia Covered Bridge
33Huaqiao Covered BridgeJialu Town, Wuyuan County78Jingxiu Bridge
34Jifang BridgeYanqian Village, Wuyuan County79Jiujian Covered BridgeYouting Village
35Zhongshu Covered BridgeLikeng Village, Wuyuan County80Zhongxiu Covered BridgeShichun Area
36Shuikou Covered BridgeHe Village, Wuyuan County81Nanyuan Bridge
37Fuqing Covered BridgeQingyuan Village, Wuyuan County82Ningxiu BridgeZhankeng Village
38Luoxi Covered BridgeHeshantan Area, Wuyuan County83Wenyu BridgeLuocun Village
39Dongxi Covered BridgeLi Village, Wuyuan County84Ningxiu Bridge
40Yuhou BridgeQiuxi Village, Wuyuan County85Ren’an BridgeXixiang Village
41Likeng Covered BridgeLiyuan Town, Wuyuan County86Shuanghe Covered BridgeQinghua Town
42Covered Bridge, Jujing VillageWuyuan County87Yongde BridgeGaoshe Village
43Fengxi BridgeFenshui Town, Wuyuan County88Henan BridgeLongshan Area
44Weixin Covered BridgeYuanyuan Village, Kaoshui Area, Wuyuan 89Baiyun Covered BridgeShanjiao Village
45Yingen Covered BridgeYaowan Village, Wuyuan County
Note: “—” indicates that detailed site information was not explicitly recorded in the field survey.
Table 2. Definition of risk factors related to flash flood damage.
DimensionRisk FactorData SourcesDescription
ExposureTopographic sheltering ( T S ) Field investigation(1) The upper and lower water outlets of the village
(2) outside the main residential area of the village
(3) Transportation node within the village
Foundation relative elevation ( E R ) UAV and remote sensing imagery (DJI Technology Co., Ltd., Shenzhen, China) E R   =   R E -   B E ; R E is the average elevation of the river bank; B E is the average elevation of the covered bridges’ foundation.
Inundation depth ( H I )   Surveying and mapping calculationsSurface flood height
Building height ( B H ) Surveying and mapping calculationsDistance between the outer skin of the roof structure and the bridge floor
Openness ratio ( O R )   Surveying and mapping calculations O R   = H A   /   F A ; H A is the area of openings in the elevation;   F A is the total elevation area.
Facade morphology   ( F K ) Field investigation(1) open (2) semi-closed (3) closed
VulnerabilityStructural stability ( S S ) Field investigation(1) Timber beam bridge with timber roof truss
(2) Timber beam bridge with brick–timber roof truss
(3) Stone beam bridge with timber roof truss
(4) Stone beam bridge with brick–wood roof truss
(5) Stone arch bridge with timber roof truss
(6) Stone arch bridge with brick–timber roof truss
Ground-floor area   ( A R ) Surveying and mapping calculations A R = L F   ×   W F ; L F is the front width of the ground-floor; W F is the depth of the ground-floor
Year of construction   ( C D ) Local chronicles and genealogical records(1) Song dynasty (2) Yuan dynasty
(3) Ming dynasty (4) Qing dynasty
Protection level ( I A ) Publicly available government data(1) Not listed as cultural heritage sites
(2) Municipal and county-level cultural heritage sites
(3) Provincial Cultural Heritage Site
(4) National Key Cultural Heritage Site
Maintenance and repair ( R S )Field investigation(1) Irregular maintenance
(2) Regular maintenance
Usage status ( U S ) Field investigation(1) Provide service functions
(2) Do not provide service functions
Note: E R , H I , and B H are measured in meters (m); A R in square meters (m2); O R is dimensionless. All categorical variables ( T S , F K , S S , C D , I A , R S and U S ) are ordinal codes without physical units.
Table 3. Descriptive statistics of risk factors.
VariableTypeMean (SD)
/N (%)
Q1Q2Q3
Topographic shelteringCategorical116 (100.0%)
-
Outside the main residential area of the village (1)
38 (32.8%)
-
The upper and lower water outlets of the village (2)
31 (26.7%)
-
Transportation nodes within the village (3)
47 (40.5%)
Foundation relative elevationContinuous1.318 (1.063)0.2200.9505.460
Inundation depthContinuous2.603 (1.208)0.6202.4406.320
Building heightContinuous5.031 (1.723)2.6404.64512.610
Openness ratioContinuous0.693 (0.338)0.1100.8351.000
Facade morphologyCategorical116 (100.0%)
-
Open (1)
53 (45.7%)
-
Semi-closed (2)
28 (24.1%)
-
Closed (3)
35 (30.2%)
Structural stabilityCategorical116 (100.0%)
-
Timber beam bridge with timber roof truss (1)
13 (11.2%)
-
Timber beam bridge with brick–timber roof truss (2)
13 (11.2%)
-
Stone beam bridge with timber roof truss (3)
5 (4.3%)
-
Stone beam bridge with brick–wood roof truss (4)
6 (5.2%)
-
Stone arch bridge with timber roof truss (5)
36 (31.0%)
-
Stone arch bridge with brick–timber roof truss (6)
43 (37.1%)
Ground-floor areaContinuous75.260 (76.370)6.28058.430480.26
Year of constructionCategorical116 (100.0%)
-
Song dynasty (1)
9 (7.8%)
-
Yuan dynasty (2)
3 (2.6%)
-
Ming dynasty (3)
46 (39.7%)
-
Qing dynasty (4)
58 (50.0%)
Protection levelCategorical116 (100.0%)
-
Not listed as cultural heritage sites (1)
62 (53.4%)
-
Municipal and county-level cultural heritage sites (2)
40 (34.5%)
-
Provincial Cultural Heritage Site (3)
6 (5.2%)
-
National Key Cultural Heritage Site (4)
8 (6.9%)
Maintenance and repairCategorical116 (100.0%)
-
Regular maintenance (1)
71 (61.2%)
-
Irregular maintenance (2)
45 (38.8%)
Usage statusCategorical116 (100.0%)
-
Provide service functions (1)
88 (75.9%)
-
Do not provide service functions (2)
28 (24.1%)
Note: N = 116. For categorical variables, numerical values (e.g., 1, 2, 3) are used only as coding labels.
Table 4. Hyperparameter Settings and Optimization Results of RF Model.
ModelDescriptionSearch SpaceOptimal Value
n_estimatorsNumber of trees in the forest[50, 100, 200, 300]100
max_depthMaximum depth of the tree[3, 5, 10, None]10
min_samples_splitMinimum samples required to split an internal node[2, 5, 10]5
min_samples_leafMinimum samples required to be at a leaf node[1, 2, 4]4
class_weightWeights associated with classes[‘balanced’, None]‘balanced’
max_featuresNumber of features to consider when looking for the best split[‘sqrt’, ‘log2’, None]‘sqrt’
Table 5. Necessity analysis of single condition.
Test ConditionDamagedUndamaged
ConsistencyCoverageConsistencyCoverage
Openness ratio0.6335680.9843850.3708110.107121
~Openness ratio0.4253270.7842840.9459460.324314
Protection level0.2092460.7745540.6464870.444941
~Protection level0.8500510.9282270.6724330.136523
Building height0.4488440.8264250.8064880.276092
~Building height0.6068350.9440270.4929740.142589
Structural stability0.7039200.8590700.9400000.213296
~Structural stability0.3553770.9695640.3789200.192213
Maintenance and repair0.3939700.8132780.8054060.309129
~Maintenance and repair0.6653270.9484240.5135140.136103
Ground-floor area0.4455280.8127980.8535140.289513
~Ground-floor area0.6105530.9572960.4481090.130634
Note: N = 116. For categorical variables, numerical values (e.g., 1, 2, 3) are used only as coding labels. The symbol “~” represents the logical negation (absence) of a condition.
Table 6. Results of the preconditions configuration.
The Results of the Damage to the Covered Bridge
Configuration 1Configuration 2Configuration 3Configuration 4Configuration 5Configuration 6Configuration 7Configuration 8
Openness ratio////
Protection level//
Building height///
Structural stability///
Maintenance and repair/
Ground-floor area/
Raw coverage0.34500.20950.21370.19590.19640.21580.14910.1026
Unique coverage0.12830.00320.00710.08060.01550.01660.01210.0257
Consistency0.97450.90340.90970.95540.99490.95591.00000.9240
Solution coverage0.6597
Solution consistency0.9353
Note: “●”: Core existence condition; “•”: Auxiliary existence condition; “○”: Core absence condition; “◎”: Auxiliary absence condition; “/”: Condition that may or may not exist.
Disclaimer/Publisher’s Note: The statements, opinions and data contained in all publications are solely those of the individual author(s) and contributor(s) and not of MDPI and/or the editor(s). MDPI and/or the editor(s) disclaim responsibility for any injury to people or property resulting from any ideas, methods, instructions or products referred to in the content.