Article

Application of Multi-Ribbed Composite Wall Structure in Rural Housing: Seismic, Carbon Emissions, and Cost Analyses


1
Architects & Engineers Co., Ltd., Southeast University, Nanjing 210096, China
2
Power China Shanghai Electric Power Engineering Co., Ltd., Shanghai 200025, China
3
School of Architecture & Design, China University of Mining and Technology, Xuzhou 221116, China
4
School of Architecture, Southeast University, Nanjing 210096, China
5
School of Art, Nantong University, Nantong 226019, China
6
The Bartlett School of Sustainable Construction, University College London, London WC1E 7HB, UK
7
Kunshan Ecological House Construction Technology Co., Ltd., Suzhou 215000, China
*
Author to whom correspondence should be addressed.
Buildings 2026, 16(2), 465; https://doi.org/10.3390/buildings16020465
Submission received: 5 December 2025 / Revised: 8 January 2026 / Accepted: 19 January 2026 / Published: 22 January 2026

Abstract

Sustainable development is crucial worldwide. Under the Paris Agreement, countries commit to Nationally Determined Contributions (NDCs) assessed every five years. China, a major contributor to global warming, has made significant efforts to reduce carbon emissions and achieve carbon neutrality, a key strategy for sustainable development. However, there is a lack of adequate attention to embodied emission reduction in rural residential construction, despite a surge in building to improve living standards. This paper evaluated the feasibility of applying a multi-ribbed composite wall structure (MRCWS) in rural China through a village service project. A full-scale shaking table test was conducted to study its seismic performance. Carbon emissions were analyzed using process-based life cycle assessment (P-LCA) and the emission-factor approach (EFA), while costs were estimated using life cycle costing (LCC) and the direct cost method (DCM). These analyses focused on sub-projects and specific structural members to validate the superiority of this prefabricated structure over common brick masonry. MRCWS blocks were prefabricated by mixing wheat straw with aerocrete, utilizing agricultural by-products from local farmlands, thus reducing both construction-related carbon emissions and agricultural waste treatment costs. Results show that this novel precast masonry structure exhibits strong seismic resistance, complying with fortification limitations. Its application can reduce embodied carbon emissions and costs by approximately 6% and 10%, respectively, during materialization phases compared to common brick masonry. This new prefabricated building product has significant potential for reducing carbon emissions and costs in rural housing construction while meeting seismic requirements. The recycling of agricultural waste highlights its adaptability, especially in rural areas.

1. Introduction

Urbanization is one of the major social changes all over the world, and is directly related to urban areas’ expansion, growth of rural and urban populations, and migration [1]. Statistically, the overall urbanization rate of developed countries is more than 75% while some countries, such as the United States, Australia, and South Korea, reached between 83% and 88% in 2018 [2,3]. Since the reform and opening-up policy of 1978, China has been experiencing an unprecedented process of urbanization, and the urbanized population has grown from 17.9% in 1978 to 50% by 2020 [4].
However, the rapid urbanization and economic development have inevitably caused many problems concerning the environment, society, and governance, such as social inequalities, land scarcity, and climate change, each of which has negative impacts on the sustainable development of cities. There are a variety of distinctive features of China’s urbanization compared to other countries, which can be simply summarized as the comparatively high rate of urbanization, a growing urban–rural income gap, and unbalanced economic structure of cities [1,5]. A more balanced approach to urban policy interventions is highly recommended in the context of realizing sustainable development [6].
At present, the development of both rural and urban areas in China is experiencing a social and economic transition period. To some extent, the processes of industrialization and urbanization have impelled huge sacrifices for agriculture and the countryside [7].
Great strides can be attained in the development of the countryside and coordination of urban and rural development, if the industrialization and urbanization of a country are to reach a certain stage, via enactment of various favorable policies. Many such attempts have been made by both Western and Asian developed countries. In 1995, the United Kingdom’s government published a major assessment of rural policy, referred to as the Rural White Paper (RWP), to present major statements on a wide range of issues relating to rural areas, from agriculture to housing [7,8]. Saemaul Undong, or the New Community Movement, was initiated to raise incomes and improve living standards in rural areas in South Korea in the early 1970s, thus narrowing the urban–rural divide in the long term [9].
Due to the unprecedented development of the economy and improvement of its international status, it is possible for industries to support agriculture and for cities to support the countryside in China. Considering the widening income gap between rural and urban populations, as well as concerns related to farmers, agriculture, and rural areas, an important long-term development strategy of ‘building a new countryside’ was put forward. In the integrated rural policy, a ‘new countryside’ refers to advanced production, improved livelihood, clean and tidy villages, a civilized social atmosphere, and efficient management [10].
For many rural residents, houses are basic fixed assets and the major family property. Admittedly, housing provision in the countryside, which fell behind that in urban areas, has been an overlooked issue for a long time during the process of development [11]. According to the national strategy, ‘building a new socialist countryside,’ ‘improved livelihood,’ and ‘clean and tidy villages’ target constructing rural residences of higher qualities under the guidance of scientific village plans. Considering the income gap and the shortage of sophisticated technologies and tools, rural construction cannot directly follow the path of cities. In other words, rural housing ought to meet the requirements of high quality and comparatively low cost simultaneously. Moreover, carbon emissions should also be taken into account. As the architecture, engineering, and construction (AEC) industry has been identified as one of the largest carbon emission sources, low-carbon rural housing is definitely one effective way to cope with climate change and energy consumption [12].
This article aims to propose a new type of application of a combination of resource-saving and environmentally friendly features, local adaptive technology, and affordable cost. Firstly, shaking table testing was conducted to investigate the seismic performance of the structure and verify that the prototype building can be put in use safely. Then, embodied carbon emission analysis assessed how the use of precast aerocrete blocks mixed with straw particles can reduce the greenhouse gas production. Finally, cost estimation looked at economic efficiency to evaluate the potential of reducing construction costs in prefabricated masonry structures compared to normal brick masonry structures.

2. Literature Review

2.1. Rural Residential Construction

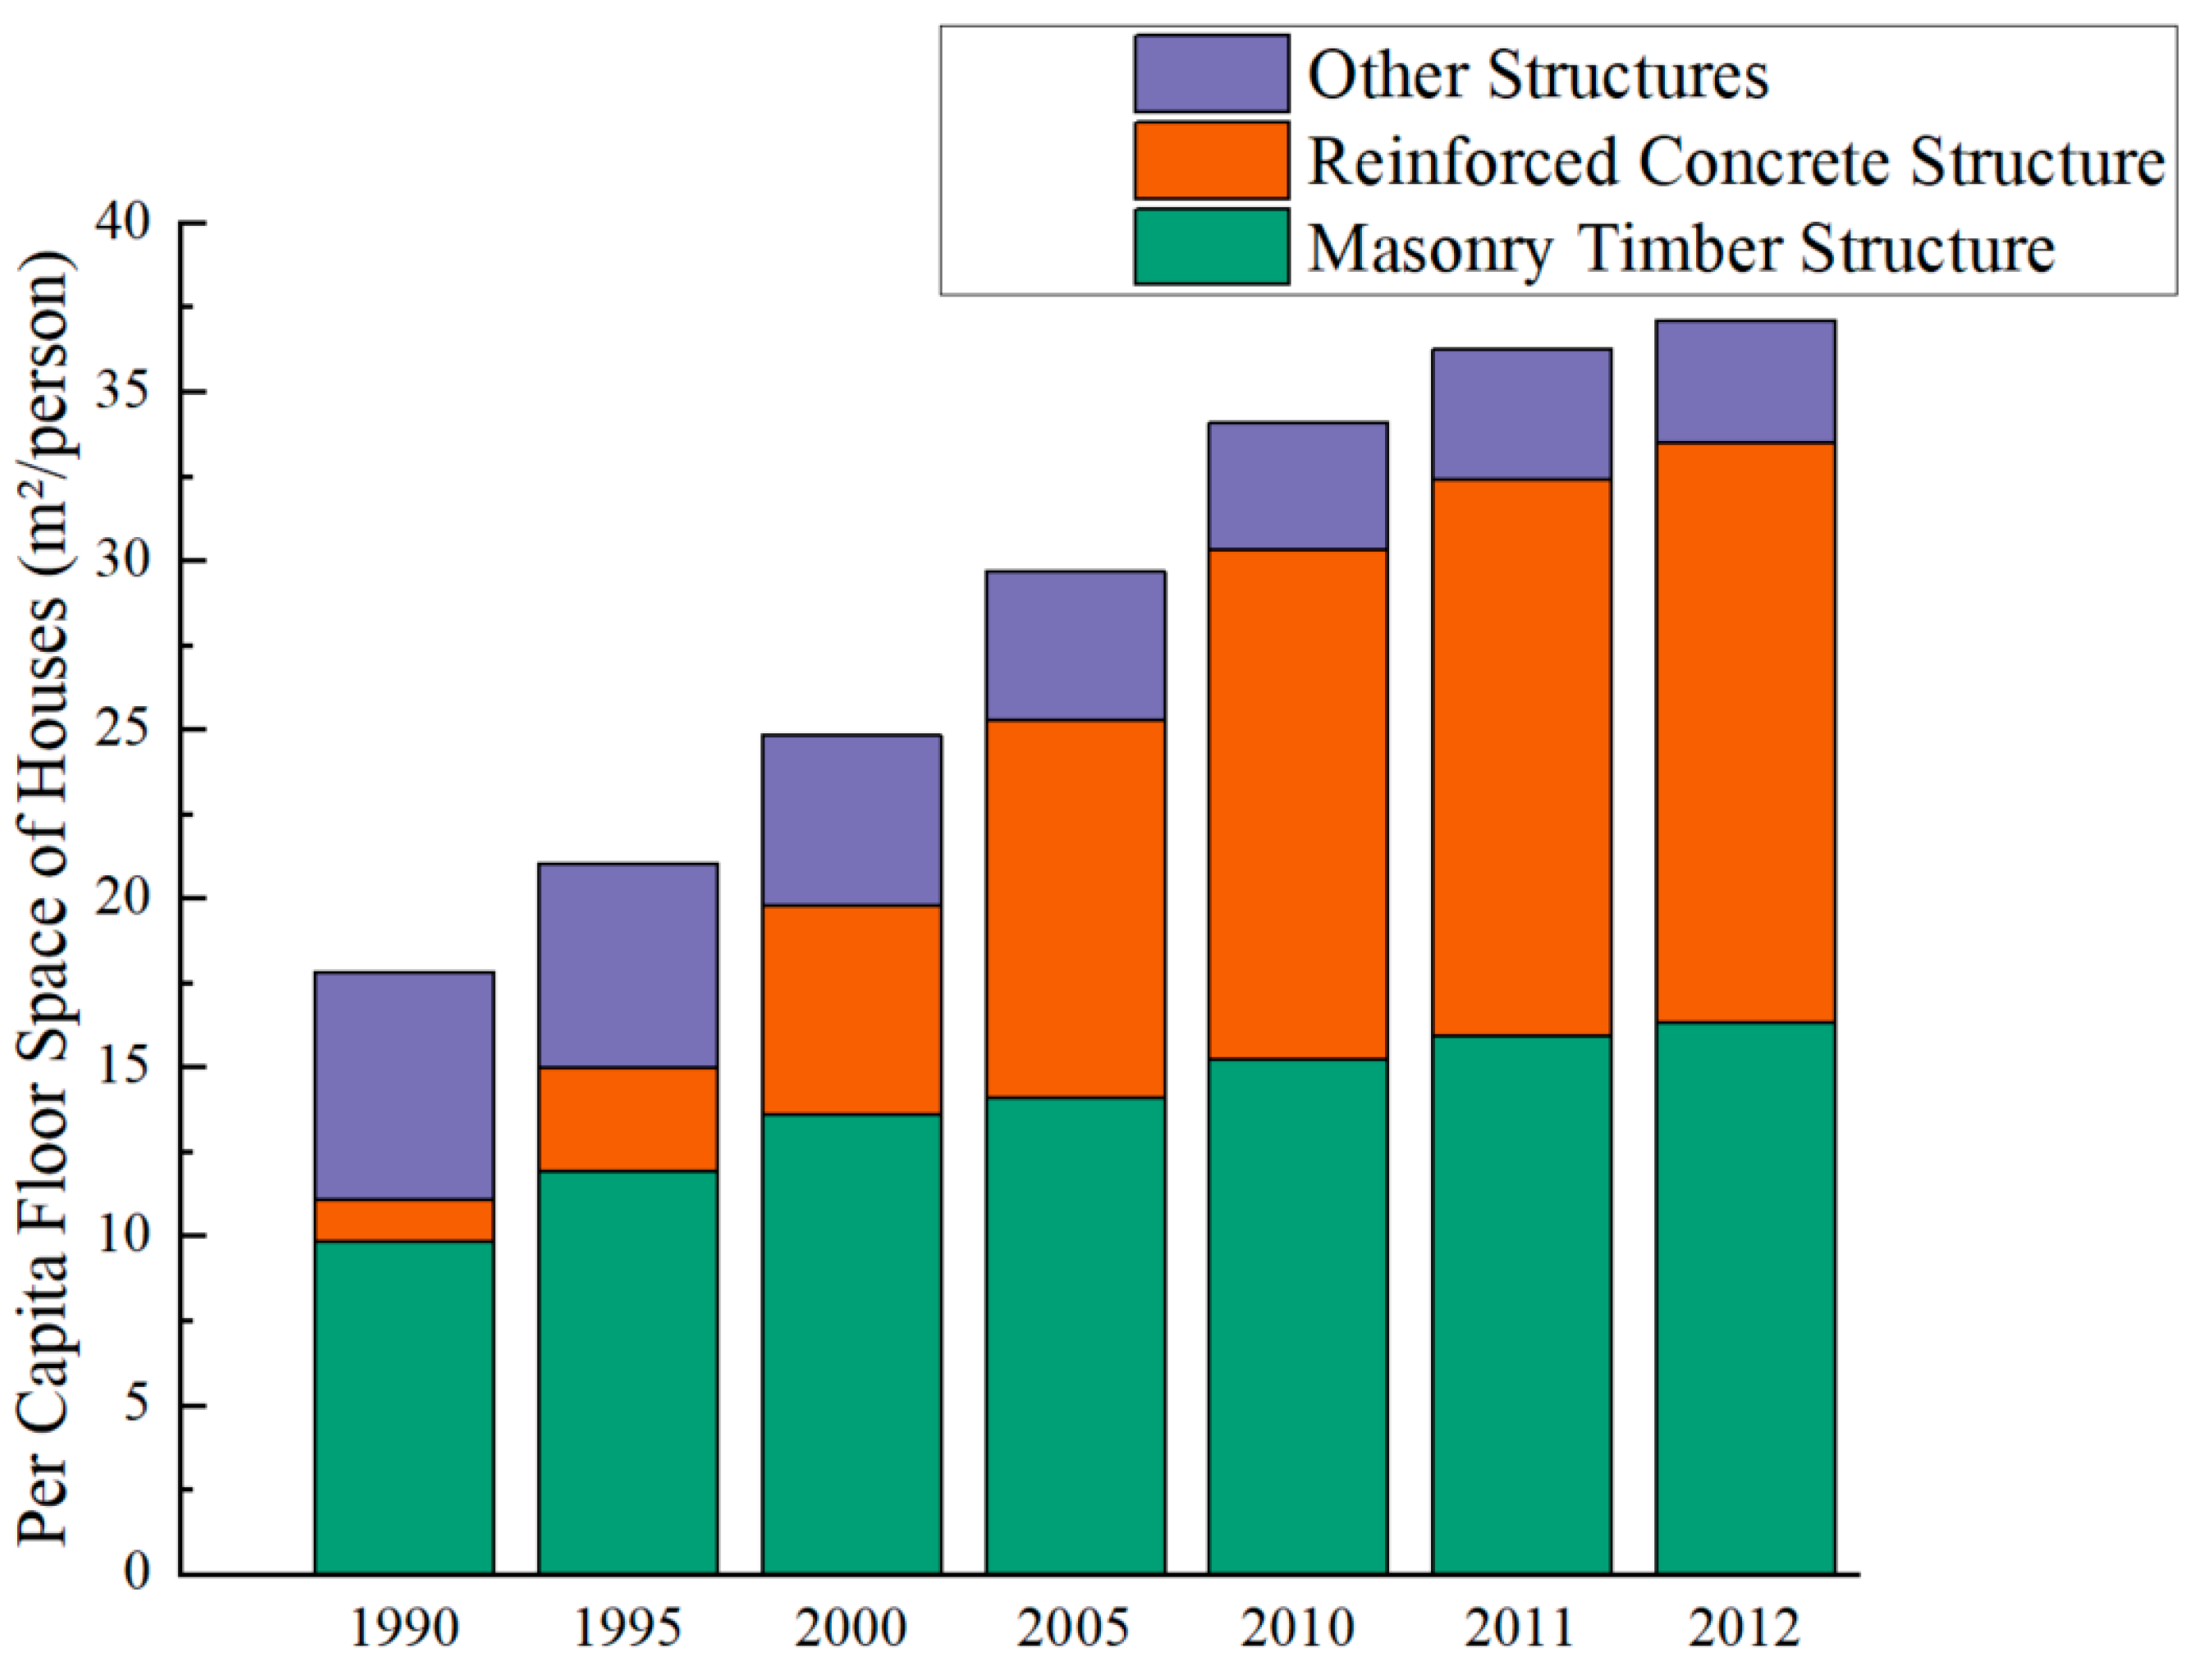
In China, rural housing is interrelated in many aspects, including migration, employment, land use, energy consumption, and the natural environment [10]. As illustrated in Figure 1, the living space per capita of rural residents has gradually increased since the 1990s. Additionally, among all types of housing structures, masonry timber structure and reinforced concrete structures make up the major shares [13].
According to an investigation concerning the construction materials used in rural China, brick and wood represent approximately 47.38%, making them the most common materials [15]. In masonry timber structures, the vertical components such as load-bearing walls and columns are made of brick masonry, while the floor slabs and roof trusses are wood. Despite simple construction technology and low cost, its significant disadvantages are poor earthquake resistance and poor durability [16]. The horizonal strength of brick walls is much lower than their vertical strength, and therefore bearing walls show poor shear strength and deformation performance when encountering horizontal seismic loading [17]. Additionally, there is a shortage of forest resources in China [18], and the fire resistance of timber frames is always a thorny issue. Moreover, clay bricks have been forbidden by the government due to environmental impact considerations. Thus, fewer brick wood structures have been constructed in recent years among newly built rural dwellings, and they are likely to be excluded from the mainstream structure types in the future.
Reinforced concrete structures (RCSs) are widely used in China at present due to their high load-bearing capacity and comprehensive performance [16]. However, high labor costs, waste of resources and pollution of the environment are noteworthy issues at this time. Concrete is extensively used all over the world with an annual production of more than 10 billion tons, which has made it by far the most important building material in the construction industry [19]. With the ever-increasing population growth, urbanization, and industrialization, there will be undoubtfully be a considerable increase in the demand for cement and concrete, which will correspondingly consume vast amounts of natural resources [20]. It is implied that traditional reinforcement concrete structures appear to be not particularly compatible with the requirements of sustainable development and do not correspond to local income levels in rural China owing to the relatively high construction cost. Therefore, RCSs may not be the optimal choice for rural housing despite their wide application at present.

2.2. Seismic Performance of Structures (Structural Stability)

Seismic failure is closely related to highly nonlinear deformation as well as continuous damage accumulation in structures [21]. The substructure shaking table can be controlled via the input of seismic waves to imitate the Earth’s vibration so as to simulate undesirable structural vibration induced by earthquakes [22]. Then, the dynamic responses of superstructure will be investigated, and the main outcomes include acceleration amplification factors along the building heights, story drift ratios at different performance levels, damage evolution, and displacement curves as the intensities of earthquakes increase [23].
Shaking table tests can be conducted based on different model scales. In some cases, prototype structures were subjects of research. For instance, a full-scale seven-story reinforced concrete shear wall was set as the specimen to simulate the nonlinear seismic responses under four representing excitation waves of increasing intensities. Additionally, scaled model tests have been undertaken over the years, which are especially feasible for high-rise buildings at relatively lower experimental costs. A 1/50 scaled model of the Shanghai World Financial Center Tower was made to verify its structural stability under one- and two-dimensional seismic waves of growing acceleration amplitudes. Based on the visible damage of the tested model, the weak locations under rarely-occurred earthquakes were found, and some corresponding recommendations for structural seismic fortification could be proposed [24]. It is worth noting that different miniature ratios may have varying degrees of impacts on investigation outcomes of seismic behaviors.
Rural houses, characterized by low story heights, high stiffness, and limited budgets, have suffered severe damage from both historical and recent earthquakes worldwide [25]. Widely employed in rural areas globally, rammed-earth dwellings, and brick masonry structures are vulnerable to earthquakes due to their poor mechanical properties and weak seismic resistance [26]. Shaking table tests were conducted to study the seismic performance of existing buildings in rural areas, especially in high seismic fortification zones. For structures that fail to meet the appraisal requirements, actions must be taken to strengthen existing buildings so that they can withstand potential earthquake forces [27]. Recently, a new fully fabricated concrete grating composite wall structure (FFCGCWS) has been proposed in order to promote the adoption of prefabricated concrete structures in rural residential areas and a shaking table test was carried out to investigate the seismic performance of the FFCGCWS [28].

2.3. Environment Impact

2.3.1. Building Carbon Emissions

The construction industry contributes to 37% of carbon emissions, with global carbon emissions reaching 32 billion tons in 2020 [29]. Generally, carbon emissions can be categorized as embodied carbon and operational carbon. Embodied carbon relates to the carbon emissions required for the processes associated with construction, including the energy needed for acquiring natural resources, manufacturing materials, and transportation [30]. Operational carbon consists of the carbon emissions generated by a building over its lifetime, including those generated by maintaining the indoor environment through processes such as heating, cooling, and lighting [31].
In recent years, considerable efforts have been undertaken to promote energy-efficient designs in buildings, such as enhanced thermal insulation, windows with better performance, infiltration losses reduction, and even heat recovery from air ventilation and water drainage [32]. All of the above improvements can greatly reduce operational carbon emissions. Recent studies have demonstrated that embodied energy makes up a growing share of total life cycle energy, especially with the increasing constructions of energy-efficient buildings [32,33,34,35].Therefore, more attention ought to be paid to the assessment of embodied carbon emissions. It has been concluded that lower embodied carbon is emitted by wood framed buildings than concrete structures, based on case studies [36]. Admittedly, the materialization stage is a significant contributor to greenhouse gas emissions, as the cement industry alone represents about 7% of worldwide carbon dioxide generation [20]. Low-carbon materials, such as biomass building materials (e.g., straw bales, stalks, etc.), can considerably decrease embedded carbon emissions [37,38]. Some scholars have looked at embodied carbon emission of various construction methods and compared off-site prefabrication and conventional cast in situ construction methods [39,40].
Life cycle assessment (LCA) is a standardized methodology commonly used to outline how various types of environmental impacts accumulate over the different life cycle stages and elements of a system, which can quantify carbon emissions over the whole life cycle of the building [41]. There exist three primary models: process-based LCA (P-LCA), input–output LCA (I-O LCA), and hybrid LCA, which is a combination of P-LCA and I-O LCA [42]. Process-based assessment is a bottom-up approach that identifies the detailed emissions in specific processes of building construction [43]. Several studies have utilized this bottom-up method to evaluate carbon emissions of individual buildings at the micro level [44,45,46]. However, there exist truncation errors due to the system boundaries definition which might cut off supply chain activities [47]. Conversely, as a top-down method, an input–output analysis can estimate the emissions from the complete supply chain and eliminate truncation errors [48]. But this approach only considers typical input–output processes [43]. H-LCA combines the advantages of the aforementioned two models, so that it has complete boundaries and produces reliable results. However, it requires a large amount of data and high computational complexity. Thus, the selection and application of LCA models rely on the costs, time, data availability, and reliability requirements of the results [42].
Currently, the whole world is confronted with continuous climate change, and China has been among the largest contributors to global carbon emissions and energy consumption [49]. For the aspect of tackling climate change, China mainly focuses on urban areas, transport, and industrial energy needs. Little attention has been paid to rural domestic energy consumption, which is an important factor in climate change mitigation and energy security as well [11]. Therefore, it is necessary to carry out research on the carbon emissions of rural housing construction.

2.3.2. Waste Control

In rural areas, abundant agricultural wastes are discharged, and the solid material disposal is posing serious environmental issues. Agricultural wastes are usually burnt or dumped outdoors, causing soil, water, and air pollution [50,51]. These wastes can be used as supplementary cementitious materials or potential alternatives to thermal insulation in the construction industry to minimize the negative environment impacts of concrete production and agricultural waste disposal at the same time [52]. Additionally, it can reduce not only the usage of raw materials but the cost of construction materials [53], which will definitely give this reuse approach a promising future.
Recent studies have investigated the possible use of agricultural solid wastes as aggregates in structural and non-structural concrete, among which are oil palm shell, rice husk ash, coconut shell, corn cob, etc. [19]. Oil palm shell and coconut shell have been proven to be reliable resources of aggregates to produce lightweight concrete with satisfactory mechanical properties, while rice husk ash and corn cob can be suitable thermal insulation materials with relatively lower thermal conductivities [54,55,56,57]. The detailed usages of various agricultural wastes are listed in Table 1. China’s total output of agricultural products such as wheat, rice, and so on is far ahead in the global rankings. Concerning the environment impacts, reasonable treatment should be applied to tackle the disposal of by-products of crops such as straw stalk, instead of burning them directly in the field [58]. Straw bricks can be used as thermal insulation to reduce heat loss effectively, which is extremely suitable for northern rural areas in China to cut down the carbon emission resulting from heating supplies [58].
Utilization of recycled agricultural wastes is desirable for sustainability goals in rural construction because of their wide availability in the countryside, which is a great demonstration of adaptive construction catering to the local conditions. However, most of relevant researches focus on material properties and are restricted to experimental levels. Few investigations have put agricultural wastes into practical construction and construction products. Recycling of theses wastes in engineering practice can not only tackle solid wastes during the process of local agricultural production but also prevent the excessive usage of raw materials. In the long term, using agricultural waste as aggregate in the concrete production will make the material, and eventually the structure, more environmentally friendly, which is a favorable combination of economic and environmental benefits.
Another concern regarding the use of agricultural waste in construction projects is the uncertainty surrounding its structural performance and durability. However, studies have shown that straw bale walls exhibit good durability in temperate maritime climates [59]. Research by Muhammad Usman Farooqi demonstrated that naturally weathered, optimized straw-reinforced concrete matrix retains 108% residual toughness, indicating that wheat straw-reinforced concrete possesses durable behavior suitable for civil structures [60]. Furthermore, the study by Gratien Kiki noted that while the addition of straw somewhat reduces the abrasion and erosion resistance of compressed earth blocks (CEBs), these properties remain sufficient to permit the use of such blocks in the construction of sustainable buildings [61,62,63,64].

3. Methodology

Seismic surveys in China indicate that a large number of rural houses are built without formal regulatory design, posing significant collapse risks during earthquakes, which can lead to heavy casualties and property losses [65]. In recent years, relevant management regulations have been introduced to guide the standardized development of rural housing construction [66]. However, current standards for rural housing mainly follow those of urban construction systems, lacking a housing construction framework and specifications truly suitable for rural contexts.
To align with the practical needs of rural construction, the multi-ribbed composite wall structure (MRCWS) was developed based on core principles including industrialized production, low demand for on-site machinery and skilled labor, environmental friendliness, and cost control. This construction method is designed to minimize on-site skill requirements, streamline construction processes, and reduce the demand for a large workforce.
The research team has previously published findings in areas such as rural housing design and construction [67], industrialized production and assembly [29], and building energy efficiency [68]. This paper discusses the MRCWS from three key perspectives: structural safety, embodied carbon emissions, and cost control. As a novel structural system, MRCWS cannot be fully evaluated using existing domestic codes. Therefore, shaking table tests were conducted in this study to verify its structural safety and reliability.
Owing to the lack of documented construction characteristics or application cases for FFCGCWS in the relevant literature [28], an analysis of its on-site installation labor intensity and machinery dependency is precluded in this study. The FFCGCWS system utilizes factory prefabrication for its primary load-bearing elements, with its performance evaluated through comparative analysis using mechanical models. In contrast, the MRCWS integrates factory prefabrication for both internal steel reinforcement components of the load-bearing structure and non-load-bearing foamed concrete infill modules.

3.1. Seismic Performance Evaluation

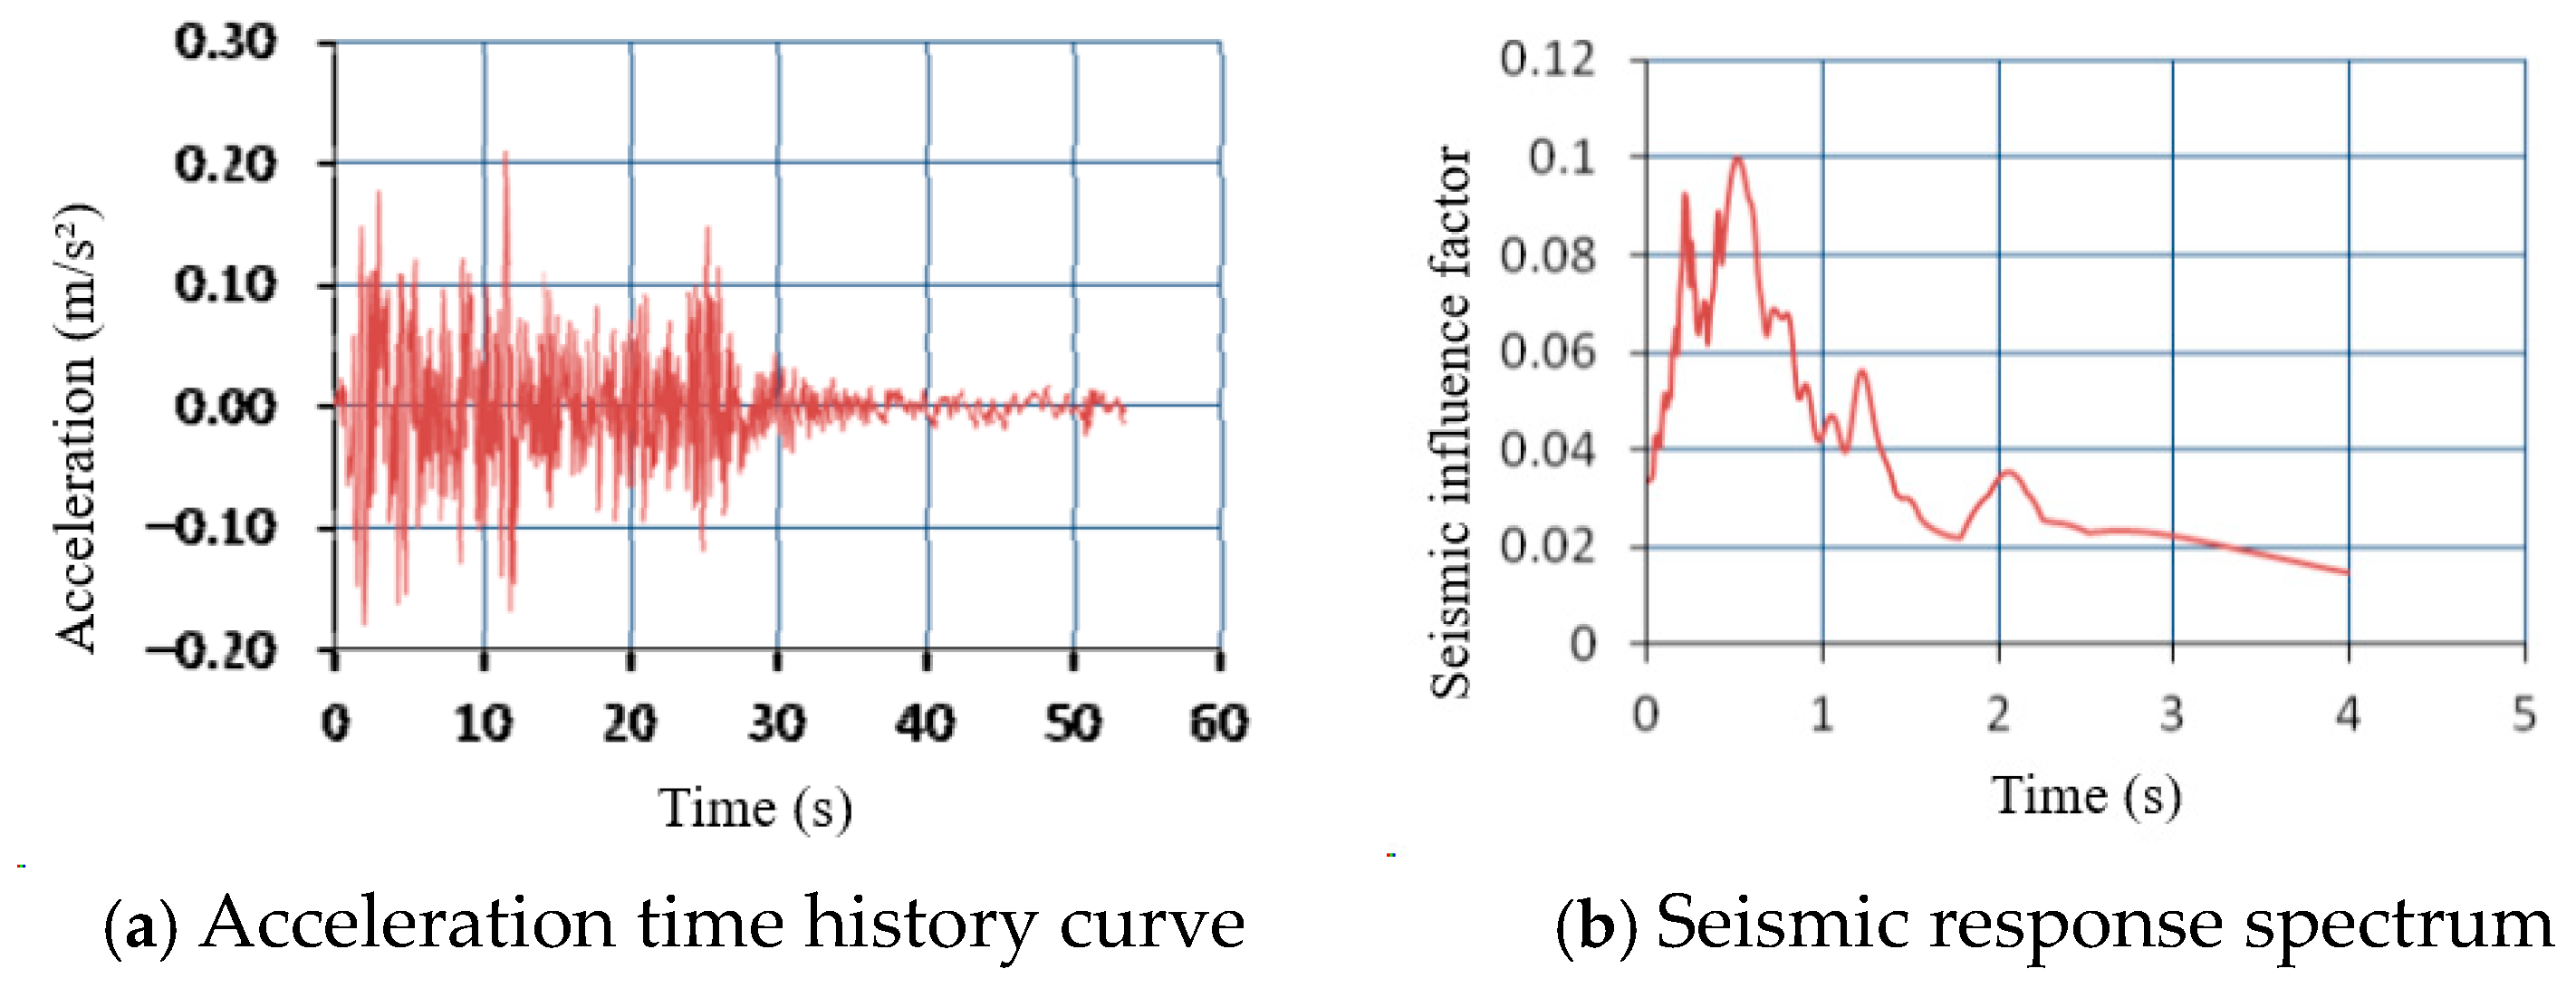
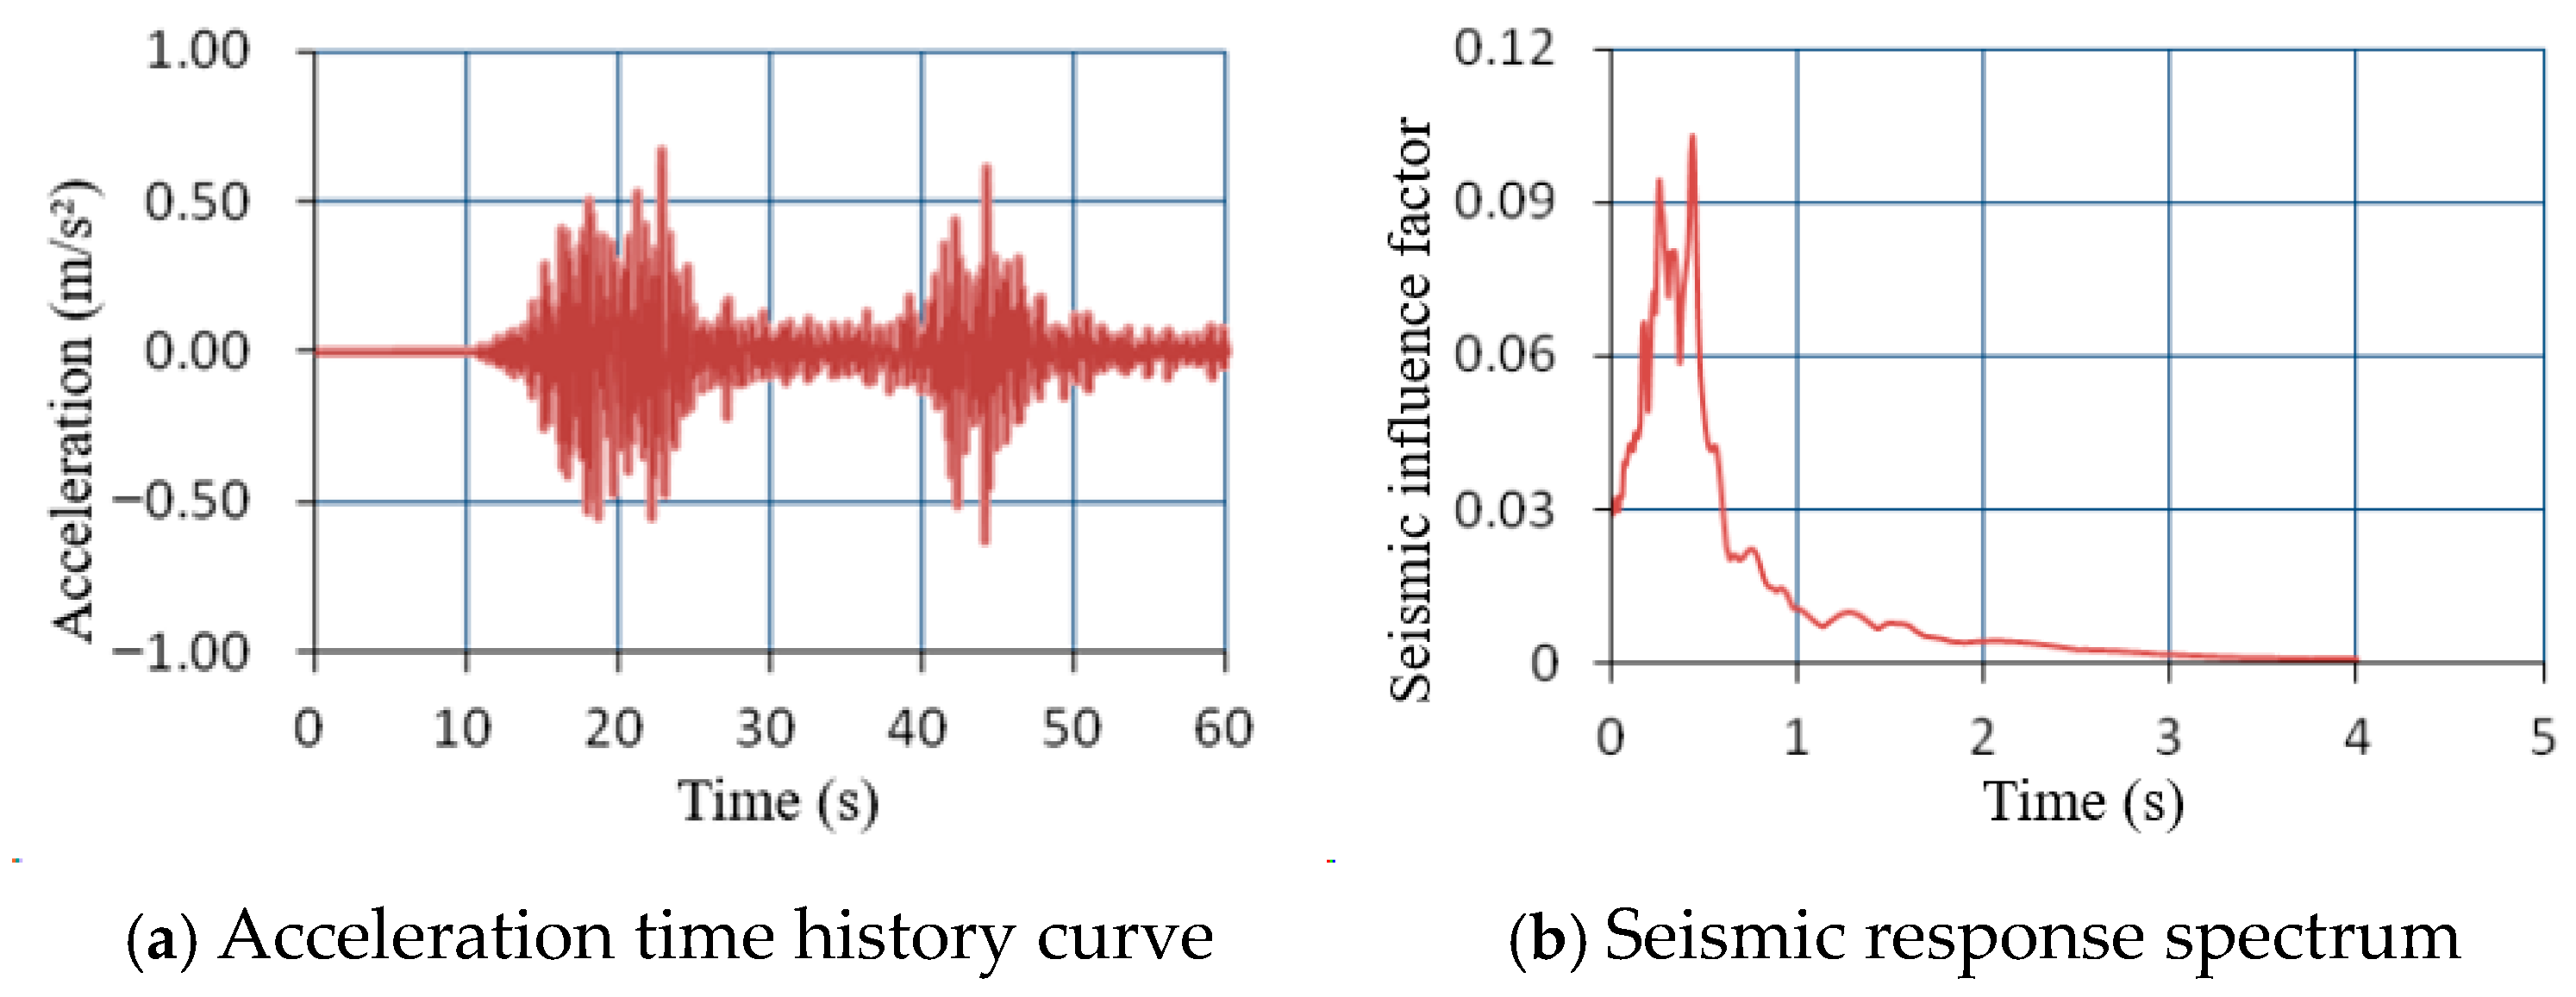
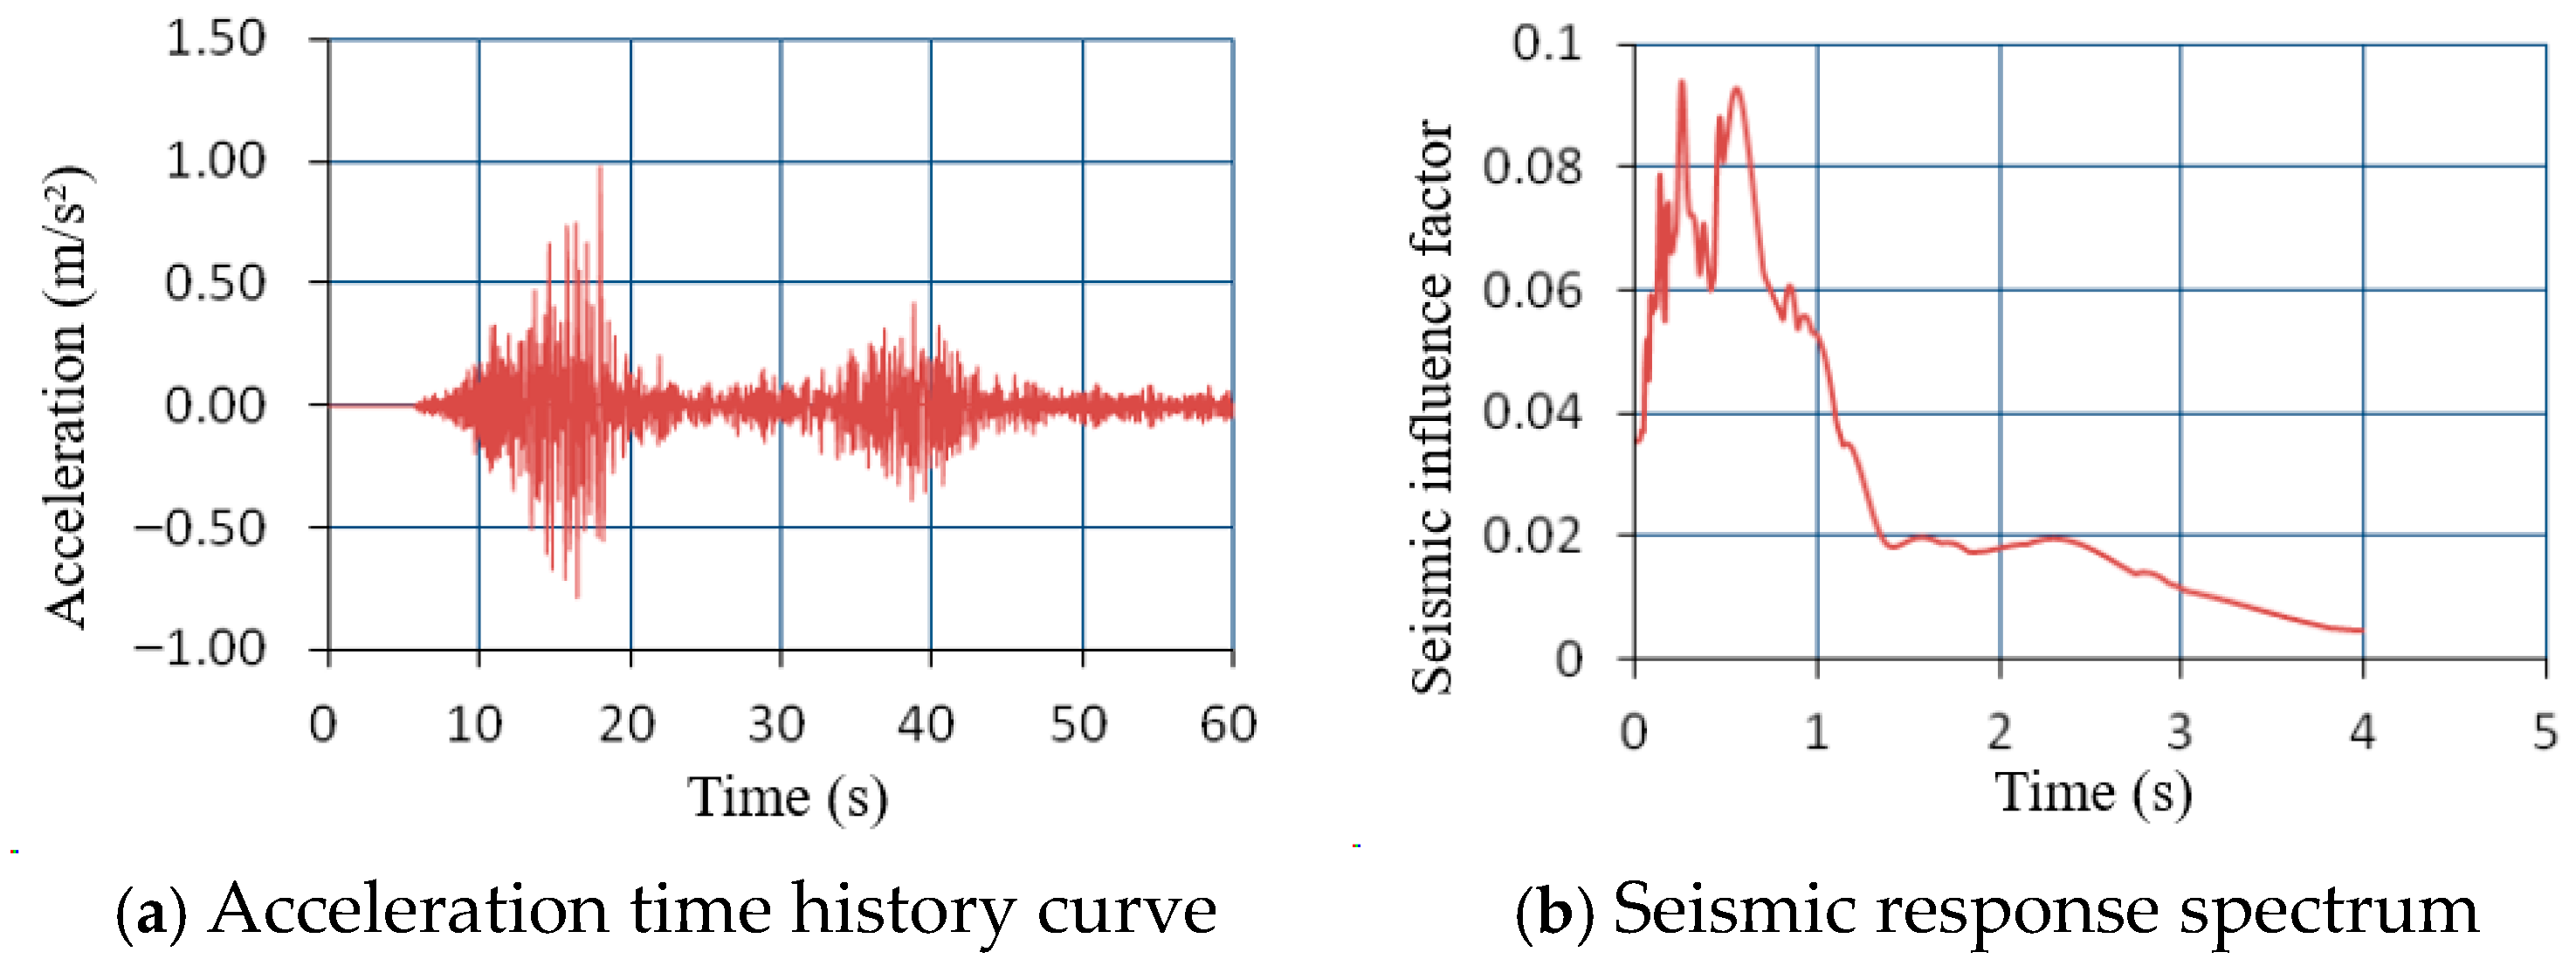
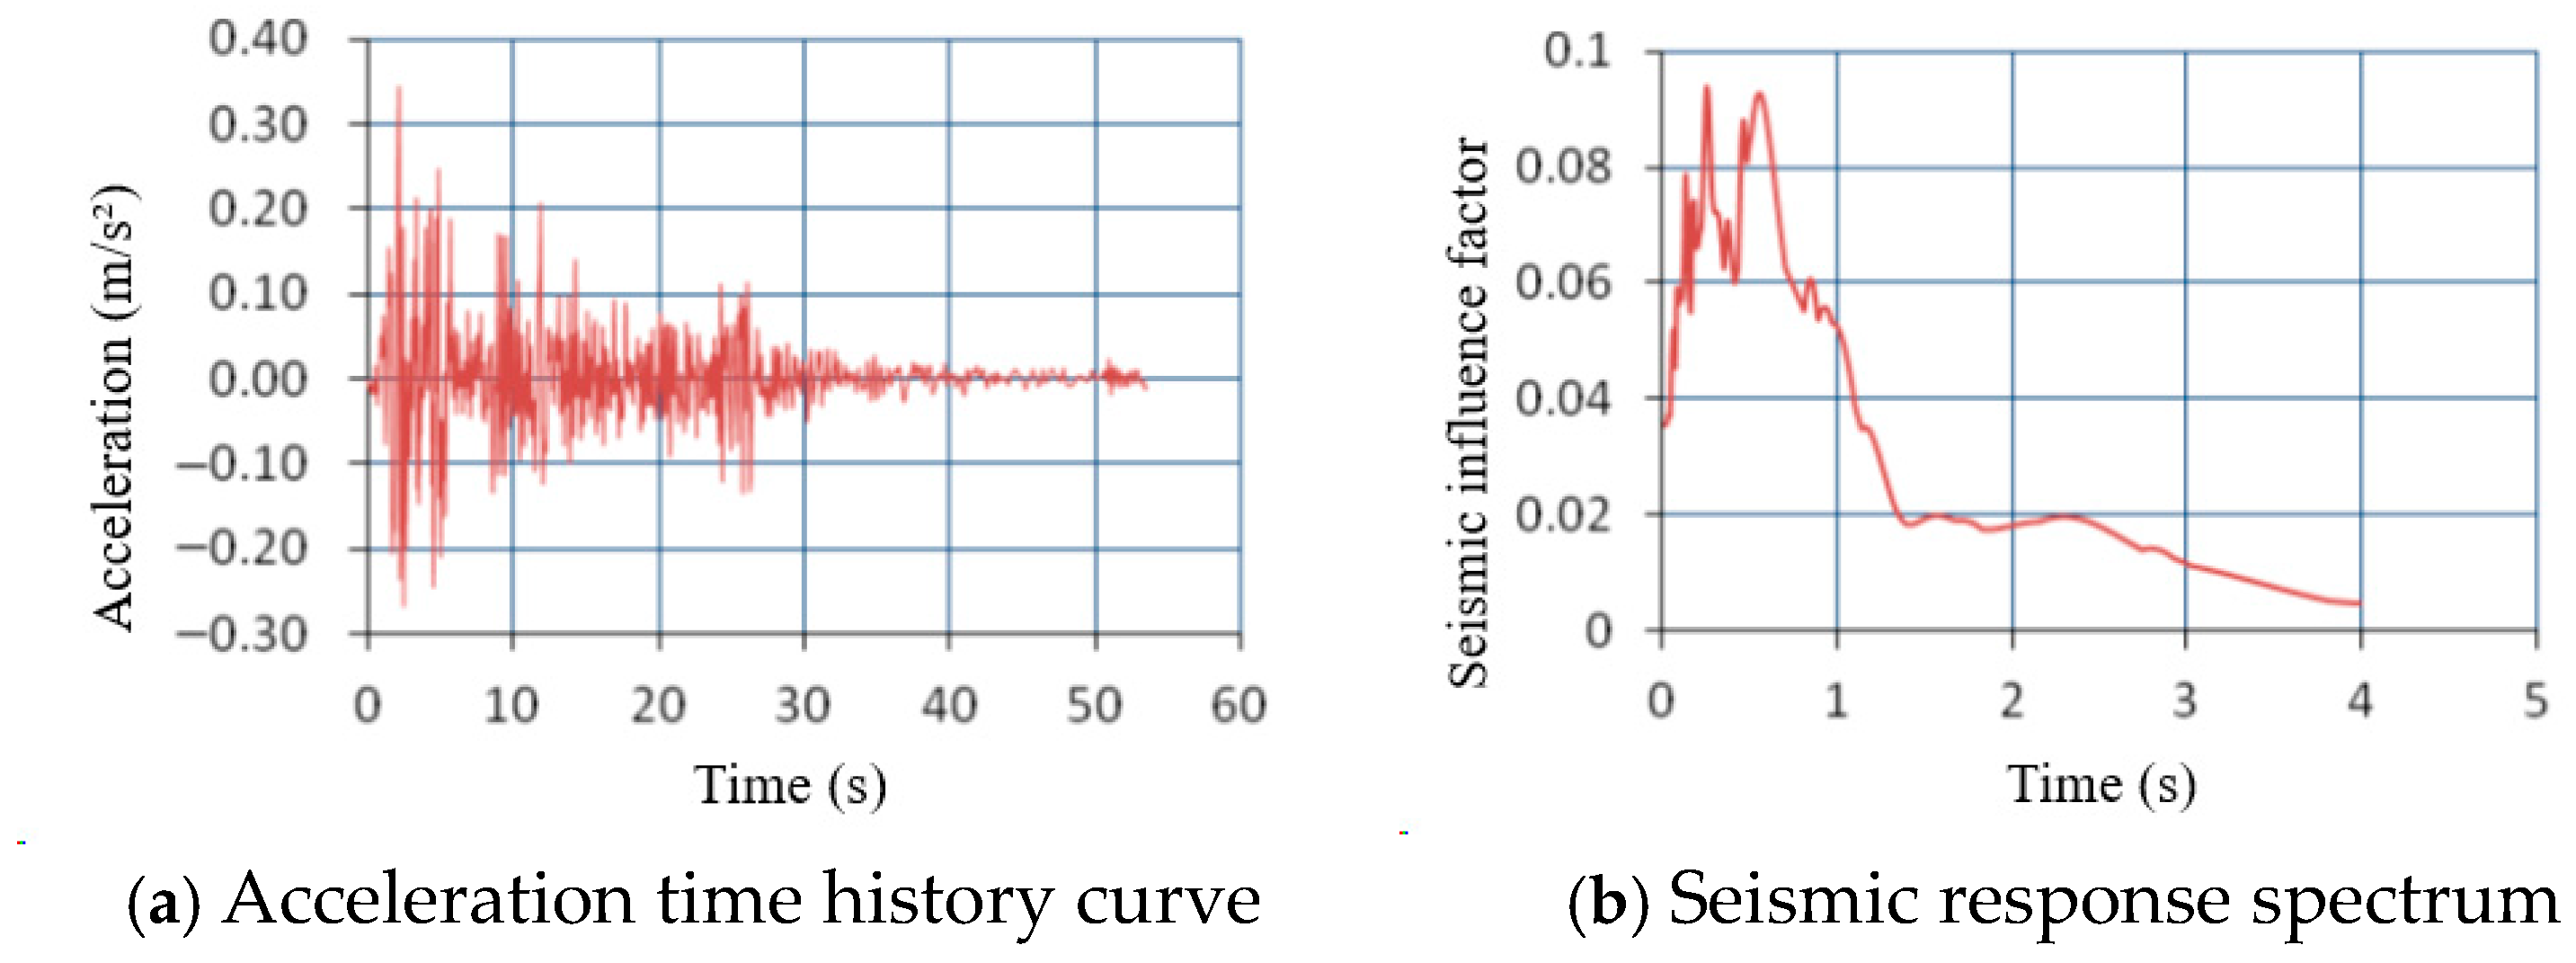
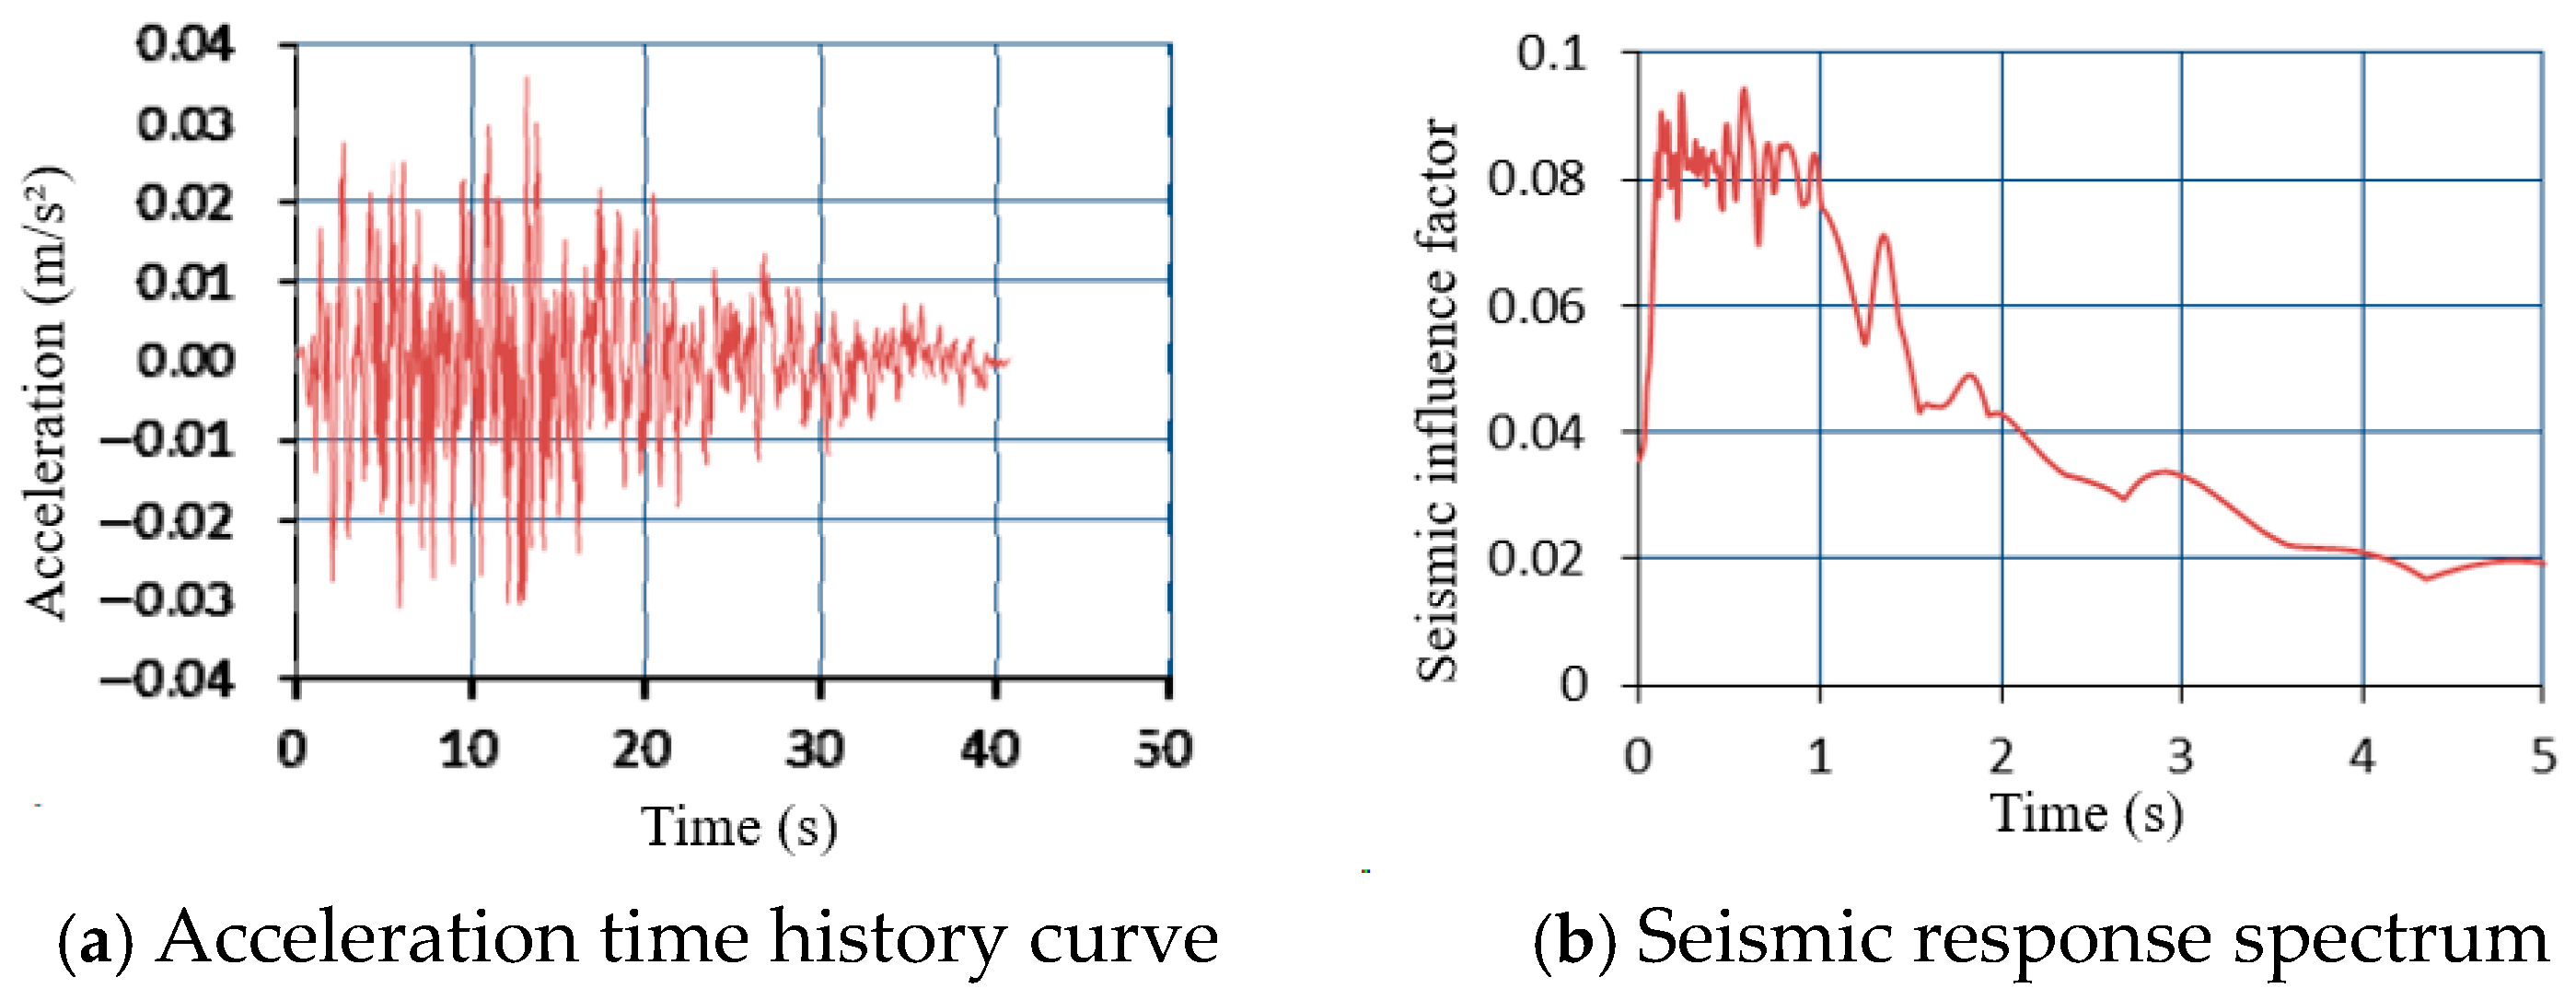
Shaking table testing is currently among the most widely applied techniques for evaluating the seismic performance of various structures, including the linear/nonlinear and elastic/inelastic dynamic response [68]. Shaking table testing reproduces the real seismic waves on a structure, which can simulate the effects of actual ground motion and earthquakes on building structures more closely [27]. The selection of excitation wave for simulating seismic ground motion (including natural seismic records and artificial waves) is based primarily on design requirements, seismic safety assessment, site type, and dynamic properties of the building structure. In the process of the testing, a wide range of conditions were taken into consideration, including the 7-degree frequently-occurred, fortification, and rarely-occurred seismic effects. After confirming that the model still has considerable seismic capacity, tests would be conducted for earthquakes of magnitude 8 and higher. The following three seismic records were selected as vibration excitation waves, and the time courses and response spectra are shown in Figure 2, Figure 3, Figure 4, Figure 5 and Figure 6.
(1)
Wenchuan seismic wave: recorded on 12 May 2008 in Wenchuan, China, with a duration of 180 s, whose maximum accelerations in the north–south and east–west directions were 653 c m / s 2 and 958 c m / s 2 , respectively, and its magnitude was 8.0.
(2)
El Centro seismic wave: recorded on 18 May 1940 in Imperial Valley, USA, with a duration of 53.73 s, whose maximum acceleration in the north–south, east–west, and vertical directions were 341.7 c m / s 2 , 210.1 c m / s 2 , and 206.3 c m / s 2 , respectively, and the original record is equivalent to an 8.5-degree earthquake.
(3)
Shanghai artificial seismic wave (SHW3): an artificial fitting seismic wave recommended by “Seismic Design Regulations for Buildings” (DGJ 08-9-2003 [69]).
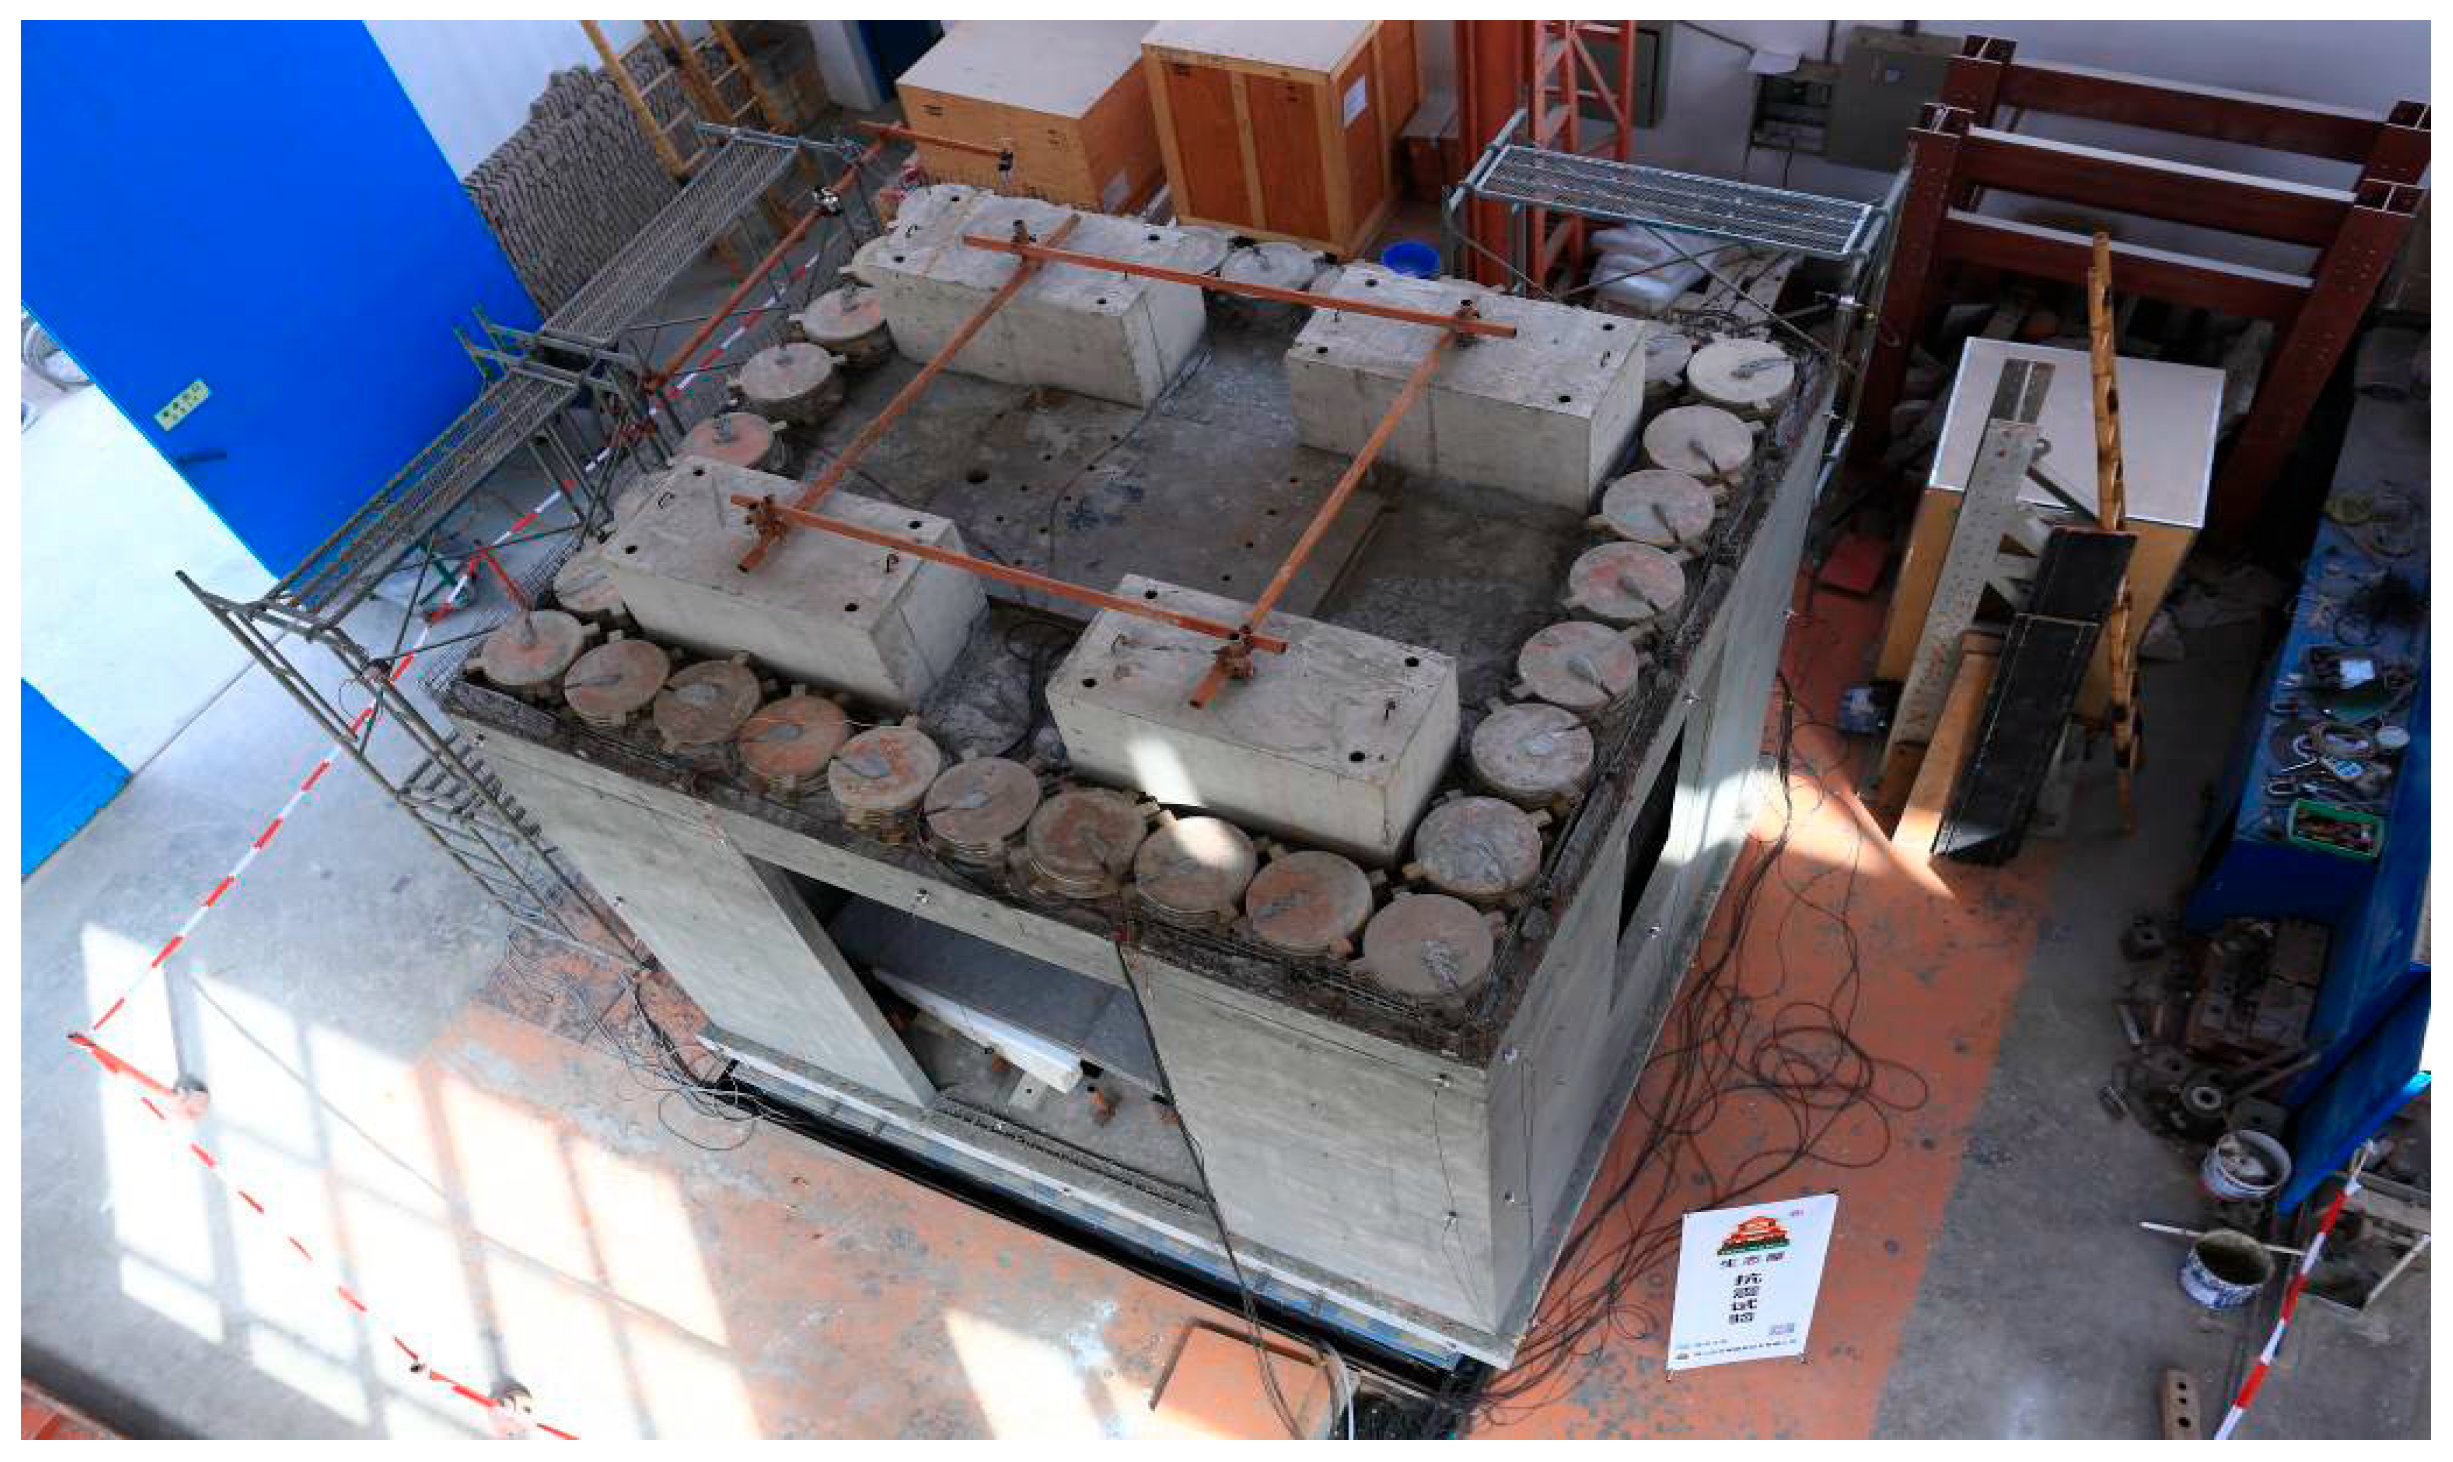
Striving to reflect the seismic performance of the prefabricated masonry structural system as accurate as possible, this test adopted a full-scale model, which means that the geometric similarity of the model was taken as 1:1. Considering the stage size, maximum model mass, and other aspects of properties of the shaking table, a one-story eco-house structure was assembled with 4.2 m × 3.6 m in the plane dimension, serving as a separate room scale to simulate the seismic response of original rural building. The total height is 3.4 m, of which the model base is 0.2 m thick while the frame itself is 3.2 m in height. The model was fixed on the vibration table base via bolted connections. The sizes and material of the model components remained the same as the actual construction. The total mass of the model is 22.5 tons, of which the model and additional mass is 19.5 tons and the base mass is 3.0 tons. Among the additional mass, there are 5 layers of circle iron blocks, with 32 in each layer, and a single piece weighing 0.02 tons, arranged around the four sides of the floor panel. Four rectangular concrete blocks (each weighing 1.08 tons), as well as one rectangular iron block weighing 1.28 tons, were laid in the middle area. The counterweight scheme, shown in Figure 7, forms an approximately uniformly distributed load of 6.2 k N / m 2 on the floor slab.
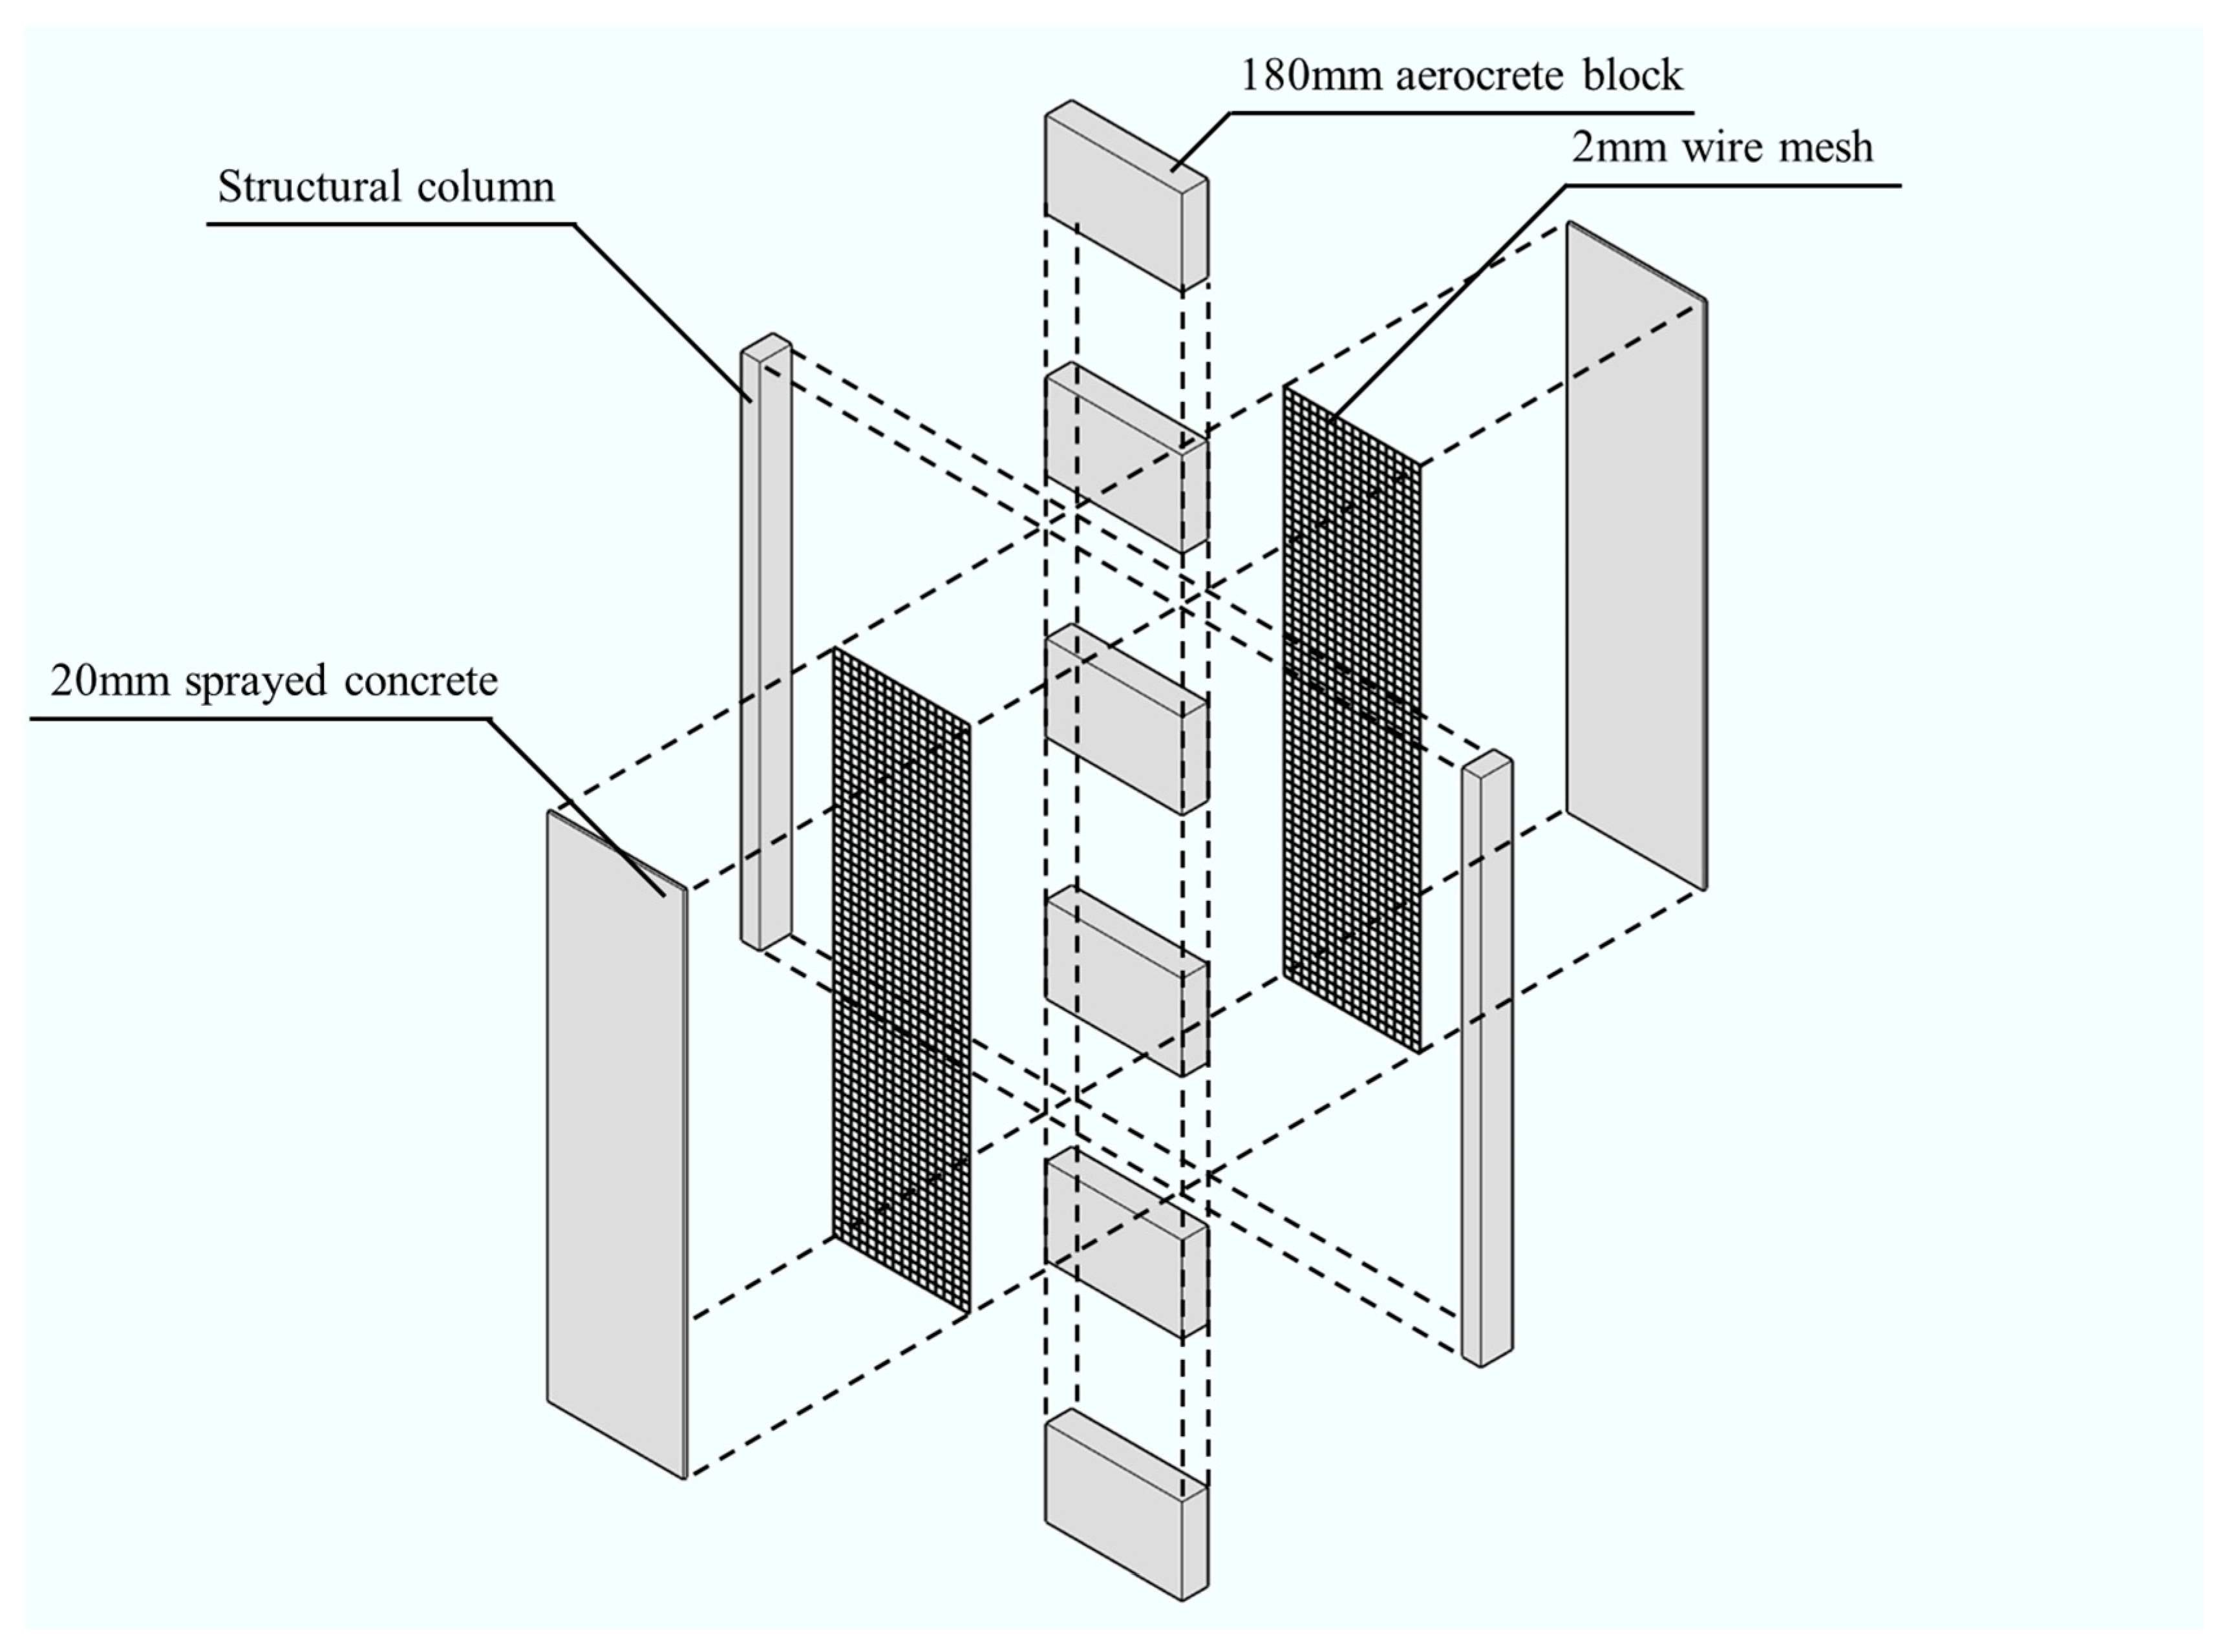
The model materials include concrete, whose strength grade was C30, primarily used for the confined columns and wall surface layers. The longitudinal reinforcement for the confined columns and ring beams consisted of four Grade III (HRB400) bars with a diameter of 8 mm. The stirrups were made of Grade II (HPB300) steel bars with a diameter of 4 mm spaced at 150 mm centers. The column cross-section was 80 mm × wall thickness. The confined columns were spaced at 600 mm centers, with additional confined columns and ring beams arranged on both sides of door and window openings. The masonry blocks were made of foamed concrete. The foamed concrete blocks were not considered to participate in load bearing; they served as thermal insulation layers and as formwork during the concrete pouring construction process. A base was set at the bottom of the model to connect with the shaking table platform, designed according to the principle of fixing the model structure onto a rigid base. A detailed drawing of the typical wall section is provided in Figure 8.
During the test, the prototype seismic record was modified according to the dynamic similarity required by the model and then used as the input to the seismic shaking table. The input acceleration amplitude was increased from small to large according to the fortification intensity to simulate the effects of frequently and rarely-occurred earthquakes on the structure. The peak ground acceleration (PGA) corresponds to the maximum input accelerations in each test. There were nine PGAs considered in total: 7-degree frequently-occurred (0.035 g), 7-degree fortification (0.10 g), 7-degree rarely-occurred (0.22 g), 8-degree rarely-occurred (0.40 g), 9-degree rarely-occurred (0.62 g), 0.80 g, 1.00 g, 1.20 g, and 1.50 g.
After experiencing a strong earthquake action, dynamic properties of structures (self-oscillation frequency, mode of vibration, and damping ratio) will probably change. Thus, white noise is usually utilized to sweep the model before and after it is subjected to different levels of seismic ground motion, so as to determine the magnitude of the structural stiffness reduction.
During the test, various types of sensors were arranged at different heights and positions of the model to measure the corresponding accelerations, displacements, and strains. Meanwhile, the deformation and cracking conditions of the structure were macroscopically observed during the test. As the model has one story, acceleration sensors were installed at the bottom, middle, and top positions to obtain real-time accelerations of different heights. Seventeen CA-YD acceleration sensors were used for collecting accelerations of three directions with frequency response ranging from 0.3 Hz to 200 Hz. Additionally, there were 8 ASM draw-wire displacement sensors (0~±375 mm) and 18 resistive strain gauges (0~20,000 με). The seismic response of the prototype structure and its comprehensive seismic performance were analyzed and deduced based on the collected seismic response data and the observed damage of the model structure.

3.2. Embodied Carbon Emissions Assessment

Life cycle analysis reveals that the initial embodied carbon of prefabricated buildings originates predominantly from the manufacturing phase (82.9%), with smaller contributions from transportation (9.3%) and on-site construction (7.8%) [70]. The relative contribution of each phase to total emissions can vary significantly based on project specific factors, especially in the transportation and construction stages [71]. Considering that the existing literature related to this research has already addressed operational carbon emissions [68], this study excludes the operational and end-of-life disposal phases from its scope.
China’s rural areas are vast and sparsely populated, and the locations of rural housing construction are often highly variable. In remote counties or prefecture-level administrative regions, there may only be one or two prefabricated component factories, or even fewer. In contrast, factories in relatively developed areas are more densely distributed. Therefore, under current conditions, it is difficult to establish a unified standard for discussing transportation-related carbon emissions. This article focuses solely on projects in the Xuzhou region as a case study, serving as an example of a relatively developed economic area.
The scope of carbon emission analysis and calculation is limited to site work, foundations, wall panels, doors, windows, and stair components. These elements generally cover the main sources of embodied carbon in rural residential buildings. The selected case study compares the structural system analyzed in this paper with masonry structures.
As introduced previously, calculation models of carbon emission assessment include process-based LCA (P-LCA), input–output LCA (I-O LCA), and hybrid LCA. P-LCA looks at carbon emissions from detailed processes, and therefore meets the requirements of building emissions assessment better [72]. This paper aims to verify the influence of structural form on embodied carbon emissions during construction, so the calculation of carbon emissions during materialization phase is the main research objective.
Currently, there are three common methods for carbon emission calculation: direct measurement, input–output, and the carbon emission factor method. The direct measurement method involves using relevant measurement techniques and instruments directly at the construction site to measure emissions. During the construction process, indicators such as gas emission concentration, flow rate, and velocity are monitored and recorded. The collected data are then used for result calculation and performance analysis. This method is only suitable for use in the materialization phase and cannot determine the carbon footprint generated by the building in other phases. It needs specialized equipment and technical staffs, which can increase the project cost and is not economically suitable for rural housing construction.
The emission factor approach (EFA) is a technique for calculating carbon footprints based on the average carbon emissions generated per unit of production. This method relies on carbon emission factors (EFs) as the basis for calculations. EF is defined as the amount of carbon emissions produced by per unit of energy during the combustion or use of a given energy source. Noteworthily, carbon emissions in this study refer to carbon dioxide equivalent (CO2e), which represents the six major categories of greenhouse gases (GHGs) specified in the Kyoto Protocol: carbon dioxide (CO2), methane (CH4), nitrous oxide (N2O), hydro fluorocarbons (HFCs), perfluorocarbons (PFCs), and sulfur hexafluoride (SF6) [73].
In the carbon emission factor method, the embodied carbon emission from a specific process can be viewed as the product of the engineering quantity of one type material and the associated emission factor. Embodied emissions at the material production stage are calculated as follows:
C E mat = i = 1 n Q mat , i × E F mat , i
where Q mat , i refers to the quantity of material i while E F mat , i refers to the emission factor of material i, and n is the number of material categories. Herein, engineering quantities can be referred to the bill of quantities of the project and relevant emission factors can be obtained from the Standard for Building Carbon Emission Calculation and other previous relevant research.

3.3. Cost Estimation

In AEC sector, life cycle costing (LCC) is a method to estimate the total cost of a construction project, which covers all stages including design, construction maintenance and disposal. The LCC analysis can be implemented for the entire building or on a component level. Hence, it can be employed to find cost-effective alternatives by considering various economic parameters that significantly influence budget predictions for a building.
As our study concentrates on embedded carbon emissions generated during the materialization stage of the construction process, the cost estimation emphasizes direct construction costs, which can be assessed based on the actual consumption and unit prices of corresponding building materials. Thus, the direct cost method (DCM) calculation formula is shown below:
C mat = i = 1 n Q mat , i × U P mat , i
where Q mat , i stands for the quantity of material i utilized in this project while U P mat , i means its unit price. The amount of each material used originates from the bill of quantities, and the pricing quotas are taken in accordance with local market prices of materials at the time the building being constructed.
Construction costs are estimated for the main structural and functional components. Due to the absence of a well-established cost database for materials in Chinese rural areas, quotations from local suppliers and construction companies were requested. Local market guide prices and previous studies were referred to as well. In this study, we assume that the materials utilized in all scenarios will not be replaced over the lifetime of the building. Additionally, wheat straw used in the blocks was directly accessible at the materialization site, which means that the cost of this material is negligible.
Considering the characteristics of the research subject—industrialized production, low demand for on-site machinery, and low reliance on skilled labor—compared to the labor-intensive nature of masonry structures, fluctuations in labor costs tend to have a positive impact on the pricing advantage of the research subject [29]. As outlined in Section 3.2, transportation distances across China’s extensive rural regions vary considerably, which precludes consistent conclusions. Therefore, analogous to the transport of urban prefabricated components, the impact of transportation distance on the carbon emissions [74] and costs of rural prefabricated housing in China are deferred to dedicated future studies and fall outside the scope of this paper. For cost analysis, this study employs the direct costing method. The carbon emission and cost analysis for rural housing in the Xuzhou region serves as a representative case study for construction in economically developed rural areas of China.

4. Case Study

4.1. Project Introduction

To illustrate the applicability of MRCWS, a village service center was designed and constructed according to this structural form, which is situated in Pei County, Xuzhou, Jiangsu Province, China. It is located in the eastern part of the province, characterized by coordinates approximately 34.7309° N latitude and 116.9282° E longitude. Pei County experiences a humid subtropical climate, which typically has four distinct seasons. The annual precipitation is relatively evenly distributed throughout the year. The topography of Pei County is alluvial plains and the region’s geological composition includes various types of soil, such as loam and clay, which are conducive to agricultural activities. The seismic fortification intensity of Pei County is 7 degrees and its earthquake acceleration is 0.10 g.

4.2. Basic Information

The building has two stories, whose floor areas are 319.29 and 255.15 m2, respectively. It functioned as a comprehensive service center, with the combination of health care, government services, and cultural and recreational activities.

4.2.1. Multi-Ribbed Composite Wall Structure

The center utilizes a new multi-ribbed composite wall structure (MRCWS), whose components contain aerocrete wire mesh modular wall panel and multi-ribbed cast-in-place concrete columns, beams, and slabs. The detailed diagram is depicted in Figure 8. It has an infilled wall in the middle and 2 mm bidirectional metal meshes attached to both sides, with 20 mm concrete poured after the wire mesh was fixed. The infilled walls consist of precast concrete blocks, whose size is 960 mm × 180 mm × 600 mm or 960 mm × 90 mm × 600 mm. For the larger block (960 mm × 180 mm × 600 mm), the individual weight is approximately 25 kg [29]. Specifically, the masonry blocks are composed of aerated concrete and straw, with the straw content not exceeding 10% of the total weight, which were manufactured in a specialized factory and assembled on site. The aerocrete has a dry density of 300 kg/m3 and a compressive strength of 0.5 MPa. In this design, the straw-reinforced aerocrete block is not considered as a load-bearing component. It serves solely as thermal insulation material and permanent formwork for the wall. The spacing of structural columns is mostly in accordance with the length of the precast blocks (960 mm).

4.2.2. Brick Masonry Structure

Brick masonry structure (BMS), a system primarily composed of bricks and cement mortar, is extensively used worldwide. It offers advantages including cost-effectiveness, ready availability, durability, fire resistance, and effective thermal and acoustic insulation. Consequently, BMS is frequently employed in low- to mid-rise buildings, especially in rural China. For the purpose of comparative analysis, a BMS scheme was designed for the same project. In the comparative case study, although no specific codes directly govern the MRCWS structural system, its detailing and construction practices were designed to comply with the Code for Design of Concrete Structures (GB/T 50010-2010) [75]. In contrast, the BMS scheme was designed to fully conform to the Code for Seismic Design of Buildings (GB/T 50011-2010) [76] and the Code for Design of Masonry Structures (GB 50003-2011) [77]. The load-bearing walls, with a thickness of 240 mm, were constructed using fired common bricks measuring 240 mm × 115 mm × 53 mm in standard dimensions, with brick and mortar strengths of 10 MPa and 5 MPa, respectively. Reinforced concrete columns were placed at wall intersections or corners, with a cross-sectional size equal to the thickness of the brick walls (240 mm × 240 mm).
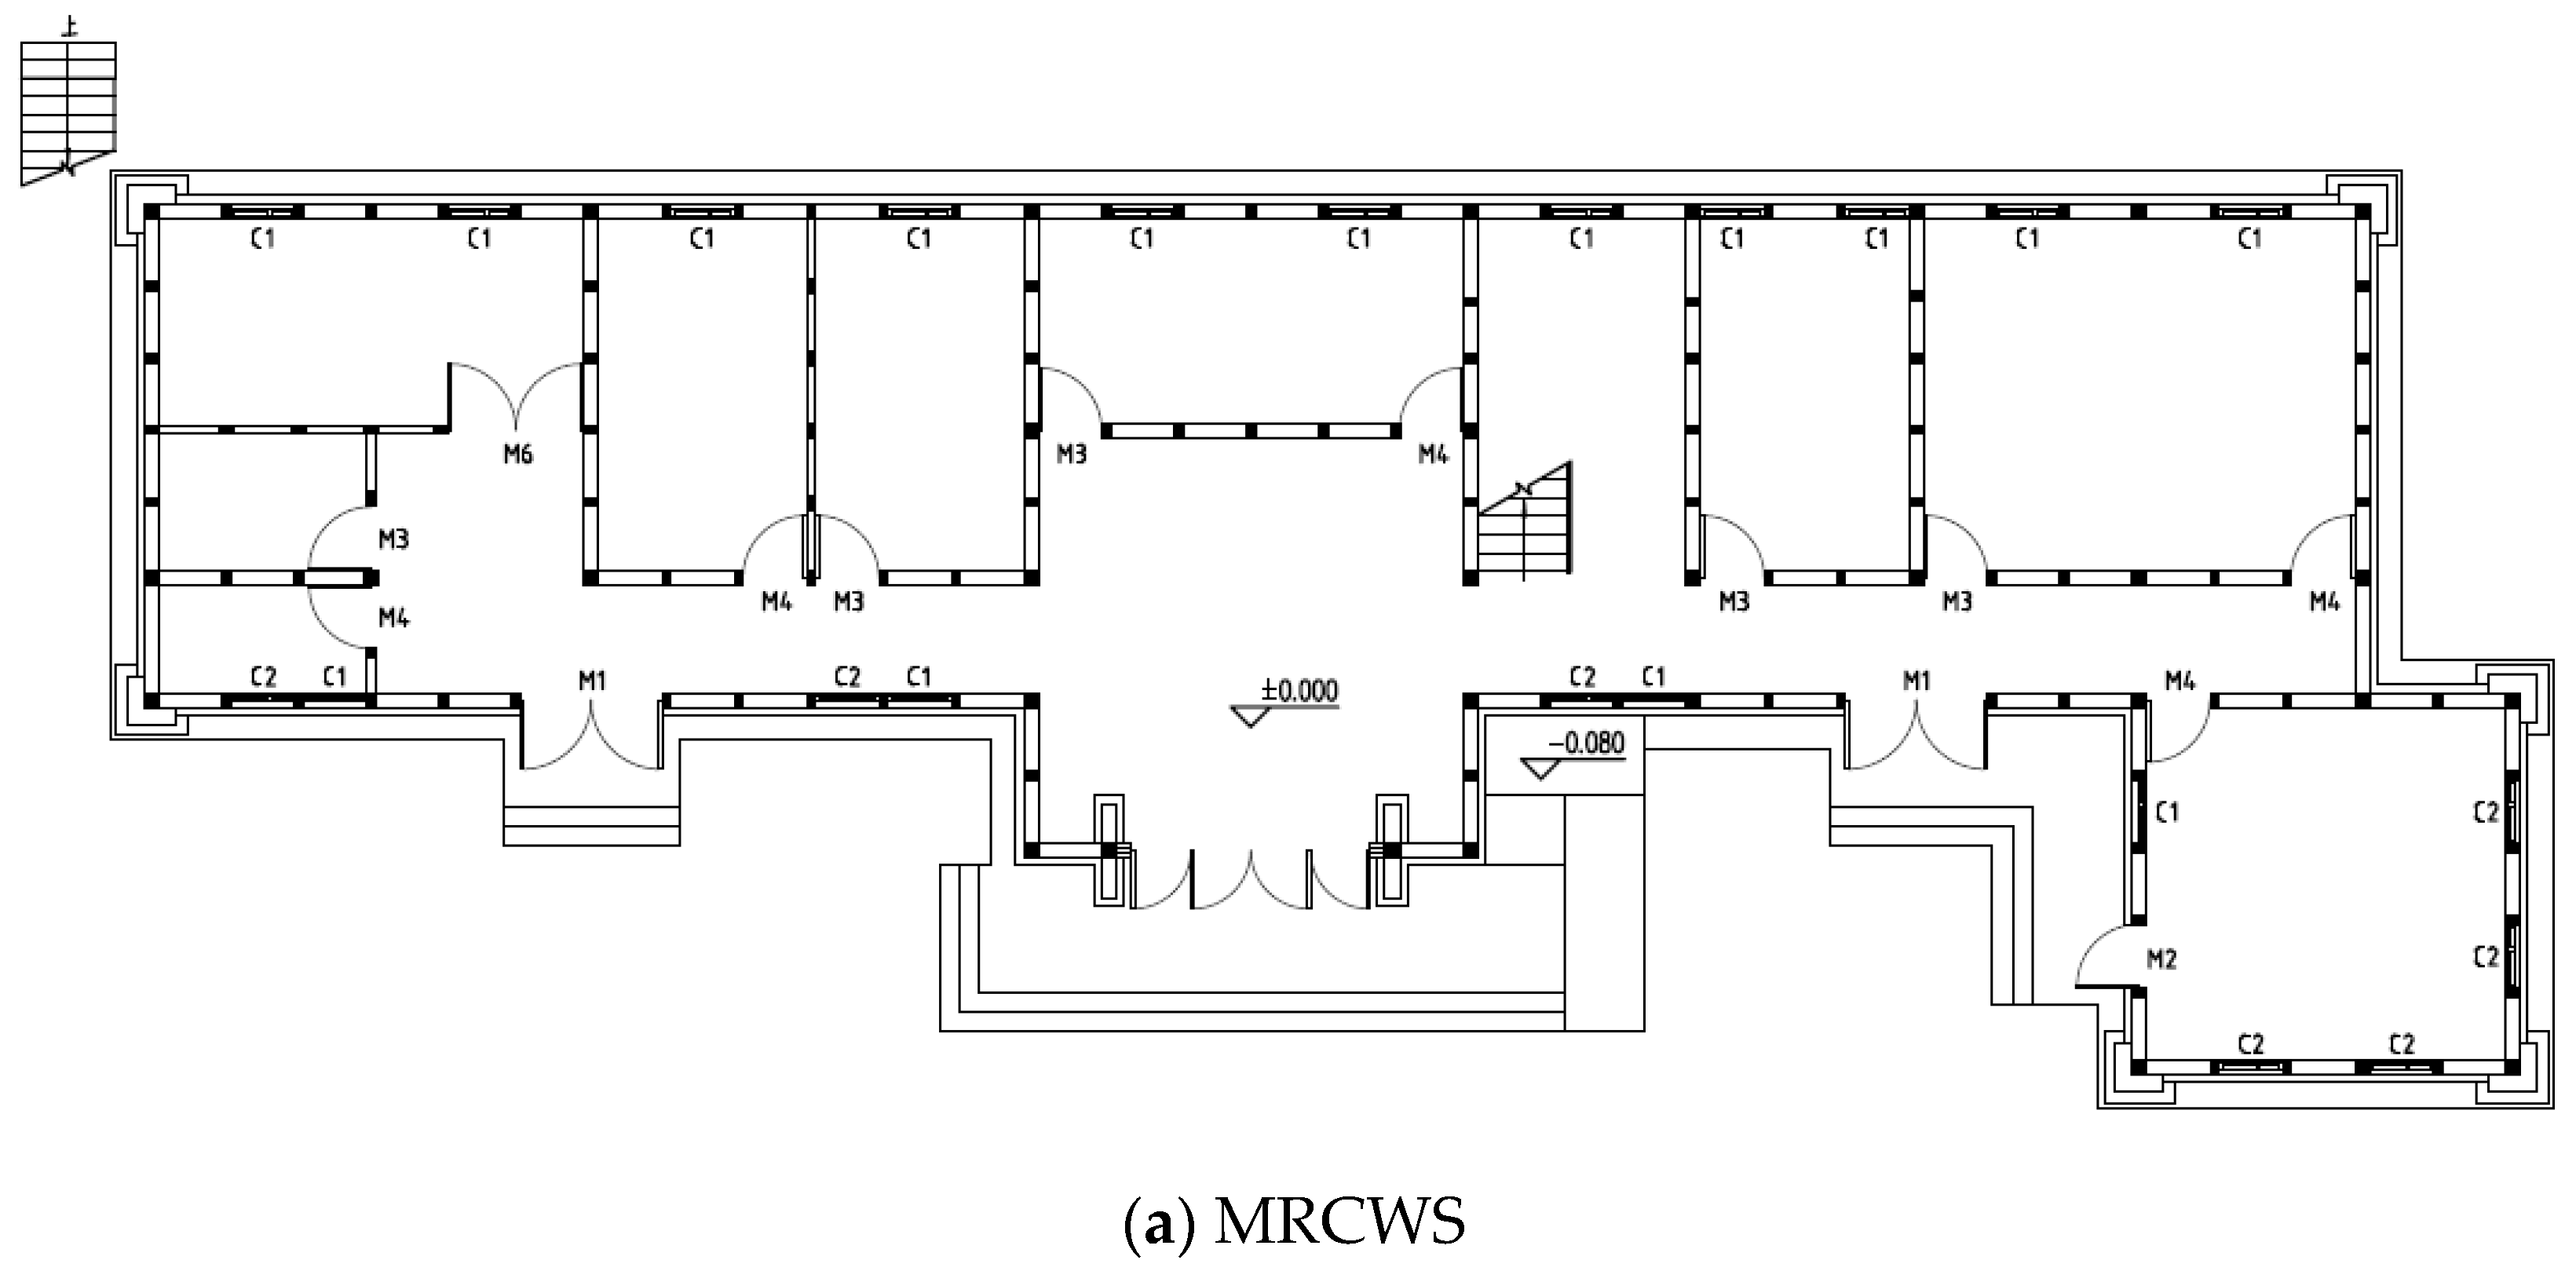
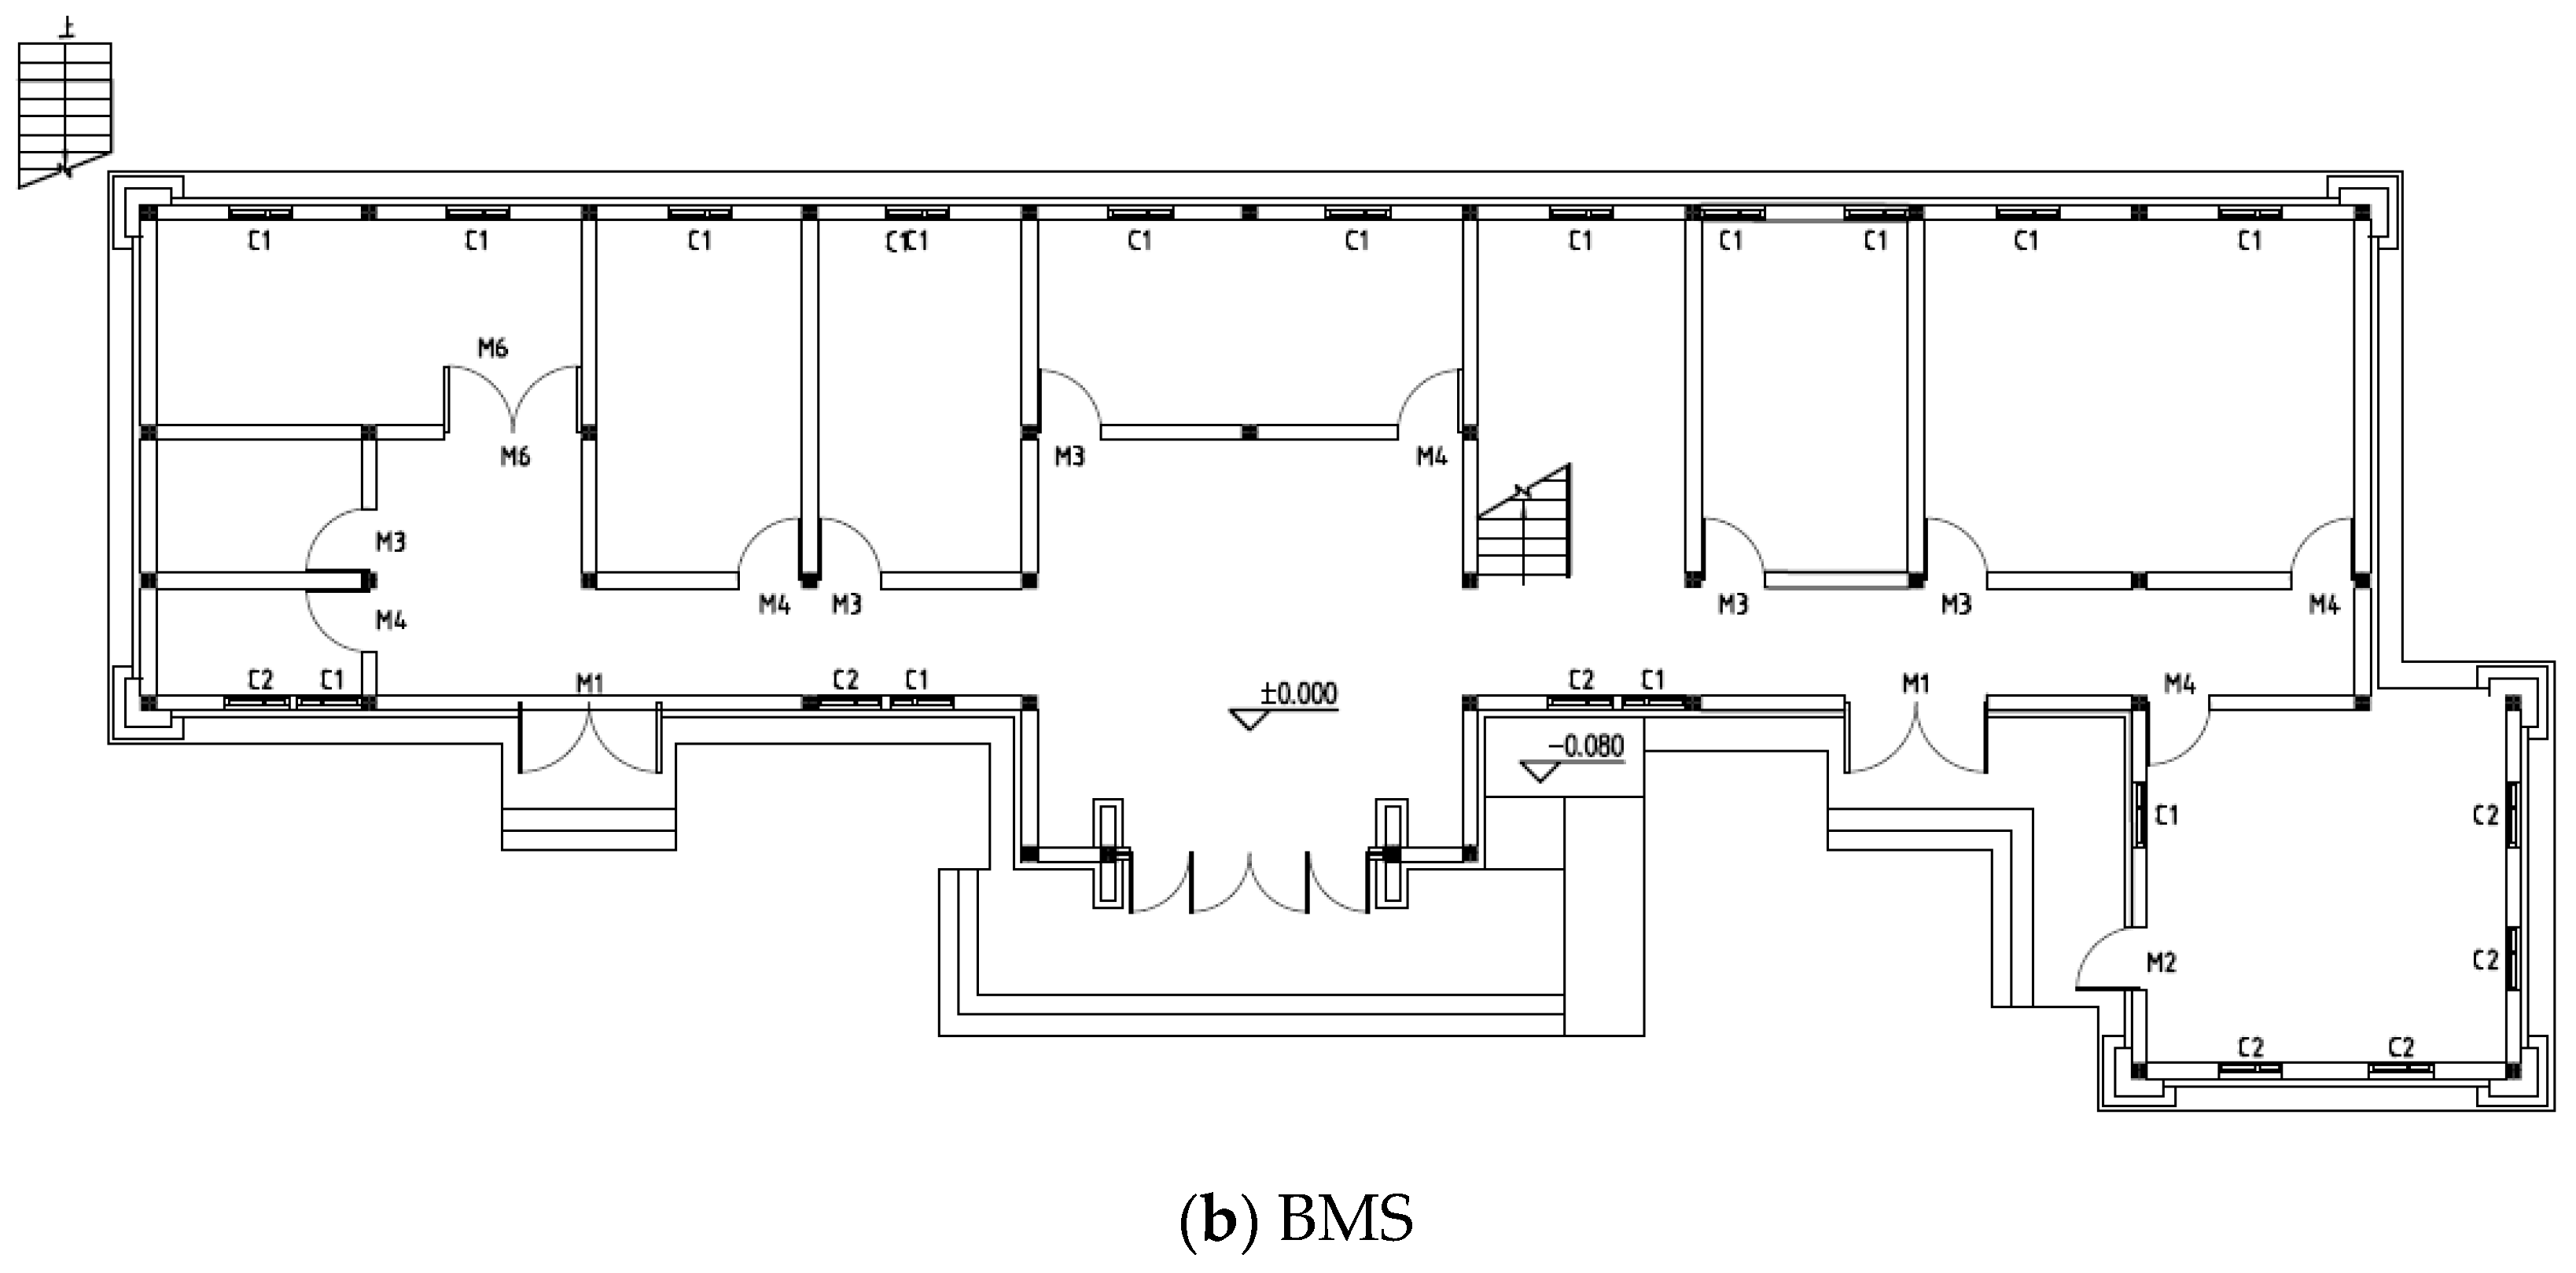
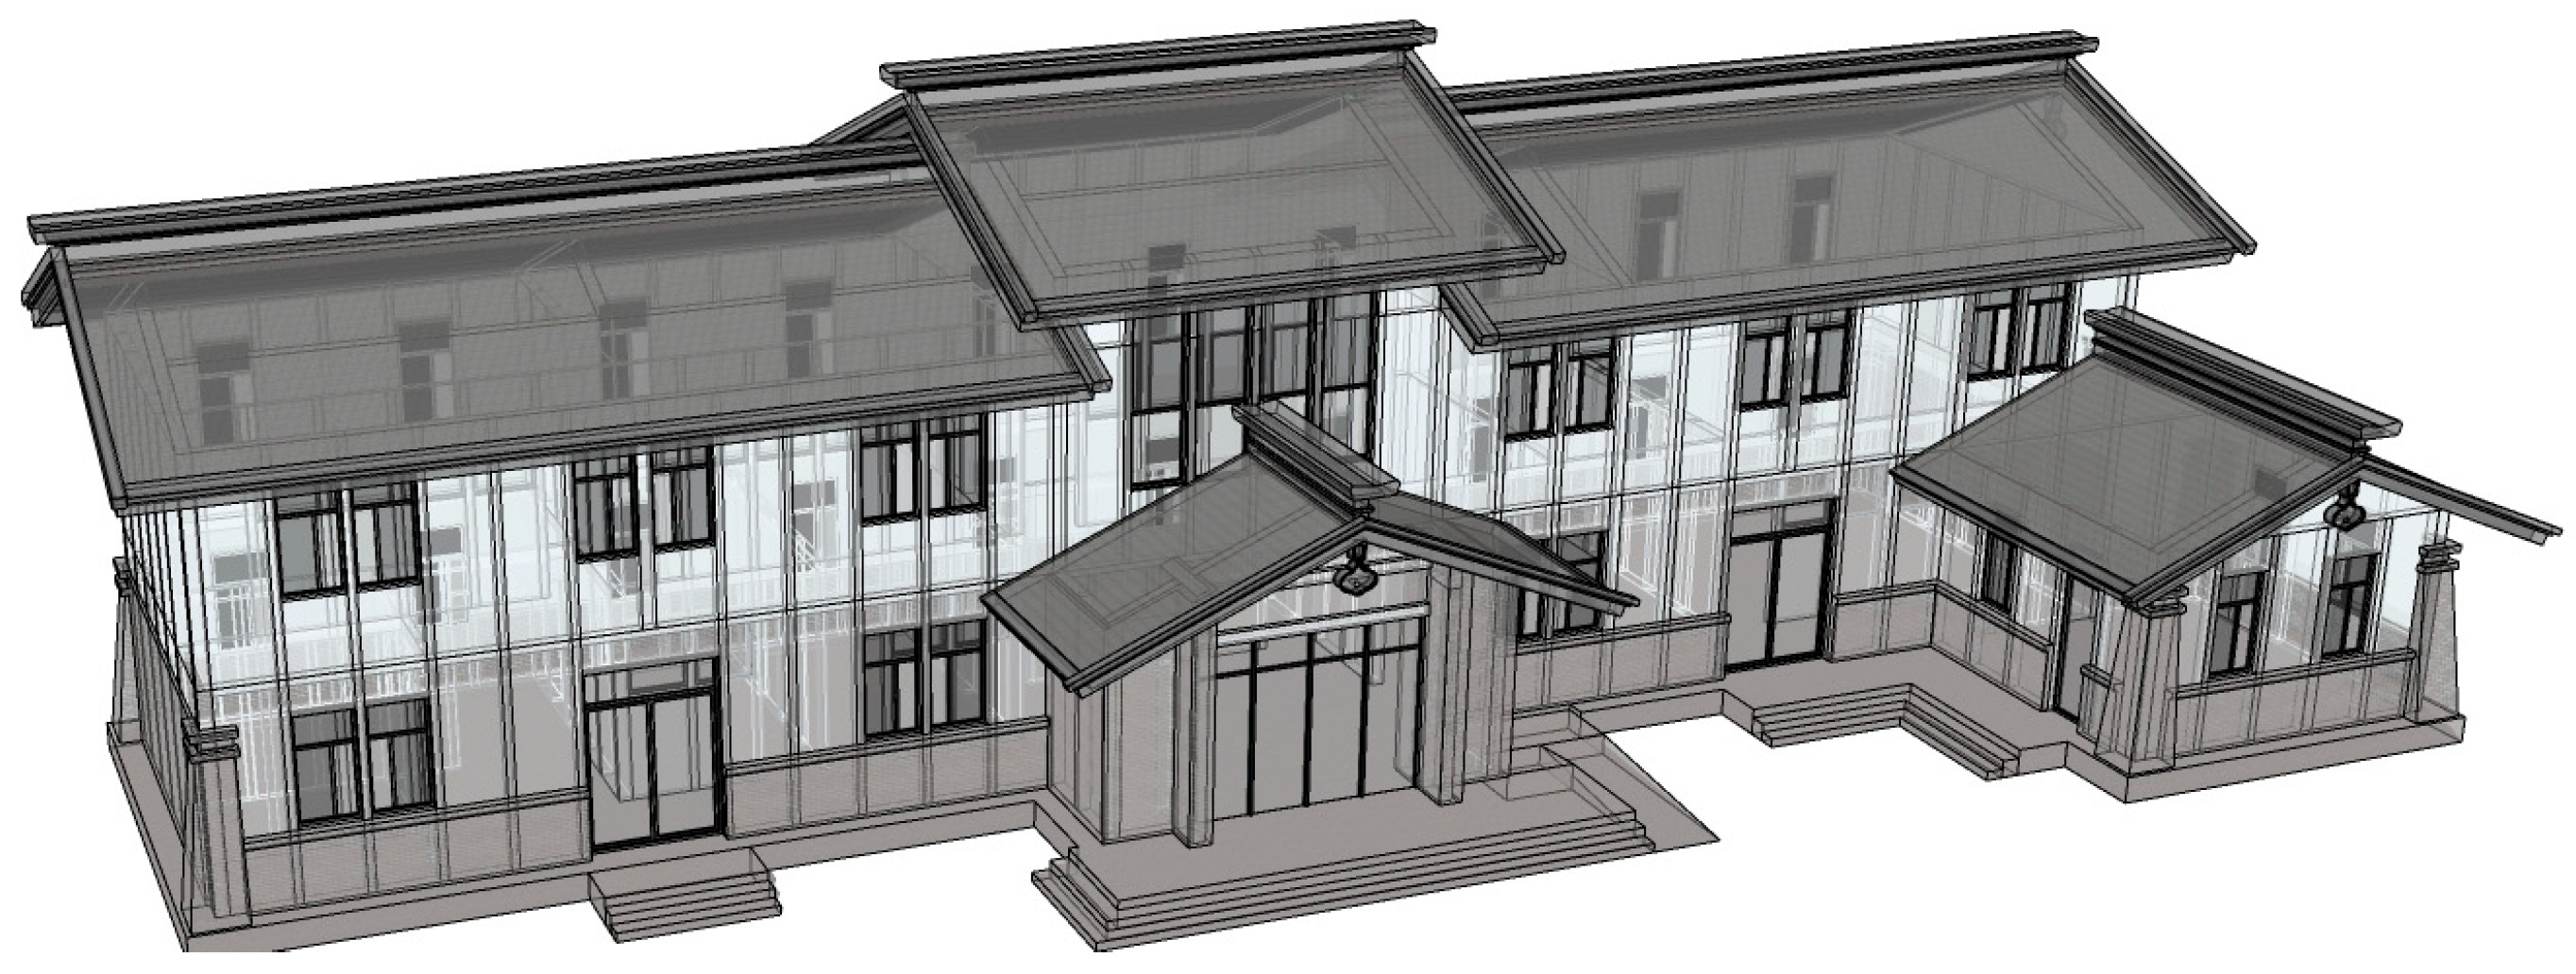
Cross comparison was then assessed to determine whether the MRCWS scheme can bring about both better mechanical, seismic performance and low-carbon, low-cost features at the same time. The architectural plan and rendering sketch of the project are shown in Figure 9 and Figure 10, respectively.
A cross comparison was then conducted to determine whether the MRCWS scheme can simultaneously achieve superior mechanical and seismic performance alongside low-carbon and low-cost characteristics. The architectural plan and rendering sketch of the project are shown in Figure 9 and Figure 10, respectively. Reference [29] analyzes the case by comparing the construction processes of foundations and walls with conventional methods, which will not be reiterated here. This paper focuses on simulating and analyzing carbon emissions and costs for project cases employing MRCWS versus the traditional brick masonry structure approach, covering site and foundation work, walls and wall surfaces, as well as elements such as doors, windows, floors, and stairs.

4.3. Data Collection

Regarding embodied carbon emissions and cost estimation, on the basis of the two structural schemes above (MRCWS and BMS), Table 2 summarizes the relevant engineering quantities of the materialization stage, while Table 3 shows the specific values of carbon emission factors and unit cost for different materials utilized during the construction of this building. To minimize uncertainties arising from regional heterogeneity and short-term price fluctuations driven by market supply and demand, government-issued market guideline prices [78] were adopted in this study. Meanwhile, embodied carbon-related data were obtained from the Standard for Building Carbon Emission Calculation (GB/T 51366-2019) [79] and supplemented by previous studies on carbon emissions and construction costs.

5. Results and Discussion

5.1. Seismic Performance

5.1.1. Crack Patterns

When the PGA was under 0.22 g, equivalent to the rarely-occurred earthquake under the seismic fortification intensity of VII, there was no visible cracking or other damage phenomena yet, which means the model structure was still basically in the elastic stage. MRCWS can clearly meet local seismic defense requirements.
Next, the model was tested under earthquake conditions at a higher intensity level; no cracks were found on the exterior of the model, but a small decrease in the self-oscillation frequency of the structure was observed, which indicates that cracks appeared and continued to develop inside the interior part of components.
Following the application of a rare biaxial seismic event (intensity 9), the overall structural damage was inspected, and changes in the fundamental frequency were preliminarily analyzed. Based on this assessment, a subsequent biaxial seismic input test was conducted using the Wenchuan wave at a peak acceleration of 0.8 g. A white noise frequency sweep was performed, after which the specimen was inspected for cracks. Despite the conclusion of the 0.8 g Wenchuan wave input, no visible cracks were detected on the structure, although its natural frequency continued to decrease.
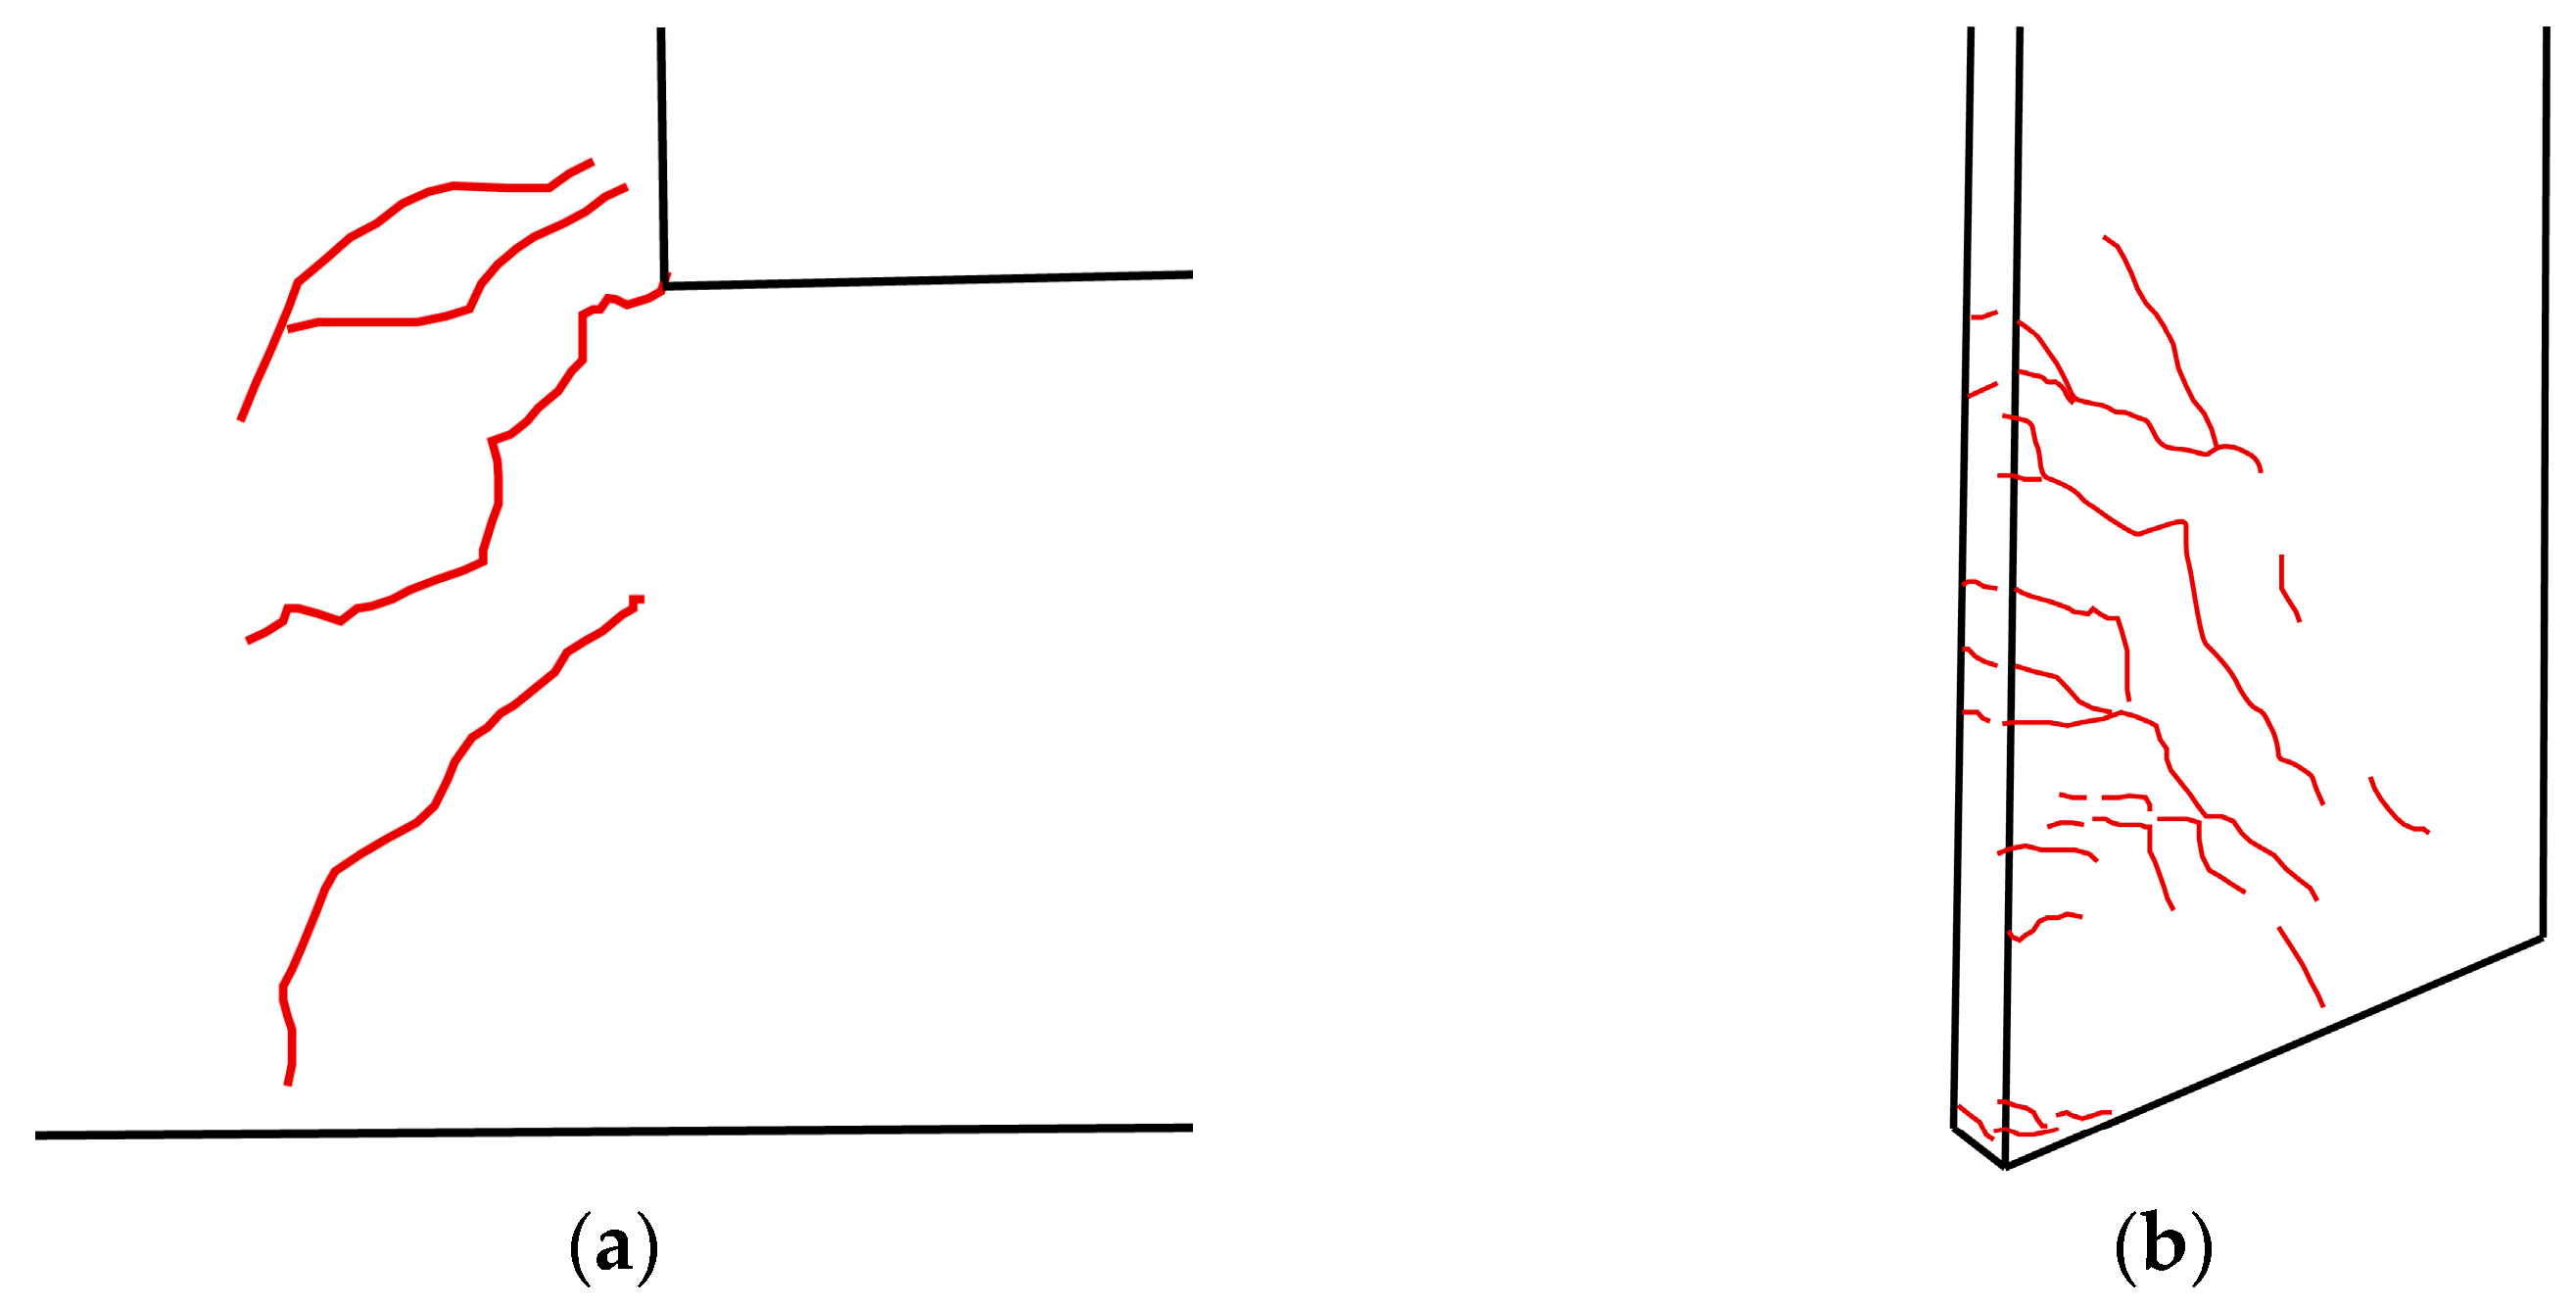
When subjected to a PGA of 1.00 g, cracks initiated on the model’s exterior surface, primarily at door opening corners. At a PGA of 1.20 g, the fine cracks at door openings propagated further, and initial cracking commenced around window openings. At this stage, all cracks remained widths under 0.2 mm. As the seismic intensity increased to 1.50 g, crack development progressed; however, the model sustained no significant damage and remained largely intact. The crack patterns are documented in Figure 11. Test results show that under 1.50 g excitation, all structural cracks propagated diagonally downward from door and window openings, with some extending as continuous diagonal cracks traversing the wall surfaces. No cracks fully penetrated the walls. Local crack widths ranged from 0.2 mm to 0.4 mm. This crack propagation behavior is consistent with the typical seismic response of frame structures. The structural system thus demonstrates favorable seismic performance.

5.1.2. Dynamic Response

The self-oscillation frequency, also called natural frequency, refers to the frequency of natural vibration of the structure itself without external interference, which is an important indicator of the structural dynamic performance. Before and after each level of seismic shaking, the test model underwent white noise sweeping to observe its dynamic characteristics. The white noise signals collected by the acceleration transducers were subjected to spectral analysis to obtain the natural frequency of the structure. Table 4 displays the self-oscillation frequencies and damping ratios in the X and Y direction of the test model under increasing seismic intensity.
The initial frequencies of the test model in the X and Y directions were 7.750 Hz and 10.375 Hz, respectively, which indicates that the structure has a large global stiffness. As the input PGA increased, the test model experienced a decrease in its self-oscillation frequency of the test model, resulting from the gradual escalation of the structural damage degree. When the input PGA was 0.10 g, equivalent to frequently-occurred earthquake of the seismic fortification intensity of VII, the self-oscillation frequencies of the test model in the X and Y directions were 95.2% and 98.8% of the initial ones, indicating that the structural damage under this seismic intensity was slight and the structure was in the elastic stage. When PGA was 0.40 g and higher, the structural state gradually shifted from elastic to elastoplastic as the structural damage accumulated. The natural frequency in the X and Y directions decreased by 30.6% and 14.5%, illustrating a more obvious degradation of the lateral stiffness in the X direction.

5.1.3. Acceleration Response

The real-time acceleration response of the MRCWS was obtained by means of transducers arranged on the structure. Acceleration amplification factor K is introduced to describe the status of the structure under seismic effects, which defines as the ratio of the maximum acceleration to the input acceleration at the base of the model. In this model, the peak accelerations can be obtained at the top of the model. The calculation formula of K is shown below:
K = a max a bottom = a top a bottom
where a t o p is the peak accelerations response, which can be obtained at the top of the structure, while a b o t t o m is the peak input acceleration in the test, which can be measured at the bottom. The acceleration amplification factor K is an important parameter in assessing the degree of structural stiffness damage.
The experimental results are summarized thoroughly in Table 5.
Overall, as the PGA of the input seismic wave increased, the acceleration amplification factor K showed a declining trend in general, indicating that with the increase of the intensity, the structure enters the elastic–plastic phase gradually while the structural damage continues to increase, which makes its lateral stiffness degrade continuously.

5.1.4. Displacement Response

Table 6 summarizes the maximum relative displacements to the base measured at various monitoring points under different seismic waves, which illustrates that the maximum displacement of the test model increased with the increasing input PGA and the displacement response was not the same under different seismic waves, owing to differences in spectral characteristics. In general, when the input PGA was no higher than 0.4 g, the displacement response of the test model under the El Centro wave was the largest, followed by the artificial SHW3, and the Wenchuan was the smallest. As the seismic intensity increased, the maximum relative displacement to the base under the Wenchuan earthquake motion experienced a significant increase and reached 17.31 mm in the X direction on the top of the structure. Under small earthquake motions, the displacement response in the Y direction of the test model was slightly larger than that in the X direction. However, when the input PGA was higher than 0.40 g, the maximum displacement in the X direction surpassed that in the Y direction, and the difference became more pronounced with the increasing seismic intensity. The reason is that the damage in the longitudinal walls was more severe than that in the transverse walls, resulting in a more obvious degradation of the lateral stiffness of the test model in the X direction than in the Y direction.
As illustrated in Table 7, when the input PGAs were 0.035 g, 0.10 g, and 0.22 g, equivalent to the minor, moderate, and rarely-occurred earthquakes under the seismic fortification intensity of VII, respectively, the maximum inter-story drift of the test model was 1/3911, 1/2020, and 1151, which is smaller than the limit value of elastic inter-story displacement angle (1/550) for concrete frame structure stipulated in the Code for Earthquake-Resistant Design of Buildings (GB 50011-2010). This indicates that the structure was still basically in the elastic stage and stayed basically intact during earthquakes of low intensity. When the input PGA was higher than 0.40 g, the maximum inter-story displacement angel exceeded 1/550 but still satisfied the elastic–plastic inter-story angle limit of 1/50 for concrete frame structure in the seismic code, which demonstrates that the structure had received structural damage would not collapse in rarely-occurred earthquakes under the seismic fortification intensity of VIII and above. It can be concluded from the test results that the seismic performance of the structure is comparable to that of a concrete frame structure.
According to reference [80], the ultimate displacement for overall collapse in global masonry collapse models is defined as the displacement at which the story shear capacity drops by 15% from its peak value; for local collapse models, an ultimate drift limit of 1/300 is adopted. Analysis shows that for structures with code-compliant structural columns, ring beams, and cast-in-place slabs, the collapse probability exceeds 50% at a peak acceleration of 1.22 g.
The test results show a maximum drift angle of 1/173 under the 1.5 g condition, with no wall-penetrating cracks observed. Given the structural characteristics of MRCWS, its ultimate drift angle was benchmarked against the 1/50 limit specified for frame structures [76]. The measured drift angle of 1/173 under the 1.5 g condition was substantially lower than the 1/50 limit required for frame structures during rare seismic events. Consequently, under equivalent conditions, the MRCWS structural system exhibits superior lateral force resistance.

5.2. Carbon Emissions

Table 8 summarizes the detailed embodied emissions of MRCWS and BMS, in aspects of construction phases and building components. It is obvious that MRCWS scheme offers great possibility in lowering carbon in terms of total embodied carbon emissions during its construction compared with BMS structure.
The total floor area of the building is 574.44 m 2 , with 319.29 and 255.15 m 2 , respectively, for each story. Thus, the carbon emissions per net floor area of PM structure is 277.35 k g   C O 2 / m 2 , which is much lower than that of the BM structure of 295.52 k g   C O 2 / m 2 .
The data in Table 8 indicate that differences in construction methods lead the MRCWS system to reduce carbon emissions by 3.55 tons in the site and foundation modules compared to the traditional masonry structure. The mechanisms underlying these savings are detailed in the literature [29]. For the superstructure (walls and finishes), the choice of structural system results in different quantities of constituent materials, including steel reinforcement, concrete, masonry blocks, mortar, and finish layers. When these material quantities are converted to embodied carbon, the MRCWS system yields a further reduction of 6.89 tons compared to the BMS system.

5.2.1. Embodied Carbon Emission of Precast Aerocrete Blocks

Considering the unique materialization of masonry block in this building construction, there is a lack of available carbon emission factors in previous studies. Thus, customized calculation was conducted according to the material composition and corresponding proportions. As mentioned in Section 4.1, the masonry blocks are composed of aerated concrete and wheat straw while the volumetric admixture of wheat straw is 20%. Noteworthily, this new type of blocks not only save the raw materials but also tackle the disposal of by-products of crops, which is a main resource of agricultural wastes. The reuse of wheat straw do not merely reduce the quantity of aerocrete used in the precast blocks, but can also eliminate the unnecessary carbon emission caused by agricultural waste disposal, especially burning wheat straw in the field in rural areas. Thus, the actual embodied carbon emission should deduct the corresponding reduction resulting from straw reuse. The calculation equation is shown below.
C E blo = C E aer C E str
Following the same regularity,
E F blo = E F aer E F str
Considering the volumetric ratio is 80%, the emission factor of aerocrete in precast masonry blocks can be calculated.
E F a e r = 170 × 0.8 = 136   k g   C O 2 e / m 3
Regarding the agricultural waste, the carbon emission factor for field burning of wheat straw is 1.48 k g   C O 2 / k g [81]. The utilization of straw in masonry completely eliminates the carbon emissions of field burning. Reference [82] reported that loose bulk density of wheat straw was about 20 and increased to 65 when the sample was chopped into smaller sizes (10% moisture content). The relevant calculation of emission factor is presented as follows.
E F s t r = 1.48 × 65 × 0.2 = 19.24   k g   C O 2 e / m 3
E F b l o = E F a e r E F s t r = 116.76   k g   C O 2 e / m 3
The mixture of wheat straw particles in the aerocrete blocks can reduce carbon emissions by 27% per unit of volume. Compared to common fired bricks, this type of blocks can bring about a nearly 42% reduction in carbon emissions each square meter, which is undoubtedly far more environmentally friendly, making it a perfect substitute to common bricks in BMS. Thus, the total embodied carbon emissions of the precast masonry blocks can be obtained below.
C E b l o = Q b l o × E F b l o = 151.10 × 116.76 = 17642.44   k g   C O 2 = 17.64   t   C O 2

5.2.2. Embodied Emissions Analysis Based on Sub-Projects

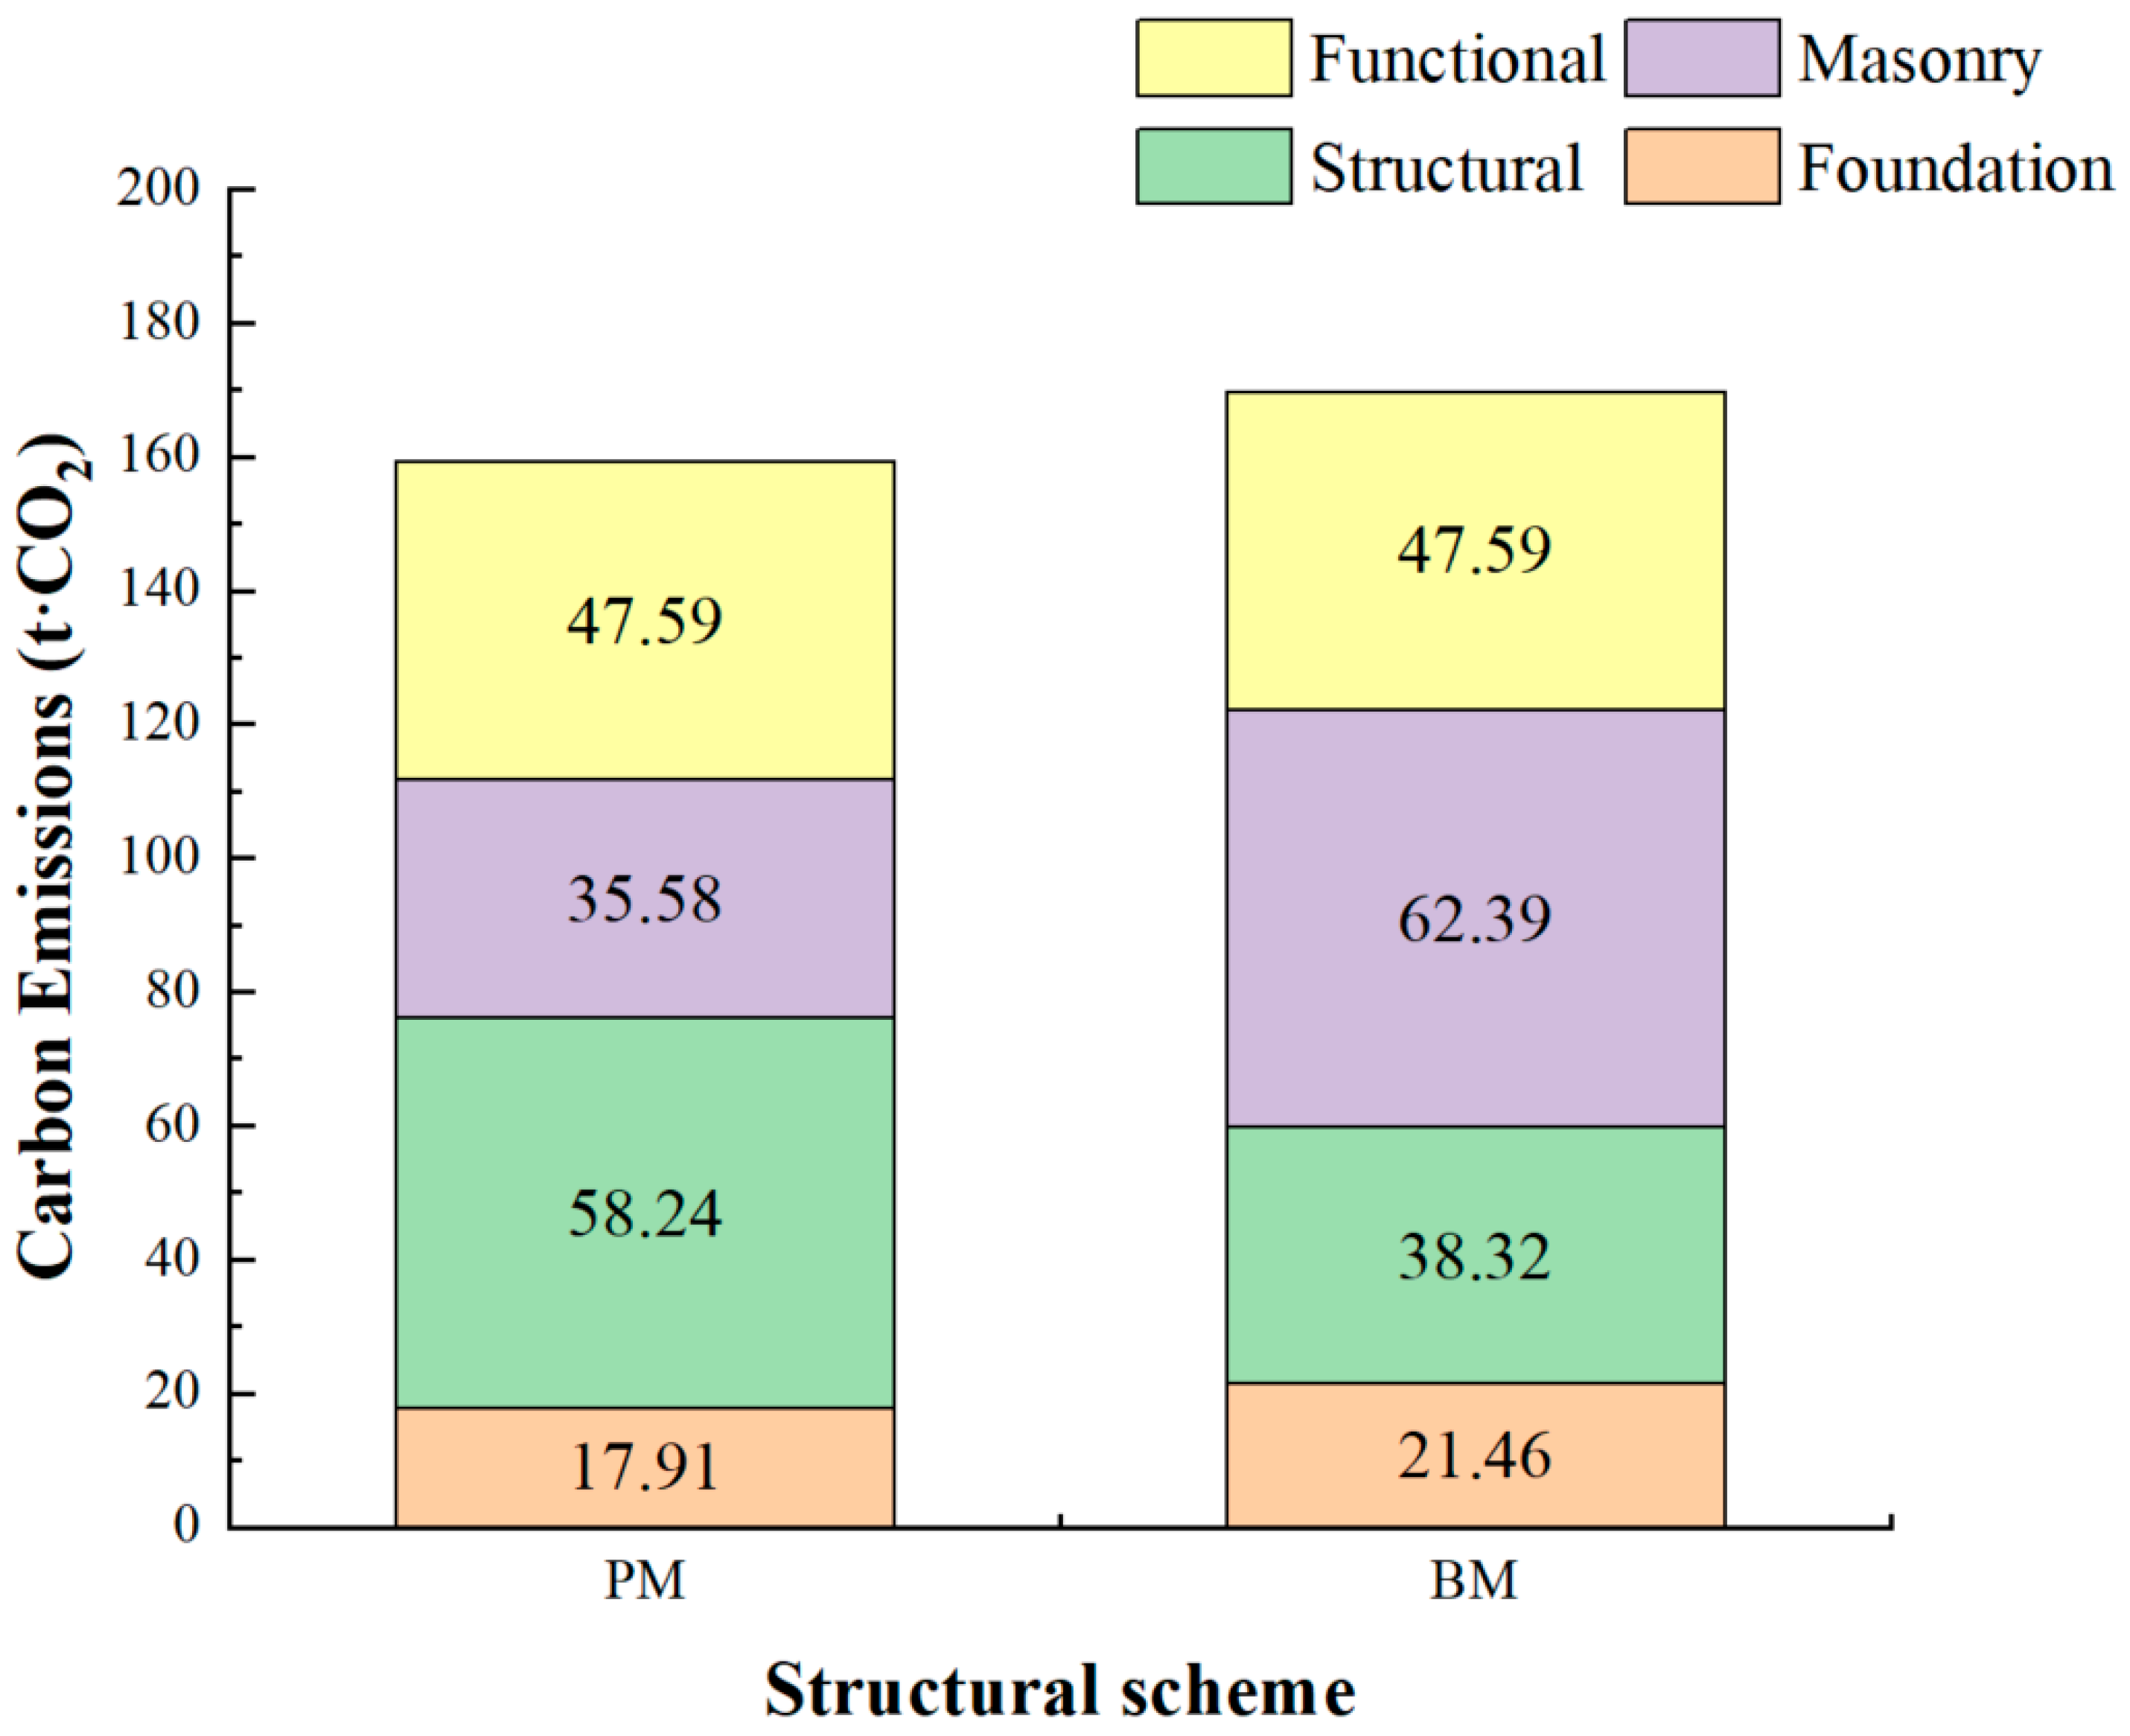
As shown previously in Table 8, the whole construction process was divided into four main subprojects: (1) ground and foundation, including leveling and solidifying the foundation soil; (2) main structural construction, including reinforced concrete preparation of columns, beams, and slabs; (3) masonry engineering; and (4) functional work containing stairs, roofing, doors, and windows. A stacked bar chart is used in Figure 12 to visualize the comparison of embodied carbon emissions in materialization stage during corresponding construction subprojects. As the components of functional work are exactly the same, the main differences are reflected in the other three subprojects. Structural construction dominates the carbon emissions in the PM scheme (58.24 t   C O 2 in total), while masonry engineering takes up the largest proportion in the BM structure (62.39 t   C O 2 in total). There is not a significant gap in CE between the foundation construction of the two structures (17.91 and 21.46 t   C O 2 , respectively). Generally, regarding the carbon emissions in the combination of main structural construction and masonry engineering, more C O 2 can be generated by the brick masonry structure.

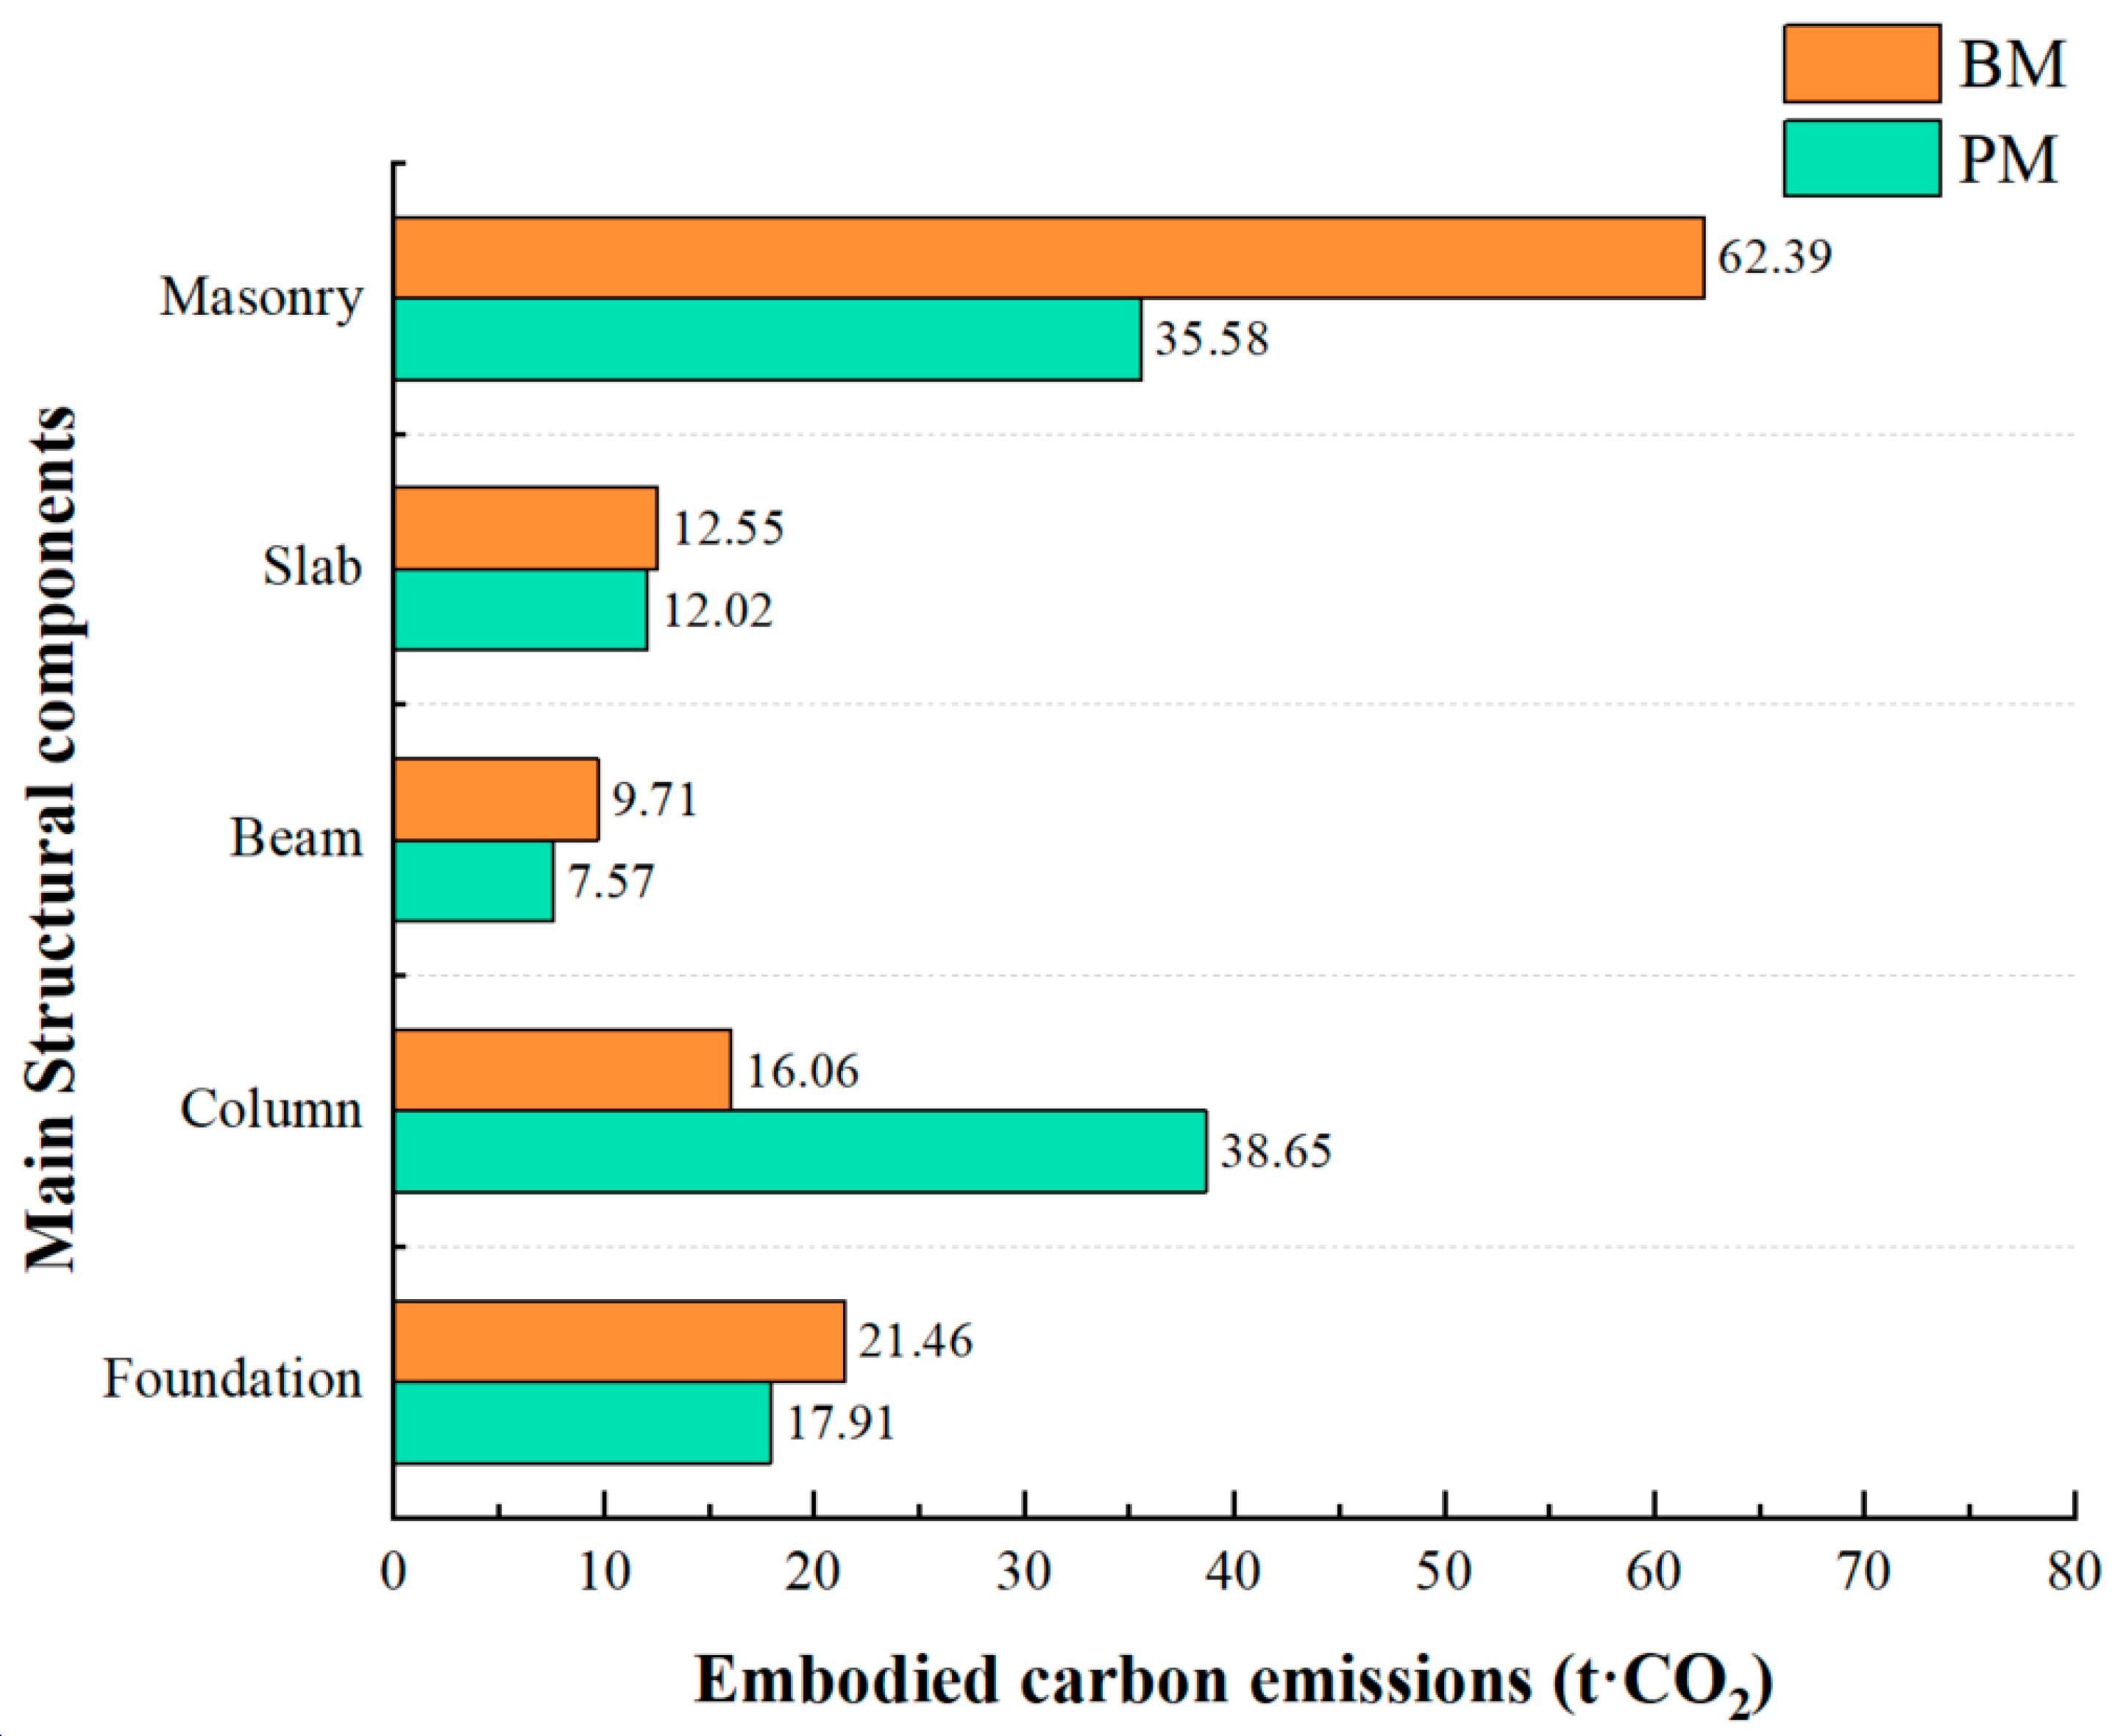
5.2.3. Embodied Emissions Analysis Based on Structural Components

Further analysis focused on the CE of specific structural components. The functional works were excluded from consideration as there is no difference in this part of both types of structures. The output is illustrated in Figure 13. Owing to the relatively poor load-bearing properties of precast aerocrete blocks, there are more structural columns in the PM scheme than in the BM scheme, whose spacing is basically in accordance with the width of the blocks (960 mm). This explains why the materialization of columns in the PM structure can produce more than twice the volume of C O 2 than columns in the BM structure. With regards to masonry blocks, the use of aerocrete and straw demonstrates a great advantage of carbon emission control compared to fired common bricks (reduction by nearly half). The remaining components demonstrate little difference in carbon emissions in the two types of structures. The combination of columns and precast aerocrete masonries in the PM scheme still realize the target of environmental protection and resource-saving, which can become an adaptive set of building products widely applied in the future.

5.3. Construction Costs

Cost estimation was conducted following carbon emission analysis, and the process is basically similar. As presented in Table 9, the PM structure can save more than CNY 56,000 compared to the BM structure. In terms of construction cost per unit area, the PM scheme expenses are CNY 827.81 per square meter, while CNY 925.77 are needed for each unit area in the BM structure. This new type of structure can save approximately 10% in construction costs compared to normal brick masonry structures.

5.3.1. Cost Estimation Based on Sub-Projects

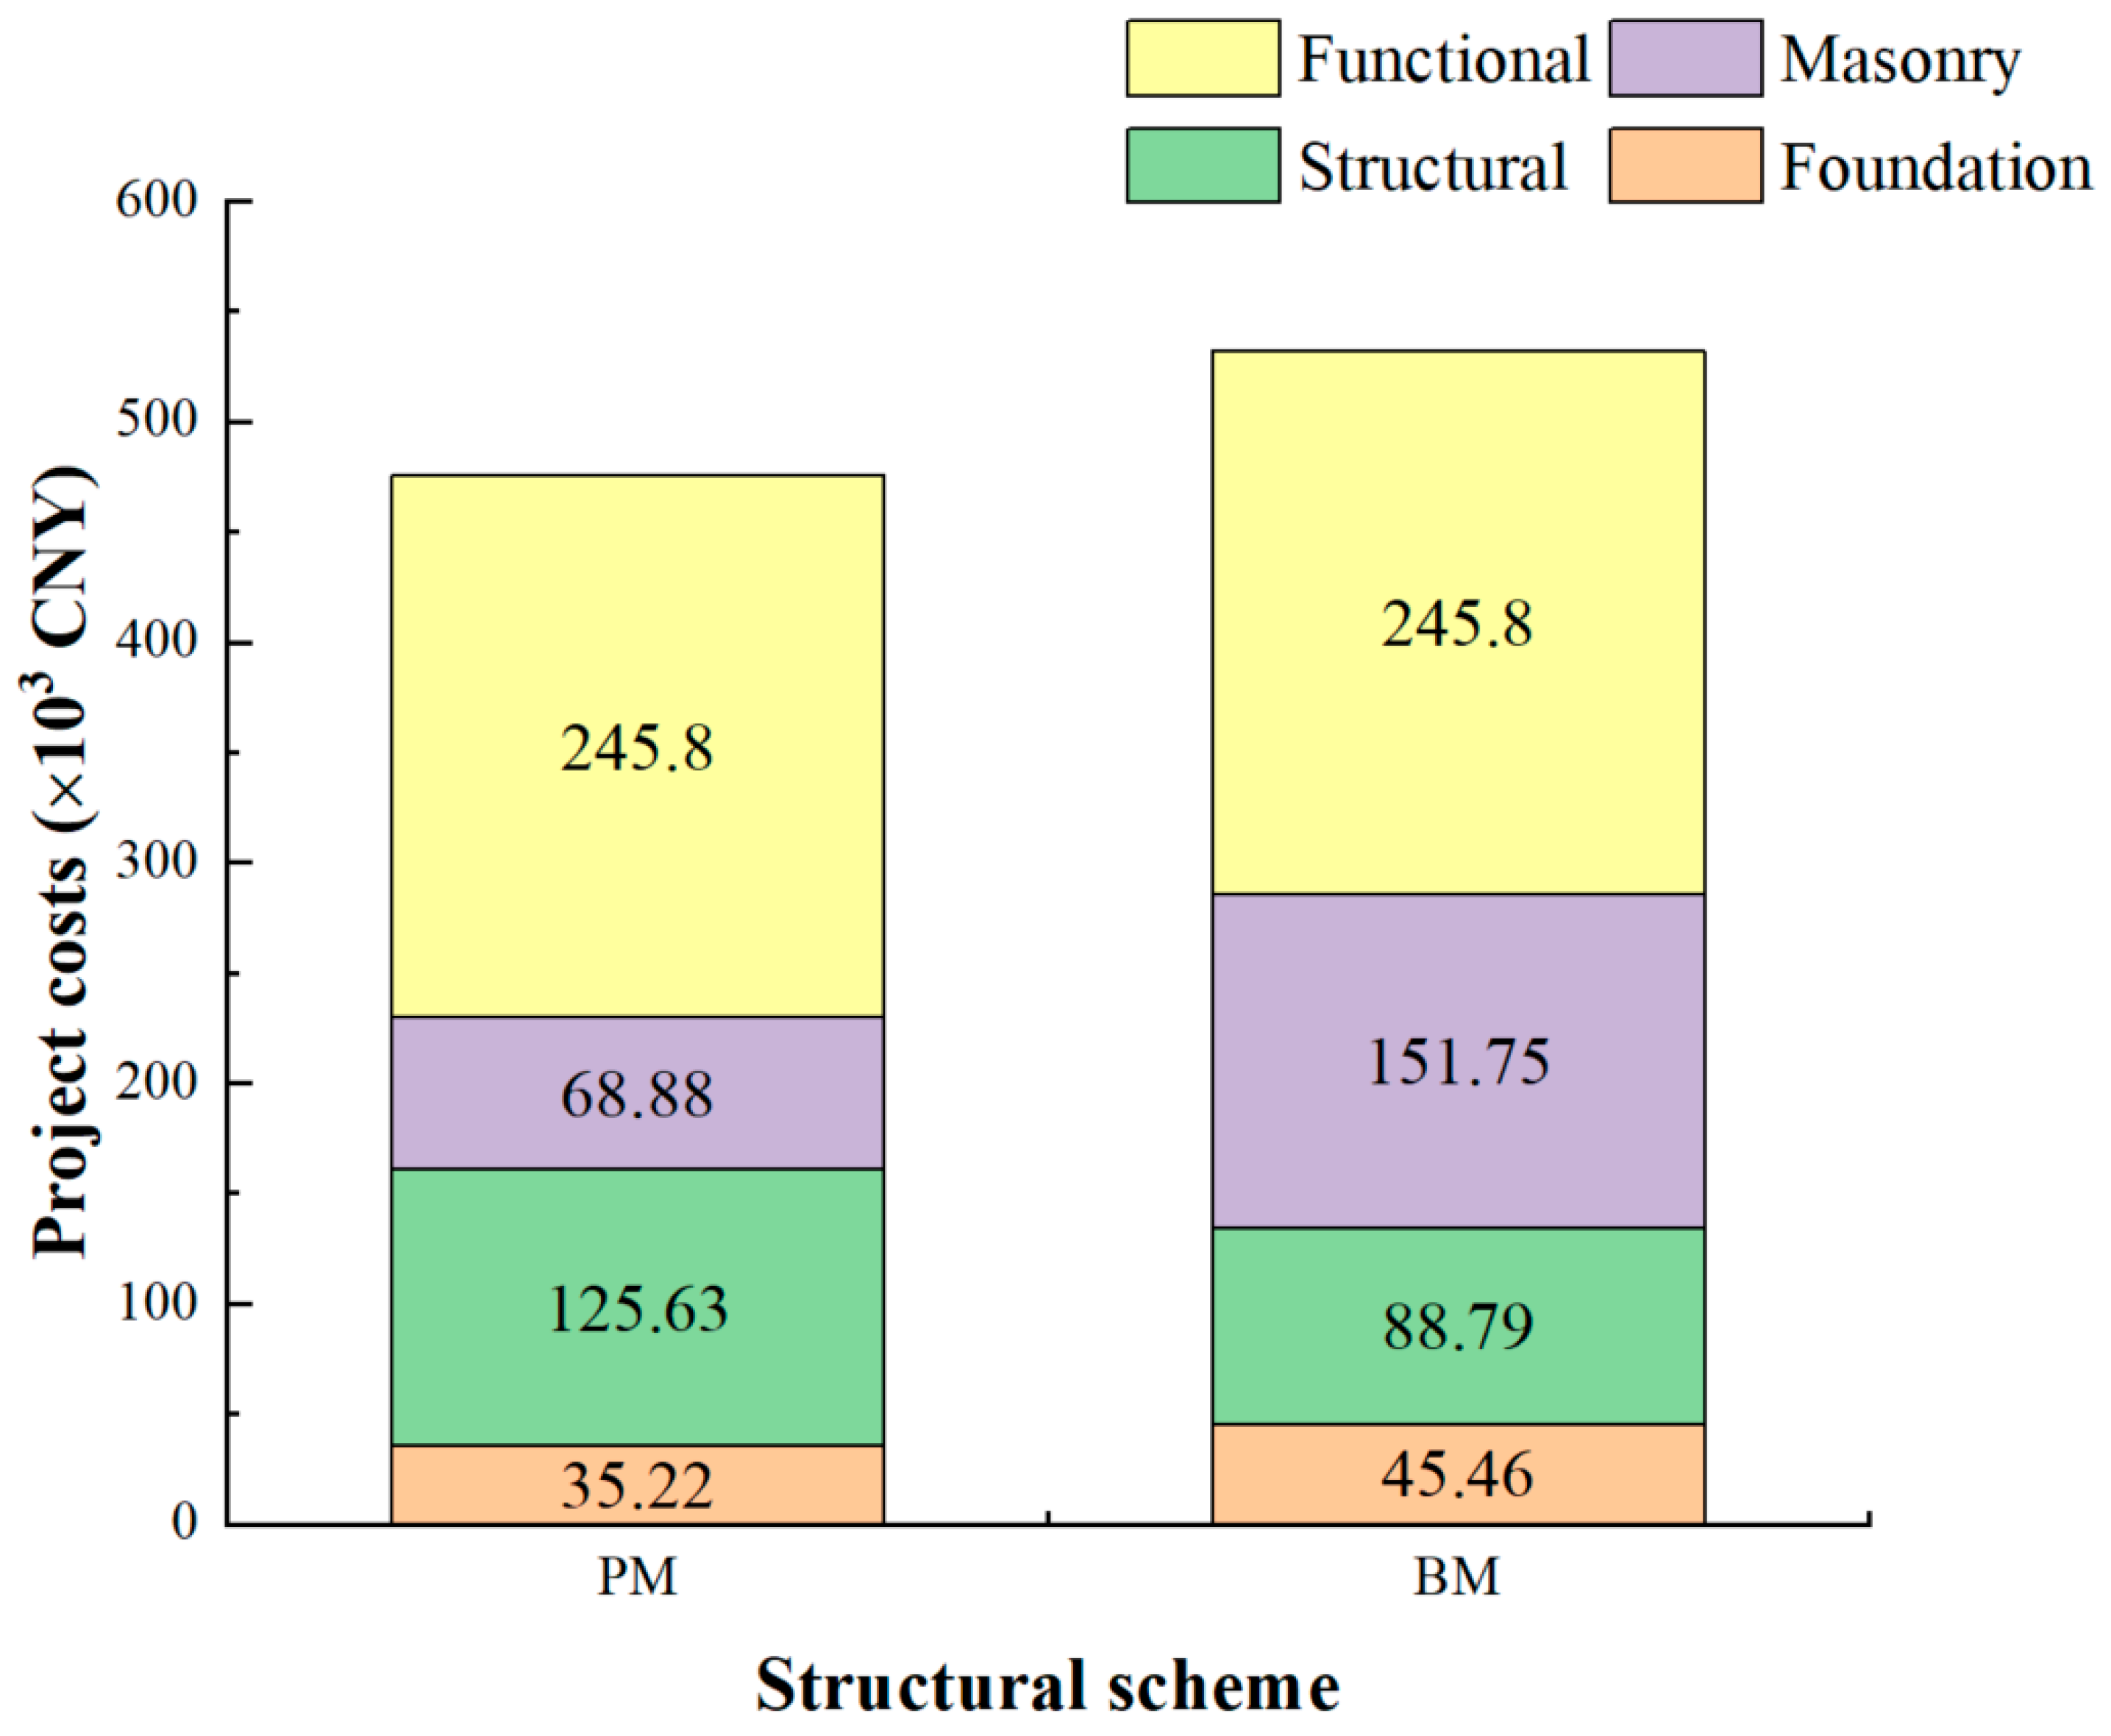
Applying a similar analytical logic, Figure 14 depicts costs of different sub-projects using a stacked bar chart to carry out a horizontal comparison. Aside from functional work, for which expenses are the same in both schemes, main structural construction and masonry engineering, respectively, account for the majority of costs in the PM and BM structures. The main explanation shows no difference from embodied carbon emissions.

5.3.2. Cost Estimation Based on Structural Components

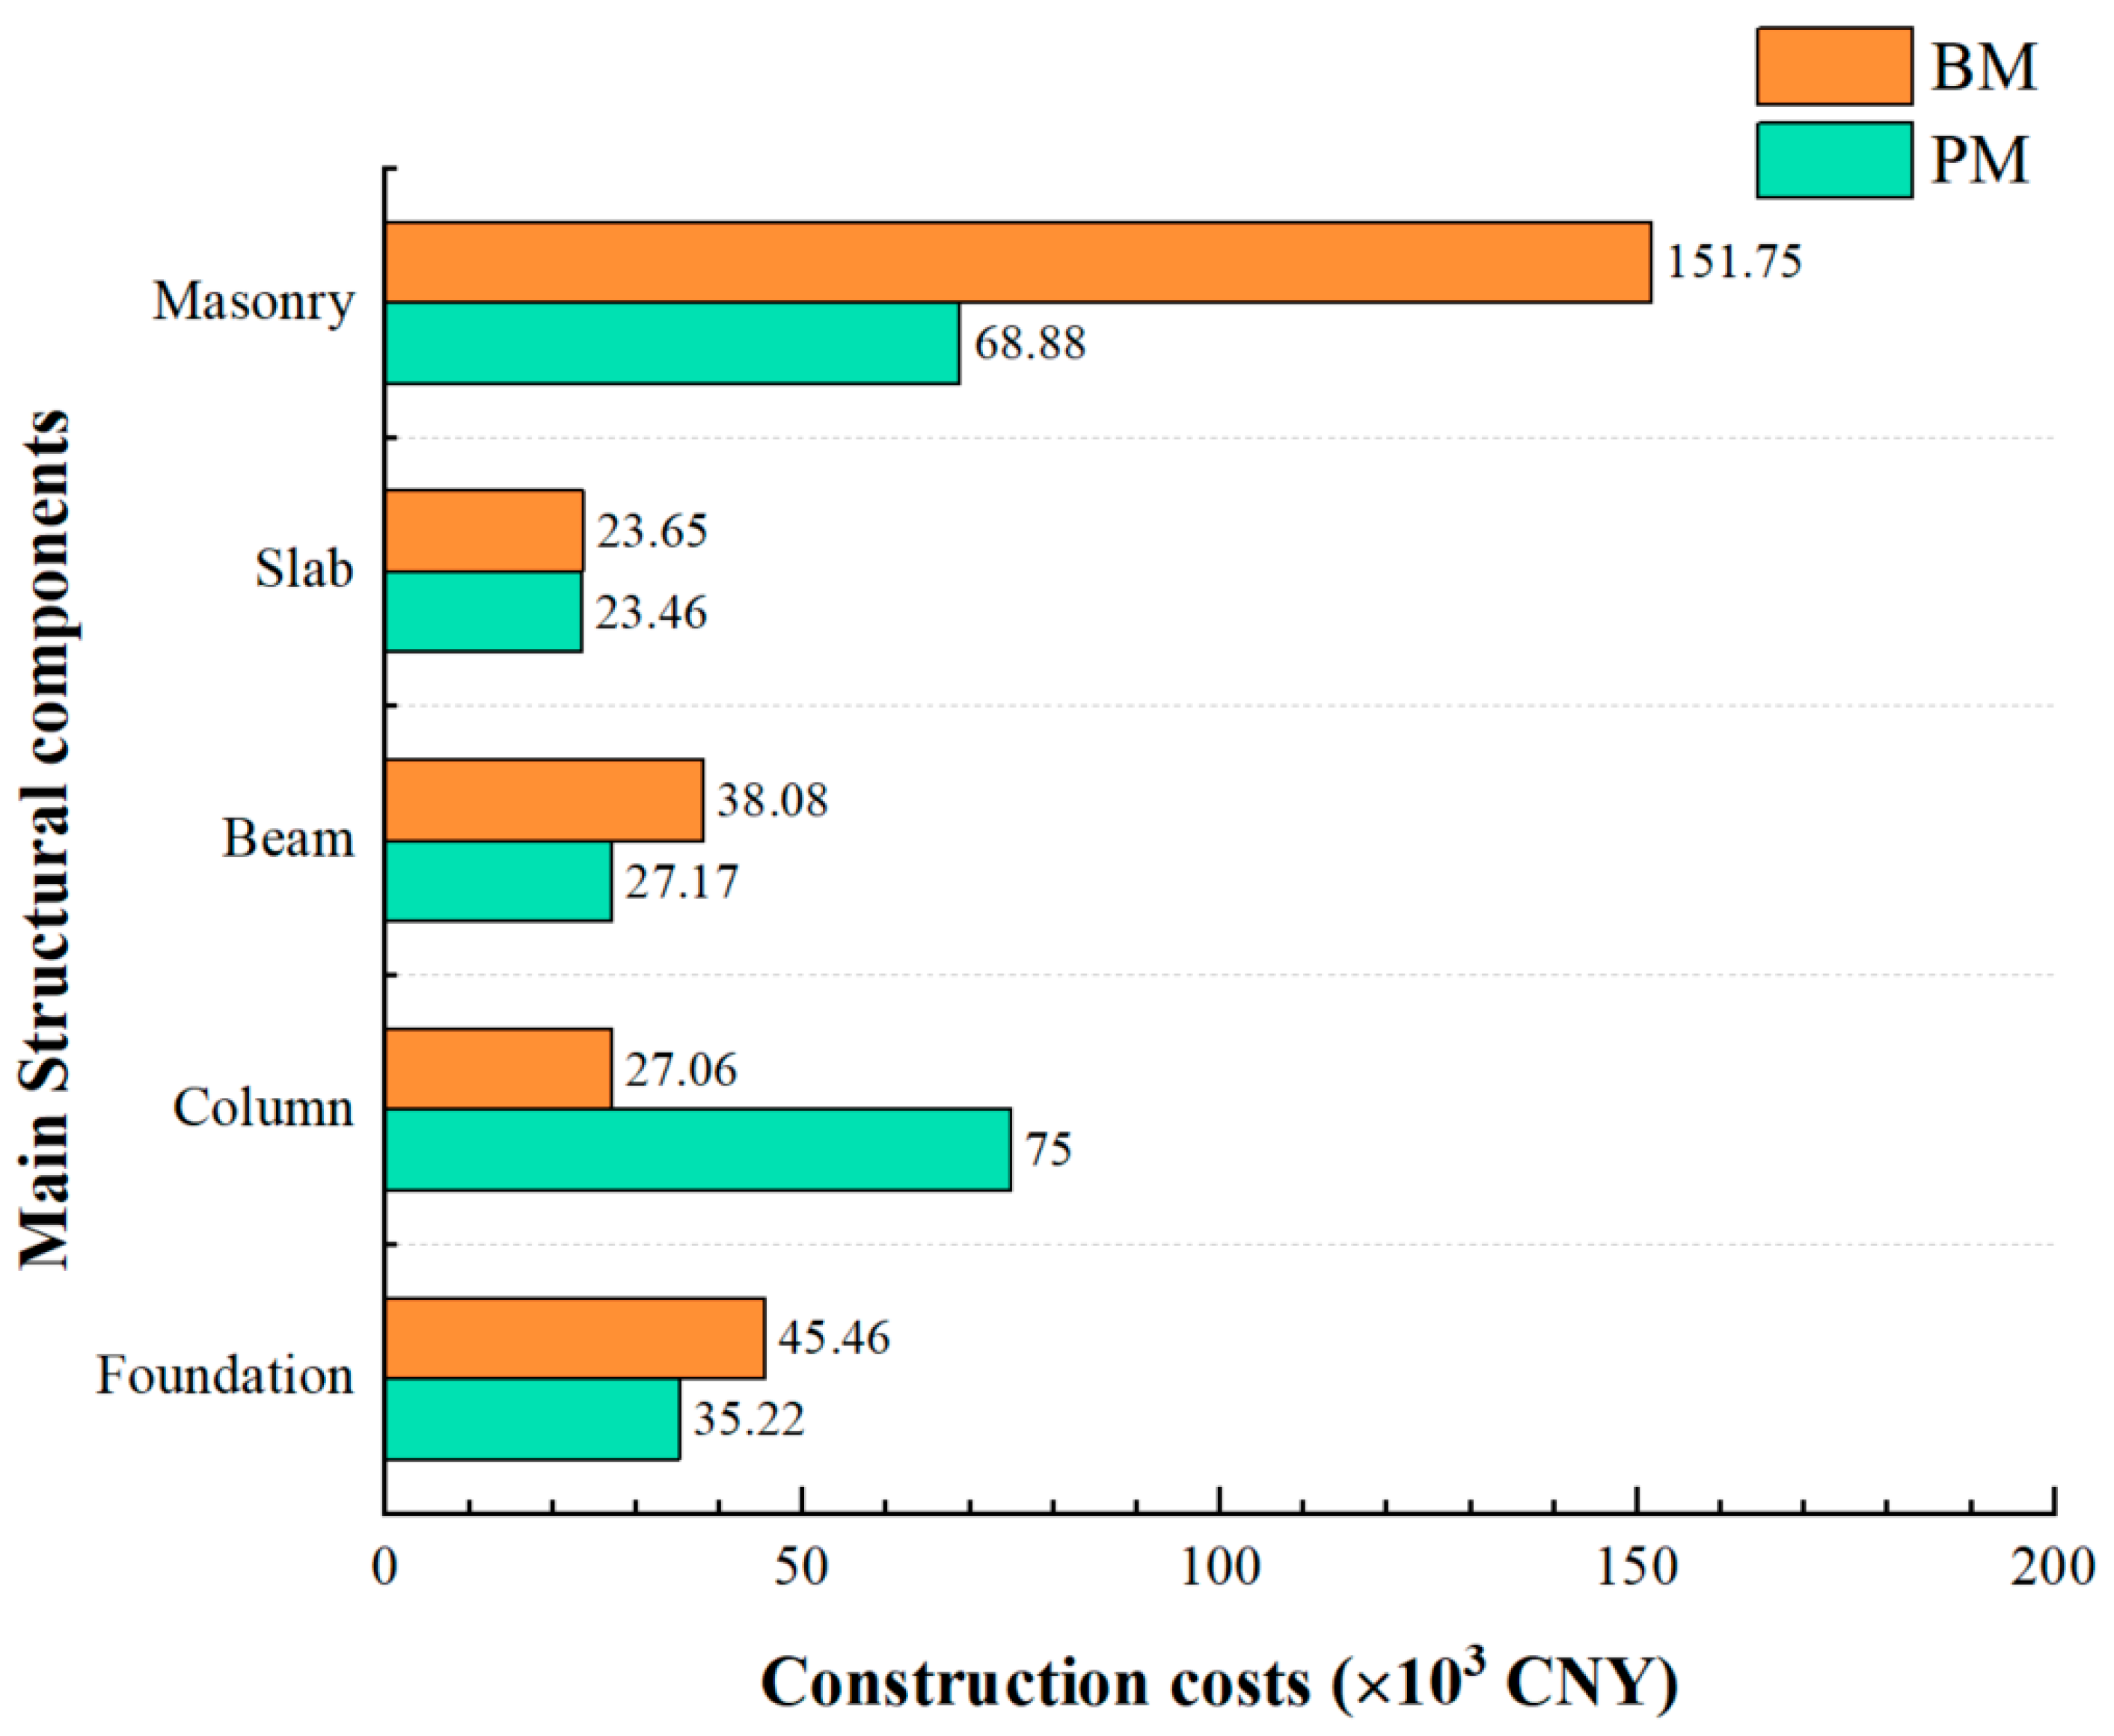
A cost refined analysis was also conducted in the aspect of components. As presented in Figure 15, the pattern is consistent with the former graph. The columnar arrangement is relatively denser in the PM scheme, which makes the cost much higher (nearly tripled). With regard to masonry, precast aerocrete blocks can significantly reduce costs, as they contain a certain amount of straw particles and openings. The application of this new type of masonry block saves over CNY 80,000, not only covering the extra money spent by columns but also considerable existing margins. Therefore, it can be concluded that the prefabricated block is the crucial factor resulting in the outstanding advantage of low cost.

5.4. Discussion

For a structural system currently under development and not yet widely implemented, this study employs full-scale shaking table tests to validate its safety. The experimental methodology and data collection, however, have limitations. For example, the results lack data on the walls’ ultimate failure modes and limit loads, as well as conclusive findings on parameters including residual drift, plastic deformation mapping, damage indices, and hysteretic response. Although the current test results adequately demonstrate the safety of the MRCWS under the investigated seismic conditions, the research depth remains insufficient and requires further development. Furthermore, the absence of a mature industrial supply chain complicates the collection of large-scale component data. Consequently, the carbon emissions and cost assessments presented here are subject to limitations. Accurate quantification will depend on future complementary research and the development of supporting industries, which are key focal points for subsequent work.

6. Conclusions

This study investigated the potential of promoting sustainable development in rural building construction via applying MRCWS, which has densely ribbed frames comprising both beams and columns and proposed a new type modular composite wall panel containing aerocrete and steel wire mesh. The contents of the research were divided into three parts: (1) seismic performance evaluation; (2) embodied carbon emission analysis; and (3) cost estimation. The main findings are as follows.
The prefabricated masonry showed good seismic performance subject to excitation waves of different intensities. Its dynamic and displacement response demonstrated that the structure could stay undamaged during earthquakes of fortification intensity and would not collapse in rarely-occurred earthquakes.
Compared to common brick masonry structure, the utilization of precast aerocrete blocks realized embodied carbon emission reduction of nearly 20 kg carbon dioxide per unit area in materialization and construction phases. The mixture of straw particles tackles the agricultural waste problem at the same time, which can double the environmental benefits as well.
In terms of construction costs, the case study in the Xuzhou region demonstrates a 10% reduction compared to traditional masonry structures, providing a valuable reference for rural construction in other economically developed regions of China.

Author Contributions

Conceptualization: Y.W. (Yanhua Wu), M.C., and H.Z.; methodology: Y.W. (Yanhua Wu), H.W., M.C., H.Z. and Y.X.; software: F.D.C.; validation: Y.W. (Yue Wang); formal analysis: F.D.C.; resources: H.Z. and C.L.; data curation: Y.W. (Yue Wang), H.W., and C.L.; writing—original draft, Y.W. (Yue Wang); writing—review and editing, Y.W. (Yanhua Wu); visualization: M.C., F.D.C., and Y.X.; supervision: Y.W. (Yanhua Wu), H.W., M.C., H.Z., and Y.X.; project administration: H.W. and M.C.; funding acquisition: Y.W. (Yanhua Wu) and M.C. All authors have read and agreed to the published version of the manuscript.

Funding

This research was funded by National Key R&D Program of China (2022YFC3803803).

Data Availability Statement

The data presented in this study are available on request from the corresponding author on reasonable request.

Conflicts of Interest

Authors Yanhua Wu and Meng Cong were employed by the company Architects & Engineers Co., Ltd., Southeast University. Author Yue Wang was employed by the company Power China Shanghai Electric Power Engineering Co., Ltd. Author Chun Liu was employed by the company Kunshan Ecological House Construction Technology Co., Ltd. The remaining authors declare that the research was conducted in the absence of any commercial or financial relationships that could be construed as a potential conflict of interest.

Abbreviations

The following abbreviations are used in this manuscript:
Abbreviations
RWPRural White Paper
AECArchitecture, Engineering, and Construction
RCSReinforced Concrete Structure
CECarbon Emission
NDCsNationally Determined Contributions
FFCGCWSFully Fabricated Concrete Grating Composite Wall Structure
LCALife Cycle Assessment
P-LCAProcess-based Life Cycle Assessment
IO-LCAInput–Output Life Cycle Assessment
H-LCAHybrid Life Cycle Assessment
EFAEmission Factor Approach
EFsEmission Factors
LCCLife Cycle Costing
UPUnit Price
MRCWSMulti-Ribbed Composite Wall Structure
BMSBrick Masonry Structure
OPSOil Palm Shell
PGAsPeak Ground Accelerations
Variables
Q m a t , i quantity of material i
E F m a t , i emission factor of material i
U P m a t , i unit price of material i
Subscript
matmaterial
bloblock
aeraerocrete
strstraw

References

  1. Tan, Y.; Xu, H.; Zhang, X. Sustainable Urbanization in China: A Comprehensive Literature Review. Cities 2016, 55, 82–93. [Google Scholar] [CrossRef]
  2. Gu, C. Urbanization: Processes and Driving Forces. Sci. China Earth Sci. 2019, 62, 1351–1360. [Google Scholar] [CrossRef]
  3. Zhang, Y.-J.; Liu, Z.; Zhang, H.; Tan, T.-D. The Impact of Economic Growth, Industrial Structure and Urbanization on Carbon Emission Intensity in China. Nat. Hazards 2014, 73, 579–595. [Google Scholar] [CrossRef]
  4. Lang, W.; Chen, T.; Li, X. A New Style of Urbanization in China: Transformation of Urban Rural Communities. Habitat. Int. 2016, 55, 1–9. [Google Scholar] [CrossRef]
  5. Henderson, J.V. Urbanization in China: Policy Issues and Options; Brown University: Providence, RI, USA, 2009. [Google Scholar]
  6. Heikkila, E.J. Three Questions Regarding Urbanization in China. J. Plan. Educ. Res. 2007, 27, 65–81. [Google Scholar] [CrossRef]
  7. Long, H.; Liu, Y.; Wu, X.; Dong, G. Spatio-Temporal Dynamic Patterns of Farmland and Rural Settlements in Su–Xi–Chang Region: Implications for Building a New Countryside in Coastal China. Land Use Policy 2009, 26, 322–333. [Google Scholar] [CrossRef]
  8. Hodge, I. On Penguins on Icebergs: The Rural White Paper and the Assumptions of Rural Policy. J. Rural. Stud. 1996, 12, 331–337. [Google Scholar] [CrossRef]
  9. So, J.K. Inclusive Growth through Saemaul Undong in Korea. Area Dev. Policy 2019, 4, 400–416. [Google Scholar] [CrossRef]
  10. Long, H.; Liu, Y.; Li, X.; Chen, Y. Building New Countryside in China: A Geographical Perspective. Land Use Policy 2010, 27, 457–470. [Google Scholar] [CrossRef]
  11. Liu, W.; Spaargaren, G.; Mol, A.P.J.; Heerink, N.; Wang, C. Low Carbon Rural Housing Provision in China: Participation and Decision Making. J. Rural. Stud. 2014, 35, 80–90. [Google Scholar] [CrossRef]
  12. Colombier, M.; Li, J. Shaping Climate Policy in the Housing Sector in Northern Chinese Cities. Clim. Policy 2012, 12, 453–473. [Google Scholar] [CrossRef]
  13. Wang, H.; Su, F.; Wang, L.; Tao, R. Rural Housing Consumption and Social Stratification in Transitional China: Evidence from a National Survey. Hous. Stud. 2012, 27, 667–684. [Google Scholar] [CrossRef]
  14. National Bureau of Statistics of China. China Statistical Yearbook; China Statistics Press: Beijing, China, 2013. [Google Scholar]
  15. Ren, H.; Yuan, N.; Hu, H. Housing Quality and Its Determinants in Rural China: A Structural Equation Model Analysis. J. Hous. Built Environ. 2019, 34, 313–329. [Google Scholar] [CrossRef]
  16. Wang, C.; Engels, A.; Wang, Z. Overview of Research on China’s Transition to Low-Carbon Development: The Role of Cities, Technologies, Industries and the Energy System. Renew. Sustain. Energy Rev. 2018, 81, 1350–1364. [Google Scholar] [CrossRef]
  17. Wang, Q.; Lei, X.P.; Wang, P. Characteristics and Mechanics of Earthquake Damage of Brick-Wood Building. Adv. Mater. Res. 2014, 838–841, 1517–1521. [Google Scholar] [CrossRef]
  18. Qu, M.; Pelkonen, P.; Tahvanainen, L.; Arevalo, J.; Gritten, D. Experts’ Assessment of the Development of Wood Framed Houses in China. J. Clean. Prod. 2012, 31, 100–105. [Google Scholar] [CrossRef]
  19. Shafigh, P.; Mahmud, H.B.; Jumaat, M.Z.; Zargar, M. Agricultural Wastes as Aggregate in Concrete Mixtures—A Review. Constr. Build. Mater. 2014, 53, 110–117. [Google Scholar] [CrossRef]
  20. Meyer, C. The Greening of the Concrete Industry. Cem. Concr. Compos. 2009, 31, 601–605. [Google Scholar] [CrossRef]
  21. Chen, G.; Wang, Z.; Zuo, X.; Du, X.; Gao, H. Shaking Table Test on the Seismic Failure Characteristics of a Subway Station Structure on Liquefiable Ground. Earthq. Eng. Struct. Dyn. 2013, 42, 1489–1507. [Google Scholar] [CrossRef]
  22. Igarashi, A.; Iemura, H.; Suwa, T. Development of Substructured Shaking Table Test Method. In Proceedings of the 12th World Conference on Earthquake Engineering, Auckland, New Zealand, 30 January–4 February 2000. [Google Scholar]
  23. Graziotti, F.; Tomassetti, U.; Kallioras, S.; Penna, A.; Magenes, G. Shaking Table Test on a Full Scale URM Cavity Wall Building. Bull. Earthq. Eng. 2017, 15, 5329–5364. [Google Scholar] [CrossRef]
  24. Lu, X.; Zou, Y.; Lu, W.; Zhao, B. Shaking Table Model Test on Shanghai World Financial Center Tower. Earthq. Eng. Struct. Dyn. 2007, 36, 439–457. [Google Scholar] [CrossRef]
  25. Wang, Y.; Wang, M.; Liu, K.; Pan, W.; Yang, X. Shaking Table Tests on Seismic Retrofitting of Rammed-Earth Structures. Bull. Earthq. Eng. 2017, 15, 1037–1055. [Google Scholar] [CrossRef]
  26. Liu, F.; Wang, J.; Zhou, B.; Wu, M.; He, J.; Bin, J. Shaking Table Study on Rubber-Sand Mixture Cored Composite Block as Low-Cost Isolation Bearing for Rural Houses. J. Build. Eng. 2023, 76, 107413. [Google Scholar] [CrossRef]
  27. Liu, Z.; Shen, M.; Zhang, F.; Xue, J.; Liang, Y. Seismic Behavior of the Brick Masonry Rural Building Strengthened with Polypropylene Grid Cement Mortar Coating: Shaking Table Tests. Soil. Dyn. Earthq. Eng. 2024, 176, 108318. [Google Scholar] [CrossRef]
  28. Zhou, T.; Wang, Z.; Liu, H.; Yuan, H.; Shu, Z.; Guo, J. Seismic Behavior of a New Fabricated Concrete Grating Composite Wall Structure in Rural Residences: Shaking Table Test and Finite Element Analysis. J. Build. Eng. 2024, 82, 108254. [Google Scholar] [CrossRef]
  29. Xiang, Y.; Bu, J.; Zhu, K.; Ma, K.; Opoku, A.; Florez-Perez, L.; Zhang, H.; Wu, Y. Reconsidering Adaptive Industrialized Construction in Chinese Rural Areas: Responding to the Challenge of COVID-19. Build. Res. Inf. 2023, 51, 316–332. [Google Scholar] [CrossRef]
  30. Dissanayake, D.M.K.W.; Jayasinghe, C.; Jayasinghe, M.T.R. A Comparative Embodied Energy Analysis of a House with Recycled Expanded Polystyrene (EPS) Based Foam Concrete Wall Panels. Energy Build. 2017, 135, 85–94. [Google Scholar] [CrossRef]
  31. Akbarnezhad, A.; Xiao, J. Estimation and Minimization of Embodied Carbon of Buildings: A Review. Buildings 2017, 7, 5. [Google Scholar] [CrossRef]
  32. Sartori, I.; Hestnes, A.G. Energy Use in the Life Cycle of Conventional and Low-Energy Buildings: A Review Article. Energy Build. 2007, 39, 249–257. [Google Scholar] [CrossRef]
  33. Copiello, S. Economic Implications of the Energy Issue: Evidence for a Positive Non-Linear Relation between Embodied Energy and Construction Cost. Energy Build. 2016, 123, 59–70. [Google Scholar] [CrossRef]
  34. Davies, P.J.; Emmitt, S.; Firth, S.K. Challenges for Capturing and Assessing Initial Embodied Energy: A Contractor’s Perspective. Constr. Manag. Econ. 2014, 32, 290–308. [Google Scholar] [CrossRef]
  35. Dixit, M.K. Life Cycle Embodied Energy Analysis of Residential Buildings: A Review of Literature to Investigate Embodied Energy Parameters. Renew. Sustain. Energy Rev. 2017, 79, 390–413. [Google Scholar] [CrossRef]
  36. Gustavsson, L.; Joelsson, A. Life Cycle Primary Energy Analysis of Residential Buildings. Energy Build. 2010, 42, 210–220. [Google Scholar] [CrossRef]
  37. Huang, B.; Chen, Y.; McDowall, W.; Türkeli, S.; Bleischwitz, R.; Geng, Y. Embodied GHG Emissions of Building Materials in Shanghai. J. Clean. Prod. 2019, 210, 777–785. [Google Scholar] [CrossRef]
  38. Li, H.; Luo, Z.; Xu, X.; Cang, Y.; Yang, L. Assessing the Embodied Carbon Reduction Potential of Straw Bale Rural Houses by Hybrid Life Cycle Assessment: A Four-Case Study. J. Clean. Prod. 2021, 303, 127002. [Google Scholar] [CrossRef]
  39. Dong, Y.H.; Jaillon, L.; Chu, P.; Poon, C.S. Comparing Carbon Emissions of Precast and Cast-in-Situ Construction Methods—A Case Study of High-Rise Private Building. Constr. Build. Mater. 2015, 99, 39–53. [Google Scholar] [CrossRef]
  40. Mao, C.; Shen, Q.; Shen, L.; Tang, L. Comparative Study of Greenhouse Gas Emissions between Off-Site Prefabrication and Conventional Construction Methods: Two Case Studies of Residential Projects. Energy Build. 2013, 66, 165–176. [Google Scholar] [CrossRef]
  41. Resch, E.; Lausselet, C.; Brattebø, H.; Andresen, I. An Analytical Method for Evaluating and Visualizing Embodied Carbon Emissions of Buildings. Build. Environ. 2020, 168, 106476. [Google Scholar] [CrossRef]
  42. Guan, J.; Zhang, Z.; Chu, C. Quantification of Building Embodied Energy in China Using an Input–Output-Based Hybrid LCA Model. Energy Build. 2016, 110, 443–452. [Google Scholar] [CrossRef]
  43. Zhang, X.; Wang, F. Assessment of Embodied Carbon Emissions for Building Construction in China: Comparative Case Studies Using Alternative Methods. Energy Build. 2016, 130, 330–340. [Google Scholar] [CrossRef]
  44. Cheung, M.; Fan, J. Carbon Reduction in a High-Density City: A Case Study of Langham Place Hotel Mongkok Hong Kong. Renew. Energy 2013, 50, 433–440. [Google Scholar] [CrossRef]
  45. Kneifel, J. Life-Cycle Carbon and Cost Analysis of Energy Efficiency Measures in New Commercial Buildings. Energy Build. 2010, 42, 333–340. [Google Scholar] [CrossRef]
  46. You, F.; Hu, D.; Zhang, H.; Guo, Z.; Zhao, Y.; Wang, B.; Yuan, Y. Carbon Emissions in the Life Cycle of Urban Building System in China—A Case Study of Residential Buildings. Ecol. Complex. 2011, 8, 201–212. [Google Scholar] [CrossRef]
  47. Nässén, J.; Holmberg, J.; Wadeskog, A.; Nyman, M. Direct and Indirect Energy Use and Carbon Emissions in the Production Phase of Buildings: An Input–Output Analysis. Energy 2007, 32, 1593–1602. [Google Scholar] [CrossRef]
  48. Onat, N.C.; Kucukvar, M.; Tatari, O. Scope-Based Carbon Footprint Analysis of U.S. Residential and Commercial Buildings: An Input–Output Hybrid Life Cycle Assessment Approach. Build. Environ. 2014, 72, 53–62. [Google Scholar] [CrossRef]
  49. Hu, S.; Zhang, Y.; Yang, Z.; Yan, D.; Jiang, Y. Challenges and Opportunities for Carbon Neutrality in China’s Building Sector—Modelling and Data. Build. Simul. 2022, 15, 1899–1921. [Google Scholar] [CrossRef]
  50. Asadi Zeidabadi, Z.; Bakhtiari, S.; Abbaslou, H.; Ghanizadeh, A.R. Synthesis, Characterization and Evaluation of Biochar from Agricultural Waste Biomass for Use in Building Materials. Constr. Build. Mater. 2018, 181, 301–308. [Google Scholar] [CrossRef]
  51. Ghofrani, M.; Mokaram, K.N.; Ashori, A.; Torkaman, J. Fiber-Cement Composite Using Rice Stalk Fiber and Rice Husk Ash: Mechanical and Physical Properties. J. Compos. Mater. 2015, 49, 3317–3322. [Google Scholar] [CrossRef]
  52. Aprianti, E.; Shafigh, P.; Bahri, S.; Farahani, J.N. Supplementary Cementitious Materials Origin from Agricultural Wastes—A Review. Constr. Build. Mater. 2015, 74, 176–187. [Google Scholar] [CrossRef]
  53. Mannan, M.A.; Ganapathy, C. Concrete from an Agricultural Waste-Oil Palm Shell (OPS). Build. Environ. 2004, 39, 441–448. [Google Scholar] [CrossRef]
  54. Gunasekaran, K.; Kumar, P.S.; Lakshmipathy, M. Mechanical and Bond Properties of Coconut Shell Concrete. Constr. Build. Mater. 2011, 25, 92–98. [Google Scholar] [CrossRef]
  55. Madandoust, R.; Ranjbar, M.M.; Moghadam, H.A.; Mousavi, S.Y. Mechanical Properties and Durability Assessment of Rice Husk Ash Concrete. Biosyst. Eng. 2011, 110, 144–152. [Google Scholar] [CrossRef]
  56. Pinto, J.; Paiva, A.; Varum, H.; Costa, A.; Cruz, D.; Pereira, S.; Fernandes, L.; Tavares, P.; Agarwal, J. Corn’s Cob as a Potential Ecological Thermal Insulation Material. Energy Build. 2011, 43, 1985–1990. [Google Scholar] [CrossRef]
  57. Shafigh, P.; Jumaat, M.Z.; Mahmud, H. Oil Palm Shell as a Lightweight Aggregate for Production High Strength Lightweight Concrete. Constr. Build. Mater. 2011, 25, 1848–1853. [Google Scholar] [CrossRef]
  58. Li, K.; Wang, X.; Li, H.; Zheng, M.; Peng, B.; Kong, F.; Zhang, Z. Analysis on Energy Saving and Thermal Insulation Performance of Improved Straw Brick in Northern Cold Area. Arab. J. Geosci. 2020, 13, 807. [Google Scholar] [CrossRef]
  59. Assaf, M.; Brachelet, F.; Tittelein, P.; Defer, D.; Antczak, E. Evaluating Long-Term Durability of a Novel Straw Bale Wall in a Temperate Oceanic Climate. Constr. Build. Mater. 2025, 492, 142876. [Google Scholar] [CrossRef]
  60. Farooqi, M.U.; Ali, M. Durability Evaluation of Wheat Straw Reinforced Concrete for Sustainable Structures. J. Build. Eng. 2024, 82, 108400. [Google Scholar] [CrossRef]
  61. Kiki, G.; Nshimiyimana, P.; Kouchadé, C.; Messan, A.; Houngan, A.; André, P. Physico–Mechanical and Durability Performances of Compressed Earth Blocks Incorporating Quackgrass Straw: An Alternative to Fired Clay. Constr. Build. Mater. 2023, 403, 133064. [Google Scholar] [CrossRef]
  62. Staszak, N.; Szymczak-Graczyk, A.; Garbowski, T. Elastic Analysis of Three-Layer Concrete Slab Based on Numerical Homogenization with an Analytical Shear Correction Factor. Appl. Sci. 2022, 12, 9918. [Google Scholar] [CrossRef]
  63. Ksit, B.; Szymczak-Graczyk, A.; Pilch, R. Numerical Simulation of the Impact of Water Vapour and Moisture Blockers in Energy Diagnostics of Ventilated Partitions. Materials 2022, 15, 8257. [Google Scholar] [CrossRef]
  64. Szymczak-Graczyk, A. Rectangular Plates of a Trapezoidal Cross-Section Subjected to Thermal Load. IOP Conf. Ser. Mater. Sci. Eng. 2019, 603, 032095. [Google Scholar] [CrossRef]
  65. Xu, Y.; Di, X. Investigation and Analysis of Collapse Mechanism and Calamity Resistance Per-Formance of Structure: Third Anniversary Memorial of 5·12 Wenchuan Earth-Quake. J. Build. Struct. 2011, 32, 1–8. [Google Scholar] [CrossRef]
  66. Ministry of Housing and Urban–Rural Development of the People’s Republic of China. Guiding Opinions on Strengthening the Administration of Rural Housing Construction; State Council of the People’s Republic of China: Beijing, China, 2024. [Google Scholar]
  67. Zhu, K.; Xiang, Y.; Bu, J.; Zhang, H. The Design and Construction of Public Service Building in Developing Rural Regions During the Post COVID-19 Period: Cased on a Chinese Village Centre. In Proceedings of the 37th Annual ARCOM Conference, Virtual, 6–7 September 2021; Available online: https://www.arcom.ac.uk/-docs/proceedings/a4656cbe0b10b63d3cafbf1475a2e4c0.pdf (accessed on 20 August 2023).
  68. Hu, X.; Xiang, Y.; Zhang, H.; Lin, Q.; Wang, W.; Wang, H. Active–Passive Combined Energy-Efficient Retrofit of Rural Residence with Non-Benchmarked Construction: A Case Study in Shandong Province, China. Energy Rep. 2021, 7, 1360–1373. [Google Scholar] [CrossRef]
  69. DGJ09-9-2003; Code for Seismic Design of Buildings. Shanghai Municipal Commission of Housing and Urban-Rural Development: Shanghai, China, 2003.
  70. Teng, Y.; Pan, W. Estimating and Minimizing Embodied Carbon of Prefabricated High-Rise Residential Buildings Considering Parameter, Scenario and Model Uncertainties. Build. Environ. 2020, 180, 106951. [Google Scholar] [CrossRef]
  71. Li, X.; Xie, W.; Xu, L.; Li, L.; Jim, C.Y.; Wei, T. Holistic Life-Cycle Accounting of Carbon Emissions of Prefabricated Buildings Using LCA and BIM. Energy Build. 2022, 266, 112136. [Google Scholar] [CrossRef]
  72. Zhang, X.; Zheng, R. Reducing Building Embodied Emissions in the Design Phase: A Comparative Study on Structural Alternatives. J. Clean. Prod. 2020, 243, 118656. [Google Scholar] [CrossRef]
  73. Maamoun, N. The Kyoto Protocol: Empirical Evidence of a Hidden Success. J. Environ. Econ. Manag. 2019, 95, 227–256. [Google Scholar] [CrossRef]
  74. Xiang, Y.; Ma, K.; Mahamadu, A.-M.; Florez-Perez, L.; Zhu, K.; Wu, Y. Embodied Carbon Determination in the Transportation Stage of Prefabricated Constructions: A Micro-Level Model Using the Bin-Packing Algorithm and Modal Analysis Model. Energy Build. 2023, 279, 112640. [Google Scholar] [CrossRef]
  75. GB/T 50010-2010; Code for Design of Concrete Structures. Ministry of Housing and Urban–Rural Development of the People’s Republic of China: Beijing, China, 2020.
  76. GB/T 50011-2010; Code for Seismic Design of Buildings. Ministry of Housing and Urban–Rural Development of the People’s Republic of China: Beijing, China, 2024.
  77. GB 50003-2011; Code for Design of Masonry Structures. Ministry of Housing and Urban–Rural Development of the People’s Republic of China: Beijing, China, 2011.
  78. Bureau of Housing and Urban–Rural Development of Xuzhou Municipal. Market Guideline Prices for Major Construction Materials; Bureau of Housing and Urban–Rural Development of Xuzhou Municipal: Xuzhou, China, 2019. [Google Scholar]
  79. GB/T 51366-2019; Standard for Building Carbon Emission Calculation. Ministry of Housing and Urban–Rural Development of the People’s Republic of China: Beijing, China, 2019.
  80. Miao, Z.; Chen, K.; Ma, D.; Yang, D.; Liu, Y. Analysis on Seismic Collapse Vulnerability of Masonry Structuresof Residential Houses in Rural Areas. J. Southeast Univ. (Nat. Sci. Ed.) 2024, 2024, 1154–1160. [Google Scholar] [CrossRef]
  81. Cao, G.; Zhang, X.; Wang, Y.; Zheng, F. Estimation of Emissions from Field Burning of Crop Straw in China. Chin. Sci. Bull. 2008, 53, 784–790. [Google Scholar] [CrossRef]
  82. Lam, P.S.W.; Sokhansanj, S.; Bi, X.; Lim, J.; Naimi, L.; Hoque, M.; Mani, S.; Womac, A.; Ye, X.; Narayan, S. Bulk Density of Wet and Dry Wheat Straw and Switchgrass Particles. Appl. Eng. Agric. 2008, 24, 351–358. [Google Scholar] [CrossRef]
Figure 1. Per capita living space of rural residents and housing structure types in China [14].
Buildings 16 00465 g001
Figure 2. Wenchuan seismic wave in N–S direction.
Buildings 16 00465 g002
Figure 3. Wenchuan seismic wave in E–W direction.
Buildings 16 00465 g003
Figure 4. El Centro seismic wave in N–S direction.
Buildings 16 00465 g004
Figure 5. El Centro seismic wave in E–W direction.
Buildings 16 00465 g005
Figure 6. Shanghai artificial seismic wave SHW3.
Buildings 16 00465 g006
Figure 7. Counterweight scheme.
Buildings 16 00465 g007
Figure 8. Exploded view of MRCWS.
Buildings 16 00465 g008
Figure 9. Plan of the assessed building.
Buildings 16 00465 g009aBuildings 16 00465 g009b
Figure 10. Architectural rendering sketch of the assessed rural building.
Buildings 16 00465 g010
Figure 11. Visible cracks at the corner of the window and door opening. (a) transverse walls under the PGA of 1.2 g; (b) longitudinal wall under the PGA of 1.5 g.
Buildings 16 00465 g011
Figure 12. Carbon emissions of the assessed building for different schemes.
Buildings 16 00465 g012
Figure 13. Embodied carbon emissions of the structural components for different schemes.
Buildings 16 00465 g013
Figure 14. Project costs of the assessed building for different schemes.
Buildings 16 00465 g014
Figure 15. Construction costs of the structural components for different schemes.
Buildings 16 00465 g015
Table 1. Potential applications of agricultural wastes.
Agricultural WastesPotential Application
Oil palm shell (OPS)lightweight aggregate for producing lightweight concrete
producing high strength OPS lightweight concrete
Coconut shellcoarse aggregate in the production of concrete
lightweight aggregate for producing lightweight concrete
Corn coba cementitious material in blended cement concrete
suitable building material for thermal and sound insulation
lightweight concrete for non-structural applications
Rice husk (RH)aggregate for making light weight and insulating concrete
Tobacco wasteadditive as coating and dividing material in construction
Table 2. Bill of quantities.
MaterialsSubcategoriesConsumption
MRCWSBMS
Concrete 175.84   m 3
Foundation 60.72   m 3 52.46   m 3
Column 59.63   m 3 28.93   m 3
Beam 9.83   m 3 12.57   m 3
Slab 27.89   m 3 29.79   m 3
Stair 17.77   m 3 17.77   m 3
Masonry 151.10   m 3 182.93   m 3
Rebar 13,049.85 kg
Column8786.63 kg6067.67 kg
Beam1965.78 kg2505.20 kg
Slab1583.67 kg1569.73 kg
Stair713.77 kg713.77 kg
Steel wire mesh 2205.47   m 2 -
Mortar 37.41   m 3 46.82   m 3
Doors and Windows 168.13   m 2 168.13   m 2
Table 3. Emissions factors and unit costs of main construction materials.
Construction MaterialsUnitEmissions Factor
(kg·CO2e/Unit)
Unit Cost
(CNY/Unit)
Data Source
Concrete (C30) m 3 m 3 580[78,79]
Aerated concrete block m 3 170290
Rebar (HRB400)t23974600
Steel wire mesh t 10105050
Cement (P.O. 42.5) t 832540
Sand t 7200
Roof truss (cold-formed steel)t17554831
Resin tile 10 3   m 2 77036
Doors and windows m 2 41835
Fired common brick m 3 200636
Table 4. Self-oscillation frequencies and damping ratios of the test model.
White Noise
Working Condition
Self-Oscillation Frequency (Hz)Damping Ratio
X DirectionY DirectionX DirectionY Direction
7.75010.3750.1460.201
7.50010.2500.1590.201
7.37510.2500.1400.185
6.8759.6250.1170.184
6.8759.7500.1110.185
6.3759.7500.0980.172
5.8758.8750.0990.185
5.7508.8750.0980.165
5.3758.8750.0890.142
7.75010.3750.1460.201
Table 5. Peak accelerations and amplification factors under different seismic intensities.
Input PGAs (g)DirectionWenchuanEl CentroSHW3
a m a x ( g ) K a m a x ( g ) K a m a x ( g ) K
0.035X0.0661.9180.0641.9110.0951.641
Y0.0491.3670.0551.4020.0621.192
0.10X0.2231.8420.1791.7620.2241.814
Y0.1341.3960.1481.4040.1371.167
0.22X0.4431.7390.3021.5630.4311.949
Y0.3221.4220.2971.2370.3031.304
0.40X0.6801.4810.5951.4330.6621.519
Y0.6081.5400.4821.1130.5941.239
0.62X0.9271.573
Y1.1361.707
0.80X1.1411.415
Y1.2061.490
1.00X1.4541.569
Y1.5601.422
1.20X1.8061.532
Y1.9181.328
1.50X2.2771.437
Y2.2811.227
Table 6. Maximum relative displacements to the foundation of the test model.
Input PGA (g)DirectionWenchuanEl CentroSHW3
0.035X0.340.580.54
Y0.380.700.77
0.10X0.881.411.16
Y0.831.491.47
0.22X2.002.612.27
Y1.462.592.47
0.40X3.445.783.60
Y2.644.132.98
0.62X6.98
Y4.97
0.80X8.19
Y5.65
1.00X11.11
Y7.62
1.20X14.58
Y9.68
1.50X17.31
Y12.04
Table 7. Maximum inter-story drift under different seismic intensities.
Input PGA (g)WenchuanEl CentroSHW3Maximum
0.0351/78131/42981/39111/39110.0351/78131/4298
0.101/33981/20201/20381/20200.101/33981/2020
0.221/15021/11511/12161/11510.221/15021/1151
0.401/8711/5191/8351/5190.401/8711/519
0.621/430 1/4300.621/430
0.801/366 1/3660.801/366
1.001/270 1/2701.001/270
1.201/206 1/2061.201/206
1.501/173 1/1731.501/173
Table 8. Embodied emissions of two structural schemes based on sub-projects (t ·   C O 2 e ).
Sub-ProjectsDetailsProcess-Based Analysis
MRCWSBMS
Ground and foundation 17.9121.46
Main structural
construction
Column38.6516.06
Beam7.579.71
Slab12.0212.55
Masonry engineeringBlock17.6436.59
Steel wire mesh2.25-
Tie bar-0.84
Mortar15.6924.96
Functional workDoors and windows6.896.89
Stairs6.956.95
Roofing33.7533.75
Total 159.32169.76
Table 9. Project costs associated with two structural schemes ( × 1 0 3 CNY).
Sub-ProjectsDetailsPMBM
C m a t
Ground and foundation 35.2245.46
Main structural constructionColumn75.0027.06
Beam27.1738.08
Slab23.4623.65
Masonry engineeringBlock43.82116.34
Steel wire mesh11.22-
Tie bar-1.42
Mortar13.8416.67
Functional workDoors and windows140.39140.39
Stairs13.5913.59
Roofing91.8291.82
Total 475.53531.80
Disclaimer/Publisher’s Note: The statements, opinions and data contained in all publications are solely those of the individual author(s) and contributor(s) and not of MDPI and/or the editor(s). MDPI and/or the editor(s) disclaim responsibility for any injury to people or property resulting from any ideas, methods, instructions or products referred to in the content.