Article

An Experimental Study on the Performance of L-Shaped CFSTs Connected by Double-Corrugated Steel Plates Under Axial Compression


School of Future Cities, University of Science and Technology Beijing, Beijing 100083, China
*
Author to whom correspondence should be addressed.
Buildings 2026, 16(2), 379; https://doi.org/10.3390/buildings16020379
Submission received: 16 December 2025 / Revised: 8 January 2026 / Accepted: 13 January 2026 / Published: 16 January 2026
(This article belongs to the Section Building Structures)

Abstract

Special-shaped, concrete-filled steel tubes (SCFSTs) enhance the space efficiency of residential structures and improve aesthetics by avoiding exposed columns. However, the flat steel-plate connection sections are susceptible to local buckling. To mitigate this, corrugated steel plates are incorporated to enhance the local buckling resistance of the structure. This study examines the axial-compression performance and damage characteristics of SCFSTs connected by double-corrugated steel plates (DCP-SCFST) through full-scale static-loading tests. A finite element analysis explores the impact of column height, corrugated plate thickness, material strength, and connection length on the load-carrying capacity of DCP-SCFSTs. The study also presents the sectional strength and design method for these structures. The results indicate that the DCP-SCFSTs exhibit high bearing capacity and ductility under axial compression. The corrugated plates effectively restrain the concrete, markedly improving the buckling behavior of the connection section. Moreover, the corrugation wave size does not significantly affect the bearing capacity, whereas increasing the corrugated plate’s thickness enhances both the bearing capacity and ductility. This is attributed to the indirect confinement effect of corrugated plates. Additionally, the paper proposes design methods for sectional strength and overall stability, offering accurate formulas that offer valuable reference for the design of concrete-filled, corrugated plate members.

1. Introduction

Concrete-filled steel tubes (CFSTs) are a type of structural element where concrete is placed inside a round or rectangular steel tube. This combination results in a high-strength, rigid steel–concrete structure that exhibits excellent ductility, seismic energy dissipation, and fire resistance [1]. The mutual action between the steel tube and the concrete in CFSTs enhances the overall performance of the structure. The steel tube offers external confinement to the core concrete, increasing its strength, plasticity, and toughness. Simultaneously, the core concrete hinders or defers local buckling of the steel tube, thereby improving its stability and bearing capacity [2,3].
Rectangular section columns have long been utilized in traditional residential structures, leading to protruding column corners from the walls that impede interior space utilization, restrict furniture placement, and reduce the actual usable area. To address this issue, researchers have put forward the adoption of special-shaped columns, as presented in Figure 1. These special-shaped, concrete-filled steel tubes (SCFSTs) offer several advantages [4,5,6,7,8,9,10,11,12]: (1) they acquire the advantageous characteristics of both steel and concrete, integrating their individual strengths to enhance structural performance. (2) The limbs of the section columns can be formed into L-, T-, and cross-shaped cross-sections, which effectively eliminates convex columns in residential buildings. This improves space utilization and flexibility. (3) From a processing and construction standpoint, steel components can be fabricated in automated factory settings, enabling fast on-site assembly. Additionally, steel tubes can act as formwork during concrete pouring, enhancing constructability and cost-effectiveness.
The demand for SCFST columns in prefabricated buildings is increasing due to their outstanding performance. As prefabrication processes rapidly develop and the construction industry undergoes transformation and advancement, SCFST columns are poised to find widespread application in prefabricated steel structures. They exhibit significant development potential and promising prospects for practical use, such as frame structures, frame shear wall structures, and double-steel composite shear wall structures [13,14,15,16].
Compared with the flat steel plate, the out-of-plane stiffness of corrugated steel plate is significantly improved, the initial buckling load is increased, and local buckling can be effectively suppressed. Corrugated steel plates provide a stronger restraining effect on the core concrete and improve the structural load-bearing performance and ductility. Researchers have explored the application of corrugated plates in various structural members. Wang et al. [17] concluded that the introduction of corrugated plates into thin-walled tubular columns is beneficial in preventing local buckling of steel tubes and proposed a single corrugated-plate steel tube–concrete special-shaped column. The results showed that the corrugated plate could effectively enhance the local stability of steel tube columns, and there was a significant improvement in the initial buckling load as well as the ultimate bearing capacity of the specimens. Nassirnia et al. [18] applied the corrugated plate to a hollow steel tube column, and the corrugated-plate steel tube relieved the local buckling of the column. By using round tube connections with corrugated plates, they effectively addressed the residual stress problem caused by the welded connection at the corners, resulting in improved overall structural bearing capacity. Zou et al. [19,20,21] replaced the corner round tubes with square steel tubes or pentagonal steel tubes and used corrugated plates for connection, filling them with concrete. The restraining action of the corrugated steel plate on the core concrete is stronger than that of the flat steel plate, and the lateral restraining effect of the corrugated plate on the concrete is primarily attributed to its protruding part. However, existing studies have not clarified the influence of corrugated waveform parameters (e.g., wave-height, wave-length) on the mechanical behavior of concrete-filled steel tubes under axial compression, nor have they determined whether waveform optimization constitutes a key determinant for improving the load-bearing capacity of such structures. Tong et al. [22] investigated a combined wall structure consisting of a double-layered corrugated plate filled with concrete and connected to rectangular CFSTs. The vertical ultimate bearing capacity of the structure is controlled by the overall stability, which can ensure that the steel plate and concrete can work together without additional shear connectors. Guo et al. [23,24] conducted an investigation into the stress mechanism under axial compression and the load-bearing capacity of composite shear walls composed of vertical double-corrugated steel plates with concrete infill. With an improved understanding of the processing technology and mechanical properties of corrugated steel plates, these plates show promising prospects for structural applications.
In this paper, axial-compression tests, finite element numerical simulation analyses, and theoretical design methods are investigated for the special-shaped, concrete-filled steel tubular column connected by double-corrugated steel plates (DCP-SCFST). Loading tests were conducted, detailed in Section 2, and the specimens showed high load-bearing capacity and good ductility, and the corrugated steel plates could effectively improve the local buckling problem and confine the core concrete. The influence of various parameters on the axial compressive bearing capacity of DCP-SCFST is explored through finite element analysis in Section 3, and parametric analyses, including on column height, material strength, corrugated-steel-plate dimensions, and connecting plate length, are carried out in Section 4. Finally, the mechanism of the confinement effect of the corrugated steel plate on the core concrete is revealed in Section 5, and the calculation methods for the strength of stub DCP-SCFST sections and the bearing capacity of slender DCP-SCFST are presented.

2. Test Program and Result

2.1. Test Specimens

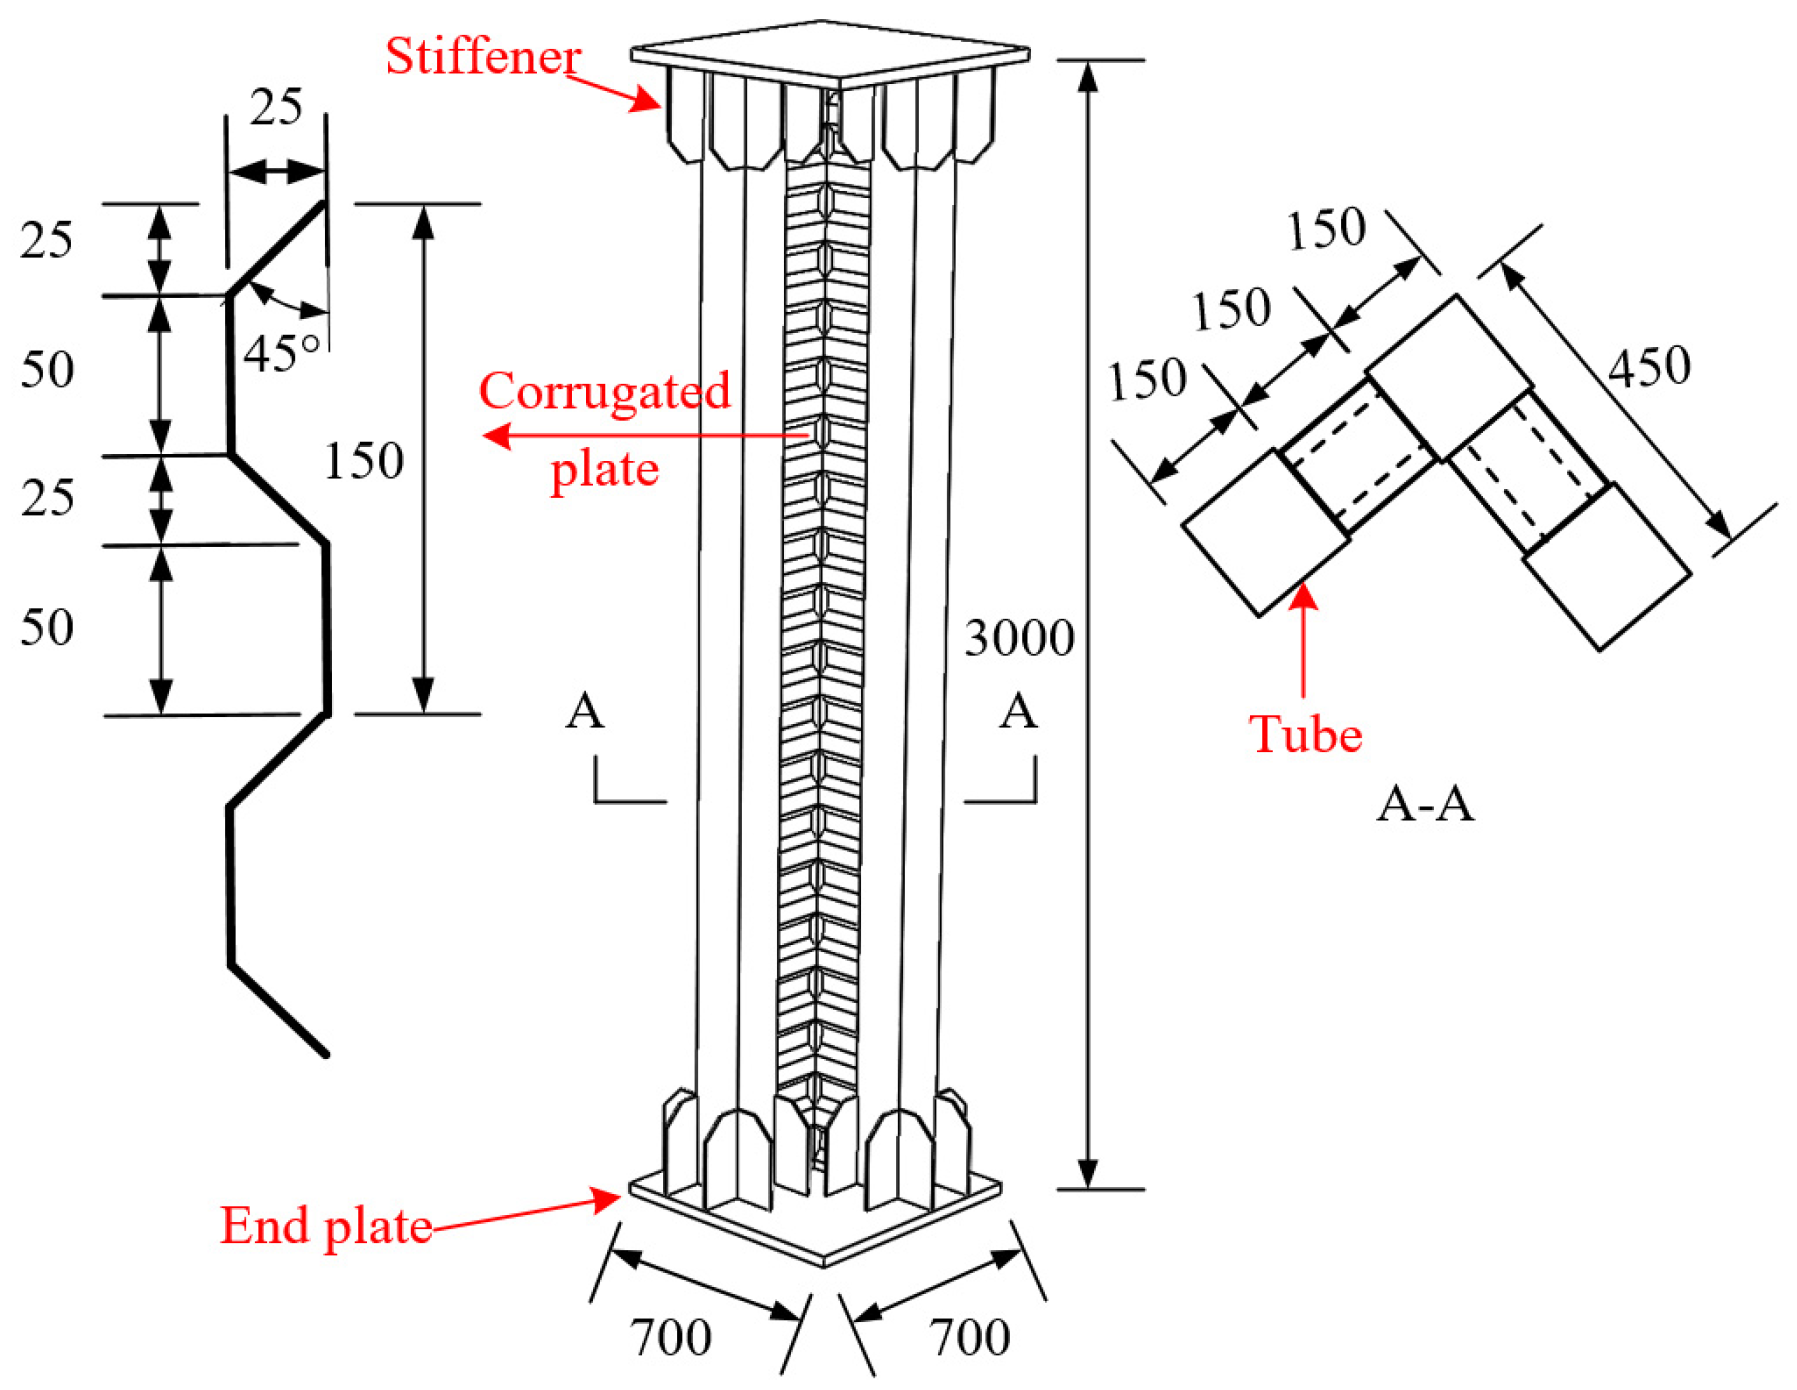
An example DCP-SCFST specimen was designed, consisting of corrugated steel plates, square tubes, and infilled concrete. As illustrated in Figure 2, the DCP-SCFST specimen is designed with a total height of 3000 mm. The dimensions of the square steel tubes are 150 × 150 × 4 mm. Two corrugated steel plates connect the square steel tubes, forming a cavity connection section where the corrugated plates are arranged horizontally. This arrangement results in an irregular longitudinal cross-sectional shape. Concrete is then filled inside the cavities of square steel tubes and corrugated plates to create DCP-SCFST. The steel is type Q355, and the concrete is C30 grade concrete. To study the axial-compression stabilized load capacity, thick steel end-plates were installed at the upper and lower ends of the DCP-SCFST to facilitate axial compression loading. The descriptions of the relevant parameters are provided in Table A1 of Appendix A.

2.2. Material Properties of Specimens

Steel’s sampling from the same batch as the test pieces was conducted to prepare tensile specimens: specifically, 3 tensile specimens were made for the square tube and 3 tensile specimens for the corrugated steel plate, respectively [25]. For concrete, 3 cubic specimens with dimensions of 150 × 150 × 150 mm were cast using the same batch of concrete as the test specimen. According to the relevant specifications, mechanical property tests were performed on the steel and concrete specimens. The test results of each material were obtained by calculating the average value of the 3 corresponding specimens. The material test results of the corrugated steel plate, square steel tube, and concrete are shown in Table 1. The yield strengths of the corrugated steel plate and square steel tube are 382 MPa and 393 MPa, the ultimate strengths are 512 MPa and 536 MPa, respectively, and the modulus of elasticity is approximately 2 × 10⁵ MPa. The concrete specimens fabricated from the same batch as the test structure possess a cubic compressive strength of 35.1 MPa.

2.3. Load Device

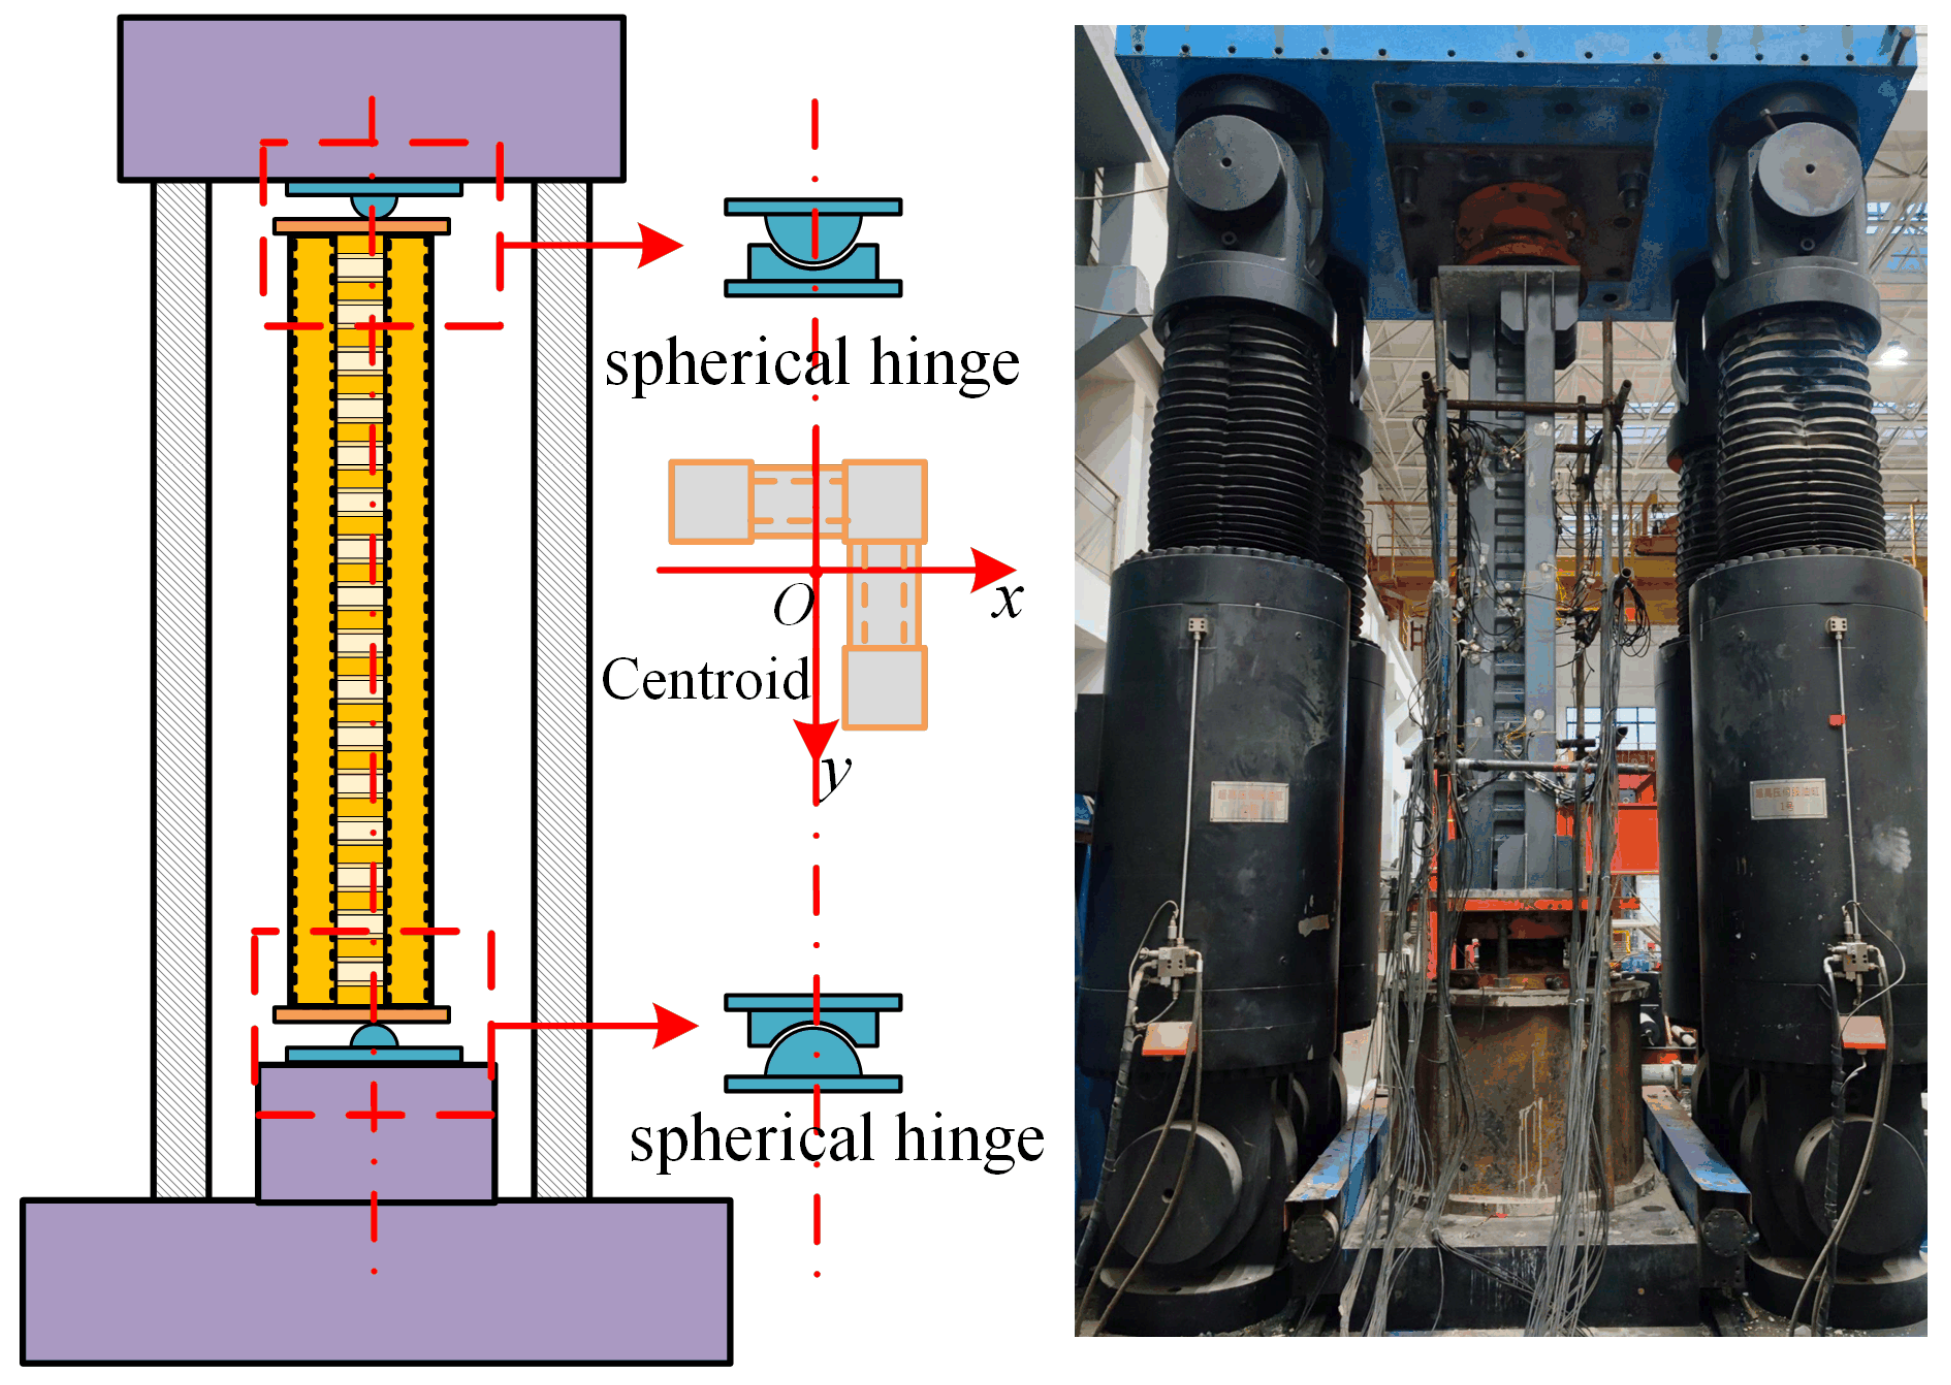
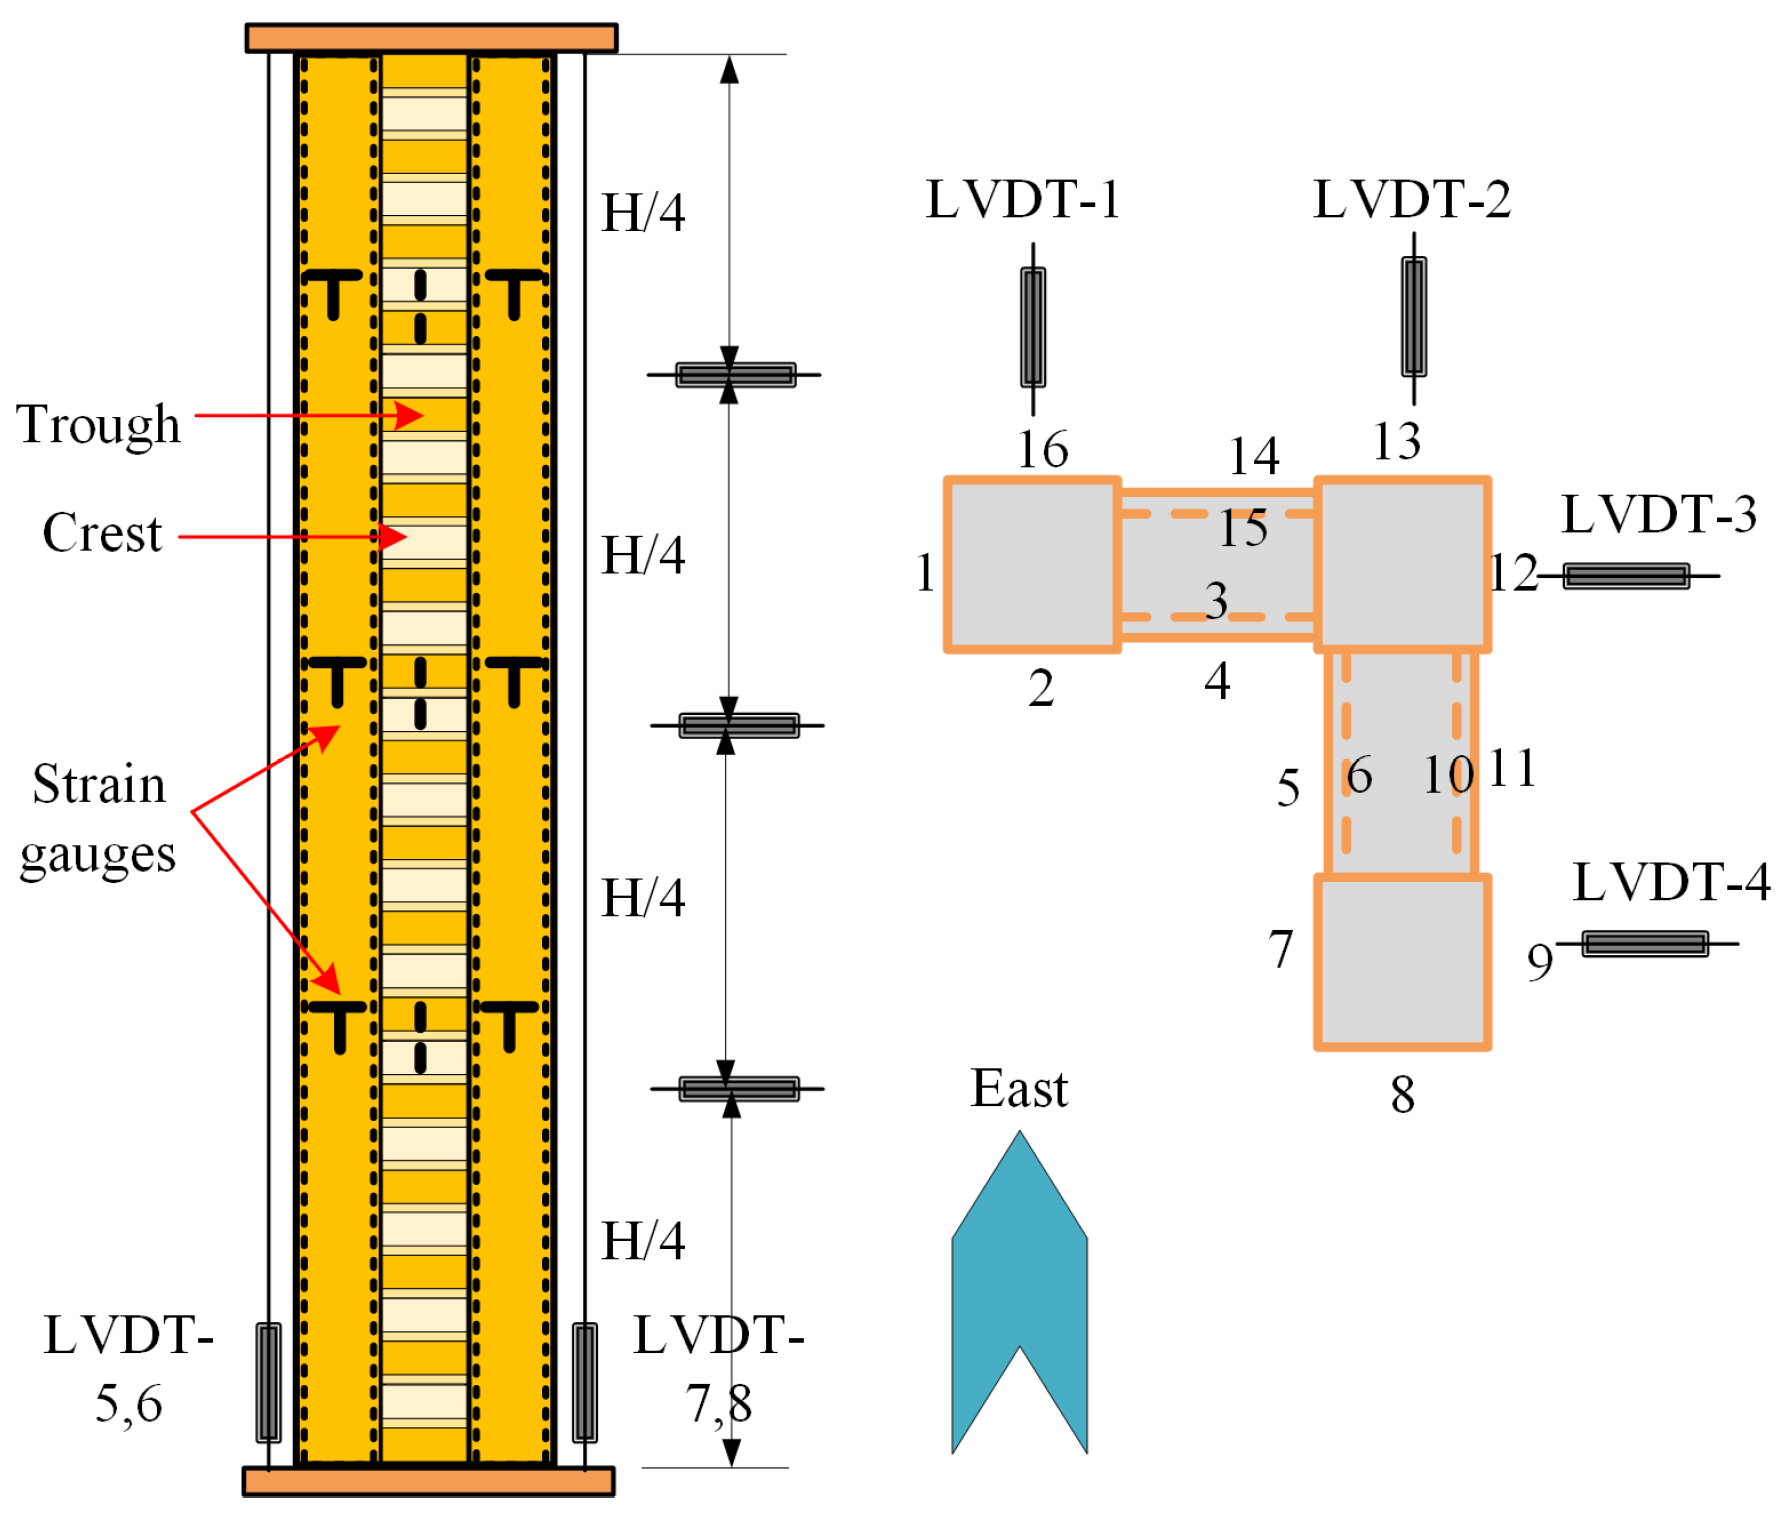
The specimen is connected to the hydraulic machine through the spherical hinges. The center of the spherical hinge was justified to the centroid of the specimen to ensure that the axial load was applied, as shown in Figure 3. The corrugated concrete was equated to a rectangular concrete, the length was kept constant, the width was taken as the average of the distance between the maximum and minimum corrugated widths, and then the cross-section center of form was taken after converting the strengths of each part. Horizontal LVDTs and strain gauges were set at every 1/4 of the height of the specimen to monitor the horizontal displacement and strain of the specimen. LVDTs were arranged at the upper and lower ends of the test specimen to measure the axial compression distance. LVDT-1 and LVDT-2 are employed to measure lateral displacement of the test specimen in the east–west direction, and LVDT-3 and LVDT-4 measure lateral displacement in the north–south direction. The location and numbering of displacement gauges and strain gauges (1 to 16) are presented in Figure 4. Prior to the test, a pre-loading of 200 kN was applied, and it was ascertained that the measuring instrument was connected correctly. The formal loading procedure is displacement control loading, with a loading rate of 0.5 mm/min. When the load reaches approximately 85% of the peak load [26], the specimen is considered to have reached its ultimate state. To investigate the plastic evolution and damage characteristics of the specimen following peak load variation, loading is continued until either 70% deformation is achieved or further loading becomes impossible, at which point the test is terminated.

2.4. The Analysis of the Failure Mode

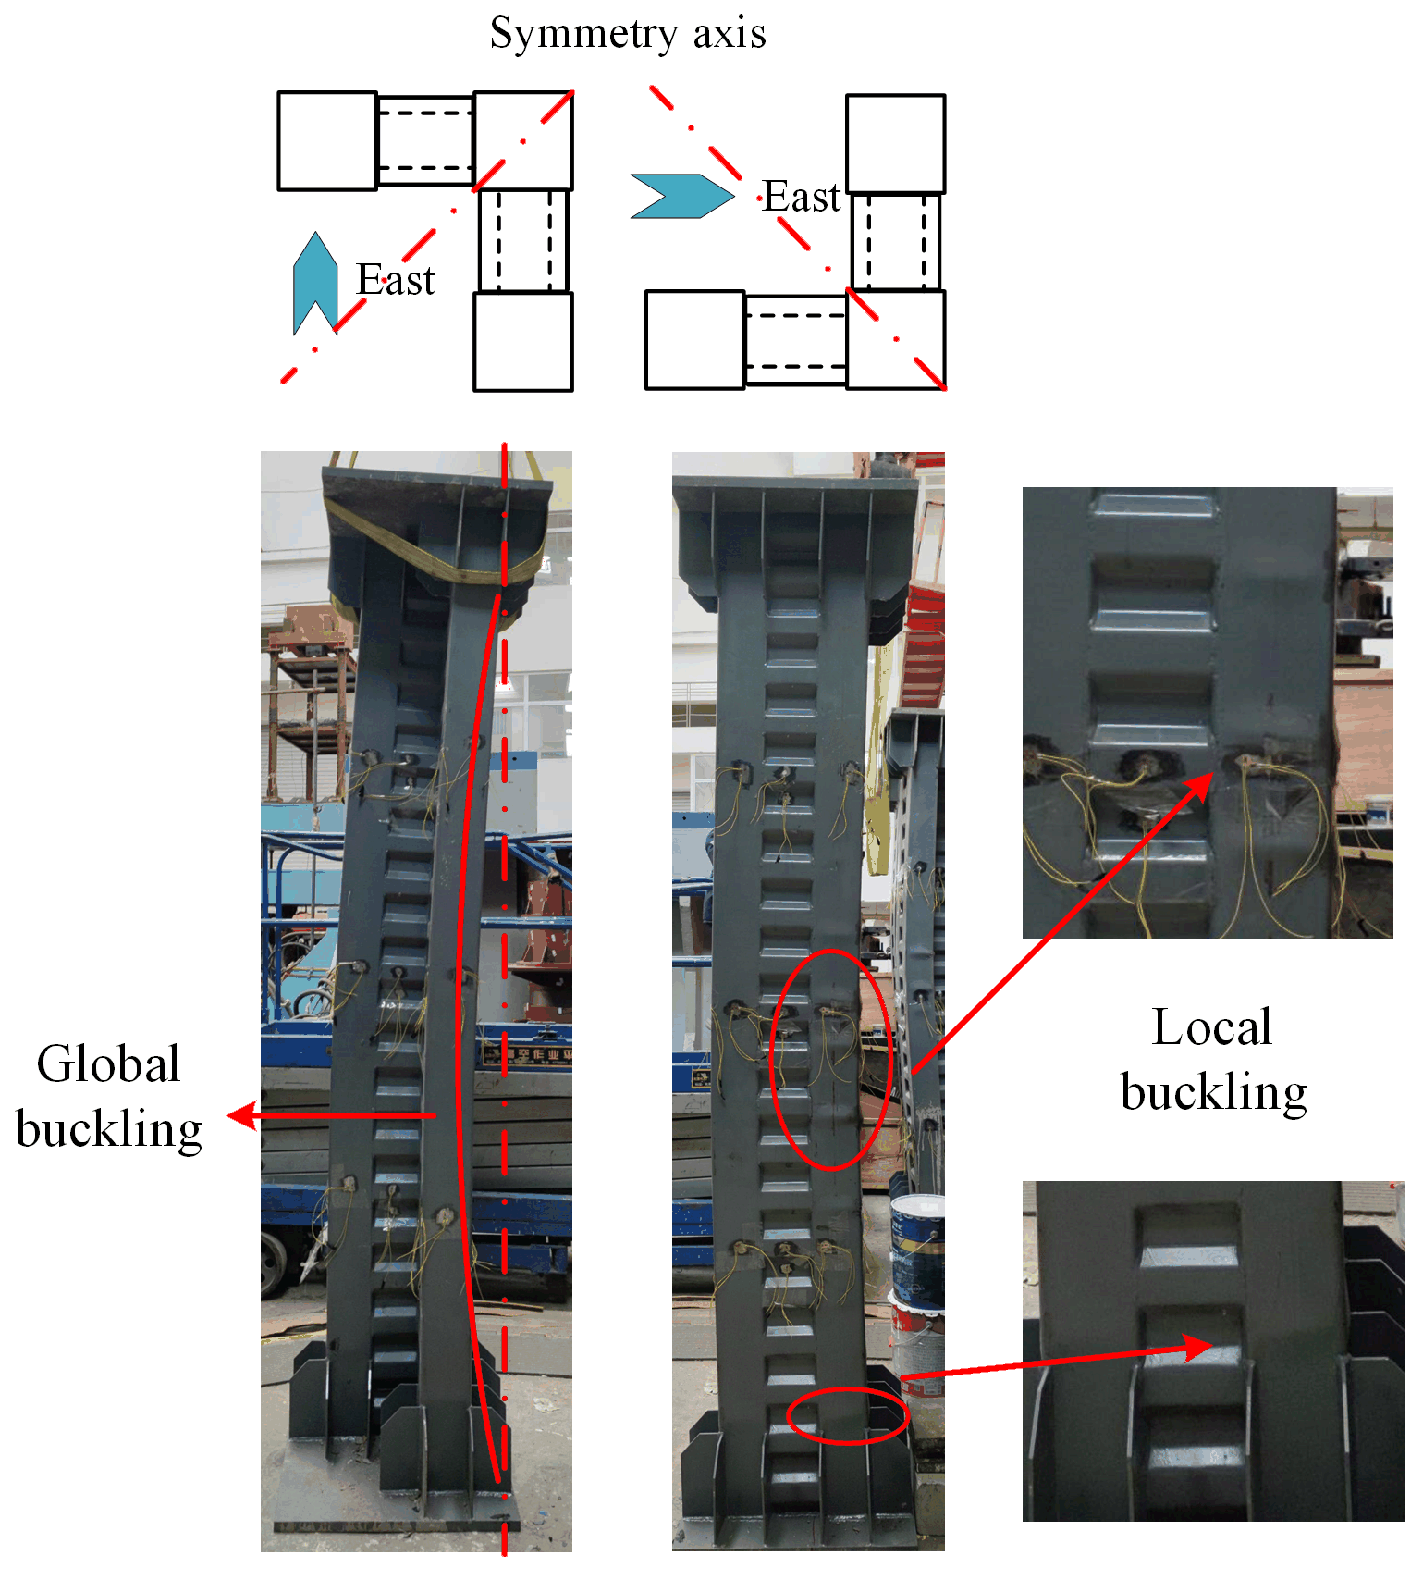
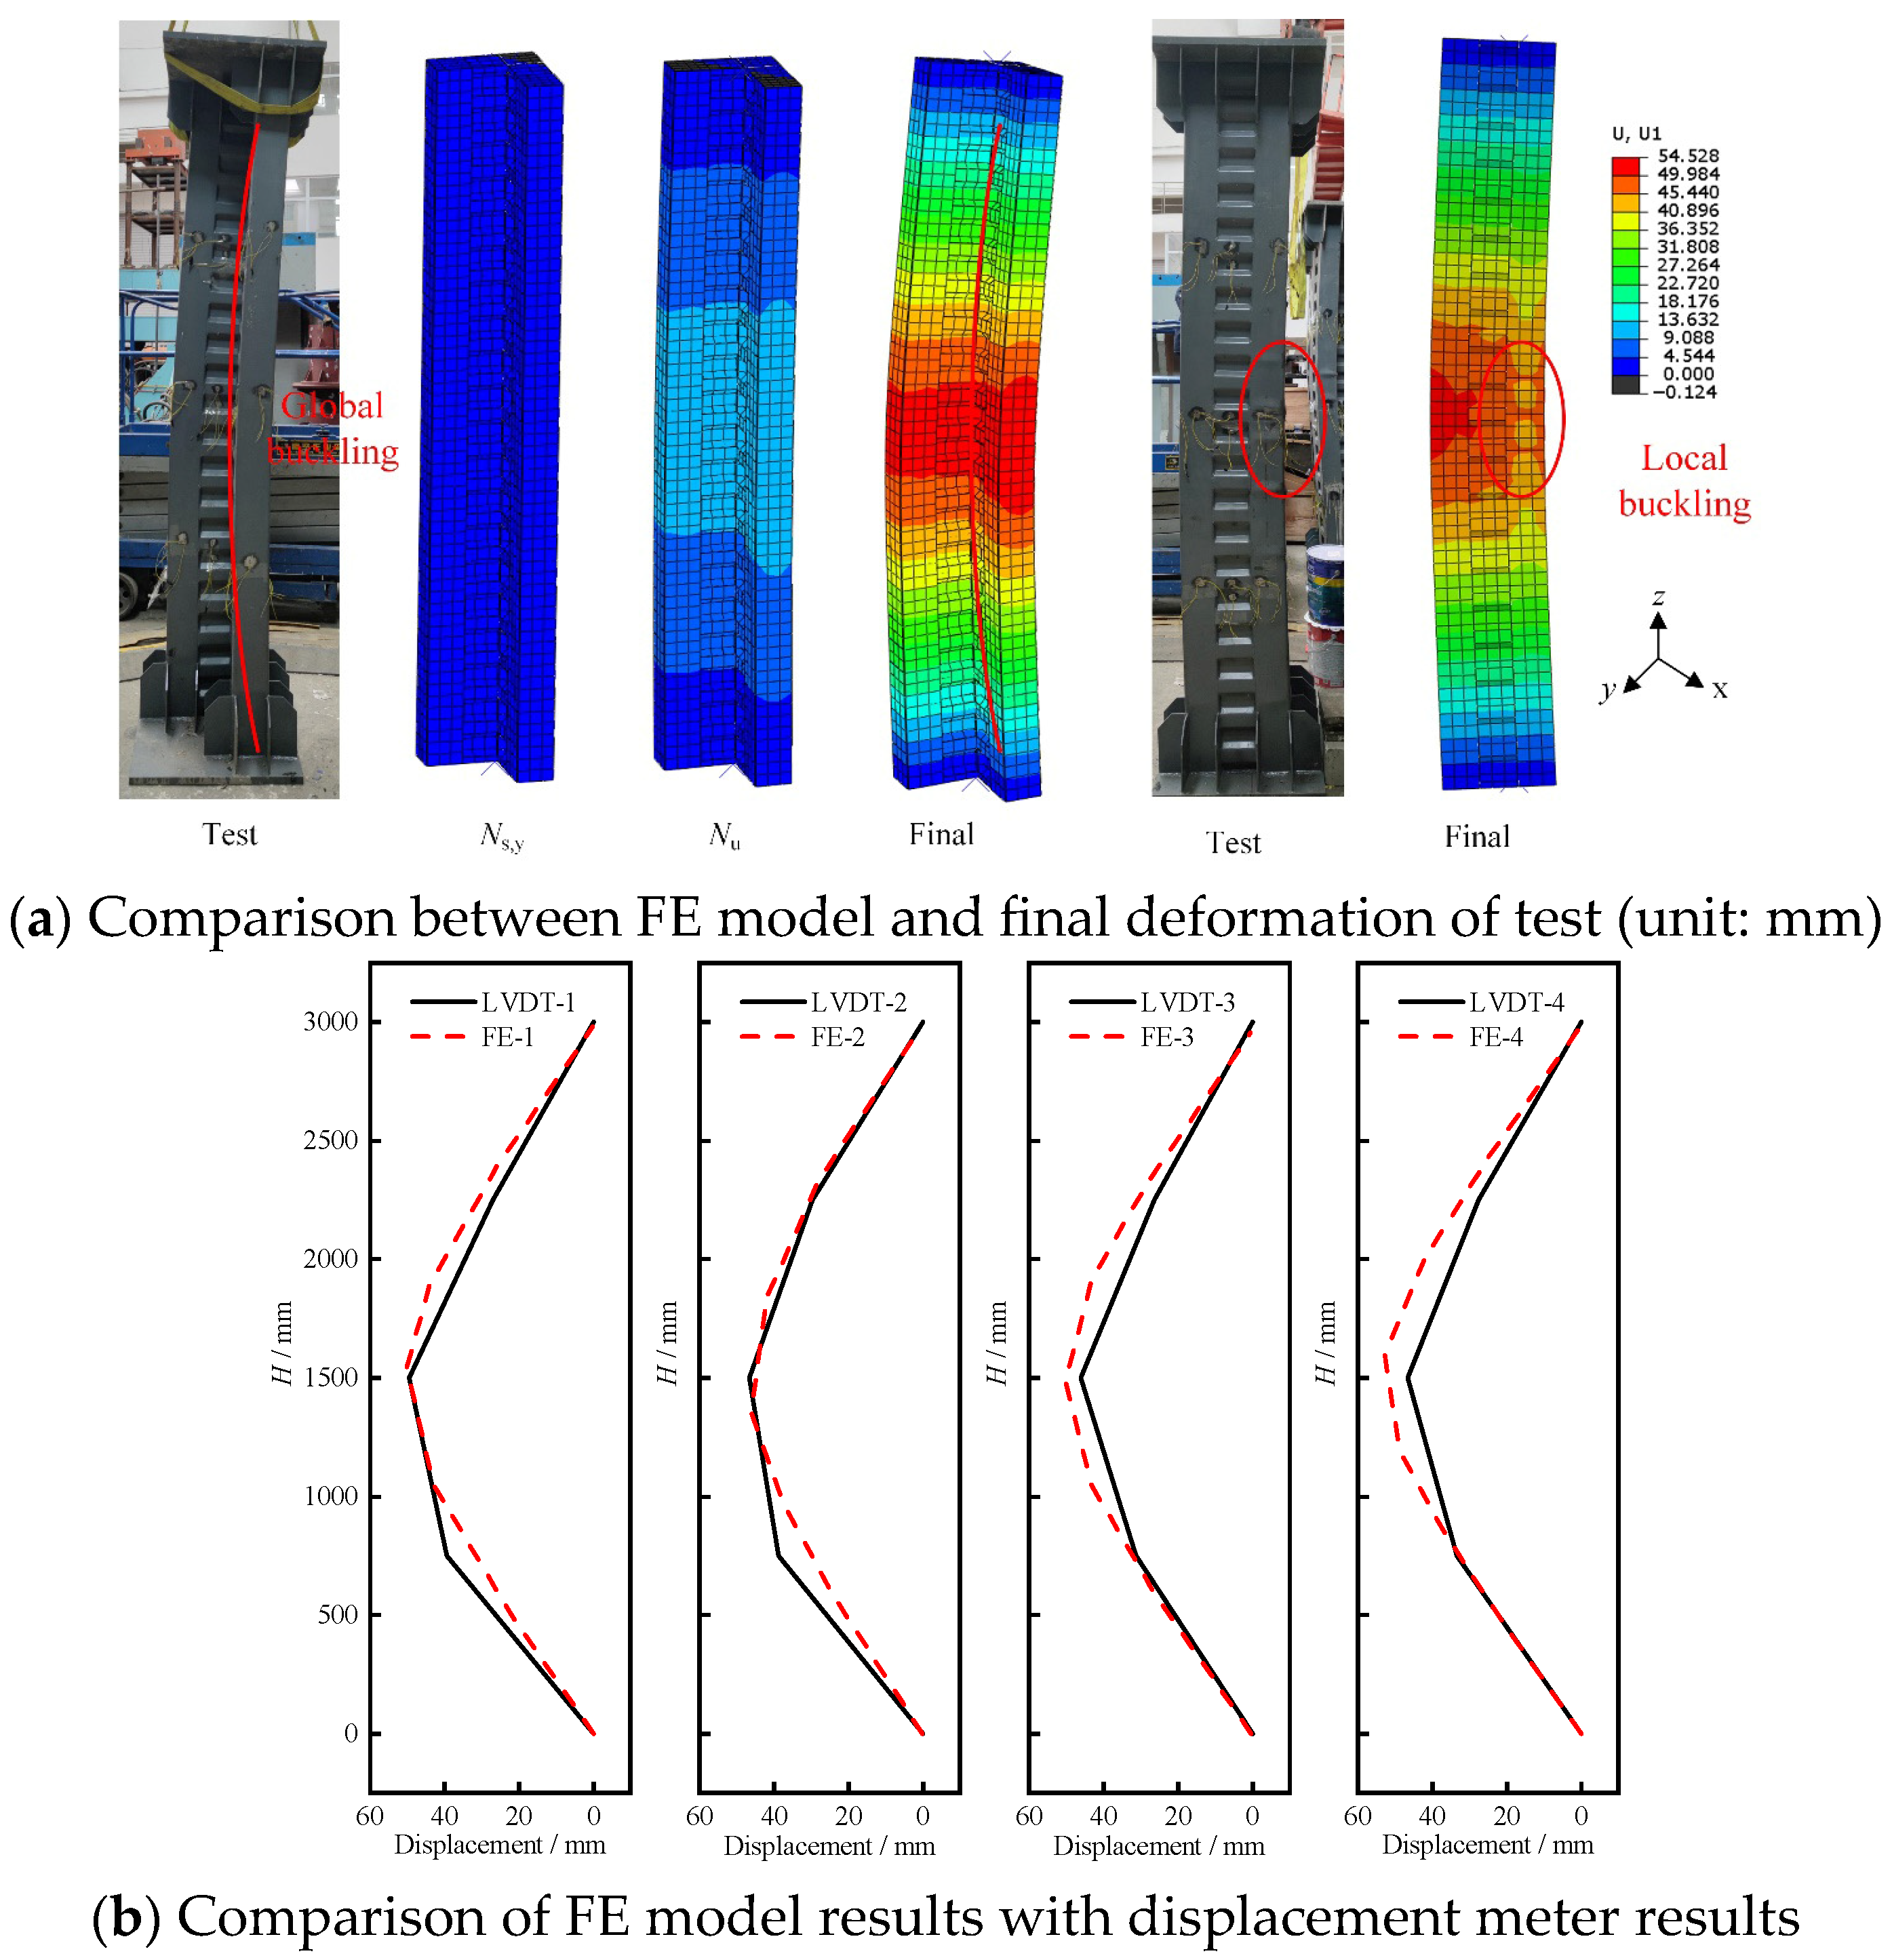
The damaged form of the DCP-SCFST is illustrated in Figure 5. The DCP-SCFST exhibited overall buckling, and owing to the symmetric nature of its cross-section, this overall buckling deformation manifested as bending along the axis of symmetry. The CFST located on the axis of symmetry was significantly compressed after structural buckling, and local buckling was observed at the middle and bottom of this CFST column. However, there was no significant deformation of the corrugated steel plate.

2.5. Load–Displacement Relationship

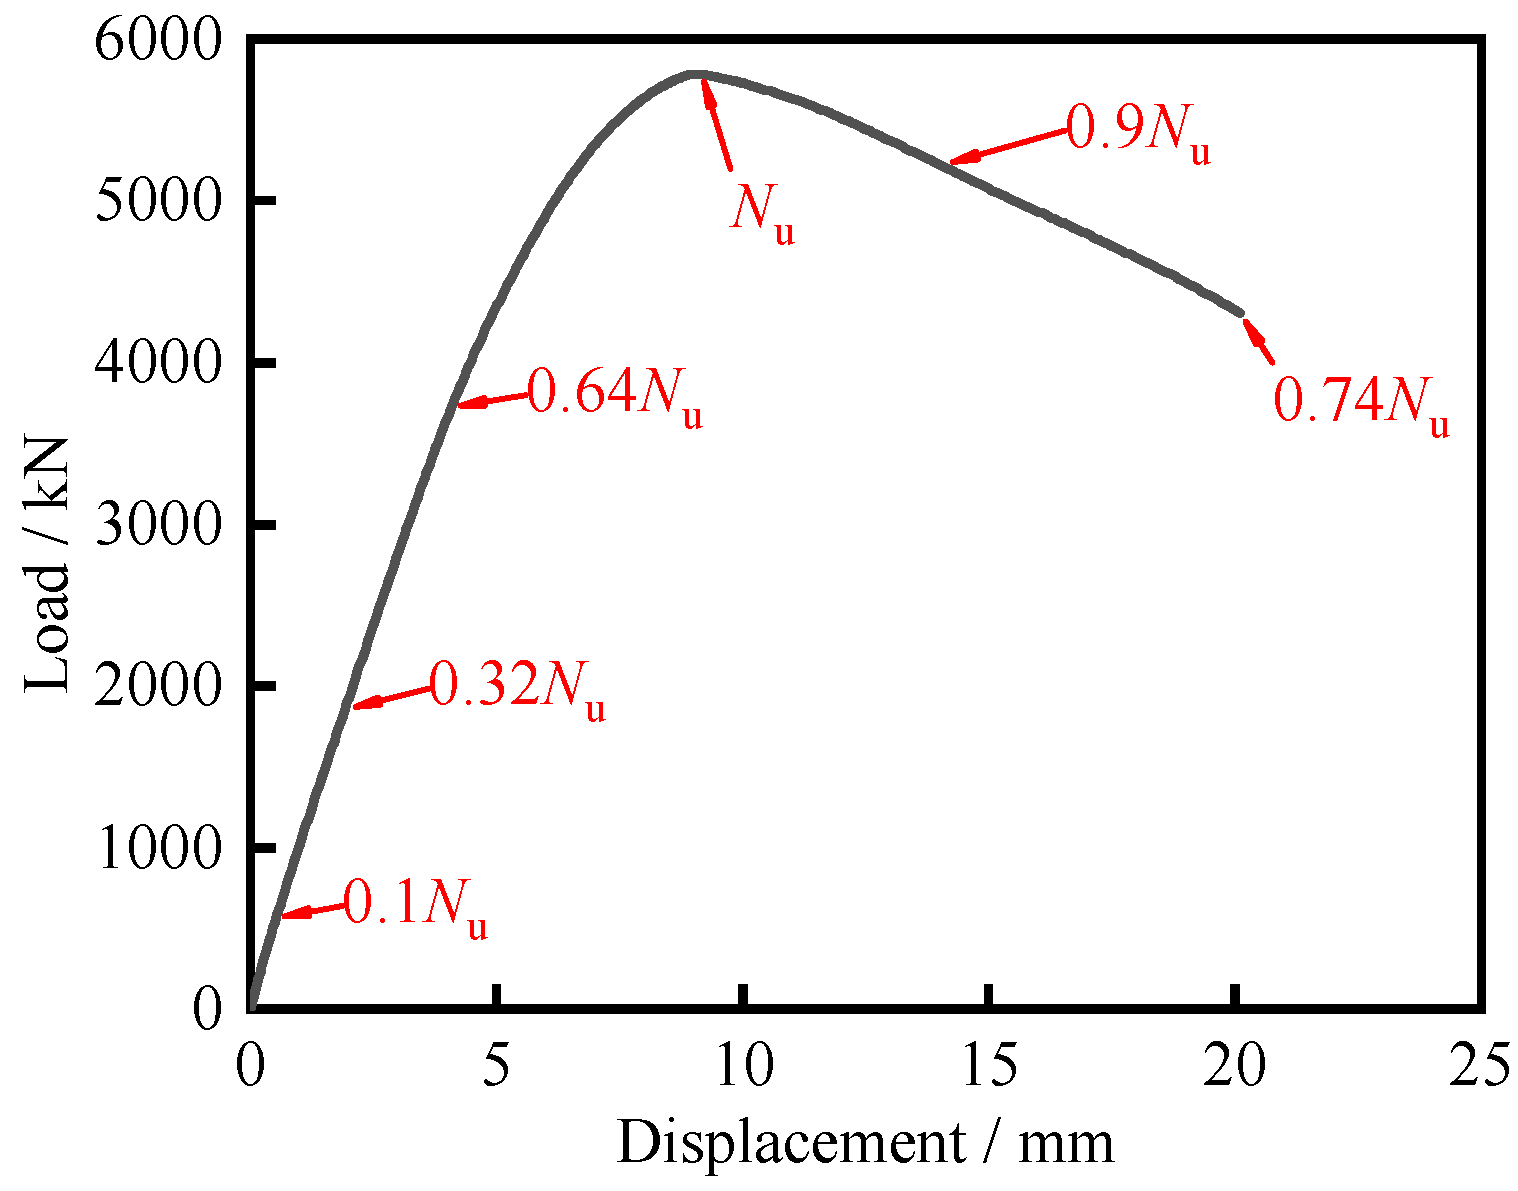
The load–displacement curves of specimen DCP-SCFST are shown in Figure 6. At the beginning of loading, the specimen is basically in the elastic stage, and the load–displacement is linear. However, after the axial-compression load reaches 0.64 Nu, the structural stiffness decreases, and the growth rate of load capacity with displacement slows down slightly. The peak bearing capacity Nu of the specimen is 5797 kN, and the vertical displacement is 9.15 mm. Continuing to load, the bearing capacity begins to decline, and the lateral deformation of the structure increases significantly.
The strength index S I is introduced to evaluate the restraining effect of steel members on concrete, and the calculation formula is shown in Equation (1) [21]. Due to the horizontal arrangement of the corrugated plate, which basically does not bear the vertical load, ignore its contribution [21]. From Table 2, SI of DCP-SCFST is 1.14.
S I = N u f y A s + f c A c + f c , c A c , cor
where N u denotes the ultimate bearing capacity; f y denotes the yield strength of steel; f c and f c , c denote the compression strength of concrete-filled steel tubes and corrugated plate, respectively; A s , A c and A c , cor denote the cross-sectional area of steel, concrete-filled steel tubes, and concrete-filled corrugated plate, respectively. The value of A c , cor is based on taking the average of the maximum and minimum width of the corrugated cell [22].
The ductility index D I is introduced to evaluate the plastic deformation capacity of a structure, and the calculation formula is shown in Equation (2) [21]. The DI of the DCP-SCFST is calculated in Table 2 as 2.40.
D I = ε 85 % ε y , ε y = Δ y H , ε 85 % = Δ 85 % H
where ε 85 % and Δ 85 % denote the corresponding strain and displacement when the bearing capacity is reduced to 85% of the ultimate bearing capacity N u ; ε y and Δ y denote the corresponding strain and displacement when the steel yields. Yield displacement Δ y and its corresponding yield load N y can be determined by the Geometric Graphic Method [27].
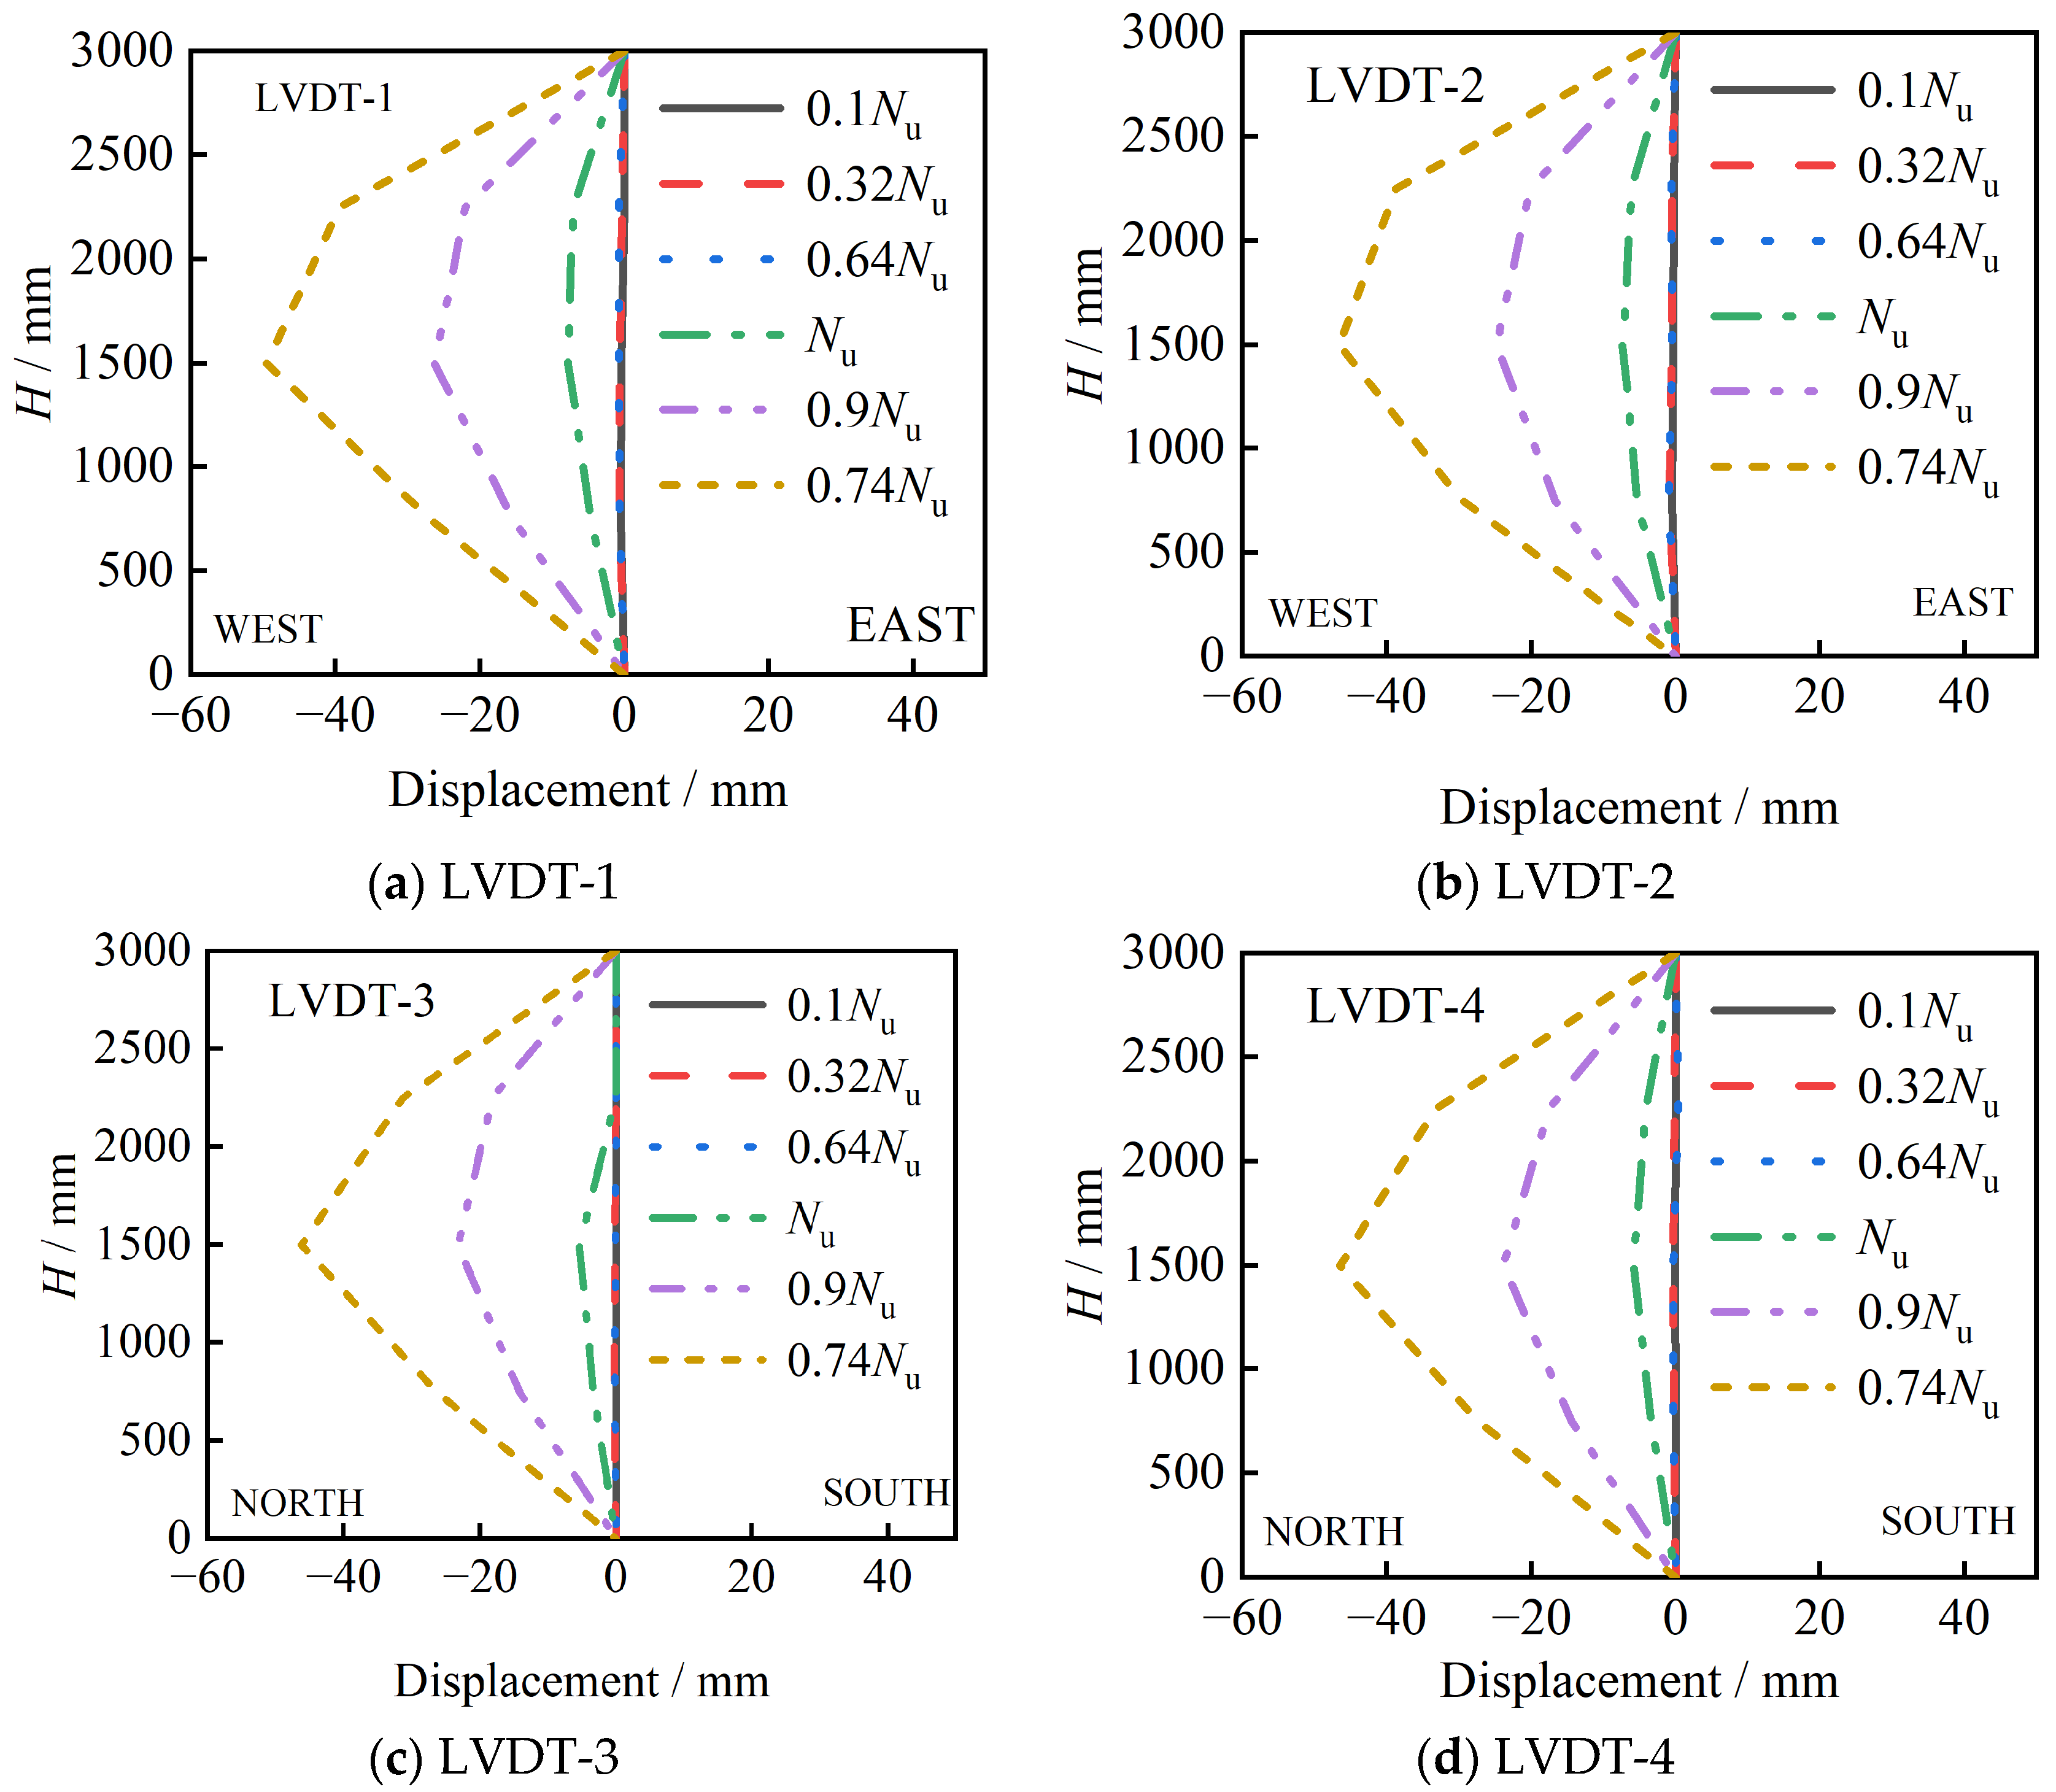
Figure 7 displays the lateral deformation of the DCP-SCFST. The change in deformation during loading is approximately the same in the west–east and north–south directions due to the symmetry of the cross-section, and the specimen deforms along the axis of symmetry during axial compression. There was no significant deformation until the load capacity of 0.64 Nu was reached. At the peak load capacity of Nu, the mid-height of the column exhibited a lateral deformation of 10 mm. As the loading process progressed, the deformation of the specimen increased rapidly while the load capacity decreased. At a load capacity of 0.74 Nu, the maximum deformation was approximately 50 mm in the west and north directions.

2.6. Load–Strain Curves of Tubes and Corrugated Plate

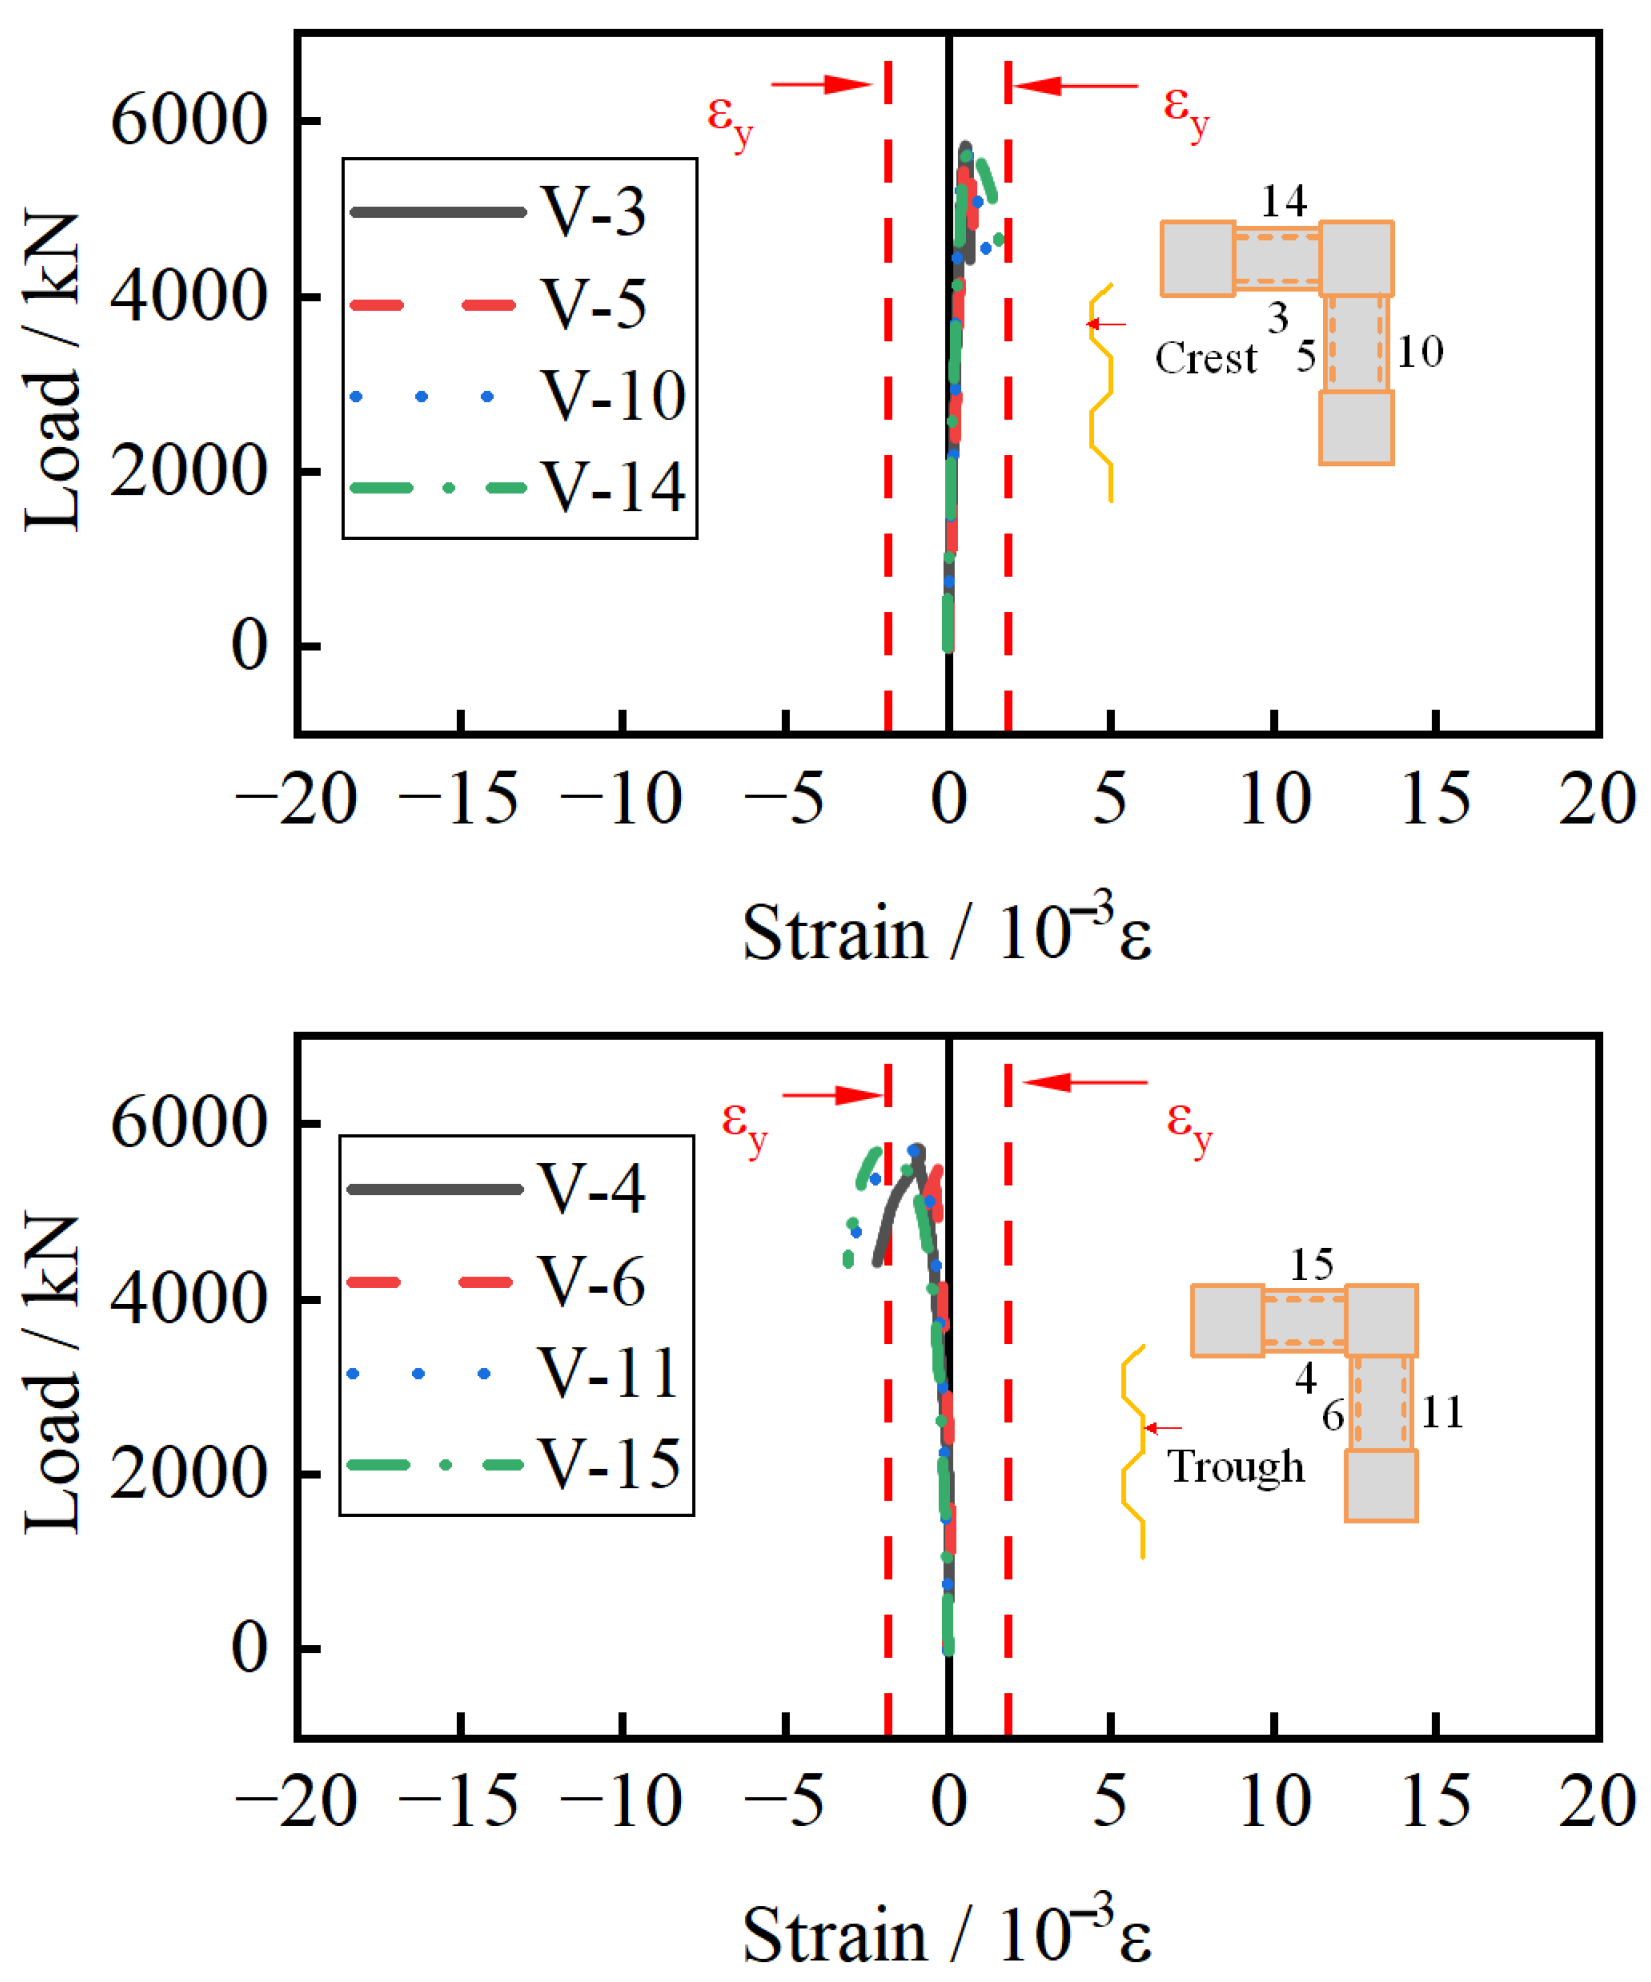
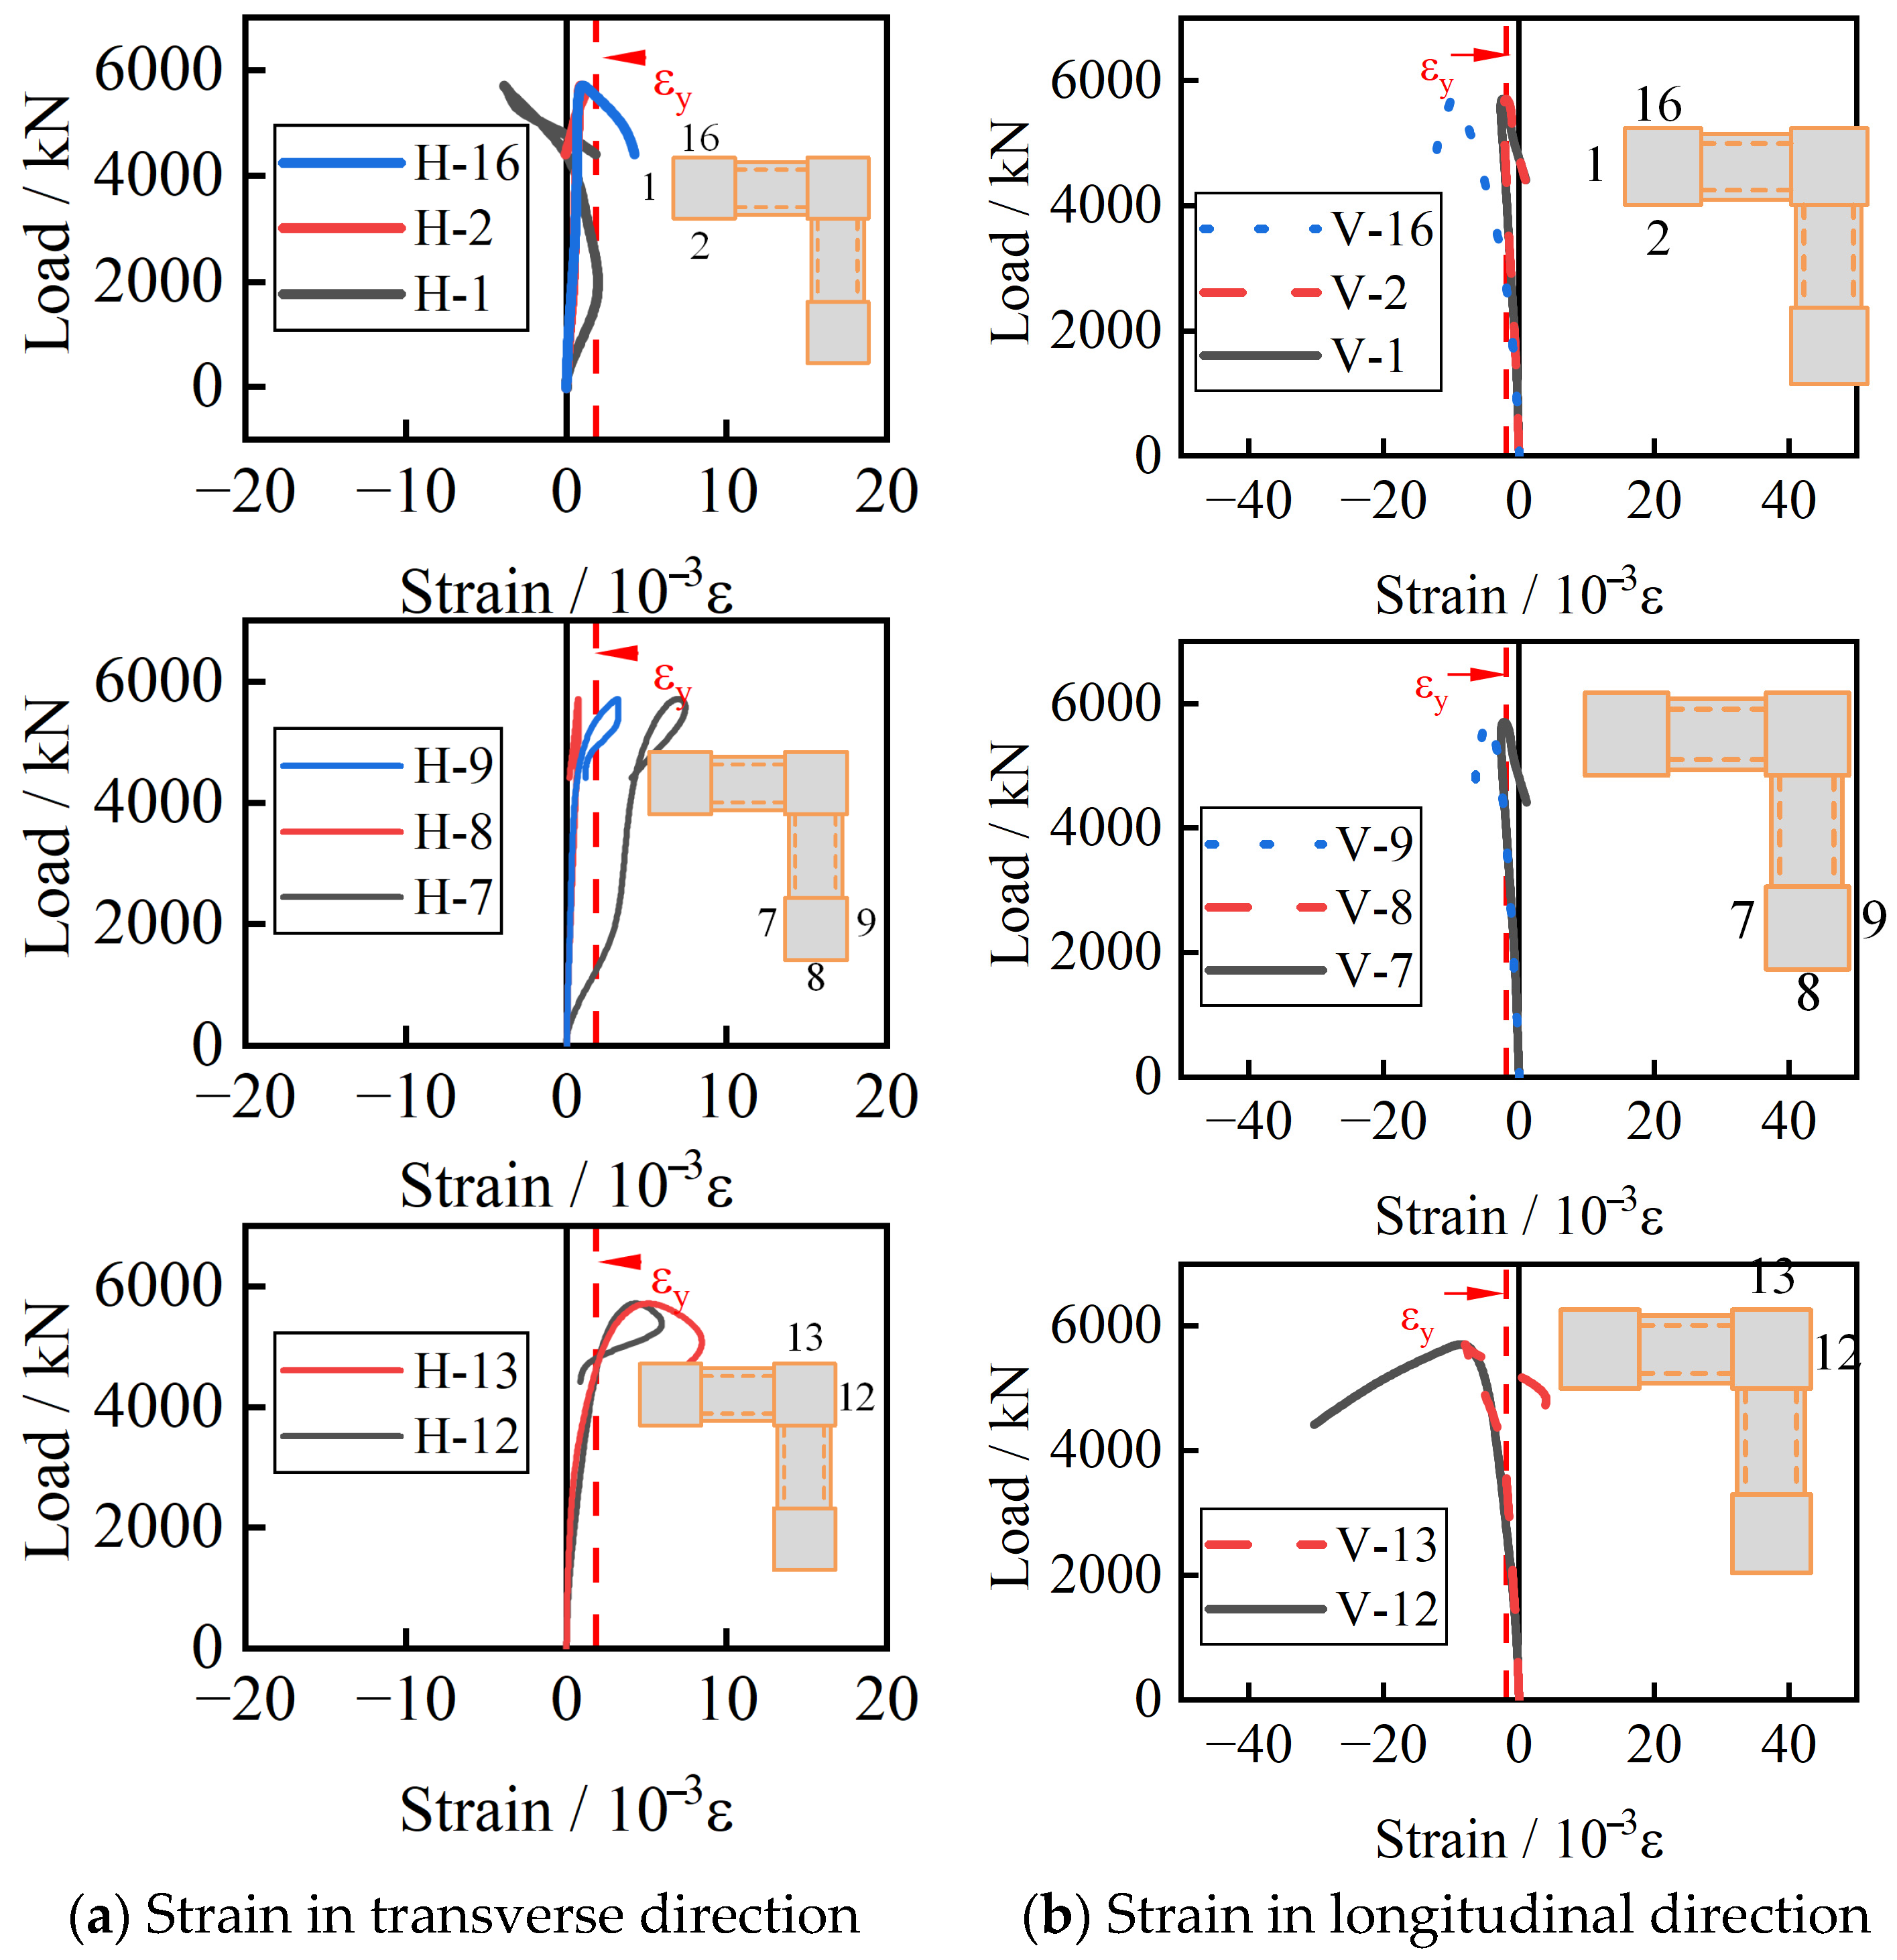
Figure 8 and Figure 9 illustrate the relationship between load and strains for steel tubes and corrugated steel plates at the middle height section (H = 1500 mm) of the specimen, respectively. The yield strain of the steel is εy. The relationship between the load and longitudinal (transverse) strains of tubes is presented in Figure 8. At the beginning of loading, both longitudinal and transverse strains increased linearly. The trend of strain change on the three tubes is relatively close, with positive strain in the horizontal direction and negative strain in the vertical direction, indicating that the tubes produce compressive deformation in the vertical direction and outward expansion in the transverse direction under axial pressure. Moreover, the vertical strain is significantly higher than the horizontal strain. Subsequently, with the increase in load, the strain of the specimen showed a nonlinear increase. This indicates that the specimen transitions from the elastic stage to the elastic–plastic stage. Once the ultimate bearing capacity is reached, the bearing capacity begins to decrease, and at the same time, the longitudinal and transverse strain values of the specimen begin to increase significantly. Due to local buckling of the tube, such as inward or outward deformation of the V13 and V12 strain positions, the strains move towards negative or positive values.
Figure 9 shows the strain versus load curves for the crest and trough of corrugated steel plates at the middle section of the column (H = 1500 mm). The stresses in the trough and crest are low, and they barely carry the vertical load. The steel in the trough is negative under axial pressure and behaves in compression. On the contrary, in the crest it is positive and exhibits tension. The corrugated steel plate, due to its unique cross-sectional form, in the trough tends to deform inward as compression and in the crest tends to deform outward as tensile deformation under axial load.

3. Finite Element Analyses

3.1. Finite Element Modeling

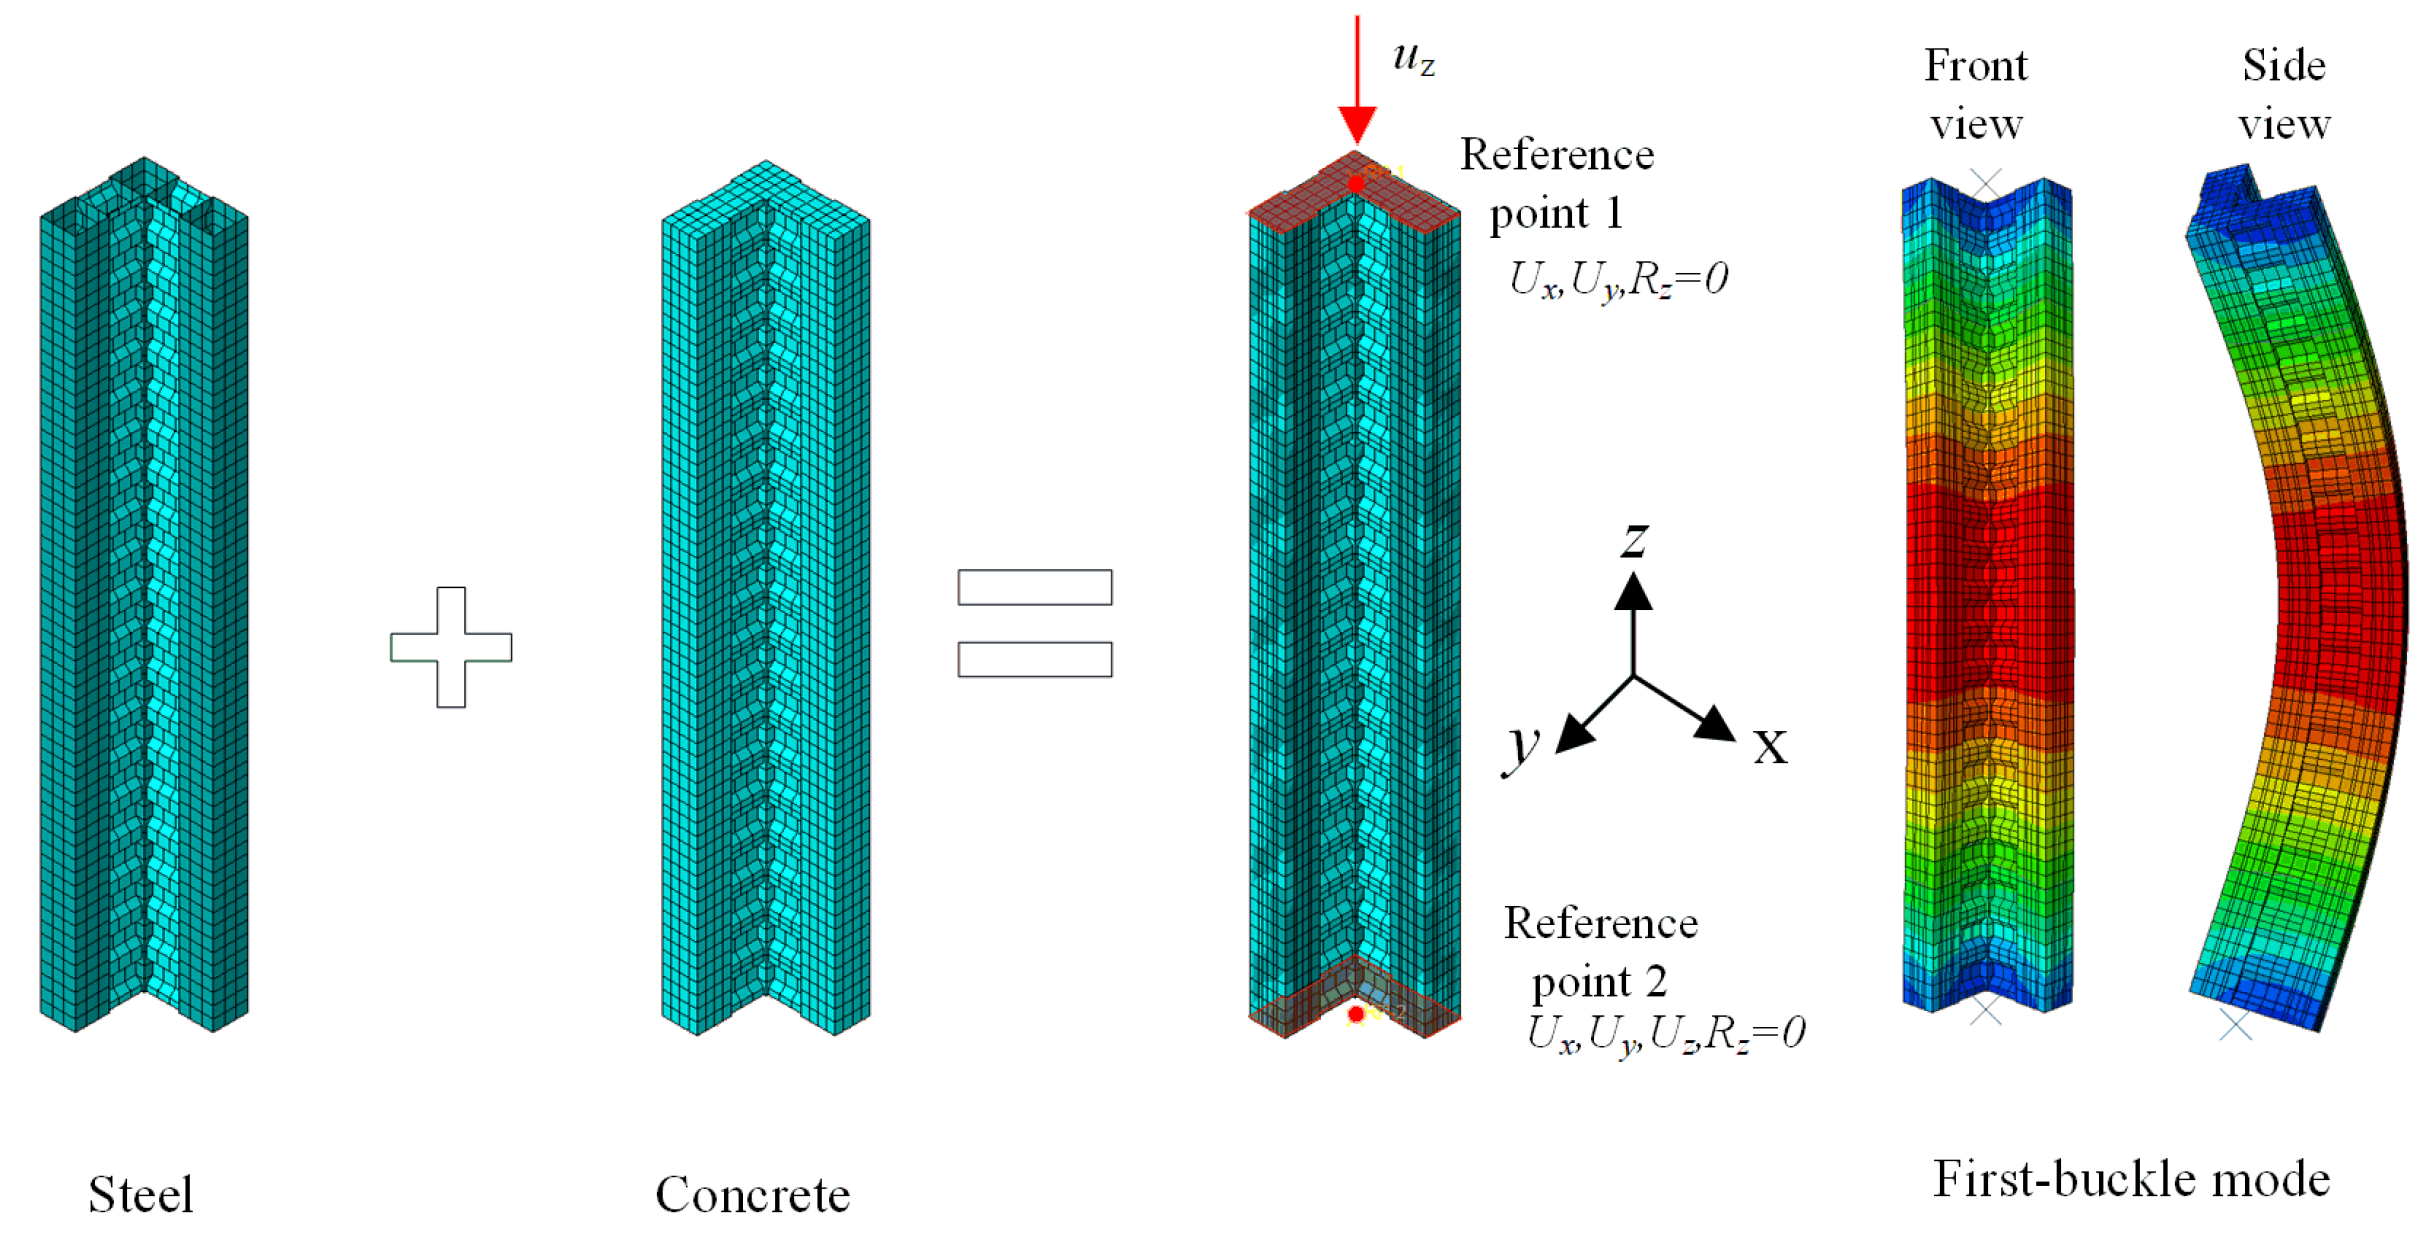
ABAQUS/Standard [28] is used to create the DCP-SCFST-column finite element model, and this analysis module is able to solve the nonlinear static problems of the structure. The steel tubes and connection plates are simulated by the S4R shell element, and the infilled concrete is simulated by the C3D8R solid element. The welding between the steel tube and the connection plate is simulated by a Tie constraint. For the contact behavior between the steel plate and concrete, hard contact is defined in the normal direction, and tangential contact follows a frictional model where the friction coefficient is 0.15 [29]. (The friction coefficient for typical steel–concrete composite structures ranges from 0.15 to 0.6, and the specific value of the friction coefficient has no significant impact on the results.) The reference points 1 and 2 are established at the centroid of the cross-section. Three translational and Rz rotational degrees of freedom at the bottom of the column are constrained by a rigid body at reference point 2. The top is constrained to reference point 1, and the displacement uz is applied to simulate the axial compressive loading process. According to the FEM pre-calculation results, the results already have great accuracy with a minimum mesh size of 50 mm. The concrete is divided into 4080 C3D8R elements, and the steel is divided into 3132 S4R elements. Further reduction in the mesh size would significantly increase the computational time without significantly improving accuracy. The mesh and the first-order buckling mode are shown in Figure 10.
Before conducting the experiment, the geometrical initial defect of the specimen was measured. The north–south defect was measured at 4.4 mm, which is equivalent to 1/680 of the specimen’s height. The east–west defect was measured at 3.2 mm, which is equivalent to 1/1060 of the specimen’s height. The direction of the defects is similar to that of the first-order buckling mode. In accordance with the provisions of GB50017-2017 [30], the initial defects of columns are to be taken to be not less than 1/1000 of the column height, and the model adopts the first-order buckling modes as the distribution of the defects, which is consistent with that of the first-order buckling modes. The maximum defect is defined as 1/1000 of the column height. The effect of residual stress is not considered in the FE model.

3.2. Material Constitutive Models

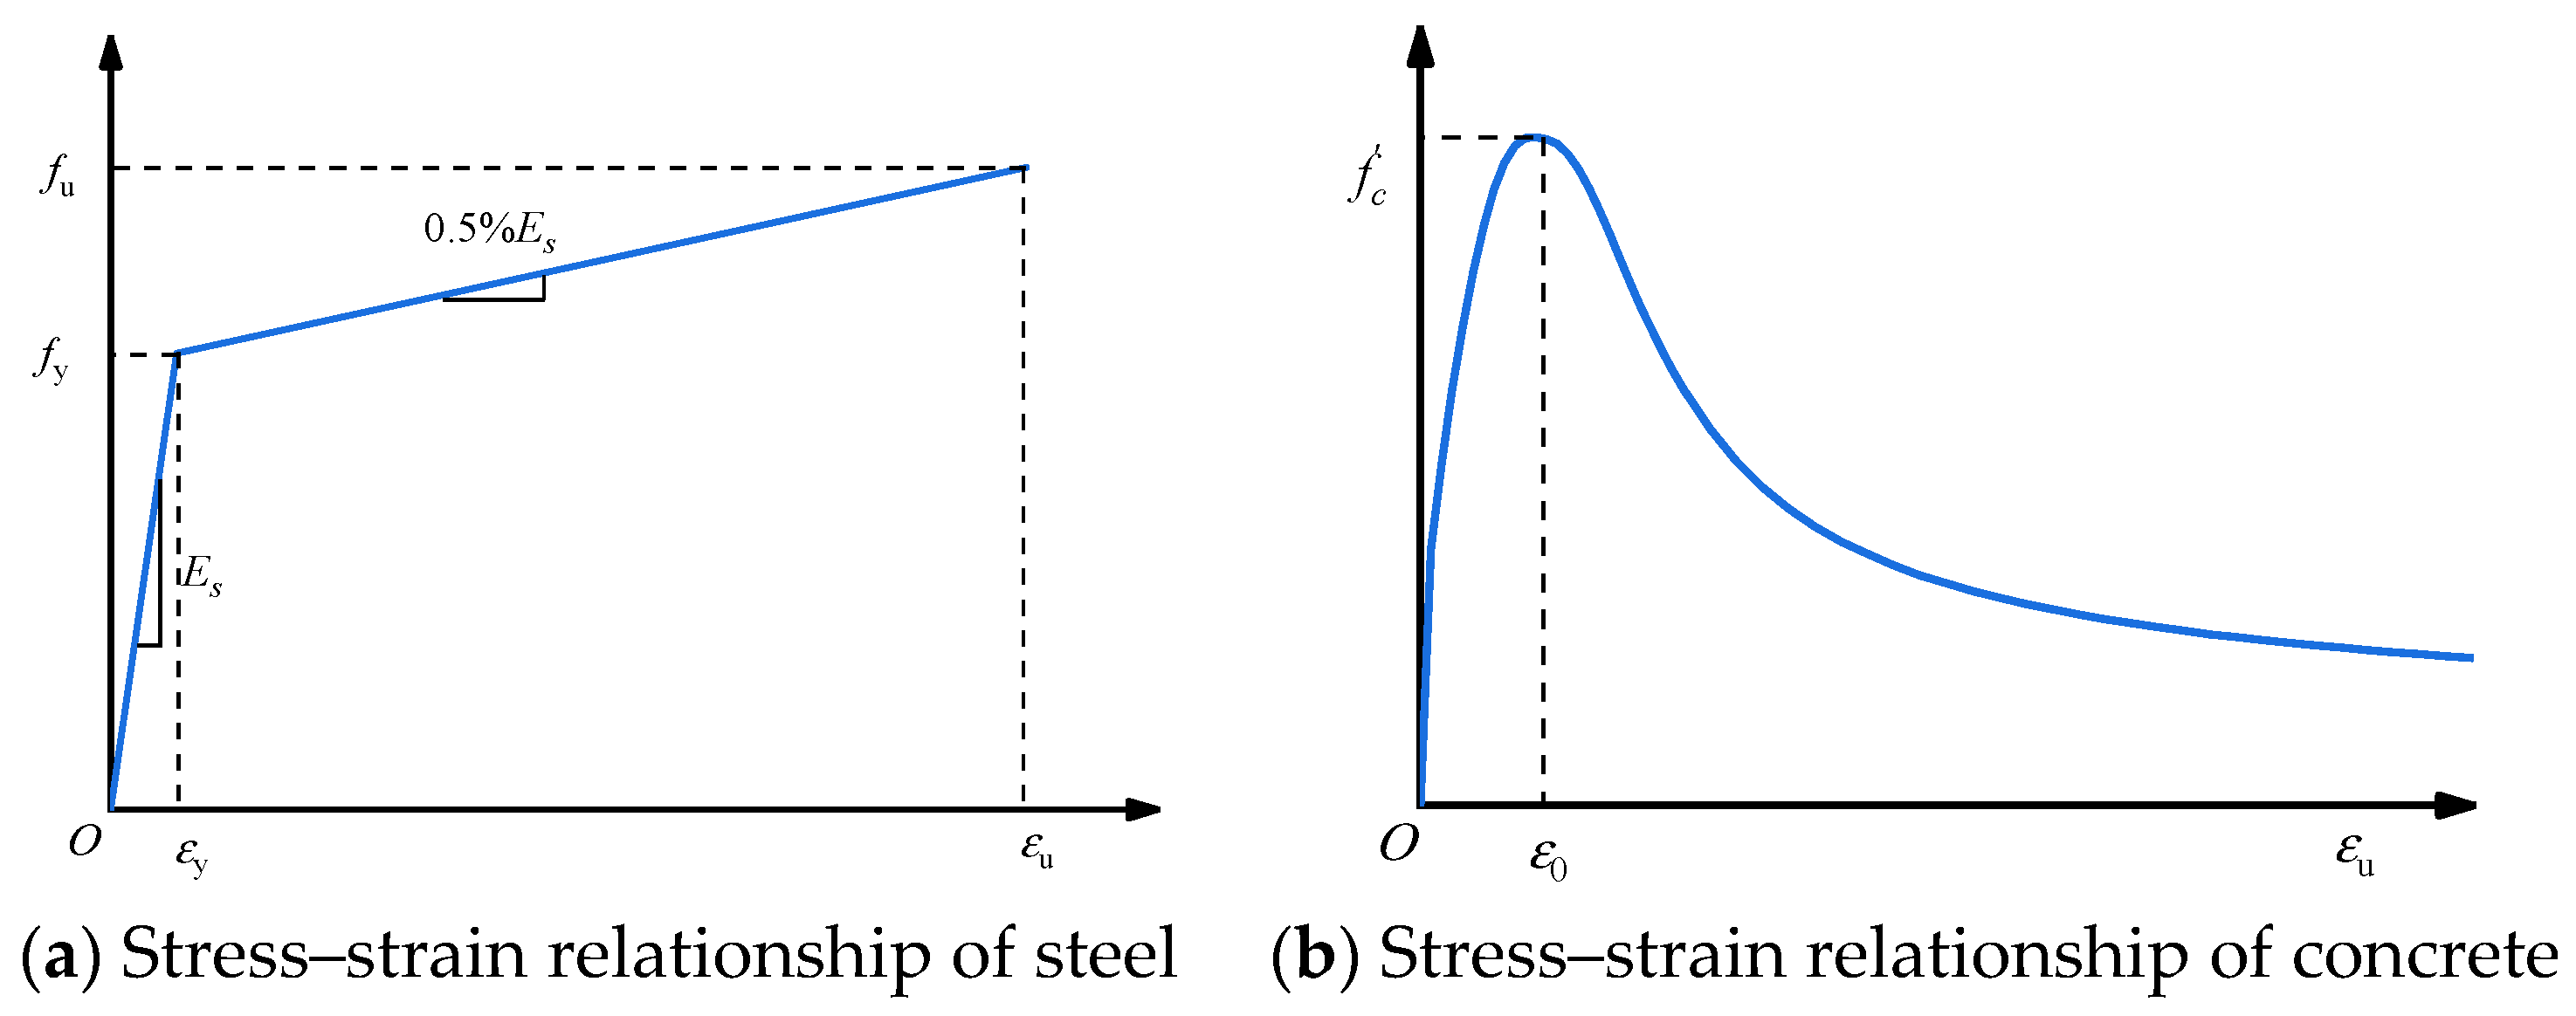
The strength of the material is taken according to the results of the material properties in Table 1. The modulus of elasticity of the steel E s is 206,000 MPa, and the Poisson’s ratio is 0.3. The constitutive relation of steel is selected to be elastic–plastic, and the gradient of the strengthening phase is 0.5% of E s , as shown in Figure 11a. The modulus of elasticity of the concrete E c is 4730 f c and the Poisson’s ratio is 0.2. The constitutive relation of infilled concrete is selected from Han’s constitutive model [31], which is suitable for the plastic behavior of core concrete in CFSTs under compression, as shown in Equations (3)–(8) and Figure 11b. Since the axial-compression properties of DCP-SCFSTs are not sensitive to the tensile behavior of concrete, a simplified bilinear curve constitutive model is used [32]. The material parameters of the concrete damaged-plasticity model are determined as follows: dilation angle ψ = 30 ° ; f b 0 / f c 0 = 1.16 ; eccentricity e f = 0.1 ; invariant stress ratio K = 0.6667 ; viscosity parameter V p = 0.0005 [33].
y = 2 x x 2 x 1 x β 0 x 1 η + x x > 1
x = ε ε 0 , y = σ σ 0
ε 0 = ε c + 800 ξ 0.2 × 10 6 , ε c = 1300 + 12.5 f c × 10 6
η = 1.6 + 1.5 x CFST   with   rectangle   section
β 0 = f c 0.1 1.2 1 + ξ CFST   with   rectangle   section
ξ = A s f y A c f c k

3.3. FE Model Verification

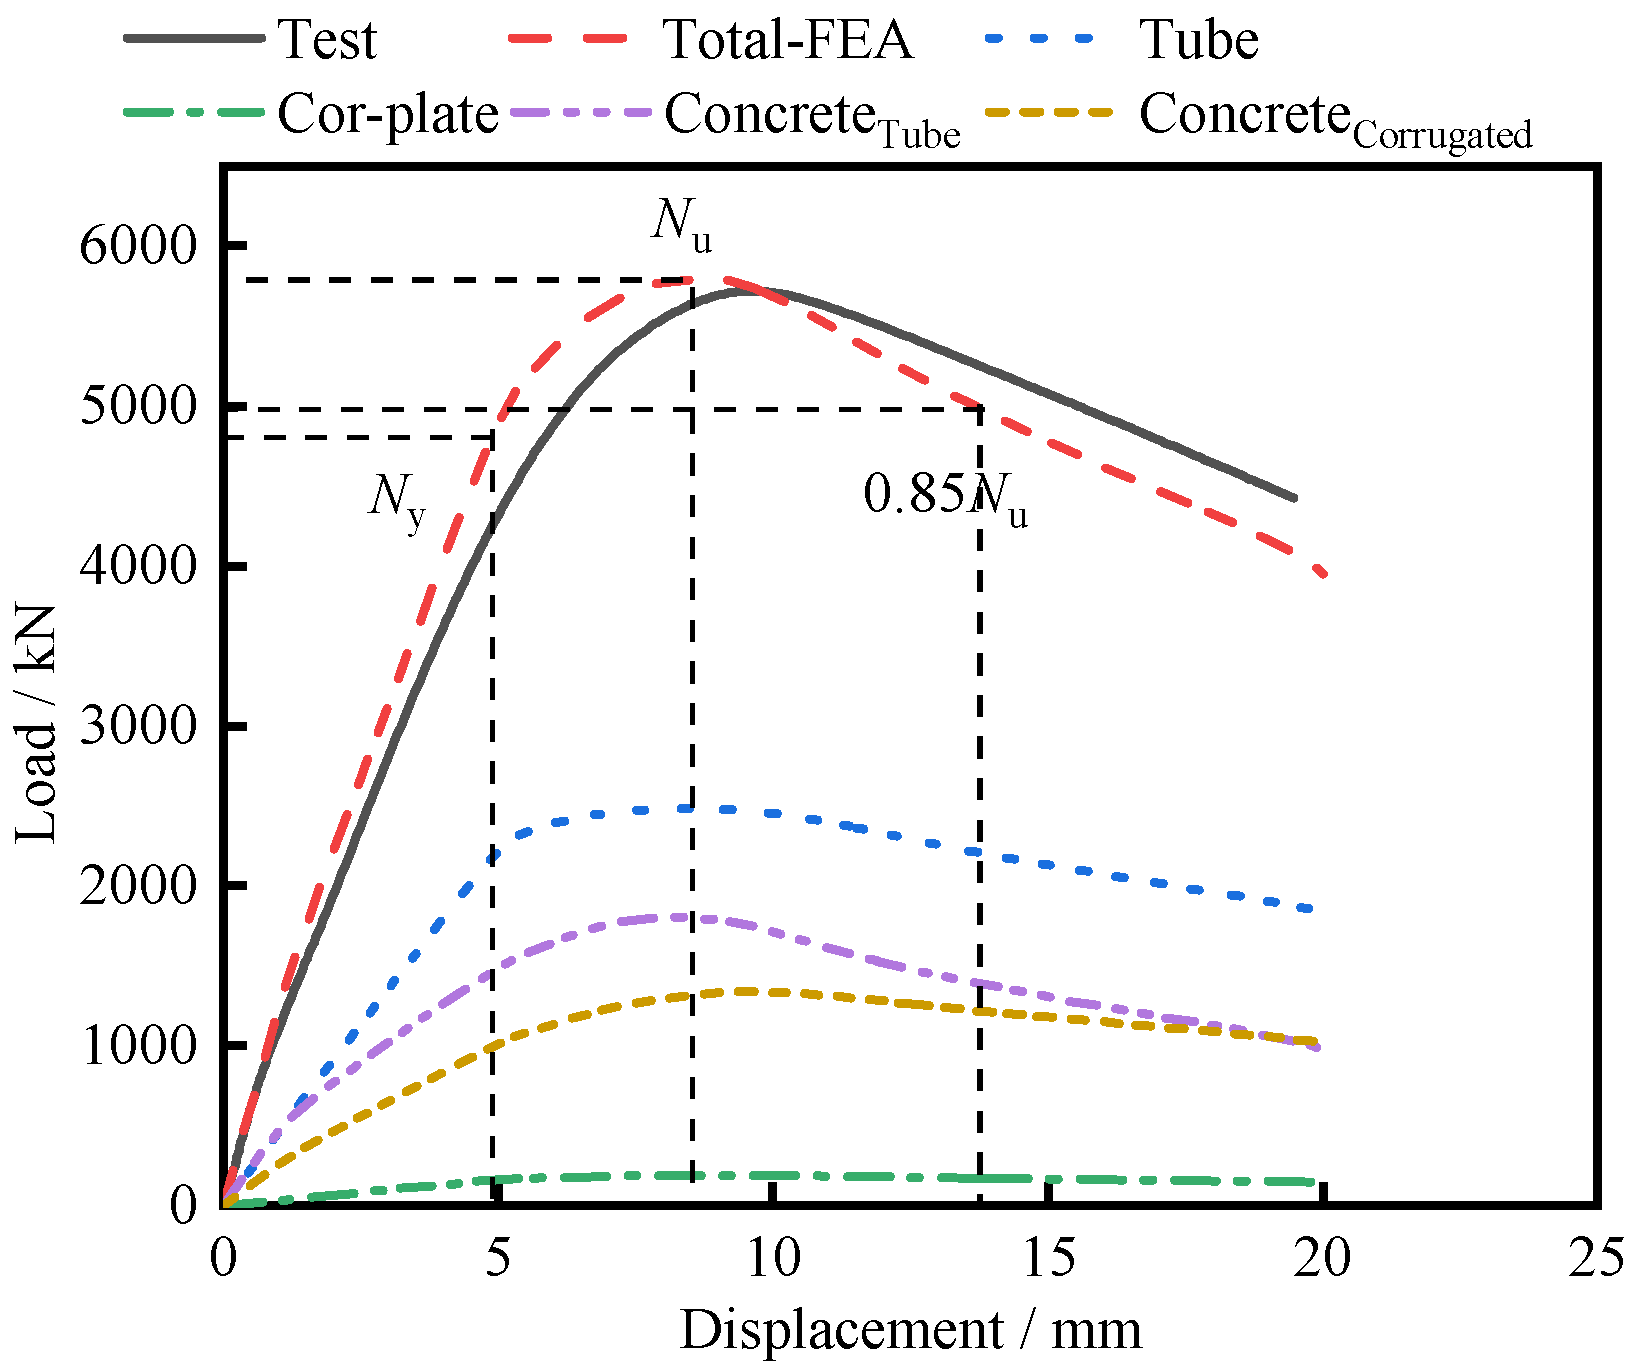
Figure 12 presents a comparison between the load–displacement curves derived from the DCP-SCFST test and those from the finite element model, with the finite element simulation results showing a good level of consistency with the test data. The contributions of steel tubes, corrugated plates, concrete-filled steel tubes, and concrete-filled corrugated plates to the bearing capacity are extracted. Initially, when the load is small, the structure is in the elastic phase, and its bearing capacity grows linearly with the increase in vertical displacement. Once the load reaches the point N y , the steel yields and enters the plastic stage. This is the point at which the steel reaches the yield strength to determine that the model has entered yielding by the FE stress distribution map. The structural bearing capacity continues to increase, and when the concrete in the square steel tube reaches the axial-compression ultimate bearing capacity, the structure reaches the ultimate bearing capacity N u . Subsequently, with the further increase in vertical displacement, the structural bearing capacity starts to decrease. The ultimate bearing capacity N u of the DCP-SCFST FE model is 5804 kN. Among the different members, the steel tubes contributed the most to the bearing capacity at 42.8%, followed by the concrete-filled steel tubes at 30.8% and concrete-filled corrugated plates at 23.1%. The load-bearing contribution of each component reflects the clear functional division of the structure:
Corrugated plates: Their direct axial force contribution is almost negligible, as their horizontal arrangement and wave-shaped cross-section lead to low vertical stiffness, precluding effective direct axial load sharing. Instead, corrugated plates exert indirect lateral confinement on the concrete in their cavities: when concrete expands under compression, the protruding parts of corrugations provide counterforces to suppress lateral deformation, delaying concrete plastic degradation.
Concrete in corrugated cavities: Benefiting from the confinement effect, it contributes 23.1% to the total bearing capacity—even the contribution of concrete in a single corrugated cavity (23.1%/2) is higher than that in a single square steel tube (30.8%/3), directly verifying the enhancement of concrete load-bearing capacity by corrugated plate confinement.
Square steel tubes: They are the main direct load-bearing components, contributing 42.8%, while the concrete in steel tubes (30.8%) is also constrained by the tubes themselves.
Figure 13a shows the deformation of the structure, and the final deformation of the finite element simulation is the same as that of the test, which is the global buckling of the columns. At the yield point Ny, the global deformation of the structure was very low. As the load increases, the structure exhibits buckling deformation under compression. The lateral deformation in the column at maximum load Nu was approximately 10 mm, which is essentially the same as that measured in the tests in Figure 7. The maximum horizontal deformation of the finite model specimen was 54 mm, which was slightly greater than the test value in Figure 7, as shown in Figure 13b.
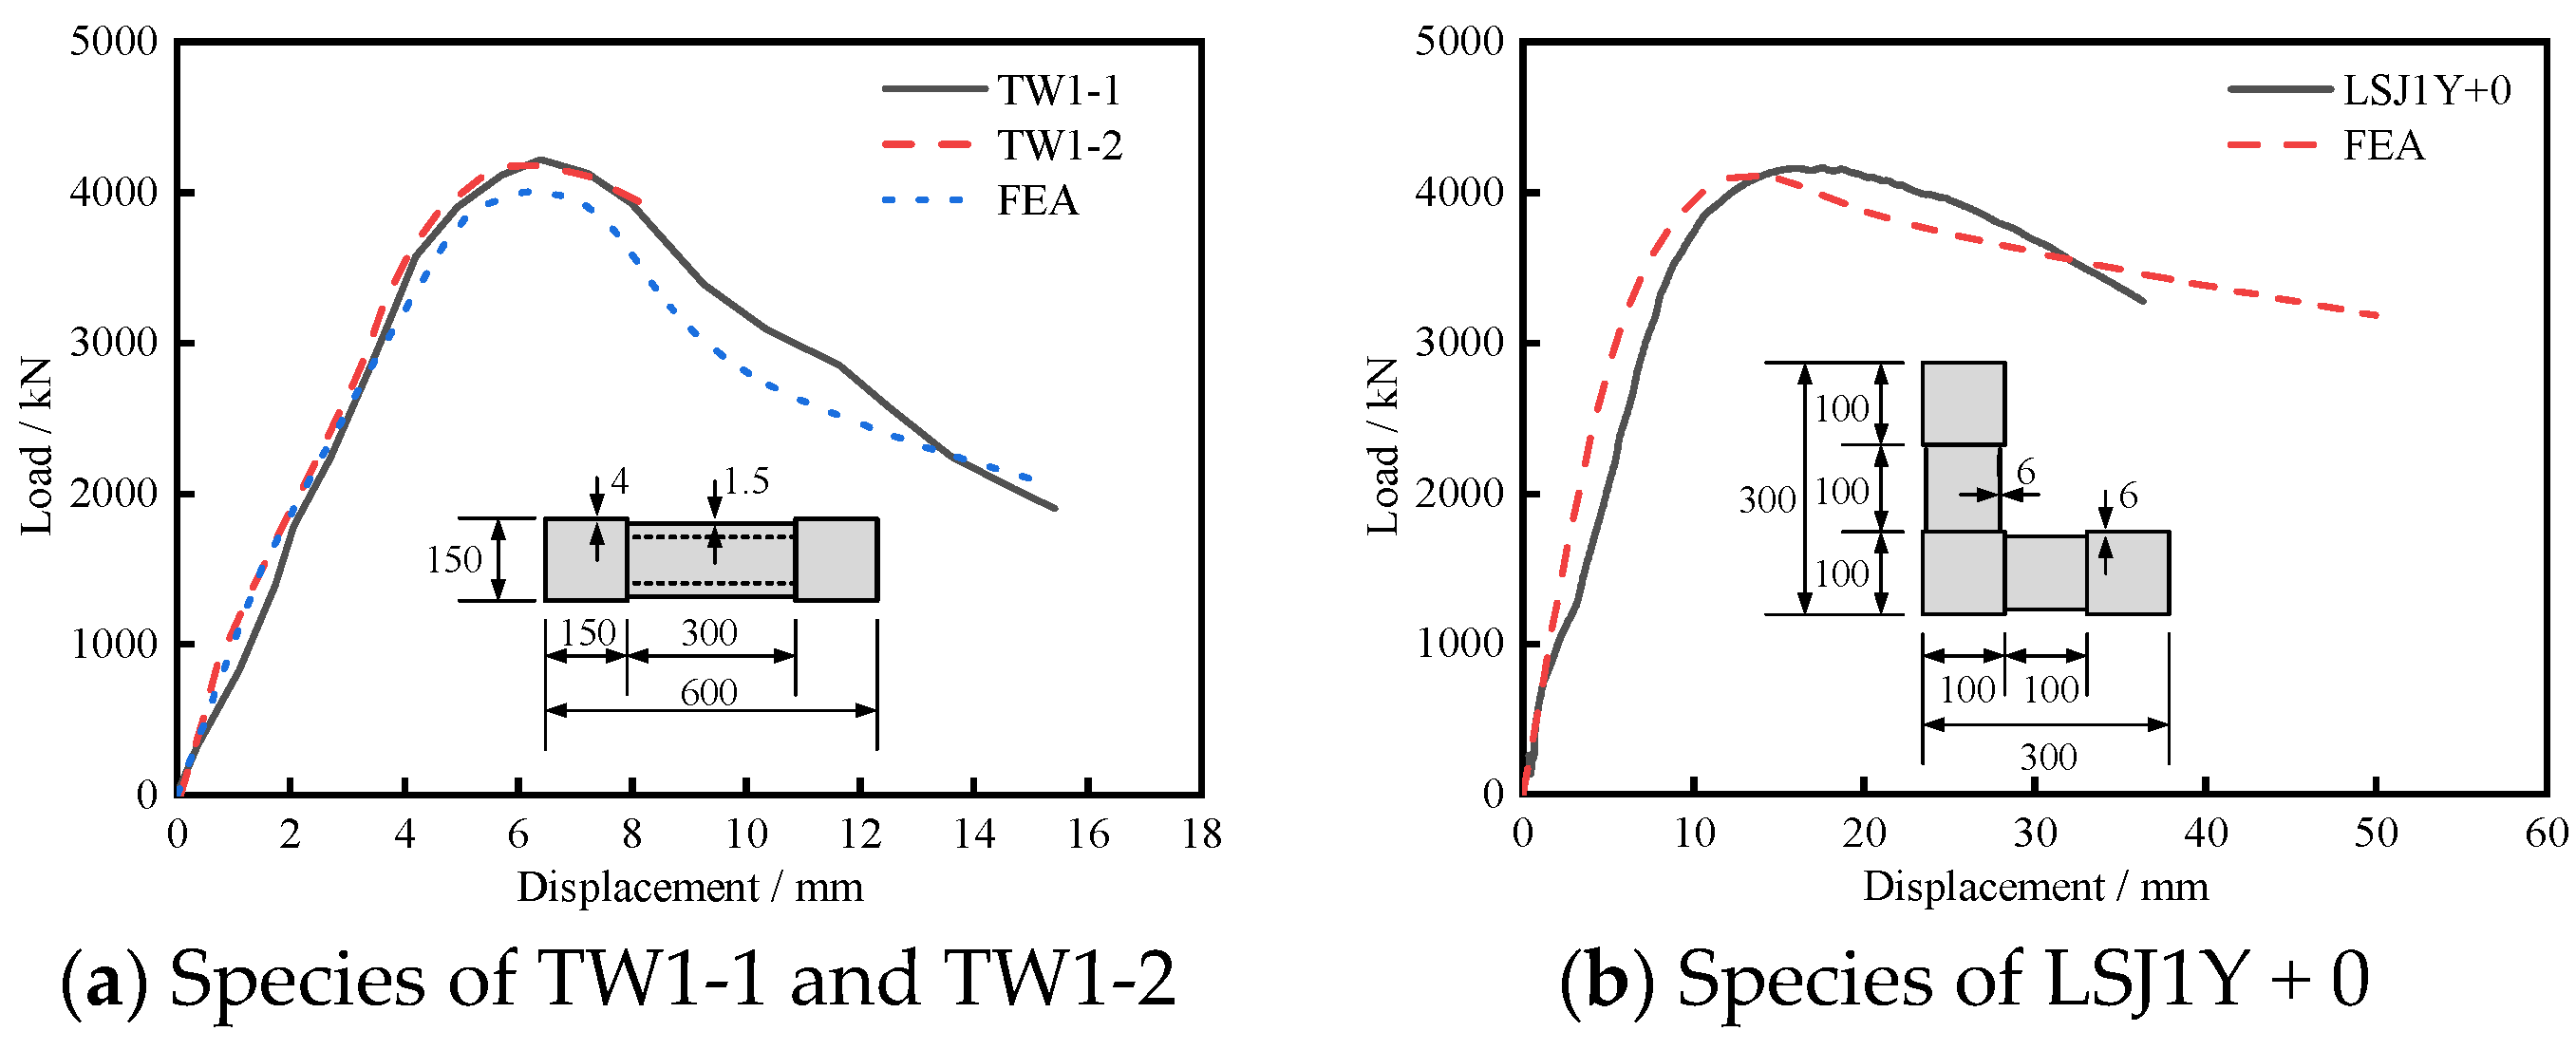
To verify the feasibility of the finite element method for analyzing DCP-SCFST columns, axial-compression tests of similar CFST specimens were simulated and compared to the corresponding test results, as shown in Table 3 and Figure 14. Specimens of TW1-1 and TW1-2 consist of corrugated steel plates connected to square steel tubes and infilled with concrete to form CFST shear walls, which are derived from the reference [22]. Specimen LSJ1Y + 0 is an L-shaped double-plate-connected concrete-filled steel tube composite column, which is derived from the reference [34]. The load–displacement curves obtained by using the above modeling method to set the model and perform the analysis are shown in Figure 14. It can be seen that the ultimate bearing capacities of those finite element models are within 5% error compared with the test results, and the load–displacement curves of those specimens were found to be mostly identical.

4. FE Parameter Analysis

The analysis presented above demonstrates that finite element modeling is an accurate way to simulate the axial-compressive behavior of DCP-SCFSTs. By utilizing finite element software for analysis, we can conserve resources while studying the influence laws of parameters on the bearing capacity of the structure. Based on the test model, the related parameters are changed to analyze the effects of column height, material strength, dimensions of the corrugated plate, and connection length on the axial-compressive load capacity of DCP-SCFSTs. The yield strength of steel for the base model in the parametric analysis was taken as 355 MPa, and the cubic compressive strength of the concrete cube was taken as 30 MPa. The variation in relevant parameters is shown in Table 4. The thickness of the tube was varied in group G-1. In G-2 the thickness of the corrugated plate was varied. The effect of different connection lengths is studied in G-3. Groups G-4 and G5 focus on the effect of material strength. The effect of different corrugation sizes was studied in G6 and G7. In addition, the influence of height has also been studied. As shown in Table 4, increasing the thickness of the steel tube increases the initial stiffness, load capacity, and ductility index DI, but the strength index SI remains essentially unchanged. While increasing the thickness of the corrugated steel plate has less effect on the initial stiffness, it is favorable to the load capacity, strength index SI, and especially the ductility index DI, which improves significantly.

4.1. Strength of Material

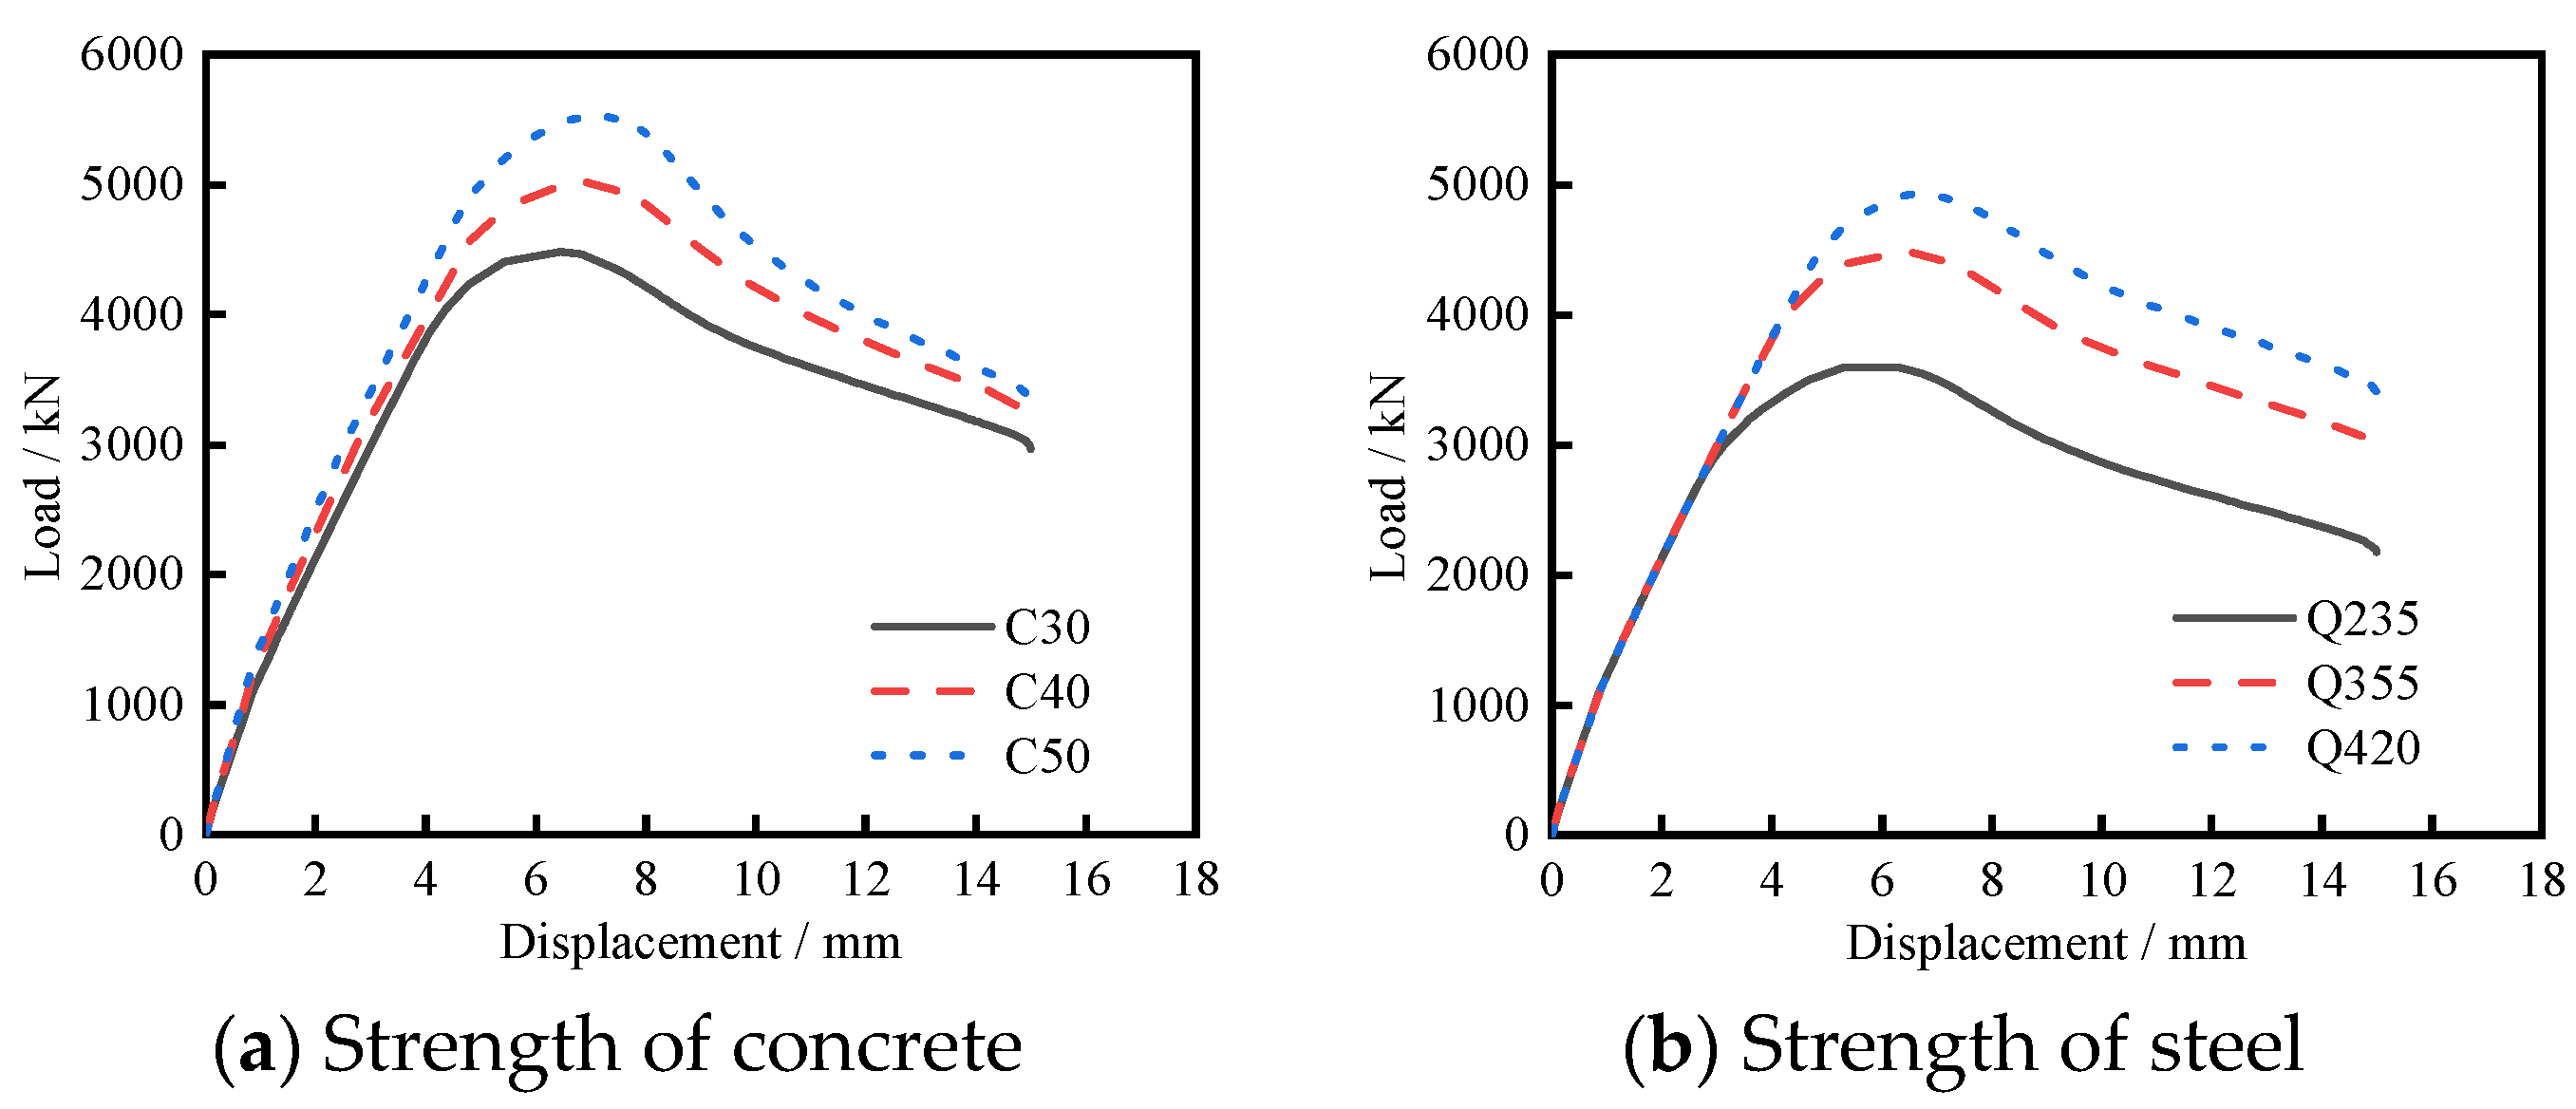
By varying the strengths of concrete and steel, the effect of material strength on structural performance is studied. Figure 15a shows the effect of different concrete strengths on the structural bearing capacity. Increasing the concrete strength leads to an increase in both the ultimate bearing capacity and the initial stiffness of the structure. Specifically, compared to C30, the models with C40 and C50 exhibit bearing capacity enhancements of approximately 12% and 23%, respectively. Figure 15b illustrates the effect of different steel strengths on the structural bearing capacity. Increasing the steel strength results in an increase in the ultimate bearing capacity of the structure. However, the initial stiffness of the structure remains essentially unaffected by changes in steel strength. When comparing the bearing capacity of models with Q235, Q355, and Q420, it is observed that the bearing capacity is reduced by approximately 20% for Q235 and increased by about 10% for Q420 as compared to Q355.

4.2. Thickness of Steel Plate

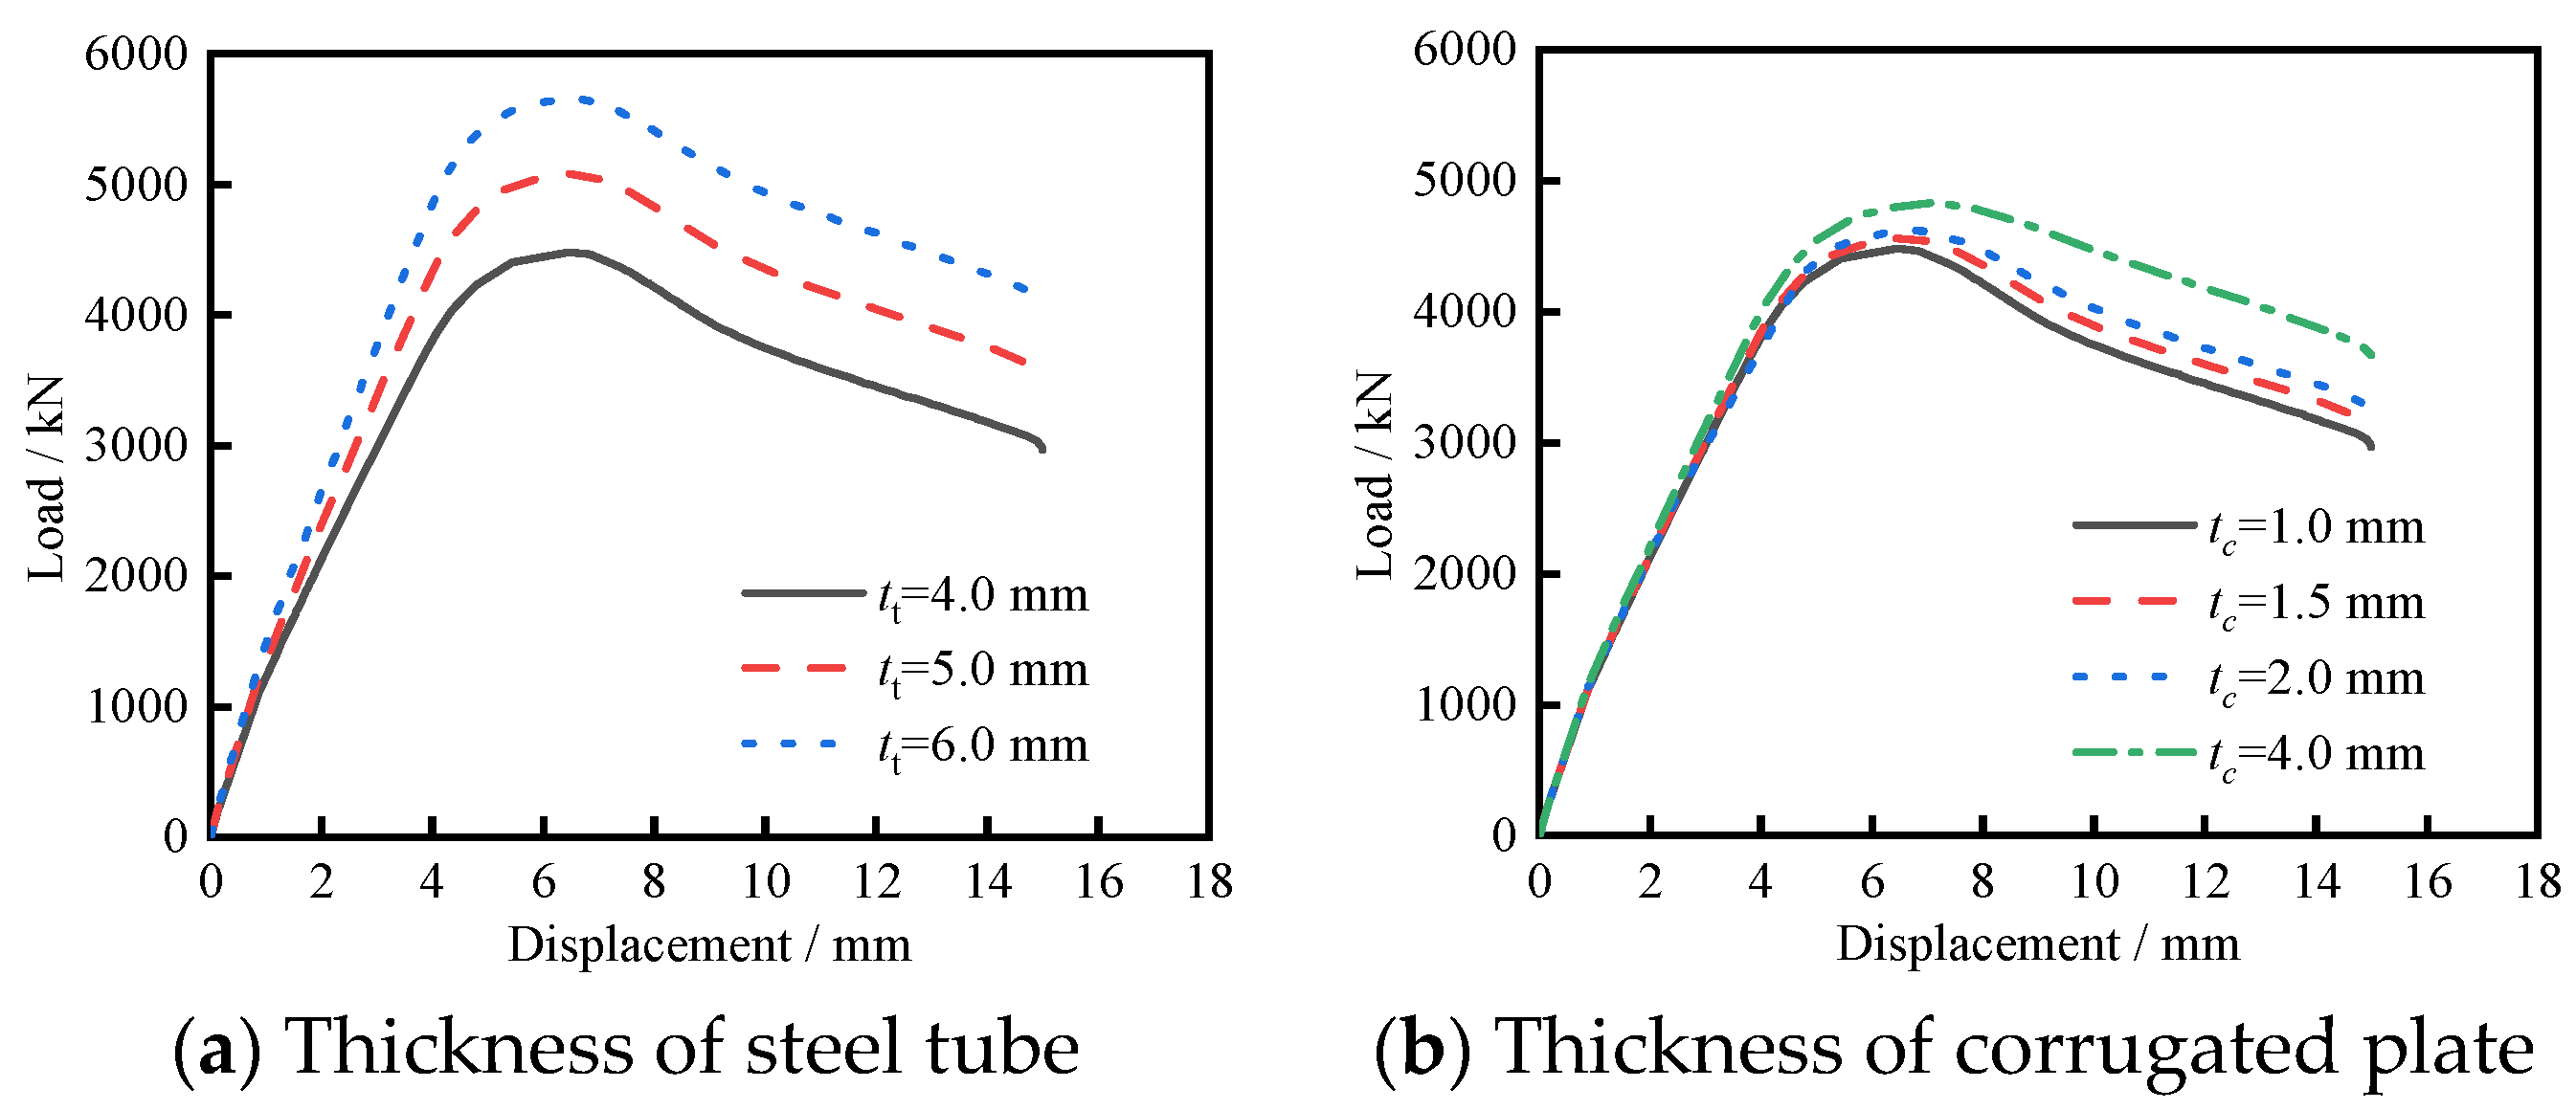
The effect of steel-plate thickness on the structural performance was investigated by varying the thickness of the steel tube and corrugated plate. Figure 16a shows the effect of different steel tube thicknesses on the structural bearing capacity. Increasing the steel tube thickness can increase the ultimate bearing capacity of the structure and also the initial stiffness of the structure. Compared with the steel tube with t t = 4.0 mm, the bearing capacity of the t t = 5.0 mm and t t = 6.0 mm models increased by 13% and 26%, respectively. A linear growth trend was observed in this relationship. Figure 16b illustrates the effect of different corrugated-steel-plate thicknesses on the structural bearing capacity. Increasing the corrugated-plate thickness does not significantly increase the ultimate bearing capacity of the structure and has essentially no effect on the initial stiffness of the structure. However, it can improve the structural ductility slightly. When comparing the ultimate bearing capacity of models, compared to the model with a thickness of t c = 1.0 mm, the bearing capacity increased by approximately 2%, 3%, and 8% for the t c = 1.5 mm, t c = 2.0 mm, and t c = 4.0 mm models, respectively. This is because the corrugated plate is arranged horizontally and does not bear a significant vertical load. As a result, the thickness of the corrugated steel plate has little effect on the structural bearing capacity.
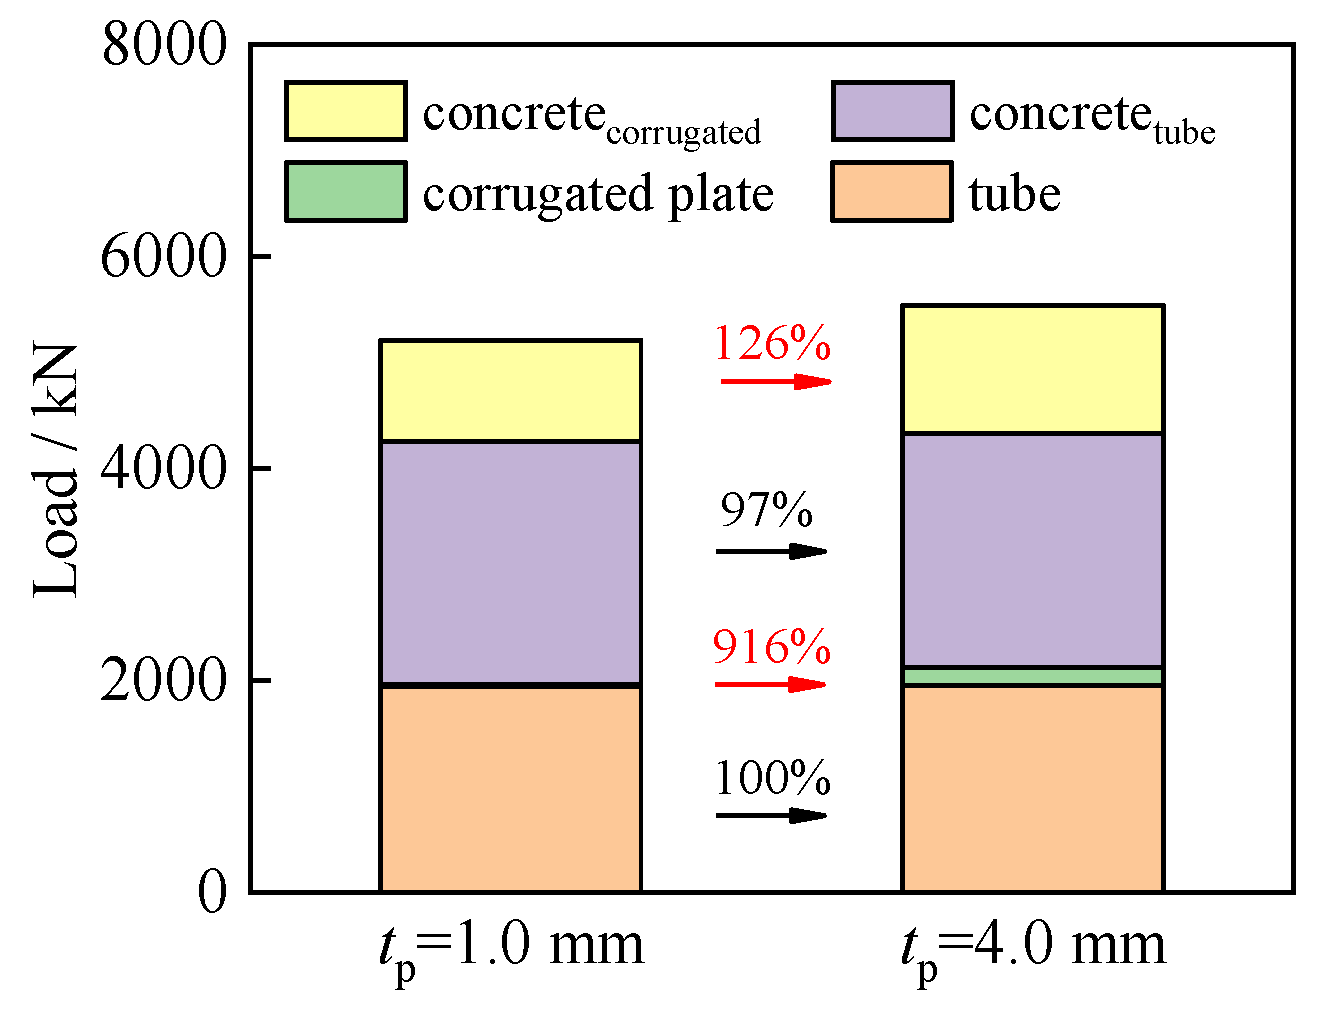
The structural bearing capacity does not increase linearly as the thickness of the corrugated plate increases. The load-bearing capacity contributions of each part were further analyzed to compare the load-bearing capacity contributions of CFST columns with different corrugated-plate thicknesses, as shown in Figure 17. It can be seen that the bearing capacity of the square steel tube and its filled concrete remains relatively unchanged. However, the contribution of the corrugated plate and its filled concrete exhibits a significant increase. Specifically, when the corrugated-plate thickness increased from 1.0 mm to 4.0 mm, the bearing capacity of the corrugated plate increased from 18 kN to 167 kN, representing 916% of the initial value. Although the contribution of the corrugated plate to the overall bearing capacity may be relatively small, its increase is noticeable. Furthermore, the concrete-filled corrugated plate experienced increased restraint, resulting in a corresponding increase in bearing capacity. The bearing capacity increased from 960 kN to 1213 kN, which is 126% of the previous capacity. Therefore, as the thickness of the corrugated plate of CFSTs increases, the structural bearing capacity improves due to the enhanced restrained action on the corrugated concrete.

4.3. Length of Corrugated-Plate Connection

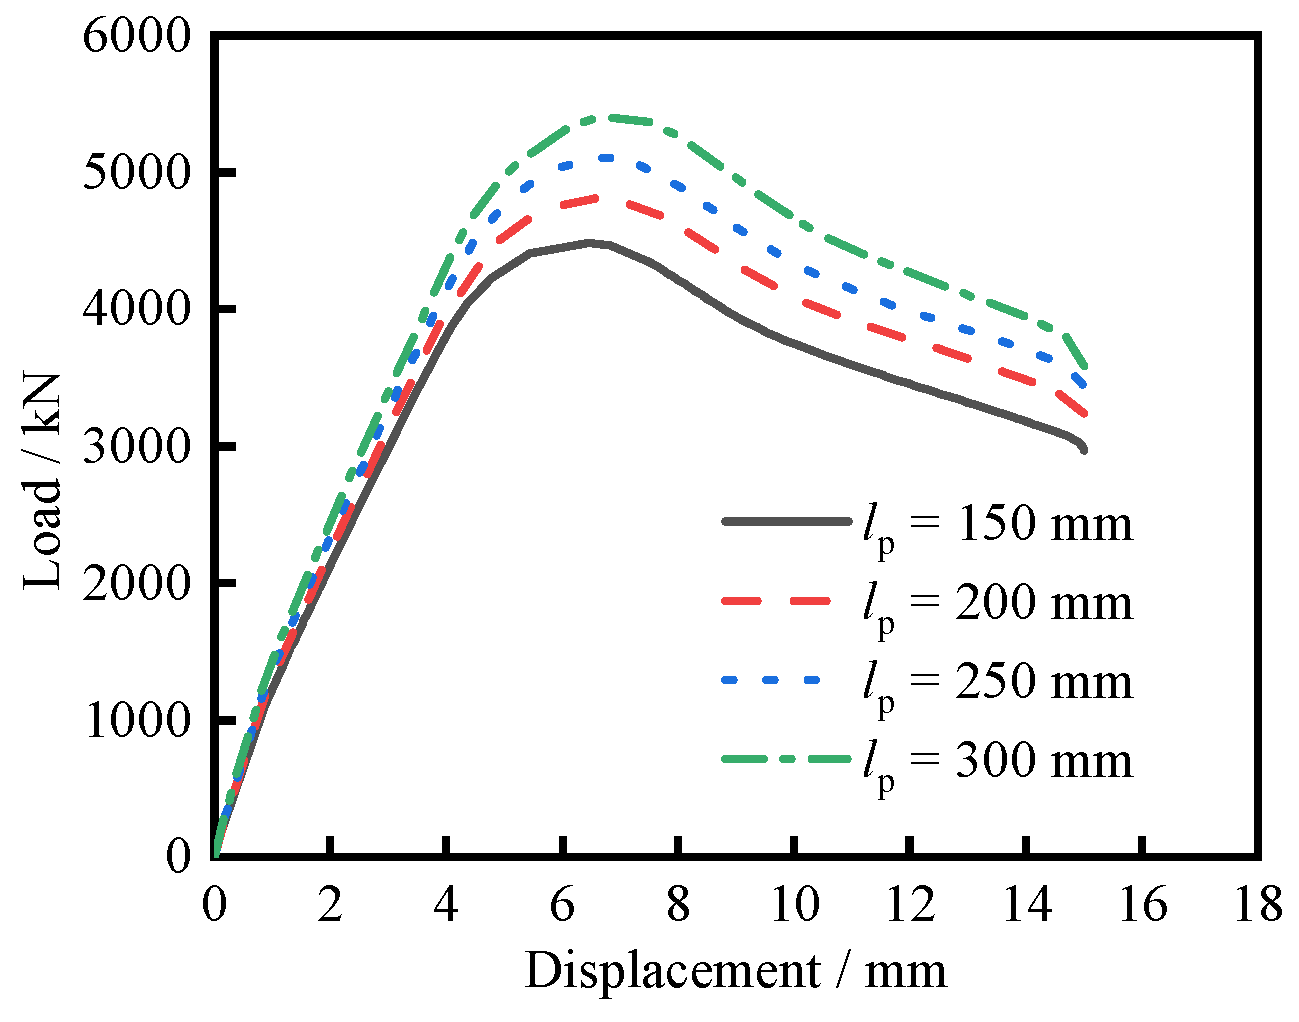
The effect of the corrugated-plate length on the structural performance was investigated by varying the length of the connection section. Figure 18 shows the effect of different connection section lengths on the structural bearing capacity. Increasing the length of the corrugated-plate connection can improve the ultimate bearing capacity of the structure. Compared with the l p = 150 mm model, the bearing capacity of the l p = 200 mm, l p = 250 mm, and l p = 300 mm models increased by 7%, 14%, and 20%, respectively. The increase in the length of the connection section results in a larger area of concrete filled within the corrugated plate. Consequently, this increase in concrete volume contributes to the improvement in the structural bearing capacity.

4.4. Wave-Height of Corrugated Plate

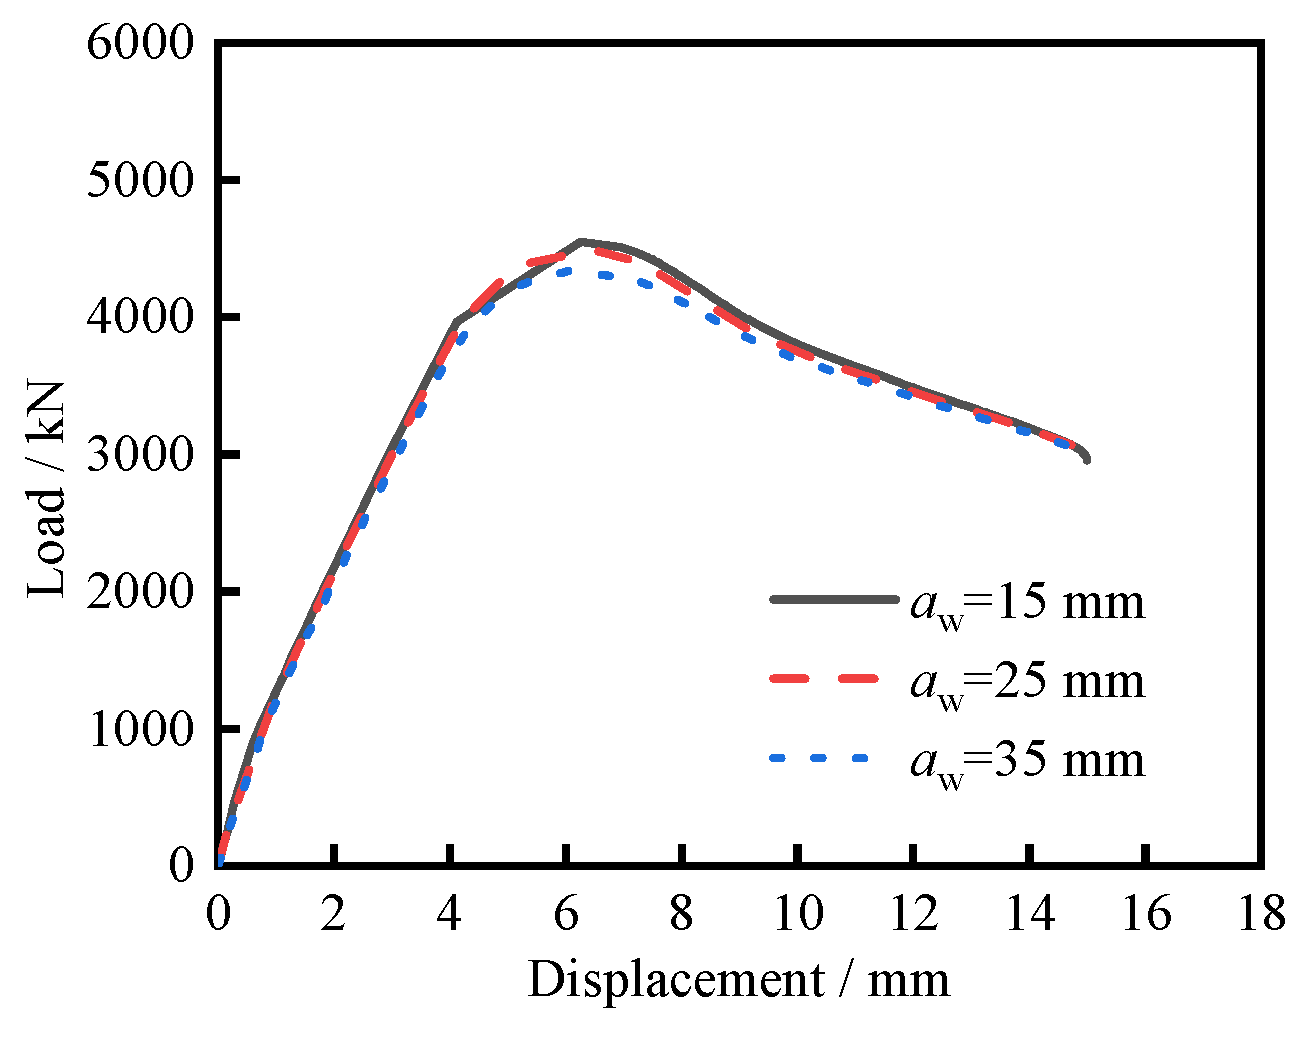
The effect of the wave-height of the corrugated plate on the structural load–displacement curve is shown in Figure 19. With the increase in wave-height of the corrugated plate, the bearing capacity slightly decreases. Compared with a w = 15 mm, the wave-heights of a w = 25 mm and a w = 35 mm decreased the bearing capacity by 1.5% and 4.6%. The decrease in bearing capacity can be attributed to the larger wave-height resulting in a reduction in the narrowest distance of concrete within the corrugated cavity. This reduction leads to a decrease in the effective cross-sectional area, ultimately resulting in a decrease in the ultimate bearing capacity of DCP-SCFSTs.

4.5. Wave-Length of Corrugated Plate

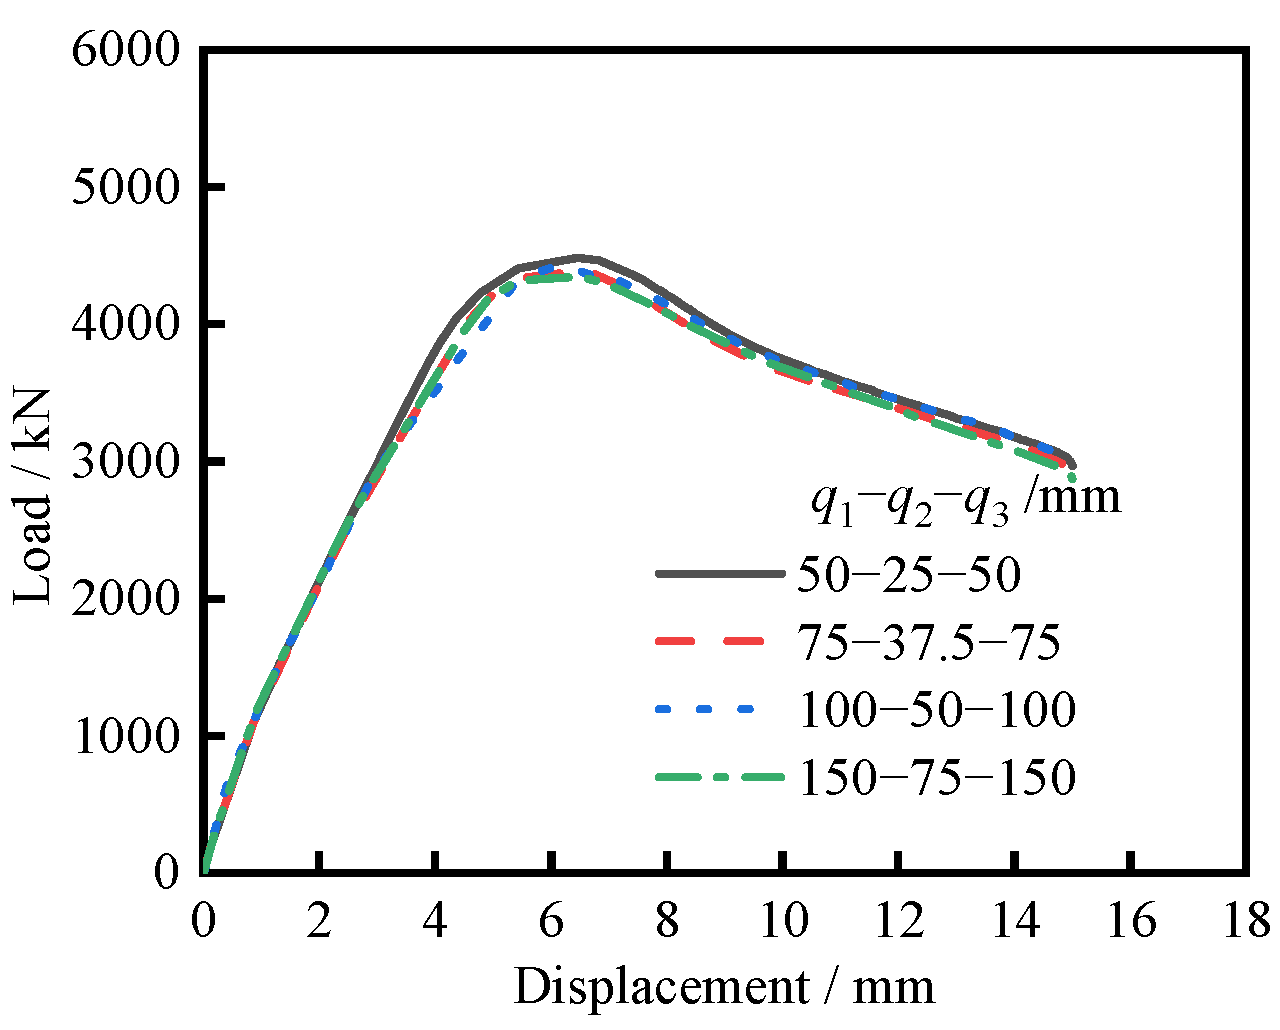
The waveform size of the corrugated plate was changed to study the effect of the waveform on the load–displacement curve of the structure. It can be seen from Figure 20 that the wave-length of the corrugated plate has a small magnitude of influence on the ultimate structural bearing capacity, under the condition of constant wave-height. The ultimate bearing capacity of the structure varies within 3%. This suggests that changes in the wave-length of the corrugated plate do not significantly affect the overall axial-compressive performance.
Analysis of the G-6 (wave-height) and G-7 (wave-length) parameter groups revealed that under axial-compression conditions, when the wave-height ranges from 15 to 35 mm and the wave-length ranges from 50-25-50 to 150-75-150 mm (commonly used in engineering applications), the ultimate load-bearing capacity fluctuation of DCP-SCFSTs is only -4.6% to +1.5%, with the strength index SI remaining stable between 0.97 and 1.00 (Table 4). This indicates that corrugation parameters exert a significantly lesser influence on axial-compression performance than core parameters such as steel pipe thickness and connection length. This result indicates that for the axial-compression design of L-shaped DCP-SCFSTs, optimizing corrugation to enhance load-bearing capacity is not a necessary approach.

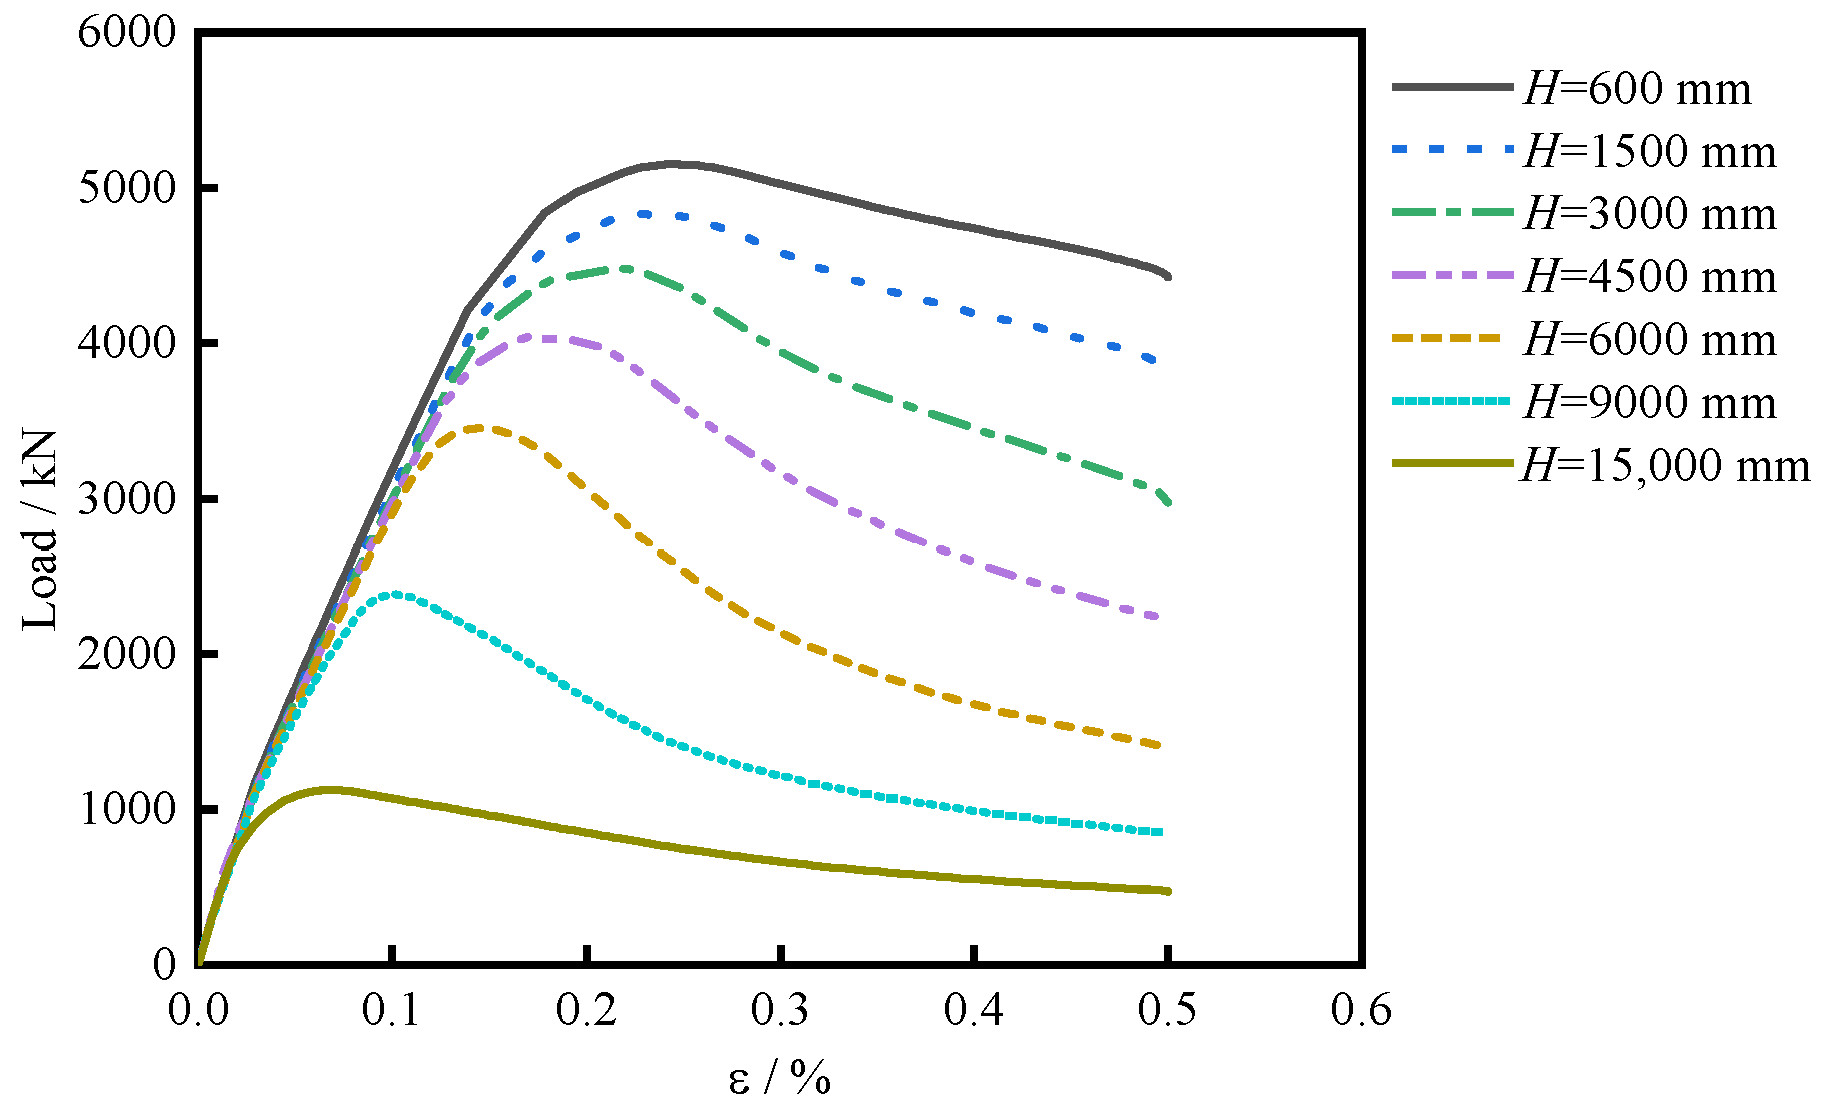
4.6. Height of Column

Figure 21 shows the effect of different column heights on the structural bearing capacity. The ultimate bearing capacity of the structure decreases with increasing column height, and the ductility decreases significantly. Compared with the H = 600 mm model, the ultimate bearing capacity of the H = 1500 mm, H = 3000 mm, H = 6000 mm, H = 9000 mm, and H = 15 , 000 mm models decreased by 6%, 13%, 33%,54%, and 78%, respectively. The structural stability decreases with increasing column height. When the height is small, the structure primarily exhibits strength-controlled damage. In contrast, as the structural height increases, the bearing capacity of the structure becomes dominated by its stability-related bearing capacity.

5. Design Method of Bearing Capacity Under Axial Compression

From the cross-section, DCP-SCFSTs comprise two corrugated steel plates that serve as the connecting plate between the square-steel-tube column and are filled with concrete. Making the square-steel-tube column and the connecting plate have good integrity, which is similar to the traditional DP-SCFSTs. When the corrugated plates are positioned horizontally, their vertical stiffness is relatively low, precluding them from bearing a significant portion of the vertical load. Consequently, for axial-compression analysis, it is deemed reasonable to disregard their direct contribution to the axial-compression bearing capacity.

5.1. Sectional Strength of Stub DCP-SCFSTs

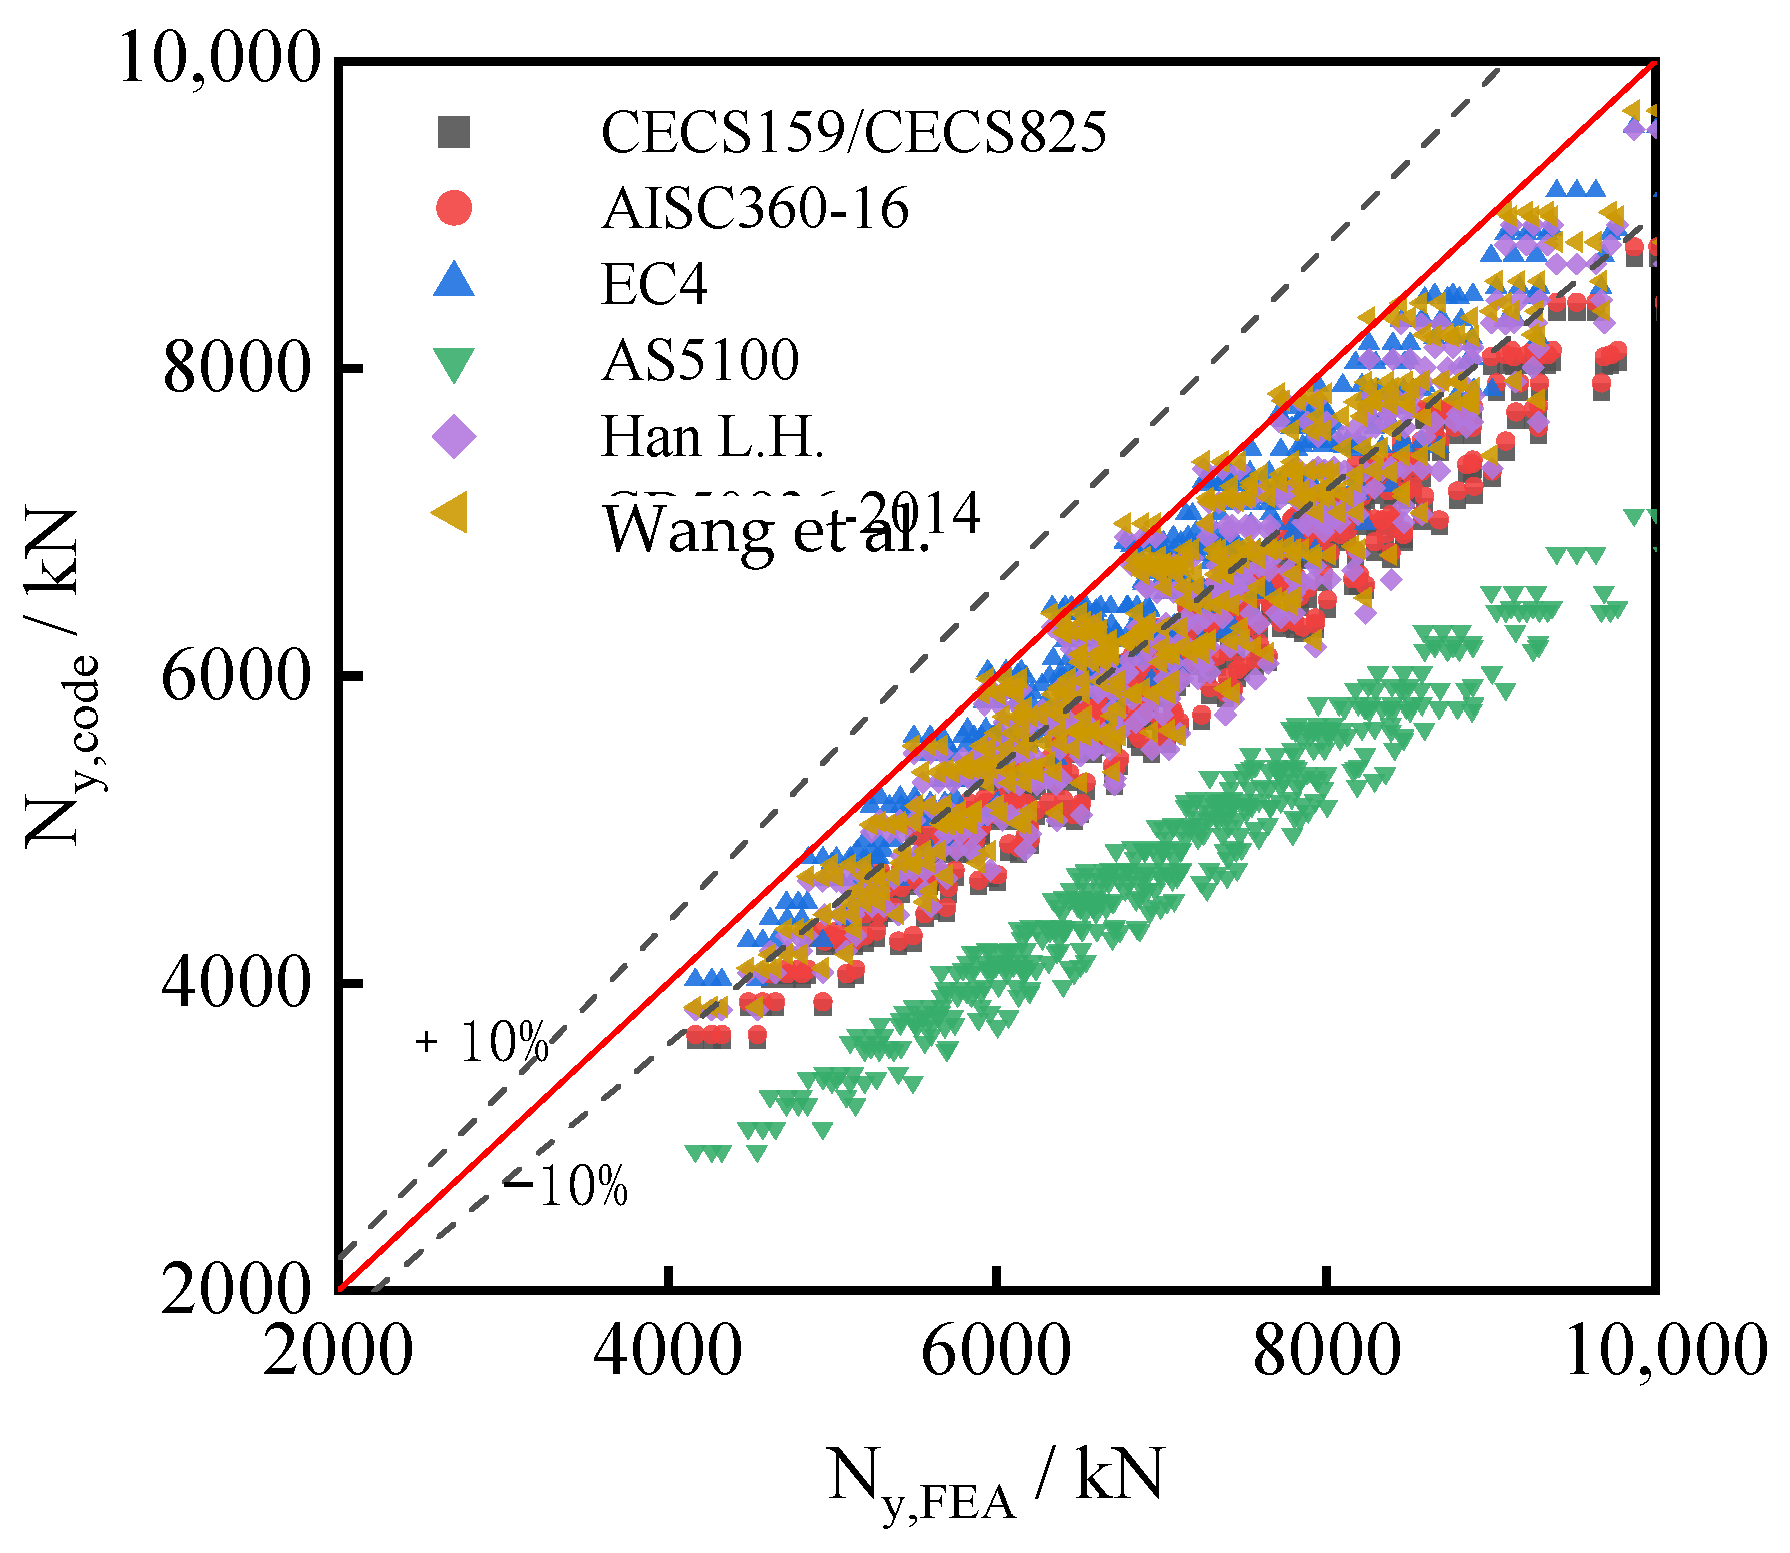
A comparison of the applicability of existing calculation methods to the strength of DCP-SCFST sections is shown in Table 5. The codes currently available for the calculation of the fully cross-sectional yielding load of CFSTs can be classified into two main types. (I) The unified theory: This theory considers the steel tube and core concrete as a composite material and considers the constraint effect of the steel tube on the core concrete. Examples of formulas proposed based on this theory include those by Wang et al. [35] and GB50936 [36]. (II) The superposition theory: This theory involves summing up the load-bearing capacity of the steel tube and the core concrete, but does not consider the restraint effect of the steel tube on the core concrete, such as CECS159 [37], T/CECS825 [38], and EC4 [39]. CECS159 and T/CECS825 use the superposition method to give the formula for calculating the axial-compression load capacity of CFSTs. In AISC360 [40], Equation (10) was used to calculate the axial-compression bearing capacity of CFST. The strength of the concrete-filled rectangular steel tube was modified by a discount factor of 0.85. The superposition theory is used in EC4 to calculate the axial-compression bearing capacity of CFST, as shown in Equation (11). The formula of CFSTs for rectangular CFSTs is given in AS5100.6 [41], the capacity reduction factor for steel strength is 0.9, and the capacity reduction factor for concrete strength is 0.6. Wang et al. fitted the axial compression strength index f scy of CFSTs through the results of tests and numerical analysis and proposed the formula for calculating the axial-compression strength bearing capacity of CFSTs. The axial-compressive-strength index f scy of rectangular CFSTs is calculated by Equation (13). GB50936 [36] presents Equation (14) to calculate the section strength of concrete-filled steel tube columns based on the unified theory. Parameters B and C are cross-section shape factors, and the values taken for squares are listed in Table 5.
In general, the height-to-width ratio of the column L / D 4 for stub columns and the design of the CFST axial-compression specimen are generally taken as L / D = 3 [42]. In order to study the relationship between the strength of the concrete-filled corrugated plate and the confinement factor, the models of H = 600 mm were selected for analysis. Several formulas for calculating the CFST axial-compression load capacity are used to calculate the DCP-SCFST according to the formulas listed in the summary of Table 5. It should be noted in particular that the contribution of corrugated steel plates is neglected in the calculation of the bearing capacity of DCP-SCFSTs. There are more than 400 models covering commonly used dimensions and material strengths, and the results of the calculations are shown in Figure 22, which considers as parameters the thickness of the steel tube, the thickness of the corrugated steel plate, the strength of steel and concrete, and the length of connecting section; these were selected based on the commonly used dimensions and material strengths in Table 4’s comparison of the obtained results with the FEA results shows that there are differences in the MAE, RMSE, and MAPE of the results from different codes (as shown in Table 6), which indicates whether the existing design codes can accurately predict the axial-compressive load-carrying capacity of the DCP-CFST. The calculation results using EC4 and Wang et al.’s formula are closer to the finite element results. However, the calculation results of the existing codes basically have an MAPE of around 6% to 15% over the FEA results, with AS5100.6 reaching 31%. This indicates that most of the codes have conservative calculation results. Therefore, it is impossible to accurately predict the axial-compressive bearing capacity of DCP-SCFSTs. Failure to accurately reflect the restraining effect of corrugated steel plates on the core concrete is the primary reason for the inaccuracy of these existing formulas for DCP-SCFST bearing capacity. Meanwhile, some formulas use discount factors or safety factors, resulting in overly conservative calculations, which may result in a waste of materials.
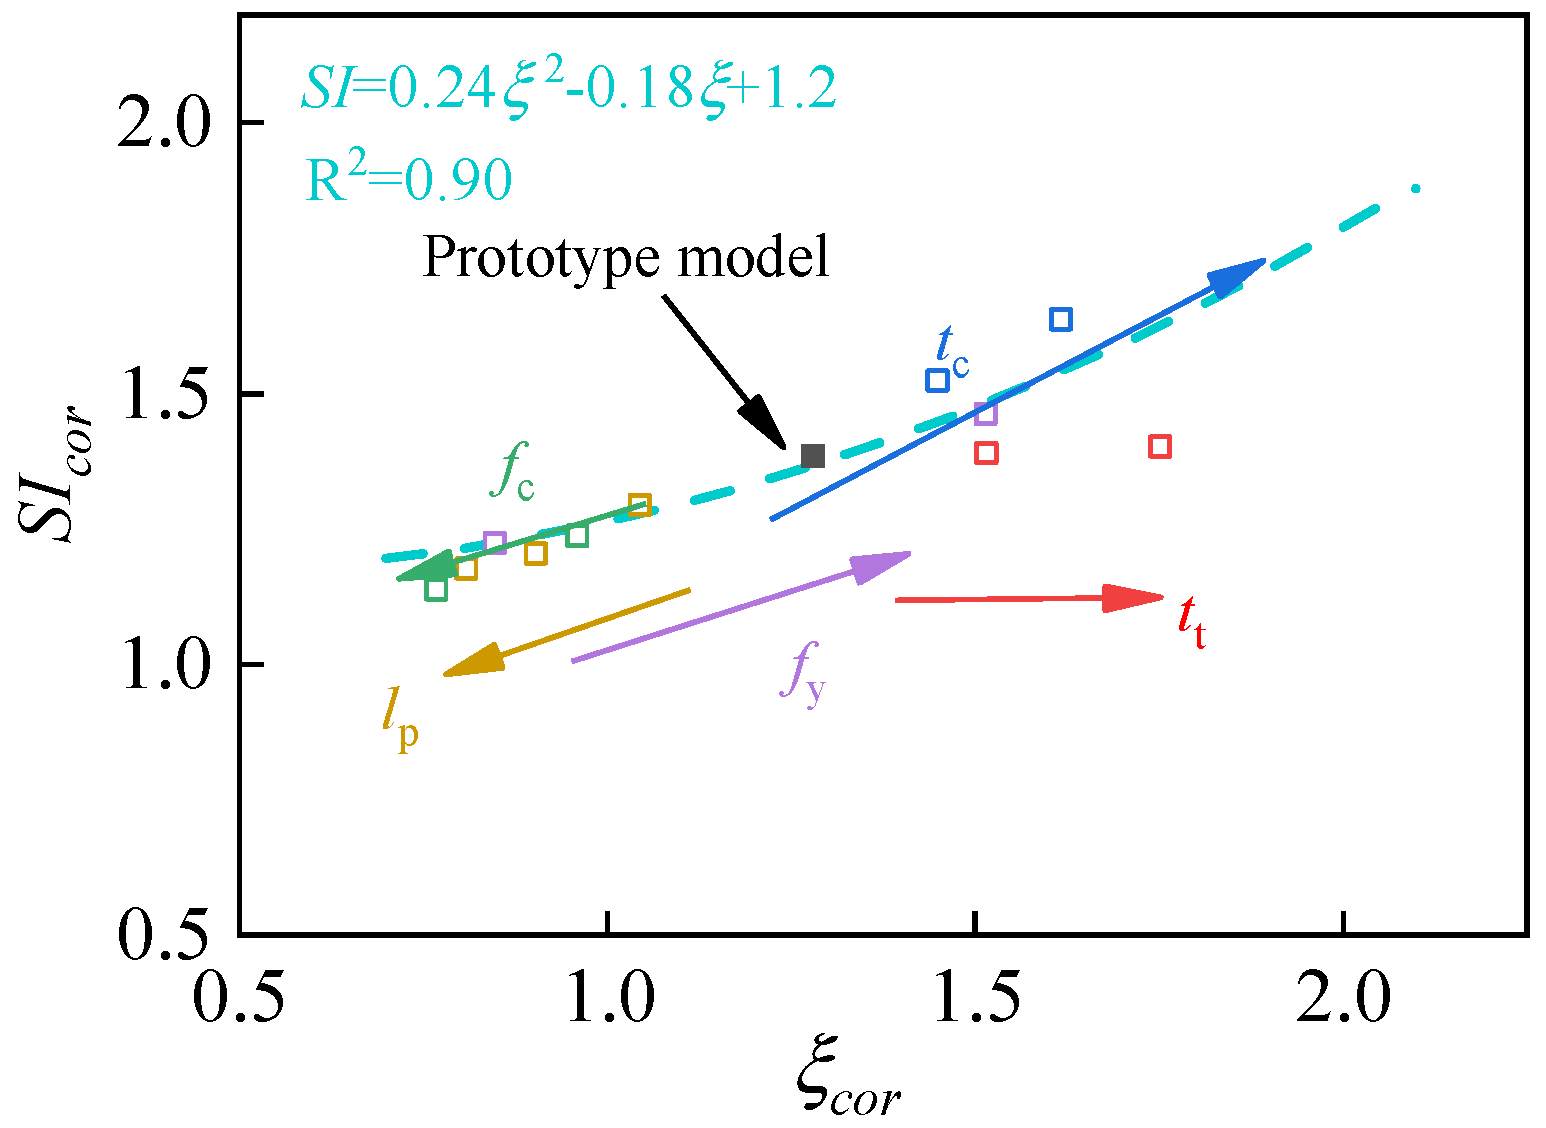
The strength index of concrete-filled corrugated plate S I cor is defined as Equation (15). The confinement factor of concrete-filled corrugated plate ξ cor is defined as Equation (16), where the cross-sectional area of steel consists of the steel tube and corrugated plate. A s , cor and A s , tube * represent the two corrugated steel plates and two flat plates that constitute a rectangular corrugated cell, with the latter being part of the steel tube on either side. Figure 23 shows the trend of S I cor with ξ cor , and fitting these data points to obtain the relationship curve of S I cor and ξ cor , as shown in Equation (17). The corrugated plate can also produce a significant restraint effect on the concrete, so S I cor are all larger than 1.0. The overall trend is that S I cor increases as ξ cor increases. From Figure 23, the effect of parameters on S I cor and ξ cor is analyzed, and the direction of the arrow indicates that the parameters increase. Changing the thickness of the tube ( t t = 4 mm, 5 mm, 6 mm) increases the ξ cor , but the effect on the S I cor is not significant. However, increasing the corrugated thickness ( t c = 1.0 mm, 1.5 mm, 2 mm, 4 mm) increases the S I cor and ξ cor . Increasing the concrete strength (C30, C40, C50) decreases the ξ cor and also decreases the S I cor . Increasing the steel strength (Q235, Q355, Q420) will increase the ξ cor and S I cor . Increasing the length of corrugated-plate connection (150 mm, 200 mm, 250 mm, 300 mm) decreases the S I cor and ξ cor .
The relationship between the confinement factor ξ cor and the section strength in concrete-filled corrugated steel plates was analyzed above. Moreover, combining the superposition theory and unification theory, DCP-SCFSTs are regarded as a superposition composition of the bearing capacity of CFST and double-corrugated steel plates. Based on Wang et al.’s unified theory calculation method of CFST strength [35], this paper considers the restraining effect of corrugated steel plate and steel tubes on concrete, and the axial-compressive bearing capacity of DCP-SCFSTs is calculated as shown in Equation (18).
S I cor = f ξ cor = N u , cor N y , cor
ξ cor = A s , tube * + A s , cor f y A c , cor f ck
S I cor = 0.24 ξ cor 2 0.18 ξ cor + 1.2 0.7 ξ cor 2.1
N y = ( A s , tube + A c , tube ) f scy , tube + A c , cor f scy , cor f scy , tube = ( 1.18 + 0.85 ξ tube ) f ck f scy , cor = S I cor f ck = ( 0.24 ξ cor 2 0.18 ξ cor + 1.2 ) f ck
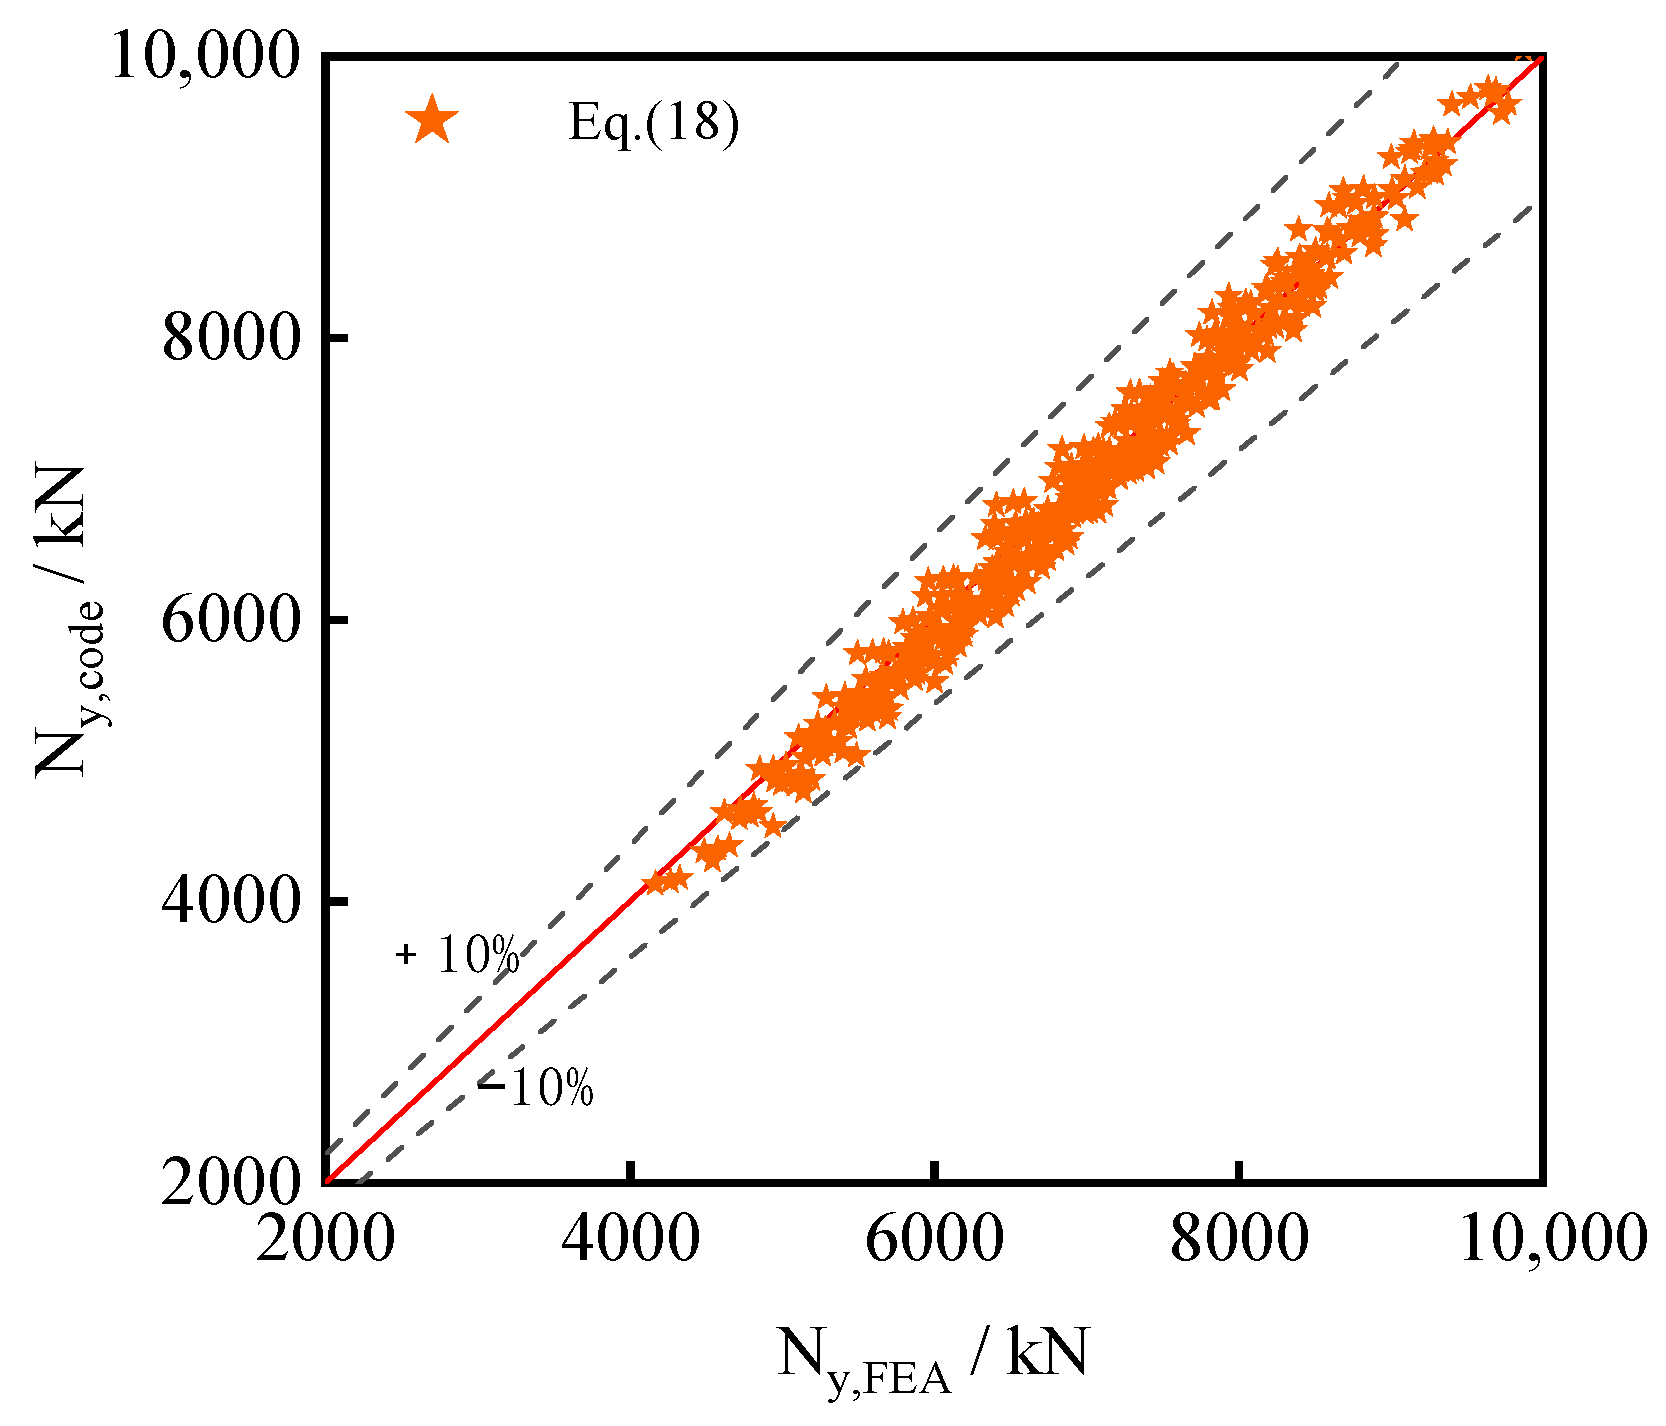
According to the formula that Equation (18) proposed above, the cross-sectional strength of DCP-SCFST is calculated and compared with the finite element calculation results, as shown in Figure 24. The calculated RMSE is 180 kN, MAE is 150 kN, and MAPE is 0.022. It can be seen that this proposed formula has high accuracy under the commonly used cross-section and can well reflect the variation in the cross-section strength of DCP-SCFSTs with the influence parameters.

5.2. Stability Bearing Capacity of Slender DCP-SCFSTs

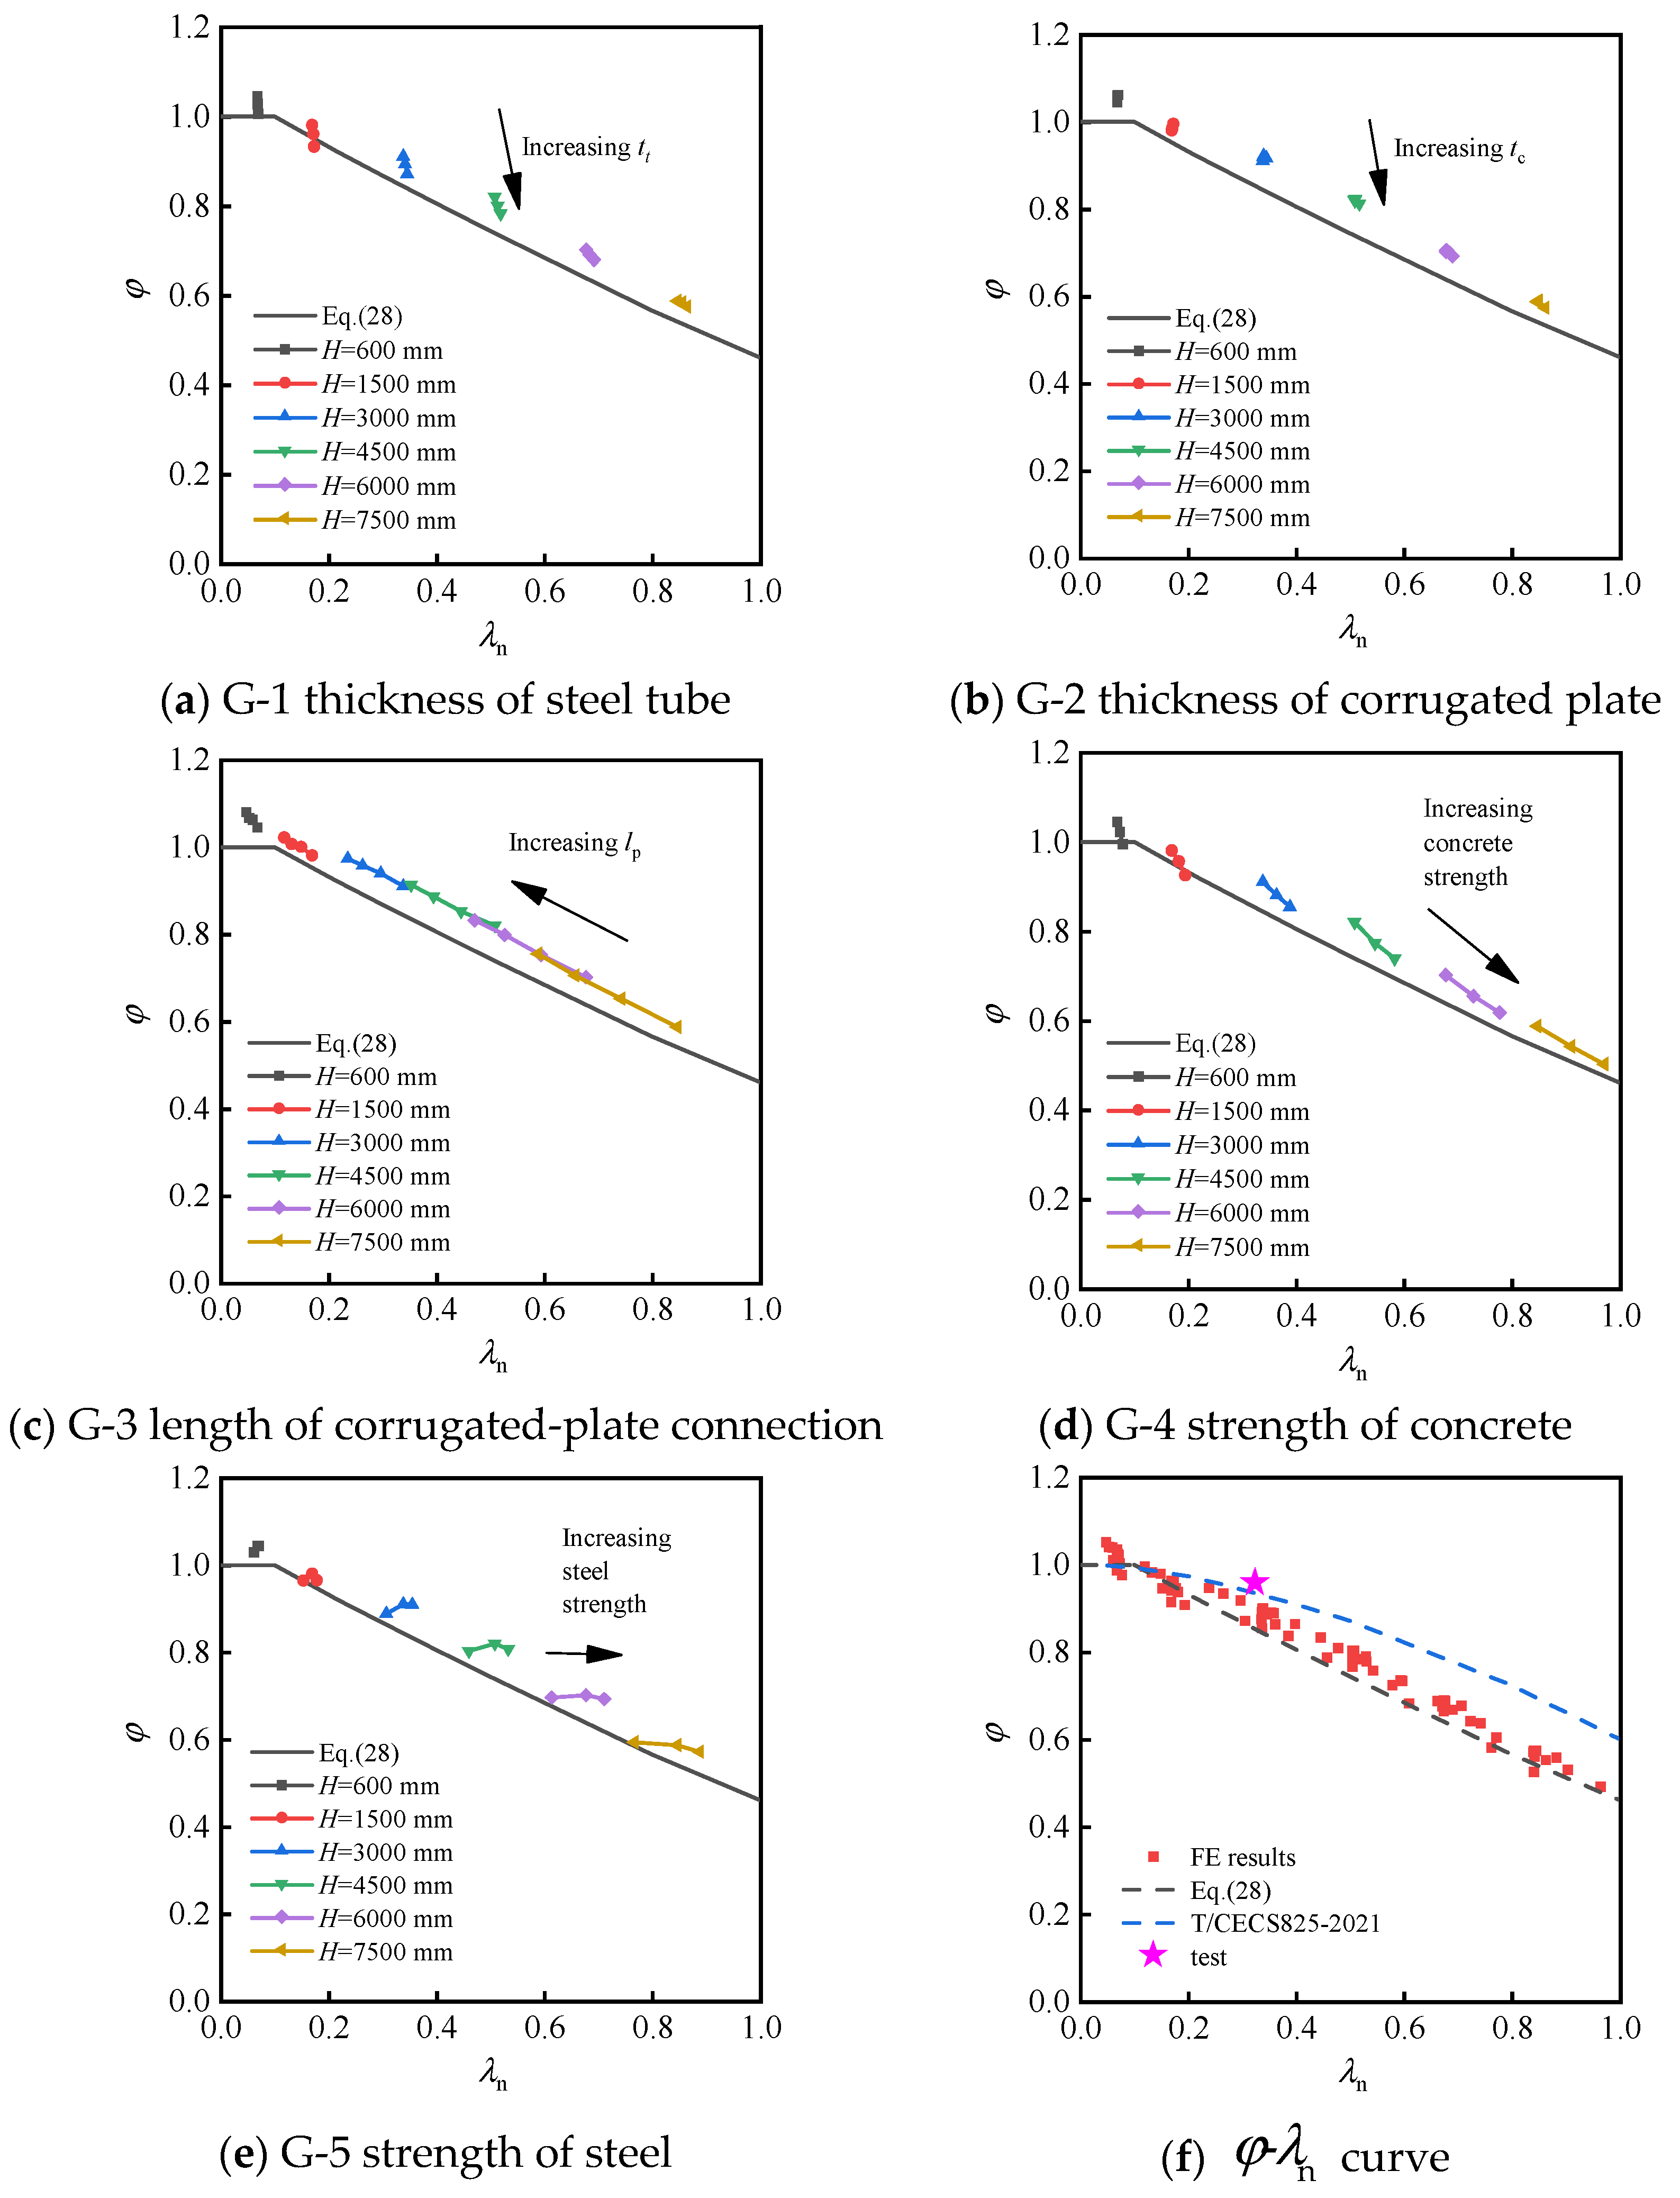
The overall stability of a slender column can significantly affect its ultimate load capacity. Generally, the ultimate bearing-carrying capacity of slender columns N u is determined by multiplying the fully cross-sectional yielding strength N y by a stability factor φ , as defined in Equation (19). The stability factor φ is related to the relative slenderness ratio λ n (or normalized slenderness ratio), as shown in Equations (20) and (21). λ n reflects the relative magnitude relationship between the yield load of the full section N y and the elastic buckling load N cr . The DCP-CFST proposed in this paper differs significantly from a traditional CFST in terms of its structural form and mechanical performance. Therefore, the calculations for the axial-compression bearing capacity and stability coefficient in the above codes are not applicable to DCP-SCFSTs. Based on existing test results in references [19,20,21,22], it has been observed that the corrugated plate does not bear significant axial forces, and its contribution to the structural bearing capacity can be neglected. Consequently, the axial-compression load capacity of DCP-SCFSTs can be considered as a combination of CSFTs and the corrugated plate filled with concrete. For the design formula of the φ, the form of EN3 [43] is adopted. α and β are parameters to be determined and obtained from the φ - λ n data point envelope, as shown in Equations (22) and (23).
φ = N u N y
λ n = N y N cr
N cr = π 2 E I H 2
φ = 1 ϕ + ϕ 2 λ n 2
ϕ = 0.5 1 + α ( λ n β ) + λ n 2
Subsequently, the φ - λ n data points will be obtained through a large number of numerical analyses. The influence of the main parameters on the bearing capacity of DCP-SCFSTs is analyzed, such as material strength, steel thickness, height, and width. Finally, a calculation formula for the stable bearing capacity of DCP-SCFSTs will be presented, which can provide theoretical support for the design of the structure.
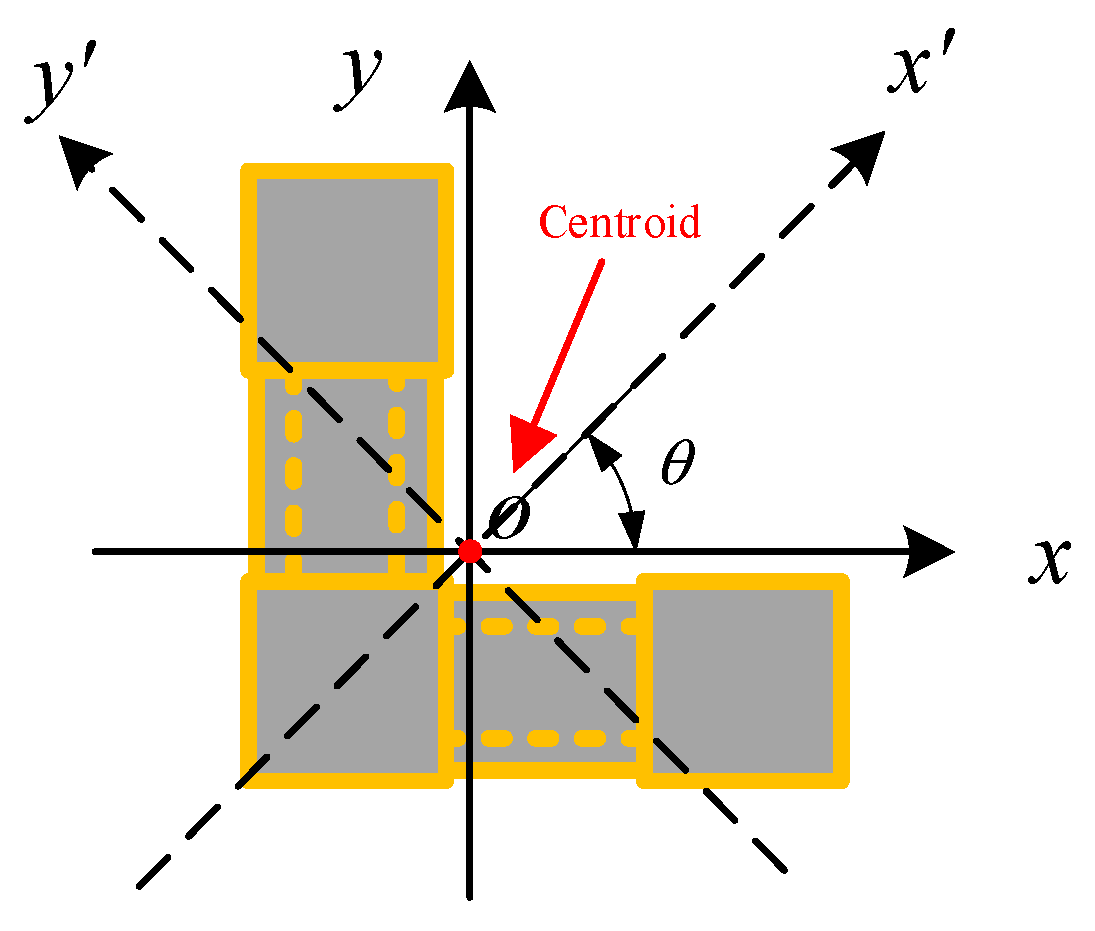
Slender columns are subject to stability effects, and their damage can occur earlier than full-section yielding. Consequently, it is necessary to investigate the stable bearing capacity of DCP-SCFSTs to obtain the relationship curve between the axial compressive stability factor φ and the normalized slenderness ratio λ n . The Euler load of the DCP-SCFSTs is first calculated theoretically, assuming that the structure satisfies the assumption of plane section. Figure 25 illustrates the L-shaped cross-section of a DCP-SCFST, with its moment of inertia evaluated along the x and y axes in xy coordinates. The x’ and y’ represent the strong and weak axes of the cross-section. The moment of inertia after rotation by an angle θ can be determined using Equation (24). Accordingly, the flexural stiffness of the section along the x’ axis can be calculated by Equation (25). Since the cross-section comprises steel and concrete, the flexural stiffness of the cross-section satisfies the principle of superposition, as indicated in Equation (25). Thus, the flexural stiffness of the section in x’ axis can be calculated using Equation (26). By substituting Equation (26) into Euler’s formula, Equation (21), the elastic buckling load Ncr of a DCP-SCFST is obtained.
I x = I x + I y 2 I x I y 2 cos 2 θ I xy sin 2 θ
E I x = E s I sx + E c I cx E I y = E s I sy + E c I cy E I xy = E s I sxy + E c I cxy
E I x = E I x + E I y 2 E I x E I y 2 2 + E I xy 2
Based on the above-obtained finite element results with the calculated elastic buckling loads, the values of the parameters to be determined in Equations (22) and (23) can be fitted, and the axial-compressive-stability factor φ for the DCP-SCFSTs can be expressed by Equations (27) and (28).
φ = 1 0 λ n 0.1 1 ϕ + ϕ 2 λ n 2 0.1 < λ n
ϕ = 0.5 1 + 0.7 ( λ n 0.1 ) + λ n 2
As depicted in Figure 26, the data points are primarily positioned above the curve of Equation (27), indicating that the fitted curve exhibits a certain degree of safety redundancy. The stability of the DCP-SCFST structure is considerably influenced by its height, whereby a substantial increase in height leads to a significant reduction in the stability factor φ . Furthermore, augmenting the thickness of both the steel tube and corrugated plate slightly decreases φ . On the other hand, elongating the connection length of the corrugated plate results in a significant increase in the stability factor φ , with the enhancement effect becoming more apparent as the height increases. The stability factor φ is negatively affected by an increase in concrete strength, while the strength of steel exhibits no significant impact on φ despite increasing the normalized slenderness ratio λ n .

6. Conclusions

This study investigates the behavior of a novel L-shaped DCP-SCFST column under axial-compressive load through experimental and parametric finite element analyses. The research findings can be summarized as follows:
(1)
The DCP-SCFST column exhibits superior load-bearing capacity and ductility, with a strength index of 1.14 and a ductility index of 2.40. The corrugated steel plate enhances the confinement effect on the core concrete, outperforming conventional flat-connected steel plates. Corrugated plates do not directly share axial loads, but provide indirect lateral confinement to concrete through their corrugated cavities. This effect is stronger than that of flat plates, as the wavy protrusions more effectively suppress the lateral expansion of concrete. This mechanism confirms that the core advantage of corrugated plates lies in enhancing concrete performance through confinement, rather than directly sharing axial loads.
(2)
Column height is the most critical parameter affecting the bearing capacity of slender columns. The thickness of the steel tube, length of the corrugated plate, and material strength affect the section-bearing capacity of short columns. Increasing the corrugated-plate thickness enhances load capacity, while wave-length and wave-height of corrugated plate variations have minimal impact. Wave-height reduces bearing capacity with increasing value due to reduced effective cross-sectional area of core concrete in corrugated cavities; wave-length has no significant impact on bearing capacity.
(3)
Addressing the inability of existing codes (e.g., GB50936, EC4) to accurately predict the bearing capacity of DCP-SCFSTs, a section strength formula is derived based on unified theory, considering the confinement effect of corrugated steel plates on the core concrete. The calculated values from this formula show high consistency with finite element results. Additionally, the φ - λ n relationship curve between the overall stability coefficient and the regular slenderness ratio is fitted. This provides direct theoretical support for the engineering application of DCP-SCFST structures.

Author Contributions

Conceptualization, Y.Y.; methodology, Y.Y.; software, Y.Y.; validation, Y.Y. and F.K.; resources, Y.Y.; data curation, F.K.; writing—original draft preparation, Y.Y.; writing—review and editing, Y.Y.; visualization, F.K.; supervision, Z.M.; funding acquisition, Y.Y. All authors have read and agreed to the published version of the manuscript.

Funding

This research was funded by the Fundamental Research Funds for the Central Universities (Grant No. FRF-TP-22-117A1), the Key Laboratory of Urban Security and Disaster Engineering of the Ministry of Education (Grant No. 2024B07).

Data Availability Statement

Data available on request from the authors.

Conflicts of Interest

The authors declare no conflicts of interest.

Appendix A

Table A1. The descriptions of the relevant parameters.
Notation
N u overall stability capacity of column H height of column
N y load of fully cross-sectional yielding l t cross-sectional width of steel tube
N cr elastic buckling load of column l p length of connection plate between tube
N u , cor ultimate strength of core concrete in corrugated plate t t thickness of steel tube
N y , cor cross-sectional yielding load of core concrete in corrugate plate t c thickness of corrugated plate
f y steel yield strength d length of corrugated plate connection
f c u cube strength of concrete a w wave-height of corrugated plate
f ck characteristic   compressive   strength   of   concrete ,   f ck = 0.67 f c u q 1 - q 2 - q 3 wave-length of corrugated plate
f c cylinder   compressive   strength   of   concrete ,   f c = 0.8 f c u E s modulus of elasticity of steel
f s c y equivalent yield strength of composite steel tube and concrete E c elastic modulus of concrete
A s cross-sectional area of steel S I strength index
A c cross-sectional area of concrete D I ductility index
A c , tube cross-sectional area of concrete-filled steel tube S I c o r strength index for core concrete in corrugated plate
A c , cor cross-sectional area of concrete-filled corrugated steel E I flexural stiffness
ξ confinement factor of core concrete φ stability factor
ξ c o r confinement factor of core concrete in corrugated plate λ n normalized slenderness ratio

References

  1. Zhou, Z.; Gan, D.; Denavit, M.D.; Zhou, X. Seismic performance of square concrete-filled steel tubular columns with diagonal binding ribs. J. Constr. Steel Res. 2022, 189, 107074. [Google Scholar] [CrossRef] [Scilit]
  2. Haidar, A.; Jawdhari, A.; Fam, A. Axial compressive strength of slender UHPFRC-filled steel tubes. Eng. Struct. 2023, 285, 116073. [Google Scholar] [CrossRef] [Scilit]
  3. Wang, H.; Jiang, Q.; Huang, J.; Chong, X.; Xuan, D.; Huang, Z. Axial compression performance of multi-cell concrete filled steel tubular flat columns. J. Build. Eng. 2023, 72, 106637. [Google Scholar] [CrossRef] [Scilit]
  4. Hu, C.; Wang, Y.; Cheng, R.; Luo, J.; Gong, M. Confinement effect and stress-strain model for concrete of multi-cell CFST column under axial compression. J. Constr. Steel Res. 2024, 221, 108865. [Google Scholar] [CrossRef] [Scilit]
  5. Hu, C.; Wang, Y.; Cheng, R.; Luo, J.; Gong, M. Design of improved multi-cell L-shaped CFST columns under compression and bending. Structures 2024, 68, 107194. [Google Scholar] [CrossRef] [Scilit]
  6. Lei, M.; Li, Y.; Li, Y.; Zhang, J.; Liu, D. Behavior of concrete-filled T-shaped steel tubular beam-columns under biaxial compressive loads. Eng. Struct. 2023, 277, 115409. [Google Scholar] [CrossRef] [Scilit]
  7. Li, H.; Tong, Y.; Yin, J.; Zhang, H.; Yan, C. Study on axial compression behavior of cross-shaped and L-shaped multi-cavity concrete-filled steel tube special shaped column. Int. J. Steel Struct. 2021, 22, 153–175. [Google Scholar] [CrossRef] [Scilit]
  8. Liu, X.; Xu, C.; Liu, J.; Yang, Y. Research on special-shaped concrete-filled steel tubular columns under axial compression. J. Constr. Steel Res. 2018, 147, 203–223. [Google Scholar] [CrossRef] [Scilit]
  9. Liu, W.; Guo, Y.; Tian, Z.; Yang, X. Overall stability capacity design of T-shaped irregularly concrete-filled steel tube columns considering axial compression and any directional moments. J. Build. Eng. 2023, 70, 106317. [Google Scholar] [CrossRef] [Scilit]
  10. Wang, Y.; Guo, L.; Li, H. L-shaped steel-concrete composite columns under axial load: Experiment, simulations and design method. J. Constr. Steel Res. 2021, 185, 106871. [Google Scholar] [CrossRef] [Scilit]
  11. Zheng, Y.; Liang, W.; Ma, S.; Zeng, S. Behavior of stiffened and multi-cell L-shaped CFST columns under eccentric compression. Thin-Walled Struct. 2022, 174, 109156. [Google Scholar] [CrossRef] [Scilit]
  12. Zheng, Y.; Zeng, S. Design of L-shaped and T-shaped concrete-filled steel tubular stub columns under axial compression. Eng. Struct. 2020, 207, 110262. [Google Scholar] [CrossRef] [Scilit]
  13. Amer, M.; Chen, Z.; Du, Y.; Mashrah, W.; Zhang, W. Experimental and numerical investigations on cyclic performance of L-shaped-CFT column frame-buckling restrained and unrestrained steel plate shear walls with partial double-side/four corner connections. J. Build. Eng. 2023, 78, 107568. [Google Scholar] [CrossRef] [Scilit]
  14. Chen, Z.; Amer, M.; Du, Y.; Mashrah, W.; Zhao, B.; Huang, J. Experimental and numerical study on seismic performance of square and l-shaped Concrete-filled steel tubes column Frame-Buckling steel plate shear walls. Eng. Struct. 2023, 274, 115155. [Google Scholar] [CrossRef] [Scilit]
  15. Du, Y.; Amer, M.; Chen, Z.; Al-Haaj, M.; Huang, J. Seismic behaviors of CFT-column frame-four-corner bolted connected buckling-restrained steel plate shear walls using ALC/RAC panels. Thin-Walled Struct. 2024, 195, 111365. [Google Scholar] [CrossRef] [Scilit]
  16. Liu, X.; Liu, J.; Yang, Y.; Cheng, G.; Lanning, J. Resistance of special-shaped concrete-filled steel tube columns under compression and bending. J. Constr. Steel Res. 2020, 169, 106038. [Google Scholar] [CrossRef] [Scilit]
  17. Wang, Y.; Bi, C.; Jiao, Z.; Zhang, Z.; Li, G. Experimental study on local stability of special-shaped HSS columns with single-corrugation. J. Constr. Steel Res. 2023, 201, 107726. [Google Scholar] [CrossRef] [Scilit]
  18. Nassirnia, M.; Heidarpour, A.; Zhao, X.; Minkkinen, J. Innovative hollow columns comprising corrugated plates and ultra high-strength steel tubes. Thin-Walled Struct. 2016, 101, 14–25. [Google Scholar] [CrossRef] [Scilit]
  19. Sun, Z.; Zou, Y.; Wang, C.; Pan, J.; Wang, L.; Chen, M. Axial compressive behavior and load-bearing capacity of steel tubular-corrugated steel plate confined concrete composite columns. Structures 2022, 44, 135–151. [Google Scholar] [CrossRef] [Scilit]
  20. Sun, Z.; Zou, Y.; Wang, C.; Pan, J.; Wang, L.; Chen, M. Study on confinement mechanism of core concrete in steel tubular-corrugated steel plate confined concrete columns. J. Build. Eng. 2022, 52, 104497. [Google Scholar] [CrossRef] [Scilit]
  21. Zou, Y.; Wang, L.; Sun, Z.; Pan, J.; Chen, M.; Wu, Y. Experimental and numerical studies of concrete-filled corrugated steel tubular column under axial compression. Eng. Struct. 2023, 276, 114813. [Google Scholar] [CrossRef] [Scilit]
  22. Tong, J.; Yu, C.; Tong, G.; Chen, M.; Zhang, L. Stability behavior of multi-celled corrugated-plate concrete filled steel tubular walls. J. Build. Struct. 2023, 44, 240–251. (In Chinese) [Google Scholar]
  23. Wang, M.; Guo, Y.; Yang, X.; Zhu, J. Interaction equations of composite walls with T-section under axial compression and biaxial bending. Eng. Struct. 2021, 229, 111667. [Google Scholar] [CrossRef] [Scilit]
  24. Zhu, J.; Guo, Y.; Wang, M.; Yang, X.; Zhu, B. Strength design of concrete-infilled double steel corrugated-plate walls under uniform compressions. Thin-Walled Struct. 2019, 141, 153–174. [Google Scholar] [CrossRef] [Scilit]
  25. GB/T228.1-2010; Metallic Materials-Tensile Testing—Part 1: Method of Test at Room Temperature. Standards Press of China: Beijing, China, 2010.
  26. JGJ/T 101-2015; Specification for Seismic Test of Buildings. China Architecture & Building Press: Beijing, China, 2015.
  27. Mu, Z.; Yang, Y. Experimental and numerical study on seismic behavior of obliquely stiffened steel plate shear walls with openings. Thin-Walled Struct. 2020, 146, 106457. [Google Scholar] [CrossRef] [Scilit]
  28. ABAQUS. Analysis User’s Manual IV, Version 6.10; ABAQUS, Inc., Dassault Systèmes: Waltham, MA, USA, 2010.
  29. Chen, C.; Ko, J.; Huang, G.; Chang, Y. Local buckling and concrete confinement of concrete-filled box columns under axial load. J. Constr. Steel Res. 2012, 78, 8–21. [Google Scholar] [CrossRef] [Scilit]
  30. GB 50017-2017; Standard for Design of Steel Structures. China Architecture and Building Press: Beijing, China, 2017.
  31. Han, L.; Yao, G.; Tao, Z. Performance of concrete-filled thin-walled steel tubes under pure torsion. Thin-Walled Struct. 2007, 45, 24–36. [Google Scholar] [CrossRef] [Scilit]
  32. Tong, J.; Yu, C.; Zhang, L. Sectional strength and design of double-skin composite walls with re-entrant profiled faceplates. Thin-Walled Struct. 2021, 158, 107196. [Google Scholar] [CrossRef] [Scilit]
  33. Duarte, A.P.C.; Silva, B.A.; Silvestre, N.; de Brito, J.; Júlio, E.; Castro, J. Finite element modelling of short steel tubes filled with rubberized concrete. Compos. Struct. 2016, 150, 28–40. [Google Scholar] [CrossRef] [Scilit]
  34. Chen, Z.; Liu, J.; Zhou, T.; Yan, X.; Zhang, X. Uniaxial eccentric-compression performance analysis for double-plate connected concrete-filled steel-tube composite columns. J. Struct. Eng. 2020, 146, 04020161. [Google Scholar] [CrossRef] [Scilit]
  35. Wang, Z.; Tao, Z.; Han, L.; Uy, B.; Lam, D.; Kang, W. Strength, stiffness and ductility of concrete-filled steel columns under axial compression. Eng. Struct. 2017, 135, 209–221. [Google Scholar] [CrossRef] [Scilit]
  36. GB 50936-2014; Technical Code for Concrete Filled Steel Tubular Structures. China Architecture and Building Press: Beijing, China, 2014.
  37. CECS 159:2004; Technical Specification for Structures with Concrete-Filled Rectangular Steel Tube Members. China Plan Press: Beijing, China, 2004.
  38. T/CECS825-2021; Technical Specification for Special-Shaped Column Structure Composed of Concrete-Filled Rectangular Steel Tubes. China Architecture and Building Press: Beijing, China, 2021.
  39. EN1994-1-1; Eurocode 4: Design of Composite Steel and Concrete Structures-Part 1-1: General Rules and Rules for Buildings. European Committee for Standardization: Brussels, Belgium, 2004.
  40. AISC 360-16; Specification for Structural Steel Buildings. American Institute of Steel Construction (AISC): Chicago, IL, USA, 2016.
  41. AS-5100.6; Bridge Design Part 6: Steel and Composite Construction. Standards Australia: Sydney, Australia, 2004.
  42. Han, L.H. Concrete Filled Steel Tubular Structures—Theory and Practice, 3rd ed.; Science Press: Beijing, China, 2016. [Google Scholar]
  43. EN1993-1-1; Eurocode 3: Design of Steel Structures-Part 1-1: General Rules and Rules for Buildings. European Committee for Standardization: Brussels, Belgium, 2005.
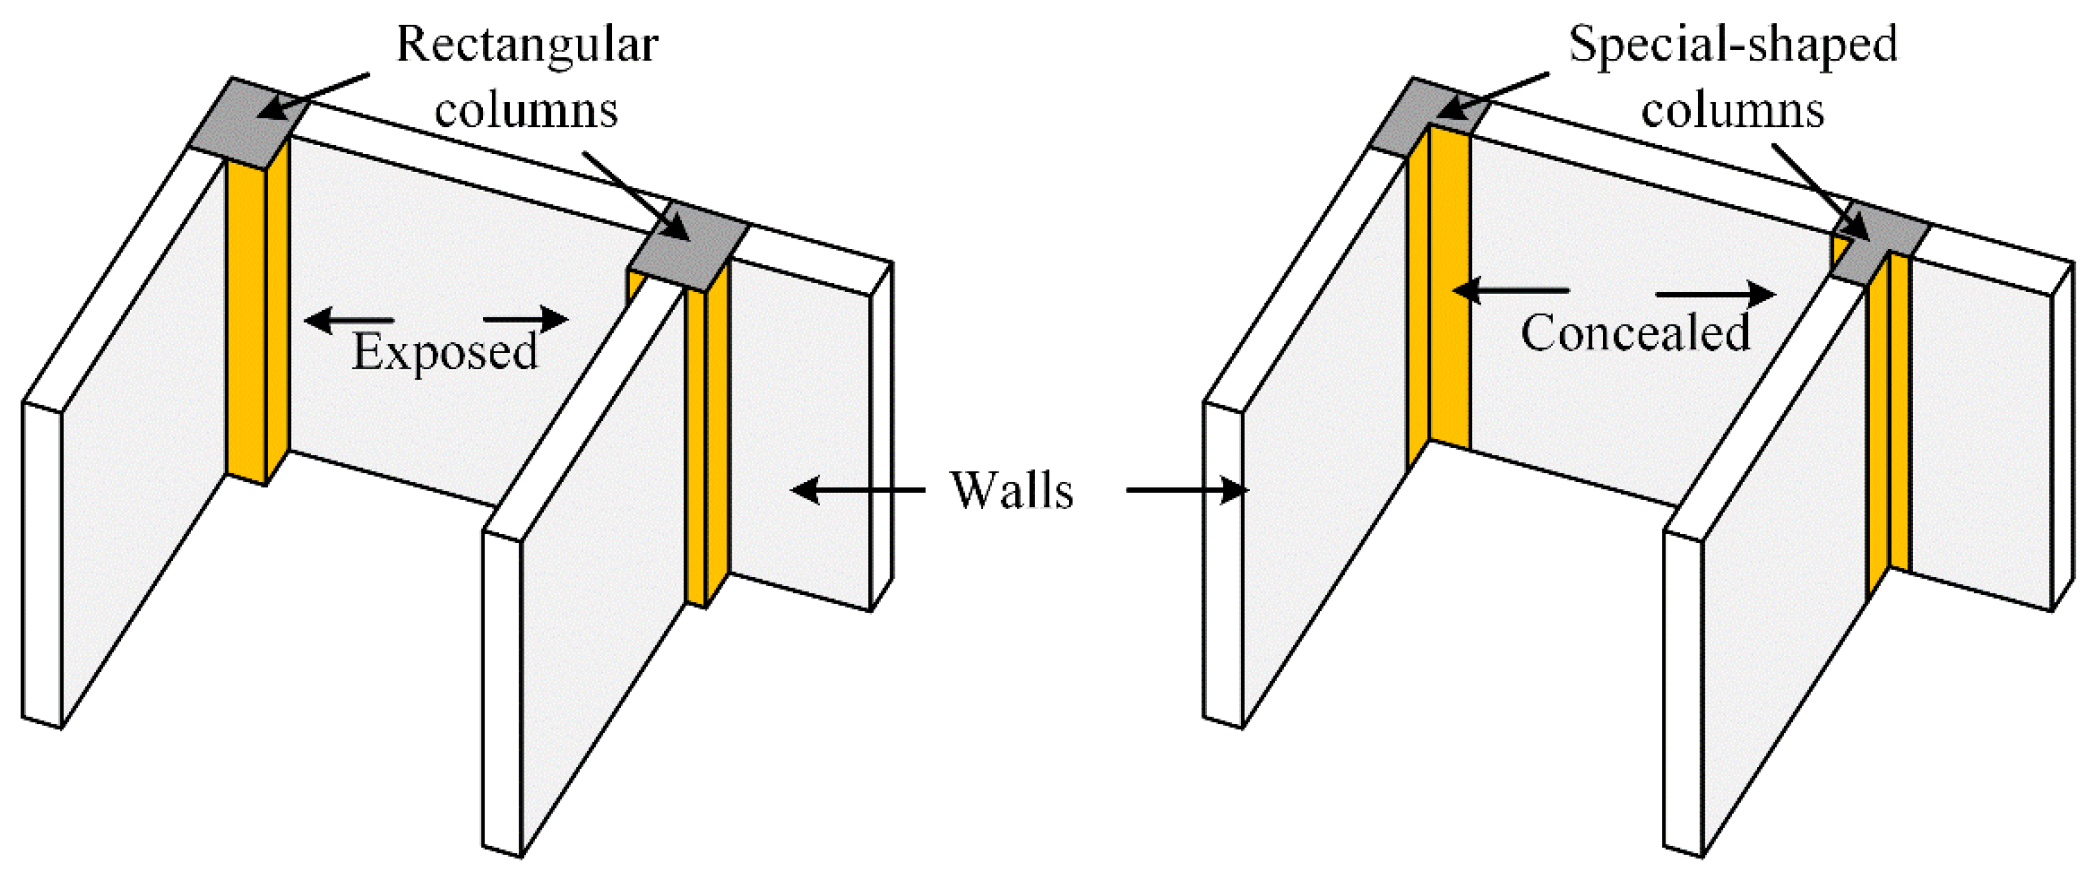
Figure 1. Rectangular columns compared to special-shaped columns.
Buildings 16 00379 g001
Figure 2. Details of DCP-SCFST (unit: mm).
Buildings 16 00379 g002
Figure 3. Loading devices.
Buildings 16 00379 g003
Figure 4. Arrangement of LVDT and strain gauges.
Buildings 16 00379 g004
Figure 5. Failure mode of DCP-SCFST.
Buildings 16 00379 g005
Figure 6. Load–displacement curve of DCP-SCFST test.
Buildings 16 00379 g006
Figure 7. Lateral deformation of the specimen.
Buildings 16 00379 g007
Figure 8. Load–strain curves of steel tubes.
Buildings 16 00379 g008
Figure 9. Strain of corrugated steel plate in longitudinal direction.
Buildings 16 00379 g009
Figure 10. Mesh and buckle mode of DCP-SCFST.
Buildings 16 00379 g010
Figure 11. Constitutive relationship of steel and concrete.
Buildings 16 00379 g011
Figure 12. Comparison of load–displacement curve between test and numerical results.
Buildings 16 00379 g012
Figure 13. Comparison of failure mode between test and numerical results.
Buildings 16 00379 g013
Figure 14. The load–displacement curves from experimental measurements and finite element analysis.
Buildings 16 00379 g014
Figure 15. Effect of material strength on load–displacement curves.
Buildings 16 00379 g015
Figure 16. Effect of thickness of steel plate on load–displacement curves.
Buildings 16 00379 g016
Figure 17. Effect of corrugated-plate thickness on bearing capacity.
Buildings 16 00379 g017
Figure 18. Effect of length of corrugated-plate connection on load–displacement curves.
Buildings 16 00379 g018
Figure 19. Effect of wave-height of corrugated plate on load–displacement curves.
Buildings 16 00379 g019
Figure 20. Effect of wave-length of corrugated plate on load–displacement curves.
Buildings 16 00379 g020
Figure 21. Effect of height of column on load–displacement curves.
Buildings 16 00379 g021
Figure 22. Comparison of formula calculation results with finite element simulation results [35,36,37,38,39,40,41].
Buildings 16 00379 g022
Figure 23. Strength index for concrete-filled corrugated plate of DCP-SCFST.
Buildings 16 00379 g023
Figure 24. Comparison of the new calculation method with finite element results.
Buildings 16 00379 g024
Figure 25. Cross-section of DCP-SCFST.
Buildings 16 00379 g025
Figure 26. Effect parameters on the φ - λ n of DCP-SCFST.
Buildings 16 00379 g026
Table 1. Mechanical properties of steel and concrete.
NameMaterialThickness/mm f y /MPa f u /MPa E /MPa ε /%
TubeQ3553.94382512194,0000.28
Corrugated plateQ3553.89393536203,0000.24
ConcreteC30 f cu = 35.1 MPa
Table 2. Bearing capacity and displacement of the specimen.
N y /kN Δ y /mm N u /kN Δ u /mm 0.85 N u /kN Δ 0.85 /mm S I D I
52676.6657979.144927161.142.40
Table 3. Specific dimensions of test specimens.
Test SpecimenHeight/mmTube Width × Thickness/mmConnection Plate Length × Thickness/mmConnection Plate Type N Test /kN N FE /kN N Test N FE
TW1-1 3000150 × 150 × 4300 × 1.5Corrugated plate422040011.05
TW1-2 3000150 × 150 × 4300 × 1.5Corrugated plate420440011.05
LSJ1Y + 0 2000100 × 100 × 6100 × 6.0Flat plate417841101.02
Table 4. Parameters of numerical models of DCP-SCFSTs.
No. H /mm l t /mm t t /mm l p /mm t c /mm a w /mm q 1 - q 2 - q 3 /mm f cu /MPa f y /MPa K 0 N u SIDI
/kN·mm−1 /% /kN /%
Prototype3000150415012550-25-50303551354100.004484100.001.002.11
G-1-13000150515012550-25-50303551473108.795087113.451.002.21
G-1-23000150615012550-25-50303551593117.655665126.341.002.34
G-2-1300015041501.52550-25-50303551359100.374564101.781.022.19
G-2-23000150415022550-25-50303551364100.744624103.121.032.20
G-2-33000150415042550-25-50303551381101.994838107.891.082.64
G-3-13000150420012550-25-50303551433105.834811107.291.032.13
G-3-23000150425012550-25-50303551510111.525106113.871.042.08
G-3-33000150430012550-25-50303551591117.505397120.361.062.11
G-4-13000150415012550-25-50403551462107.985015111.840.982.01
G-4-23000150415012550-25-50503551537113.525536123.460.951.87
G-5-13000150415012550-25-50302351388102.51359680.200.992.52
G-5-23000150415012550-25-5030420134299.114932109.991.002.00
G-6-13000150415011550-25-50303551624119.944550101.471.002.18
G-6-23000150415013550-25-5030355130696.45433896.740.982.21
G-7-13000150415012575-37.5-75303551373101.40439197.930.982.06
G-7-230001504150125100-50-100303551601118.24442298.620.992.21
G-7-330001504150125150-75-150303551402103.55434796.940.972.20
Table 5. Ultimate section strength of CFST under compression load in different codes.
Code or Scholars ProposedFormulaNo.
CECS159 [37] and T/CECS825 [38] N y = f y A s + f ck A c (9)
AISC360-16 [40] N y , AISC360 = f y A s + 0.85 f c A c (10)
EC4 [39] N y , EC4 = f y A s + f c A c (11)
AS-5100.6 [41] N y , AS5100 = 0 . 9 f y A s + 0.6 f c A c (12)
Wang et al. [35] N y , Han = ( A s + A c ) f scy f scy = ( 1.18 + 0.85 ξ ) f ck      0.2 ξ 5 (13)
GB50936-2014 [36] N y , G B 50936 = ( A s + A c ) f sc f sc = ( 1.212 + B ξ + C ξ 2 ) f ck B = 0.131 f y / 213 + 0.723 C = 0.070 f ck / 14.4 + 0.026 (14)
Table 6. Comparison of Ny results of DCP-SCFSTs predicted by different codes.
Code or Scholars ProposedRMSE (kN)MAE (kN)MAPE
CECS159 [37]/CECS825 [38]110110690.152
AISC360-16 [40]105110180.144
EC4 [39]5434690.066
AS-5100.6 [41]226422290.316
Wang et al. [35]8177290.104
GB50936-2014 [36]5564470.065
Disclaimer/Publisher’s Note: The statements, opinions and data contained in all publications are solely those of the individual author(s) and contributor(s) and not of MDPI and/or the editor(s). MDPI and/or the editor(s) disclaim responsibility for any injury to people or property resulting from any ideas, methods, instructions or products referred to in the content.