Article

Influence of Fiber Content on the Self-Healing Behavior of Engineered Cementitious Composites

by
Ioan Ștefan Zavaschi
1,2,3,*,
Tudor Panfil Toader
3 and
Călin Grigore Radu Mircea
1,2
1
Faculty of Civil Engineering, Technical University of Cluj-Napoca, 15 Constantin Daicoviciu, 400020 Cluj-Napoca, Romania
2
European University of Technology (Eut+), European Union, 400020 Cluj-Napoca, Romania
3
NIRD URBAN-INCERC, Cluj-Napoca Branch, 117 Calea Florești, 400524 Cluj-Napoca, Romania
*
Author to whom correspondence should be addressed.
Buildings 2026, 16(17), 3375; https://doi.org/10.3390/buildings16173375
Submission received: 16 June 2026 / Revised: 20 August 2026 / Accepted: 21 August 2026 / Published: 24 August 2026
(This article belongs to the Special Issue Research on Sustainable and High-Performance Cement-Based Materials)

Abstract

This study investigated the self-healing behavior of Engineered Cementitious Composites (ECCs), with a focus on the influence of fiber content. ECC mixtures have shown a distinctive response under tensile loading, particularly their high tensile strain capacity, which leads to the formation of microcracks and the redistribution of stress. Three-point bending tests (at 80–90% of the maximum load) were performed to induce controlled cracking in beam specimens, followed by weekly wet–dry curing. Crack closure was monitored at the specimen surface using microscopic image acquisition and within the specimens by means of ultrasonic monitoring. The results indicated that higher fiber dosage generally promoted microcracking and reduced crack widths, thereby creating favorable conditions for self-healing. Specimens with crack widths not exceeding 0.10 mm exhibited complete or nearly complete crack closure after approximately 60 days of weekly wet–dry curing, whereas specimens with wider cracks showed only partial healing. These findings highlight the beneficial role of fibers in controlling crack development, limiting crack widths, and providing favorable sites for the formation of apparent healing products, thereby enhancing the self-healing capacity of ECCs.

1. Introduction

Modern structures increasingly push the limits of construction technology and available materials while striving to minimize costs, thereby influencing durability, longevity, and in many cases, the safety of constructed assets. Crack formation is among the most influential factors governing the durability of concrete structures and can occur at any stage of a structure’s lifespan due to various factors, such as loading conditions, dynamic effects (e.g., earthquakes, wind or explosions), volumetric changes, foundation settlements and freeze–thaw cycles [1]. Once cracking occurs, chemically aggressive liquids or gases may penetrate the material, resulting in concrete deterioration and reinforcement corrosion, potentially leading to catastrophic failures [2]. Self-healing of concrete, also referred to as autogenous healing, has been investigated in numerous studies and has been shown to increase the service life of structures by positively affecting durability, permeability, and in some cases, mechanical properties [3,4,5]. However, given the brittle nature of conventional concrete, the difficulty of controlling crack formation using traditional reinforcement and the strong dependence of autogenous crack closure effectiveness on crack width, achieving consistent self-healing behavior in plain or reinforced concrete used in common structures remains challenging. To overcome the inherent drawbacks of plain or reinforced concrete, Engineered Cementitious Composites (ECCs) were developed. ECCs incorporate fiber reinforcement (≤2 vol.%) to achieve superior tensile strain capacity (exceeding 3%) while maintaining comparable or superior mechanical properties [6]. Under loading, ECCs exhibit a distinctive microcracking behavior, characterized by the formation of multiple fine cracks and stress redistribution. As a result, self-healing conditions in ECCs are more favorable due to the reduced crack widths, typically limited to ≤60 µm [7,8]. In recent years, numerous studies have investigated the self-healing behavior of ECCs, concluding that narrow crack widths promote the precipitation of healing products, such as calcium carbonate and continued hydration products, leading to improved crack closure and durability performance [9]. Emerging research has also explored the incorporation of sustainable supplementary materials, such as fly ash or biochar, into ECC mixtures to enhance mechanical performance, internal curing characteristics, and long-term durability, while reducing environmental impacts [9,10]. Most existing studies have focused on ECC mixtures containing a fixed fiber volume fraction, commonly around 2% of polyvinyl alcohol (PVA) fibers, whereas the direct influence of fiber dosage on crack formation and self-healing efficiency has received comparatively limited attention [11].
In this context, the present study provides a systematic investigation of ECC mixtures incorporating fibers at dosages ranging from 1.0% to 3.5% of the cement mass, with particular emphasis on the relationships between fiber content, crack-width control, and autogenous healing performance.

2. Materials and Methods

The experimental program included the preparation of six ECC mixtures incorporating PVA fibers at dosages of 1.0%, 1.5%, 2.0%, 2.5%, 3.0% and 3.5% of the cement mass, followed by bending and compression testing, controlled crack initiation using three-point bending, and a self-healing stage during which crack evolution was monitored using microscopic image acquisition and ultrasonic measurements. The investigated mixtures were designed in accordance with the established ECC mix-design principles [6,7], incorporating PVA fibers and a tailored cementitious matrix intended to promote ductile behavior. However, as the scope of the present study did not include direct uniaxial tensile testing, the classification of the investigated specimens as ECCs is based on the adopted mixture design and constituent materials, rather than on experimentally verified tensile strain-hardening behavior.

2.1. Raw Materials and Their Properties

For the preparation of the ECC specimens, the mixtures consisted of ordinary Portland cement (CEM II 42.5 R) (PC) (Holcim România S.A., Bucharest, Romania), locally sourced Class F fly ash (FA) (Holcim România S.A., Bucharest, Romania), finely ground marble powder (MP), river sand (0–4 mm), the admixture MasterLife WP 1000 (ML1000) (Master Builders Solutions România S.R.L., Ploiești, Romania), water, PVA fibers, and a polycarboxylate-based high-range water-reducing admixture (HRWR). Marble powder, consisting of finely ground calcium carbonate (CaCO3) with a mean particle size of approximately 5 μm and a purity of 99% CaCO3, served as a microfiller to enhance particle packing and matrix densification. The PVA fibers, manufactured by KURARAY Europe GmbH (Hattersheim am Main, Germany), had a diameter of 39 μm, a length of 8 mm, a density of 1.3 g/cm3, and a tensile strength of 1600 MPa. MasterLife WP 1000 is a powdered crystalline waterproofing admixture composed of Portland cement, fine fillers, and proprietary active chemicals. In the presence of water, these active components react to form insoluble crystals within the concrete matrix, sealing capillary pores and microcracks, thereby reducing permeability, enhancing durability, and potentially promoting autogenous self-healing.

2.2. Mixture Proportions, Preparation and Casting of Test Specimens

The mix proportions are summarized in Table 1. The water-to-binder ratio (W/B), calculated based on the combined mass of PC, FA, MP and ML1000, was maintained at 0.30, while the FA replacement level was 100% of the PC mass. An HRWR was used to achieve the required flowability of the ECC mixtures.
The ECC mixtures were mixed using a standard laboratory mixer. The mixing sequence consisted of 30 s of dry mixing of the solid components, followed by the addition of the fibers and a further 30 s of mixing. Subsequently, water and the HRWR were added, and mixing continued for 3 min, followed by a 30 s pause and a final 3 min mixing phase to ensure homogeneity.
The flowability of the fresh ECC mixtures was evaluated using the flow table test in accordance with EN 1015-3. A truncated cone mold with a top diameter of 70 mm, a bottom diameter of 100 mm, and a height of 60 mm was used. After the mold was filled and lifted, the flow table was subjected to 15 drops, and the flow diameter was determined for each mixture as the average of two perpendicular measurements. The measured flow diameters were 190 mm for mixtures M1 and M2, 180 mm for mixtures M3 and M4, 170 mm for mixture M5, and 160 mm for mixture M6. Mixtures M1–M4 exhibited good flowability, ensuring adequate fiber dispersion and ease of casting, whereas mixtures M5 and M6 showed reduced workability with increasing fiber dosage while remaining castable under the adopted laboratory procedure. After confirming the absence of visible macroscopic fiber balling and segregation, the mixtures were cast into standard 40 × 40 × 160 mm molds for compression and bending tests, as well as for self-healing monitoring. After 24 h, the ECC specimens were demolded and cured by submersion in water for 28 days under laboratory conditions (20 ± 2 °C). Throughout the mixing, casting, and specimen preparation processes, no segregation or visible macroscopic fiber balling was observed, indicating that all mixtures exhibited satisfactory homogeneity despite the increased fiber dosage.

2.3. Controlled Crack Initiation

Mechanical testing was performed at 28 days in accordance with EN 196-1 using a combined bending and compression testing machine manufactured by ELE International. The machine was operated under load control at loading rates of 0.05 kN/s for the three-point bending tests and 2.40 kN/s for the compressive strength tests. Three specimens were prepared and tested for each mixture. Each specimen was first subjected to a three-point bending test to determine the peak flexural load and corresponding flexural strength. The two halves obtained after flexural failure were subsequently tested in compression to determine the compressive strength. In a separate step, three additional specimens from each mixture were subjected to the predetermined precracking load under three-point bending to induce controlled cracking. The applied precracking load corresponded to 80–90% of the mean peak flexural load, as shown in Table 2. The values presented in Table 2 represent the mean values obtained from the tested specimens for each mixture.

2.4. Self-Healing Conditions

The self-healing conditions consisted of weekly wet–dry curing, comprising 8 h of drying and 16 h of water immersion for 5 days, followed by 2 days of continuous water submersion. The specimens were kept under laboratory conditions (20 ± 2 °C) and were not exposed to other environmental factors. Following crack initiation, the specimens were fully unloaded, and the initial crack widths were measured immediately after unloading. The specimens were subsequently subjected to the prescribed weekly wet–dry healing cycles under unrestrained conditions, without the application of external loads or restraints to maintain or modify the crack opening during the healing period. Consequently, the residual crack widths monitored throughout the study represent the crack configuration remaining after unloading and subsequent elastic recovery.

2.5. Monitoring Methods for Self-Healing

In this study, to develop a more comprehensive understanding of the self-healing behavior of ECC specimens, two methods were used to evaluate healing performance: microscopic image acquisition for surface data and ultrasonic pulse testing to assess internal self-healing processes within the specimen structure. Data acquisition was conducted over approximately 60 days to better understand the self-healing process and its evolution over time.

2.5.1. Image Acquisition

During each weekly wet–dry healing cycle, images of crack evolution were acquired using a Leica DMC2900 digital microscope (Leica Microsystems GmbH, Wetzlar, Germany) at varying magnification levels. To ensure consistent monitoring throughout the experimental program, 8–9 overlapping images were acquired along the entire crack length of each specimen during each inspection. Additional images were captured using higher optical magnification to enable detailed observation of crack closure and the formation of apparent surface deposits. Consecutive images were compared side by side to identify and document the same crack segments over time, thereby ensuring consistent image acquisition at identical locations throughout the monitoring period. Image acquisition was performed manually using a camera resolution of 2048 × 1536 pixels. Depending on the crack width and the level of detail required, images were captured at either 2× or 8× optical magnification, corresponding to the 1 mm and 0.25 mm scale bars displayed in the lower right corner of each image, respectively. After image acquisition, measurements were performed using Leica Application Suite software (version 4.11.0), and the progression of self-healing was recorded.

2.5.2. Ultrasonic Pulse Velocity (UPV)

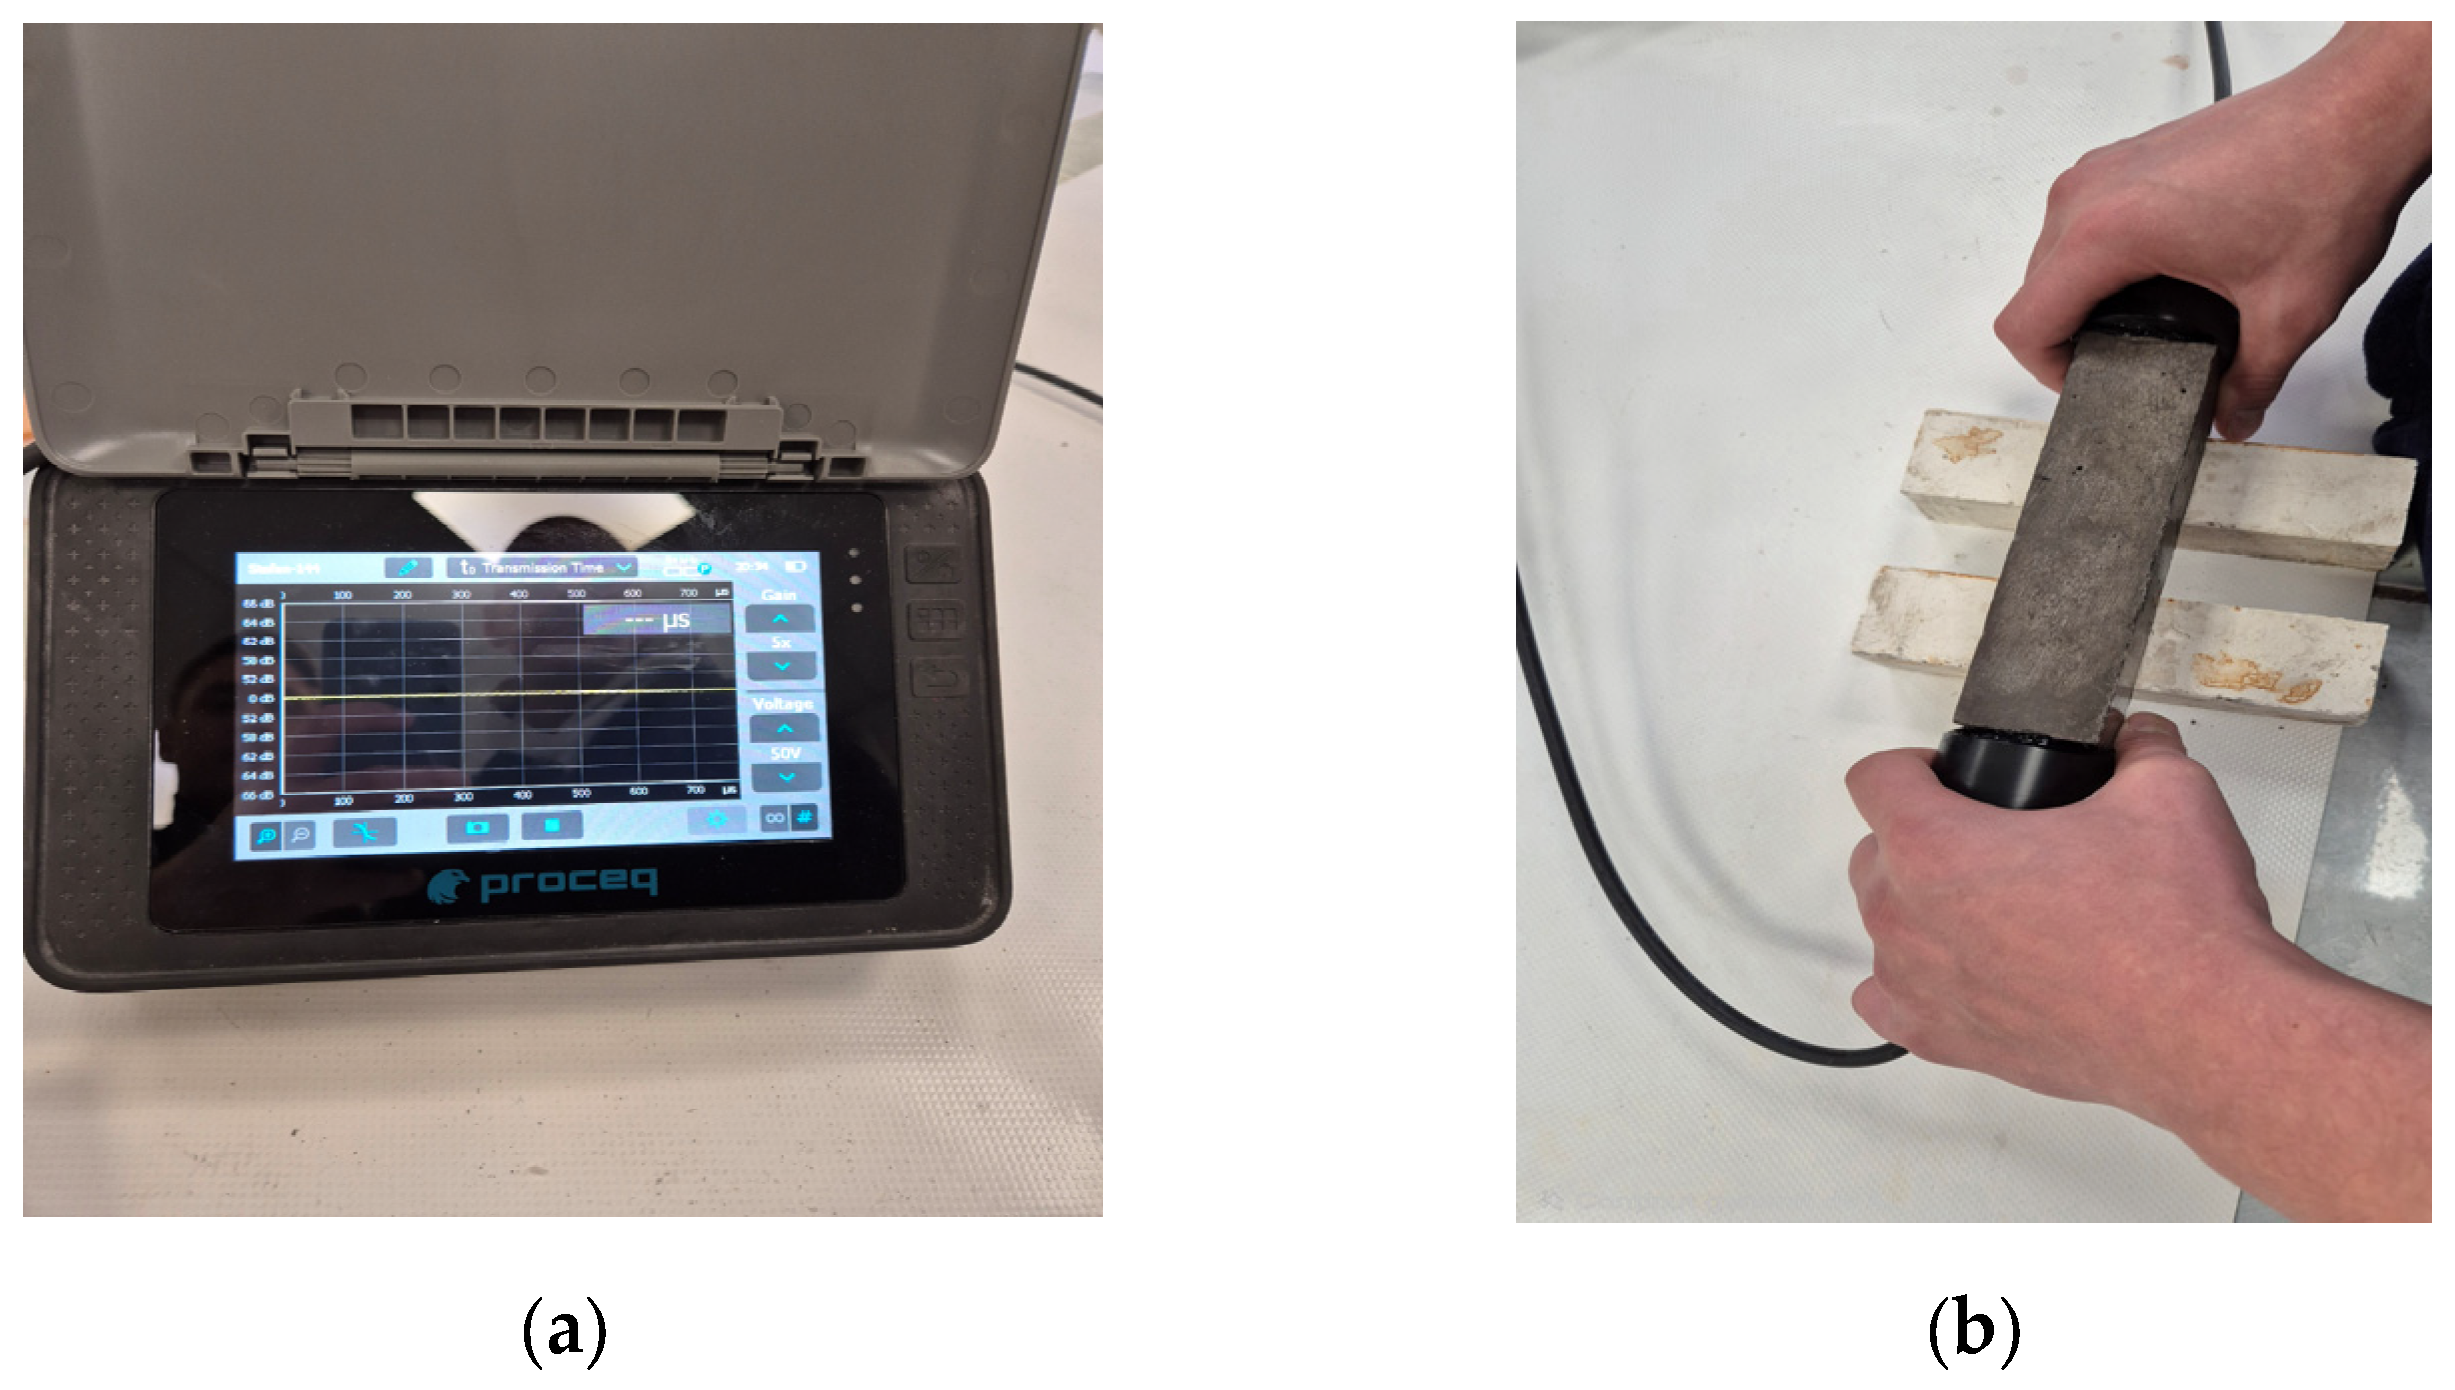
UPV testing was used to assess changes in the internal integrity of the specimens throughout the self-healing process. A Pundit 200 apparatus manufactured by Proceq (Zurich, Switzerland), shown in Figure 1a was used to evaluate homogeneity and crack closure. Testing consisted of emitting a pulse of vibrational energy through one side of the specimen and recording the wave propagation time using the transducers placed on the specimen surface with coupling gel. The longest side of the specimen (160 mm) was selected as the ultrasonic wave transmission path, intersecting the crack induced during the three-point bending test, as shown in Figure 1b. Although the crack occupied only a small portion of the total transmission path, it extended through the cross-section of the specimen. To minimize operator-related variability, all measurements were performed along the same transmission path, with the transducers positioned at identical locations on each specimen and acoustic coupling gel applied consistently to ensure uniform acoustic coupling throughout the monitoring period. P-waves were used for testing purposes. These are compressional waves characterized by the fastest travel times.

3. Results

3.1. Image Acquisition

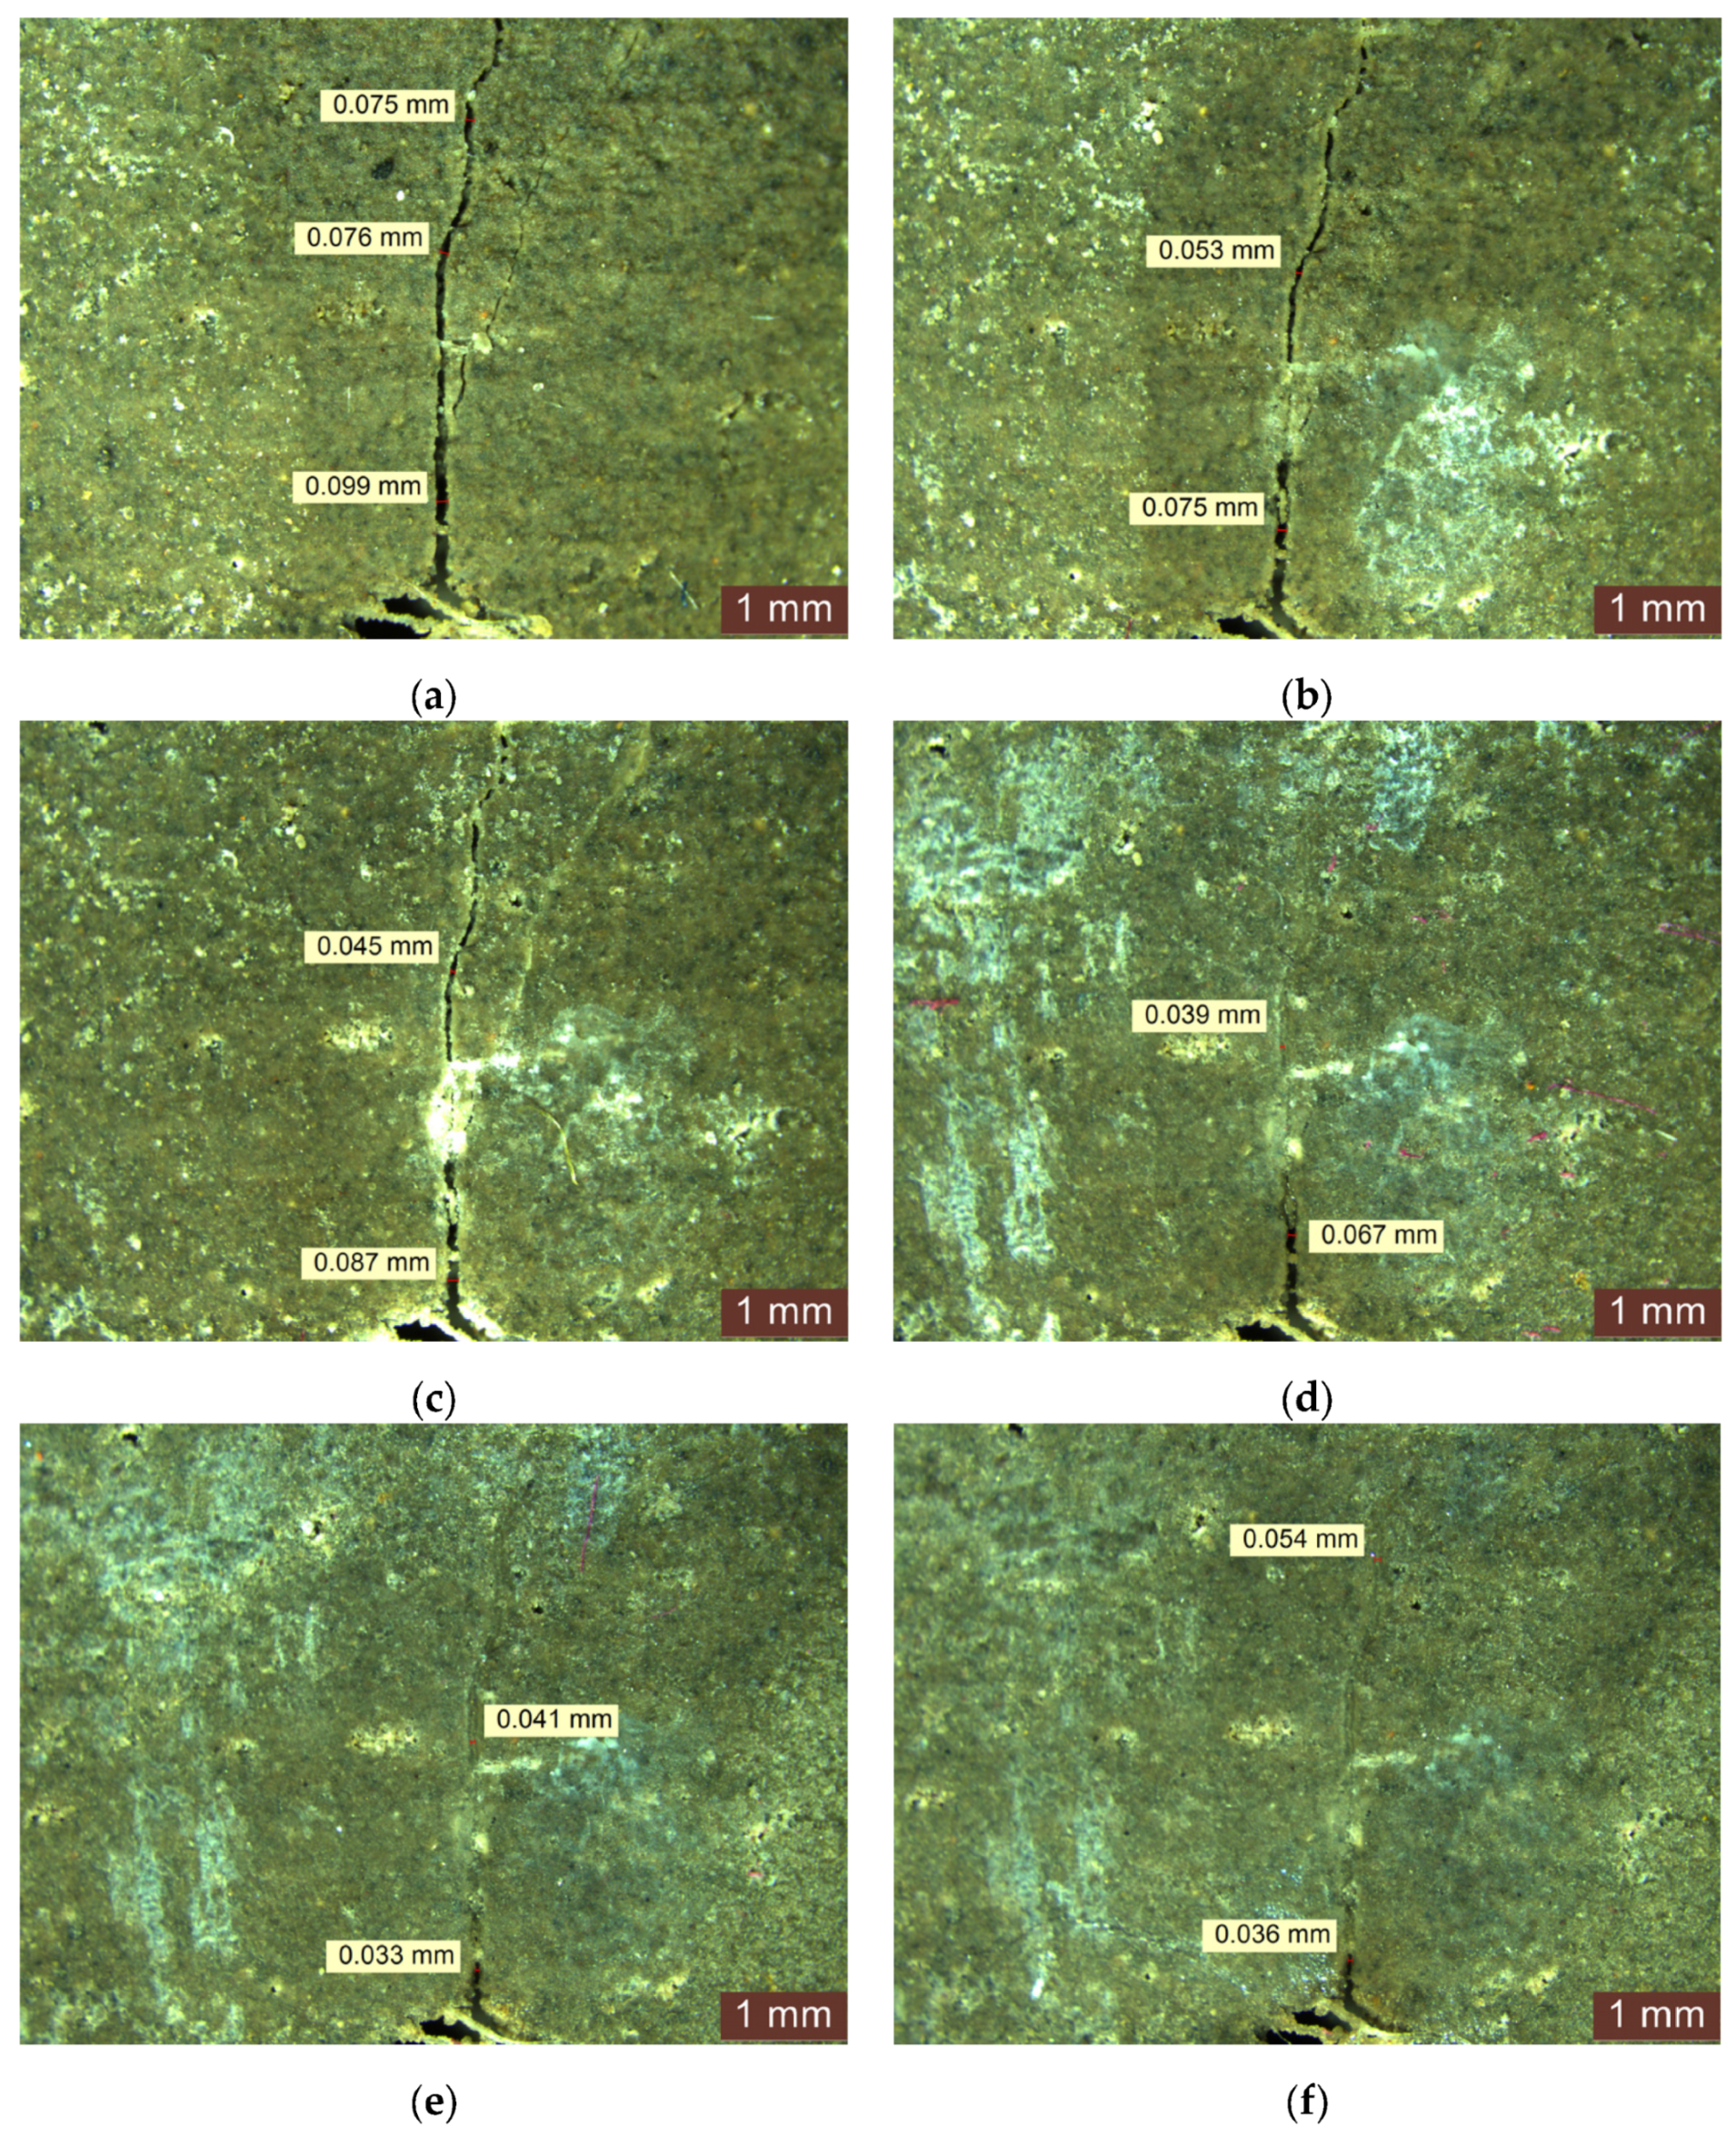
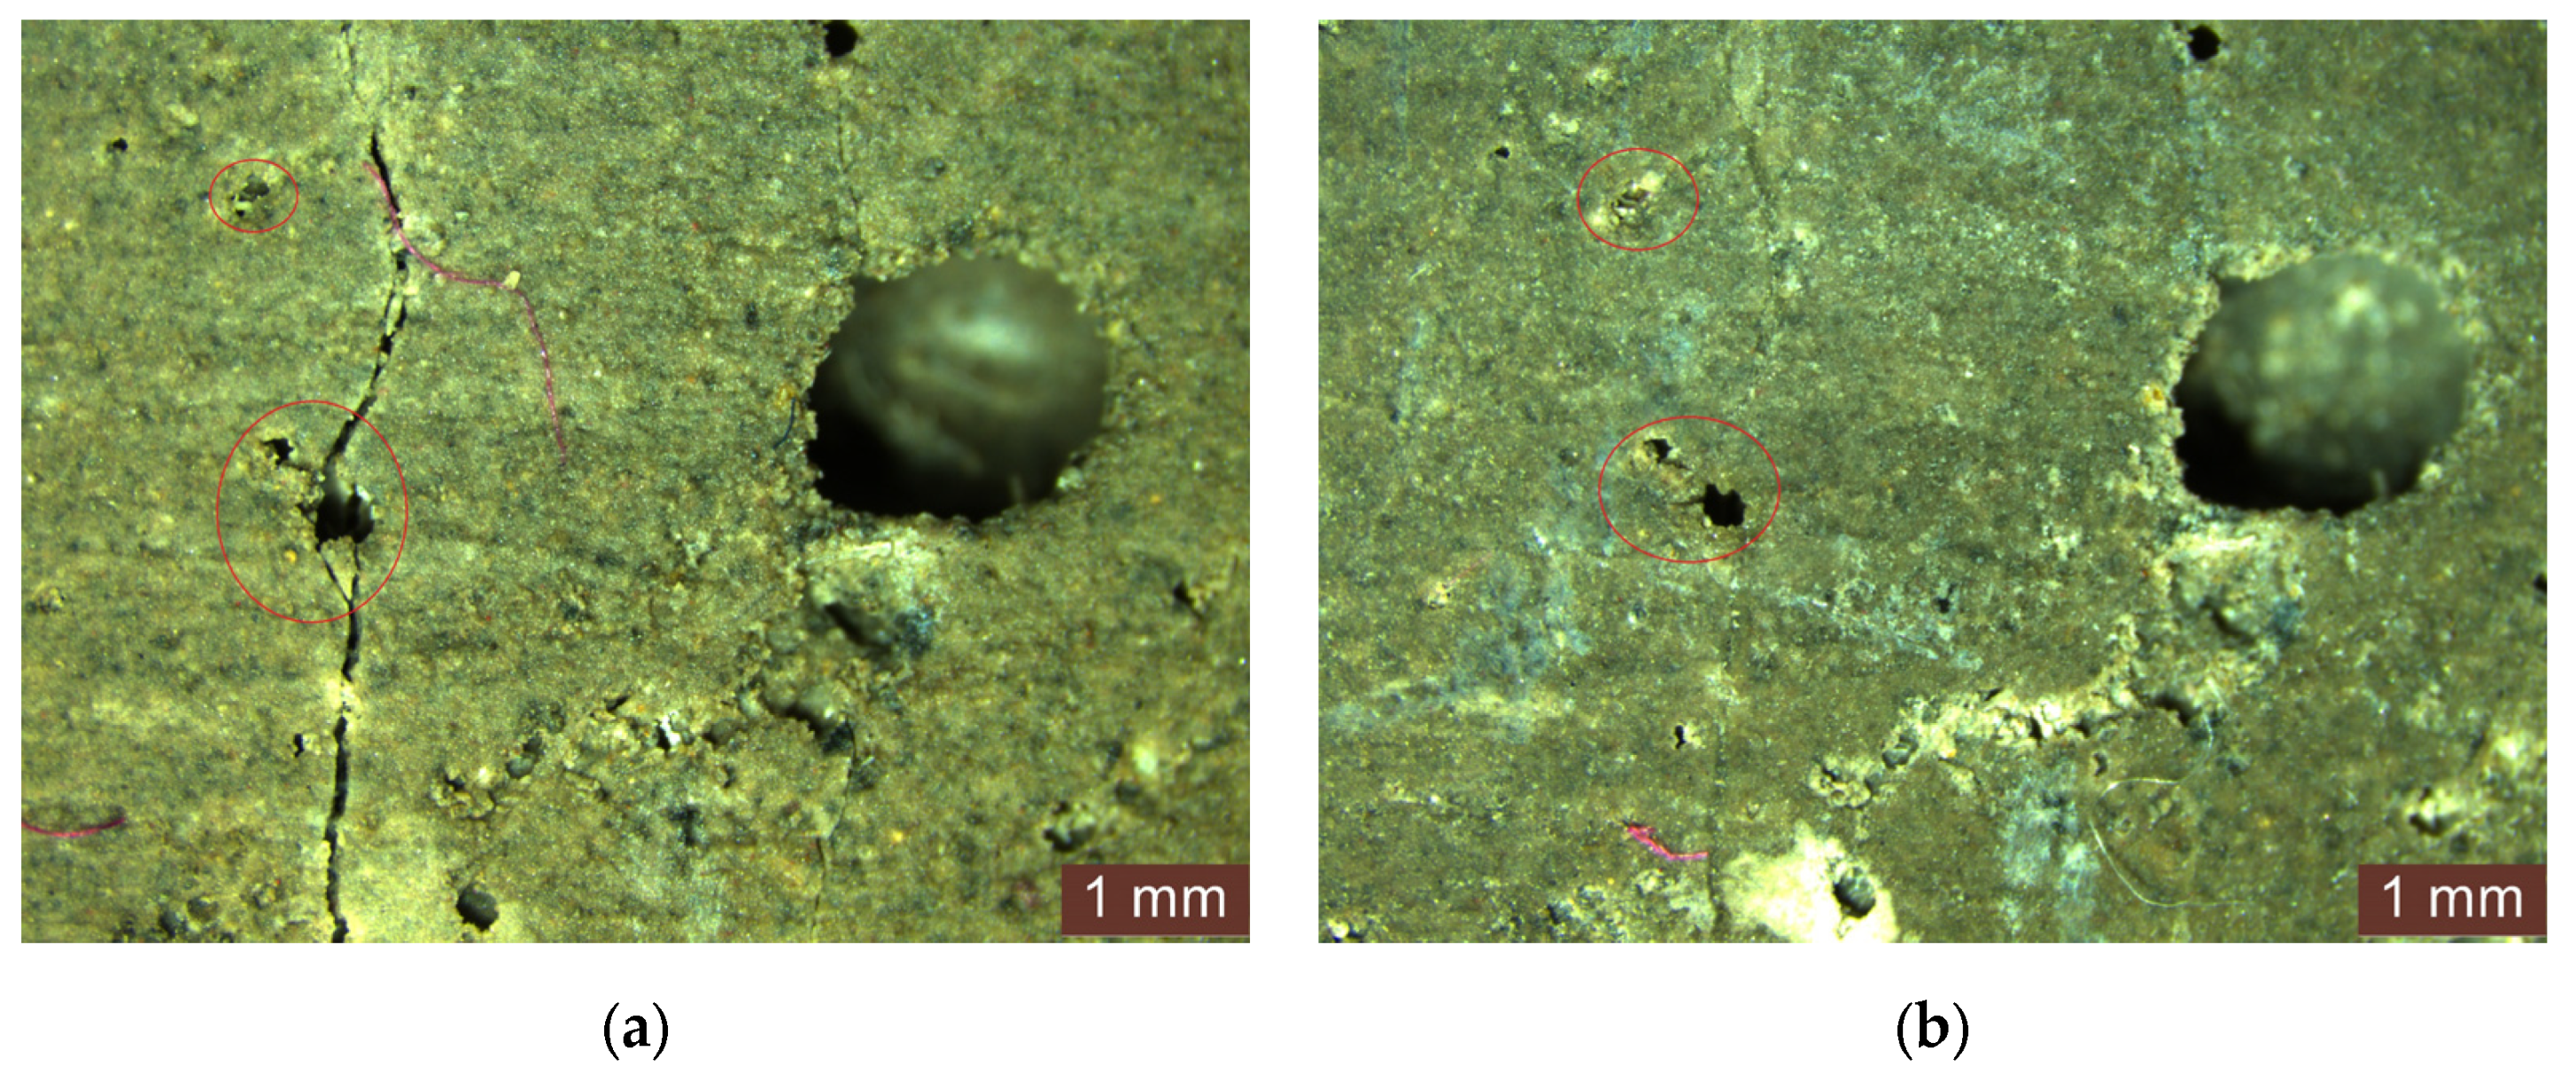
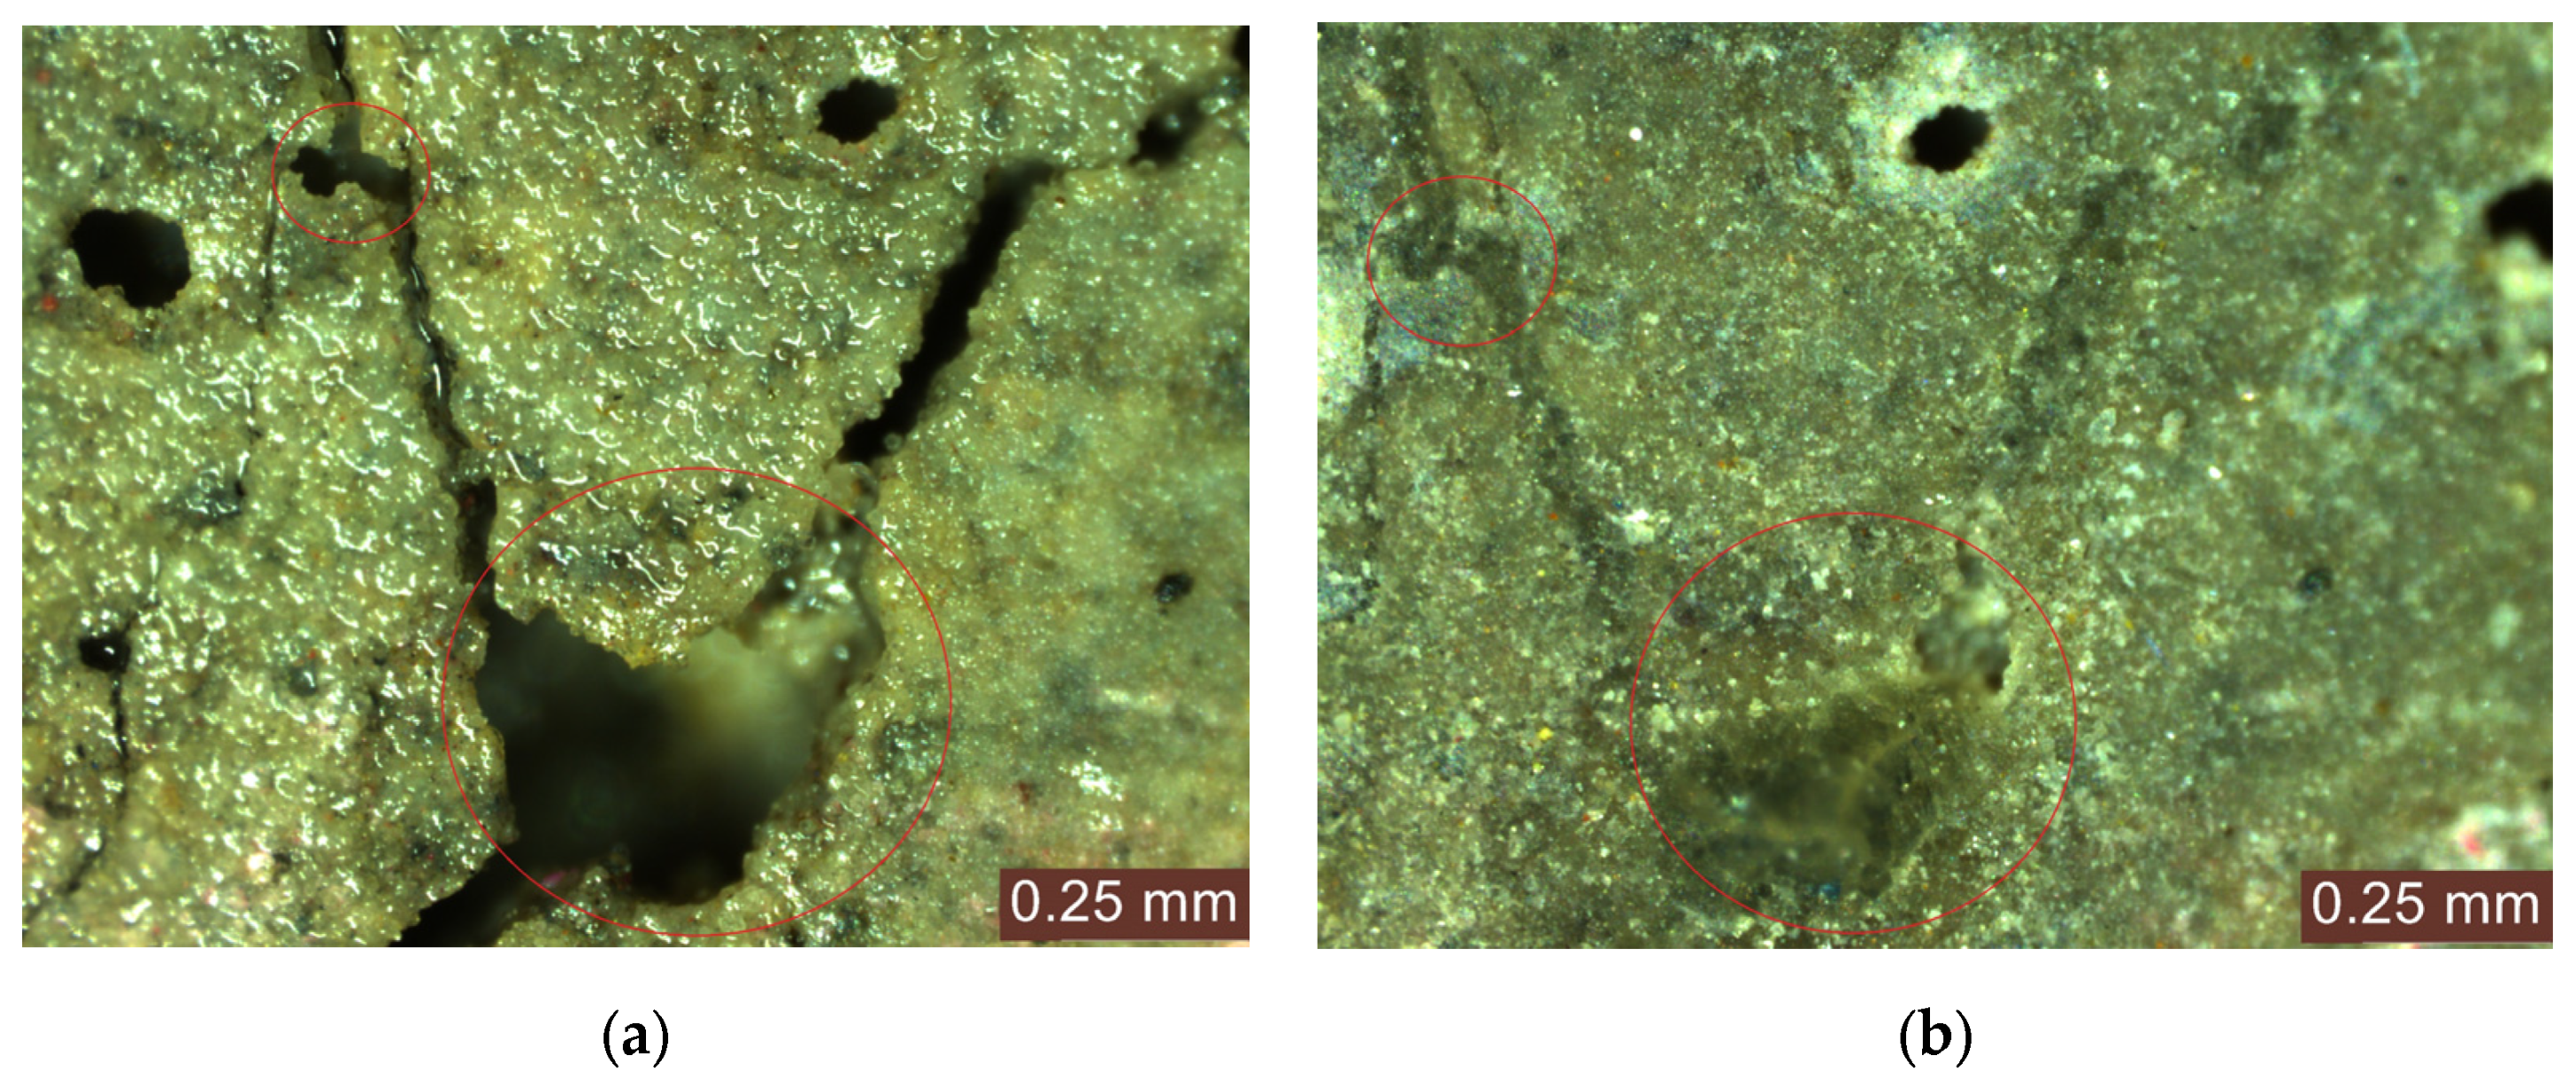
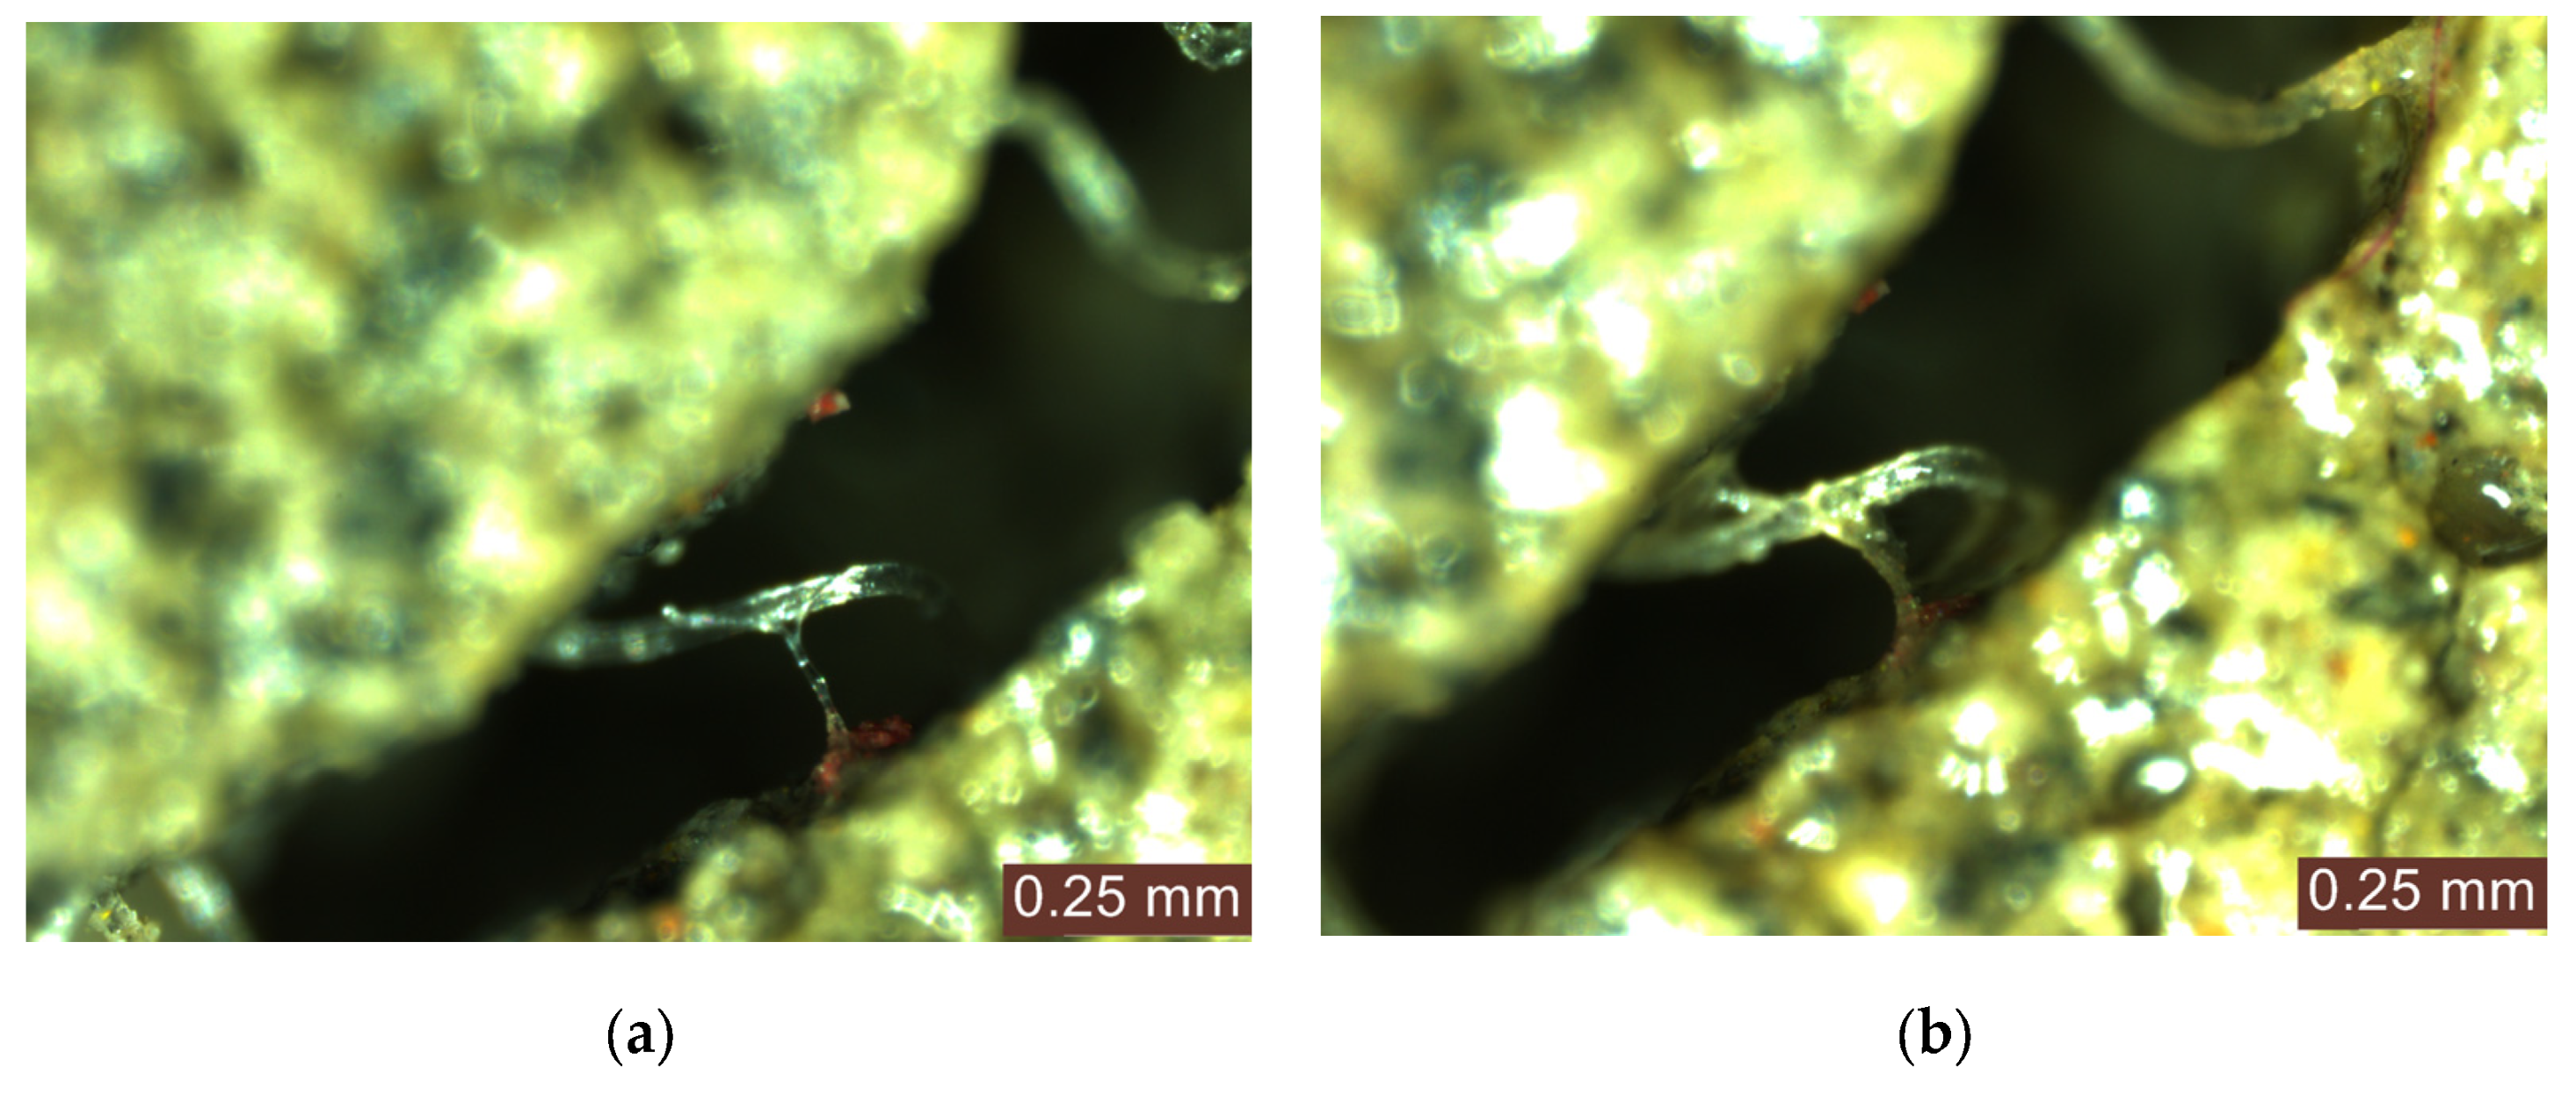
Complete crack closure, defined as the condition in which the crack opening was no longer distinguishable in the acquired microscopic images, was observed for crack widths up to 0.10 mm after approximately 60 days of wet–dry exposure, representing the full monitoring period. Figure 2 illustrates a representative example of this behavior in mixture M6 (specimen 1), while apparent surface depositions near pores are depicted for mixtures M6 (specimen 1) and M2 (specimen 1) in Figure 3 and Figure 4. Similar complete crack closure behavior was observed in other specimens with comparable initial crack widths.
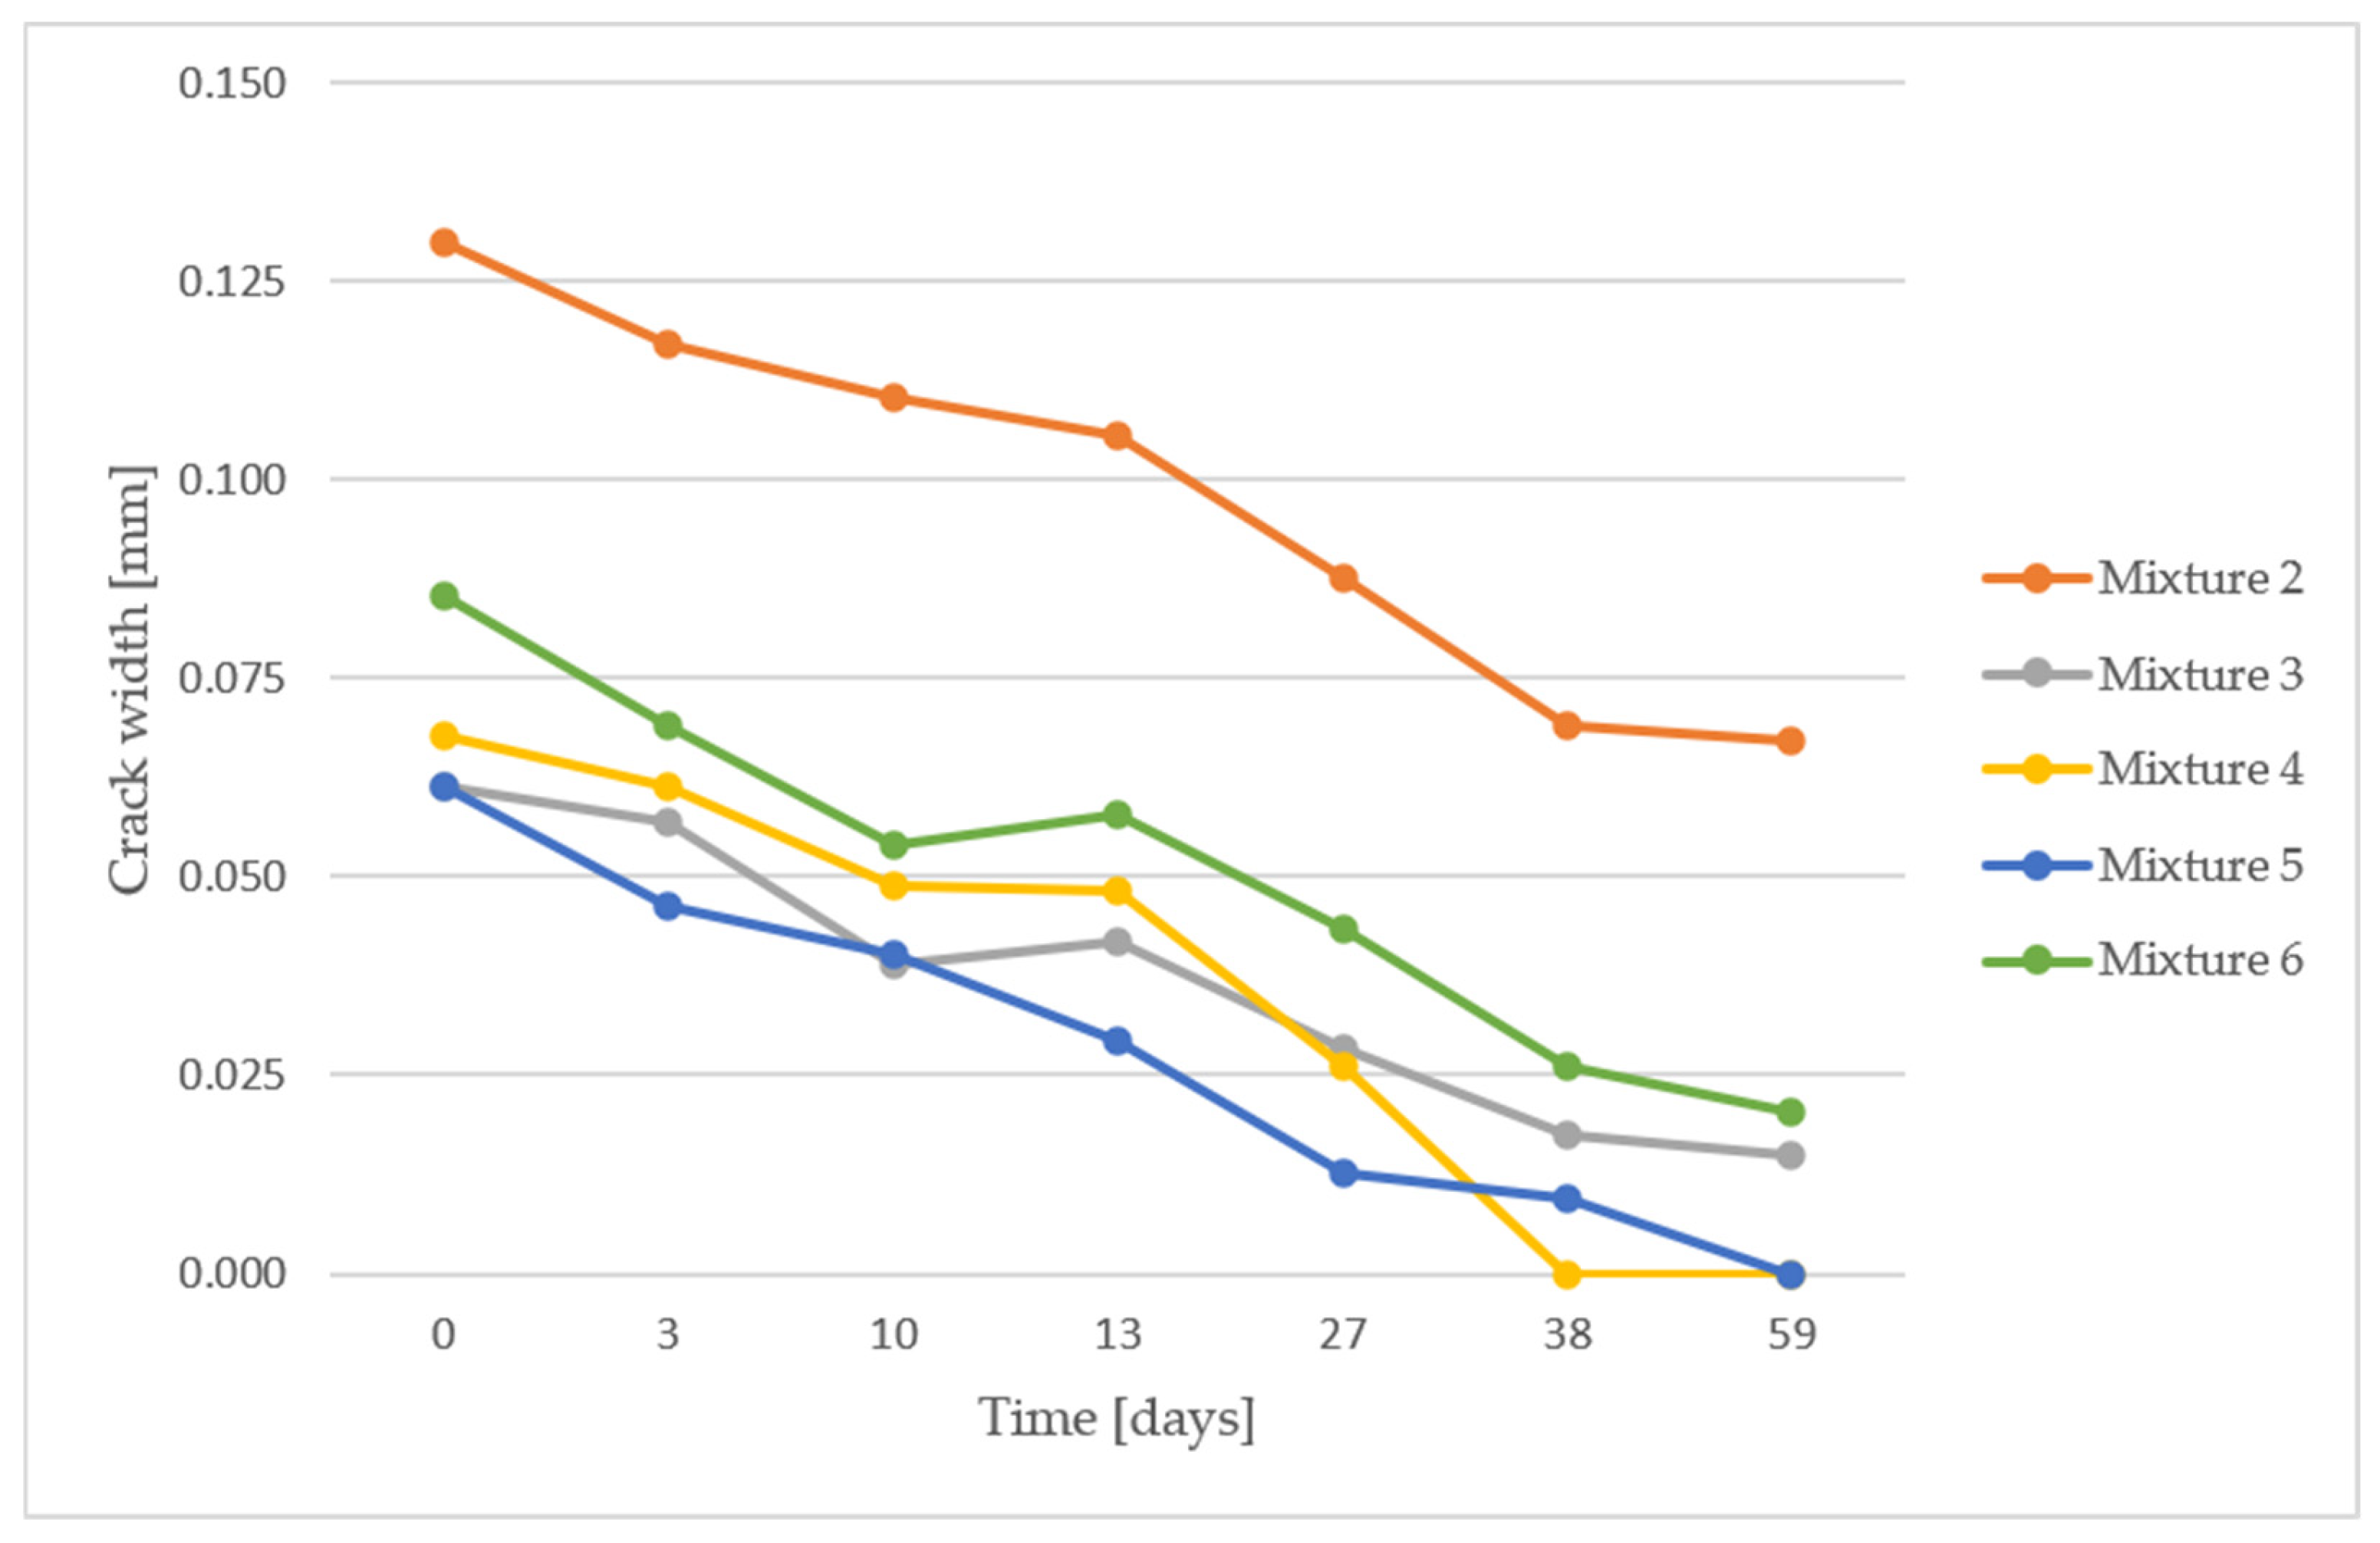
Most of the autogenous healing occurred within the first 10–14 days, corresponding to the period of rapid formation of healing products, although the healing process continued throughout the entire monitoring period. Specimens with crack widths up to 0.10 mm exhibited complete or almost complete crack closure, whereas specimens with larger crack widths (≥0.15 mm) showed partial or no closure, depending on the initial crack width, as shown in Figure 5. Mixtures M1 and M2 exhibited larger crack openings (≥0.15 mm) despite being subjected to lower three-point bending loads as presented in Table 2, indicating that the fiber content influenced not only the load capacity, but also the crack opening widths.
In Figure 5, the crack widths are expressed as the mean values of the three specimens for each mixture. To provide a normalized assessment of the self-healing performance and enable a direct comparison among mixtures with different initial crack widths, the crack healing ratio (CHR) was calculated using Equation (1), and the resulting values are presented in Table 3. The CHR represents the percentage reduction in crack width during the healing period and was determined based on the initial crack width measured immediately after crack initiation and the residual crack width after healing. Together with the residual crack widths, the calculated CHR values allow both the absolute crack width evolution and the normalized healing performance of the investigated mixtures to be evaluated. Mixture M1 exhibited brittle behavior as a result of its low fiber content, leading to crack widths of up to 0.713 mm. Consequently, these specimens were considered failed and were not included in the preceding graph because their large crack widths exceeded the plotting range; however, the corresponding results are presented in Figure S1 of the Supplementary Materials.
Crack   healing   ratio   ( % ) = ( Initial   crack   width   −   Residual   crack   width ) Initial   crack   width   × 100
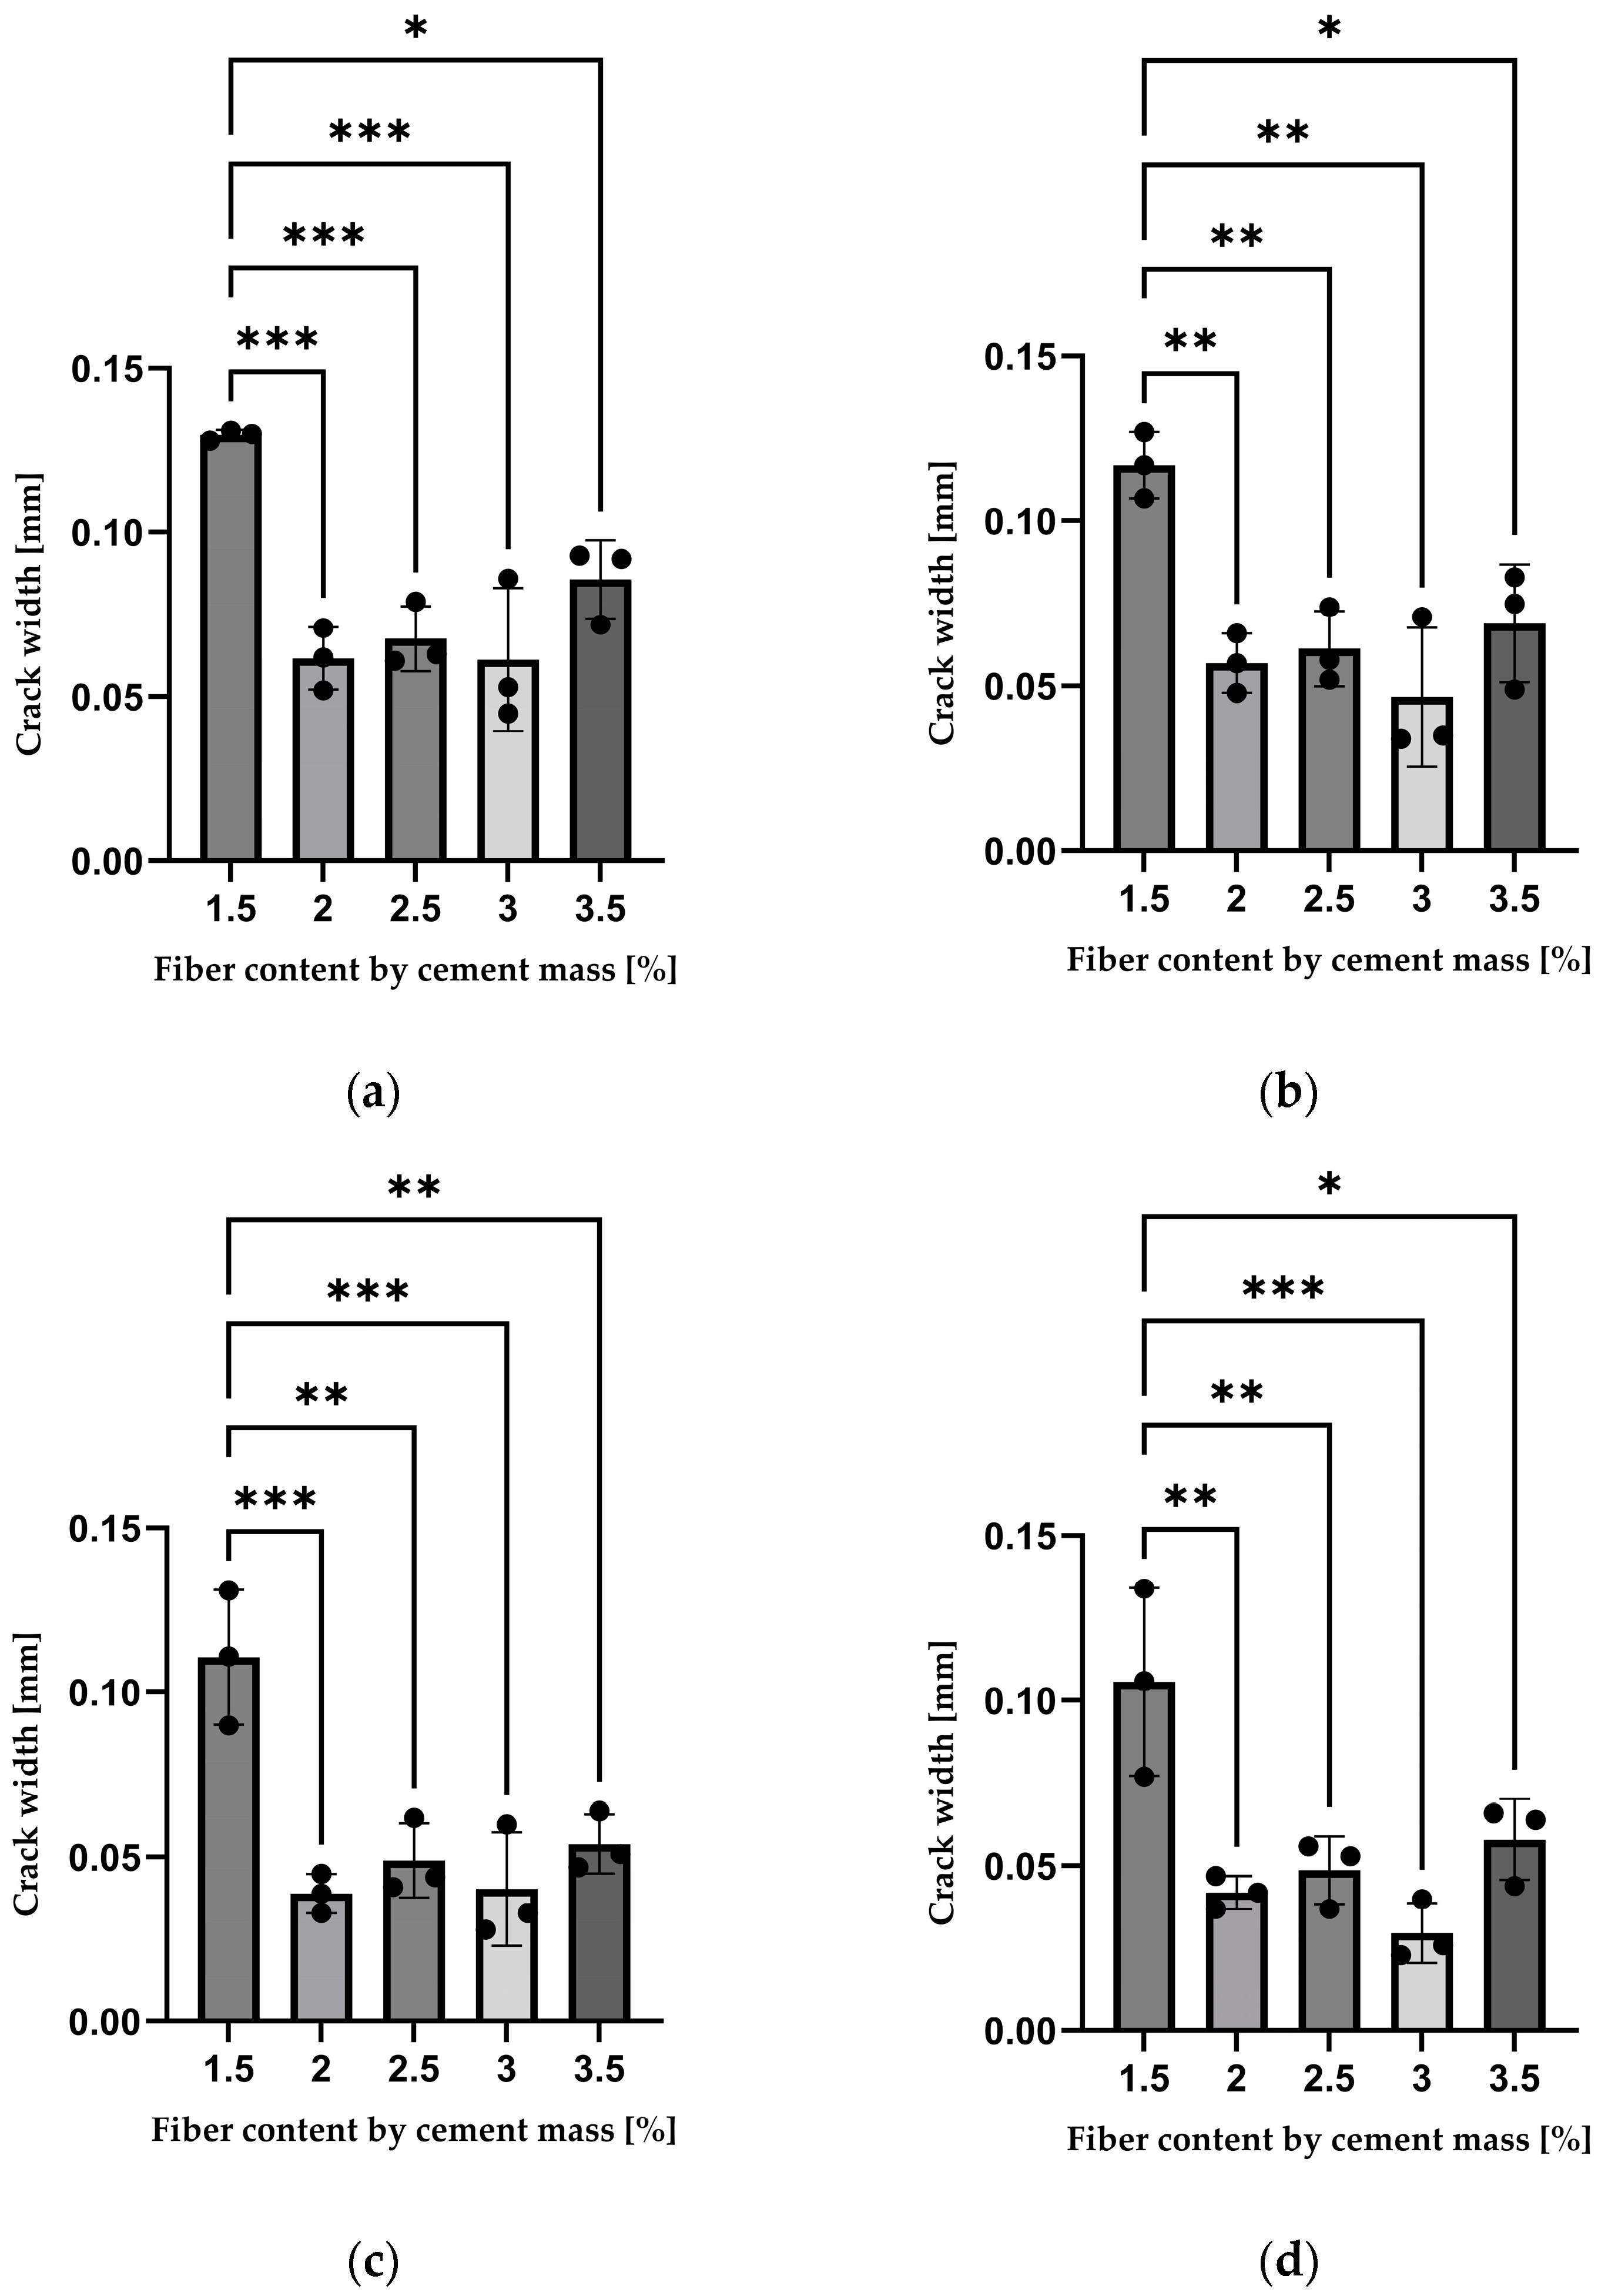
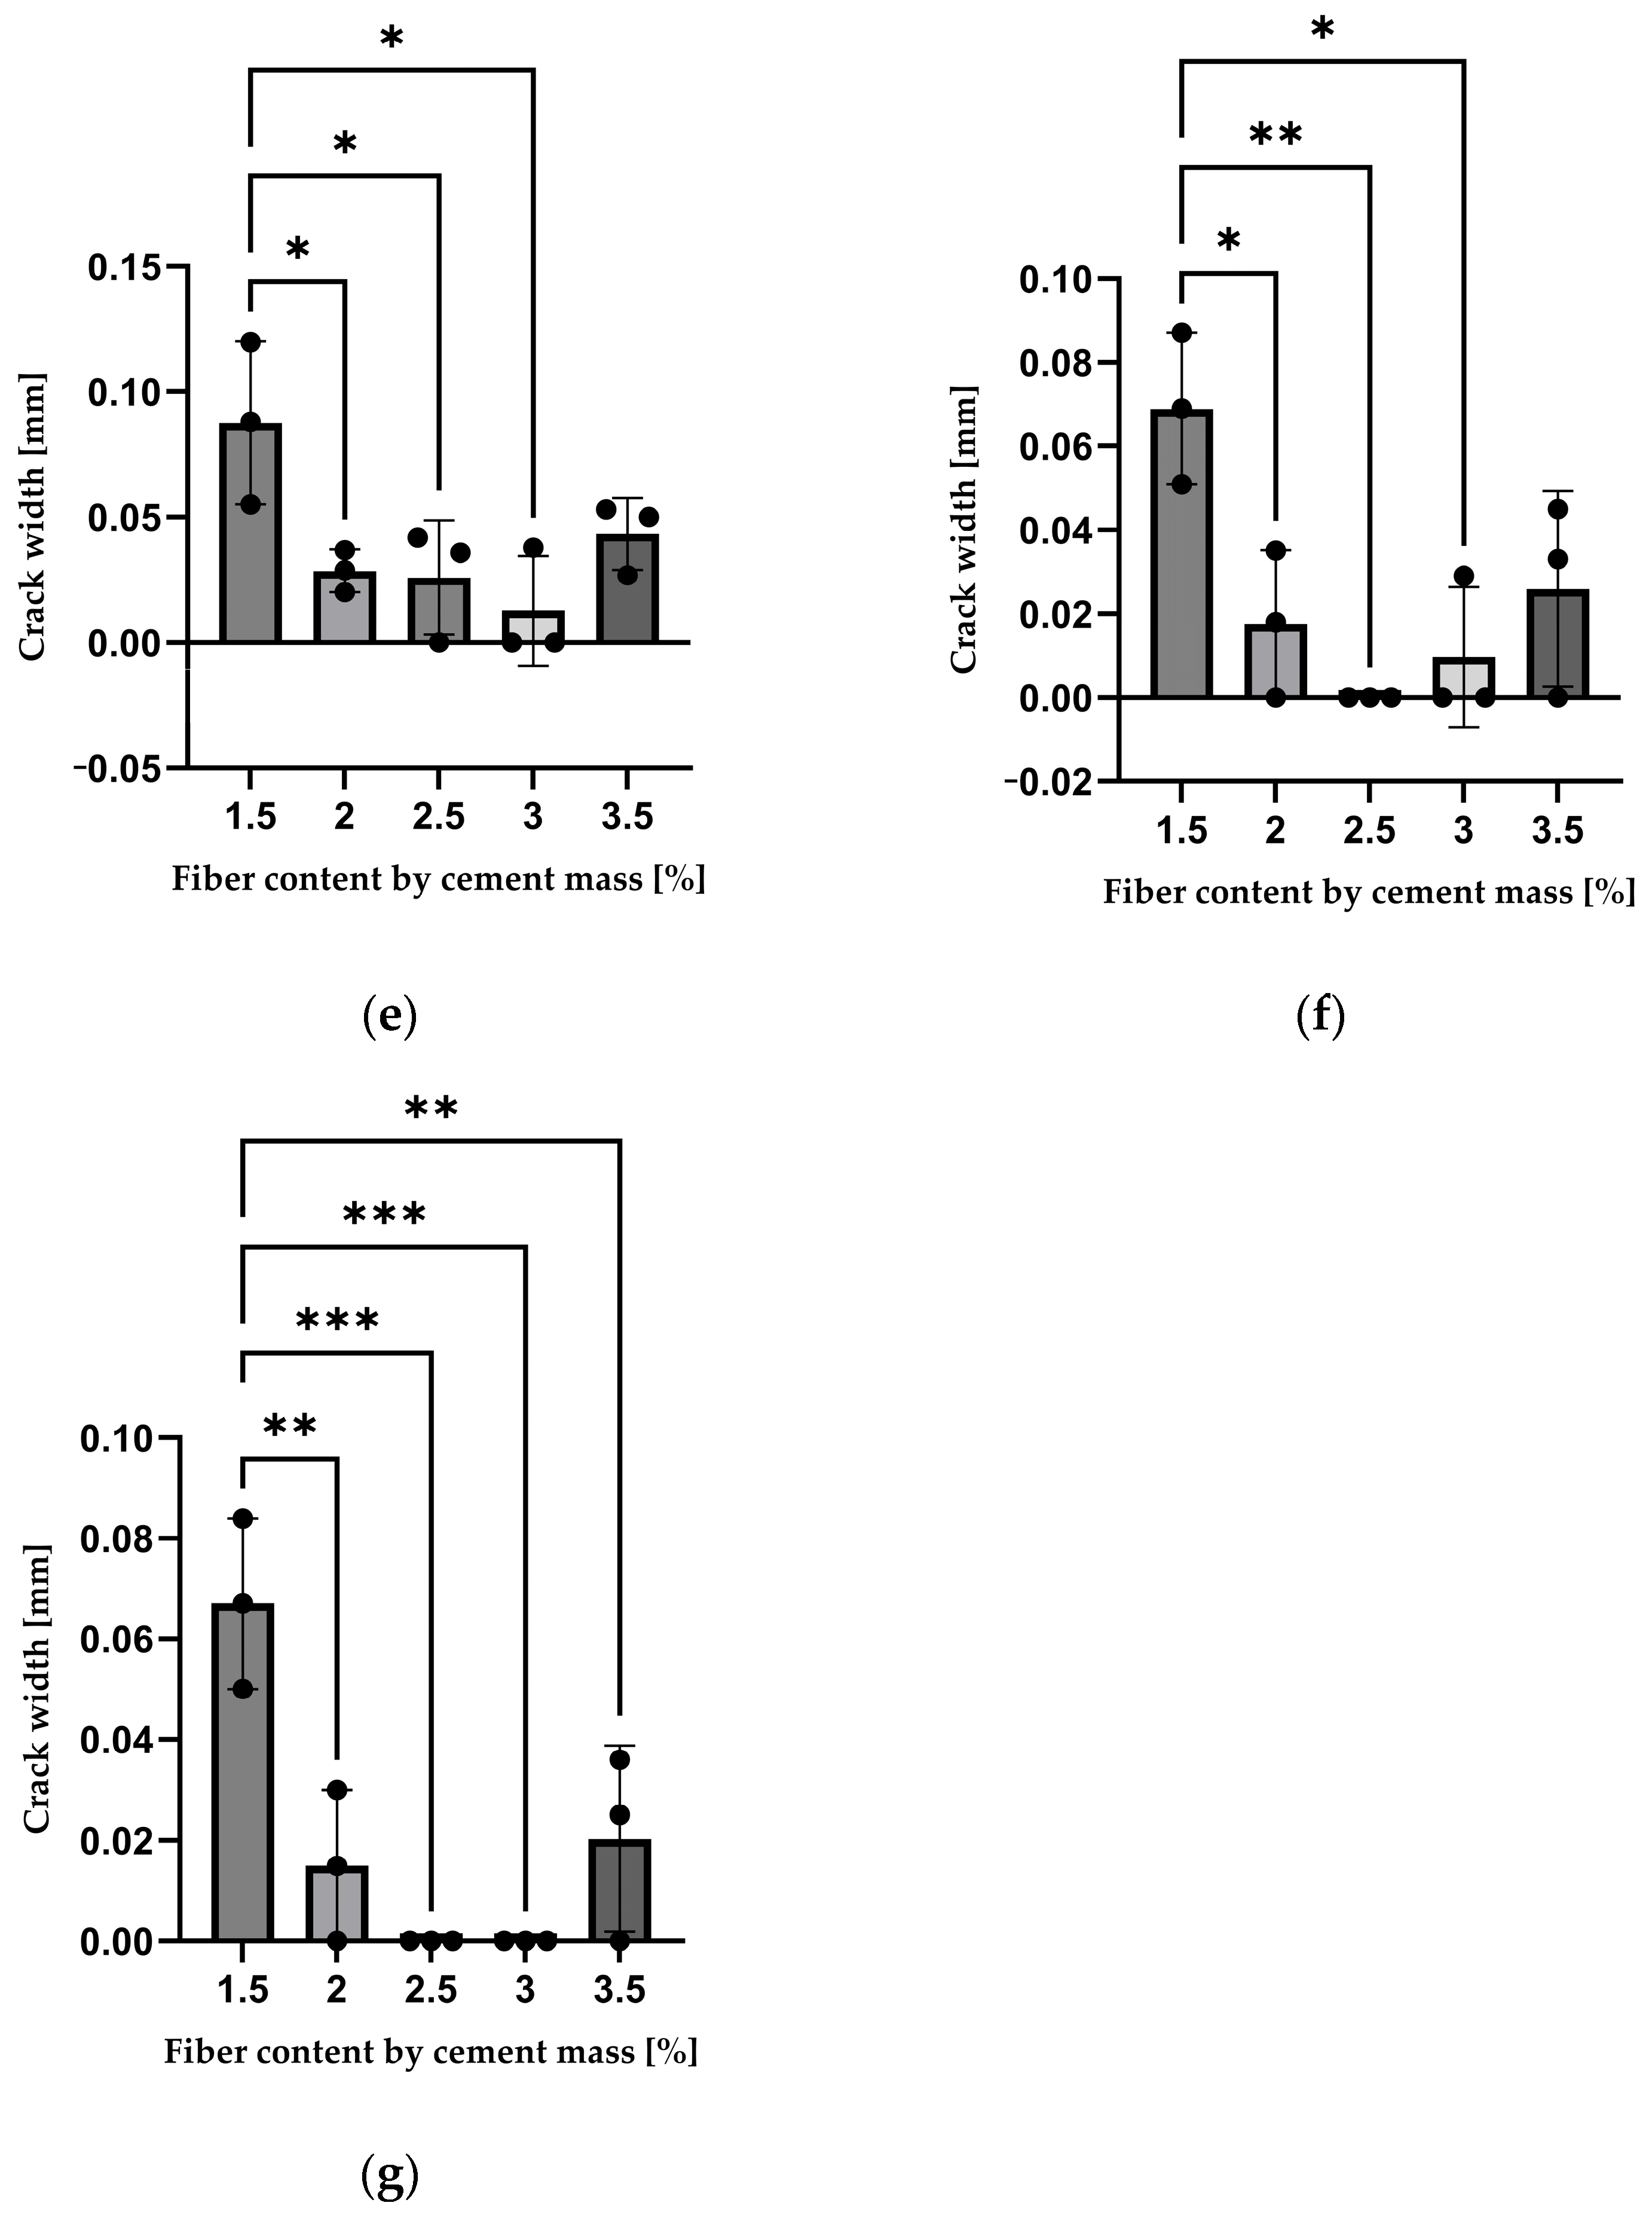
For the visualization of the individual measurements and the corresponding statistical analysis, Figure 6 presents the crack widths measured for the investigated ECC mixtures at 0, 3, 10, 13, 27, 38, and 59 days of the monitoring period. Bars represent the mean crack width of the three independent specimens for each mixture, while the error bars indicate the standard deviation (SD). Individual dots correspond to the measurements obtained from each specimen. Statistical differences between mixtures at each monitoring time were evaluated using one-way analysis of variance (ANOVA) followed by Tukey’s multiple-comparisons test. Brackets indicate the compared groups, and statistical significance is denoted as follows: p < 0.05 (*), p < 0.01 (**), p < 0.001 (***). Only statistically significant comparisons are indicated in the graph; all other pairwise comparisons were non-significant (p ≥ 0.05). The graphs were generated using GraphPad Prism (version 11.0.2; GraphPad Software, San Diego, CA, USA). It should also be acknowledged that the experimental program was conducted using a limited number of specimens (n = 3 per mixture). Although individual measurements, mean values, standard deviations, and statistical comparisons are reported, the small sample size limits the power of the statistical analysis and generalizability of the findings. Therefore, the statistical analysis should be interpreted as supporting the observed experimental trends, rather than providing definitive statistical conclusions.
It was observed that the PVA fibers provided favorable sites for the formation of apparent healing products, which was likely associated with continued hydration and the precipitation of mineral phases, as shown in Figure 7. Similar healing products have been widely reported in the literature on the autogenous self-healing of cementitious materials. For example, Wu et al. [12] investigated the influence of magnesium oxide (MgO) and superabsorbent polymer (SAP) as curing additives and reported the formation of healing products associated with continued hydration and calcium carbonate (CaCO3) precipitation. The authors also described the formation of CaCO3 crystals through the reaction between Ca2+ ions released from the cementitious matrix and dissolved CO32− ions, contributing to crack closure and the autogenous self-healing of cement-based materials.

3.2. Ultrasonic Pulse Velocity (UPV)

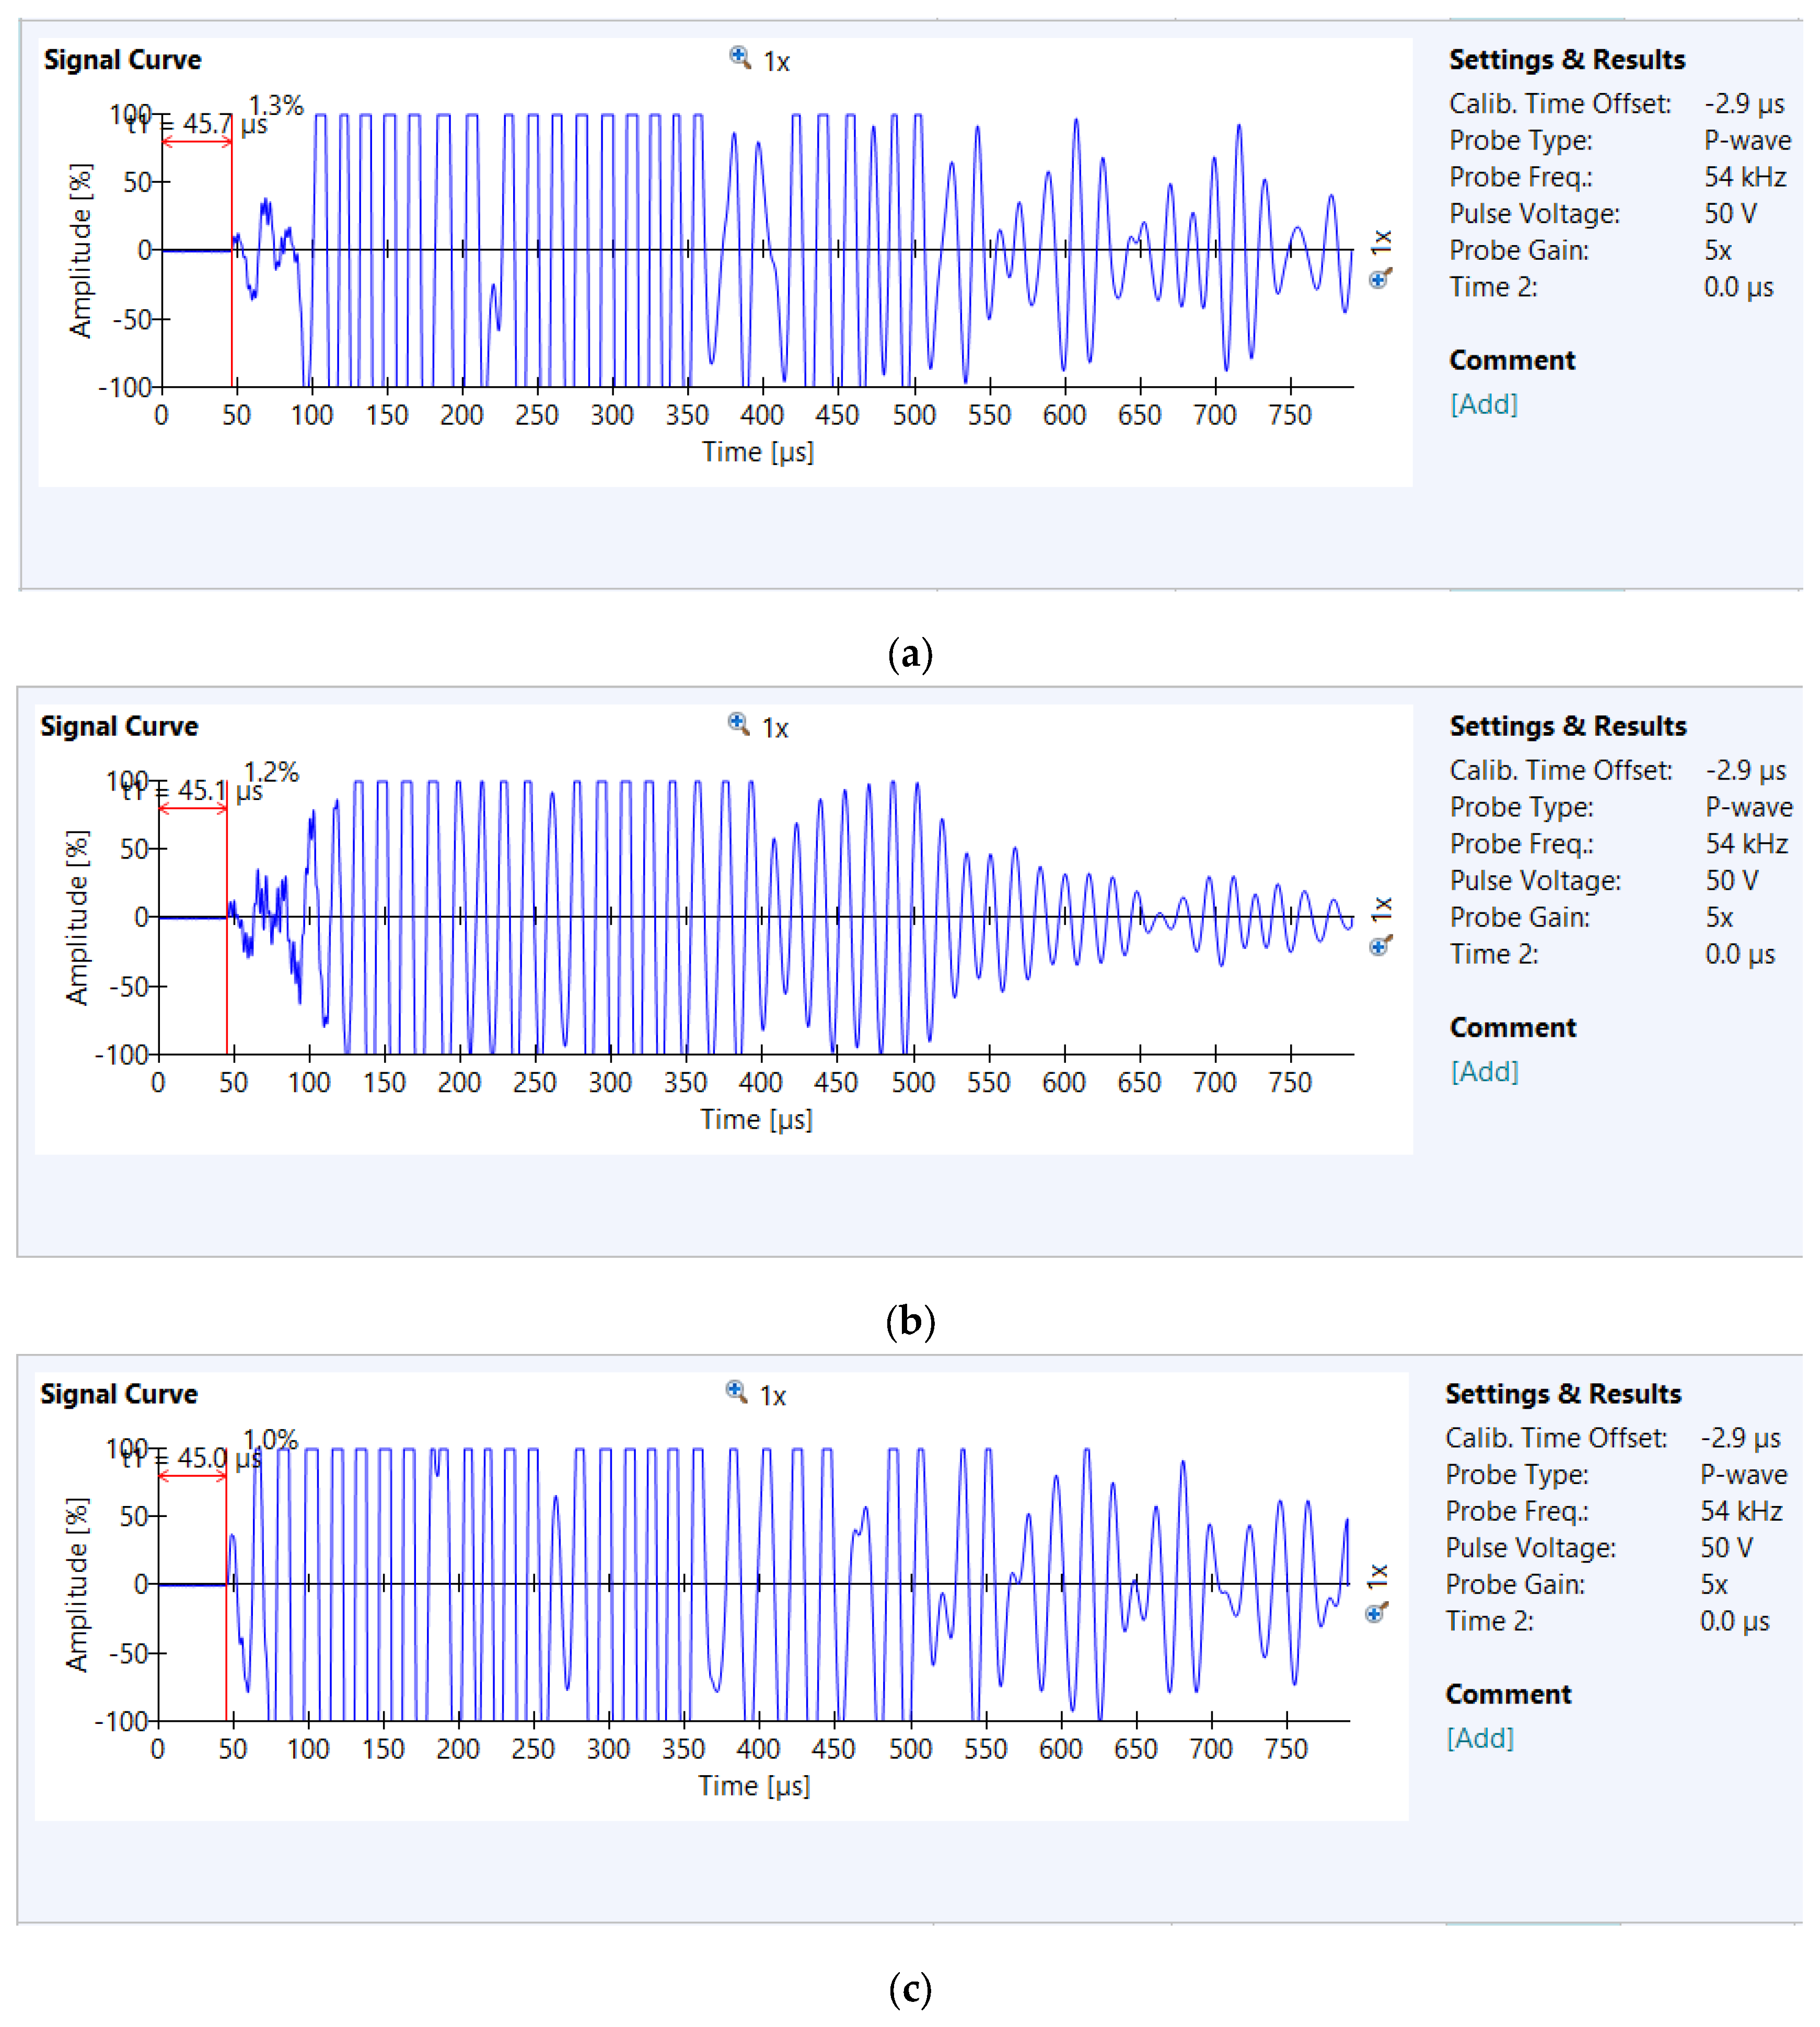
Before crack initiation, the measured first-arrival time for mixture M5, specimen 2 was approximately 44.4 μs. Following crack initiation, the first-arrival time increased to approximately 46.0 μs due to the presence of the induced crack. During the self-healing period, the first-arrival time gradually decreased, reaching approximately 44.6 μs at the end of the monitoring period. Similar trends were observed for the other mixtures, indicating potential recovery of the internal integrity of the specimens as the autogenous healing process progressed. For a first-arrival time of 44.6 µs, the resulting pulse velocity was 3587 m/s, based on the geometric dimensions of the specimens. This value places the specimens in the “satisfactory but loss of integrity is suspected” category according to ASTM C597-22 [13]. The wave propagation graphs of mixture M5, specimen 2, varied slightly over time, indicating the progression of the self-healing process, as shown in Figure 8. Irregular or distorted segments of the signal curve at certain time intervals indicate the presence of inhomogeneities, thereby perturbing signal transmission. Similar results were recorded for other specimens that exhibited self-healing behavior under the image acquisition process.
An initial UPV reading on the cracked specimens indicated an estimated compressive strength of 33 MPa for mixture M4. This value should be regarded only as a qualitative reference, as the UPV measurements were performed after crack initiation. Accordingly, the compressive strength estimated from the UPV measurements was lower than the directly measured 28-day compressive strength of 46.99 MPa obtained for the uncracked specimens (Table 2), which can be attributed to the influence of the induced crack on ultrasonic wave propagation.
EN 12504-4 highlights the influence of water, which has both chemical and physical effects on the tested specimens, particularly affecting the hydration process of the constituent components and the presence of water in the pores [14]. Given the curing regime and the implemented self-healing program, it can be assumed that the influence of water is significant and may have led to a slight overestimation of the measured data.

4. Discussion

The self-healing behavior of ECCs was investigated in this study, with particular emphasis on the influence of PVA fiber content. It was found that specimens with crack widths ≤0.10 mm exhibited complete or almost complete crack closure, whereas specimens with greater crack widths showed partial or no crack closure. Complete crack closure was defined as the condition in which the crack opening was no longer distinguishable in the acquired microscopic images. These findings are consistent with recently published studies [15]. Considering that cracking in concrete structures is one of the primary factors contributing to durability deterioration, the autogenous healing process of concrete, particularly in ECCs designed for microcrack formation under load and high tensile strain capacity, can contribute to extending the service life of constructed assets.
Specimens with higher fiber content generally exhibited greater precracking loads and modulus of rupture (MOR), as shown in Table 2, and, more importantly, reduced crack widths. These results suggest that increasing the fiber content influenced the cracking behavior of the specimens by enhancing their flexural response and improving crack-width control. Mixture M1, containing the lowest PVA fiber dosage, exhibited the lowest precracking load and a brittle failure mode characterized by abrupt formation of a wide crack. The limited fiber content probably reduced the crack-bridging capacity, resulting in poor crack-width control and consequently a less favorable response for autogenous self-healing. The majority of studies reported in the literature use a 2% fiber volume fraction. Considering the cost associated with incorporating fibers into the concrete matrix, as well as the potential for fiber clumping and reduced flowability, increased fiber content should be used with caution. Nevertheless, recent studies suggest that the use of materials with self-healing capabilities can reduce environmental impacts when the entire life cycle of the structure is considered [16].
The studied mixtures exhibited potential self-healing behavior within the body of the specimens and not only at the surface while being exposed to weekly wet–dry curing. This finding is consistent with previously reported results obtained using different testing methods (e.g., sorptivity tests) [17]. It is essential for concrete elements to exhibit in-depth crack closure to ensure the integrity and durability of the structural element, properties that have been shown to be beneficial when using ECCs for retrofitting, repair and other structural applications [18].
The novelty of this work lies in the systematic comparison of a broad range of PVA fiber dosages within the same material, with particular emphasis on their influences on crack-width control and subsequent autogenous healing behavior. The combined use of microscopic image acquisition for monitoring surface crack closure and UPV measurements for assessing changes in internal integrity provides a complementary approach to evaluating the self-healing process. The effectiveness and extent of the autogenous healing process may be influenced by the type and properties of the raw materials used in the production of the mixtures [19,20], curing conditions [17,21], and exposure to different environmental factors [22]. Consequently, the principal limitations of this study stem from the fact that the curing regime and exposure conditions do not fully replicate real-world service environments, which may affect the applicability of the results to field conditions.
It should be noted that the adopted UPV methodology is subject to the inherent limitations of manual ultrasonic testing and the relatively long transmission path, which reduces the sensitivity of the measurements to localized crack healing. Although several sources of variability were minimized by maintaining identical transducer locations, consistent coupling conditions, and standardized testing procedures throughout the monitoring period, the use of dedicated positioning fixtures and more localized ultrasonic transmission paths could further improve measurement repeatability and sensitivity. It should also be acknowledged that the UPV measurements were not performed in full accordance with ASTM C597-22 [13], as the minimum specimen cross-sectional dimensions specified by the standard were not satisfied. Consequently, the UPV results should be interpreted as a qualitative assessment of changes in the internal integrity of the specimens, rather than as an absolute measure of material properties. These aspects should be considered in future investigations.

5. Conclusions

This study investigated the influence of PVA fiber dosage on the self-healing behavior of ECCs using microscopic imaging and UPV monitoring. Higher PVA fiber content generally resulted in improved crack-width control, while specimens with narrower initial cracks exhibited more effective autogenous crack closure. These findings highlight the role of fiber-assisted crack-width control in creating favorable conditions for autogenous self-healing. Specimens with crack widths up to 0.10 mm achieved complete or nearly complete crack closure after approximately 60 days of weekly wet–dry curing, whereas specimens with wider cracks exhibited only partial healing. Most of the healing occurred within the first 10–14 days, and UPV measurements qualitatively indicated that healing also occurred within the internal structure of the specimens.
The findings are consistent with previous studies showing that ECC mixtures with microcracks exhibit enhanced self-healing capacity and potentially improved durability. The results further highlight the beneficial role of PVA fibers in crack-width control, with narrower initial cracks associated with more effective subsequent autogenous closure.
Future research should focus on the long-term durability of self-healed ECCs under different environmental and loading conditions (e.g., intermittent wetting, low humidity, chloride exposure, sustained loading and freeze–thaw cycling), as well as on optimizing fiber content with respect to mechanical performance, workability, and cost-effectiveness. In addition, advanced image analysis techniques based on computer vision could be integrated to automate the quantitative assessment of crack healing from microscopic images. In particular, semantic segmentation models, such as DeepLab, have the potential to accurately delineate crack regions at the pixel level, enabling objective quantification of crack width reduction, crack closure, and healing coverage [23]. The implementation of such approaches could improve the accuracy, repeatability, and efficiency of crack assessment compared with conventional manual image analysis.

Supplementary Materials

The following supporting information can be downloaded at: https://www.mdpi.com/article/10.3390/buildings16173375/s1, Figure S1. Evolution of crack width during the monitoring period for Mixture 1.

Author Contributions

Conceptualization, C.G.R.M.; methodology, C.G.R.M.; software, I.Ș.Z.; validation, T.P.T.; formal analysis, T.P.T.; investigation, I.Ș.Z.; resources, I.Ș.Z.; data curation, I.Ș.Z.; writing—original draft preparation, I.Ș.Z.; writing—review and editing, I.Ș.Z.; visualization, I.Ș.Z.; supervision, C.G.R.M.; project administration, T.P.T.; funding acquisition, I.Ș.Z. All authors have read and agreed to the published version of the manuscript.

Funding

This research was funded by the Technical University of Cluj-Napoca through support for the article processing charges.

Data Availability Statement

The data presented and analyzed in this study are included in the article. Additional underlying data, including specimen-level experimental data not individually reported in the manuscript, as well as Supplementary Information and clarifications, are available from the corresponding author upon reasonable request.

Acknowledgments

The authors gratefully acknowledge Master Builders Solutions Romania SRL, for providing the MasterLife WP 1000 admixture, and the Technical University of Cluj-Napoca for financial and institutional support. The authors also thank the other contributors for supplying the additional materials used in this study.

Conflicts of Interest

The authors declare no conflicts of interest.

Abbreviations

The following abbreviations are used in this manuscript:
ECCEngineered Cementitious Composite
UPVUltrasonic Pulse Velocity
PCPortland Cement
FAFly Ash
MPMarble Powder
ML1000MasterLife WP 1000
PVAPolyvinyl Alcohol
HRWRHigh-Range Water-Reducing Admixture
W/BWater to Binder Ratio
IDIdentification
VfFiber Volume Fraction
FcrApplied Precracking Load
MORModulus of Rupture
fc,28Compressive Strength
CHRCrack Healing Ratio
SDStandard Deviation
ANOVAOne-Way Analysis of Variance
SAPSuperabsorbent Polymer

References

  1. Pise, N.; Meshram, T.; Doijad, Y.; Gathe, R.; Bobade, A.; Kutemate, A.; Patil, S.; Raut, P.; Gudadhe, A. A Brief Study on Causes of Cracks, Prevention and Pattern of Cracks on Concrete. Int. J. Sci. Res. Sci. Eng. Technol. 2021, 8, 439–443. [Google Scholar] [CrossRef] [Scilit]
  2. DeBelie, N.; DeMuynck, W. Crack repair in concrete using biodeposition. In Proceedings of the International Conference on Concrete Repair, Rehabilitation and Retrofitting, Cape Town, South Africa, 24–26 November 2008. [Google Scholar]
  3. Granger, S.; Loukili, A.; Pijaudier-Cabot, G.; Chanvillard, G. Experimental characterization of the self-healing of cracks in an ultra high performance cementitious material: Mechanical tests and acoustic emission analysis. Cem. Concr. Res. 2007, 37, 519–527. [Google Scholar] [CrossRef] [Scilit]
  4. Wang, K.; Jansen, C.D.; Shah, P.S.; Karr, F.A. Permeability study of cracked concrete. Cem. Concr. Res. 1997, 27, 381–393. [Google Scholar] [CrossRef] [Scilit]
  5. Edvardsen, C. Water permeability and autogenous healing of cracks in concrete. ACI Mater. J. 1999, 96, 448–454. [Google Scholar] [CrossRef] [Scilit]
  6. Li, C.V. Engineered Cementitious Composites (ECC)—Material, Structural, and Durability Performance; University of Michigan: Ann Arbor, MI, USA, 2007. [Google Scholar]
  7. Fakharifar, M.; Dalvand, A.; Arezoumandi, M.; Sharbatdar, K.M.; Chen, G.; Kheyroddin, A. Mechanical properties of high performance fiber reinforced cementitious composites. Constr. Build. Mater. 2014, 71, 510–520. [Google Scholar] [CrossRef] [Scilit]
  8. Yang, Y.; Yang, H.E.; Li, C.V. Autogenous healing of engineered cementitious composites at early age. Cem. Concr. Res. 2011, 41, 176–183. [Google Scholar] [CrossRef] [Scilit]
  9. Wu, M.; Johannesson, B.; Geiker, M. A review: Self-healing in cementitious materials and engineered cementitious composite as a self-healing material. Constr. Build. Mater. 2012, 28, 571–583. [Google Scholar] [CrossRef] [Scilit]
  10. Shahmansouri, A.A.; Zhang, Z.; AzariJafari, H.; Shi, X. Biochar-amended high-strength engineered cementitious composites. Cem. Concr. Compos. 2025, 164, 106219. [Google Scholar] [CrossRef] [Scilit]
  11. Van Tittelboom, K.; De Belie, N. Self-Healing in Cementitious Materials—A review. Materials 2013, 6, 2182–2217. [Google Scholar] [CrossRef] [Scilit]
  12. Wu, S.; Lu, G.; Liu, Q.; Liu, P.; Yang, J. Sustainable High-Ductility Concrete with Rapid Self-Healing Characteristic by Adding Magnesium Oxide and Superabsorbent Polymer. Adv. Mater. Sci. Eng. 2020, 2020, 5395602. [Google Scholar] [CrossRef] [Scilit]
  13. ASTM C597-22; Standard Test Method for Pulse Velocity Through Concrete. Advancing Standards Transforming Markets. ASTM International: West Conshohocken, PA, USA, 2023.
  14. EN 12504-4; Testing Concrete in Structures—Part 4: Determination of Ultrasonic Pulse Velocity. European Committee for Standardization: Brussels, Belgium, 2021.
  15. Osibodu, J.S.; Akerele, D.D.; Bamigboye, O.G. Efficacy of Self-Healing Concrete for Mitigating Reinforcement Corrosion: A Critical Review of Transport Properties and Electrochemical Performance. Buildings 2025, 15, 3875. [Google Scholar] [CrossRef] [Scilit]
  16. Uguzzoni, P.M.A.; Fregonara, E.; Ferrando, G.D.; Anglani, G.; Antonaci, P.; Tulliani, J.-M. Concrete Self-Healing for Sustainable Buildings: A Focus on the Economic Evaluation from a Life-Cycle Perspective. Sustainability 2023, 15, 13637. [Google Scholar] [CrossRef] [Scilit]
  17. Zhu, Y.; Yang, Y.; Yao, Y. Autogenous self-healing of engineered cementitious composites under freeze-thaw cycles. Constr. Build. Mater. 2012, 34, 522–530. [Google Scholar] [CrossRef] [Scilit]
  18. Yücel, E.H.; Dutkiewicz, M.; Yıldızhan, F. Application of ECC as a Repair/Retrofit and Pavement/Bridge Deck Material for Sustainable Structures: A Review. Materials 2022, 15, 8752. [Google Scholar] [CrossRef] [Scilit]
  19. Cahyati, D.M.; Huang, H.W.; Hsu, L.H.; Winata, C. Self-healing investigation on engineered cementitious composites incorporating Bacillus subtilis immobilized in silica gel. Case Stud. Constr. Mater. 2025, 23, e05130. [Google Scholar] [CrossRef] [Scilit]
  20. Şahmaran, M.; Yildirim, G.; Noori, R.; Ozbay, E.; Lachemi, M. Repeatability and Pervasiveness of Self-Healing in Engineered Cementitious Composites. ACI Mater. J. 2015, 112, 513–522. [Google Scholar] [CrossRef] [Scilit]
  21. Qian, Z.S.; Zhou, J.; Schlangen, E. Influence of curing condition and precracking time on the self-healing behavior of Engineered Cementitious Composites. Cem. Concr. Compos. 2010, 32, 686–693. [Google Scholar] [CrossRef] [Scilit]
  22. Herbert, N.E.; Li, C.V. Self-Healing of Microcracks in Engineered Cementitious Composites (ECC) Under a Natural Environment. Materials 2013, 6, 2831–2845. [Google Scholar] [CrossRef] [Scilit]
  23. Luo, D.; Qiao, X.; Niu, D. A predictive model for the freeze-thaw concrete durability index utilizing the deeplabv3+ model with machine learning. Constr. Build. Mater. 2025, 459, 139788. [Google Scholar] [CrossRef] [Scilit]
Figure 1. UPV testing: (a) Proceq Pundit 200 (Proceq S.A., Zurich, Switzerland) apparatus used for ultrasonic pulse velocity measurements and (b) transducer placement.
Buildings 16 03375 g001
Figure 2. Crack closure monitoring of mixture M6, specimen 1: (a) after 3 days; (b) after 10 days; (c) after 13 days; (d) after 27 days; (e) after 38 days; and (f) after 59 days.
Buildings 16 03375 g002
Figure 3. Apparent surface deposition near pores for mixture M6, specimen 1: (a) after 3 days and (b) after 59 days.
Buildings 16 03375 g003
Figure 4. Apparent surface deposition near pores for mixture M2, specimen 1: (a) after 3 days and (b) after 59 days.
Buildings 16 03375 g004
Figure 5. Evolution of crack width during the monitoring period for mixtures M2–M6.
Buildings 16 03375 g005
Figure 6. Individual crack width measurements and the corresponding statistical comparison among the investigated ECC mixtures at different monitoring times: (a) 0 days; (b) 3 days; (c) 10 days; (d) 13 days; (e) 27 days; (f) 38 days; and (g) 59 days. *, p < 0.05; **, p < 0.01; ***, p < 0.001.
Buildings 16 03375 g006aBuildings 16 03375 g006b
Figure 7. Apparent surface deposits on the fibers of mixture M1, specimen 1: (a) after 11 days; and (b) after 67 days.
Buildings 16 03375 g007
Figure 8. Wave propagation graphs of mixture M5, specimen 2: (a) after 3 days of wet–dry exposure; (b) after 13 days of wet–dry exposure; and (c) after 21 days of wet–dry exposure.
Buildings 16 03375 g008
Table 1. Mix proportions of ECC mixtures (kg/m3).
Mixture ID 1PCFASandMPHRWRWaterFiberML1000Vf
M158058047014015.923985.8017.400.45
M258058047014015.923988.7017.400.67
M358058047014015.9239811.6017.400.89
M458058047014015.9239814.5017.401.12
M558058047014015.9239817.4017.401.34
M658058047014015.9239820.3017.401.56
1 Mixture identification; PC, Portland Cement; FA, Fly Ash; MP, Marble Powder; HRWR, HighRange Water Reducer; ML1000, MasterLife WP 1000 admixture; Vf, Fiber volume fraction (%).
Table 2. Crack initiation forces, compressive strength and modulus of rupture.
Mixture ID 1Fcr 2 [kN]MOR 3 [N/mm2]fc,28 4 [N/mm2]
M12.124.9743.45
M22.636.1848.15
M33.498.2046.03
M43.658.5546.99
M54.8411.3445.66
M65.5212.9445.99
1 Mixture identification, 2 Applied precracking load, 3 Modulus of rupture for a span length of 150 mm, 4 Compressive strength.
Table 3. Summary of crack healing ratio (CHR) values (%).
Mixture ID 1CHR (3) *CHR (10) *CHR (13) *CHR (27) *CHR (38) *CHR (59) *
M29.7614.8918.7432.6146.9248.27
M37.3236.5932.1153.6671.5475.61
M49.4427.8328.8261.58100.00100.00
M524.4134.8152.5379.3984.54100.00
M619.2636.9632.2749.2569.5576.19
1 Mixture identification; * CHR values represent the average of the three tested specimens at each monitoring time (days).
Disclaimer/Publisher’s Note: The statements, opinions and data contained in all publications are solely those of the individual author(s) and contributor(s) and not of MDPI and/or the editor(s). MDPI and/or the editor(s) disclaim responsibility for any injury to people or property resulting from any ideas, methods, instructions or products referred to in the content.