Article

Performance Assessment of Gypsum-Based Composites with Coconut Fibers: Durability, Circularity, and Environmental Impact Assessment


by
María Fernanda Rodríguez-Robalino
,
Alicia Zaragoza-Benzal
,
Amparo Verdú-Vázquez
and
Daniel Ferrández
*
Department of Building Technology, Polytechnic University of Madrid, Avda. Juan de Herrera 6, 28040 Madrid, Spain
*
Author to whom correspondence should be addressed.
Buildings 2026, 16(15), 3082; https://doi.org/10.3390/buildings16153082
Submission received: 9 June 2026 / Revised: 26 July 2026 / Accepted: 30 July 2026 / Published: 3 August 2026
(This article belongs to the Section Building Materials, and Repair & Renovation)

Abstract

Gypsum-based composites are widely used in construction for their rapid setting and fire resistance; however, their low mechanical strength and limited durability in humid conditions restrict their use in highly humid indoor environments. In this study, gypsum-based composites were developed with a partial volumetric replacement of up to 17.5% using pre-consumer coconut fiber waste (an agro-industrial by-product) as a reinforcing material. The experimental program was structured in four stages. First, the hygrothermal behavior of commercial gypsum composites containing coconut fiber was assessed through accelerated aging tests, including water-oven cycles and humid chamber-air cycles. Second, the Building Circularity Index (BCI) was estimated at life cycle stage C3 (waste treatment), considering the separation and recovery of gypsum and coconut fibers at the end of life (EoL) of a panel made from gypsum and coconut fibers. Third, three series of composites incorporating pre-consumer recycled gypsum (an industrial by-product) as a binder and coconut fiber, with substitutions of 5%, 10%, and 15%, were produced and mechanically characterized. Finally, a comparative Life Cycle Assessment (LCA) was carried out on two laboratory-scale panels: a gypsum panel and a recycled gypsum panel, both reinforced with coconut fibers. The results show that coconut fibers act as a hygrothermal stabilizer within the gypsum matrix. Following accelerated aging cycles, all formulations maintained flexural strengths greater than 1 MPa and compressive strengths greater than 2 MPa, despite maximum losses of 34.7% and 41.8%, respectively. Meanwhile, the series containing recycled gypsum showed a reduction in compressive strength of up to 74.4%, with only the mix containing 5% fiber meeting the minimum regulatory requirements. The circularity analysis showed a recovery potential of 50.34% for gypsum and 44.99% for coconut fiber at EoL, with a maximum BCI of 13.70%. Finally, the LCA confirmed a reduction in Global Warming Potential of up to 80% in panels made with recycled gypsum. In conclusion, this research suggests the technical potential of commercial gypsum reinforced with coconut fiber, whereas for recycled gypsum matrices, only the 5% fiber formulation is identified as technically viable lightweight building components.

1. Introduction

The current climate change context highlights the need to strengthen the link between environmental protection and resource efficiency. The available scientific evidence suggests that, due to the long-term presence of carbon dioxide in the atmosphere [1], transforming production and consumption patterns to reduce these emissions progressively is essential for moving towards more sustainable development models.
In this framework, the construction industry is undergoing a profound transformation as part of the transition toward a low-carbon economy resilient to climate change [2]. Globally, the building stock accounts for a notable share of energy consumption and greenhouse gas (GHG) emissions, representing at least 34% of global energy-related carbon emissions by 2023 [3]. In the European Union (EU) alone, buildings account for approximately 40% of final energy consumption and 36% of CO2 emissions associated with heating and cooling activities [4,5].
Regulatory strategies have focused on reducing operational emissions from heating, cooling, ventilation, and lighting. However, the progressive improvement in energy efficiency has increased the relative weight of embodied carbon—that is, carbon associated with material production, construction processes, maintenance, renovation, and end-of-life. It is estimated that by 2050, embodied carbon could account for more than 50% of a building’s total carbon footprint [4].
In response to this scenario, the EU has established an ambitious regulatory framework through the European Green Deal [6] and the Circular Economy Action Plan [7] to achieve climate neutrality by 2050 [6]. Within this framework, Directive (EU) 2024/1275 [5] on the energy performance of buildings marks a regulatory milestone by requiring, for the first time, the accounting of Global Warming Potential (GWP) throughout the entire life cycle of buildings. This indicator must be included in energy performance certificates starting in 2028 for new buildings with a usable floor area exceeding 1000 m2, and starting in 2030 for all new construction. The directive also promotes the deep renovation of the existing building stock, the phasing out of incentives for fossil fuel-based systems starting in 2025, and encourages the circular and efficient use of resources [5].
Complementarily, Regulation (EU) 2024/3110 [2] introduces harmonized criteria for the marketing of construction products, incorporating environmental assessment methodologies based on the UNE-EN 15804:2012+A2:2020 standard [8], the promotion of circularity through reuse and the use of secondary raw materials, and the creation of digital passports to ensure environmental traceability [2]. In this context, Environmental Product Declarations (EPDs), regulated by this standard [2], are key tools for transparently measuring and communicating environmental impacts throughout the life cycle of construction materials [3,9,10].
In Spain, the Technical Building Code (CTE) has focused on reducing operational energy consumption through the Basic Document on Energy Saving (DB-HE) [11], which regulates parameters such as non-renewable primary energy consumption, total energy consumption, and the characteristics of the building envelope. However, there is still no specific regulatory framework for quantifying the carbon footprint of buildings, although such a framework is expected to be implemented before 2027 [4]. Additionally, at the national level, the Climate Change and Energy Transition Act (2021) [4] establishes the basis for integrating sustainability criteria into public procurement and incentivizes the use of low-environmental-impact materials.
In this context, international regulations promoting circularity have been reinforced by global frameworks such as the United Nations Sustainable Development Goal 12 [12] and Directive 2008/98/EC on waste [13], which establishes the European legal framework for waste management. Both have been adopted at the national level through policy documents such as the Spanish Circular Economy Strategy “España Circular 2030” [14], which sets clear goals, including reducing waste generation and increasing the use of recycled materials by 30% by 2030.
Among the most important materials for circular construction is gypsum, a mineral material widely used for its rapid setting, whiteness, strength, fire resistance, and ease of use, which has led to its increasing use in the production of prefabricated building components. However, gypsum has technical limitations that restrict its use: its low mechanical strength relative to other structural materials and its poor moisture resistance make it difficult to use in outdoor spaces and under demanding environmental conditions [15]. To improve its performance, various solutions have been explored, including the incorporation of secondary materials or industrial byproducts. In this context, various studies have documented the use of recycled fibers as natural reinforcements, including coconut fiber [16], date palm fiber [17], abaca fiber [18], and hemp [19], thereby improving the material’s physical, mechanical, and hygrothermal properties. These strategies not only enhance the mechanical and functional performance of gypsum but also promote more sustainable resource management, in line with the principles of circularity in construction.
Table 1 presents studies investigating the durability of gypsum composites incorporating various secondary raw materials [20,21,22,23]. In particular, studies based on lignocellulosic waste have demonstrated that these composites are not only technically viable but also exhibit durable performance suitable for protected indoor and outdoor applications [21]. Taken together, these results confirm the suitability of the reinforced composites from both a technical and functional standpoint.
Construction waste management has made the recycling of gypsum panels an increasingly important source of reusable materials, as gypsum is highly recyclable [24], a key factor in its sustainability. It is estimated that between 10% and 12% of the panels used in construction and renovation are discarded as scrap or waste [24], generating thousands of tons annually from demolition, manufacturing, and installation processes. In Spain, construction accounted for 46.9% of the waste generated in 2023, with mineral waste—including gypsum—being the largest fraction (49,000 tons), originating mainly from construction activities (42,000 tons) [25].
Recent studies have observed that recycled gypsum composites with recycled additions allow part of the material to be reused in new panels without notably compromising their properties [26,27,28,29]. Table 2 presents various studies that incorporate different types of recycled materials. However, their use typically results in more porous matrices, with a consequent reduction in density. In mechanical terms, these materials exhibit reduced surface hardness, flexural strength, and compressive strength compared to commercial gypsum, attributable to lower cohesion between the dihydrate crystals and the presence of impurities [20,21]. Despite this, the environmental benefits are considerable, notably reductions in CO2 emissions and natural resource consumption [20]. Taken together, these results highlight the potential of these strategies to enable multiple reuse cycles, contributing to the circular economy and mitigating environmental impacts.
However, despite advances in the literature, most existing studies focus primarily on characterising mechanical behaviour in the initial state [15], whilst the analysis of performance under service conditions—particularly in scenarios involving exposure to moisture—the assessment of environmental impact and end-of-life management are usually treated as separate lines of inquiry, without a methodological approach that allows these dimensions to be integrated into the overall evaluation of the material.
In this context, this study investigates composites based on commercial and recycled gypsum, reinforced with recycled coconut fiber (both pre-consumer wastes), from a circular-economy perspective aimed at decarbonizing the construction sector. The study is structured around two lines of research: (i) the incorporation of coconut fiber as a reinforcing agent in gypsum composites to improve their hygrothermal properties and (ii) the recycling of gypsum reinforced with coconut fiber to produce a new composite intended for use in internal partitions.
Within this framework, the role of coconut fiber as a reinforcing material in gypsum matrices is analyzed, focusing on its ability to modify the material’s behavior under damp conditions. The focus is on assessing the extent to which this reinforcement helps stabilize the matrix, reducing physical degradation and mass loss, whilst the use of recycled gypsum helps reduce the material’s environmental impact without compromising its technical functionality.
The experimental assessment is structured around three complementary areas: (i) in-service behavior under humid conditions, (ii) the environmental impact quantified using Life Cycle Assessment (LCA), and (iii) the material’s circularity potential at the end of its useful life [30].
Based on this approach, the study analyses the effect of incorporating coconut fiber reinforcement into gypsum and recycled gypsum binders. This enables a comprehensive assessment of the material, allowing for the identification of more sustainable construction strategies underpinned by technical evidence.

2. Materials and Methods

2.1. Materials

This study utilized primary raw materials, such as commercial gypsum and tap water, and recycled materials, including pre-consumer coconut fiber from the agro-industrial sector and pre-consumer recycled gypsum from the industrial sector.

2.1.1. Primary Raw Materials

Commercial gypsum: IBERYOLA E-35 gypsum, used as the primary binder in this study, is a high-purity, high-quality material supplied by Saint-Gobain Placo Ibérica S.A. (Madrid, Spain) [31]. It is obtained by calcining natural gypsum (CaSO4∙2H2O), a process that produces a binder consisting mainly of calcium sulfate hemihydrate (CaSO4∙½H2O) [16,22]. Designated as binder B1 in accordance with standard UNE-EN 13279-1:2009 [32]. It has a purity index > 80%, a particle size distribution ranging from 0 to 0.2 mm, a pH > 6, a thermal conductivity of 0.30 W/m∙K, and a water vapor diffusion factor (μ) of 6. According to fire reaction regulations, it meets the Euroclass A1 classification established in Regulation (EU) No. 305/2011 [33]. In terms of its mechanical properties, it exhibits a flexural strength ≥ 1 N/mm2 and compressive strength ≥ 2 N/mm2, with a workability time of 13–22 min and a water/powder ratio of 1–1.5 L/kg [31]. It is widely used in the construction sector for manufacturing moldings, slabs, and prefabricated panels, as well as for ornamental and finishing applications. Hereinafter, this material will simply be referred to as “gypsum”.
Water: Drinking water is supplied by Canal de Isabel II (Madrid, Spain), which complies with the requirements outlined in Directive (EU) 2020/2184 and Council Directive 98/83/EC [34], ensuring its suitability for both human consumption and use in laboratory testing [16,19]. It has a pH ranging from 7.1–8.9 (u), a total hardness of 10–50 (mg/L CO3Ca), a chloride content of 10–21 (mg/L), total organic carbon of 1.6–2.5 (mg/L), lead and cadmium concentrations < 2.5 (µg/L), absence of Escherichia coli (0.0 (CFU/100 mL)), and turbidity of 0.3 (NTU).

2.1.2. Recycled Materials

Coconut fiber: The coconut fiber used in this research is a pre-consumer recycled material of agro-industrial origin. Coconut fiber for use in the agro-industry is obtained from the mesocarp of the husk of the fruit of Cocos nucifera L., a perennial species cultivated in tropical regions and widely available [35]. Its production involves a specific manufacturing process comprising several stages: first, de-hulling, where the coconut husk is crushed to separate the fiber from the residual dust; next, fiber shredding, designed to separate the fibers that are tangled together; followed by screening, which allows the shredded fiber to be oriented and shaped; and finally, fiber cleaning, using centrifugal forces to remove shavings, epicarp debris, stems, and husk dust [36]. In terms of mechanical properties, it exhibits a tensile strength of 165–222 MPa, a Young’s modulus of ≈3.8 GPa, and an elongation at break of ≈40%. Physically, their density ranges from 100 to 140 kg/m3, and their thermal conductivity is 0.043–0.045 W/m°·C [37]. Their organic composition consists of 27–36 wt% cellulose, 17–23 wt% hemicellulose, and 37–42 wt% lignin.
The coconut fibers used come from the offcuts generated during the industrial manufacture of organic blankets and rolls. Due to their short length, these offcuts cannot be reintroduced into the original production process, so they were used as a reinforcing material. These fibers were cut manually to a minimum length of 10 mm, a value consistent with the typical size of commercial fibers used in reinforced gypsum precast products, such as glass or polypropylene fibers. From this batch, 100 fibers were selected and measured individually, yielding an average length of 2.45 cm. The percentage distribution of lengths was determined as 6% (1.0–1.5 cm), 32% (1.5–2.0 cm), 20% (2.0–2.5 cm), 24% (2.5–3.0 cm), 8% (3.0–3.5 cm), 6% (3.5–4.0 cm), and 4% (4.0–4.5 cm) [16].
Recycled gypsum from plasterboards: This secondary material is obtained from waste generated during the production of plasterboards at the industrial plant [26]. These boards are composed mainly of calcium sulfate dihydrate (CaSO4∙2H2O), a material with high recycling potential due to the reversibility of its chemical reactions, which allows the original material to be recovered through grinding and thermal heating processes [26].
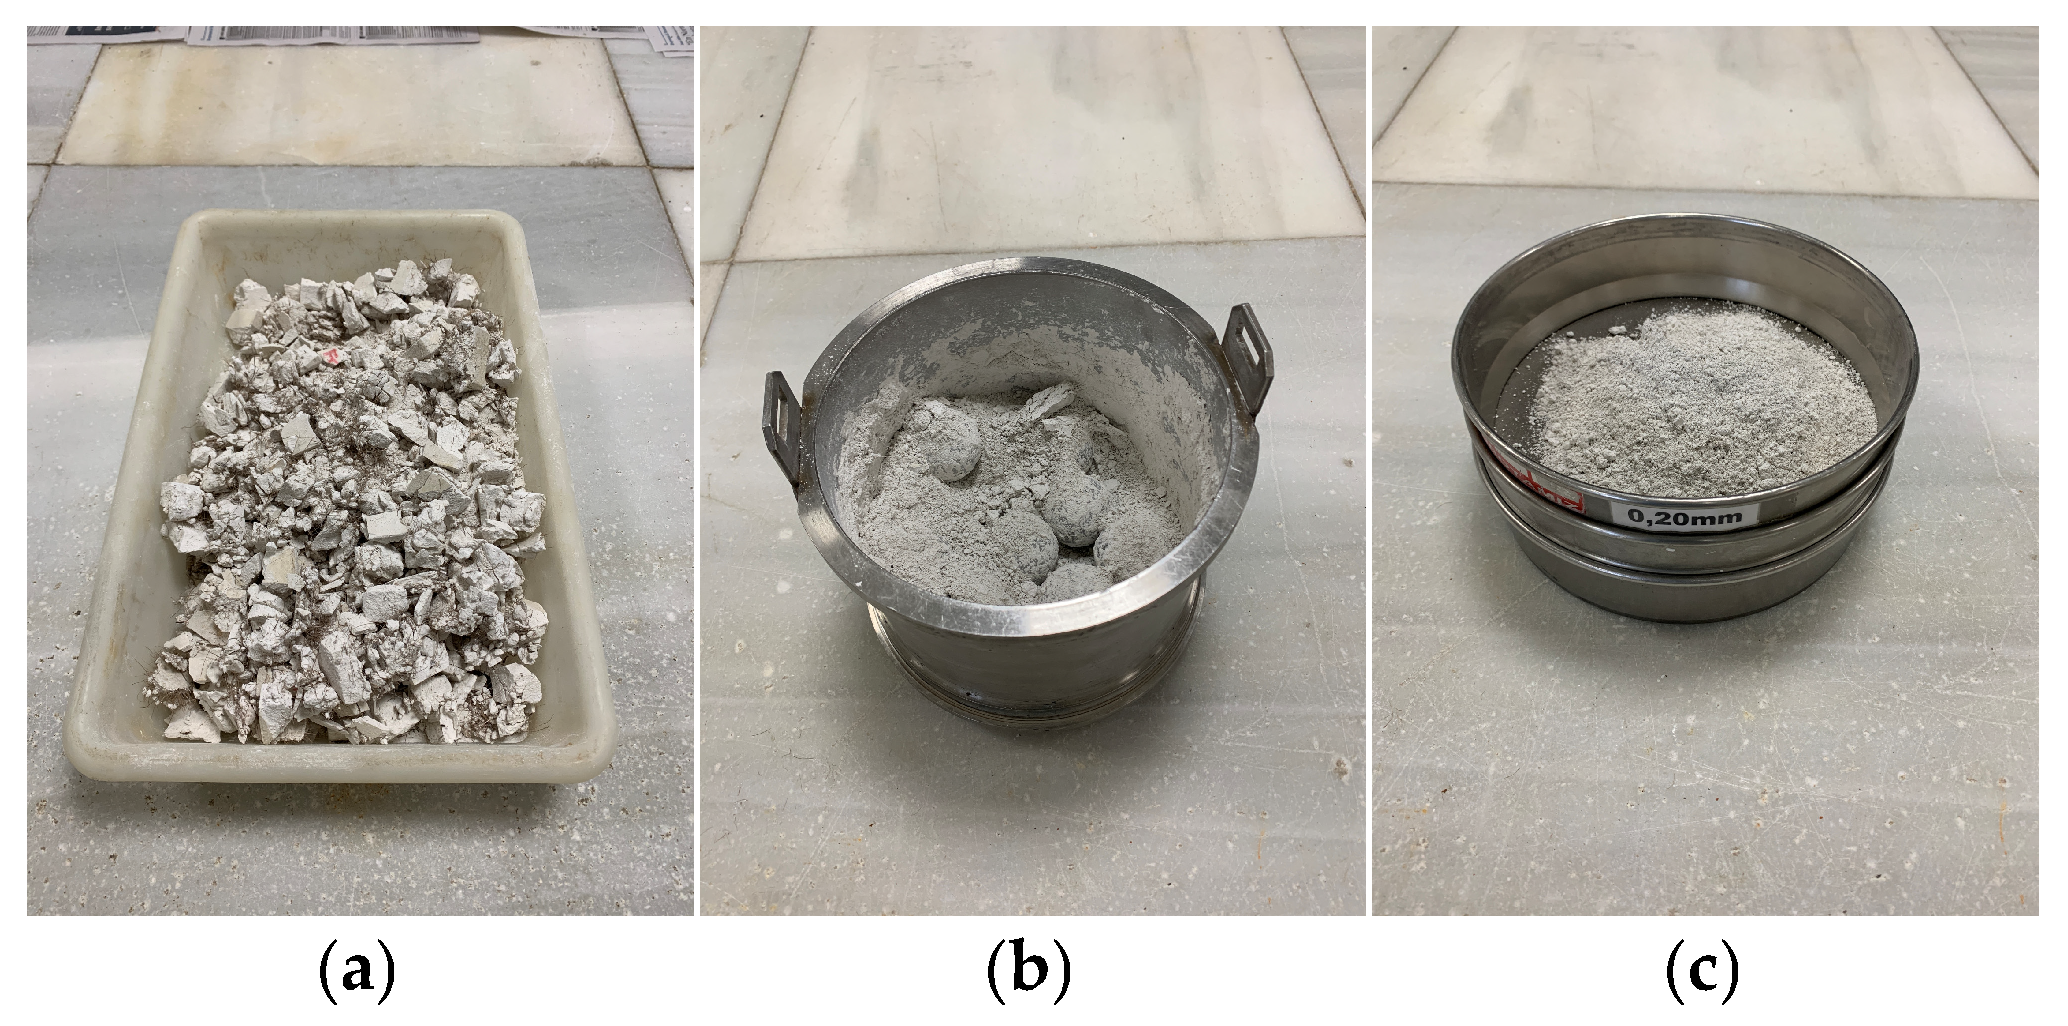
The processing of this waste involves several stages. Initially, the paper adhered to the boards was removed [26,38]. Subsequently, the waste is crushed using a jaw crusher and ground in ball mills to reduce the particle size [28]. The resulting powder is screened using a vibrating screen to ensure a particle size of less than 0.2 mm [26].
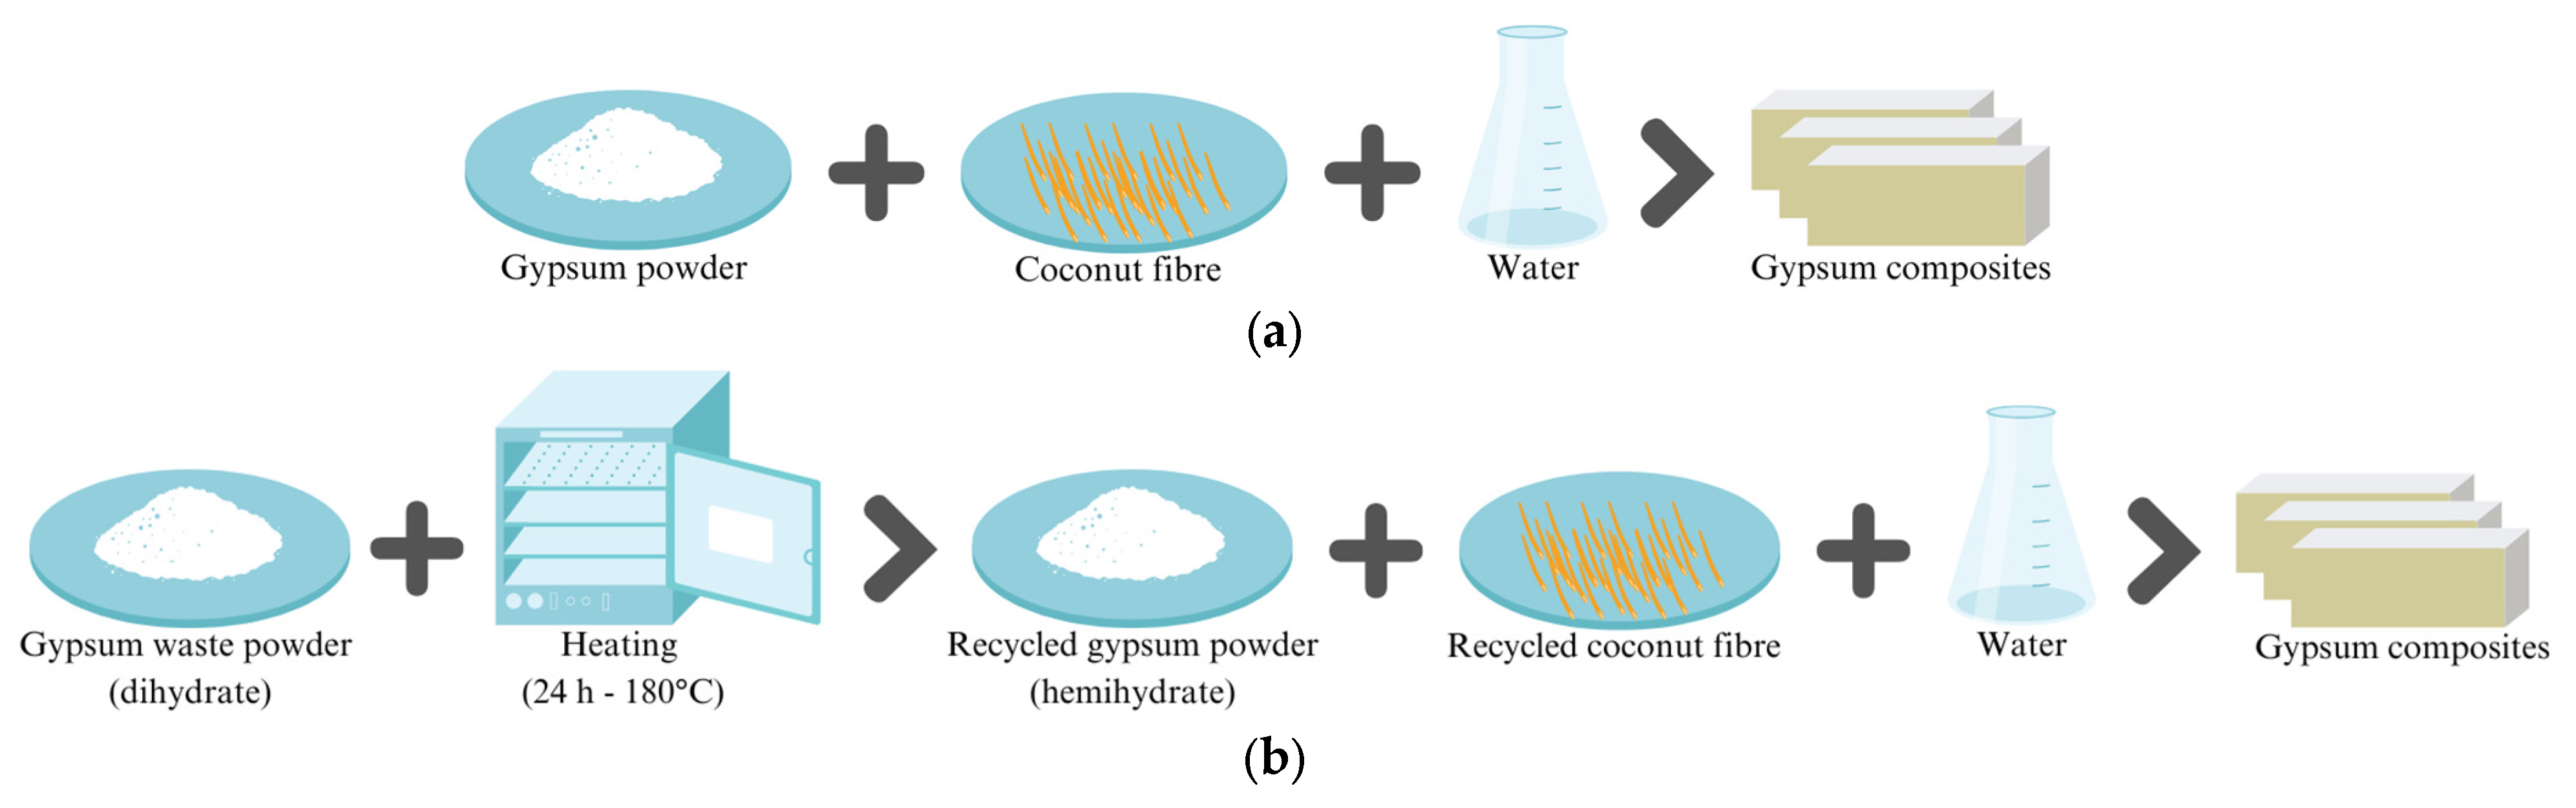
The recycling process continues with thermal treatment of the powder in an oven at 180 °C for 24 h [26,38,39], a transformation that converts calcium sulfate dihydrate into calcium sulfate hemihydrate, as corroborated by several authors and detailed in Table 3. After heat treatment, the material is stabilized by allowing it to rest for 24 h.
Compared to commercial gypsum, recycled gypsum has a finer particle size, a characteristic associated with accelerated setting times [38,40,41], which can negatively affect mixture workability [26,40].
Table 3. Summary of recycled gypsum studies: thermal treatment conditions applied during recycling processes.
ReferenceSource of Recycled GypsumTemperature (°C)
100140150100180
Time (h)
[42]Gypsum Plasterboard Waste (GPW) from the waste powder produced during the plasterboard cutting process.6 3 3
24 6 6
Flue Gas Desulphurization (FGD).6 3 3
24 6 6
[43]Flue Gas Desulphurization (FGD gypsum).6 3
24 6
Gypsum waste from plasterboard production (GPW) from the powder generated during the plasterboard cutting process at a manufacturing plant.6 3
24 6
[39]Gypsum plasterboard sheets (12.5 mm) waste from cutting or losses during the drywall ceiling installation process. 24
[44]GPW generated by local construction sites. 1
[38]Standard 12.5 mm thick gypsum plasterboard sheets from cutting or waste generated during the construction of walls and lining using drywall. 24
[45]Gypsum waste collected from civil construction projects. 0.50.50.5
1.01.01.0
1.51.51.5
2.02.02.0
2.52.52.5
3.53.53.5
[26]Waste material produced during the production of gypsum plasterboard in the factory. 24
[29]Recycled gypsum obtained from specimens made with commercial gypsum by the author. 3

2.2. Composites Preparation

In this study, two series of composites were produced: (i) composites made of commercial gypsum and recycled coconut fibers; (ii) composites made of recycled gypsum and recycled coconut fibers, whose manufacturing processes are illustrated in Figure 1. The proportions used for each type of composite are presented in Table 4 and Table 5.
In this research, the primary control parameter was the fresh-state workability (standard consistency) rather than a fixed W/B ratio. The w/b ratio for each composite was determined experimentally through trial and error, in accordance with the strict guidelines of the UNE-EN 13279-2:2014 standard [46]. In this regard, an optimal value of 0.7 was identified for commercial gypsum. The preparation of the first series of composites involved progressively replacing gypsum and water with the coconut fiber, up to a maximum of 17.5% by volume, in increments of 2.5%. A higher fiber content leads to excessive agglomeration, making mixing difficult. The nomenclature of the specimens is established as “P0.7,” indicating the W/B ratio, followed by the percentage of coconut fiber “%CF.”
For the recycled gypsum and coconut fiber composites, the W/B ratio was set at 0.90, in accordance with the UNE-EN 13279-2:2014 standard [46]. The nomenclature for the specimens was established as “RP0.9,” indicating the W/B ratio, followed by the percentage of coconut fiber “%CF.”
Sample preparation was carried out in accordance with standard UNE-EN 13279-2:2014 [46], following a protocol that ensured the homogeneity and reproducibility of the mixtures. Initially, the dry components—commercial gypsum or recycled gypsum and coconut fiber—were dry-mixed to achieve uniform distribution, after which the mixture was sprinkled over the mixing water for 30 s and allowed to rest for another 60 s before an initial 30 s of mixing. Subsequently, a further 30-s rest was incorporated, followed by a final mixing of equal duration. The mixture was poured into the mold, and air bubbles were removed by lifting the mold approximately 10 mm and dropping it 5 times (see Figure 2).
The resulting mixtures were poured into standard molds to produce test specimens for characterization tests, which, after setting, were kept under controlled laboratory conditions (23 ± 2 °C and 50 ± 5% RH) for 7 days. Finally, the specimens were oven-dried at 40 ± 2 °C for 24 h until a constant mass was reached.

2.3. Experimental Program

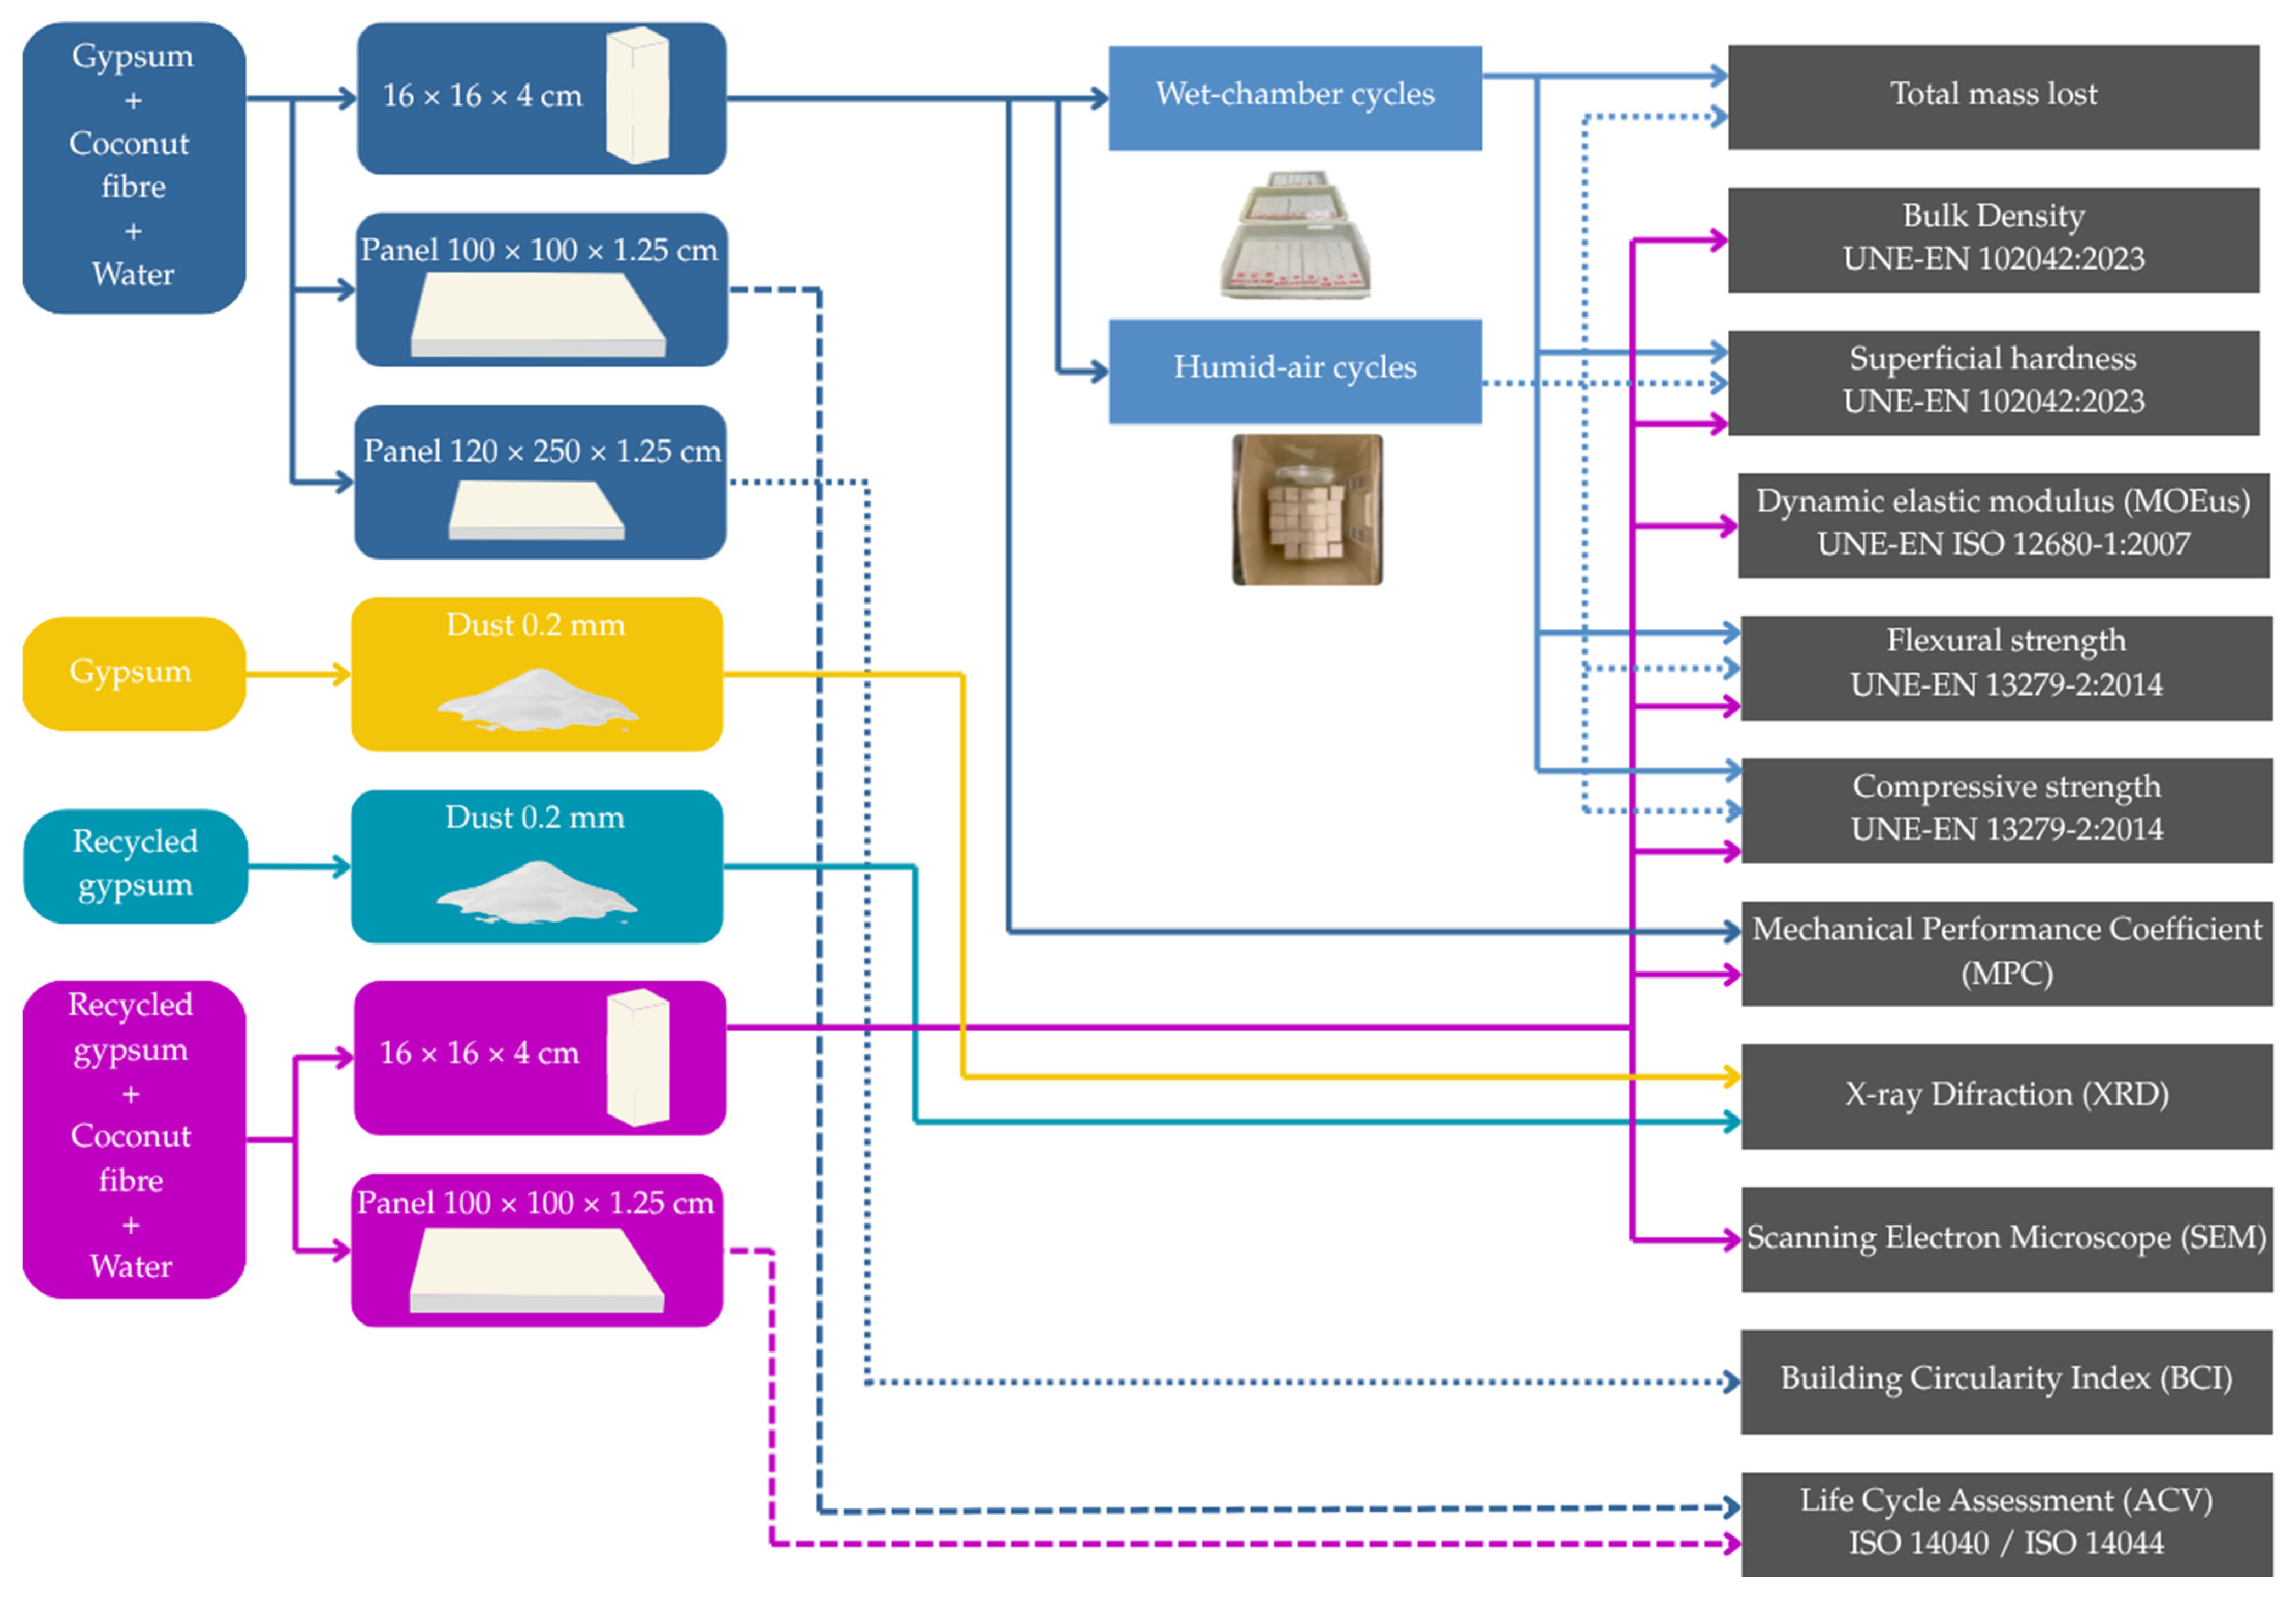
The experimental program developed in this research (Figure 3) is divided into three blocks: (i) analysis of the durability of commercial gypsum composites with coconut fiber; (ii) characterization of recycled gypsum composites with coconut fibers through the physicochemical characterization of recycled gypsum powder and the subsequent physicomechanical characterization of the resulting composites; and (iii) environmental assessment of the manufactured composites, analyzing recyclability and LCA.

2.3.1. Durability of Gypsum Composites with Coconut Fibers

  • Water-oven cycles: This is a non-standardized test designed by del Río Merino [51], which allows for the analysis of the physical stability and mechanical performance of the composites after exposure to controlled cycles. For each dosage, three standardized prismatic test specimens measuring 4 × 4 × 16 cm were prepared for the control group (not subjected to cycling), and another three test specimens were prepared for the group subjected to accelerated aging. For each formulation, standardized prismatic specimens measuring 4 × 4 × 16 cm were prepared, forming a control group without treatment and another group subjected to three 48-h cycles. The cycles consisted of 24 h of immersion in water, followed by 24 h of drying in an oven at 40 ± 2 °C and 50 ± 1% relative humidity. Upon completion of the cycles, the samples were evaluated and compared with the control group to determine total mass loss, surface hardness, flexural strength, and compressive strength.
  • Wet–dry cycles: This is an accelerated aging test in which, for each dosage, three standardized prismatic test specimens measuring 4 × 4 × 16 cm were prepared for the control group (not subjected to cycling) and another three for the group subjected to aging. The test specimens were subjected to 40 cycles [51]. Each cycle included a 24-h phase at 90 ± 5% relative humidity and 20 ± 2 °C, followed by a 24-h phase at 55 ± 5% relative humidity and 18 ± 2 °C. In each series, three specimens were tested per batch. Upon completion of the cycles, the properties of total mass loss, density, surface hardness, flexural strength, and compressive strength were evaluated and compared with a control series.

2.3.2. X-Ray Diffraction (XRD)

XRD-based mineralogical characterization was used to identify the crystalline phases and mineral composition of gypsum in both the commercial and the recycled gypsum [26,27,28,42,43]. This analysis evaluates the efficiency of recycling by verifying the conversion of calcium sulfate dihydrate (CaSO4∙2H2O) into the hemihydrate phase (CaSO4∙½H2O), which constitutes the desired binder, as well as anhydrite forms (CaSO4III and CaSO4II), and impurities that may influence its properties, such as calcite (CaCO3), quartz (SiO2), dolomite (CaMg(CO3)2), alkali feldspars, and phyllosilicates [26,27,28,41,42]. For analysis, the samples were ground and subsequently sieved to obtain a fine powder with a particle size of less than 0.2 mm.

2.3.3. Physical-Mechanical Characterization

  • Bulk density: Density was determined in accordance with UNE 102042:2023 [47] as the ratio of the dry mass to the volume of the specimens, using prismatic test specimens of standardized dimensions (4 × 4 × 16 cm). The dry mass was measured using an electronic balance (Europe 3000 RH, Gibertini, Novate Milanese, Italy) with a precision of ± 0.01 g, and the dimensions were recorded with a digital caliper with a precision of ± 0.01 mm, thereby allowing the specimen’s total volume to be calculated. Density was recorded as the average value of three specimens for each formulation evaluated.
  • Surface hardness: Surface hardness was determined in accordance with the UNE 102042:2023 standard [47]. Three standardized prismatic specimens measuring 4 × 4 × 16 cm were used for each batch. Measurements were taken with a Shore C durometer (Baxlo Precisions, Barcelona, Spain) on two parallel longitudinal faces of each specimen, with five measurements per face and a minimum distance of 2 cm from the edges and between measurement points. The final result was obtained by averaging all measurements.
  • Dynamic Modulus of Elasticity (MOEus): This test was used to analyze the influence of coconut fiber incorporation on the elasticity of composites made with recycled gypsum, following the specifications of the UNE-EN ISO 12680-1:2007 standard [48]. Three standardized prismatic specimens measuring 4 × 4 × 16 cm were used for each batch. Measurements were taken using an Ibertest Ultrasonic Tester E46 (Ibertest, Madrid, Spain) (220 V, 50 Hz) along the longitudinal axis of the specimens. Vaseline was applied to the interface to optimize coupling between the probes and the specimen surface.
  • Flexural strength: The test was conducted in accordance with the specifications of standard UNE-EN 13279-2:2014 [46], using standardized prismatic specimens measuring 4 × 4 × 16 cm, and was performed on an Ibertest AUTOTEST 200-10SW universal hydraulic press (Ibertest, Madrid, Spain) with a maximum capacity of 10 kN. For each formulation, three specimens were evaluated, and the strength was calculated as the average of the obtained values.
  • Compressive strength: This test was conducted in accordance with the UNE-EN 13279-2:2014 [46] standard, using the two halves resulting from the flexural test. The equipment used was an AUTOTEST 200-10SW universal hydraulic press from Ibertest. For each mix, six specimens were tested by applying an axial load at a constant rate of 20 N/s, and the final result was recorded as the average compressive strength obtained.
  • Mechanical Performance Coefficient (MPC): In order to gain a deeper understanding of the technical efficiency of the developed mixtures and to standardize the impact of variations in the matrix and the water-to-binder ratio, the MPC was determined. This analysis is based on the concept of the “appropriate lightweighting coefficient” originally proposed by del Río Merino [51] and adapted in recent studies on the optimization of lightweight plasters [52], which establish that the strength of plaster depends primarily on its porosity and, therefore, on its density.
The MPC allows for a standardized evaluation of the contribution of coconut fiber reinforcement relative to the material’s mass, facilitating an objective technical comparison between the different formulations in the recycled gypsum series (5%, 10%, and 15% fiber) produced in this study and the equivalent formulations in the commercial gypsum series (5%, 10%, and 15% fiber), the results of which were previously reported by the authors [16]. The coefficient was calculated for flexural strength ( K f l e x ) and compressive strength ( K c o m p ) using Equations (1) and (2):
K f l e x =   σ f l e x ρ
K c o m p = σ c o m p ρ
where σ f l e x   is the flexural strength (MPa), σ c o m p is the compressive strength (MPa) and ρ is the bulk density (g/cm3). This parameter serves as an indicator of structural efficiency, identifying formulations that indicate a favorable trend in the strength-to-weight ratio for use in lightweight construction systems.
  • Scanning Electron Microscopy (SEM): Analysis using SEM allowed us to examine the morphology and internal structure of the composites made from recycled gypsum, evaluating aspects such as coconut fiber integration into the matrix, crystal arrangement, and pore distribution. A Jeol JSM-820 microscope (Jeol, Tokyo, Japan), operated at 20 kV and equipped with an X-ray energy-dispersive analysis system (EDX, Oxford Instruments, Abingdon, UK), was used for observation. Before analysis, the specimens were coated with a thin gold film using a Cressington 108 metallizer (Cressington Scientific Instruments, Watford, UK) to ensure adequate electron beam conductivity.

2.3.4. Environmental Assessment

  • Building Circularity Index (BCI): The BCI is a metric that quantifies the circularity potential of a building, construction system, or building material throughout its life cycle as a percentage [30,53,54]. The BCI methodology is based on calculating the average percentage of Materials Recovered and Materials Returned by mass, as given by Equation (3).
B C I = M a t e r i a l s   R e c o v e r e d   · 0.5 + M a t e r i a l   R e t u r n e d   · 0.5
“Materials Recovered” refers to the input phase and represents the proportion of materials entering the system from circular or reusable sources. On the other hand, Materials Returned refer to the output phase and quantify the proportion of materials that, at the end of their life cycle, can be reincorporated into other production cycles. Materials are classified and assigned predetermined weighting factors at both the source and the end of their useful life (Table 6).
Input phase (Materials Recovered):
M a t e r i a l s   R e c o v e r e d = R e n + R e c + R e u + V i g i n T o t a l m i
M a t e r i a l s   R e c o v e r e d = 1 · R e n + 1 · R e c + 1 · R e u + 0 · V i g i n R e n + R e c + R e u + V i r g i n
where R e n   = input of renewable material; R e c = input of recycled material; R e u = input of reused material; V i r g i n = input of virgin material; T o t a l m i = total input of materials (renewable, recycled, reused, and virgin).
The BCI calculation is limited to the flow of technical and biological materials that constitute the mass of the finished product. Under this approach, the mixing water used in manufacturing is defined as a process flow that does not constitute the physical mass recoverable from the panel at the end of its useful life. Therefore, the water consumed is classified as a complementary impact indicator, whose assessment is independent and specific, such as the calculation of the water footprint [55,56].
In the end-of-life phase (Material Returned):
M a t e r i a l   R e t u r n e d =   O R e u   + O R e c   + D o w   + E r T o t a l m o
M a t e r i a l   R e t u r n e d = 1 · O R e u + 1 · O R e c + 0.5 · D o w + 0.5 · E r O R u e + O R e c + D o w + E r + D i s
where O R e u = output material for reuse; O R e c = output material for recycling; D o w = output material for “downcycling” (lower-quality recycling); E r = output material for energy recovery; T o t a l m o = total output (materials for reuse, recycling, “downcycling,” and energy recovery); and D i s = materials disposed of.
The analysis was conducted to determine the amount of gypsum and coconut fiber that could be recovered at the end of the panel’s life cycle and reintroduced into the manufacturing process. The expected service life of an interior panel made of gypsum under standard conditions is estimated at 27 years [57]; at the end of this cycle, part of the panel is recycled (gypsum, coconut fibers), and the remaining materials are disposed of through waste management. The case study is based on a panel measuring 120 × 250 × 1.25 cm. The complete list of material quantities used to manufacture this panel is presented in Table 7.
  • Life Cycle Assessment (LCA): This is a standardized methodology used to comprehensively evaluate the environmental impact of a product or service, following ISO 14040 and ISO 14044 standards [49,50]. In this study, the objective of the LCA was to study and compare three different proportions of recycled coconut fiber in composites with commercial gypsum and recycled gypsum. Furthermore, a “cradle-to-gate” approach was employed, using the cut-off principle [8,49], according to which recycled materials enter the system with zero environmental impact, and only the impacts associated with processing and transportation operations carried out within the system’s boundaries are accounted for. In the scenario studied, coconut fiber waste is generated during the industrial processing of products made from these fibers (organic mats and rolls) and cannot be reintroduced into the production process due to its short length. Meanwhile, gypsum waste is generated during gypsum board production and is recycled at the same factory. In this regard, for recycled gypsum, crushing and grinding, thermal treatment, and screening were considered; for obtaining recycled coconut fibers, the impacts of cutting and transport were considered. Regarding transport logistics, the model was based on a gypsum factory located in Madrid (Spain) and the average distance to domestic coconut fiber product manufacturers in Spain. It is important to highlight that this study utilizes waste fibers generated as a by-product during the manufacturing of coconut fiber boards. Since the international transport and raw material importation are fully allocated to the primary commercial products, these waste fibers enter our system boundary with zero initial burden at the Spanish manufacturing sites, in accordance with the cut-off allocation approach. The Spanish energy mix was used to meet electricity consumption loads (regarding the energy consumption involved in panel manufacturing, as well as the recycling process for recycled materials). The defined functional unit is 1 m2 of 12.5-mm-thick board intended for lightweight partitions. Table 8 presents the life-cycle inventory (LCI) of inputs to the system for each component analyzed. The sources of the data for raw materials were drawn from existing EPDs of Spanish companies (in the case of commercial gypsum) [58], in accordance with the standard EN15804:2012 [8], and the remaining materials were obtained from the Ecoinvent v3.10 database using SimaPro software version 9.5 (PRé Sustainability, Amersfoort, The Netherlands) [59]. The methodology used to determine the potential environmental impacts was CML-IA baseline v3.10 [60], and the following categories were analyzed: Global Warming Potential (GWP); Abiotic Depletion Potential of Fossil Fuels (ADP_ff); Ozone Depletion Potential (ODP); Acidification Potential (AP); Eutrophication Potential (EP); and Tropospheric Ozone Formation Potential (POCP).

3. Results and Discussion

3.1. Durability

3.1.1. Water-Oven Cycles

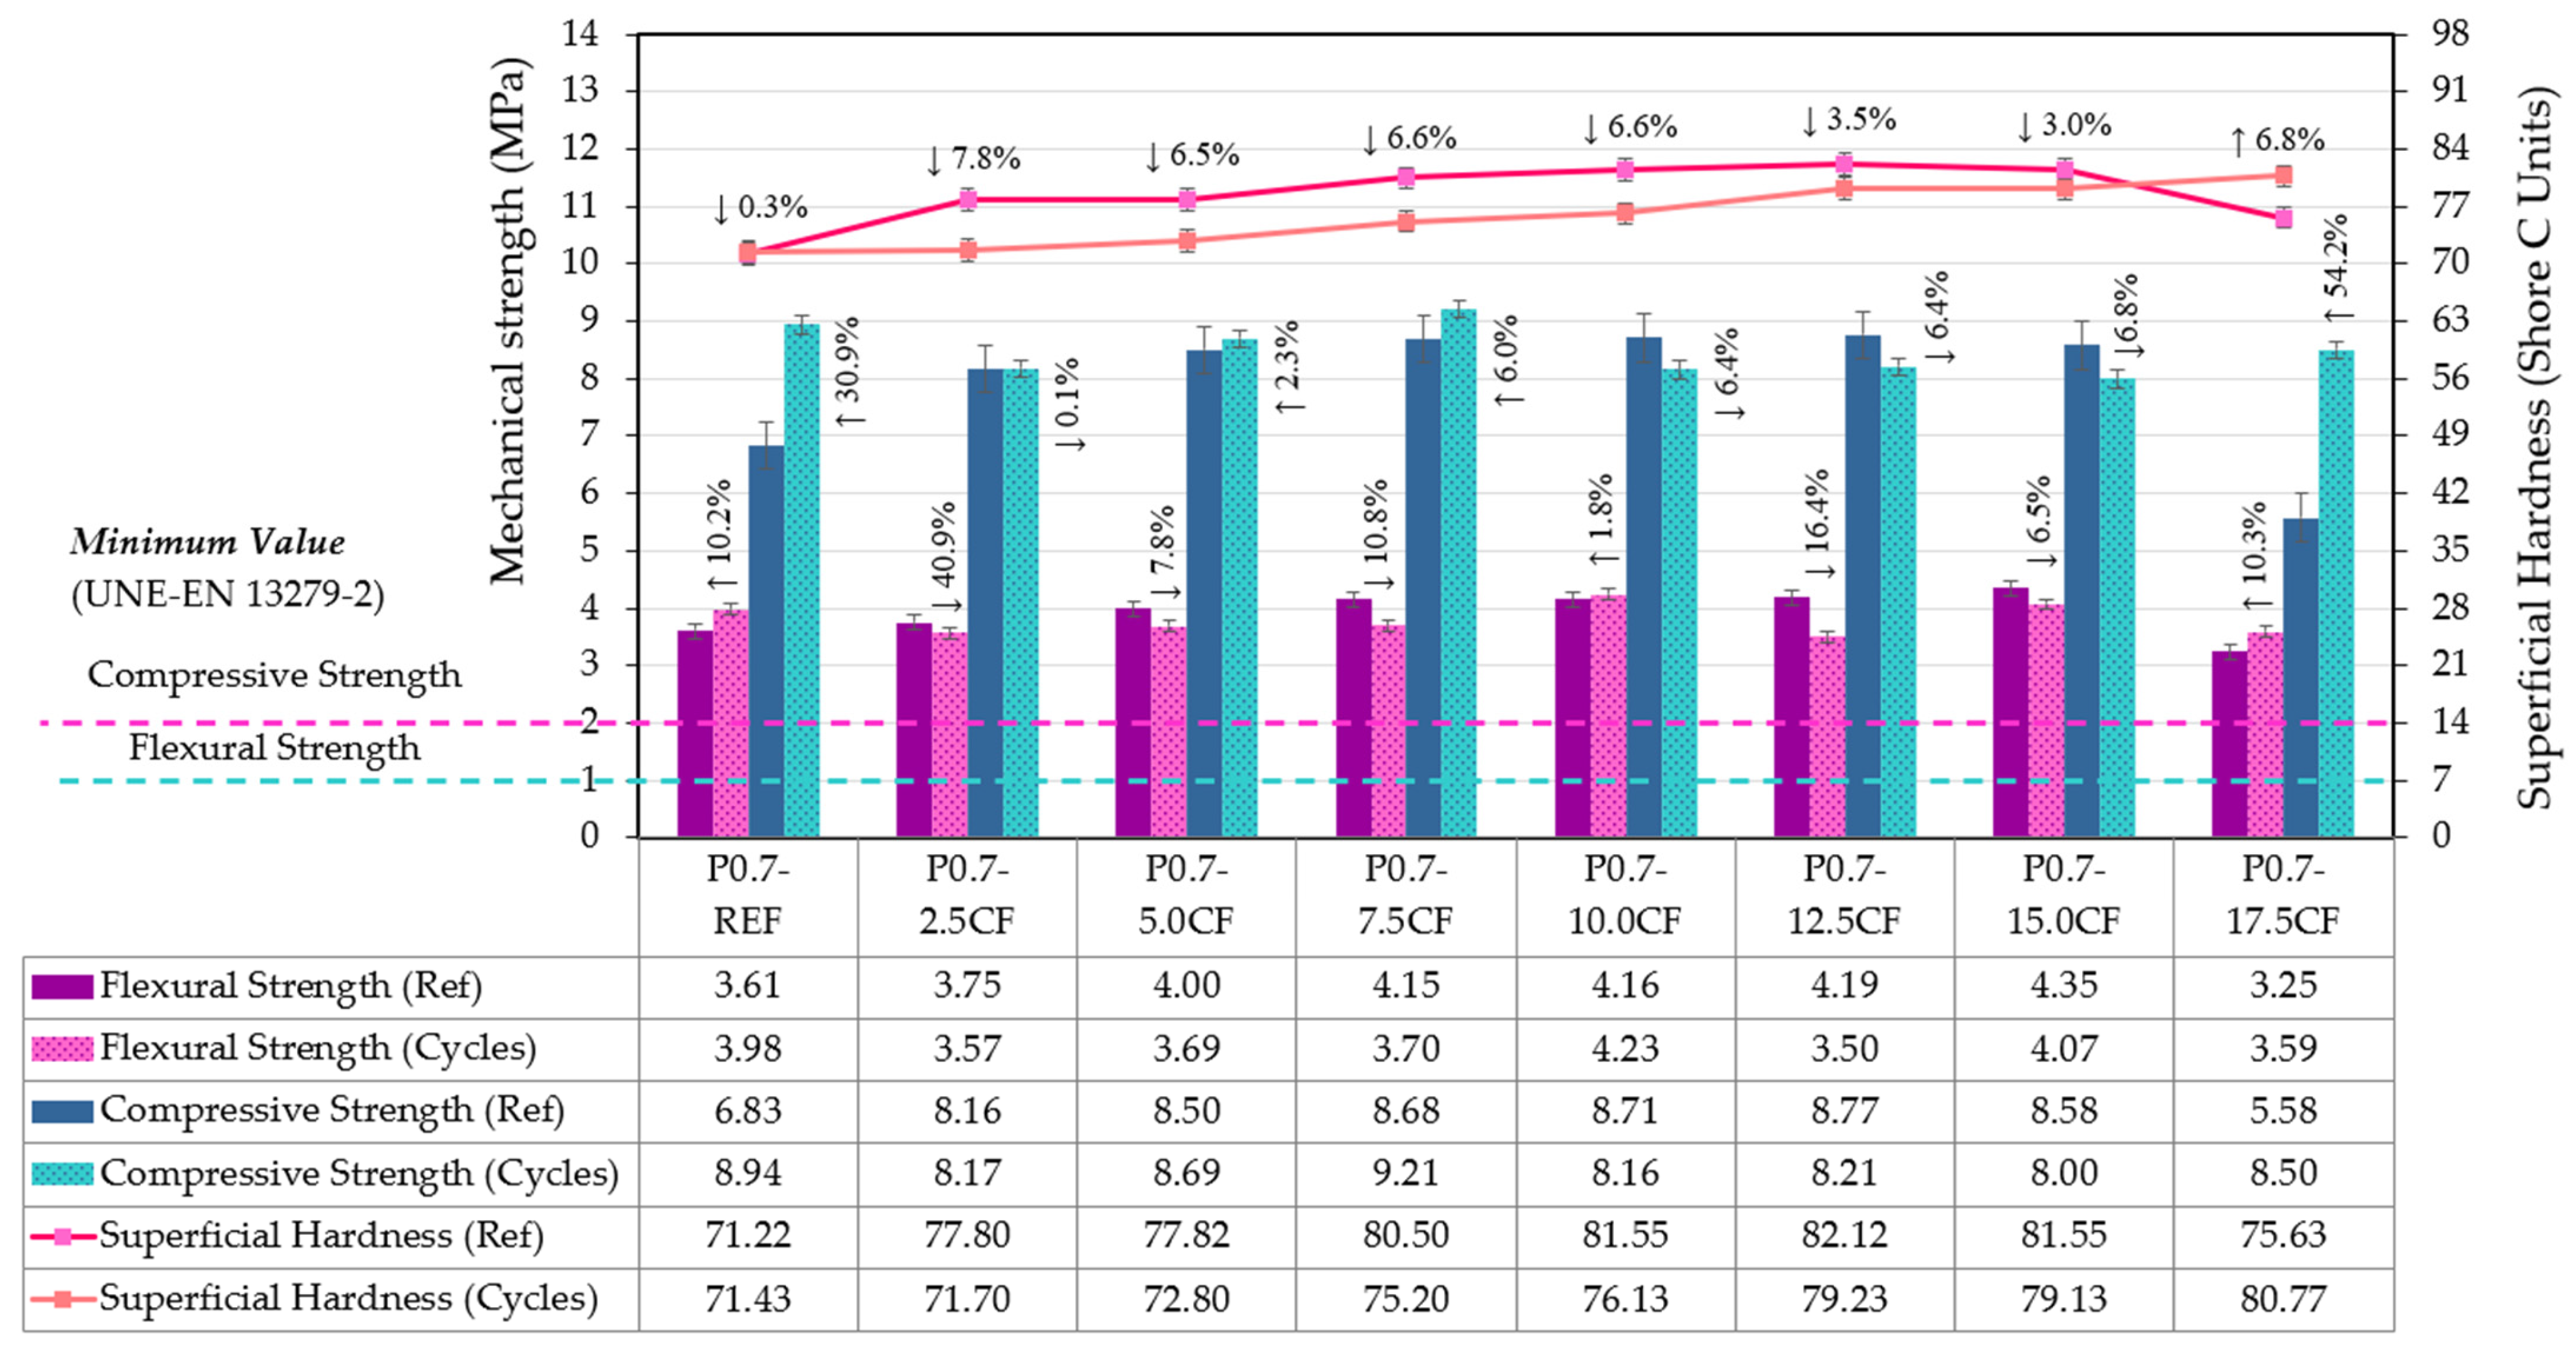
The gypsum composites with coconut fibers were subjected to three successive cycles of water immersion and oven drying, and weight changes, surface hardness, flexural strength, and compressive strength were evaluated relative to the reference specimens that were not subjected to the test. The data on mass variation are presented in Table 9. At the same time, the evolution of the flexural and compressive strength of the composites before and after the water-oven cycles is shown in Figure 4, with error bars based on the standard deviation.
The reference mixture (P0.7-REF) exhibited a mass loss of 5.4%. This behavior is consistent with the findings reported by Leiva [21], whose reference mixture showed a 6.8% decrease. In contrast, the fiber-reinforced mixtures showed greater stability, with notably smaller mass variations, similar to those observed in specimens reinforced with other agroindustrial recycled materials [21]. Furthermore, it was observed that the 2.5%, 12.5%, and 17.5% dosages showed a slight increase in mass after the cycles, attributable to the hygroscopic nature of coconut fiber, which retains water within its structure. A similar behavior was observed in specimens with whole rice husks [21], where a moderate increase in mass (1.1 g) was recorded. These results indicate that lignocellulosic reinforcements, by swelling and contracting during cycles, can absorb some of the remaining water and slightly alter the final mass without compromising the integrity of the composite. Consequently, the incorporation of natural fiber acts as a hygrothermal stabilizer, mitigating degradation effects, reducing net mass loss, and enhancing material durability.
Surface hardness tests showed a consistent decrease across all formulations, with reductions ranging from 1.8% (P0.7-17.5CF) to 16.6% (P0.7-10.0CF), corresponding to decreases of 8 to 14 Shore C units. This behavior is consistent with the results reported for composites reinforced with plastic waste [20], which showed reductions of approximately 5–8 Shore C units compared to the reference.
About flexural strength, all formulations met the minimum standard of 1 MPa specified in UNE-EN 13279-2:2014 [46]. The reference specimen showed a 27.4% reduction, while losses in the coconut fiber series varied with dosage. The recorded data suggest that mixtures with low fiber content (2.5–12.5%) tended to exhibit smaller reductions than the reference. In comparison, the formulation with the highest fiber content (15.0%) exhibited more pronounced decreases, suggesting that high fiber proportions may induce excessive porosity and loss of matrix cohesion. Atypically, specimen P0.7-17.5CF experienced an increase from 3.25 to 5.04 MPa; this post-cycle strength increase has been previously reported in gypsum composites with plant fiber additions [21], where increases in flexural strength were recorded following water-oven cycles. In general, the observed strength losses were lower than those reported for composites reinforced with plastic [20] and plant [21] waste, indicating that incorporating this type of lignocellulosic fiber improves post-cycle mechanical stability.
An apparent behavior was observed in compressive strength, with test specimens showing moderate decreases comparable to those of the control group. The fiber-free specimen showed a decrease of 21.7%, while the mixtures with fiber content between 2.5% and 12.5% exhibited losses ranging from 18.5% to 27.7%, lower than those observed in plastic-reinforced composites [20] and within the range of plant-based composites [21]. The specimen with 15% coconut fiber showed the greatest decrease in the entire series (41.8%), while, atypically, the P0.7-17.5CF specimen recorded an increase of 10.5%. Despite these variations, all specimens maintained values above the minimum standard of 2 MPa specified in UNE-EN 13279-2:2014 [46], demonstrating the fiber’s stabilizing contribution.

3.1.2. Wet–Drying Cycles

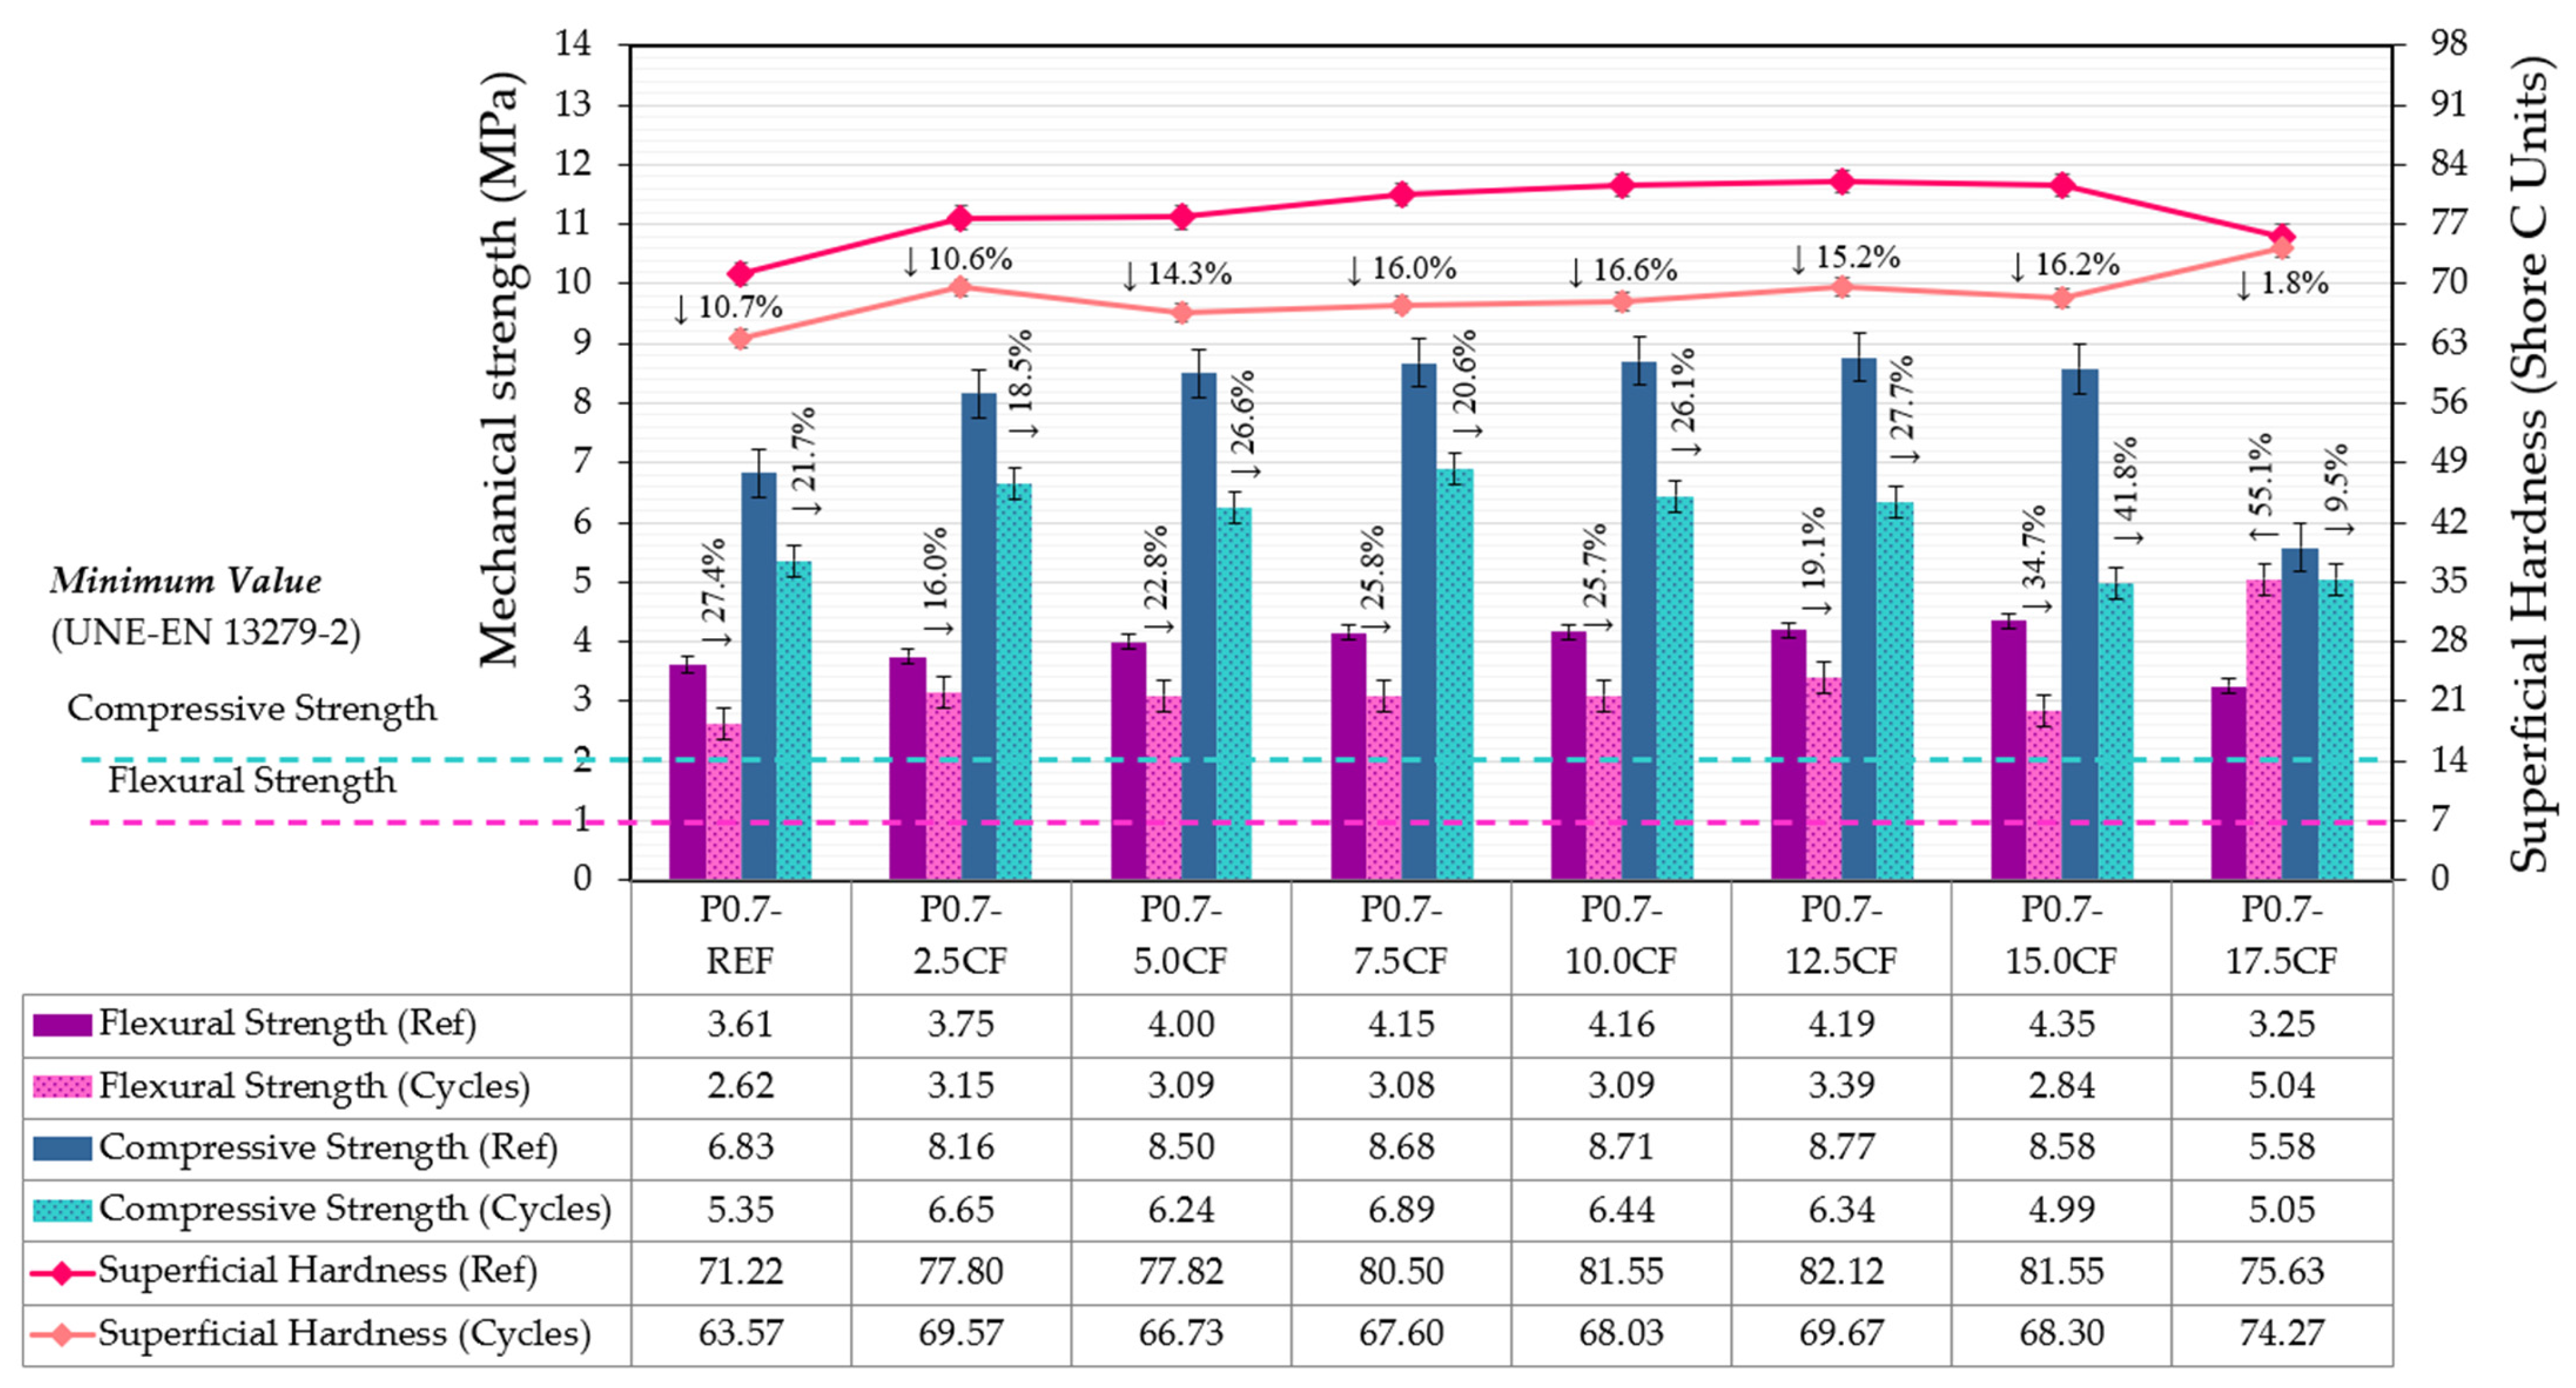
To evaluate the effect of accelerated aging, a regimen of 40 successive wet–dry cycles was applied to gypsum composites with coconut fiber. After the process, the values for mass, surface hardness, and mechanical strength were compared with those of the reference specimens not subjected to the cycles. The results obtained show, on the one hand, the evolution of mass (Table 10) and, on the other, the variations in hardness and mechanical behavior under bending and compression (Figure 5).
The reference sample showed a 2.4% decrease in mass. In contrast, the mixtures with coconut fiber showed moderate increases, ranging from 1.1% to 2.0% (P0.7-15.0CF to P0.7-5.0CF), and a more pronounced increase of 12.5% in the formulation with the highest fiber content (P0.7-17.5CF). In comparison, composites made with plastic cable waste reported increases of up to 2.6% [20], while materials reinforced with rice husks showed increases of 3.0% [21], indicating greater hygrothermal stability of the coconut fiber mixtures under humidity cycles.
Reductions in surface hardness in the fiber-containing formulations ranged from 7.8% (P0.7-2.5CF) to 3.0% (P0.7-15.0CF), showing a decreasing trend as the fiber content increased. All specimens maintained values above 70 Shore C units. Similar losses have been observed in gypsum composites reinforced with ELT textile fibers [22] and plastic cable waste [20], while materials with recycled EPS solution exhibited notably greater reductions, reaching up to 18.2% [22]. In particular, the specimen with the highest fiber content (17.5%) showed a 6.8% increase; similar behavior was observed in composites with added rice husks [21].
In terms of flexural strength, all formulations exceeded the minimum standard value of 1 MPa [46]. The reinforced mixtures exhibited decreases ranging from 4.9% (P0.7-2.5CF) to −16.4% (P0.7-12.5CF). The formulation with 12.5% coconut fiber recorded the greatest loss, although this was lower than that observed in rice husk composites (−20.9%) [21]. The mixture with 17.5% coconut fiber showed a 10.4% increase, attributable to fiber-reorganization phenomena induced during pouring into the mold. These results confirm that coconut fiber not only mitigates strength loss but, at high levels, can even improve it after accelerated aging.
Regarding compressive strength, all formulations far exceeded the minimum requirement of UNE-EN 13279-2:2014 (≥2 MPa) [46]. Mixtures with low coconut fiber concentrations (2.5% to 7.5%) showed increases of up to 6.1%, while formulations with medium fiber contents (10.0% to 15.0%) exhibited average reductions of 6.5%. These decreases were considerably lower than those observed in composites with plastic waste [20], where reductions reached up to 29.2%, or in materials with rice husks [21], with reductions ranging from 1.6% to 64.2%. Similarly, composites reinforced with recycled EPS and textile fibers [22] or ELT rubber [23] exhibited losses ranging from 29.2% to 38.8% [22] and from 8.9% to 30.5% [23], respectively. This behavior indicates that up to 7.5% coconut fiber addition could notably stabilize compressive strength against moisture cycles.

3.2. Physicochemical Characterization of Recycled Gypsum Powder

To evaluate the suitability of recycled gypsum for composite production, a physicochemical characterization was performed using X-ray diffraction (XRD). This study identified the crystalline phases present in the recycled powder after heat treatment, verifying the chemical transformation of calcium sulfate dihydrate (CaSO4∙2H2O) into the hemihydrate phase (CaSO4∙½H2O), which is necessary to ensure its binding capacity and structural performance.

XRD of Commercial Gypsum and Recycled Powder

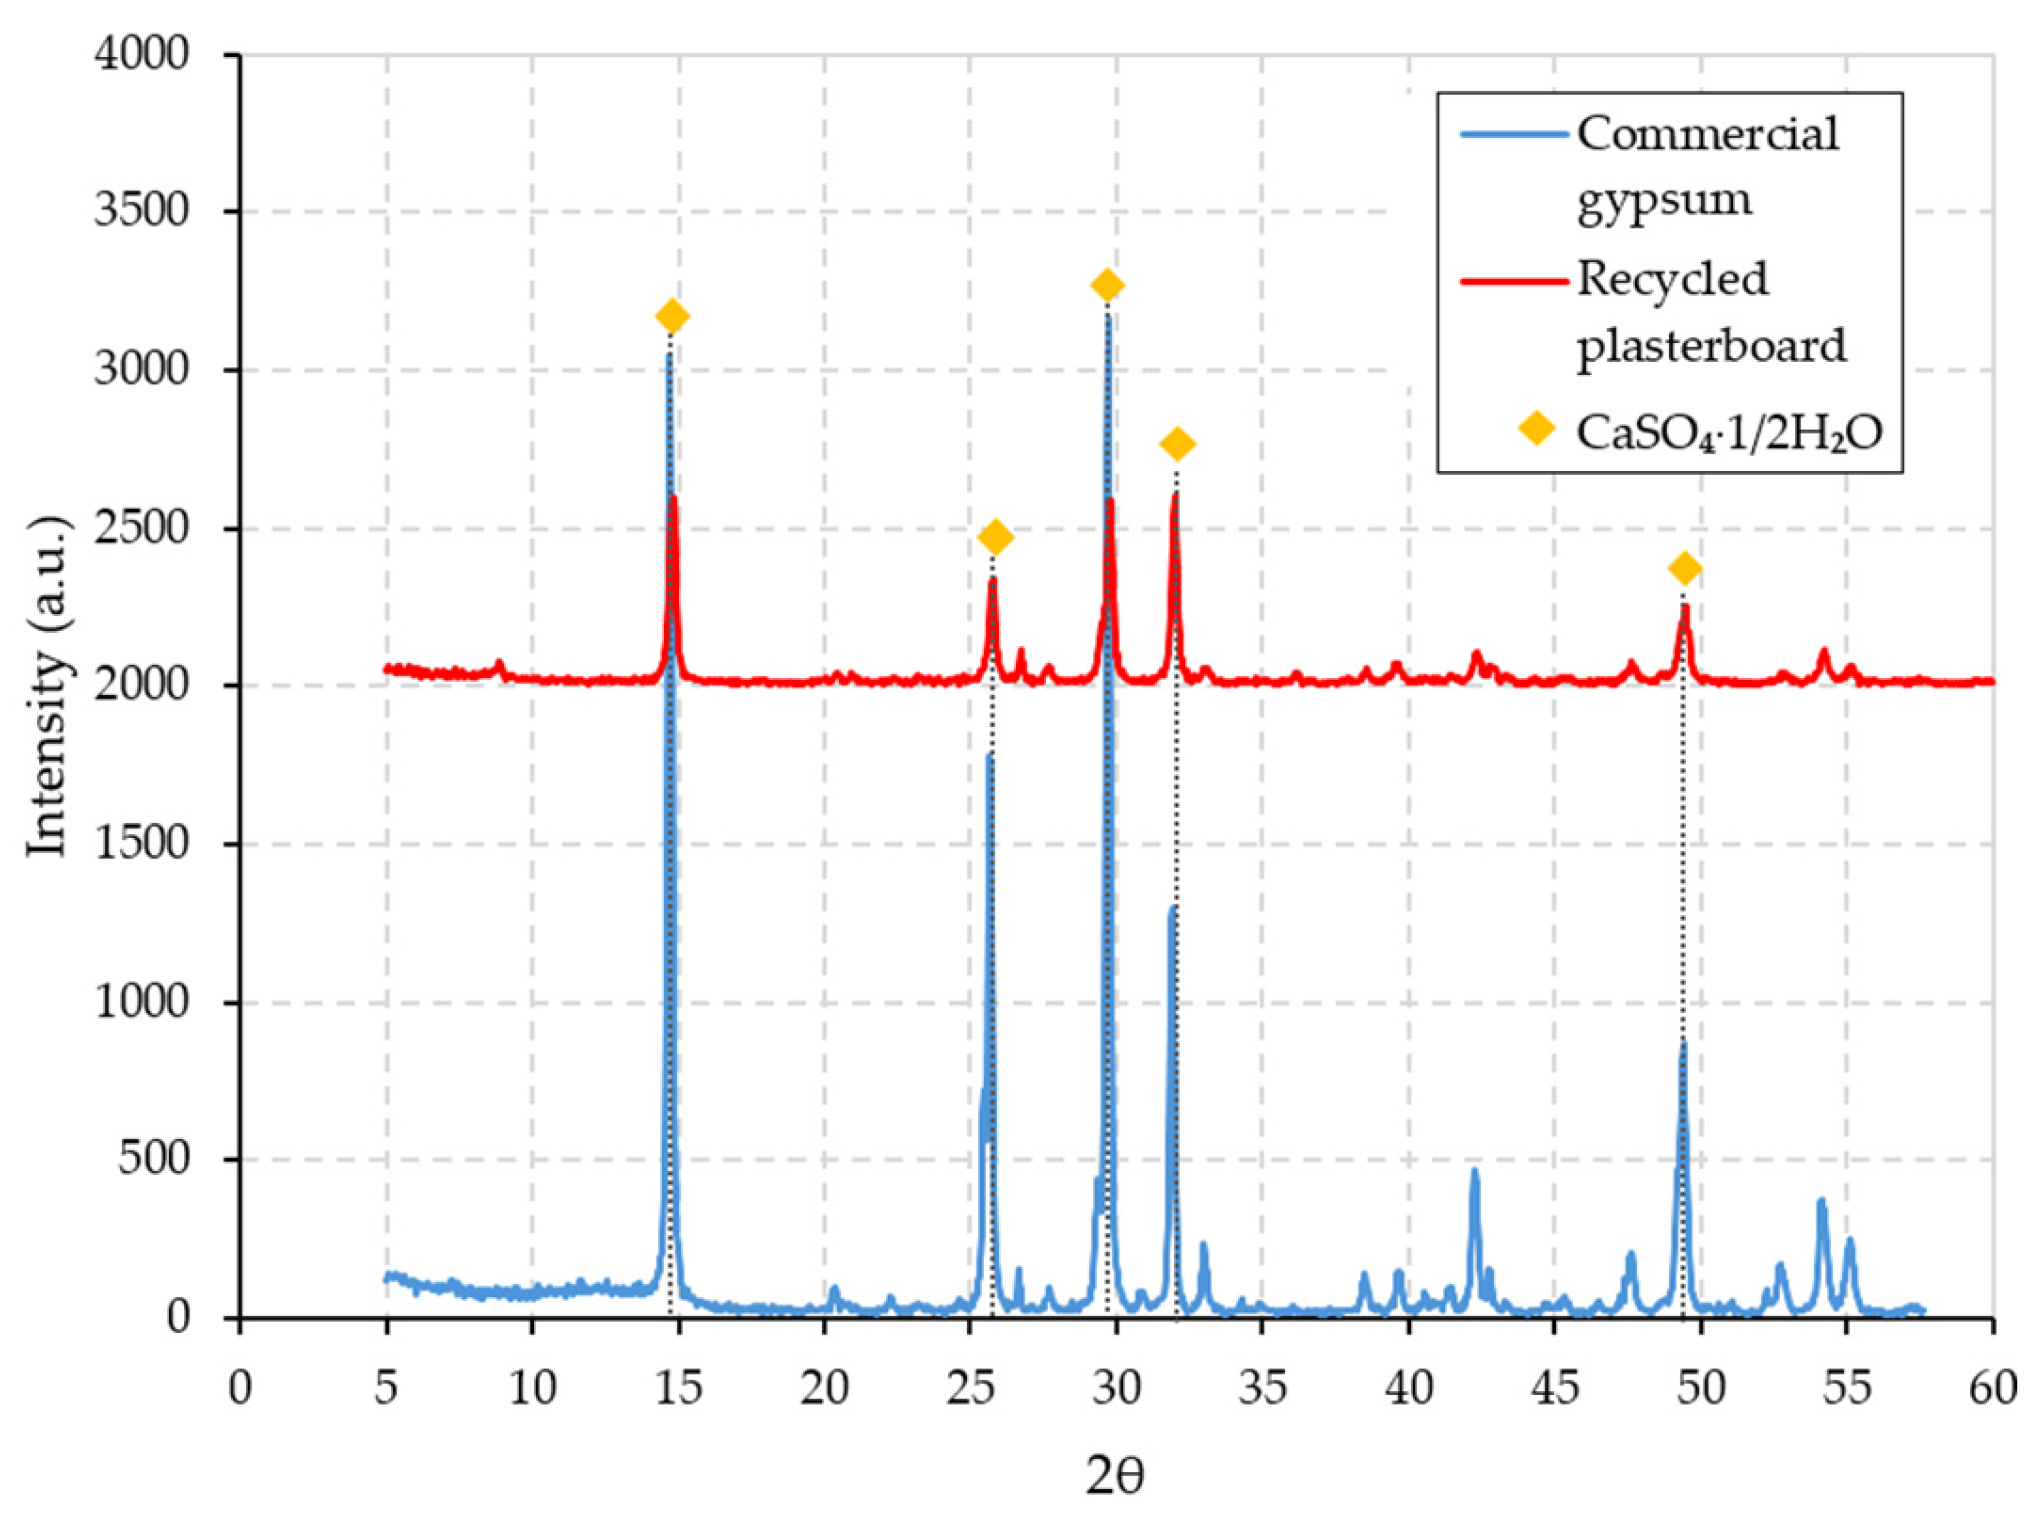
X-ray diffraction (XRD) analysis was performed using a Siemens Krystalloflex D5000 diffractometer (Siemens AG, Karlsruhe, Germany) equipped with a Cu-Kα radiation source and a graphite monochromator (λ = 0.154056 nm). Prior to analysis, the samples were ground and sieved through a 0.3 mm mesh sieve. The diffractograms were recorded over a 2θ range from 5° to 60°, using a step size of 0.04° and a counting time of 4 s per step. The crystalline phases present in the analyzed materials were identified by comparing the obtained diffraction patterns with the reference files available in the International Center for Diffraction Data Powder Diffraction File database (ICDD PDF). Figure 6 shows the diffractograms obtained from commercial gypsum (gypsum sulfate hemihydrate) and recycled gypsum powder after heat treatment.
As shown in Figure 6, the main crystalline structures identified correspond to calcium sulfate hemihydrate (CaSO4∙½H2O) for both commercial and recycled gypsum powder, with no peak corresponding to the initial dihydrate mineral (CaSO4∙2H2O) observed in the recycled material. These results confirm that the applied heat treatment yields a material suitable for producing gypsum composites similar to those obtained from virgin raw material [61].

3.3. Physical and Mechanical Characterization of Specimens Containing Recycled Gypsum

Once XRD confirmed the chemical suitability of the recycled gypsum, prismatic specimens were prepared incorporating coconut fiber at 5.0%, 10.0%, and 15.0%. For these specimens, the density, surface hardness, dynamic modulus of elasticity (MOEUS), flexural strength, and compressive strength were determined. Additionally, one of the halves from the specimens tested for flexural strength (15.0%) was analyzed by SEM to examine the internal morphology and fiber–matrix interactions. The results were compared with those of the reference specimen (without fiber content), enabling evaluation of the impact of using recycled gypsum as a binder on the physical and mechanical properties of the composites.

3.3.1. Bulk Density

The density (Table 11) showed a progressive reduction compared to the reference specimen (1094.01 kg/m3) [16]. The formulations recorded values representing decreases ranging from 7.9% to 24.2%. The noted pattern coincides with that reported by Zaragoza-Benzal et al. [26], who documented reductions of up to 26.6% when incorporating recycled EPS into the recycled gypsum binder.

3.3.2. Flexural Strength and Dynamic Elastic Modulus

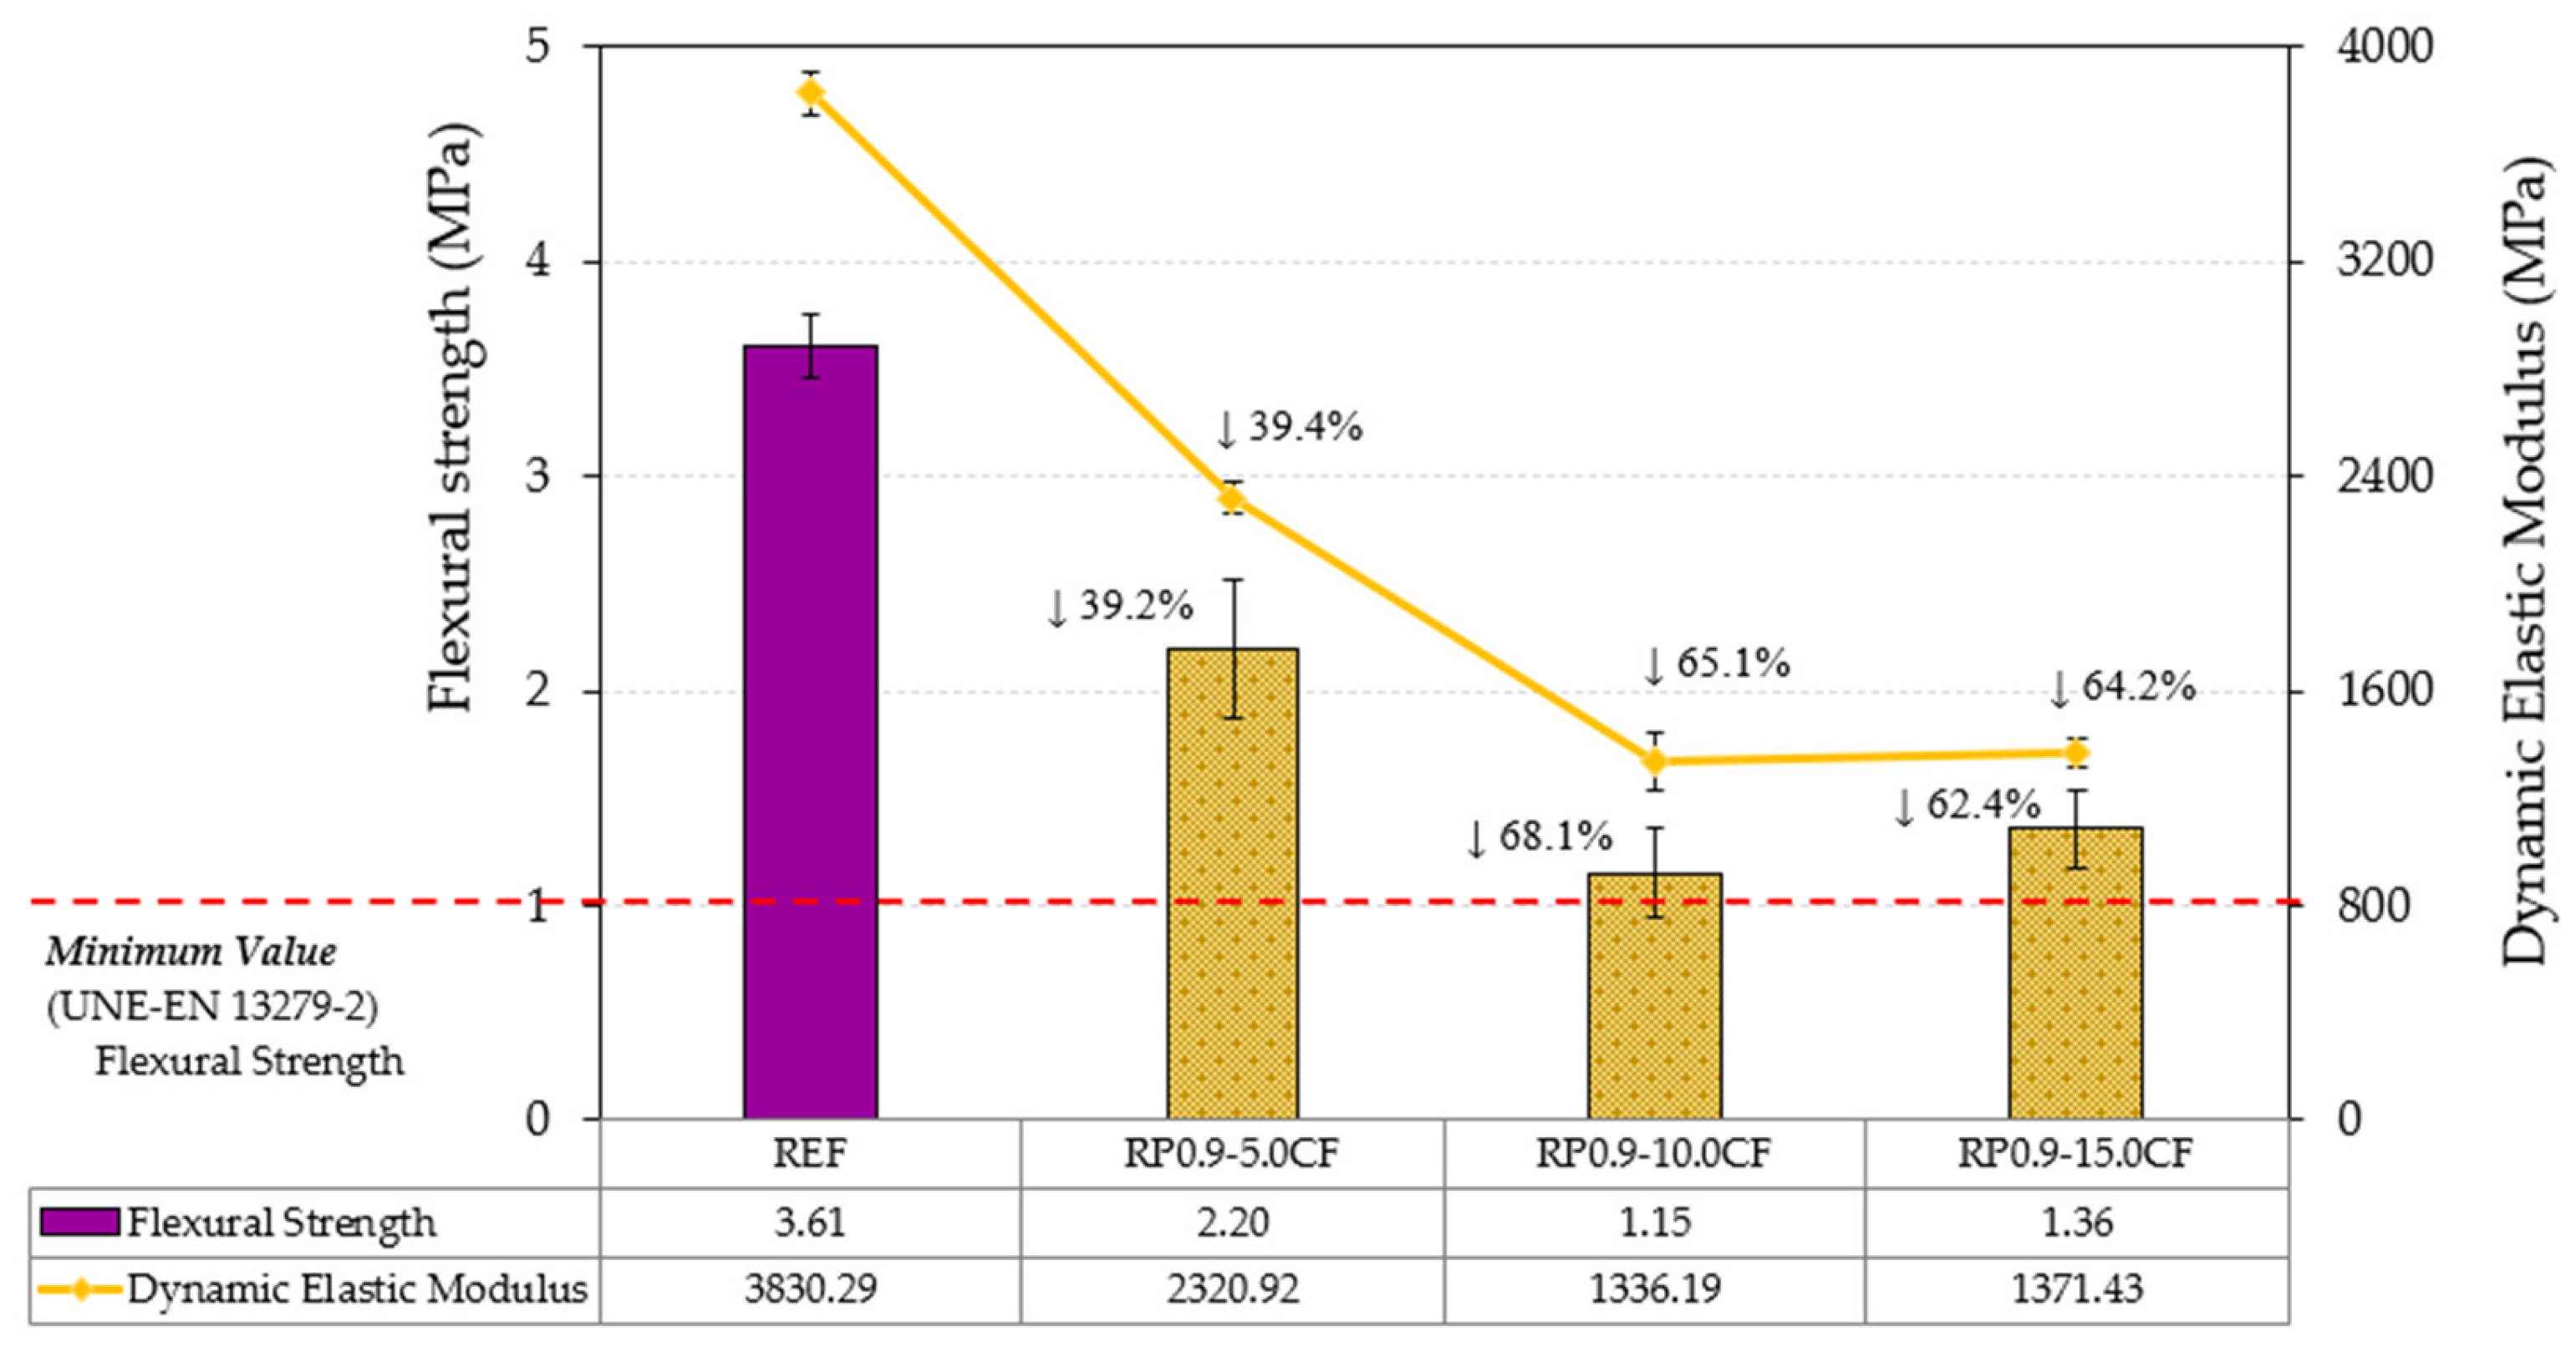
Figure 7 shows the results of the flexural strength and MOEUS tests. The flexural strength of the composites decreased by up to 62.3% (RP0.9-15.0CF) compared to the reference series, which was made with commercial gypsum and no fibers. Despite this decrease, all specimens exceeded the minimum threshold of 1 MPa established by UNE-EN 13279-2:2014 [46]. The observed pattern is consistent with the results reported for composites made with recycled EPS [26], where flexural strength decreased by 35.5–54.1% in specimens with recycled gypsum, despite the incorporation of reinforcement.
Regarding the dynamic modulus of elasticity, the composites with coconut fiber showed reductions of 39.4%, 6.1%, and 64.2%, reflecting the lower stiffness of the recycled binder, which is associated with greater porosity and lower matrix compactness.
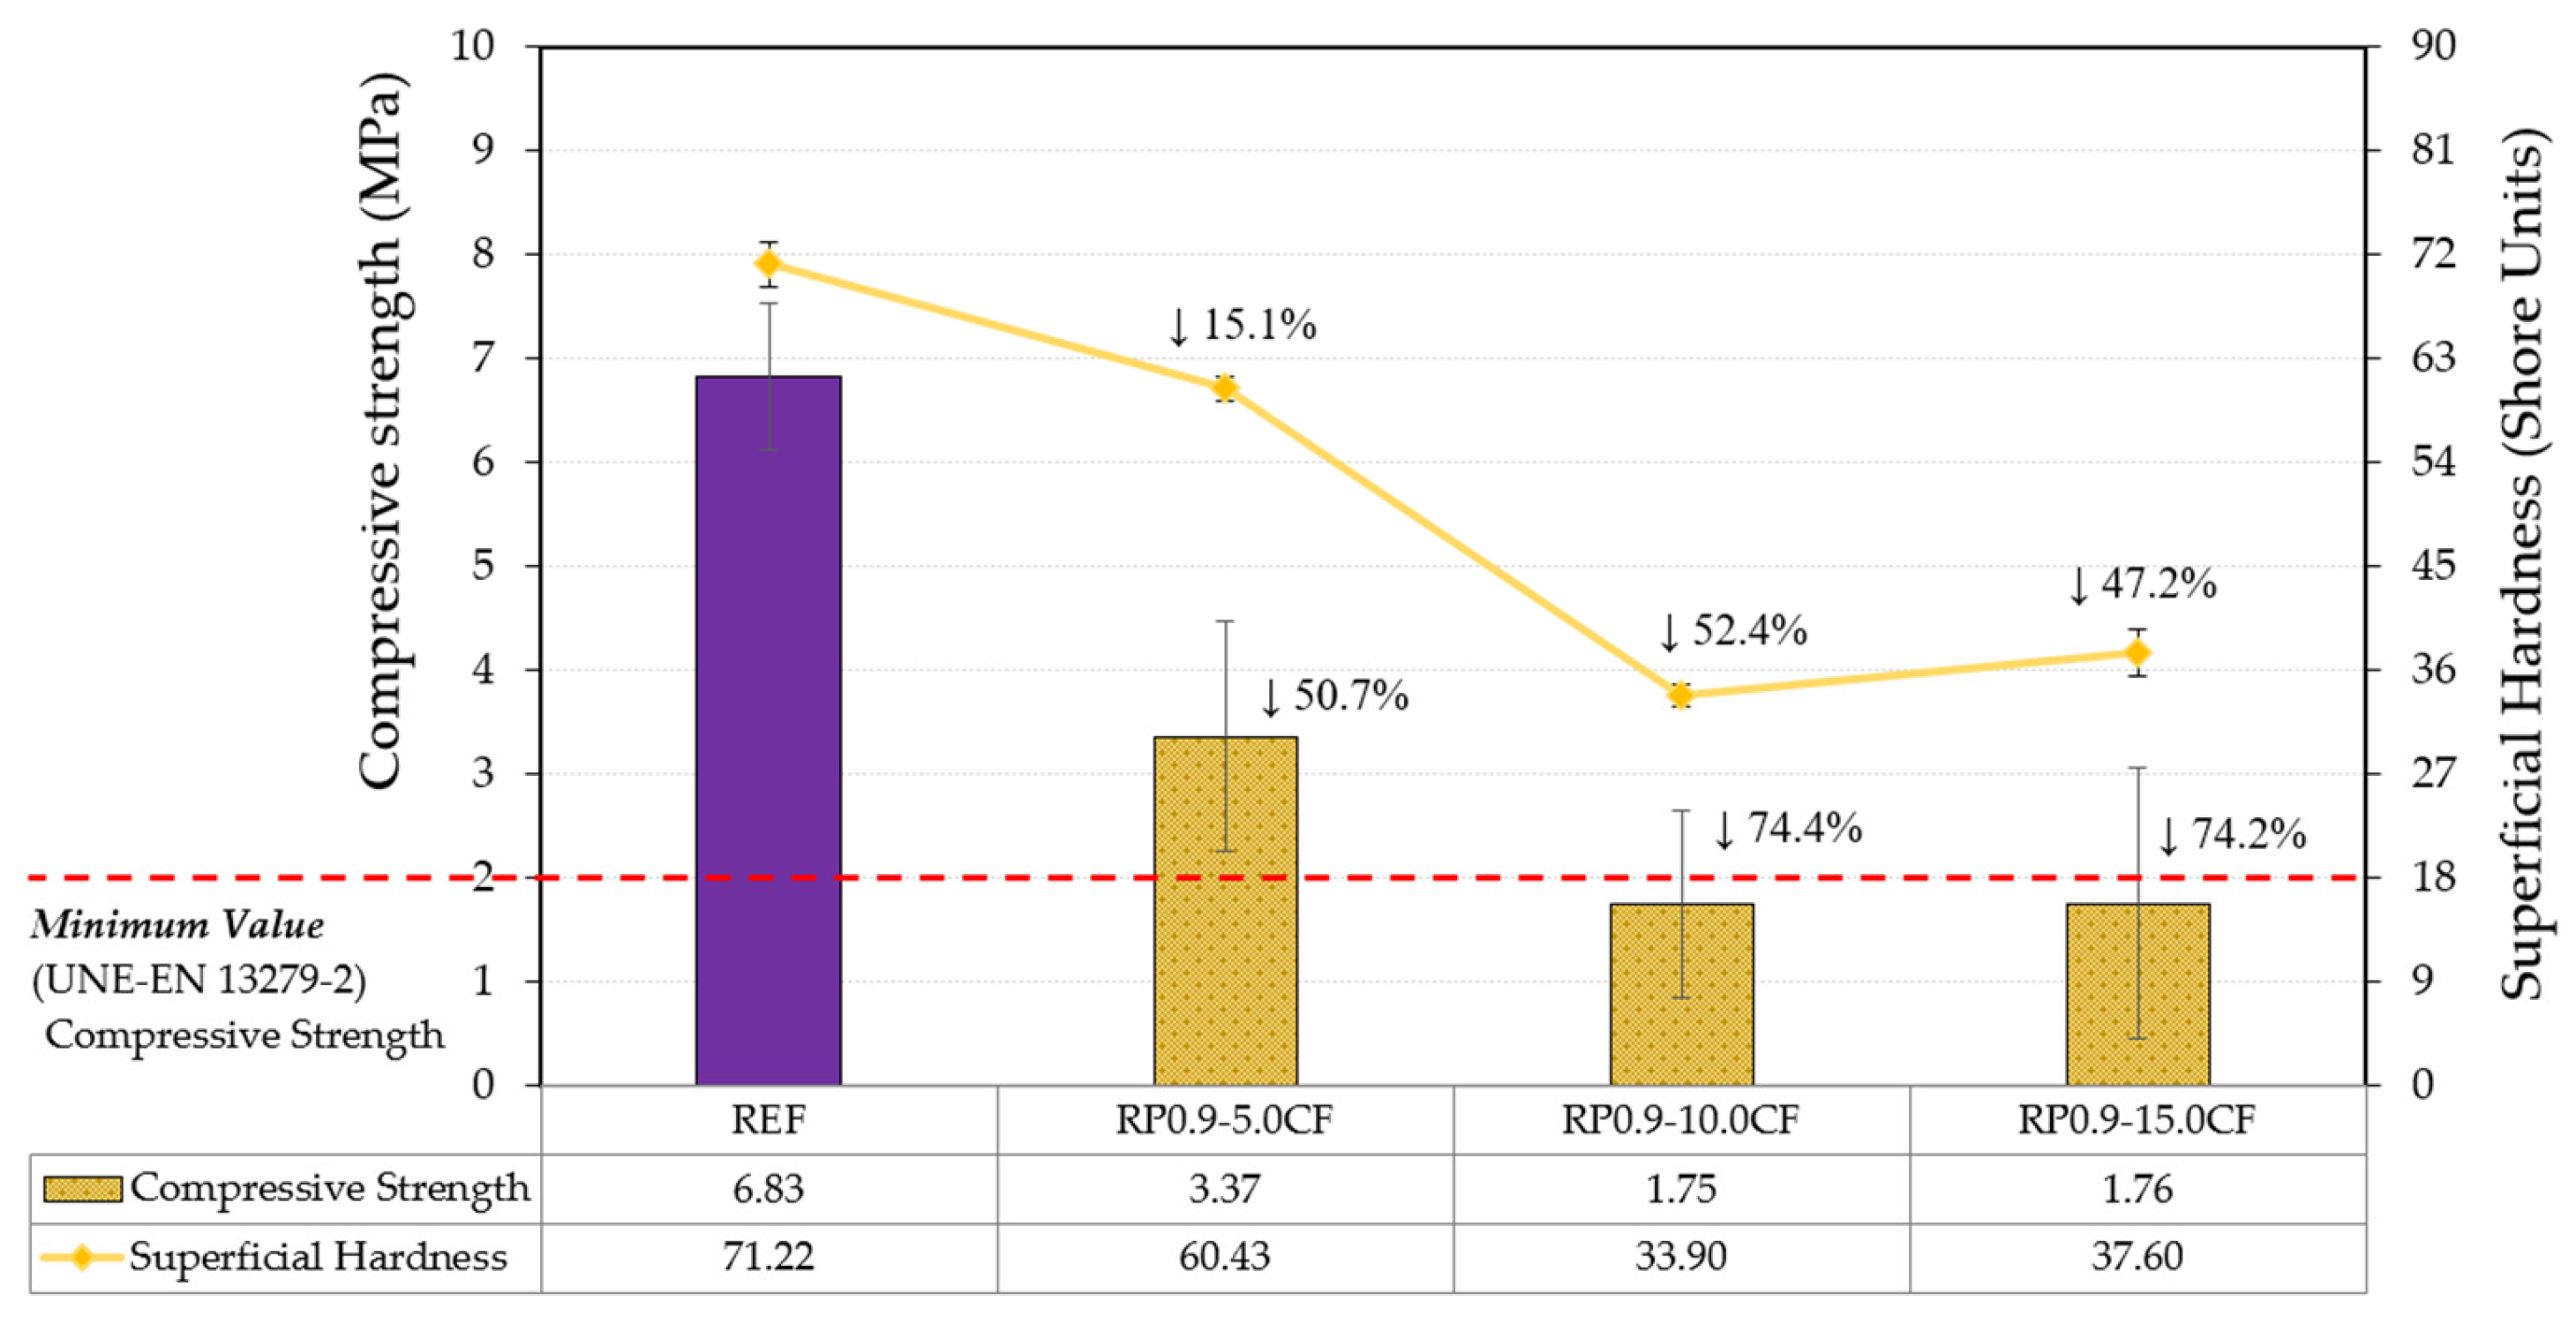
It is important to acknowledge a limitation regarding the results presented in Figure 7 (and also Figure 8). The reference value corresponds to the commercial gypsum mixture analyzed in Section 3.1.1 and Section 3.1.2, which was prepared with a water-to-binder ratio of 0.7 by mass, rather than 0.9 as used for the recycled gypsum composites. Therefore, these results should be interpreted with caution, since the mixture design was based on achieving a consistent plastic and workable mixture, with a flow diameter of 165 ± 10 mm, rather than maintaining a constant water-to-binder ratio across all formulations. A water-to-binder ratio of 0.7 was found to provide insufficient workability for the recycled gypsum mixture. Consequently, the differences observed in Figure 7 cannot be attributed exclusively to the incorporation of recycled gypsum or coconut fibers, as they may also be influenced by the higher water-to-binder ratio. Therefore, it must be explicitly noted that the observed mechanical variations result from the confounding effects of binder type, water-to-binder ratio (0.7 vs. 0.9), and fiber content, rather than being solely attributable to the recycled components.

3.3.3. Compressive Strength and Superficial Hardness

Figure 8 presents the results for Shore C surface hardness and compressive strength of the reference composite and the formulations with recycled gypsum and recycled coconut fibers. In general terms, the surface hardness values obtained for the composites were lower than those obtained for the reference specimen, which reached 71.22 Shore C units. In the case of the coconut fiber composites, reductions of up to 47.2% were observed in the RP0.9-15.0CF specimen. This behavior can be attributed to the replacement of the original binder with recycled gypsum, which has higher porosity, leading to a loss of mechanical properties [28]. Similar trends have been reported in specimens containing recycled gypsum and EPS [26], in which surface hardness decreased by 10–30%. As mentioned in the previous section, these results are influenced by the confounding effects of the increased water demand of the recycled binder.
Concerning compressive strength (Figure 8), the fiber-reinforced specimens showed reductions ranging from 50.7% to 74.4% relative to the control specimen’s 6.83 MPa. This performance demonstrates clear discrimination between the mixtures, with only the RP0.9-5.0CF composite exceeding the minimum standard value of 2 MPa, as specified in UNE-EN 13279-2:2014 [46]. This trend is consistent with the results of Zaragoza-Benzal et al. [26], who observed reductions in compressive strength in their composites.

3.3.4. Mechanical Performance Coefficient (MPC)

The use of the MPC is particularly relevant here, as the observed mechanical variations result from the confounding effects of binder type, water-to-binder ratio (0.7 vs. 0.9) and fiber content. Table 12 presents the mechanical performance coefficients obtained by correlating composite strength with bulk density. This analysis allows the results to be normalized and the structural efficiency to be evaluated comparatively, mitigating the impact of simultaneous variations in binder type and water-to-binder ratio.
In the commercial gypsum series (P0.7), the reported results suggest that the addition of fibers tends to progressively increase the material’s efficiency. The K f l e x values show a steady increase from 3.30 to 4.20, while K c o m p shows a notable improvement, rising from 6.24 in the control sample to values above 8.0 in all reinforced mixtures. This behavior indicates that, in dense, low-porosity matrices, coconut fiber reinforcement consistently contributes to a better strength-to-weight ratio.
In contrast, the behavior observed in the recycled gypsum series (RP0.9) shows a different trend. When normalizing strength against density, the data indicate that the highest relative mechanical performance is observed at the 5% dosage, with values of K f l e x = 2.18 and K c o m p = 3.34 . Beyond this content, a marked decline in technical efficiency is observed; for mixtures with 10% fiber, the coefficients drop to 1.39 for flexural strength and 2.11 for compressive strength, representing a 36.8% reduction in efficiency compared to the initial dosage. This pattern suggests that the higher intrinsic porosity of the recycled binder and the increased water demand establish a saturation threshold for the reinforcement’s effective contribution per unit mass of the composite.
When comparing the two series using the del Río Merino methodology [51], the coefficient analysis reveals that the RP0.9-5.0CF mixture represents the equilibrium point at which the recycled material achieves its most competitive balance. While the benefit of reinforcement is incremental in commercial gypsum, in recycled gypsum, this parameter provides a solid technical criterion for suggesting the potential of low-dose reinforcement for light-frame construction applications with mechanical requirements.

3.3.5. SEM

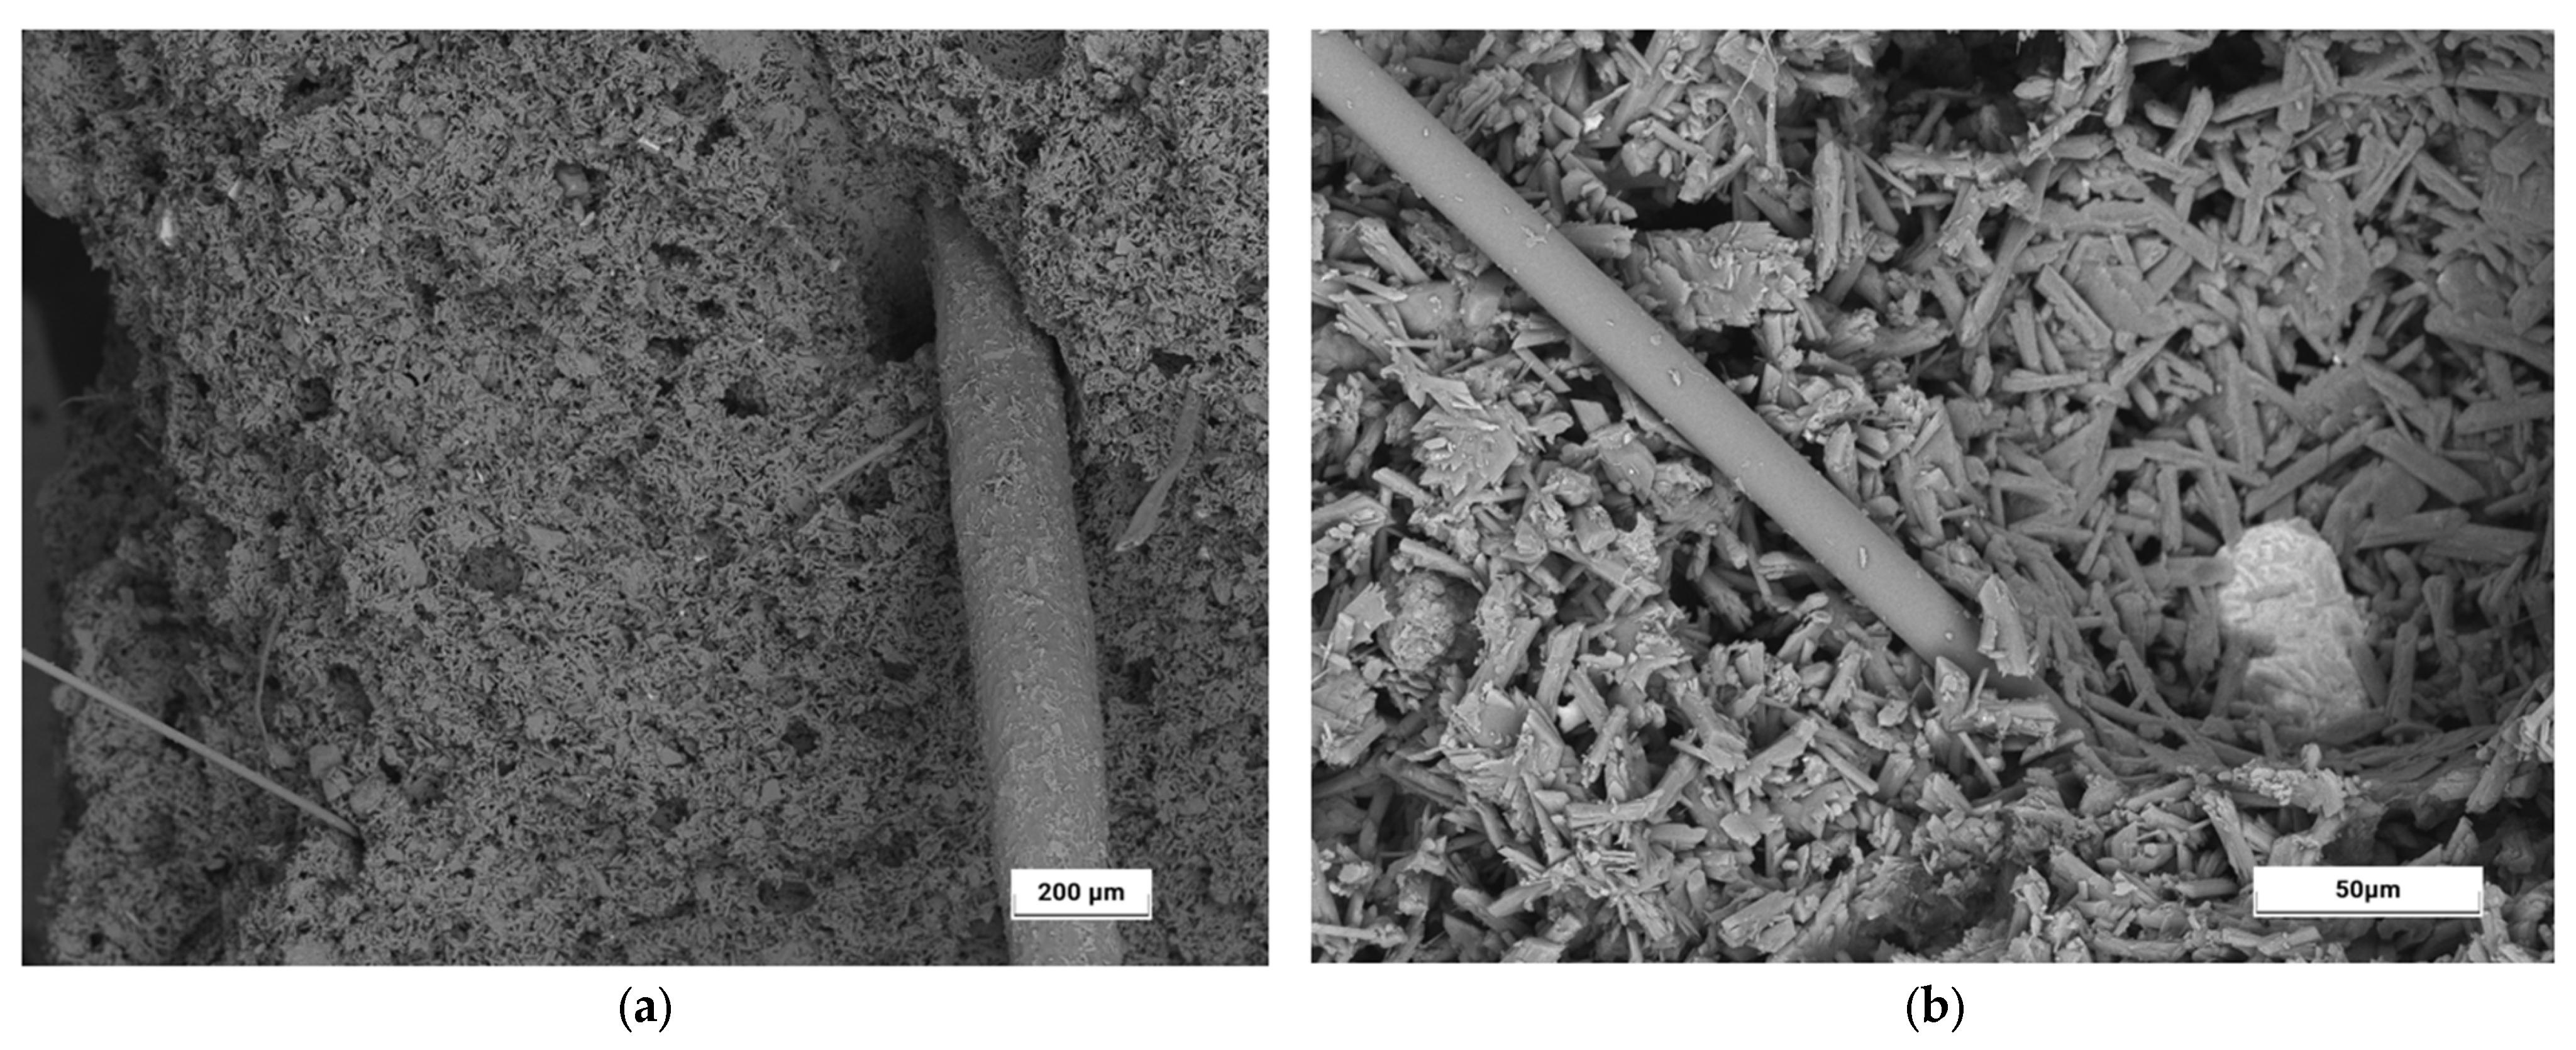
Figure 9 shows SEM images of the recycled gypsum sample with the highest coconut fiber content (RP0.9-15.0CF). The aim is to gain an in-depth understanding of the microstructure of the manufactured composites and to analyze the integration of coconut fiber into the recycled gypsum matrix. All images were obtained from the inner matrix of the sample and were selected in the laboratory to ensure maximum representativeness of the internal structure of the developed composites.
Figure 9a shows a homogeneous distribution of coconut fiber in the matrix of the recycled gypsum composite. Likewise, the high internal porosity of these materials is evident and may be related to the decrease in strength discussed in the previous section [62]. Figure 9b shows the characteristic needle-like morphology generated by the dihydrated gypsum crystals (CaSO4∙2H2O), which demonstrates the proper setting of the samples made with recycled gypsum [39].
Moreover, good integration between the coconut fiber and the matrix is observed, with no voids at the fiber periphery and crystals present on the surface. This has a beneficial effect on this type of construction material, as it limits fiber slippage failure under bending stresses, as corroborated in previous studies [63].

3.4. Environmental Assessment

3.4.1. Circularity Calculation

For Equation (3b) (Material Returned) in the BCI calculation for coconut fiber-reinforced gypsum composites, it was necessary to quantify the amount of each component that could be recovered at the end of the panel’s service life. To this end, an experimental procedure was developed and applied to seven test specimens measuring 40 × 30 × 1.5 cm, corresponding to formulations with coconut fiber contents ranging from 2.5% to 17.5%, as detailed in Table 7.
The experimental procedure (Figure 10) consisted of the mechanical separation and individual weighing of the solid components following the crushing, grinding, and sieving processes. From an initial dry mass of 13,230.00 g of gypsum and 163.38 g of coconut fibers, 6660.00 g and 73.5 g were recovered, respectively. These results correspond to an experimental recovery rate of 50.34% for gypsum and 44.99% for coconut fiber.
The recovery values assigned to each dosage are presented in Table 13. These experimental recovery rates are used to calculate the amount of materials classified as “down-recycling” ( D o w ), which will be incorporated into Equation (3b).
Table 14 presents the BCI results for the 120 × 250 × 1.25 cm panels made of gypsum and reinforced with coconut fibers, whose mix proportions are detailed in Table 7.
In Equation (3a) (Material Recovered), the dry materials incorporated into the system were quantified based on their origin. In accordance with the criteria established in Table 6, coconut fibers were classified as a renewable material ( R e n ) , as they are an agroindustrial byproduct of renewable origin, and were assigned a circularity factor of 1. In contrast, gypsum, a geological resource, was classified as virgin material ( V i r g i n ) , with a circularity factor of 0. Therefore, the value of Equation 3.1 will be the ratio of the mass of coconut fibers incorporated into the panel R e n to the total mass of solid materials used in its manufacture ( T o t a l m i ) .
Equation (3b) (Material Returned) quantifies the fraction of materials that can be reintroduced into new production cycles following the deconstruction of the panel. Based on the experimental mechanical separation tests described above, it was determined that 50.34% of the gypsum and 44.99% of the coconut fibers can be recovered. Both fractions were classified as downcycling material ( D o w ) [53] and assigned a weighting factor of 0.5 (Table 6). Thus, the value of Equation 3.2 will be the ratio of the recovered mass ( D o w ) to the total output mass ( T o t a l m o ) , which includes both the recoverable circular fraction and the non-recoverable waste (Disposed materials).
The results show that the BCI increases progressively as the coconut fiber content rises, reaching a maximum value of 13.7% for the formulation containing 17.5% fiber. This increase, although moderate, demonstrates an optimization in the end-of-life management of these composites.
The following section presents the calculation procedure for the P0.7-2.5CF series, which was used as a reference for the other studied formulations.
BCI = Materials Recovered ∙ 0.5 + Material Returned ∙ 0.5
BCI = 1   ·   R e n + 1   ·   R e c + 1   ·   R e u + 0   ·   V i r g i n     T o t a l m i ·   0.5 + 1   ·   O R e u + 1   ·   O R e c + 0.5   ·   D o w + 0.5   ·   E r T o t a l m o · 0.5
BCI = 1   ·   R e n + 1   ·   R e c + 1   ·   R e u + 0   ·   V i r g i n     R e n + R e c + R e u + V i r g i n ·   0.5 + 1   ·   O R e u + 1   ·   O R e c + 0.5   ·   D o w + 0.5   ·   E r O R e u + O R e c + D o w + E r + D i s · 0.5
BCI = 1   ·   R e n + 0   ·   V i r g i n     R e n + V i r g i n ·   0.5 + 0.5   ·   D o w D o w + D i s · 0.5
BCI = 1   ·   122.50   g + 0   ·   42656.25   g     122.50   g   + 42656.25   g ·   0.5 + 0.5   ·   21528.27   g 21528.27   g + 21250.48   g · 0.5
BCI = 12.7%

3.4.2. Life Cycle Assessment

Table 15 presents the results of quantifying the impact categories analyzed for composites containing commercial gypsum and recycled gypsum, as well as for the incorporation of recycled coconut fibers in the manufacture of prefabricated panels.
In the composites where coconut fiber has been introduced and the amount of gypsum used to manufacture the boards has been reduced, a slight reduction in values is observed across all impacts as fiber production increases relative to the reference. This reduction was most pronounced in the ODP category, with reductions of 4.8%, 9.6%, and 14.3% for the P0.7-5.0CF, P0.7-10.0CF, and P0.7-15.0CF composites, respectively. Replacing commercial natural gypsum with recycled gypsum notably improved results across all categories. Again, the greatest reduction was observed in the ODP category, with reductions of 91.9%, 92.2%, and 92.3% for the RP0.9-5.0CF, RP0.9-10.0CF, and RP0.9-15.0CF composites, respectively.
Across all composites, the highest environmental impacts are concentrated in the raw material extraction stage (A1) for every impact category, highlighting its dominant contribution to the production of this type of building material. Overall, environmental impacts decrease as the fiber content increases. However, for the GWP, AP, POCP, and EP categories, the magnitude of the environmental improvement diminishes in composites incorporating recycled gypsum as the fiber content increases. Although the RP0.9-15.0CF composite achieves GWP reductions of approximately 80% relative to the baseline, the impacts associated with fiber processing and transportation, together with the additional water required to produce recycled gypsum mixtures, offset part of these environmental gains. Furthermore, the magnitude of the GWP reduction is highly dependent on the adoption of the zero-burden assumption. Under alternative allocation approaches, part of the environmental burdens associated with primary material processing would be assigned to recycled materials, thereby reducing the net environmental benefits attributed to their incorporation. Nevertheless, this approach is widely recognized by the scientific community and is fully consistent with internationally established standards. On the other hand, the impact continues to decrease during the production phase as the density of the composites decreases.

4. Conclusions

This study has explored the technical potential and environmental feasibility of new gypsum composites that incorporate circular economy principles by using recycled gypsum and recycled coconut fiber. Using a methodology that combines durability testing, physicochemical characterization, and LCA, it is demonstrated that it is possible to substantially reduce the environmental footprint of building materials without compromising the minimum functional requirements mandated by current regulations. The following conclusions can be drawn from the experimental campaign:
  • Composites made from commercial gypsum and coconut fibers exhibited moderate losses in mass, surface hardness, and mechanical strength following accelerated aging cycles, while consistently remaining above the minimum regulatory values. The results indicate that incorporating coconut fiber serves as a hygrothermal stabilizer, mitigating mass loss and improving retention of mechanical properties after the cycles.
  • The use of recycled gypsum as a binder in coconut fiber composites resulted in reductions in all evaluated properties compared to the commercial reference series. Density decreased by up to 24.2%, reflecting the lower density of the coconut fibers and the higher porosity of the recycled matrix. Regarding mechanical properties, decreases of up to 47.2% in surface hardness were recorded for the formulation containing 15% coconut fibers. Similarly, the dynamic elastic modulus decreased by up to 64.2%, reflecting the lower stiffness of the recycled gypsum. Regarding mechanical performance, although flexural strength decreased by up to 62.4%, all formulations exceeded the minimum threshold of 1 MPa required by the standard. However, in the compression test, with decreases of up to 74.4%, only the formulation containing 5.0% fiber (3.37 MPa) met the minimum regulatory requirement. Therefore, it is identified as the most technically promising recycled gypsum composition of all those tested, since the use of fiber contents exceeding 5.0% in recycled gypsum matrices limits their suitability for applications with compressive load requirements.
However, the application of the MPCs ( K f l e x and K c o m p ) made it possible to determine that the material’s behavior is not linear in the recycled series: while in commercial gypsum the efficiency increases proportionally with fiber content, in the recycled series a point of technical optimization was identified at 5% fiber, beyond which the relative structural performance decreases.
  • The experimental material separation procedure determined that 50.34% of the gypsum and 44.99% of the coconut fibers are recoverable after the recycling of a panel made from these materials. When these values are incorporated into the BCI calculation and a weighting factor of 0.5 associated with under-recycling is applied, the index reaches a maximum of 13.7% for the formulation with the highest coconut fiber content (P0.7-17.5CF). These results show that, although the physical recovery of materials is substantial, effective circularity is limited by the loss of material quality after recycling. However, the incorporation of coconut fibers during the composite manufacturing phase helps improve the BCI, reinforcing its potential as a circular economy strategy applied to lightweight construction systems.
  • The incorporation of recycled coconut fiber into composites with commercial gypsum produces a progressive reduction in environmental impacts across all categories, primarily due to the decrease in gypsum content. This improvement is most notable in ODP, with reductions of up to 14%. On the other hand, replacing natural gypsum with recycled gypsum yields much more substantial improvements, with reductions exceeding 90% in ODP and around 80% in GWP compared to the baseline. It should be noted that the cut-off principle was applied, which directly influenced the results obtained. Finally, although the increase in fiber continues to reduce impacts in composites with recycled gypsum, factors such as fiber transportation and higher water consumption limit the potential for a much greater reduction in impact.
Despite the positive results obtained, the research identifies certain limitations that must be addressed in subsequent phases. The higher porosity and the presence of impurities in recycled gypsum limit its use in elements subject to high mechanical demands. Likewise, factors such as the increased water demand during the mixing of recycled gypsum can offset some of the environmental benefits achieved in the production phase. Another potential limitation relates to the use of a single length of coconut fiber. The aspect ratio (length/diameter) is critical to understanding the effectiveness of the reinforcement; thus, longer fibers could have a beneficial effect on flexural strength, although shorter fibers are typically used to prevent phenomena such as shrinkage. In this regard, it is proposed to expand the experimental study in the future by using different fiber lengths and even combining different sizes to determine the optimal percentage and dimensions based on the desired application. Finally, it should be noted that the observed reductions in density and mechanical properties should be interpreted as a combined effect of the recycled matrix, fiber addition, and the water/binder ratio since the individual effects of recycled gypsum and coconut fiber were not fully decoupled. Regarding the post-cycle behavior, advanced microstructural analysis is required to confirm these potential effects and validate the underlying mechanisms.
As future lines of research, it is proposed to evaluate the influence of porosity and natural fibers in composites made with recycled gypsum, in order to determine the thermal insulation capacity of the panels and their contribution to improving the operational energy efficiency of buildings. Furthermore, to complete the sustainability assessment, it would be necessary to develop an LCC that complements the LCA results, allowing for the evaluation of the long-term financial viability of the building panels and considering the economic impact of reincorporating end-of-life recovered materials into new production cycles, as opposed to the associated costs of disposing of them in landfills.

Author Contributions

Conceptualization, D.F. and M.F.R.-R.; methodology, D.F., A.Z.-B. and M.F.R.-R.; software, M.F.R.-R. and A.Z.-B.; validation, D.F., A.V.-V. and A.Z.-B.; formal analysis, M.F.R.-R. and D.F.; investigation, M.F.R.-R.; resources, D.F. and A.Z.-B.; data curation, M.F.R.-R.; writing—original draft preparation, M.F.R.-R.; writing—review and editing, D.F., A.V.-V. and A.Z.-B.; visualization, A.V.-V. and A.Z.-B.; supervision, D.F. and A.V.-V.; project administration, D.F.; funding acquisition, D.F. All authors have read and agreed to the published version of the manuscript.

Funding

This research was funded by Madrid Government (Comunidad de Madrid-Spain) under the Multiannual Agreement 2023–2026 with the Universidad Politécnica de Madrid in Line A, Emerging PhD researchers, grant number DOCTORES-EMERGENTES-24-NZMO4U-16-3U7Z8W (Name of the project: Waste2BuildIns; reference OTT: M230020126A-DFV). Buildings 16 03082 i001

Data Availability Statement

The original contributions presented in this study are included in the article. Further inquiries can be directed to the corresponding author.

Acknowledgments

The authors would like to thank the School of Industrial Design and Engineering (E.T.S. de Ingeniería y Diseño Industrial) for their assistance in obtaining the XRD patterns of the gypsum samples. The authors also gratefully acknowledge the support provided by the Department of Building Technology at the Universidad Politécnica de Madrid in carrying out this work.

Conflicts of Interest

The authors declare no conflicts of interest.

References

  1. Pierrehumbert, R. There is no Plan B for dealing with the climate crisis. Bull. At. Sci. 2019, 75, 215–221. [Google Scholar] [CrossRef] [Scilit]
  2. Comisión Europea. Reglamento (UE) 2024/3110 del Parlamento Europeo y del Consejo, de 12 de Diciembre de 2024, por el que se Establecen Condiciones Armonizadas Para la Comercialización de Productos de Construcción; Diario Oficial de la Unión Europea: Luxembourg, 2024; pp. 1–114. Available online: http://data.europa.eu/eli/reg/2024/3110/oj (accessed on 3 May 2026).
  3. Global Alliance for Buildings and Construction. 2024/2025 Global Status Report for Buildings and Construction; United Nations Environment Programme: Nairobi, Kenya, 2024. [Google Scholar]
  4. Green Building Council España (GBCe). Descarbonizar La Edificación En Todo Su Ciclo de Vida—Guía Paso a Paso Para Ciudades; GBCe: Madrid, Spain, 2023. [Google Scholar]
  5. Parlamento Europeo y Consejo de la Unión Europea. Directiva (UE) 2024/1275 del Parlamento Europeo y del Consejo de 24 de Abril de 2024 Relativa a la Eficiencia Energética de los Edificios (Versión Refundida); Diario Oficial de la Unión Europea: Luxembourg, 2024; Available online: http://data.europa.eu/eli/dir/2024/1275/oj (accessed on 3 May 2026).
  6. European Commission. The European Green Pact. 2019. Available online: https://sustainabledevelopment.un.org/post2015/transformingourworld (accessed on 3 August 2025).
  7. Comisión Europea. Nuevo Plan de Acción Para La Economía Circular: Por Una Europa Más Limpia Y Más Competitiva; COM(2020) 98 final; Comisión Europea: Bruselas, Belgium, 2020. [Google Scholar]
  8. UNE-EN 15804:2012+A2:2020; Sostenibilidad en la Construcción. Declaraciones Ambientales de Producto. Reglas de Categoría de Producto Básicas Para Productos de Construcción. UNE: Madrid, Spain, 2020.
  9. United Nations Environment Programme. Building Materials and the Climate: Constructing a New Future; United Nations Environment Programme: Nairobi, Kenya, 2023. [Google Scholar]
  10. Programa DAP® construcción. RCP 100. Reglas de Categoría de Producto (RCP) Genéricas Para Preparar una Declaración Ambiental de Producto (DAPcons®) Sobre Productos de Construcción; Versión 3; Col·legi d’Aparelladors, Arquitectes Tècnics i Enginyers d’Edificació de Barcelona (CAATEEB): Barcelona, Spain, 2021. [Google Scholar]
  11. Ministerio de Vivienda y Agenda Urbana. Documento Básico HE Ahorro de Energía. Código Técnico de La Edificación; Ministerio de Vivienda y Agenda Urbana: Madrid, Spain, 2022.
  12. Naciones Unidas. Marco de Indicadores Mundiales Para Los Objetivos de Desarrollo Sostenible Y Metas de La Agenda 2030 Para El Desarrollo Sostenible; United Nations: New York, NY, USA, 2021. [Google Scholar]
  13. Parlamento Europeo y Consejo de la Unión Europea. Directiva 2008/98/CE del Parlamento Europeo y del Consejo, de 19 de Noviembre de 2008, Sobre los Residuos y por la que se Derogan Determinadas Directivas; Diario Oficial de la Unión Europea: Luxembourg, 2008; Volume L 312, pp. 3–30. [Google Scholar]
  14. Ministerio para la Transición Ecológica y el Reto Demográfico. España Circular 2030. Estrategia Española de Economía Circular; MITECO: Madrid, Spain, 2020.
  15. Zaragoza-Benzal, A.; Ferrández, D.; Atanes-Sánchez, E.; Saíz, P. Study of the hygroscopic properties of environmentally friendly lightened composites through waste recovery. Constr. Build. Mater. 2023, 404, 133219. [Google Scholar] [CrossRef] [Scilit]
  16. Rodríguez-Robalino, M.F.; Ferrández, D.; Verdú-Vázquez, A.; Zaragoza-Benzal, A. Development and Performance of Coconut Fibre Gypsum Composites for Sustainable Building Materials. Buildings 2025, 15, 1899. [Google Scholar] [CrossRef] [Scilit]
  17. Braiek, A.; Karkri, M.; Adili, A.; Ibos, L.; Ben Nasrallah, S. Estimation of the thermophysical properties of date palm fibers/gypsum composite for use as insulating materials in building. Energy Build. 2017, 140, 268–279. [Google Scholar] [CrossRef] [Scilit]
  18. Iucolano, F.; Caputo, D.; Leboffe, F.; Liguori, B. Mechanical behavior of plaster reinforced with abaca fibers. Constr. Build. Mater. 2015, 99, 184–191. [Google Scholar] [CrossRef] [Scilit]
  19. Ferrández, D.; Álvarez, M.; Zaragoza-Benzal, A.; Cobo-González, Á.; Santos, P. Development and Characterization of Innovative Hemp–Gypsum Composites for Application in the Building Industry. Appl. Sci. 2024, 14, 2229. [Google Scholar] [CrossRef] [Scilit]
  20. Vidales-Barriguete, A.; Atanes-Sánchez, E.; del Río-Merino, M.; Piña-Ramírez, C. Analysis of the improved water-resistant properties of plaster compounds with the addition of plastic waste. Constr. Build. Mater. 2020, 230, 116956. [Google Scholar] [CrossRef] [Scilit]
  21. Leiva-Aguilera, M.J. Escayola Aditivada con Residuos de Cáscara de Arroz. Doctoral Dissertation, Universidad Politécnica de Madrid, Madrid, Spain, 2017. [Google Scholar]
  22. Zaragoza-Benzal, A.; Ferrández, D.; Diaz-Velilla, J.P.; Zúñiga-Vicente, J.A. Manufacture and characterisation of a new lightweight plaster for application in wet rooms under circular economy criteria. Case Stud. Constr. Mater. 2023, 19, e02380. [Google Scholar] [CrossRef] [Scilit]
  23. Zaragoza-Benzal, A.; Ferrández, D.; Barrios, A.M.; Morón, C. Water Resistance Analysis of New Lightweight Gypsum-Based Composites Incorporating Municipal Solid Waste. J. Compos. Sci. 2024, 8, 393. [Google Scholar] [CrossRef] [Scilit]
  24. Trio Maseda, M.; Ortuño, M.G.; Ontiveros Beltranena, C.; Díaz Muñoz, J.Á.; Galindo Rodríguez, M.E.; Martín Moreno, P.I. Yeso Y Alabastro. Panorama Minero 2022; Instituto Geológico y Minero de España: Madrid, Spain, 2024. [Google Scholar]
  25. Instituto Nacional de Estadística. Cuentas Medioambientales: Cuenta de Los Residuos. Año 2021; INE: Madrid, Spain, 2023. [Google Scholar]
  26. Zaragoza-Benzal, A.; Ferrández, D.; Santos, P.; Mateus, R.; Atanes-Sánchez, E. Towards the design of new circular composites for lightweight construction products based on gypsum and plastic waste. J. Build. Eng. 2025, 107, 112796. [Google Scholar] [CrossRef] [Scilit]
  27. Ferrández, D.; Zaragoza-Benzal, A.; Atanes-Sánchez, E.; Merillas, B.; Mateus, R.; Santos, P. Study of Different Recycling Approaches for Gypsum-Based Composites with Recycled Rubber Aggregates. Buildings 2025, 15, 577. [Google Scholar] [CrossRef] [Scilit]
  28. Gordon, A.M.; Prieto Barrio, M.I.; Cobo Escamilla, A.; Leal Matilla, A. From waste to resource: Exploring the recyclability and performance of gypsum-graphene nanofiber composites. Resour. Conserv. Recycl. Adv. 2024, 23, 200222. [Google Scholar] [CrossRef] [Scilit]
  29. Li, Z.; Xu, K.; Peng, J.; Wang, J.; Zhang, J.; Li, Q. Study on mechanical strength and water resistance of organosilicon waterproofing agent blended recycled gypsum plaster. Case Stud. Constr. Mater. 2021, 14, e00546. [Google Scholar] [CrossRef] [Scilit]
  30. One Click LCA. Building Circularity: Circular Assessment. 2026. Available online: https://help.oneclicklca.com/en/articles/275740-building-circularity-circular-assessment (accessed on 3 May 2026).
  31. IBERYOLA®. Iberyola® E-30/E35. Technical Sheet. 2023. Available online: https://www.placo.es/documents/fichas-tecnicas/ft-iberyola-es.pdf (accessed on 26 May 2025).
  32. UNE-EN 13279-1:2009; Gypsum Binders and Gypsum Plasters—Part 1: Definitions and Requirements. Asociación Española de Normalización: Madrid, Spain, 2009.
  33. Unión Europea. Reglamento (UE) n-305/2011 del Parlamento Europeo y del Consejo, de 9 de Marzo de 2011, por el que se Establecen Condiciones Armonizadas Para la Comercialización de Productos de Construcción y se Deroga la Directiva 89/106/CEE del Consejo; Diario Oficial de la Unión Europea: Luxembourg, 2011; pp. 5–43. [Google Scholar]
  34. Subdirección de Calidad de las Aguas. Características de Calidad de las Aguas. In Análisis Completo; Canal de Isabel II: Madrid, Spain, 2023.
  35. Sanou, I.; Bamogo, H.; Sory, N.; Gansoré, A.; Millogo, Y. Effect of the coconut fibers and cement on the physico-mechanical and thermal properties of adobe blocks. Heliyon 2024, 10, e38752. [Google Scholar] [CrossRef] [Scilit] [PubMed]
  36. Quintanilla Alas, M.E. Industrialización de La Fibra de Estopa de Coco; Trabajo de Graduación, Universidad de El Salvador: San Salvador, El Salvador, 2010. [Google Scholar]
  37. Stelte, W.; Reddy, N.; Barsberg, S.; Sanadi, A.R. Coir from Coconut Processing Waste as a Raw Material for Applications Beyond Traditional Uses. BioResources 2023, 18, 2187–2212. [Google Scholar] [CrossRef] [Scilit]
  38. Erbs, A.; Nagalli, A.; Carvalho, K.Q.; Mymrin, V.; Passig, F.H.; Mazer, W. Properties of recycled gypsum from gypsum plasterboards and commercial gypsum throughout recycling cycles. J. Clean. Prod. 2018, 183, 1314–1322. [Google Scholar] [CrossRef] [Scilit]
  39. Erbs, A.; Nagalli, A.; Querne de Carvalho, K.; Mazer, W.; de Moraes Erbs, M.; Paz, D.H.F.; Lafayette, K.P.V. Development of plasterboard sheets exclusively from waste. J. Build. Eng. 2021, 44, 102524. [Google Scholar] [CrossRef] [Scilit]
  40. Camarini, G.; Pinto, M.C.C.; Moura, A.G.; Manzo, N.R. Effect of citric acid on properties of recycled gypsum plaster to building components. Constr. Build. Mater. 2016, 124, 383–390. [Google Scholar] [CrossRef] [Scilit]
  41. Geraldo, R.H.; Pinheiro, S.M.M.; Silva, J.S.; Andrade, H.M.C.; Dweck, J.; Gonçalves, J.P.; Camarini, G. Gypsum plaster waste recycling: A potential environmental and industrial solution. J. Clean. Prod. 2017, 164, 288–300. [Google Scholar] [CrossRef] [Scilit]
  42. Pedreño-Rojas, M.A.; De Brito, J.; Flores-Colen, I.; Pereira, M.F.C.; Rubio-de-Hita, P. Influence of gypsum wastes on the workability of plasters: Heating process and microstructural analysis. J. Build. Eng. 2020, 29, 101143. [Google Scholar] [CrossRef] [Scilit]
  43. Pedreño-Rojas, M.A.; Flores-Colen, I.; De Brito, J.; Rodríguez-Liñán, C. Influence of the heating process on the use of gypsum wastes in plasters: Mechanical, thermal and environmental analysis. J. Clean. Prod. 2019, 215, 444–457. [Google Scholar] [CrossRef] [Scilit]
  44. Geraldo, R.H.; Souza, J.D.; Campos, S.C.; Fernandes, L.F.R.; Camarini, G. Pressured recycled gypsum plaster and wastes: Characteristics of eco-friendly building components. Constr. Build. Mater. 2018, 191, 136–144. [Google Scholar] [CrossRef] [Scilit]
  45. Fernandes Cordon, H.C.; Carvalho Cagnoni, F.; Furlan Ferreira, F. Comparison of physical and mechanical properties of civil construction plaster and recycled waste gypsum from São Paulo, Brazil. J. Build. Eng. 2019, 22, 504–512. [Google Scholar] [CrossRef] [Scilit]
  46. UNE-EN 13279-2:2014; Yesos de Construcción Y Conglomerantes a Base de Yeso Para La Construcción. Parte 2: Métodos de Ensayo. AENOR: Madrid, Spain, 2014; p. 24.
  47. Asociación Española de Normalización. UNE 102042:2023; Yesos Y Escayolas de Construcción. Aljez (o Piedra de Yeso). Otros Métodos de Ensayo. UNE: Madrid, Spain, 2023.
  48. UNE-EN ISO 12680-1:2007; Productos Refractarios. Determinación del Módulo de Elasticidad Dinámico por el Método de la Frecuencia de Resonancia. Parte 1: Método de la Probeta en Flexión. AENOR: Madrid, Spain, 2007.
  49. ISO 14040; Gestión Ambiental. Análisis de Ciclo de Vida. Principios y Marco de Referencia. ISO: Ginebra, Switzerland, 2006.
  50. ISO 14044; Gestión Ambiental. Análisis de Ciclo de Vida. Requisitos y Directrices. ISO: Ginebra, Switzerland, 2006.
  51. Del Río Merino, M. Elaboración y Aplicaciones Constructivas de Paneles Prefabricados de Escayola Aligerada y Reforzada con Fibras de Vidrio E y Otros Aditivos. Doctoral Dissertation, Universidad Politécnica de Madrid, Madrid, Spain, 1999. [Google Scholar]
  52. Santa Cruz Astorqui, J.; del Río Merino, M.; Villoria Sáez, P.; Porras-Amores, C. Analysis of the Relationship between Density and Mechanical Strength of Lightened Gypsums: Proposal for a Coefficient of Lightening. Adv. Mater. Sci. Eng. 2017, 2017, 7092521. [Google Scholar] [CrossRef] [Scilit]
  53. Timm, J.; Ries, R.; Passuello, A. Modular steel panel for walls: Life cycle environmental impact, life cycle cost, and potential for material circulation. Build. Environ. 2025, 267, 112209. [Google Scholar] [CrossRef] [Scilit]
  54. One Click LCA. Building Circularity. Available online: https://help.oneclicklca.com/en/articles/275737-building-circularity (accessed on 27 August 2025).
  55. Foundation, E.M.; Design, G. Circularity Indicators: An Approach to Measuring Circularity; Ellen MacArthur Foundation: Isle of Wight, UK, 2015. [Google Scholar]
  56. González, A.; Sendra, C.; Herena, A.; Rosquillas, M.; Vaz, D. Methodology to assess the circularity in building construction and refurbishment activities. Resour. Conserv. Recycl. Adv. 2021, 12, 200051. [Google Scholar] [CrossRef] [Scilit] [PubMed]
  57. Urlainis, A.; Paciuk, M.; Shohet, I.M. Service Life Prediction and Life Cycle Costs of Light Weight Partitions. Appl. Sci. 2024, 14, 1233. [Google Scholar] [CrossRef] [Scilit]
  58. International EPD System. Environmental Product Declaration: Standard Plasterboard 12.5 Mm; International EPD System: Estocolmo, Sweden, 2022. [Google Scholar]
  59. Base de Datos Ecoinvent. Available online: https://ecoinvent.org/database/ (accessed on 3 May 2026).
  60. Leiden University. CML-IA Characterisation Factors; Center of Environmental Science (CML): Leiden, The Netherlands, 2016. [Google Scholar]
  61. Lanzón, M.; García-Ruiz, P.A. Effect of citric acid on setting inhibition and mechanical properties of gypsum building plasters. Constr. Build. Mater. 2012, 28, 506–511. [Google Scholar] [CrossRef] [Scilit]
  62. Karua, P.; Ahammad, R.; Islam, M.S.; Arifuzzaman, M. Effect of fiber content on flexural properties of jute fiber reinforced perlite/gypsum composite core-based sandwich structures. Constr. Build. Mater. 2024, 446, 137899. [Google Scholar] [CrossRef] [Scilit]
  63. Yuksel, O.; Sandberg, M.; Baran, I.; Ersoy, N.; Hattel, J.H.; Akkerman, R. Material characterization of a pultrusion specific and highly reactive polyurethane resin system: Elastic modulus, rheology, and reaction kinetics. Compos. Part B Eng. 2021, 207, 108543. [Google Scholar] [CrossRef] [Scilit]
Figure 1. Preparation of composites. (a) Commercial gypsum composites reinforced with coconut fibers. (b) Recycled gypsum composites reinforced with coconut fibers.
Buildings 16 03082 g001
Figure 2. Procedure for preparing the composites.
Buildings 16 03082 g002
Figure 3. Experimental design of the research, including the durability stages, physical-mechanical characterization, and environmental assessment. Standardized tests were conducted according to UNE-EN 102042:2023 [47], UNE EN ISO 12680-1:2007 [48], UNE-EN 13279-2:2014 [46], and environmental assessments followed ISO 14040 [49] and ISO 14044 [50].
Buildings 16 03082 g003
Figure 4. Results of the mechanical test of gypsum specimens with and without water-oven cycles [51].
Buildings 16 03082 g004
Figure 5. Results of the mechanical tests on gypsum specimens with and without wet–dry cycles [51].
Buildings 16 03082 g005
Figure 6. Diffractograms of commercial gypsum and recycled gypsum powder.
Buildings 16 03082 g006
Figure 7. Dynamic modulus of elasticity (MOEUS) and flexural strength for the coconut fiber and recycled gypsum composites [46].
Buildings 16 03082 g007
Figure 8. Shore C hardness and compressive strength test results for the coconut fiber and recycled gypsum composites [46].
Buildings 16 03082 g008
Figure 9. SEM images of sample RP0.9-15.0CF. Magnifications (a) ×150, (b) ×1500.
Buildings 16 03082 g009
Figure 10. Process for recovering material from 40 × 30 × 1.5 cm test specimens. (a) Crushed test specimens; (b) powder ground in a ball mill; (c) sieving the powder.
Buildings 16 03082 g010
Table 1. Summary of material compositions, cycling conditions, and evaluated properties after water-stove and wet-chamber cycles of gypsum composites with secondary materials.
ReferenceVirgin MaterialsRecycled MaterialsNo. of CyclesProperties Analyzed (*)
ABCD
Water-Stove Cycles
[20]Gypsum type A;
Water
Plastic cable waste (<3 mm)2-
[21]E-35 plaster;
Water
Rice husk residue;
Rice husk ash
1
Wet Chamber Cycles
[22]E-35 plaster;
Water;
Universal solvent
Expanded polystyrene (EPS)
10-
ELT textile fiber-
[23]E-35 plaster;
Water;
Universal solvent
ELT rubber aggregate (0–0.8 mm)5-
ELT rubber aggregate (0–0.8 mm);
Expanded polystyrene (EPS)
-
[20]Type A gypsum;
Water
Plastic cable waste (<3 mm)1
[21]E-35 plaster;
Water
Rice husk residue;
Rice husk ash
1
(*) A: change in mass; B: change in surface hardness; C: change in flexural strength; D: change in compressive strength.
Table 2. Summary of recycled gypsum studies: gypsum sources and evaluated properties of the composites.
ReferenceVirgin MaterialsRecycled MaterialsSource of GypsumProperties Analyzed (*)
ABCDEAGHIJALM
[26]Type B1 gypsum; Water; Ethyl acetateRecycled gypsum plasterboard;
Recycled EPS solution
Waste generated from the manufacture of gypsum boards
[27]Gypsum E3-5; WaterRecycled gypsum; Recycled rubber aggregates from ELT (between 1.0 and 2.5 mm)Recycled gypsum obtained from test specimens prepared by the author, SERIES 1 (gypsum E-35 and ELT granulate and powder) and SERIES 2 (recycled gypsum from SERIES 1 and ELT granulate and powder)
Recycled gypsum; Recycled rubber aggregates from ELT (<0.8 mm)
[28]Type B1 gypsum; LS-class graphene nanofibers; Distilled waterRecycled gypsum with concentrations of LS-class graphene nanofibersRecycled gypsum obtained from test specimens prepared by the author, based on gypsum type B1 and graphene nanofibers LS class
[29]Organosilicon waterproofing agent; WaterRecycled plasterRecycled plaster obtained from commercial plaster processed by the author
(*) A: X-ray diffraction (XRD); B: thermogravimetric analysis (TGA); C: bulk density; D: surface hardness; E: flexural strength; F: compressive strength; G: thermal conductivity; H: scanning electron microscopy (SEM); I: void content; J: immersion absorption coefficient; K: environmental im-pact; L: water absorption; M: water absorption rate.
Table 4. Mix proportions used to prepare commercial gypsum composites reinforced with coconut fiber [16].
SampleCommercial Gypsum (g)Water (g)Coconut Fiber (g)
P0.7-REF1000700.0
P0.7-2.5CF975682.52.8
P0.7-5.0CF950665.05.6
P0.7-7.5CF925647.58.3
P0.7-10.0CF900630.011.1
P0.7-12.5CF875612.513.9
P0.7-15.0CF850595.016.7
P0.7-17.5CF825577.519.4
Table 5. Mix proportions used to prepare recycled gypsum composites reinforced with coconut fiber.
SampleRecycled Gypsum (g)Water (g)Coconut Fiber (g)
RP0.9-5.0CF950855.05.6
RP0.9-10.0CF900810.011.1
RP0.9-15.0CF850765.016.7
Table 6. Weighting factor for recovered materials and returned materials [30,43,54].
Material Weighting Factor
Recovered
(material recovery)
New material from renewable sources, circular.1
Recycled material with lower emissions than an equivalent new material; circular.1
Materials reused from another project, with little or no additional emissions.1
New material, not circular.0
Returned
(recovery of used materials)
Preparation of materials for later reuse, reducing future emissions.1
Processing of materials in a closed-loop system (maintaining the original quality of the material)1
Open-loop material processing (producing a lower-quality material)0.5
Materials incinerated to generate energy.0.5
Materials sent to landfills (may not fully disintegrate or decompose).0
Table 7. Quantities of materials used to manufacture the 120 × 250 × 1.25 cm panel.
SampleGypsum (g)Water (g)Coconut Fiber (g)
P0.7-REF43,750.0030,625.000.00
P0.7-2.5CF42,656.2529,859.38122.50
P0.7-5.0CF41,562.5029,093.75245.00
P0.7-7.5CF40,468.7528,328.13363.13
P0.7-10.0CF39,375.0027,562.50485.63
P0.7-12.5CF38,281.2526,796.88608.13
P0.7-15.0CF37,187.5026,031.25730.63
P0.7-17.5CF36,093.7525,265.63848.75
Table 8. Formulations of panels subjected to life cycle assessment.
PanelCommercial Gypsum
(kg)
Recycled Gypsum
(kg)
Water
(kg)
Coconut Fiber
(kg)
P0.7-REF14.58-10.21-
P0.7-5.0CF13.85-9.700.08
P0.7-10.0CF13.13-9.190.16
P0.7-15.0CF12.40-8.680.24
RP0.9-5.0CF-13.8512.470.08
RP0.9-10.0CF-13.1311.810.16
RP0.9-15.0CF-12.4011.160.24
Table 9. Weight variation.
Mass (g)
SeriesP0.7P0.7-2.5CFP0.7-5.0CFP0.7-7.5CFP0.7-10.0CFP0.7-12.5CFP0.7-15.0CFP0.7-17.5CF
No cycles280.07 ± 9.95269.69 ± 10.02267.43 ± 6.20266.54 ± 7.31265.80 ± 7.27265.69 ± 8.99265.45 ± 6.29252.88 ± 7.03
With cycles265.08 ± 3.73270.56 ± 2.41269.40 ± 2.75270.94 ± 2.90269.73 ± 2.05269.76 ± 3.19263.49 ± 1.65263.58 ± 1.78
Variation (%)−5.4+0.3+0.7+1.7+1.5+1.5−0.7+4.2
Table 10. Weight variation.
Mass (g)
SeriesP0.7P0.7-2.5CFP0.7-5.0CFP0.7-7.5CFP0.7-10.0CFP0.7-12.5CFP0.7-15.0CFP0.7-17.5CF
No cycles280.07 ± 9.95269.69 ± 10.02267.43 ± 6.20266.54 ± 7.31265.80 ± 7.27265.69 ± 8.99265.45 ± 6.29252.88 ± 7.03
With cycles273.24 ± 2.33266.82 ± 2.32272.66 ± 0.66270.37± 84271.06 ± 47270.09 ± 1.49268.27 ± 0.97265.40 ± 4.81
Variation (%)−2.4−1.1+2.0+1.4+2.0+1.7+1.1+5.0
Table 11. Density variation.
Bulk Density (kg/m3)
SeriesReferenceRP0.9-5.0CFRP0.9-10.0CFRP0.9-15.0CF
Bulk density (kg/m3)1094.01 ± 62.241007.68 ± 4.71829.69 ± 1.70845.31 ± 6.43
Variation (%)−7.9−24.2−22.7
Table 12. MPC for the commercial and recycled series.
BinderRatio
(w/b)
MPCREFCoconut Fiber
5%10%15%
Commercial gypsum0.7Kflex3.303.834.014.20
Recycled gypsum0.9-2.181.391.61
Commercial gypsum0.7Kcomp6.248.148.398.27
Recycled gypsum0.9-3.342.112.09
Table 13. Initial inventory and quantification of the experimental recovery of solid materials for 40 × 30 × 1.5 cm test specimens.
SampleGypsum
(g)
Coconut
Fiber
(g)
Gypsum
Weighting
(%)
Coconut
Fiber
Weighting
(%)
Recovered
Gypsum
(g)
Recovered
Coconut
Fiber
(g)
Recovery
Potential
Gypsum
(%)
Recovery
Potential
Coconut
Fiber
(%)
P0.7-2.5CF2047.505.8815.48%3.60%1030.712.6550.3444.99
P0.7-5.0CF1995.0011.7615.08%7.20%1004.295.2950.3444.99
P0.7-7.5CF1942.5017.4314.68%10.67%977.867.8450.3444.99
P0.7-10.0CF1890.0023.3114.29%14.27%951.4310.4950.3444.99
P0.7-12.5CF1837.5029.1913.89%17.87%925.0013.1350.3444.99
P0.7-15.0CF1785.0035.0713.49%21.47%898.5715.7850.3444.99
P0.7-17.5CF1732.5040.7413.10%24.94%872.1418.3350.3444.99
Total13,230.00163.38100.00%100.00%6660.0073.50
Experimental recovery rates. The mass allocation per sample is proportional to the initial solid inventory.
Table 14. BCI results for coconut fiber-reinforced gypsum boards (120 × 250 × 1.25 cm).
SampleInput phase (Materials Recovered)In the End-of-Life Phase (Material Returned)BCI
(%)
Coconut
Fiber
(g)
Gypsum
(g)
Totalmi
(g)
Materials
Recovered
Downcycling
Coconut
Fiber
(g)
Downcycling
Gypsum
(g)
Disposed
Materials
(g)
Coconut
Fiber/
Gypsum
Totalwo
(g)
Material Returned
Ren
(g)
Virgin
(g)
Dow
(g)
Dow
(g)
P0.7-
REF
0.0043,750.0043,750.000.0000.00022,023.7521,726.2543,750.000.2520.126
P0.7-2.5CF122.5042,656.2542,778.750.00355.1121,473.1621,250.4842,778.750.2520.127
P0.7-5.0CF245.0041,562.5041,807.500.006110.2620,922.5620,774.7141,807.500.2520.129
P0.7-7.5CF363.1340,468.7540,831.880.009163.3720,371.9720,296.5440,831.880.2510.130
P0.7-10.0CF485.6339,375.0039,860.630.012218.4919,821.3819,820.7739,860.630.2510.132
P0.7-12.5CF608.1338,281.2538,889.380.016273.6019,270.7819,345.0038,889.380.2510.133
P0.7-15.0CF730.6337,187.5037,918.130.019328.7118,720.1918,869.2337,918.130.2510.135
P0.7-17.5CF848.7536,093.7536,942.500.023381.8518,169.5918,391.0536,942.500.2510.137
Ren = renewable material input; Virgin = virgin material input; T o t a l m i = total material input (renewable and virgin); Dow = material output such as “downcycling” (lower-quality recycling); Disposed materials; T o t a l m o = total output (“downcycles” and disposed materials).
Table 15. Quantification of the impact categories evaluated in the LCA.
MixtureModuleADP
(MJ)
GWP
(kg CO2eq)
ODP
(kgCFC-11eq)
AP
(kg SO2eq)
POCP
(kg C2H4 eq)
EP
(kg PO4 eq)
REFA13.21 × 1011.90 × 1002.33 × 10−77.60 × 10−33.65 × 10−49.98 × 10⁻⁴
A20.00 × 1000.00 × 1000.00 × 1000.00 × 1000.00 × 1000.00 × 100
A33.84 × 10−13.01 × 10−25.55 × 10−101.27 × 10−45.53 × 10−62.90 × 10⁻⁵
Total3.25 × 1011.93 × 1002.34 × 10−77.72 × 10−33.71 × 10−41.03 × 10⁻³
P0.7-5.0CFA13.08 × 1011.82 × 1002.22 × 10−77.31 × 10−33.51 × 10−49.69 × 10⁻⁴
A21.04 × 10−17.44 × 10−31.33 × 10−101.86 × 10−51.17 × 10−64.73 × 10⁻⁶
A33.66 × 10−12.87 × 10−25.29 × 10−101.21 × 10−45.28 × 10−62.77 × 10⁻⁵
Total3.12 × 1011.86 × 1002.23 × 10−77.45 × 10−33.57 × 10−41.00 × 10⁻³
P0.7-10.0CFA12.94 × 1011.75 × 1002.11 × 10−77.01 × 10−33.36 × 10−49.39 × 10⁻⁴
A21.04 × 10−17.44 × 10−31.33 × 10−101.86 × 10−51.17 × 10−64.73 × 10⁻⁶
A33.48 × 10−12.73 × 10−25.03 × 10−101.16 × 10−45.02 × 10−62.63 × 10⁻⁵
Total2.99 × 1011.78 × 1002.11 × 10−77.15 × 10−33.43 × 10−49.70 × 10⁻⁴
P0.7-15.0CFA12.81 × 1011.68 × 1002.00 × 10−76.72 × 10−33.22 × 10−49.09 × 10⁻⁴
A23.09 × 10−12.22 × 10−23.98 × 10−105.53 × 10−53.48 × 10−61.41 × 10⁻⁵
A33.30 × 10−12.59 × 10−24.77 × 10−101.10 × 10−44.76 × 10−62.50 × 10⁻⁵
Total2.87 × 1011.72 × 1002.00 × 10−76.89 × 10−33.30 × 10−49.48 × 10⁻⁴
RP0.9-5.0CFA11.06 × 1013.25 × 10−11.82 × 10−81.14 × 10−36.57 × 10−52.54 × 10−4
A21.04 × 10−17.44 × 10−31.33 × 10−101.86 × 10−51.17 × 10−64.73 × 10⁻⁶
A34.09 × 10−13.21 × 10−25.91 × 10−101.36 × 10−45.89 × 10−63.09 × 10⁻⁵
Total1.12 × 1013.65 × 10−11.89 × 10−81.30 × 10−37.27 × 10−52.90 × 10−4
RP0.9-10.0CFA11.04 × 1013.30 × 10−11.76 × 10−81.17 × 10−36.62 × 10−52.62 × 10−4
A21.04 × 10−17.44 × 10−31.33 × 10−101.86 × 10−51.17 × 10−64.73 × 10⁻⁶
A33.89 × 10−13.05 × 10−25.62 × 10−101.29 × 10−45.60 × 10−62.94 × 10⁻⁵
Total1.09 × 1013.68 × 10−11.83 × 10−81.32 × 10−37.30 × 10−52.96 × 10−4
RP0.9-15.0CFA11.01 × 1013.35 × 10−11.71 × 10−81.21 × 10−36.68 × 10−52.70 × 10−4
A23.09 × 10−12.22 × 10−23.98 × 10−105.53 × 10−53.48 × 10−61.41 × 10⁻⁵
A33.69 × 10−12.89 × 10−25.32 × 10−101.22 × 10−45.31 × 10−62.79 × 10⁻⁵
Total1.08 × 1013.86 × 10−11.80 × 10−81.38 × 10−37.56 × 10−53.12 × 10−4
Disclaimer/Publisher’s Note: The statements, opinions and data contained in all publications are solely those of the individual author(s) and contributor(s) and not of MDPI and/or the editor(s). MDPI and/or the editor(s) disclaim responsibility for any injury to people or property resulting from any ideas, methods, instructions or products referred to in the content.