1. Introduction
Steel–concrete composite beams have been widely used in bridge engineering because they can efficiently utilize the tensile capacity of steel girders and the compressive capacity of concrete decks. With the development of prefabricated bridges and accelerated bridge construction, steel–ultra-high-performance concrete (UHPC) composite beams have attracted increasing attention owing to the high strength, durability, toughness, and crack resistance of UHPC [
1]. However, UHPC slabs are usually thinner and stiffer than normal concrete slabs, which makes the interfacial force transfer and deformation compatibility between the steel girder and the deck more critical.
For continuous composite beams, the region near the intermediate support is generally subjected to negative bending moment. In this region, the concrete or UHPC deck is under tension and is prone to cracking, stiffness degradation, and local tensile-deformation concentration. Existing studies on steel–UHPC, steel–ECC, and steel–SFRC composite members have shown that high-performance cementitious materials can improve crack resistance, flexural behavior, and shear-transfer performance in negative-moment regions [
2,
3,
4,
5]. In addition, studies on interface slip and slip-permitted connectors have indicated that appropriately releasing part of the composite action can reduce the tensile demand of the concrete deck and improve deformation coordination [
6,
7]. Therefore, connector design in negative-moment regions should not only satisfy shear resistance requirements, but also account for interfacial slip release and crack-control demand. Similar concepts of active or controllable restraint have also been reported in other concrete structural systems, such as prestressed FRP confinement for improving the axial performance and damage resistance of heat-damaged rectangular RC columns [
8].
Conventional headed stud connectors are the most widely used shear connectors in steel–concrete composite structures. Their load–slip behavior, shear capacity, and failure mechanisms have been investigated through push-out tests, inverse push-out tests, and finite element analyses [
9,
10]. For steel–UHPC composite structures, recent studies further examined demountable headed studs, large-diameter studs, grouped studs, and studs embedded in thin UHPC slabs [
11,
12,
13,
14,
15,
16]. These studies showed that UHPC can improve the local bearing capacity and shear resistance of connectors. However, because of the high stiffness and high local bearing capacity of UHPC, ordinary rigid connectors may produce strong interfacial restraint and limited slip capacity, which is not always favorable for deformation coordination in negative-moment regions.
High-strength bolted connectors have gradually become an important alternative to welded studs in prefabricated steel–UHPC composite beams because of their demountability, construction convenience, and potential for replacement or maintenance. Existing studies on large studs, novel bolted connectors, high-strength friction-grip bolts, embedded-nut bolts, and grouped bolt–UHPC pocket connections have shown that bolt diameter, bolt grade, bolt pretension, bolt-hole clearance, connector arrangement, and loading condition significantly affect connector stiffness, shear capacity, slip capacity, and failure mode [
17,
18,
19,
20,
21,
22,
23,
24,
25]. In particular, bolt-hole clearance is usually regarded as an unfavorable factor because it may cause early slip and reduce initial stiffness. Accordingly, most existing studies have focused on reducing, filling, or restraining such slip, rather than using it as a controllable deformation-release mechanism.
To improve deformation coordination and construction sustainability, several demountable or deformation-compatible connectors have also been proposed. Ataei et al. [
26] and Liu et al. [
27] studied composite beams with deconstructable high-strength friction-grip bolted connectors and showed that such systems could develop considerable interface slip while maintaining composite action. Kozma et al. [
28] investigated demountable shear connectors through push-out tests and evaluated their shear strength, stiffness, slip capacity, ductility, and demountability. Yang et al. [
29] and Jung et al. [
30] proposed different demountable bolted connectors and demonstrated their potential to replace conventional welded studs. Deng et al. [
31] further examined demountable high-strength bolted connectors by reverse push-out tests and finite element analysis for hogging-moment-related loading conditions.
Other studies have also explored new connector configurations and refined numerical modelling methods. Guo et al. [
32] developed a refined finite element model for precast concrete deck–steel beam–UHPC connection concrete connectors, considering bond degradation at the steel–UHPC interface. Xue et al. [
33] investigated composite shear connectors through tests and finite element analysis. Zhang et al. [
34] studied stud-reinforced embedded shear connectors with flanges and proposed corresponding design recommendations. Gao et al. [
35] investigated U-bolt shear connectors and showed that connector geometry can significantly affect interface shear resistance, stiffness, and ductility. Liu et al. [
36] developed finite element models for steel–concrete composite beams with high-strength friction-grip bolt shear connectors and discussed the effects of bolt spacing, hole diameter, bolt pretension, and reinforcement. These studies indicate that connector configuration and contact conditions have significant effects on interfacial shear transfer, load–slip response, and local damage evolution.
Although previous studies have examined steel–UHPC composite beams, high-strength bolted connectors, and deformation-compatible connection systems, bolt-hole clearance is still mainly treated as a construction tolerance or as an unfavorable factor that reduces initial stiffness. Its potential role as a controllable slip-release parameter in negative-moment regions has not been sufficiently investigated. Therefore, this study proposes a controlled-slip bolted shear connector for steel–UHPC composite beams. A validated three-dimensional nonlinear push-out finite element model was established to investigate the effects of bolt-hole clearance, bolt preload, and friction coefficient on the connector-level load–slip response, local UHPC damage, bolt stress distribution, and shear capacity.
2. Project Background
The engineering background of this study is the east approach bridge of Section II of the Urumqi Ring Expressway West Line in Urumqi, Xinjiang, China. The bridge adopts a prefabricated steel–concrete composite girder system consisting of precast deck panels, steel I-girders, shear connectors, and UHPC-filled shear pockets. After UHPC is cast into the reserved pockets and joints, a load-transfer path is formed through the steel flange, shear connector, UHPC, and precast deck panel, thereby ensuring composite action between the steel girder and the deck system.
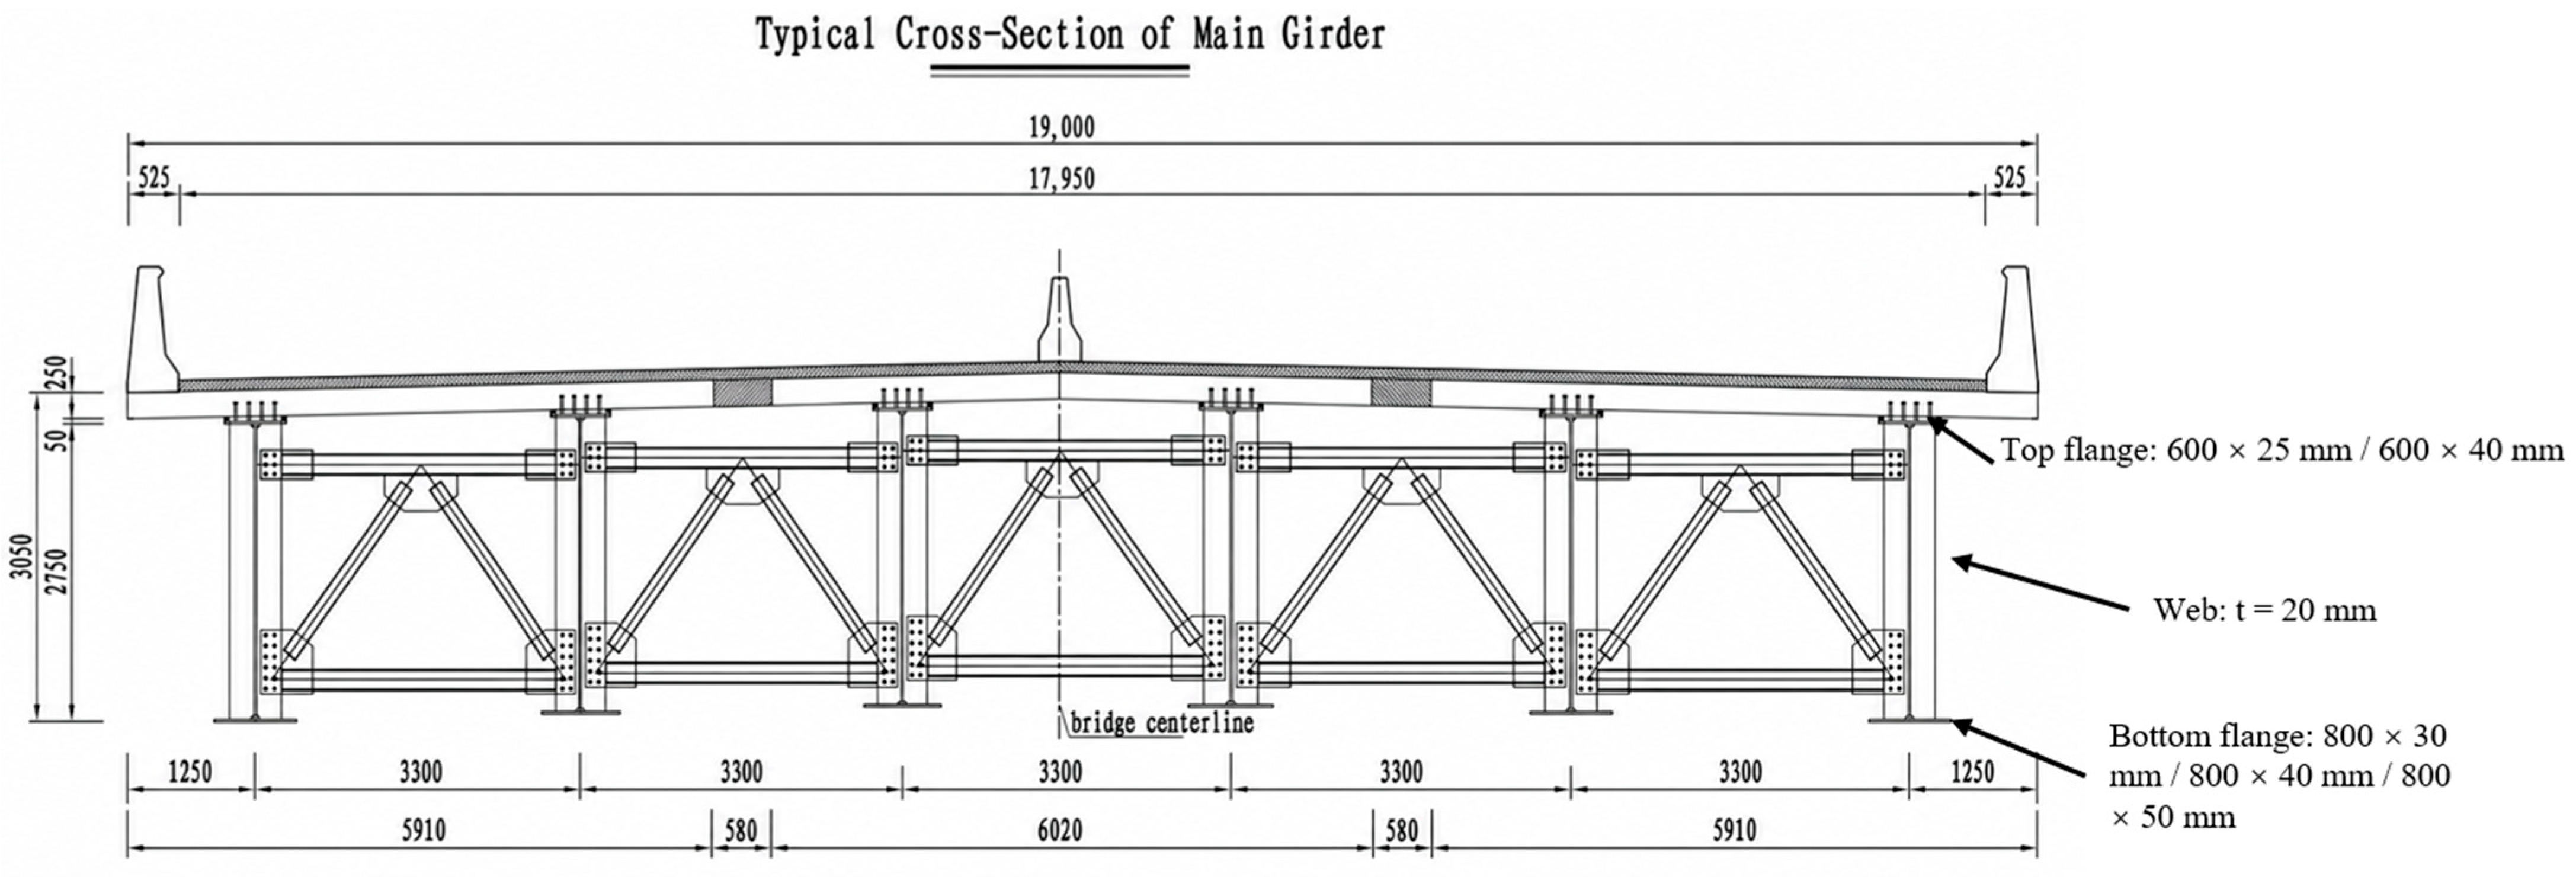
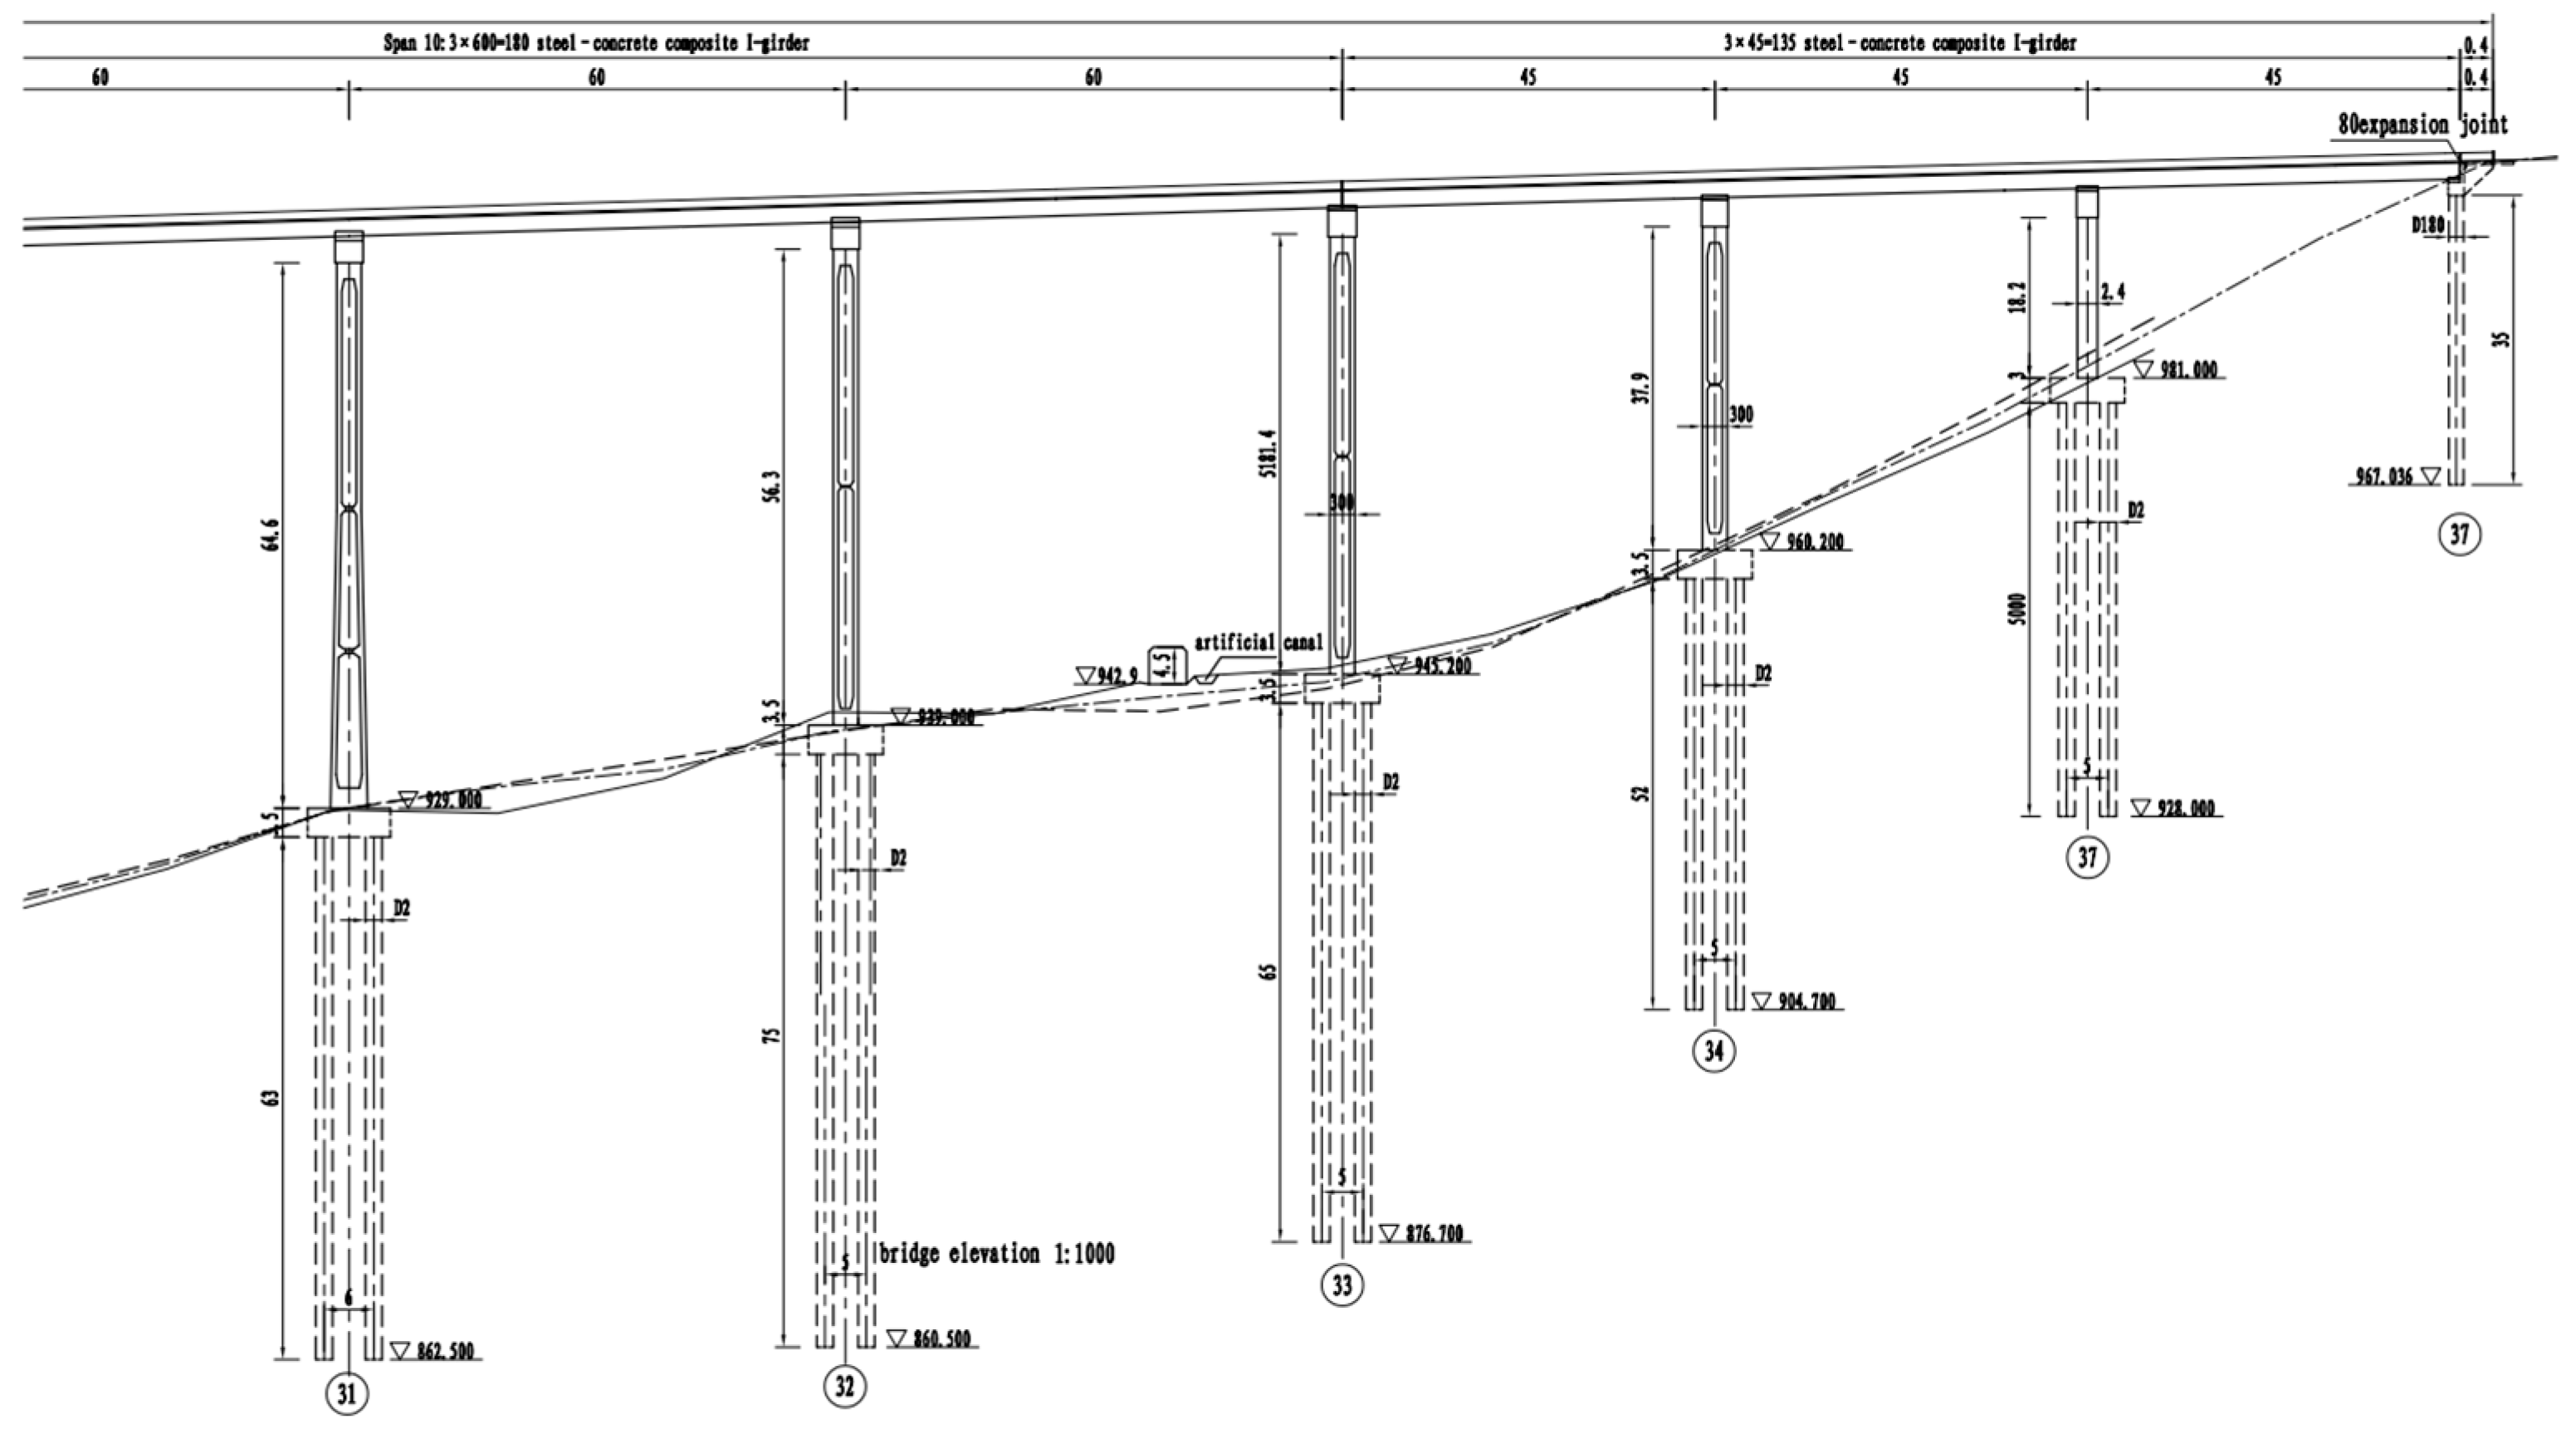
The overall layout and typical structural configuration of the bridge are shown in
Figure 1 and
Figure 2. The total bridge deck width is 19 m, and the superstructure adopts a multi-girder I-shaped composite system. In the positive-moment region, the deck system is mainly subjected to compression, while the steel girder primarily resists tension. Because the bridge is a continuous composite beam structure, negative-moment regions form near the intermediate supports. In these regions, the deck system changes from compression to tension, making local tensile stress development, interface deformation coordination, and crack control important issues in shear connector design.
2.1. Field Load Test
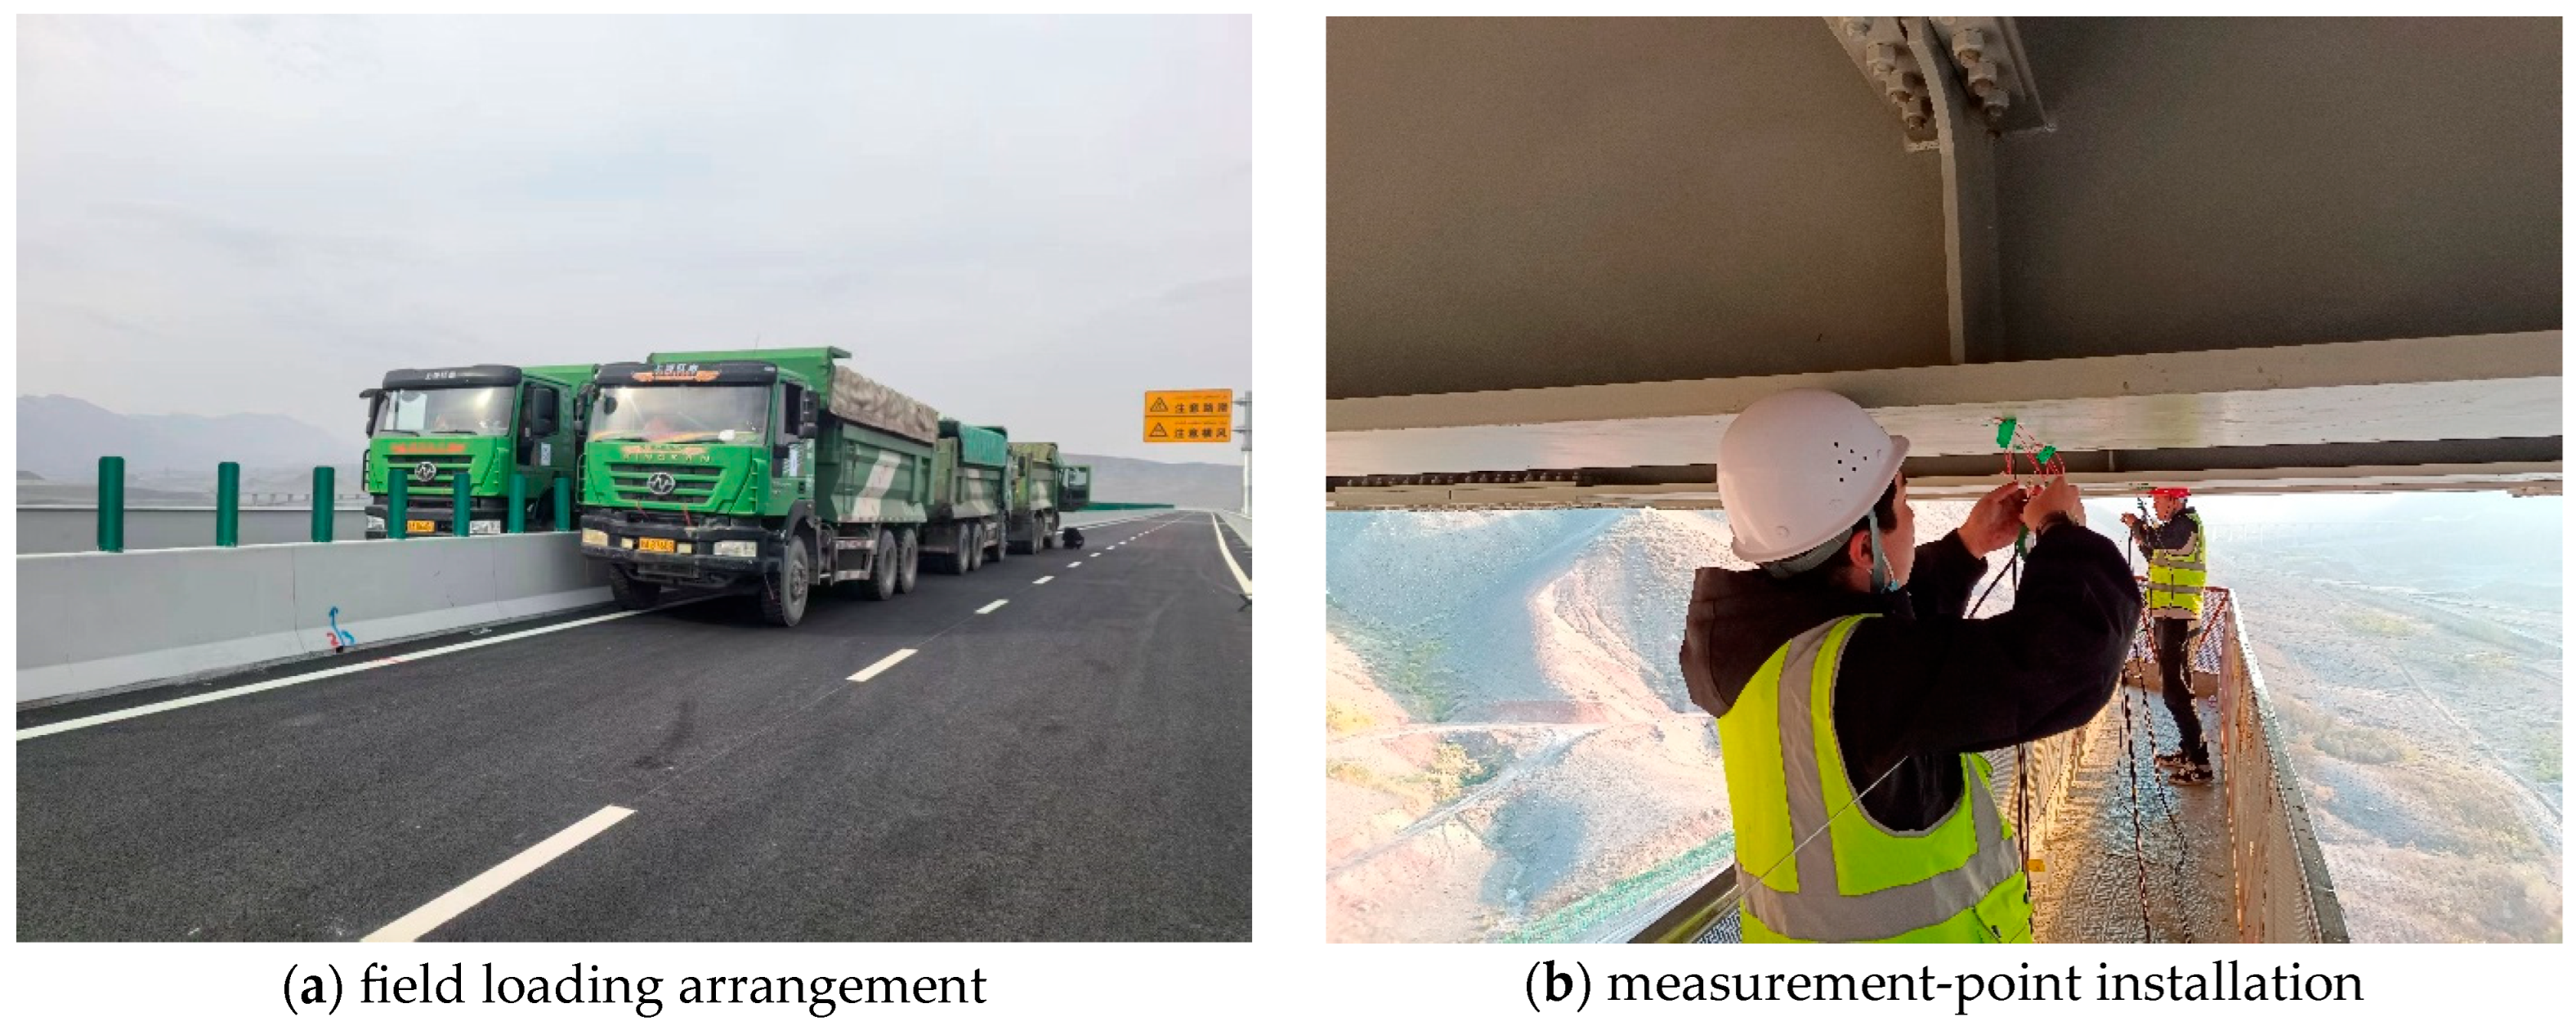
To evaluate the service-stage behavior of the investigated bridge, a field static load test was conducted using test vehicles arranged at representative loading positions. Strain and deflection measurement points were installed at critical sections to examine the global response of the composite girder. The field loading arrangement and measurement-point installation are shown in
Figure 3.
The field static load test showed that the investigated bridge exhibited acceptable global service-stage behavior under the applied test loading. The measured strain distribution and deflection response were generally consistent with the expected behavior of the steel–concrete composite girder. However, field inspection after loading revealed slight surface cracking in the deck near the intermediate support, indicating that the local response in the negative-moment region may differ from the satisfactory global stiffness response.
Therefore, the bridge project is used in this study as the engineering motivation for developing a connector with controlled slip-release capacity. The following push-out finite element model is not intended to reproduce the entire bridge, but to examine the connector-level shear–slip mechanism that may contribute to deformation release at the steel–UHPC interface.
2.2. Design of the Controllable-Slip Connector
In the negative-moment region of continuous composite girders, the deck system is subjected to tensile action. If the shear connector provides excessive initial restraint, the steel girder and deck system may act too strongly together during the early loading stage, which can increase the tensile deformation demand of the deck and promote local stress concentration. Therefore, connector design in this region should not only satisfy the requirement for reliable interfacial shear transfer, but also provide a certain deformation release capacity before full bearing resistance is mobilized.
Based on this concept, a controlled-slip bolted shear connector is proposed in this study. Unlike conventional rigid shear connectors, the proposed connector introduces bolt-hole clearance and bolt preload as two controllable parameters. Bolt preload provides interfacial frictional restraint at the early loading stage, while bolt-hole clearance provides limited slip space between the steel girder and the UHPC connection region before full bolt-hole wall bearing develops.
The expected load-transfer process of the proposed connector can be divided into three main phases. First, the interface shear force is mainly resisted by friction generated by bolt preload, which provides necessary early-stage restraint. Second, after the frictional resistance is overcome, limited relative slip occurs within the reserved bolt-hole clearance, allowing part of the tensile deformation demand in the deck system to be released. Third, as the bolt contacts the hole wall, the connector enters the bearing transfer stage and maintains shear resistance through bolt-hole wall contact.
Therefore, the design objective of the controlled-slip bolted connector is to coordinate early-stage restraint, pre-bearing slip release, and later-stage shear transfer. In the present study, this concept is examined through a connector-level push-out finite element model, with particular attention to the load–slip response, bearing activation, UHPC local damage, and bolt stress state. The results are used to clarify the connector mechanism rather than to directly quantify the crack-control effect of a full-scale continuous composite girder.
3. Finite Element Model
3.1. Model Geometry and Configuration
In studies on shear connectors for steel–concrete composite girders, push-out models are commonly used to characterize connector shear transfer behavior, including the load–slip response, local bearing behavior, and failure characteristics under interfacial shear. For the controlled-slip bolted connector proposed in this study, the key mechanical behavior is concentrated in the connection region, including interfacial friction, clearance-induced slip, bolt-hole wall contact, and local UHPC bearing. Therefore, a push-out finite element model was adopted to investigate the connector-level load-transfer mechanism.
The basic configuration of the finite element model was designed with reference to the loading mechanism of push-out specimens specified in Eurocode 4. The actual bridge connection region was simplified while maintaining the main load-transfer path among the steel girder, UHPC connection region, and bolted connector. In the model, the UHPC slab had a height of 450 mm and a thickness of 100 mm, and the spacing of both the vertical and transverse reinforcement was 100 mm. The steel beam adopted an I-shaped section with a flange width of 300 mm, a depth of 450 mm, a web thickness of 10 mm, and a flange thickness of 20 mm. The steel grade was Q345.
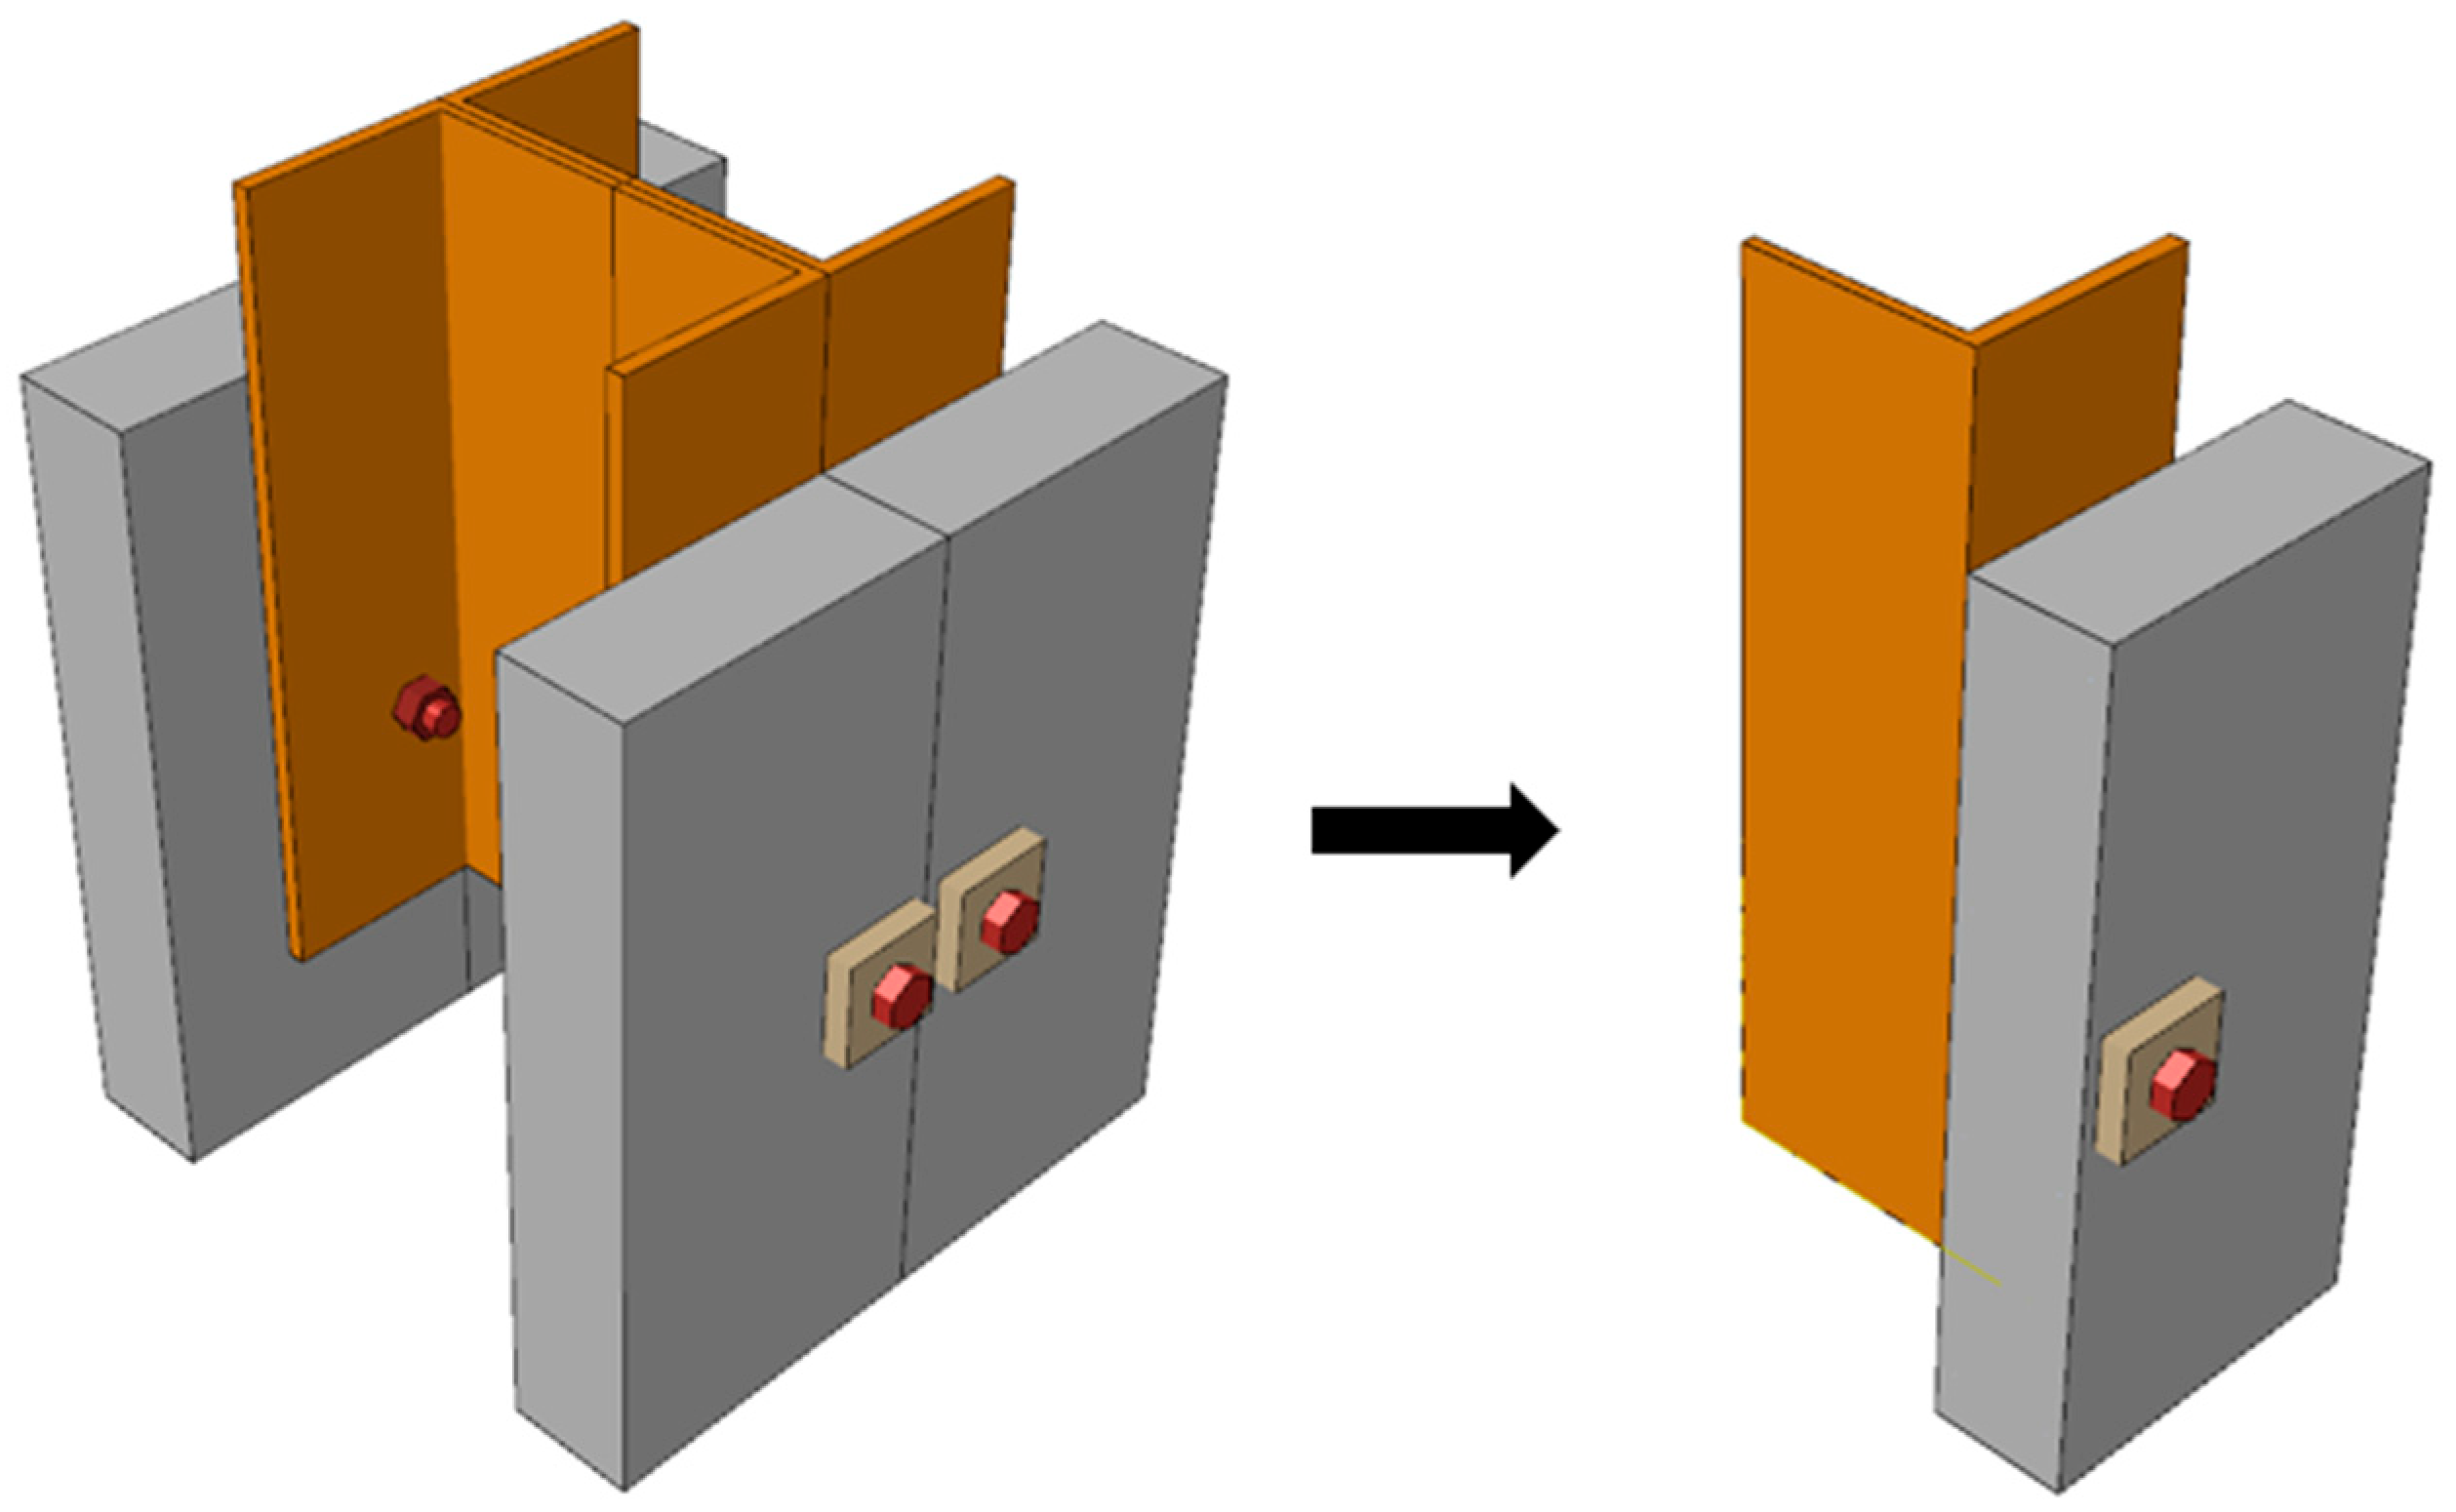
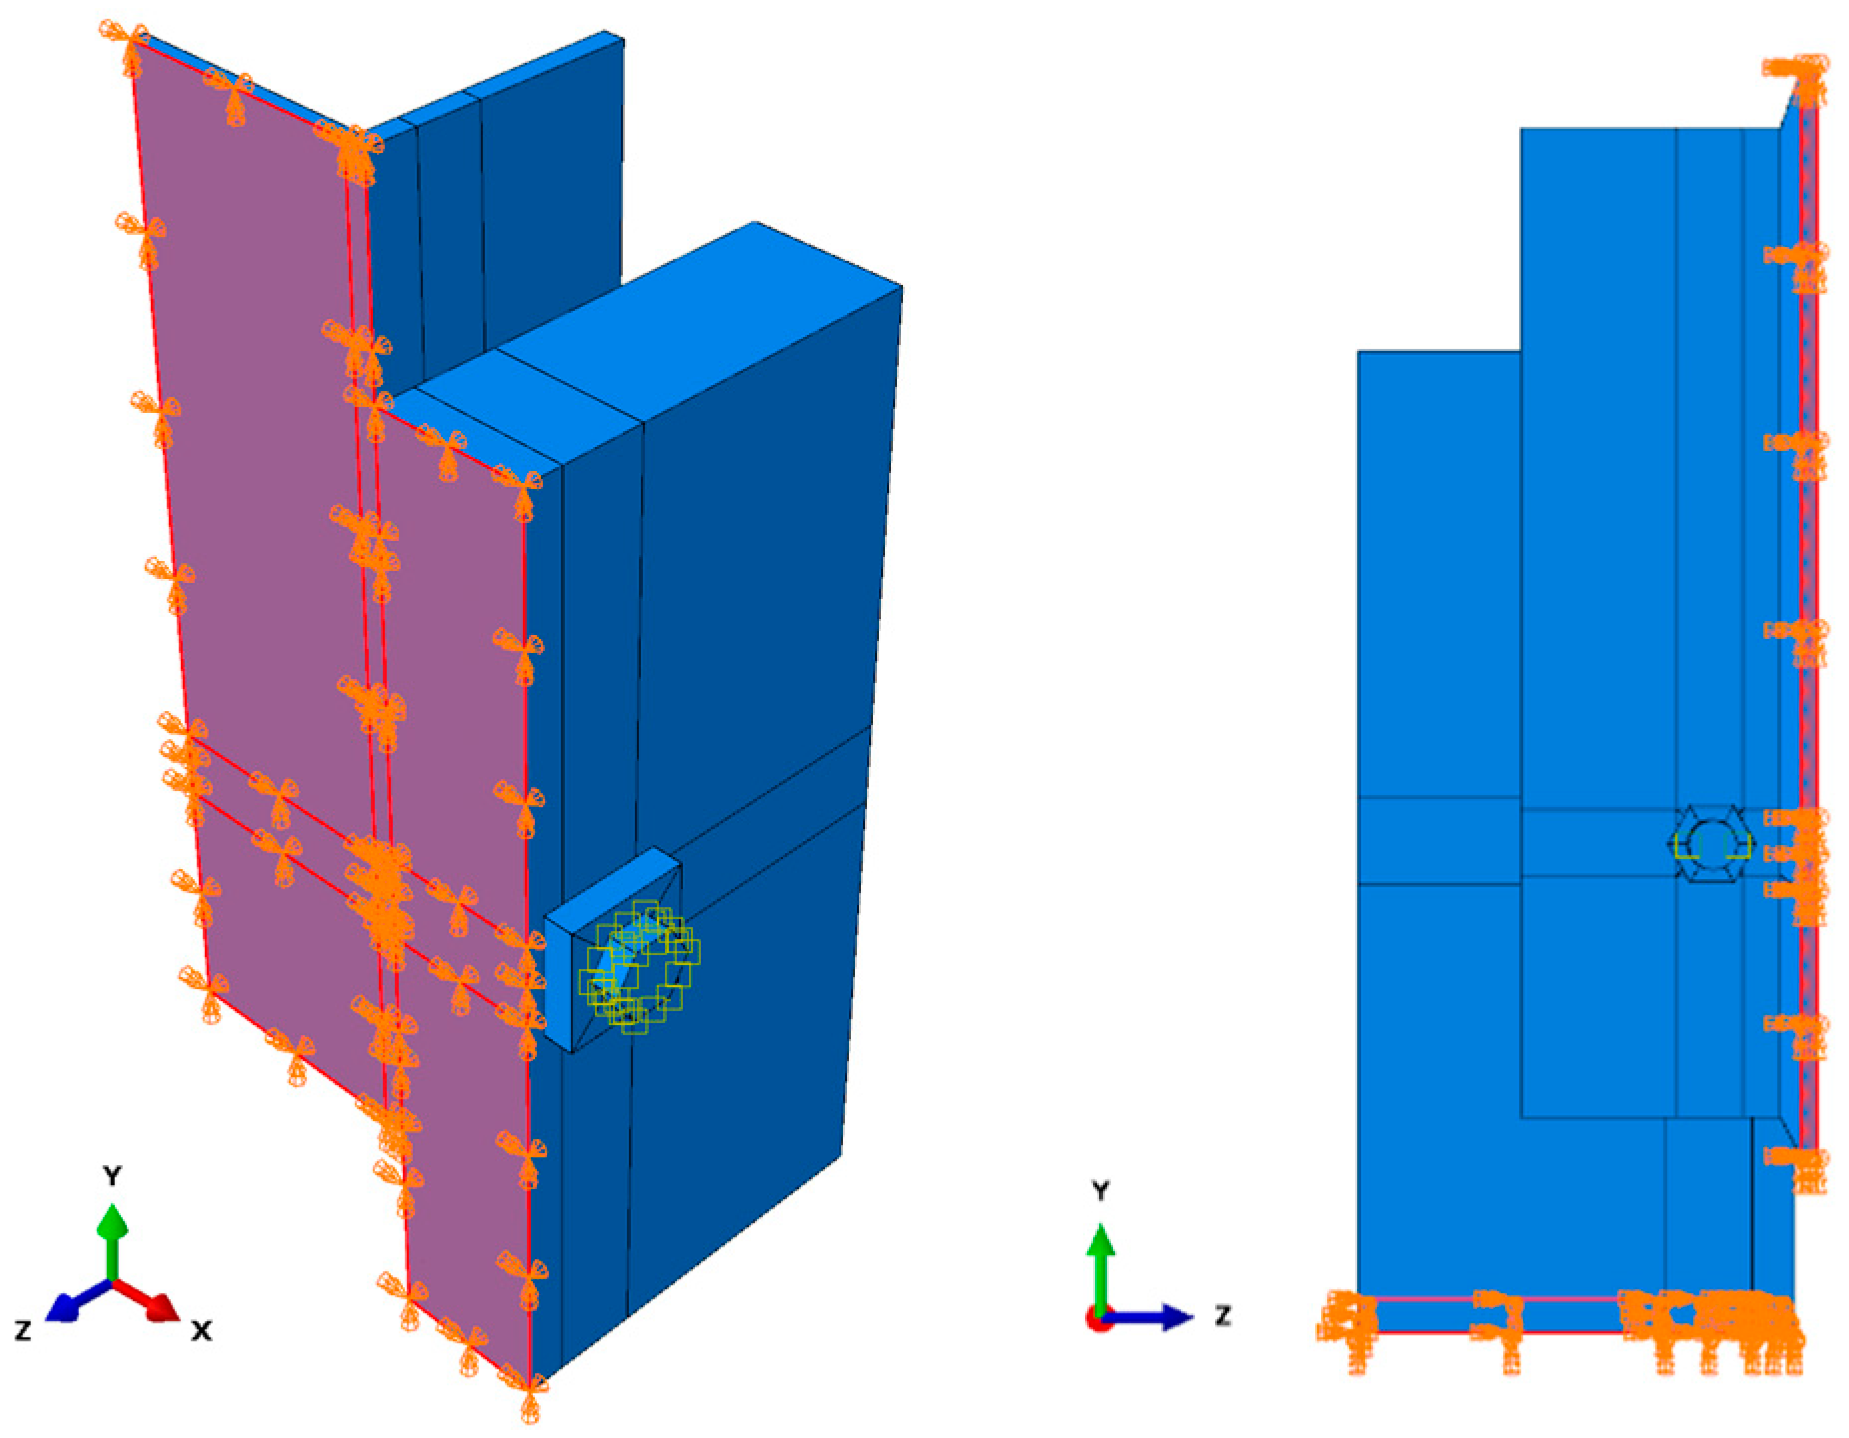
As shown in
Figure 4, a one-quarter push-out finite element model was adopted to improve computational efficiency by taking advantage of geometric and boundary symmetry. The quarter model contained one bolt and represented one-quarter of the complete specimen, which contained four bolts in total. Accordingly, the reaction force obtained from the quarter model was multiplied by four when reporting the load–slip curves and peak loads of the complete specimen. The model consisted of the steel beam, UHPC slab, reinforcement, and high-strength bolted connector. Material nonlinearity, geometric symmetry, and contact nonlinearity were considered to reproduce the staged mechanical response of the connector during frictional restraint, limited slip, and bolt-hole wall bearing. The analysis was performed using the ABAQUS/Explicit module, and the modelling procedure included geometry creation, material definition, contact interaction, boundary condition assignment, and displacement-controlled loading.
3.2. Material Constitutive Models
UHPC was simulated using the concrete damage plasticity (CDP) model in ABAQUS 2023 to describe damage evolution and stiffness degradation under compression and tension. The CDP parameters were selected with reference to previous UHPC finite element studies [
37] and are summarized in
Table 1. The material properties of UHPC, steel, reinforcement, and high-strength bolts used in the finite element model are listed in
Table 2.
3.2.1. Constitutive Model of UHPC in Compression
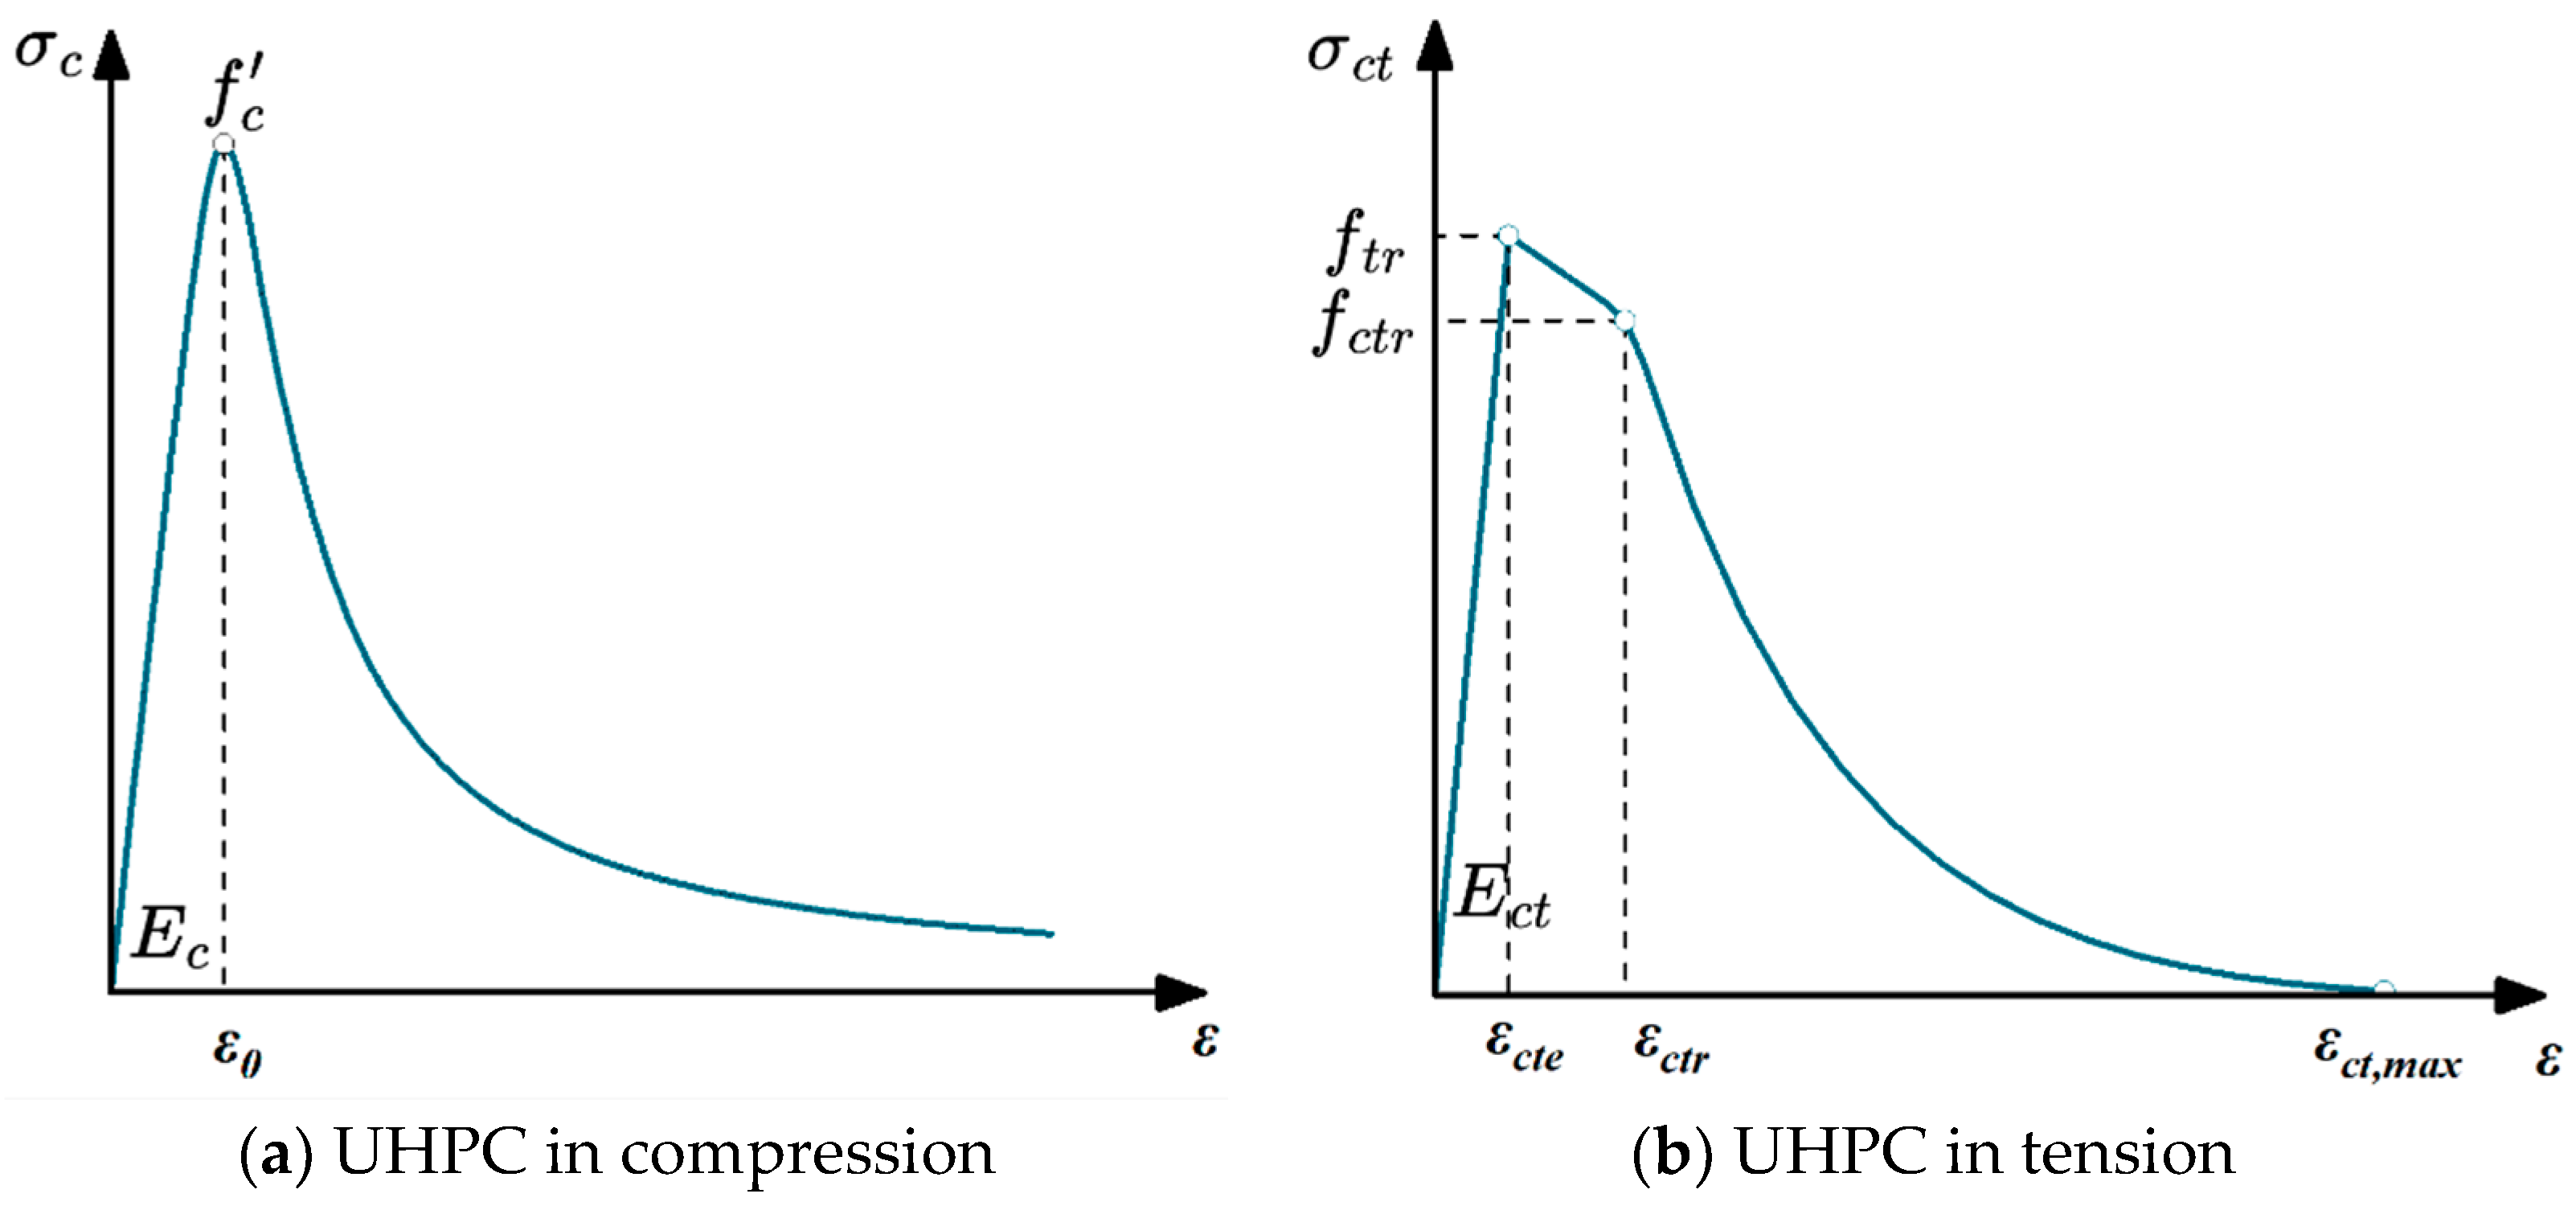
The compressive stress–strain relationship of UHPC was described using the two-stage model proposed by Yang and Fang [
38], as shown in
Figure 5a. The constitutive relationship is expressed as Equation (1).
where
is the compressive stress of UHPC;
is the axial compressive strength;
is the compressive strain;
is the strain corresponding to the peak compressive stress;
is the strain ratio;
is the stiffness ratio;
is the initial elastic modulus; and Esec is the secant modulus at the peak point.
3.2.2. Constitutive Model of UHPC in Tension
The tensile stress–strain relationship of UHPC was described using the three-stage model proposed by Shi et al. [
39], as shown in
Figure 5b. The model consists of an elastic ascending branch, a hardening or transition branch, and an exponential softening branch, and can describe the post-cracking stress degradation and residual tensile capacity of UHPC. The constitutive relationship is expressed as Equation (2).
where
is the tensile stress of UHPC;
is the tensile strain of UHPC;
is the tensile elastic modulus;
is the tensile stress corresponding to the end of the elastic stage;
is the residual tensile strength;
is the strain at the end of the elastic stage;
is the strain corresponding to the residual tensile strength;
is the ultimate tensile strain; and
and
are fitting parameters for the exponential softening branch. The numerical parameters adopted for the compressive and tensile constitutive models of UHPC are summarized in
Table 3. The resulting stress–strain relationships are shown in
Figure 5.
3.2.3. Constitutive Models of Steel
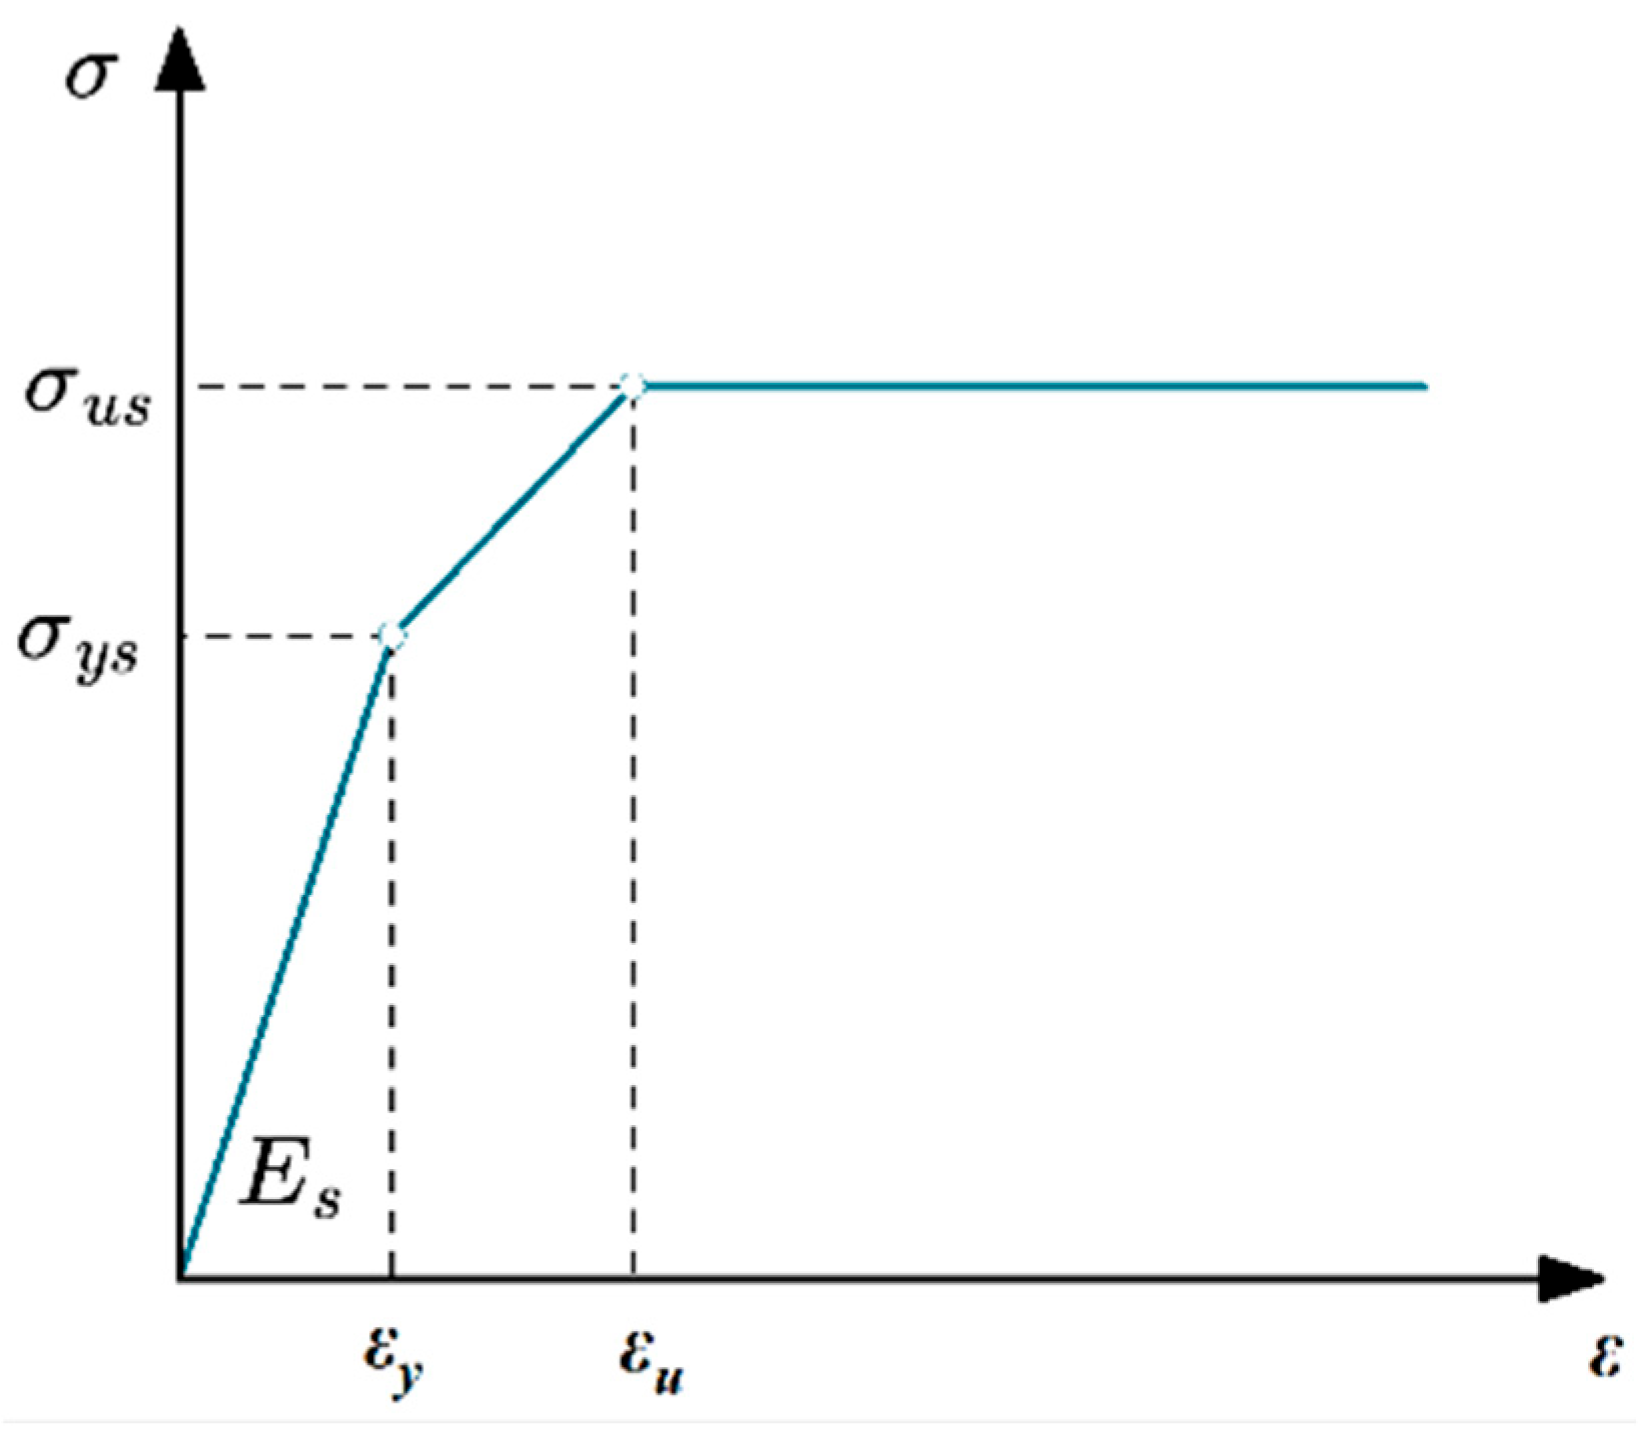
The steel beam, reinforcement, and high-strength bolts were simulated using elastoplastic constitutive models. The steel beam and reinforcement were represented by a bilinear elastoplastic model to describe plastic development after yielding. The high-strength bolts were simulated using a trilinear stress–strain model, which consists of an elastic stage, a post-yield hardening stage, and an ultimate strength plateau. The stress–strain relationship of the high-strength bolt is expressed as Equation (3).
where
is the elastic modulus of the high-strength bolt;
is the yield strength of the high-strength bolt;
is the tensile strength of the high-strength bolt;
is the strain of the high-strength bolt;
is the yield strain; and
is the strain corresponding to the tensile strength. The stress–strain relationship of steel is shown in
Figure 6.
The parameters of the finite element specimens are listed in
Table 4. Two groups of models were established to investigate the effects of bolt-hole clearance and bolt preload separately. In the clearance group, the preload was fixed at
, whereas in the preload group, the radial clearance was fixed at
mm. This arrangement was adopted to isolate the influence of each parameter rather than to form a full-factorial parameter matrix. Here,
denotes the radial bolt-hole clearance, and the hole diameter was determined as
, where
is the equivalent bolt-shank diameter. The standard bolt pretension
was calculated as
according to the specification [
40], where
is the specified minimum tensile strength of the bolt and
is the effective tensile area of the bolt. Therefore,
,
, and
represent 50%, 75%, and 100% of the standard bolt pretension, respectively.
3.3. Element Types, Mesh Division, and Contact Interactions
In the finite element model, the steel beam, UHPC slab, and high-strength bolts were simulated using C3D8R eight-node three-dimensional solid elements with reduced integration. This element type can effectively capture local bearing, contact nonlinearity, and bending–shear deformation of the bolt shank. The reinforcement in the slab was simulated using T3D2 two-node three-dimensional truss elements and was embedded into the UHPC slab to establish displacement compatibility. This fully bonded treatment neglects reinforcement–UHPC bond slip, which was not considered in the present connector-level analysis focused on steel–UHPC interface slip and bolt-hole interaction.
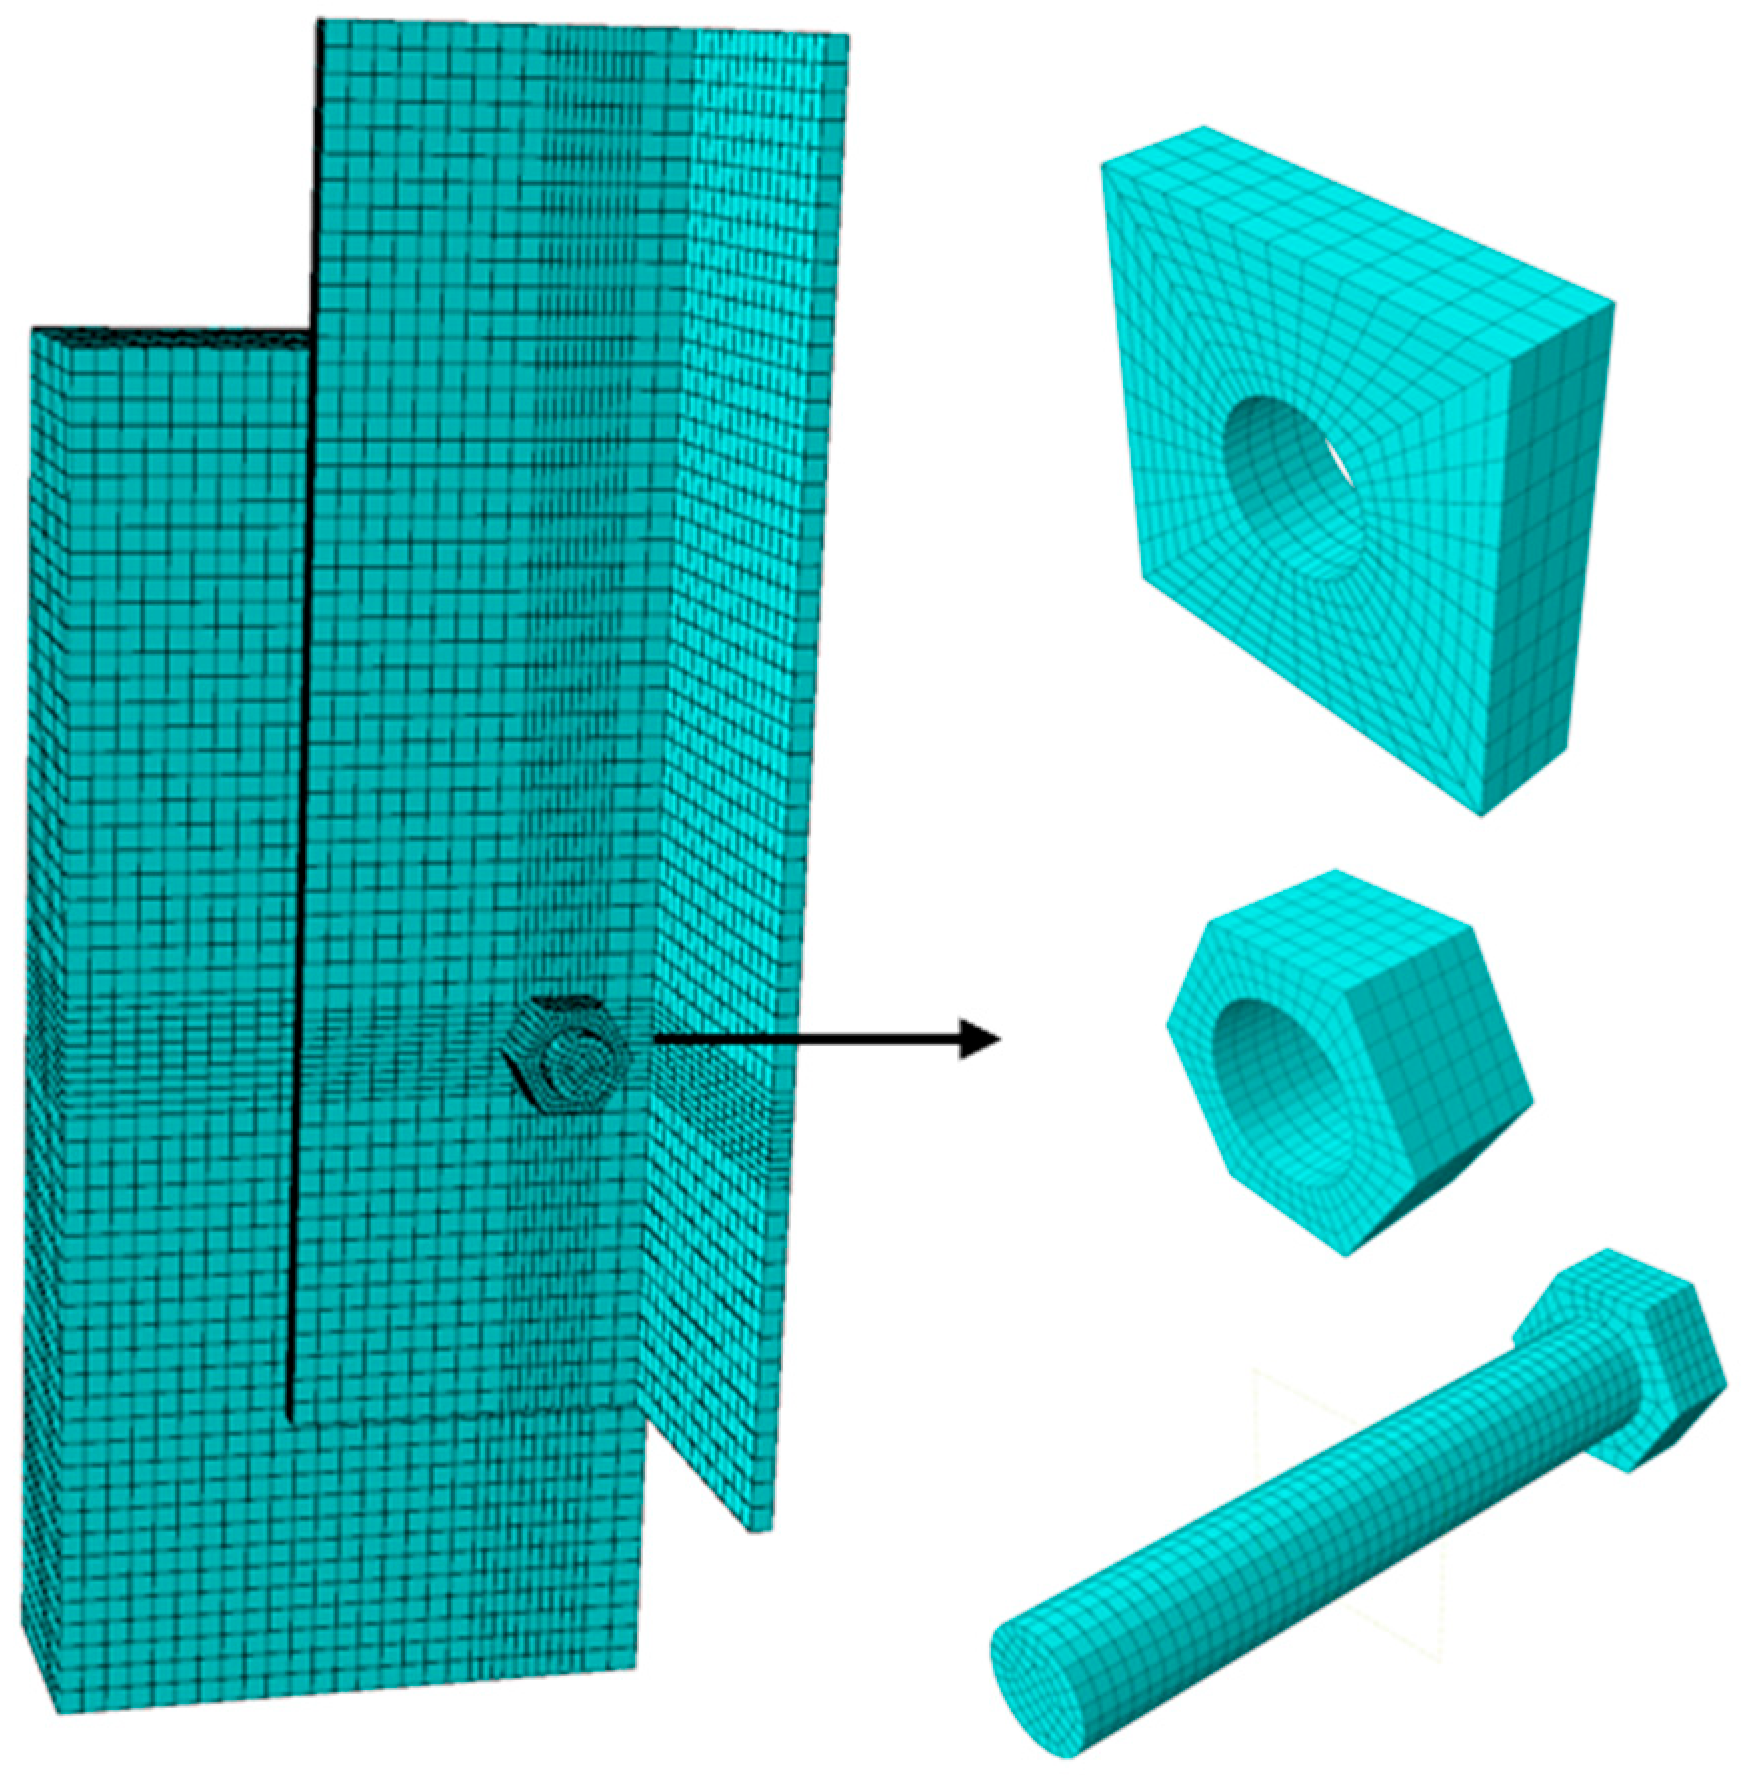
Considering the pronounced stress concentration and contact nonlinearity around the bolt shank, UHPC hole wall, and steel flange contact regions, refined meshes were adopted in these critical regions, while coarser meshes were used in the remaining regions. The mesh division of the finite element model is shown in
Figure 7.
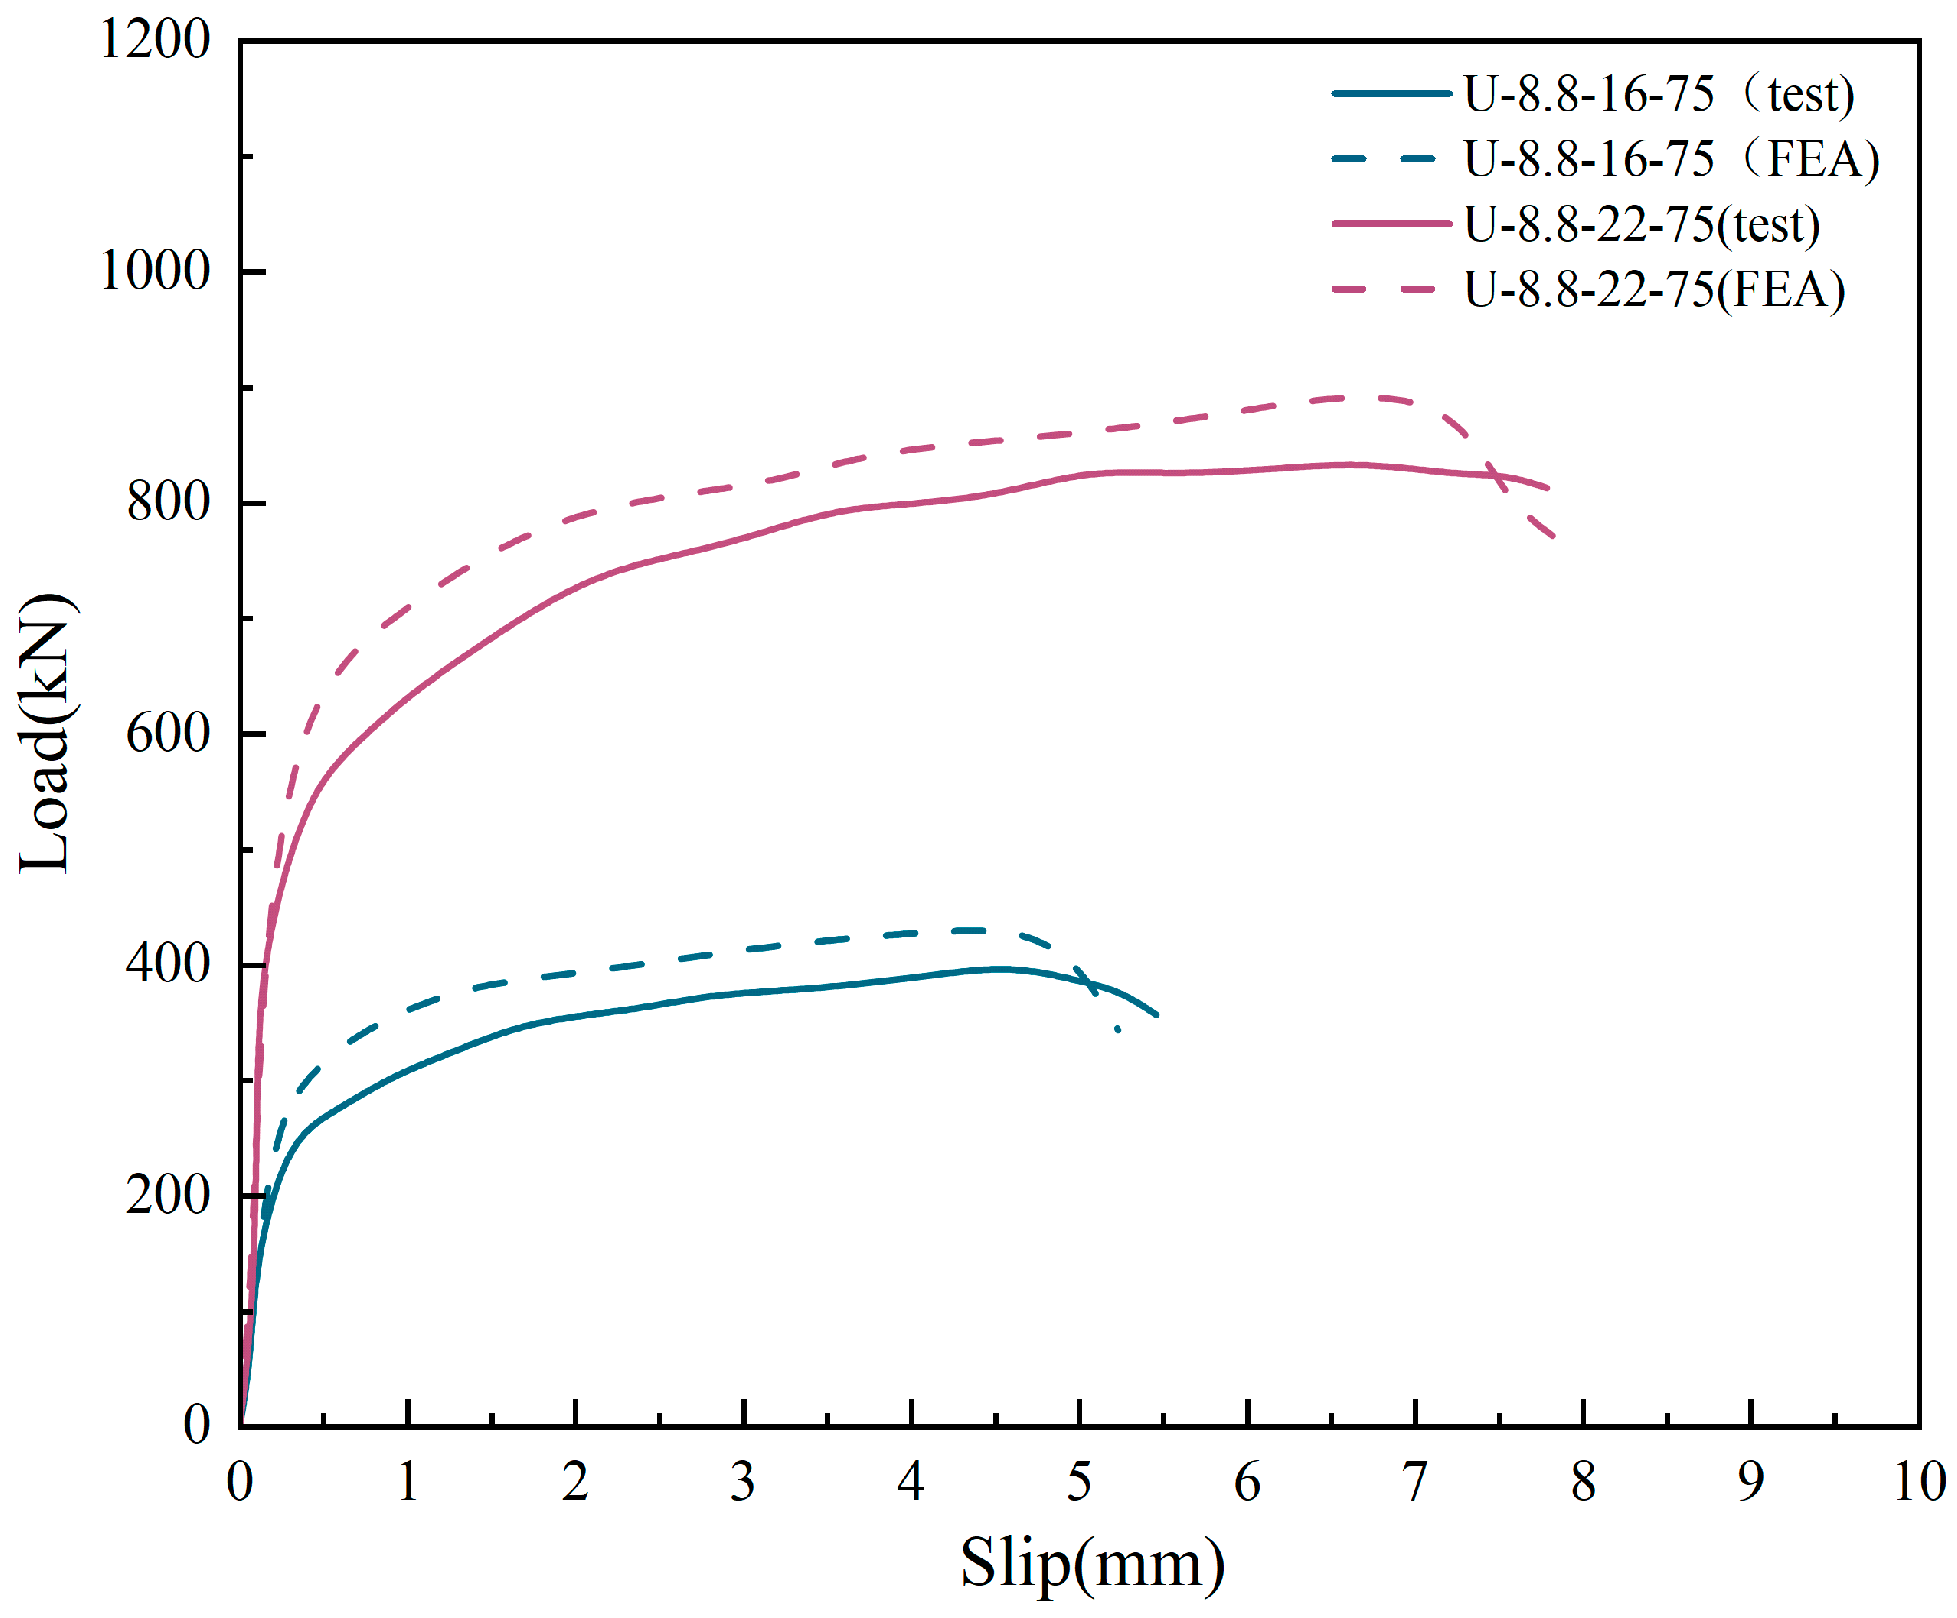
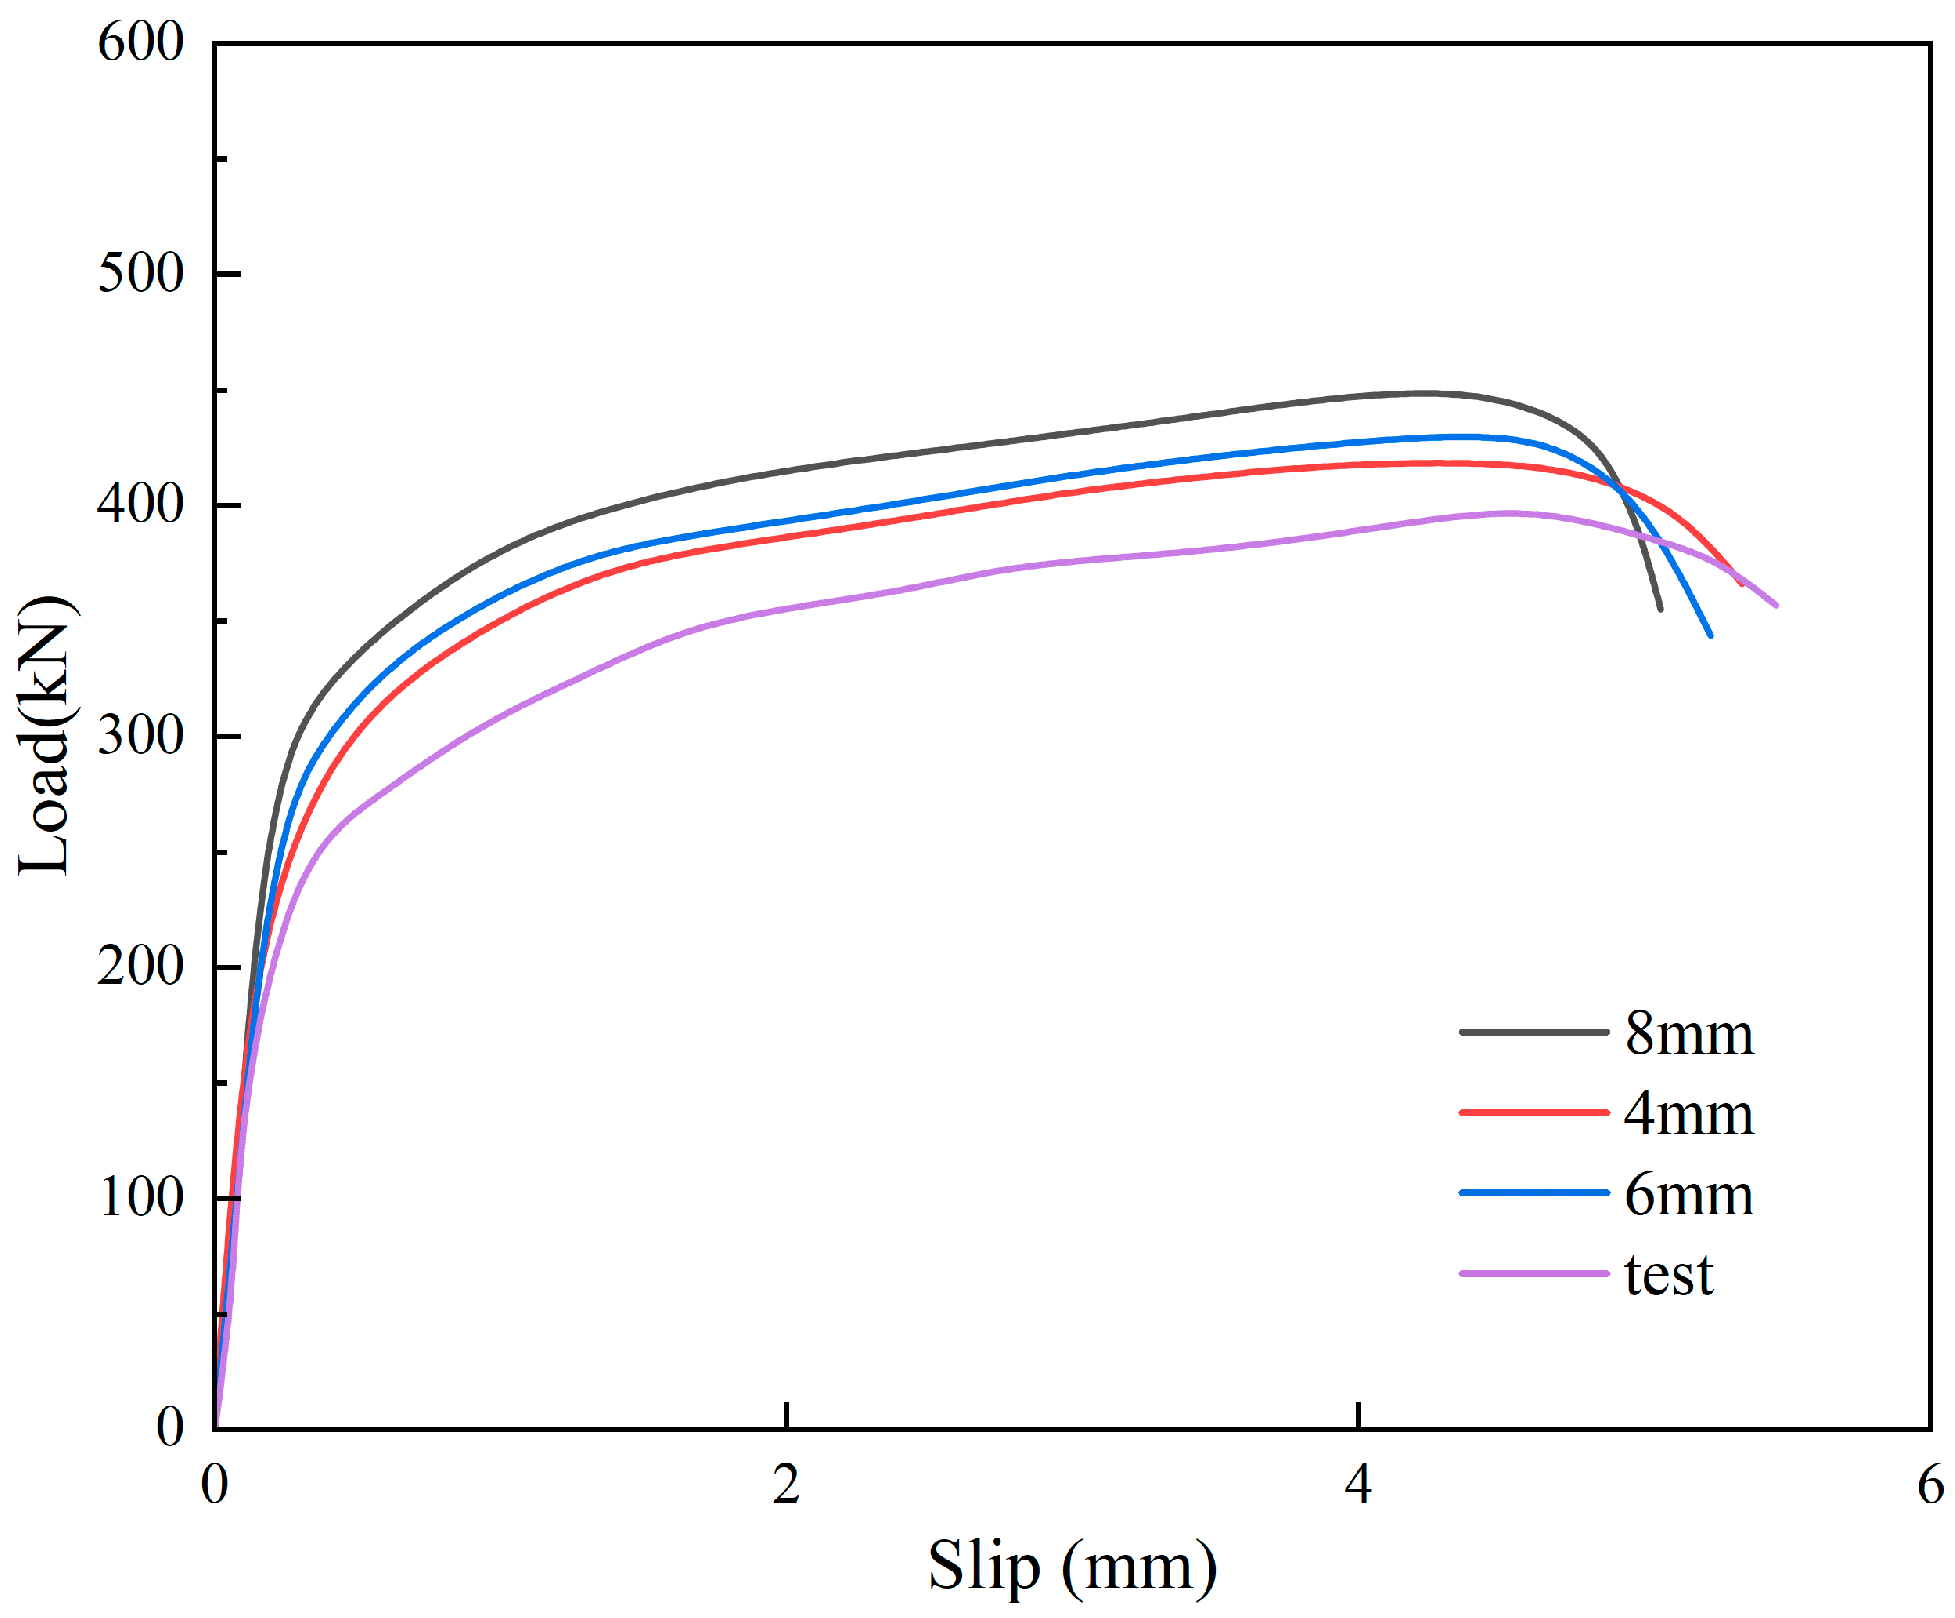
To examine the influence of the global mesh size on the numerical results, a mesh sensitivity analysis was conducted using the validation specimen U-8.8-16-75 reported by Fang et al. [
41], as shown in
Figure 8. Global mesh sizes of 8, 6, and 4 mm were compared, and the corresponding load–slip curves exhibited similar overall trends, with limited differences in peak load and peak slip. Therefore, a global mesh size of 6 mm was selected considering both computational accuracy and efficiency. The mesh sensitivity analysis was primarily used to determine the mesh size in the non-critical regions. To capture the pronounced stress gradients and contact nonlinearity near the bolt shank, UHPC hole wall, and steel flange, these local contact regions were further refined to 2 mm in the final models. Accordingly, the adopted mesh scheme consisted of a 2 mm local mesh in the critical contact regions and a 6 mm mesh in the remaining regions.
Surface-to-surface contact interactions were adopted in the model, with the stiffer surface defined as the master surface. Hard contact was used in the normal direction to prevent penetration between contact surfaces, while the penalty friction formulation was used in the tangential direction to simulate frictional load transfer during interfacial slip. The friction coefficient was taken as 0.35 for both the steel–UHPC interface and the steel–steel interface [
42]. The main contact pairs included the steel flange–UHPC interface, bolt shank–UHPC hole wall interface, bolt shank–steel hole wall interface, and bolt head–adjacent steel component interface.
3.4. Boundary Conditions and Loading Method
The boundary conditions of the finite element model are shown in
Figure 9. Since the push-out specimen was symmetric in both geometry and loading configuration, a one-quarter model was adopted to improve computational efficiency. Symmetry constraints were applied on the corresponding symmetry planes. On the XY symmetry plane, the displacement normal to the plane was constrained, namely U3 = 0. On the YZ symmetry plane, the displacement normal to the plane was constrained, namely U1 = 0. These constraints were applied to the steel beam, UHPC slab, and bolt nodes located on the corresponding symmetry planes.
To simulate the support condition of the push-out specimen, the bottom support region of the UHPC slab was fixed by constraining the translational degrees of freedom in all three directions, namely . Displacement-controlled loading was applied through a reference point coupled to the loading region at the top of the steel beam.
The analysis procedure consisted of two consecutive steps with a total duration of 1.5 s. In the first step, which lasted 0.5 s, bolt preload was introduced using an equivalent cooling method. A prescribed temperature decrease was applied to the bolt shank to generate axial contraction and the corresponding tensile force. The temperature decrease was calibrated so that the target preload level, namely
,
, or
, was reached before push-out loading. In the second step, which lasted 1.0 s, a vertical displacement was applied to the reference point using a smooth-step amplitude to obtain the load–slip response and reduce dynamic oscillations. Fixed mass scaling was applied to elements with stable time increments below the target value of
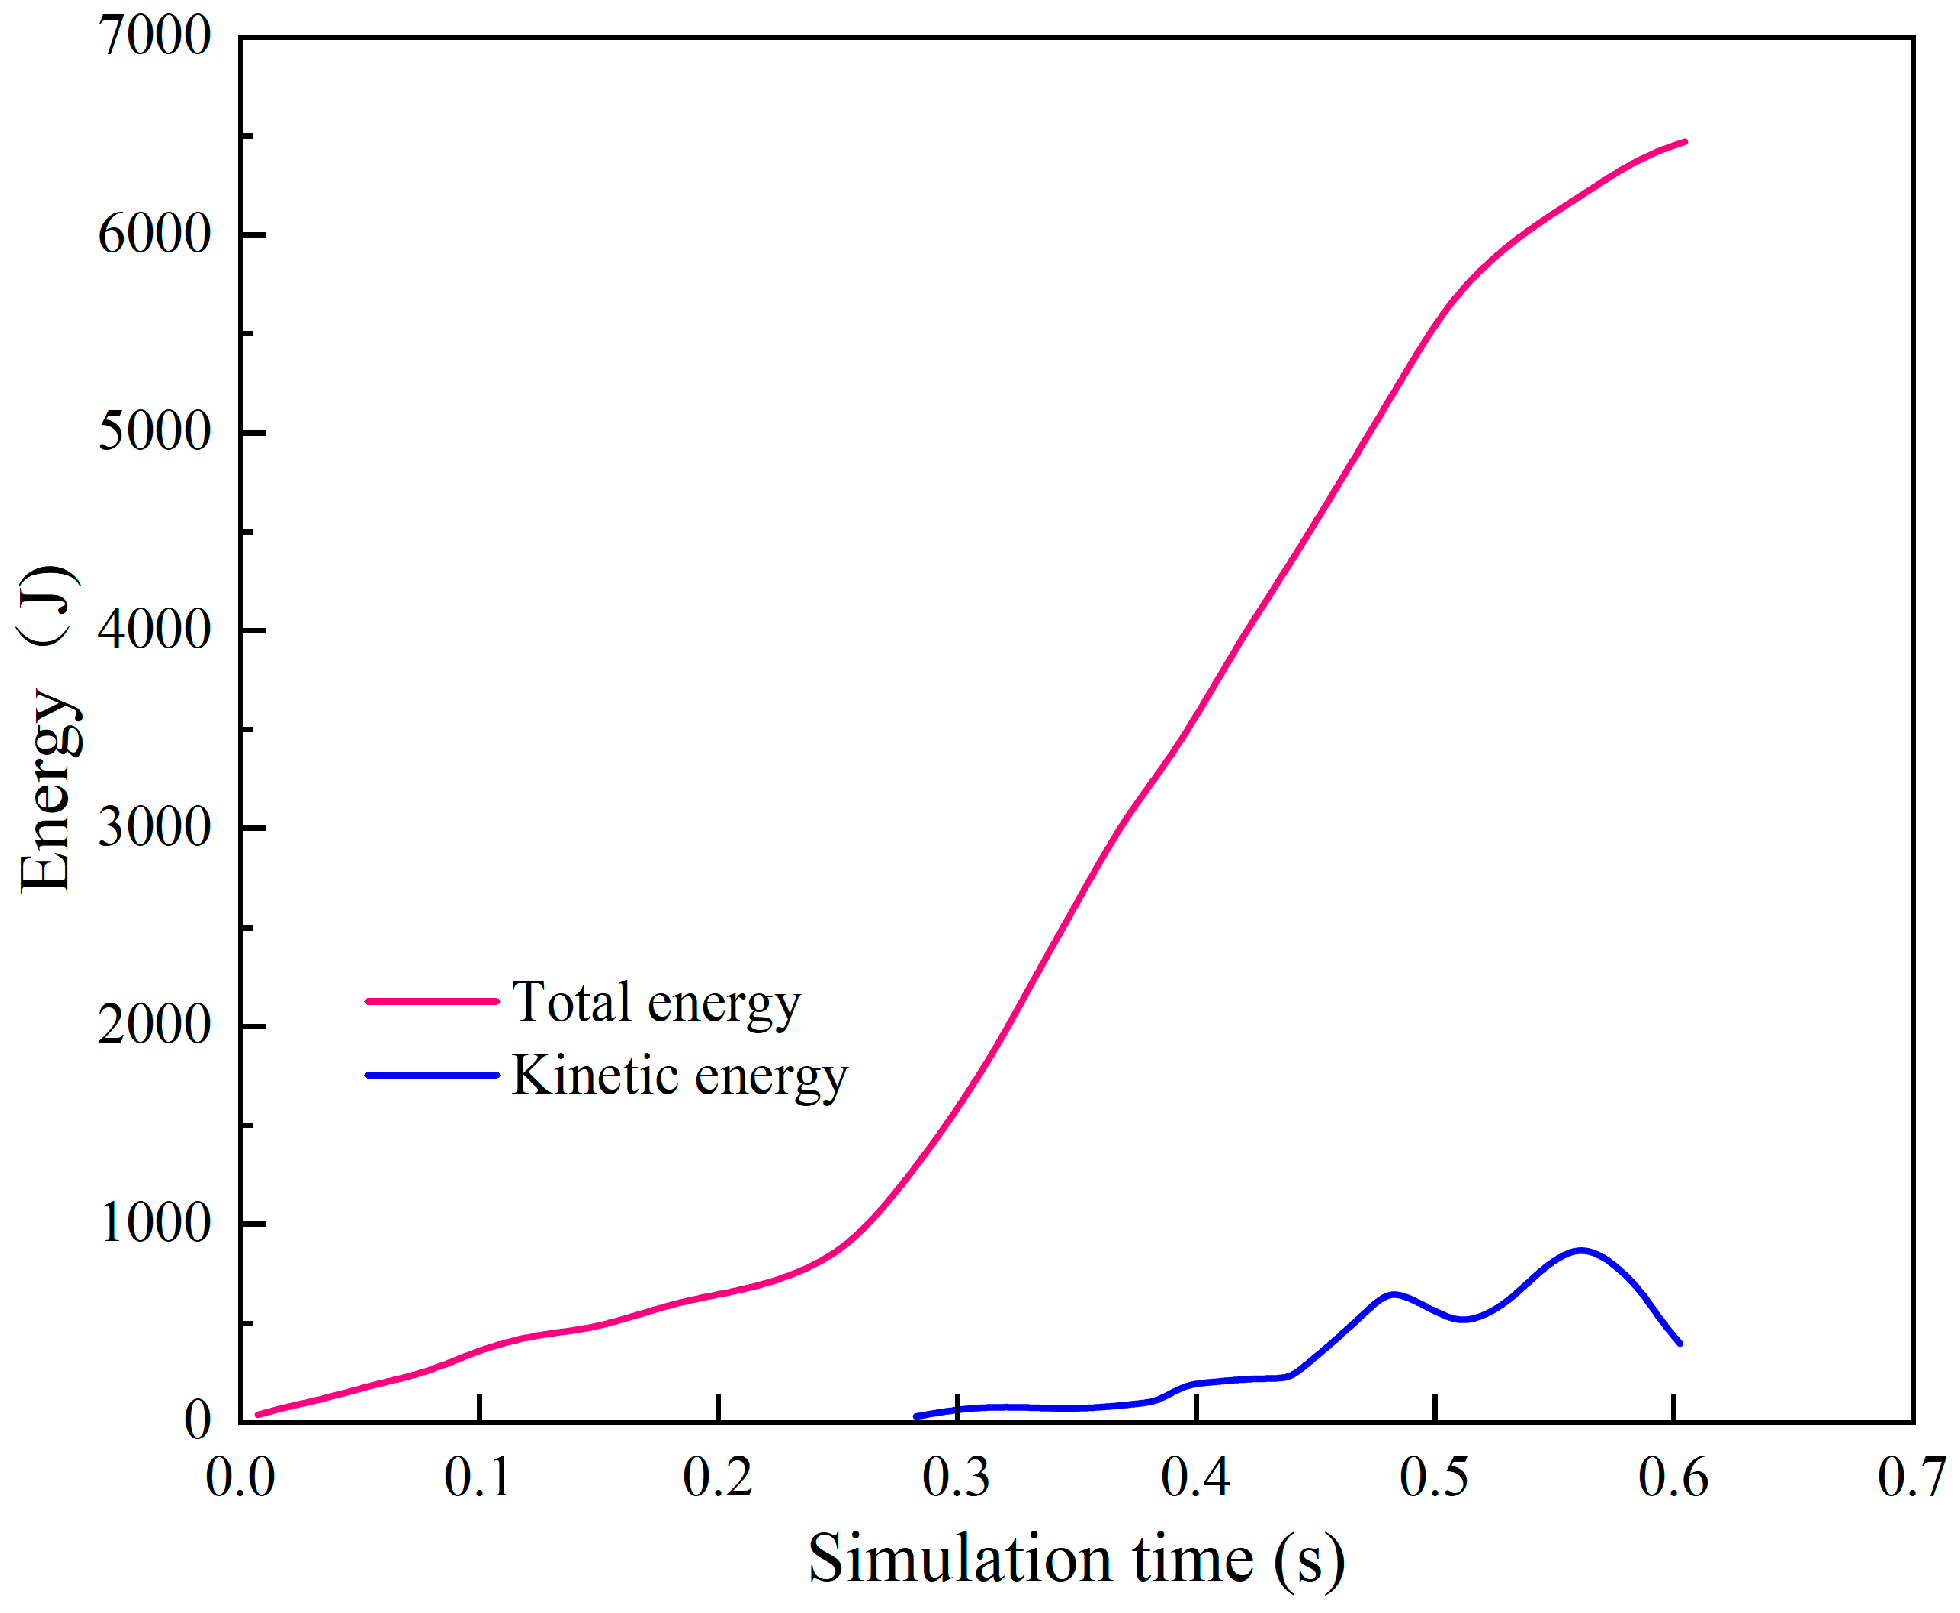
s. The kinetic and total energies were monitored throughout the analysis to evaluate the quasi-static condition. As shown in
Figure 10, during the displacement-loading step, the kinetic energy remained much smaller than the total energy, and their ratio remained below 5%, indicating that inertial effects were limited and that the numerical response was predominantly quasi-static.
3.5. Validation of the Finite Element Model
To validate the reliability of the finite element modelling method, two high-strength bolted push-out specimens tested by Fang et al. [
41] namely U-8.8-16-75 and U-8.8-22-75, were selected for comparison. The same modelling strategy, including material constitutive relationships, contact interactions, boundary conditions, and loading method, was adopted to reproduce the load–slip responses of the reference specimens.
Figure 11 compares the experimental and numerical load–slip curves. The finite element results reasonably capture the overall trends of the test curves, including the nonlinear load increase, peak load level, and slip response near the peak load. This indicates that the model can effectively simulate the main shear transfer process of high-strength bolted connectors.
To further evaluate the model accuracy,
Table 5 compares the peak loads and peak slips obtained from the tests and finite element simulations. The peak load errors of specimens U-8.8-16-75 and U-8.8-22-75 are 7.84% and 6.76%, respectively, while the corresponding peak slip errors are 3.03% and 3.30%. All errors are within 10%, indicating good agreement between the numerical and experimental results. The numerical peak loads are slightly higher than the test values, which may be attributed to the idealized treatment of contact interactions, material parameters, and boundary conditions in the finite element model.
Although the validated specimens are not completely identical to the controlled-slip bolted connector proposed in this study, they involve similar high-strength bolted shear transfer, interfacial contact, and bolt-hole bearing mechanisms. Therefore, the staged response of the proposed connector should be regarded as a numerical prediction based on the validated modelling approach. Further push-out tests on controlled-slip bolted specimens with designed bolt-hole clearances and preload levels are needed for direct verification.
4. Finite Element Results and Discussion of the Controlled-Slip Bolted Connector
4.1. General Characteristics of the Load–Slip Response
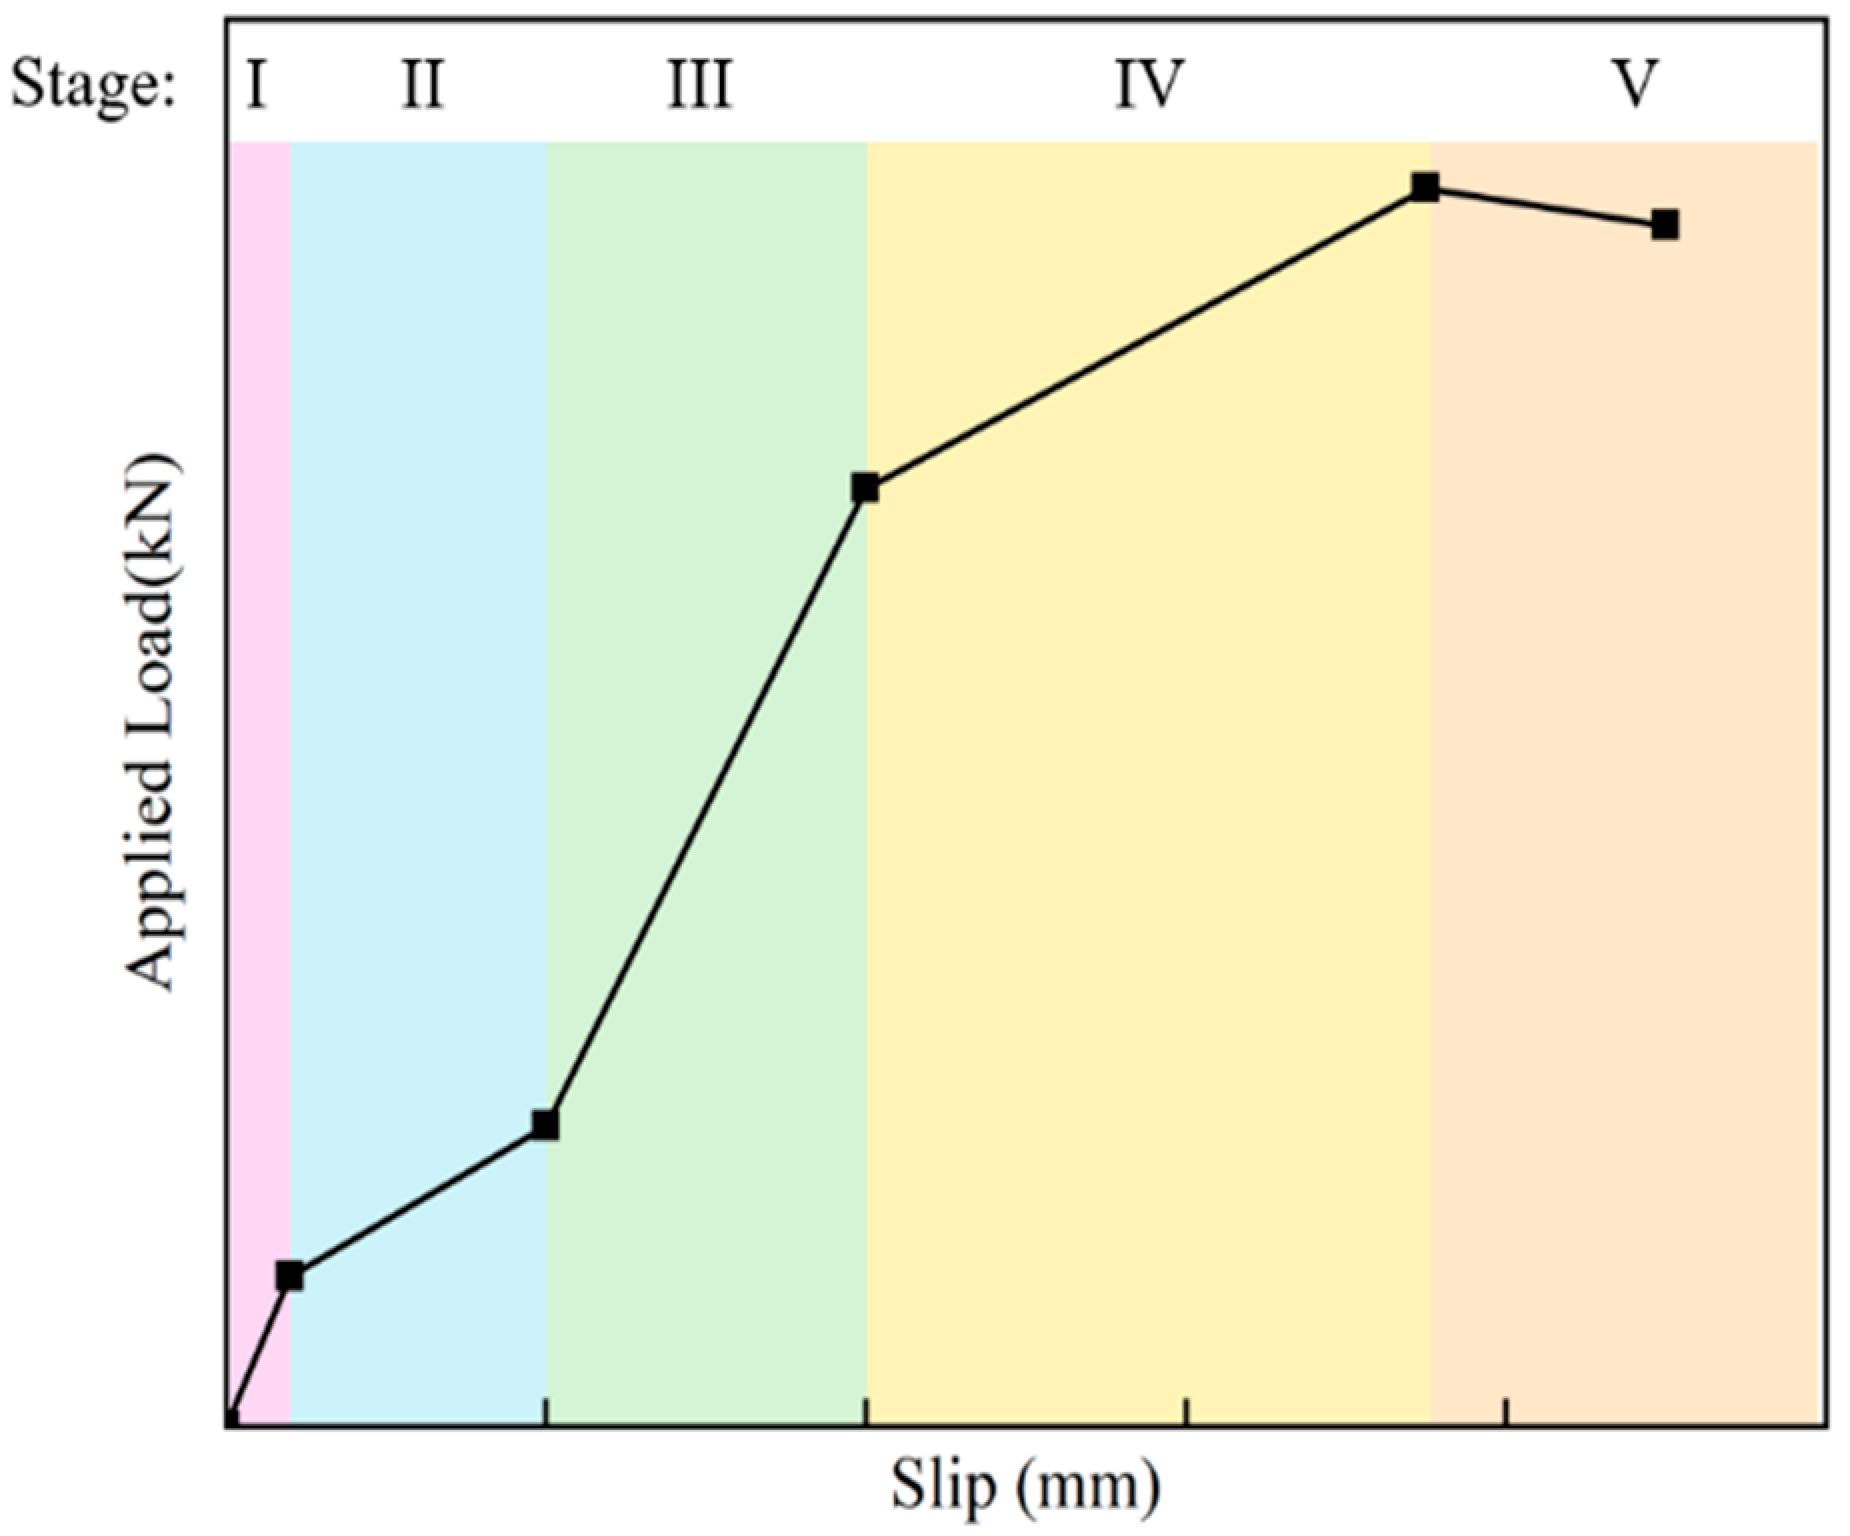
Figure 12 shows the typical load–slip response of the controlled-slip bolted connector under push-out loading. The curve indicates that the connector does not exhibit a single rigid load-transfer process, but develops a staged mechanical response. According to the variation in curve slope, interfacial slip development, and bolt-hole wall contact state, the load–slip response can be divided into five stages: initial frictional restraint, limited slip, bearing activation, bearing strengthening, and post-peak degradation.
In Stage I, the interfacial shear force is mainly resisted by the friction generated by bolt preload at the steel–UHPC interface. The load–slip curve shows a relatively steep initial slope, indicating that the connector can provide necessary early-stage restraint before significant relative slip occurs. When the applied load exceeds the interfacial friction resistance, the specimen enters Stage II. In this stage, relative slip develops between the steel beam and the UHPC slab, while full bearing contact between the bolt and the hole wall has not yet been established. The curve slope decreases significantly, reflecting the deformation release capacity provided by the reserved bolt-hole clearance.
As the slip continues to increase, the bolt gradually contacts the hole wall and the specimen enters Stage III. The load-transfer mechanism changes from friction-dominated behavior to bolt-hole wall bearing, and the load growth rate increases accordingly. In Stage IV, the hole-wall bearing action further develops, and the bolt shank is subjected to combined shear, local bearing, and bending. The load-carrying capacity continues to increase, while the curve slope gradually decreases due to local UHPC damage and plastic development of the bolt. After the peak load is reached, the specimen enters Stage V. In this stage, local crushing damage around the hole wall and plastic deformation of the bolt continue to develop, leading to post-peak degradation of load-carrying capacity.
Overall, the controlled-slip bolted connector mobilizes interfacial friction, clearance-induced slip, and bolt-hole wall bearing in sequence. The reserved clearance creates a finite slip interval before stable bearing resistance is fully developed, while the connector maintains shear resistance after bolt-hole contact is established. This staged mechanism explains how the connector can provide deformation release at the interface under push-out loading, and it also defines the mechanical basis for subsequent beam-level evaluation in negative-moment regions.
4.2. Effect of Bolt-Hole Clearance on the Load–Slip Response
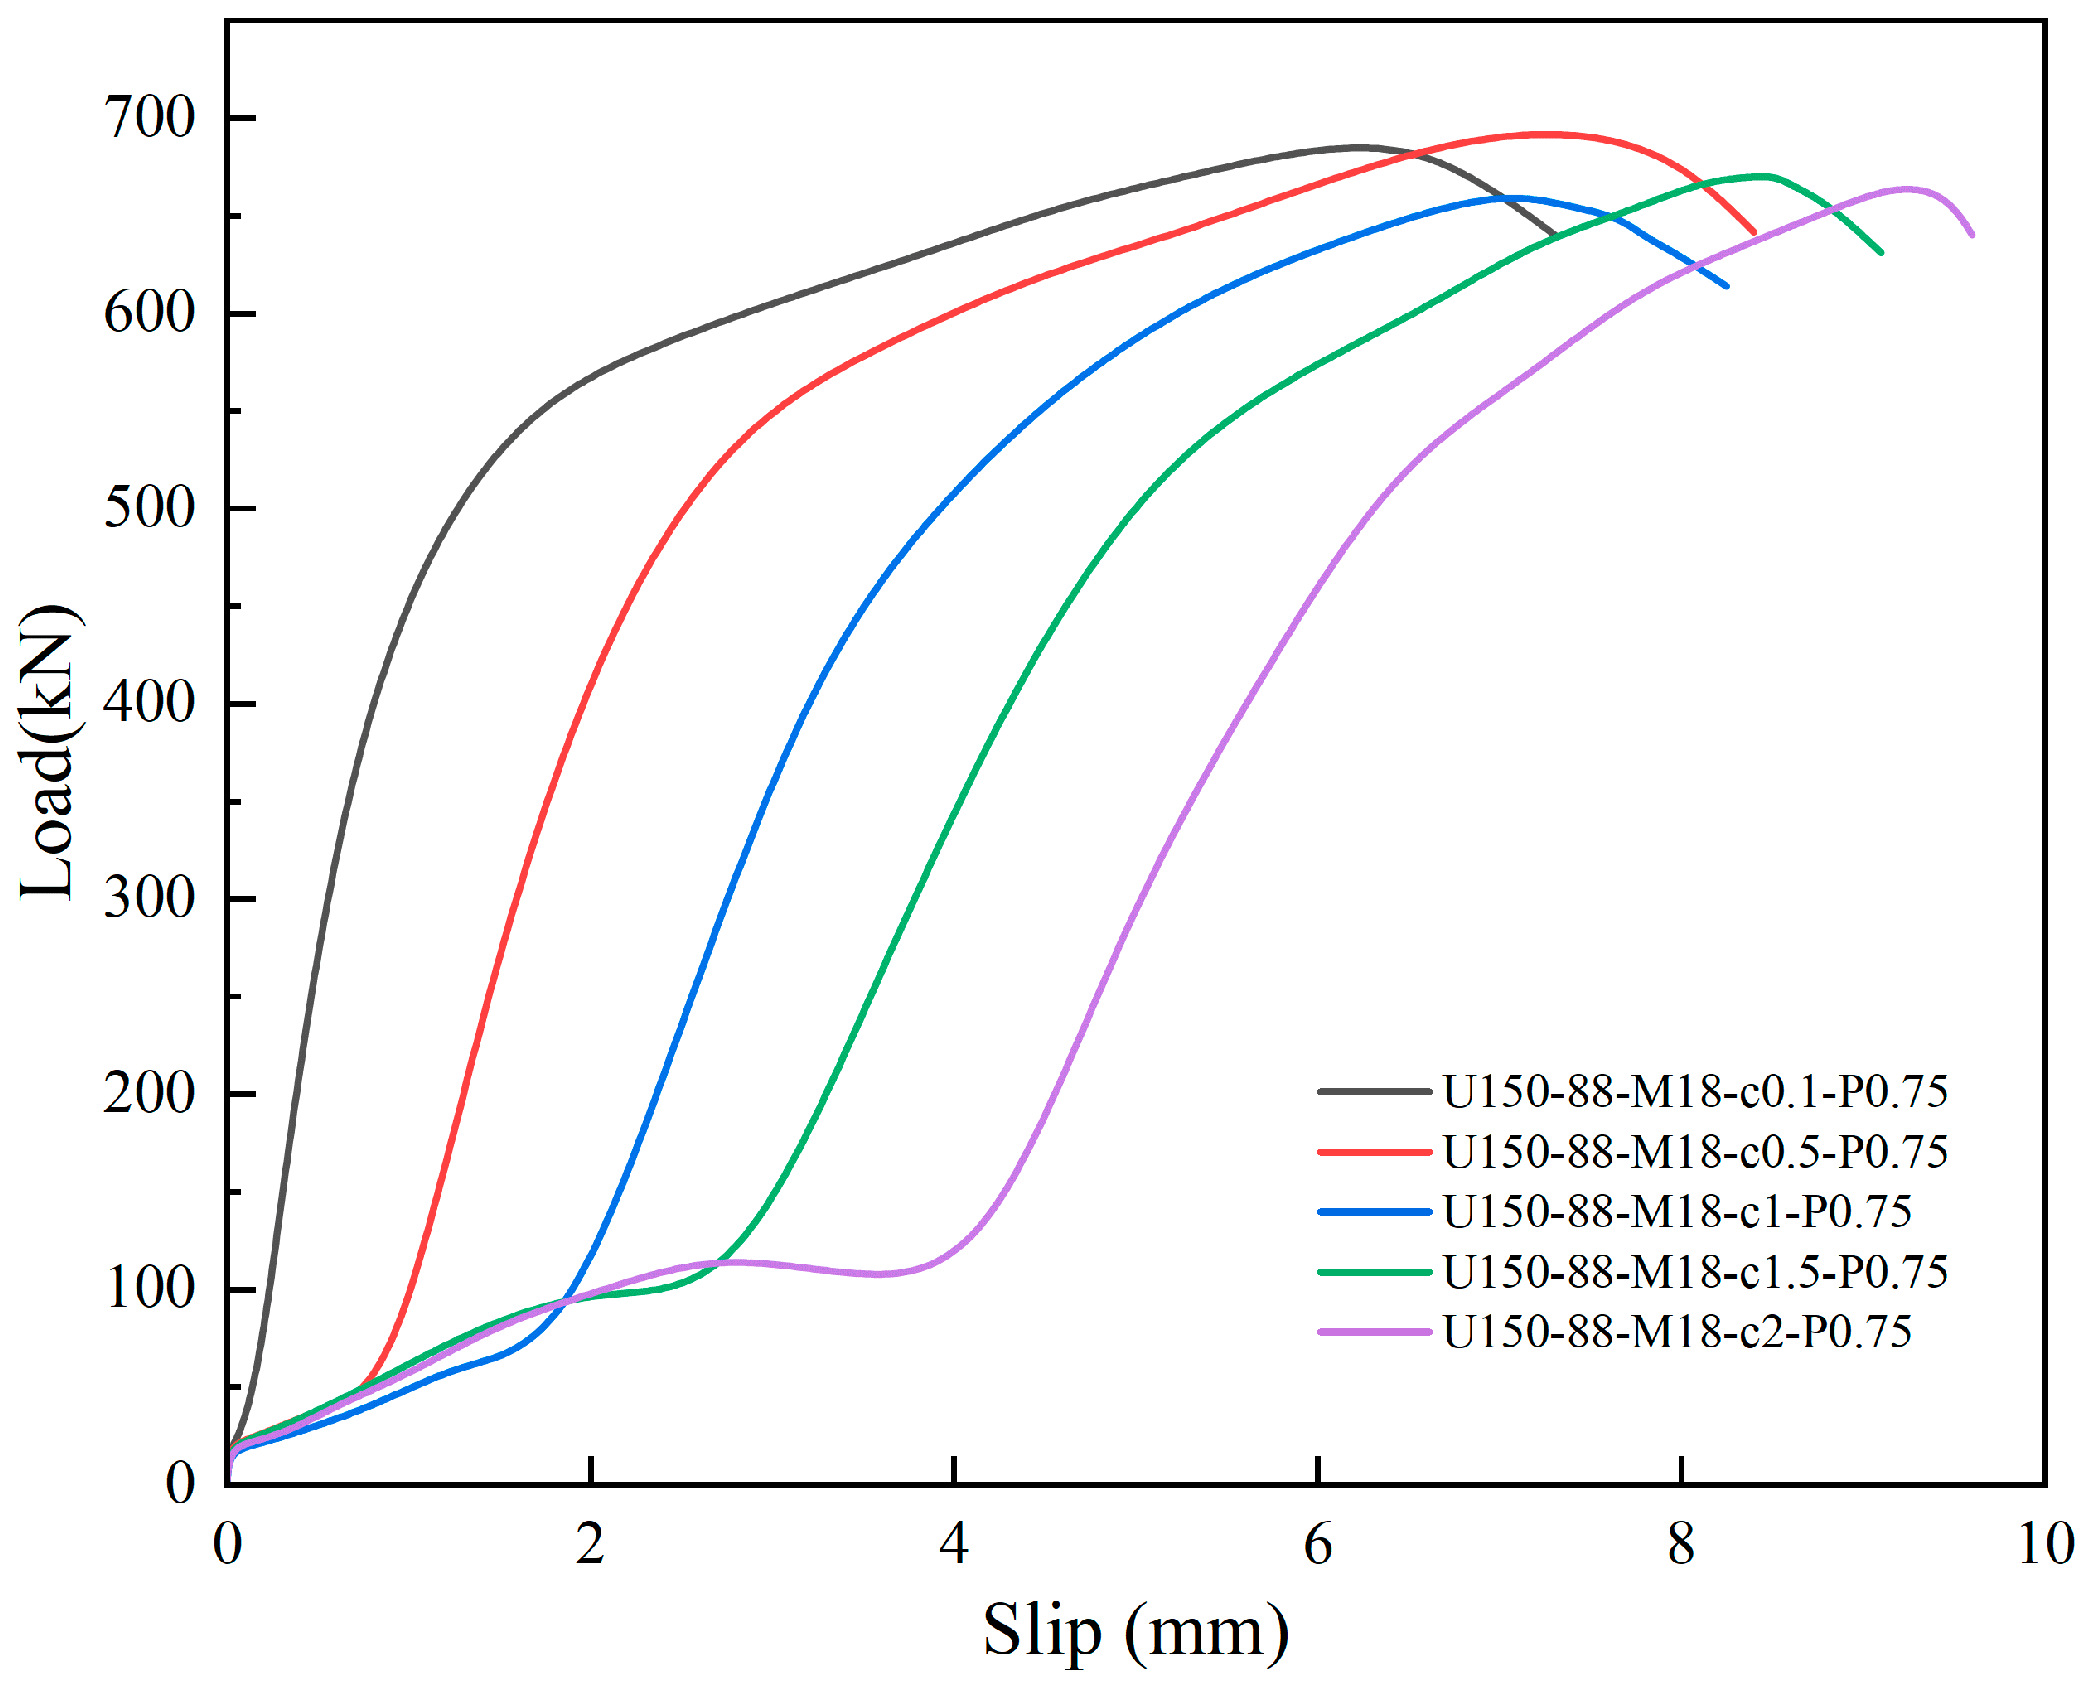
Figure 13 shows the load–slip curves of specimens with different bolt-hole clearances, and
Table 6 lists the corresponding numerical results. To investigate the influence of bolt-hole clearance on the mechanical behavior of the controlled-slip bolted connector, five specimens with the same preload level of 0.75
were compared. The radial bolt-hole clearances were 0.1, 0.5, 1.0, 1.5, and 2.0 mm.
As shown in
Figure 13, with increasing bolt-hole clearance, the low-stiffness slip stage in the load–slip curve becomes progressively longer, and the slip level at which the bolt contacts the hole wall and enters the bearing transfer stage is delayed. This indicates that bolt-hole clearance mainly controls the pre-bearing slip release process and the bearing activation timing of the connector.
As shown in
Table 6, the peak load capacity remains within a relatively narrow range of 661.79–693.86 kN, with a maximum difference of approximately 4.85%. Therefore, within the investigated range, bolt-hole clearance has a limited influence on peak load capacity, and no clear monotonic relationship is observed. The small differences among the individual cases should be interpreted cautiously. The non-monotonic response may be associated with differences in local bolt-hole contact evolution, UHPC bearing damage, and the coupled bending–shear deformation of the bolt after bearing activation. From a mechanical perspective, bolt-hole clearance mainly changes the slip distance required for bearing activation and the early contact evolution between the bolt and the hole wall. Once stable bearing contact is established, the connector resistance is mainly provided by bolt shear, local UHPC bearing, and the bending–shear interaction of the bolt shank. Therefore, different clearances may shift the bearing activation point and local damage development, but do not produce a proportional change in peak load capacity within the investigated range. The small differences in peak load among the clearance cases are within a narrow range and do not change the main mechanical trend. Therefore, the influence of bolt-hole clearance is discussed mainly in terms of slip capacity, bearing activation, local UHPC damage, and bolt stress development.
Compared with peak load capacity, bolt-hole clearance has a more pronounced influence on slip deformation capacity. The peak slip increases from 6.51 mm for the specimen with a clearance of 0.1 mm to 9.17 mm for the specimen with a clearance of 2.0 mm, corresponding to an increase of approximately 40.9%. Relative to the small-clearance reference specimen, increasing the radial clearance to 1.5 mm and 2.0 mm increases the peak slip to 8.51 mm and 9.17 mm, respectively, while the corresponding peak loads remain close to that of the reference specimen. These results indicate that an appropriate increase in bolt-hole clearance can enhance the connector-level slip deformation capacity without causing a significant reduction in ultimate shear resistance within the investigated numerical range.
For negative-moment regions of composite girders, the pre-bearing slip stage is relevant because it offers a controlled deformation-release interval before full bearing transfer is mobilized. Such a response may help reduce excessive local restraint at the steel–UHPC interface. Nevertheless, the extent to which this connector-level slip capacity contributes to deck-level crack control depends on the global bending state, connector arrangement, reinforcement details, and load distribution of the composite girder. These factors should be considered in future beam-level evaluation.
When the radial clearance reaches 2.0 mm, the load–slip curve shows a short fluctuation during the early slip stage. This fluctuation is mainly associated with the longer free-travel distance before stable bolt-hole contact is established. During this transition, the frictional resistance has already decreased after slip initiation, whereas the bolt-hole wall bearing resistance has not yet been fully mobilized. This behavior indicates that excessive clearance may reduce the stability of early-stage load transfer, even though it increases the available slip space. Therefore, bolt-hole clearance should be selected by balancing the demand for pre-bearing slip release, the stability of the friction-to-bearing transition, and the later-stage stress demand on the bolt.
4.3. Effect of Bolt Preload on the Load–Slip Response
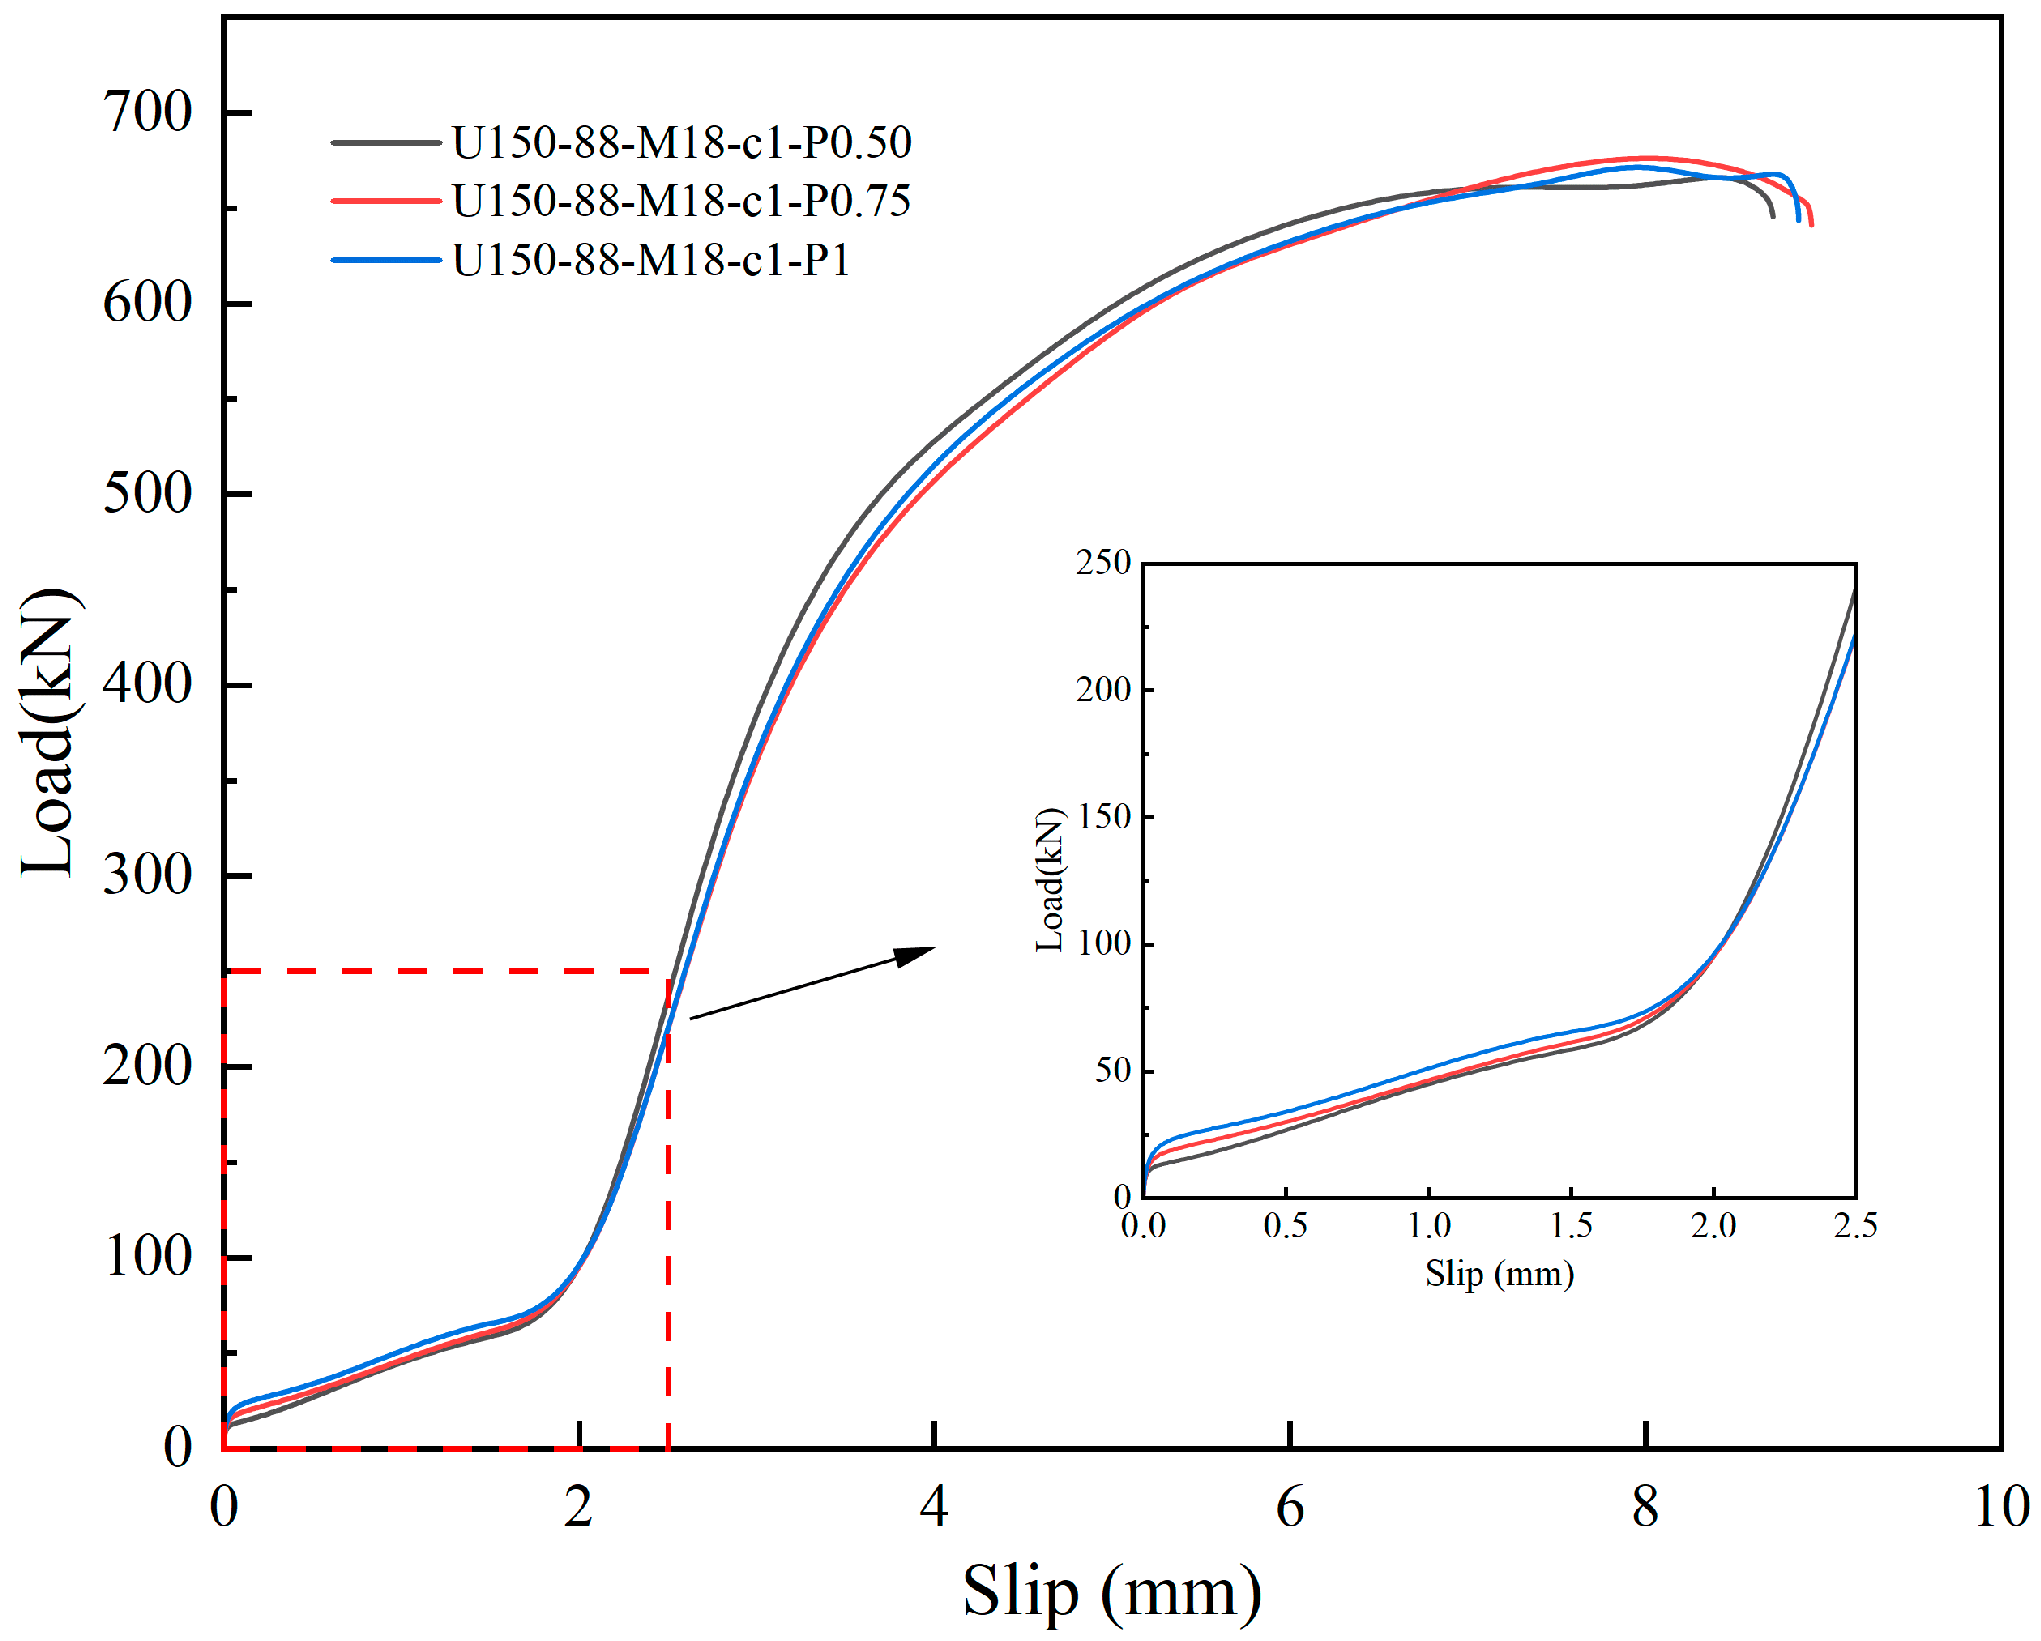
Figure 14 shows the load–slip curves of specimens with different bolt preload levels, and
Table 7 lists the main numerical results. To investigate the influence of preload on the mechanical behavior of the controlled-slip bolted connector, three specimens with the same bolt-hole clearance of 1.0 mm were compared. The preload levels were 0.5
, 0.75
, and 1.0
.
The peak load capacities of the three specimens are relatively close, ranging from 661.79 kN to 675.20 kN. The maximum difference is 13.41 kN, accounting for approximately 2.03% of the lowest peak load. No clear monotonic relationship between preload and peak load capacity is observed within the investigated range. This is because preload mainly affects the interfacial frictional restraint during the early loading stage. After the slip develops into the bolt-hole wall bearing stage, the later-stage load-carrying capacity is mainly controlled by bolt shear, local bearing of the hole wall, and bending–shear deformation of the bolt.
Compared with peak load capacity, preload has a more obvious influence on the early load–slip response. As shown in
Figure 14, at the initial loading stage, specimens with higher preload generally exhibit higher load levels at the same slip level. This indicates that increasing preload can enhance the frictional restraint capacity of the steel–UHPC interface and improve the early-stage load transfer before and around slip initiation. As slip continues to develop, the specimens gradually enter the bolt-hole wall bearing transfer stage. The influence of preload on the load response then becomes weaker, and the differences among the three curves gradually decrease.
From the perspective of slip deformation, the preload level affects the slip initiation and early slip development of the connector. When the preload is relatively low, the interfacial frictional restraint is weaker, and the connector more easily enters the slip stage. When the preload is higher, the interfacial restraint is enhanced and the initial slip can be delayed or partially suppressed. However, the peak slip does not show a strictly monotonic variation with preload, because it is also affected by the subsequent bearing contact state, local damage evolution, and bolt deformation. Therefore, the role of preload should not be understood as increasing the peak load capacity, but rather as regulating the early interfacial frictional restraint and slip initiation response.
For controlled-slip bolted connectors used in negative-moment regions, bolt preload should be considered together with bolt-hole clearance. A low preload may lead to premature slip and insufficient early-stage restraint, whereas an excessively high preload may weaken the intended slip-release effect before bearing activation. For the connector configuration investigated in this study, a radial bolt-hole clearance of 1.0–1.5 mm combined with a preload level around 0.75 provides a reasonable balance among early frictional restraint, controlled slip release, and subsequent bolt-hole wall bearing resistance. This range may serve as a useful reference for similar controlled-slip bolted connectors, provided that differences in structural configuration, connector layout, and service demand are properly considered.
4.4. Effect of Friction Coefficient on the Load–Slip Response
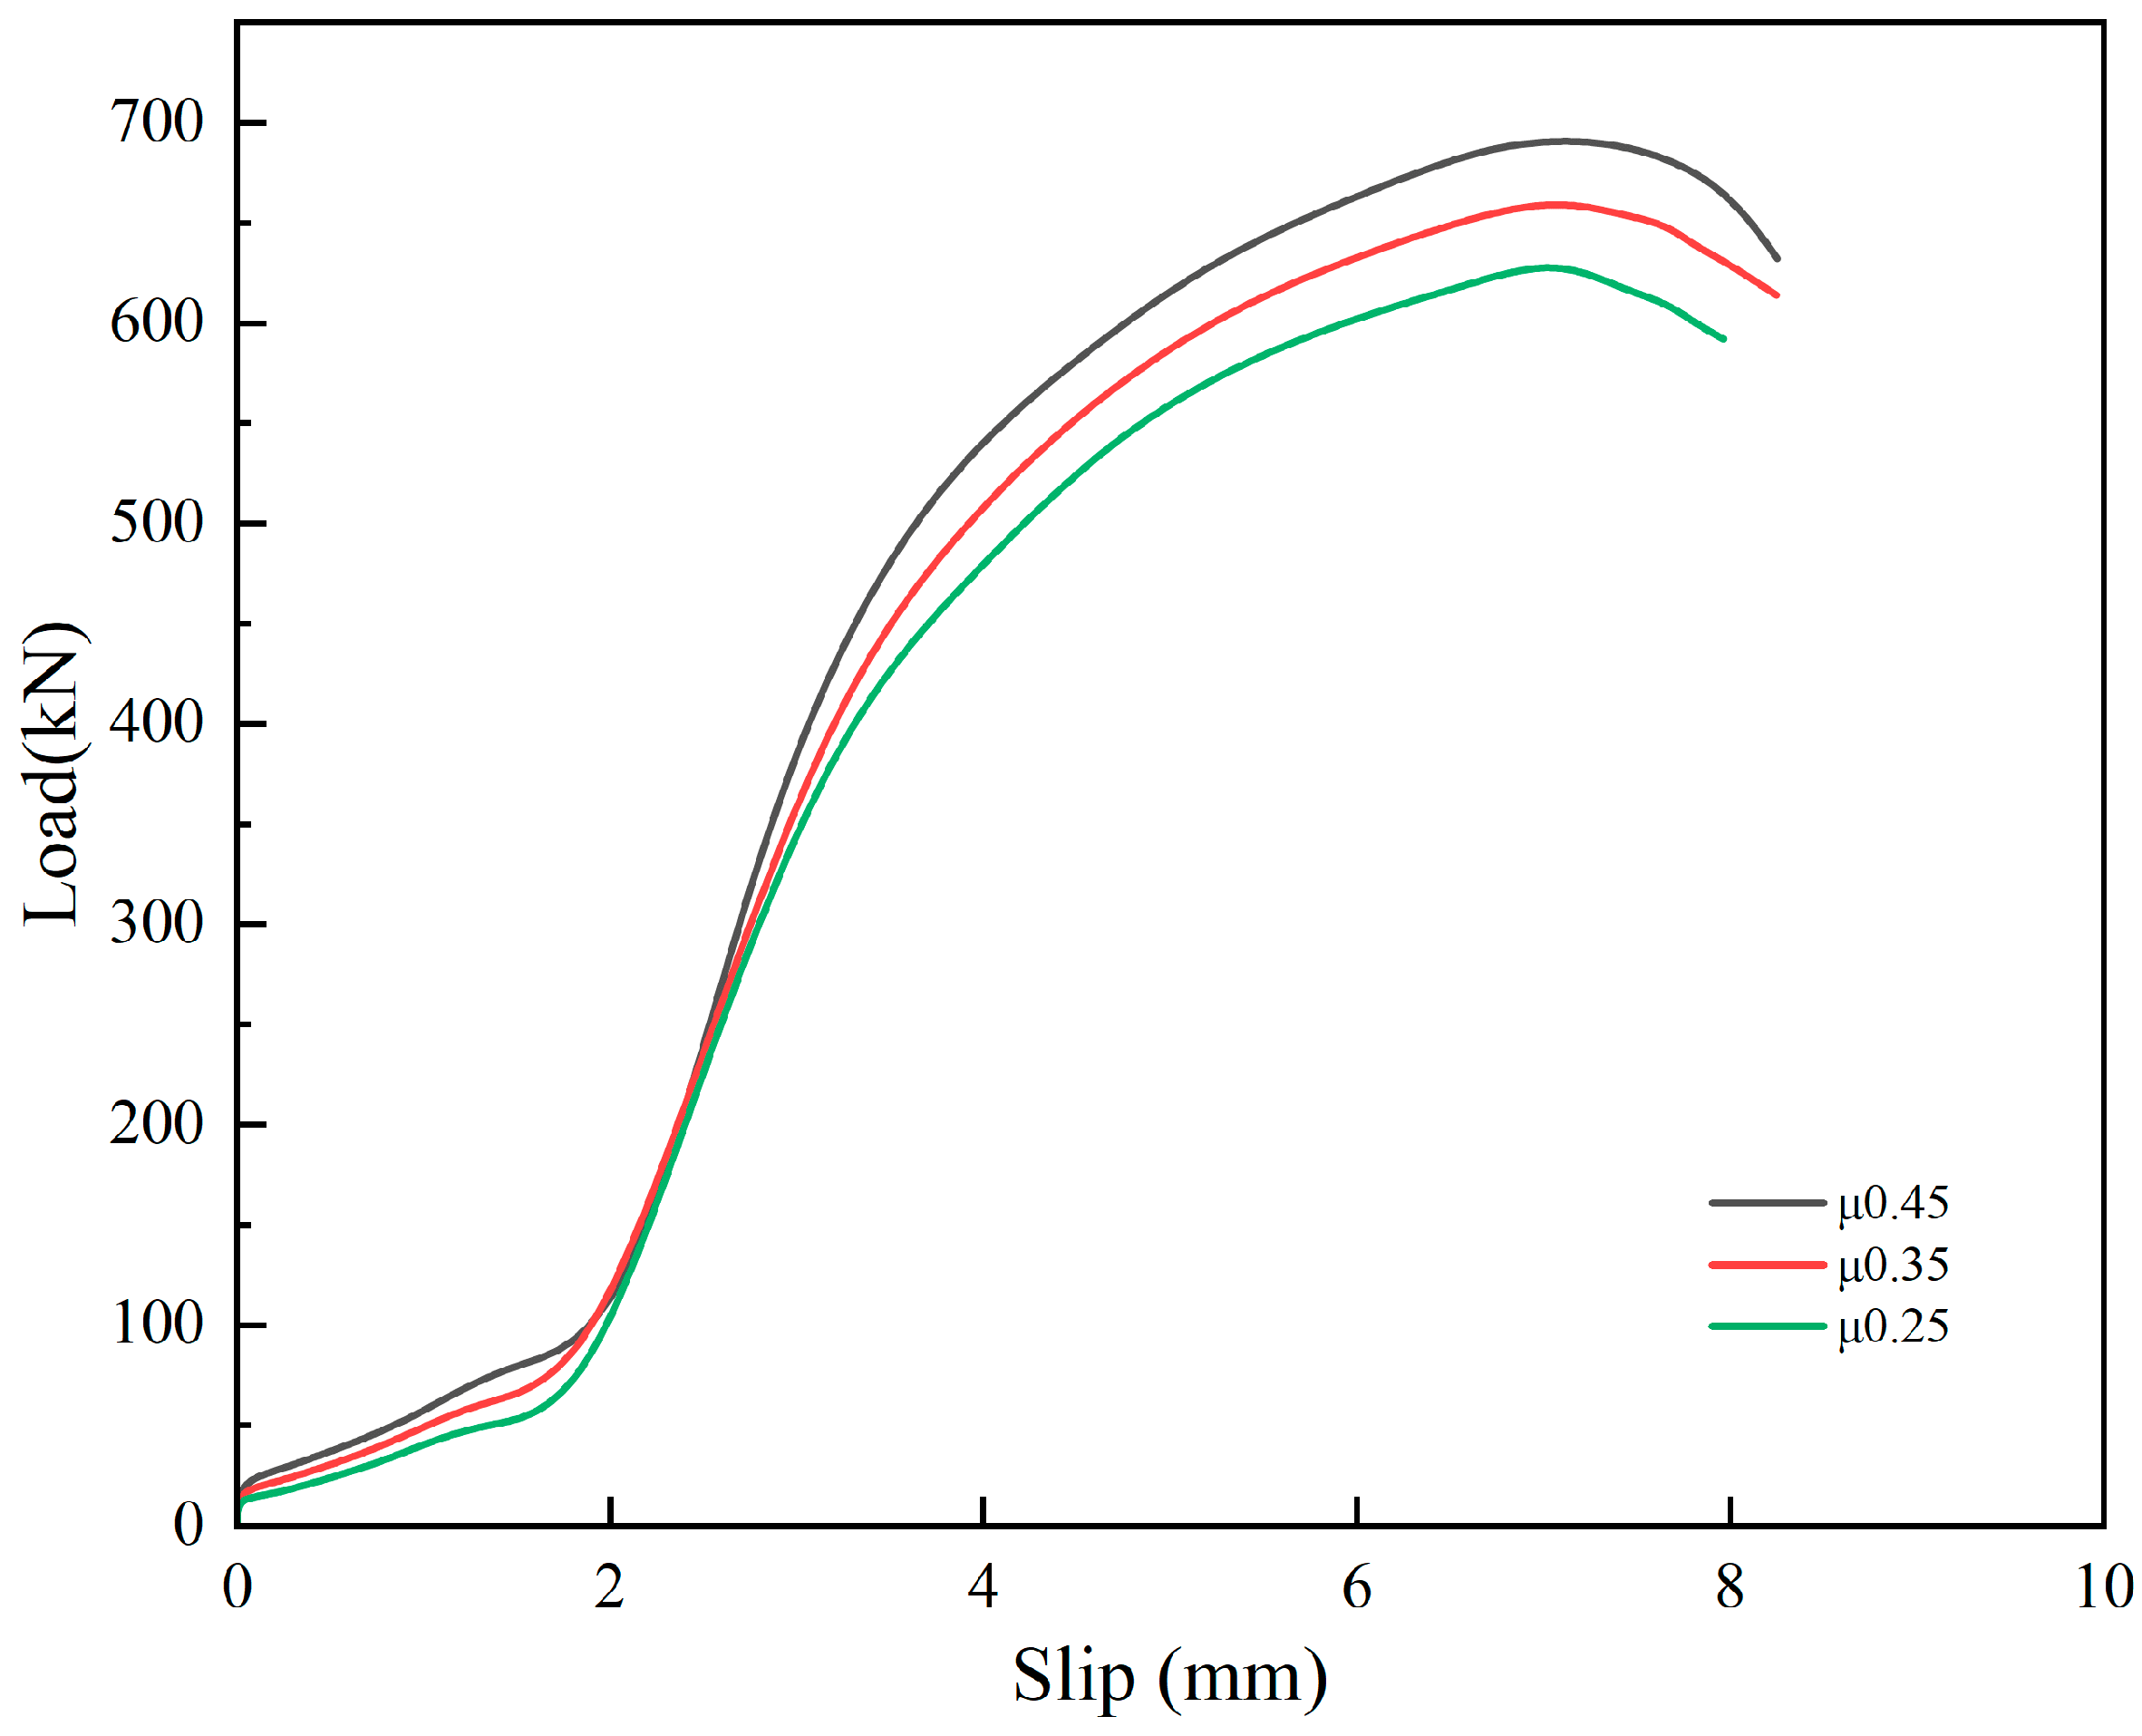
To examine the sensitivity of the staged load-transfer response to the interface friction coefficient, three models based on specimen U150-8.8-M20-c1.0-P0.75 were analyzed with friction coefficients of 0.25, 0.35, and 0.45, while the other modelling parameters were kept unchanged.
Figure 15 compares the corresponding load–slip curves.
As shown in
Figure 15, the friction coefficient has an evident influence on the early load–slip response before stable bolt-hole wall bearing is established. At a slip of approximately 1.0 mm, the load increases from about 40.25 kN for
to 48.99 kN for
and 56.38 kN for
. This indicates that a larger friction coefficient enhances the initial interfacial restraint and increases the load level during the friction-dominated and limited-slip stages.
With further slip development, all three specimens enter the bearing transfer stage, and the load increases rapidly as the bolt-hole wall contact becomes fully mobilized. The peak loads of the specimens with , 0.35, and 0.45 are 632.19, 661.79, and 691.45 kN, respectively. Compared with the baseline case of , the peak load decreases by approximately 4.47% when and increases by approximately 4.48% when . Therefore, within the investigated range, the friction coefficient mainly affects the early frictional restraint and the transition to bearing transfer, while the overall staged response remains unchanged.
4.5. Damage Development and Bearing Transfer Mechanism
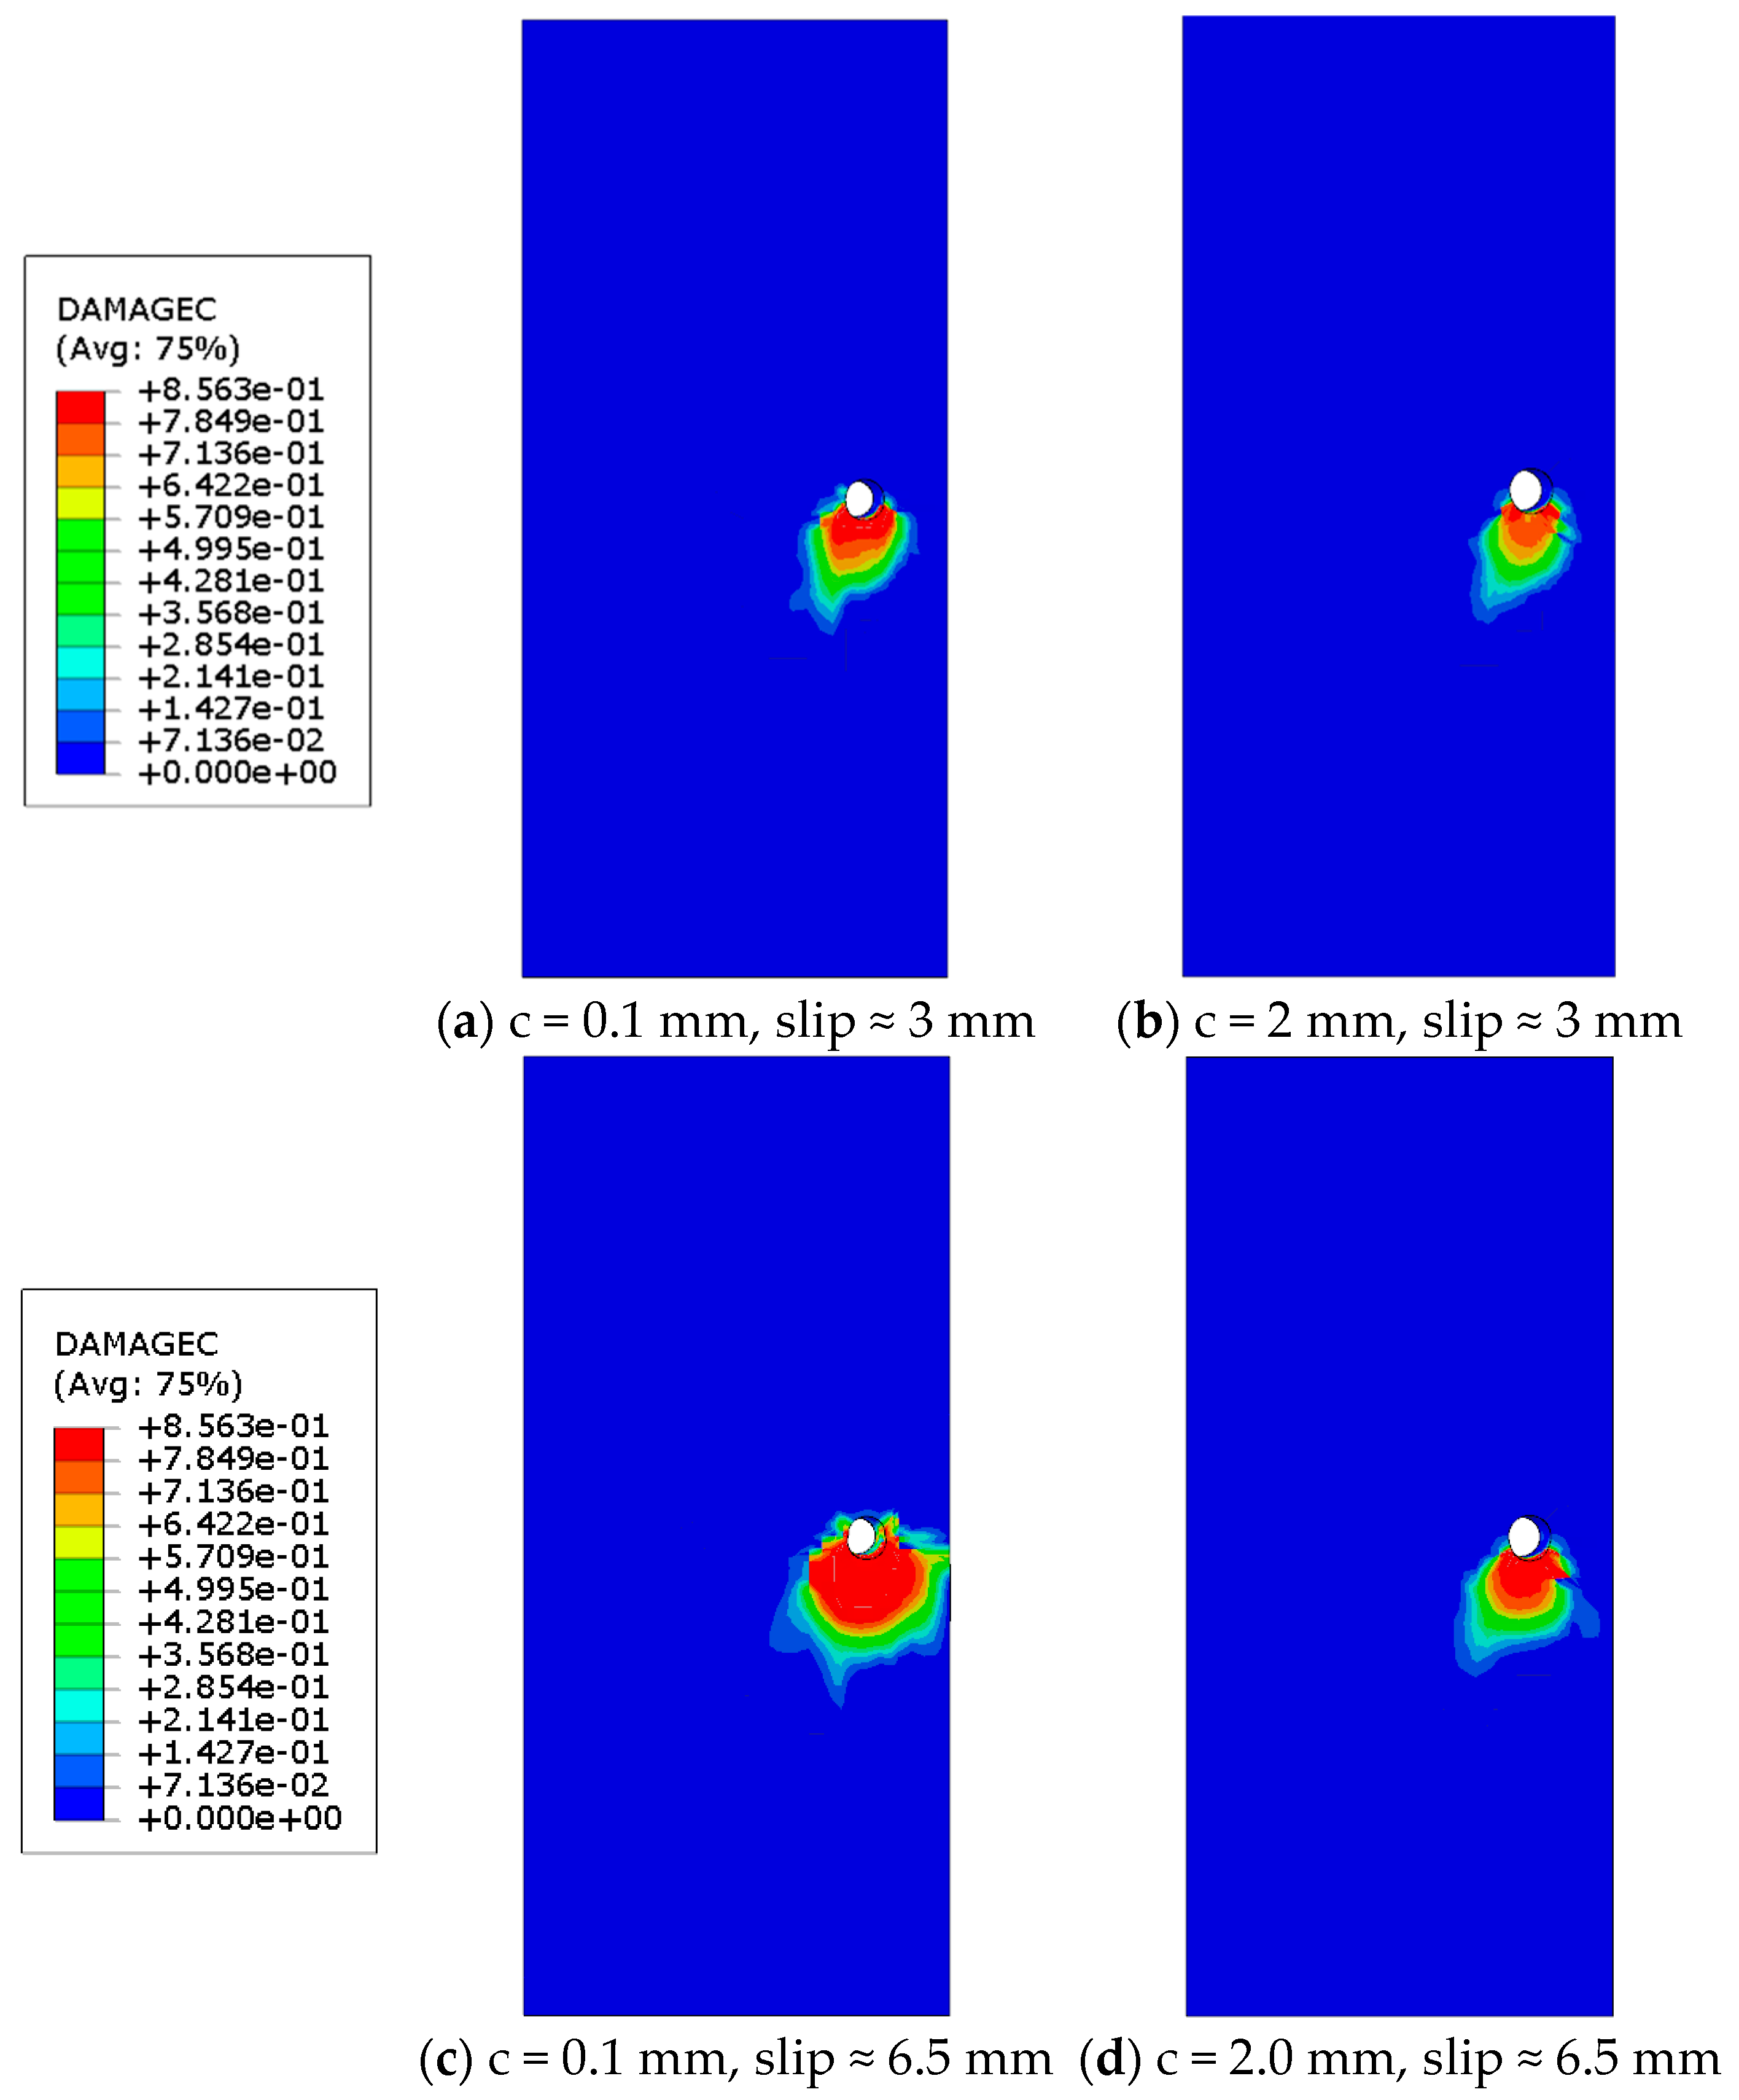
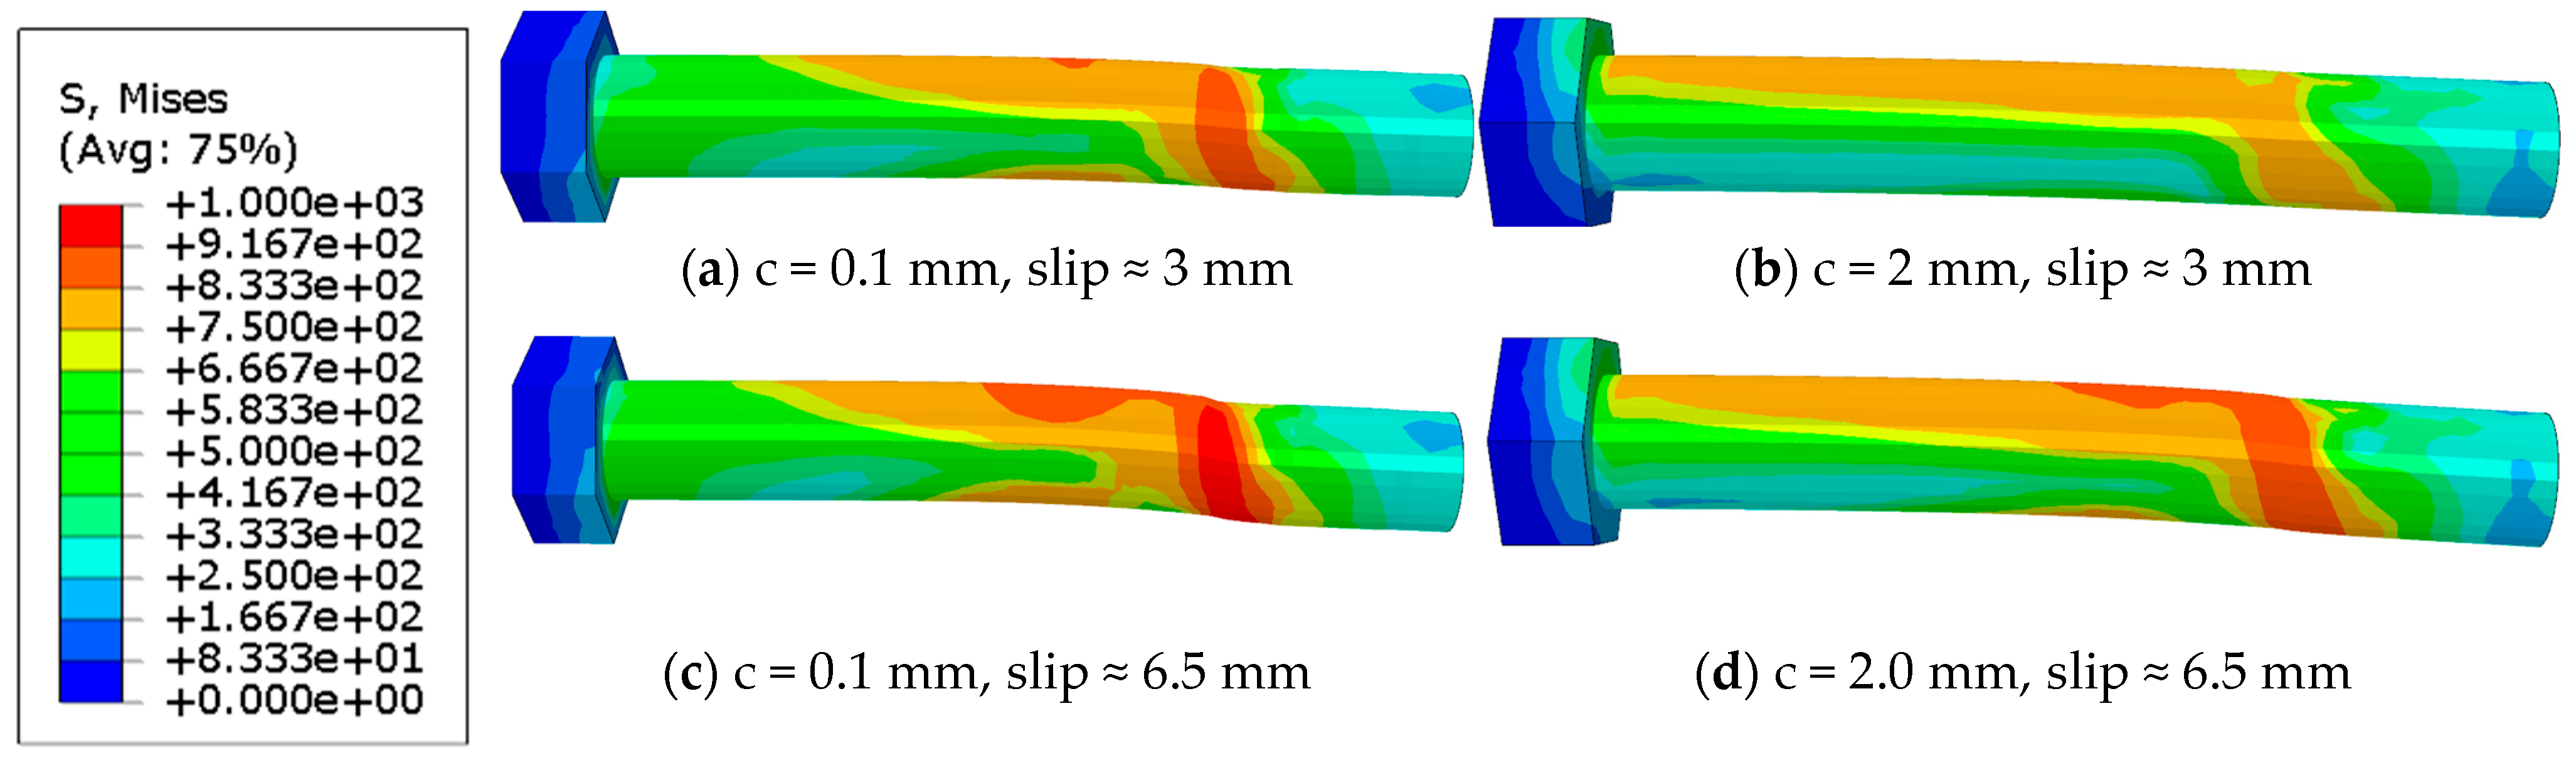
To further reveal the influence of bolt-hole clearance on the bearing transfer process and local mechanical state of the connector, specimens with radial clearances of 0.1 mm and 2.0 mm were selected for comparison.
Figure 16 shows the UHPC compressive damage contours around the hole wall, and
Figure 17 shows the corresponding von Mises stress contours of the bolt. The slip levels of approximately 3 mm and 6.5 mm were selected to represent the bearing activation stage and the near-peak bearing stage, respectively. By comparing the hole-wall damage regions and bolt stress distributions at the same slip levels, the influence of bolt-hole clearance on bearing activation timing, local damage development, and bolt bending–shear behavior can be clarified.
As shown in
Figure 16, when the slip is approximately 3 mm, obvious compressive damage has already appeared around the hole wall in the specimen with a clearance of 0.1 mm. The damage region extends toward the lower side of the bolt and the surrounding hole wall, indicating that effective contact between the bolt and the hole wall has been established and that the connector has started to enter the hole-wall bearing transfer stage. In contrast, for the specimen with a clearance of 2.0 mm, the damage range around the hole wall is smaller at the same slip level, and the damage is mainly concentrated in a limited local contact region. This indicates that a larger clearance delays the development of bolt-hole wall bearing and allows the connector to retain a more evident slip release characteristic at this stage.
When the slip increases to approximately 6.5 mm, both specimens show evident compressive damage concentration around the hole wall, indicating that the bolt-hole wall bearing mechanism has gradually been established. However, the damage range of the 0.1 mm clearance specimen is larger and more fully developed, whereas the damage region of the 2.0 mm clearance specimen remains relatively concentrated. This further confirms that larger bolt-hole clearance delays the development of local bearing damage around the UHPC hole wall.
Figure 17 shows that the bolt is not subjected to ideal pure shear during loading, but is affected by hole-wall bearing, shank shear, and bending deformation, exhibiting a coupled bending–shear behavior. When the slip is approximately 3 mm, the bolt in the 0.1 mm clearance specimen participates in hole-wall bearing earlier. The high-stress region is mainly concentrated near the hole-wall contact zone and the local bending region of the shank, indicating relatively pronounced local stress concentration. In comparison, because of the longer free-travel distance between the bolt and the hole wall, the 2.0 mm clearance specimen is still in the contact adjustment and gradual bearing development stage at the same slip level. The high-stress region is distributed more continuously along the bolt shank, indicating that the local bearing concentration has not yet fully developed and that the bolt response involves more evident shank bending–shear deformation.
When the slip increases to approximately 6.5 mm, the high-stress regions of the bolts in both specimens develop further. In the 0.1 mm clearance specimen, the high-stress region remains mainly concentrated near the hole-wall contact and adjacent region, indicating that bolt-hole wall bearing is established earlier under small-clearance conditions and that the local bearing transfer characteristic is more prominent. In the 2.0 mm clearance specimen, a longer high-stress region forms along the middle and rear portions of the bolt shank. This indicates that larger bolt-hole clearance changes the load-transfer path after bearing activation and makes the combined action of shank bending and shear more pronounced.
The above results show that bolt-hole clearance changes the connector mechanism mainly by altering the effective contact timing between the bolt and the hole wall. Small-clearance specimens activate bearing earlier, leading to faster development of hole-wall damage and local bolt stress. Large-clearance specimens provide a longer slip-adjustment stage and delay the development of local UHPC bearing damage, but they also extend the high-stress region along the bolt shank at later stages. Therefore, bolt-hole clearance has a coupled influence on slip release and bolt stress development. An excessively large clearance should be avoided because it may intensify the bending–shear demand on the bolt after bearing activation.
4.6. Effect of UHPC Compressive Strength
As an additional sensitivity analysis, three finite element models with UHPC compressive strengths of 130, 149.1, and 170 MPa were examined. The same constitutive formulations were adopted, and the complete UHPC material inputs were adjusted consistently for each strength level, while the connector geometry, bolt properties, bolt-hole clearance, preload, contact conditions, and loading method remained unchanged. The corresponding peak loads were 659.00, 661.79, and 666.04 kN, respectively. The peak load increased by only approximately 1.07% as the UHPC compressive strength increased from 130 MPa to 170 MPa, indicating limited sensitivity of the peak resistance to UHPC strength within the investigated range. Combined with the bolt stress and UHPC damage responses discussed in the following section, these results suggest that the ultimate response is predominantly associated with the bending–shear deformation and plastic development of the bolt, while UHPC strength mainly affects the local bearing response around the bolt hole.
4.7. Comparison with Shear Capacity Calculation Formulas
To evaluate the rationality of the peak load capacities obtained from the finite element model, the numerical results were compared with existing shear capacity formulas. The formulas from Eurocode 4 [
43], Fang et al. [
41], AISC 360 [
44], ACI 318 [
45], and Eurocode 3 [
46] were selected for comparison. These formulas mainly describe the ultimate shear resistance of connectors, and the corresponding expressions are given in Equations (4)–(8).
where
n = 4 is the number of bolts participating in shear transfer;
is the effective area of the bolt;
is the ultimate tensile strength of the bolt;
and
are the group-effect and position-effect reduction factors in the AISC 360 formula, respectively; φ is the strength reduction factor in the ACI 318 formula; and
is the shear resistance coefficient in the Eurocode 3 formula. The finite element model was established as a one-quarter symmetric model, and the peak loads reported in
Table 8 correspond to the equivalent full push-out specimen. Therefore,
n = 4 was adopted in the formula comparison, which is consistent with the total number of bolts participating in shear transfer in the full specimen. For a nominal M20 bolt, the gross circular area based on the nominal diameter is approximately 314 mm
2, whereas the standard tensile stress area
is 245 mm
2. The ratio between these two areas is about 0.78, reflecting the reduction in the effective resisting area caused by the threaded portion of the bolt. Therefore,
= 245 mm
2 was used in the design-formula comparison to remain consistent with the effective-area definition adopted in the specifications. Here,
denotes the standard effective stress area of a nominal M20 bolt. In the finite element model, the nominal M20 bolt was simplified as an equivalent smooth shank with a diameter of 18 mm, corresponding to a geometric cross-sectional area of
mm
2. Therefore, the finite element response is governed by the geometric area of 254.5 mm
2, whereas the capacity calculations use the standard M20 effective stress area
mm
2. The difference between the two areas is approximately 3.9%, and the 18 mm smooth shank was adopted as an equivalent representation of the threaded load-bearing section.
As shown in
Table 8, the peak load capacities obtained from the finite element model range from 661.79 kN to 693.86 kN, which are close to the predictions of Eurocode 4 and Fang et al. In particular, the prediction by Fang et al. is 671.81 kN, showing good agreement with the finite element results, with a maximum absolute deviation of 3.28%. The Eurocode 4 prediction is 707.17 kN, and the finite element results are 1.88–6.42% lower than this prediction, indicating that the Eurocode 4 formula gives slightly higher values for the investigated specimens.
In contrast, the predictions of AISC 360, ACI 318, and Eurocode 3 are 563.52 kN, 530.38 kN, and 530.38 kN, respectively, which are lower than the finite element peak load capacities. The underestimation range of AISC 360 is 17.44–23.13%, while those of ACI 318 and Eurocode 3 are both 24.78–30.82%. This difference is mainly related to the reduction factors embedded in these formulas. In the AISC 360 formula, the group-effect and position-effect factors and reduce the calculated connector resistance. In the ACI 318 and Eurocode 3 formulas, the strength reduction factor φ and the shear resistance coefficient lead to lower predicted values. Consequently, the overall resistance coefficients adopted in AISC 360, ACI 318, and Eurocode 3 are 0.6375, 0.60, and 0.60, respectively, which are lower than the coefficients of 0.76 and 0.80 adopted in the Fang et al. and Eurocode 4 formulas. These formulas were mainly developed for conventional concrete or general steel connection applications, and do not explicitly account for the high local bearing capacity of UHPC around the bolt-hole wall. Therefore, their predictions are conservative for the present steel–UHPC bolted connector. The comparison indicates that the finite element peak load capacities are generally consistent with existing shear capacity formulas, especially with the formula proposed by Fang et al., while the use of conventional design-code formulas should be interpreted with the above reduction effects in mind.
It should be noted that the above formulas are mainly used to evaluate the ultimate shear capacity of bolted connectors. They do not explicitly consider the staged response involving interfacial friction, clearance-induced slip, and progressive bolt-hole wall bearing. Therefore, the comparison is used only to assess the reasonableness of the peak load capacity, rather than to describe the complete controlled-slip mechanism.
5. Conclusions
To improve deformation compatibility in the negative-moment regions of continuous steel–UHPC composite girders, this study proposed a controlled-slip bolted shear connector and investigated its connector-level mechanical behavior using a three-dimensional nonlinear push-out finite element model. The effects of bolt-hole clearance, bolt preload, and interface friction on the load–slip response, local UHPC damage, and bolt stress distribution were examined. The following conclusions can be drawn:
(1) The proposed connector exhibits a staged friction–slip-bearing response rather than a conventional rigid shear-transfer behavior. The reserved bolt-hole clearance introduces a low-stiffness slip stage before full bolt-hole wall bearing is mobilized, while the connector can still maintain shear resistance after bearing activation. This staged mechanism provides a connector-level explanation for the deformation-release behavior before full bearing transfer.
(2) Within the investigated numerical range, bolt-hole clearance has a stronger influence on slip capacity than on ultimate shear resistance. As the radial clearance increases from 0.1 mm to 2.0 mm, the peak slip increases from 6.51 mm to 9.17 mm, whereas the peak load remains within 661.79–693.86 kN. This indicates that clearance mainly changes the bearing activation timing and the available pre-bearing slip distance, rather than directly controlling the ultimate shear-resisting mechanism.
(3) Bolt preload and interface friction mainly regulate the initial frictional restraint and slip initiation response, while their influence on peak resistance becomes limited after bolt-hole wall bearing is established. Larger bolt-hole clearance delays UHPC hole-wall bearing damage, but also produces a longer high-stress region along the bolt shank, indicating a stronger bending–shear interaction. For the investigated connector configuration, a radial clearance of 1.0–1.5 mm combined with a preload level around 0.75 gives a favorable balance among early restraint, controlled slip release, and later-stage bearing resistance. Future push-out tests on controlled-slip bolted connectors and beam-level tests under negative-moment loading are recommended to further verify the staged slip-release mechanism and its influence on deck-level crack control.