Article

Analysis of Crack Evolution Characteristics and Damage Assessment of Slabs with Openings Based on Fractal Theory
1
China Railway Seventh Bureau Group Co., Ltd., Zhengzhou 450016, China
2
Guangzhou Metro Design & Research Institute Co., Ltd., Guangzhou 510010, China
3
School of Civil Engineering, Xi’an University of Architecture & Technology, Xi’an 710055, China
4
Shaanxi Key Laboratory of Geotechnical and Underground Space Engineering, Xi’an 710055, China
5
Key Laboratory of Structural Engineering and Earthquake Resistance, Ministry of Education (XAUAT), Xi’an 710055, China
6
School of Railway Engineering, Shaanxi College of Communications Technology, Xi’an 710018, China
*
Author to whom correspondence should be addressed.
Buildings 2026, 16(17), 3388; https://doi.org/10.3390/buildings16173388
Submission received: 15 June 2026 / Revised: 15 August 2026 / Accepted: 18 August 2026 / Published: 25 August 2026

Abstract

To accurately and rapidly assess the damage level of slabs with openings in subway stations, a graded earth pressure loading device was developed. Model experiments revealed the crack evolution characteristics on the concrete surface of slabs with openings under graded earth pressure. A damage assessment method based on fractal theory was proposed, and empirical equations were established linking the fractal dimension with slab deflection, static stiffness, and the damage index. The results demonstrate that the damage process of opening slab structures can be divided into four stages: initial damage accumulation, damage manifestation, damage intensification, and damage saturation. The fractal dimension effectively characterizes the crack evolution features and damage states of the concrete surface in opening slabs. Under varying earth pressure levels, regions with the same opening area exhibit a linear increase in fractal dimension as earth pressure levels rise. During the graded earth pressure loading process, the fractal dimension of cracks in the slab opening region ranges from 1.45 to 1.88. Exponential relationships were identified between the fractal dimension of opening slabs and their mid-span deflection, static stiffness, and damage indices. This approach provides a novel method for rapidly evaluating the damage level of opening slabs based on fractal dimension analysis.

1. Introduction

To facilitate material hoisting and mechanical transportation, subway station slabs are designed with reserved openings. When these openings overlap with elevator shaft openings, the total area of openings increases, reducing the slab’s stiffness and posing significant safety risks to station construction and operation [1]. Furthermore, subway stations are often situated in urban centers, where construction areas face high traffic volumes and dense pedestrian activity. These substantial additional loads increase the earth and water pressure exerted on the station, further heightening the construction risks associated with slab openings in subway stations [2]. As a vital public transportation mode for urban residents, subways are subject to stringent safety requirements. Therefore, studying the extent of damage to subway station slabs with openings under varying earth and water pressures holds significant practical importance. Current research on subway stations primarily focuses on the mechanical properties of individual components or nodes [3,4], with limited attention to the overall mechanical behavior of stations. With the development of large-scale shaking tables and loading devices, research on the seismic performance of subway stations has been steadily increasing [5,6,7]. However, as indicated by the aforementioned analysis, the impact of earth and water pressure changes caused by surface overloading poses significant safety risks to stations. Existing studies on earth and water pressure simulations mainly utilize model box experiments. However, research on the structural mechanical performance of subway stations under varying soil and water pressure conditions remains scarce.
The failure of opening slab structures is accompanied by the initiation and propagation of concrete cracks, with the distribution and morphology of these cracks serving as a direct representation of the damage level [8]. Image recognition methods can effectively extract crack characteristics, thereby characterizing the damage level of opening slab concrete and improving the efficiency of crack detection [9,10,11]. With advancements in computer hardware and software technologies, crack detection and identification methods based on image processing have developed rapidly. However, existing studies primarily focus on extracting crack information without establishing a connection between crack characteristics and damage indices, making it challenging to directly apply these methods for structural damage assessment [12].
Research shows that during the cumulative damage process under static loads, concrete crack characteristics exhibit significant fractal features. Fractal dimensions can be used to establish the relationship between structural damage and crack characteristics [13,14]. The use of fractal theory to study damage in concrete structures can be summarized in three main aspects: (1) analyzing the morphological characteristics of concrete fracture surfaces using fractal theory and establishing relationships between fractal dimensions and the physical and mechanical properties of materials [15,16]; (2) studying the distribution of cracks in concrete structures using fractal theory and qualitatively analyzing the relationship between crack distribution and structural damage through statistical methods [17,18,19]; and (3) establishing relationships among deformation, crack development, loading, and fractal dimensions under graded loading to quantitatively analyze the correlation between concrete structural damage and fractal dimensions [20,21]. Zhu Deqi et al. investigated the compressive and flexural properties of polypropylene fiber-reinforced cementitious composites and verified the fractal characteristics of surface cracks under flexural loading. They established a quantitative relationship between the fractal dimension of surface cracks and an improved evaluation parameter for flexural toughness [22]. Azhari Samira et al. [23] employed a multi-feature fractal method to detect complex surface cracks in reinforced concrete columns, predicting the non-contact failure mode of damaged reinforced concrete columns under seismic actions. Recent studies have further extended fractal analysis to recycled-concrete crack propagation based on digital image correlation, low-velocity-impact damage of concrete slabs, strain-rate-dependent concrete failure, and multiscale pore structures [24,25,26,27]. These studies demonstrate that fractal dimension can effectively characterize crack complexity, fracture energy, dynamic damage, and material heterogeneity. More recent studies have combined fractal measures with acoustic emission for corrosion-damaged beams [28], digital-image analysis for ECC–concrete beams and full-scale prestressed concrete beams [29,30], mesoscopic damage modelling of defective concrete [31], U-Net-based crack extraction [32], and image-based damage indices for reinforced-concrete columns and beam–column joints [33,34]. Collectively, these studies reinforce the use of fractal dimension as a quantitative link between crack morphology and structural damage, while large slabs with multiple openings under graded lateral earth pressure remain insufficiently investigated.
Nevertheless, most previous studies have focused on material-scale specimens, beams, columns, impact-loaded slabs, or crack patterns at the final failure state. Their conclusions cannot be directly applied to large-scale slabs with multiple openings. In such structures, the geometric discontinuity caused by openings alters the stiffness distribution and load-transfer path, resulting in pronounced local stress concentration and interaction among cracks. In addition, few studies have tracked the complete crack-evolution process under progressively increasing earth pressure or simultaneously related fractal dimension to deflection, static-stiffness degradation, and a damage index.
Building upon the aforementioned research, this study investigates the damage characteristics of large slabs with openings under earth-pressure variations induced by additional surface loads. Through model experiments, the evolution of concrete surface cracks in subway-station slabs with openings under different earth-pressure levels was obtained. The fractal characteristics of the crack distributions were verified using the box-counting method, and the variation in fractal dimension under graded loading was analyzed. Compared with previous studies, the graded earth-pressure loading approach reproduces the progressive process from crack initiation to penetration and local failure, while the proposed four-stage classification—initial damage accumulation, damage manifestation, damage intensification, and damage saturation—links visible crack morphology with structural-response changes. Furthermore, empirical relationships among fractal dimension, mid-span deflection, static stiffness, and damage index were established, providing a quantitative method for rapidly assessing the damage state of large slabs with openings in subway stations.

2. Model Experiment

2.1. Model Fabrication

A standard section of a subway station was selected for the model experiment. A geometric scale ratio of 1:10 was adopted by balancing prototype representation, laboratory space, and loading-system capacity. A smaller model would amplify size effects on crack initiation and propagation, whereas a larger model would exceed the available test capacity. The scaled model dimensions were 5.1 m × 2.45 m × 2.66 m (length × width × height). The fabricated scaled model is shown in Figure 1. The reinforcement was configured according to the equivalent bearing-capacity principle to maintain comparable reinforcement ratios and flexural resistance. C35 fine-aggregate concrete with mechanical properties close to those of the prototype concrete was used, and 8 mm HRB400 reinforcing bars were adopted. These measures preserve the principal stiffness distribution, load-transfer paths, and crack-evolution characteristics of the prototype, although local scale effects on crack width, spacing, and fracture localization remain unavoidable.
Companion concrete specimens were prepared and cured under the same conditions as the model. Their compressive strength and elastic modulus were measured at the time of structural testing. The measured values showed only limited deviations from the nominal C35 properties and were used in the subsequent mechanical interpretation.
The experiment primarily satisfies geometric and mechanical-response similarity because the objective is monotonic static cracking rather than dynamic reproduction. With CL = 1/10 and Cσ = 1, the area and force similarity ratios are CA = CL2 = 1/100 and CF = CσCL2 = 1/100, respectively. Kinematic and dynamic similarity were not enforced; this distortion and its implications are considered in the limitations of the study. To clarify the notation and avoid confusion between the force and line-load scaling relationships used in the subsequent load conversion, Table 1 summarizes the physical meanings, definitions, and adopted values of the similarity parameters.

2.2. Experimental Scheme

2.2.1. Earth Pressure Calculation

The earth pressure is calculated based on Rankine’s active earth pressure theory, using the water–soil separation method [35]. The calculation equation is shown in Equation (1), and the resultant earth pressure is then determined using Equation (4).
p = K a γ z 2 c K a + γ w z
K a = tan 2 45 ϕ 2
E a = 1 2 h z 0 γ h K a 2 c K a
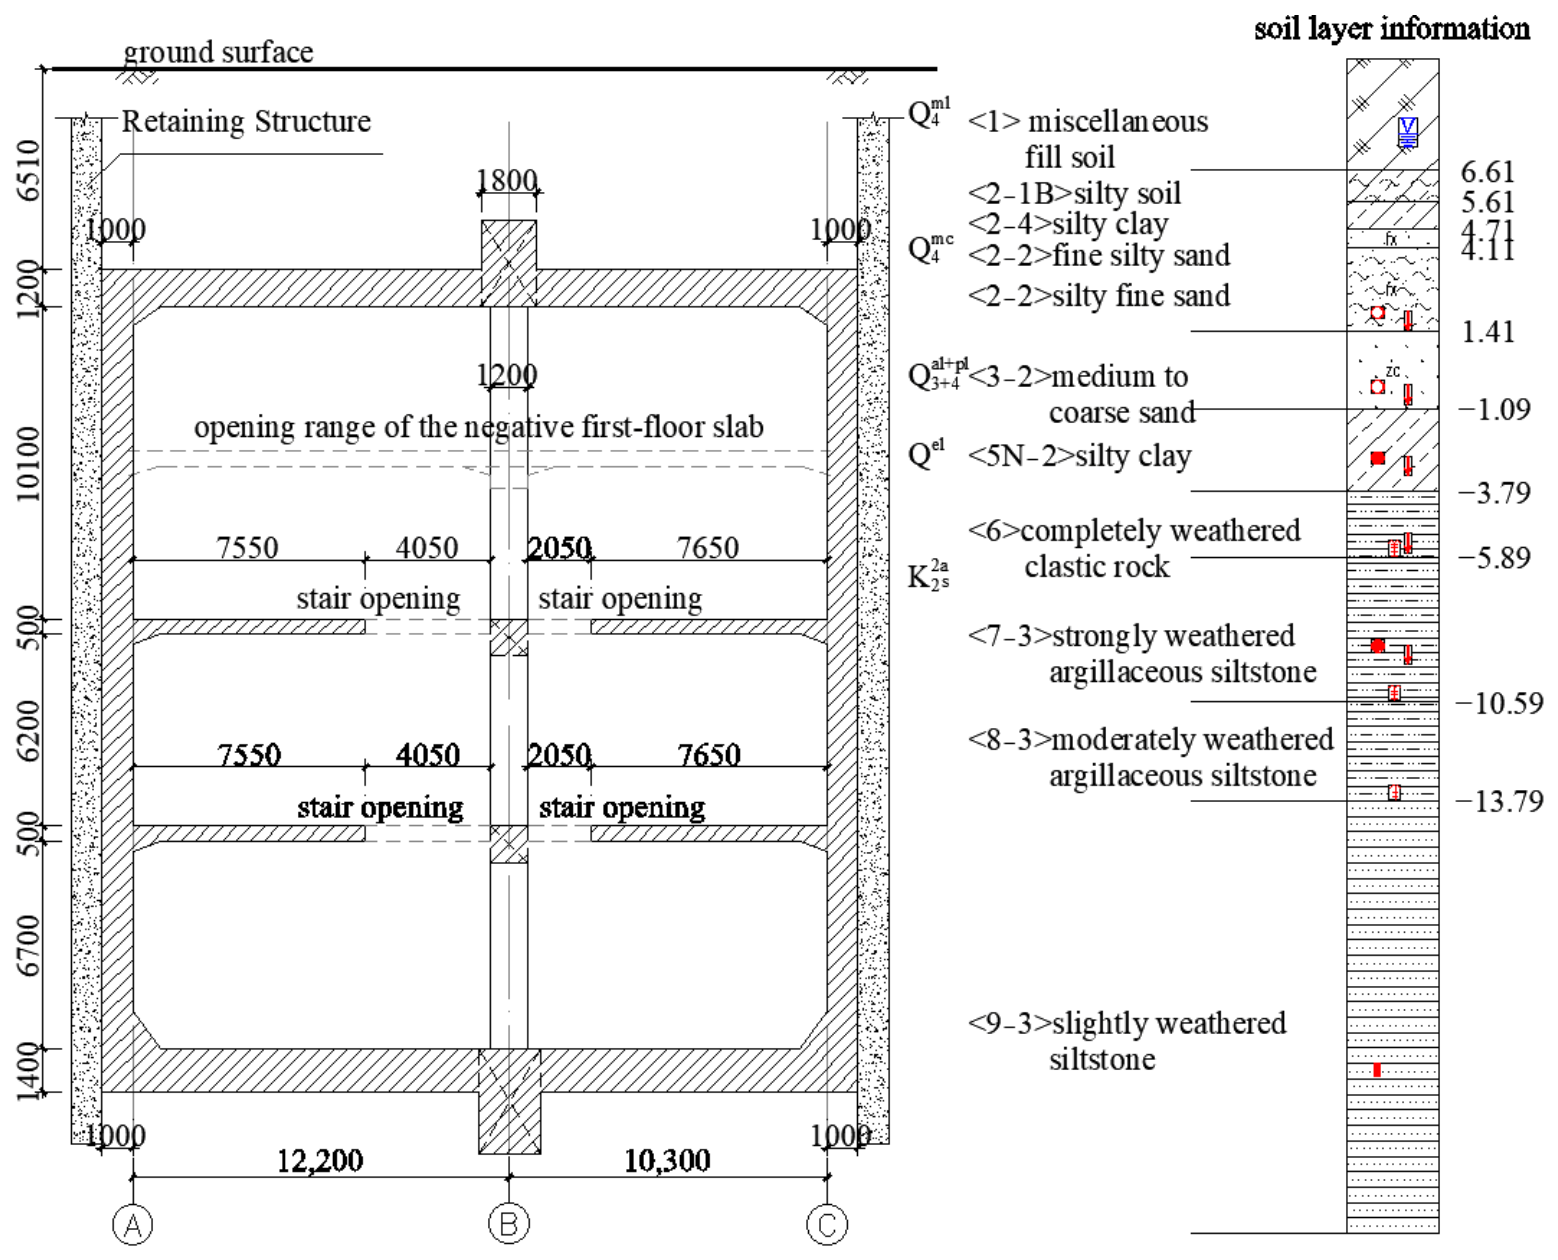
where P represents the total active earth pressure intensity (kPa); γ is the buoyant unit weight of the soil (kN/m3); γ w is the unit weight of water, taken as 9.8 kN/m3 in this study; z is the soil layer depth (m); h is the thickness of each soil layer (m); and Ka is the Rankine active earth pressure coefficient. The prototype subway station has a burial depth of 6.8 m. For the scaled model structure, surface overload, vehicle loads, and crowd loads were also considered. The calculated load distribution is shown in Figure 2.
The station structure has a height of 25.2 m, and the three loading zones are each 8.4 m high. The corrected prototype line loads are 999.41, 1819.24, and 2354.65 kN/m. A prototype line load must be converted using the line-load similarity ratio Cw = CF/CL = 0.10, rather than by applying the concentrated-force ratio CF = 0.01 to a load integrated over the model length. C w = C F C L = C σ C L , wm = Cwwp, Fm = wmLm = (wpLp)CF. With Lp = 51.0 m and Lm = 5.10 m, both conversion routes give Fm = 0.51wp. Each loading level has three jacks on each side, and the two sides are loaded symmetrically. The single-side model resultants are 509.70, 927.81, and 1200.87 kN for the upper, middle, and lower loading zones, respectively.
Fjack = Fm/3
Accordingly, the target force per jack on one side is 169.90, 309.27, and 400.29 kN for the upper, middle, and lower loading zones, respectively. Jack outputs were monitored in real time and adjusted to the target values before each holding period.

2.2.2. Design and Fabrication of Loading Devices

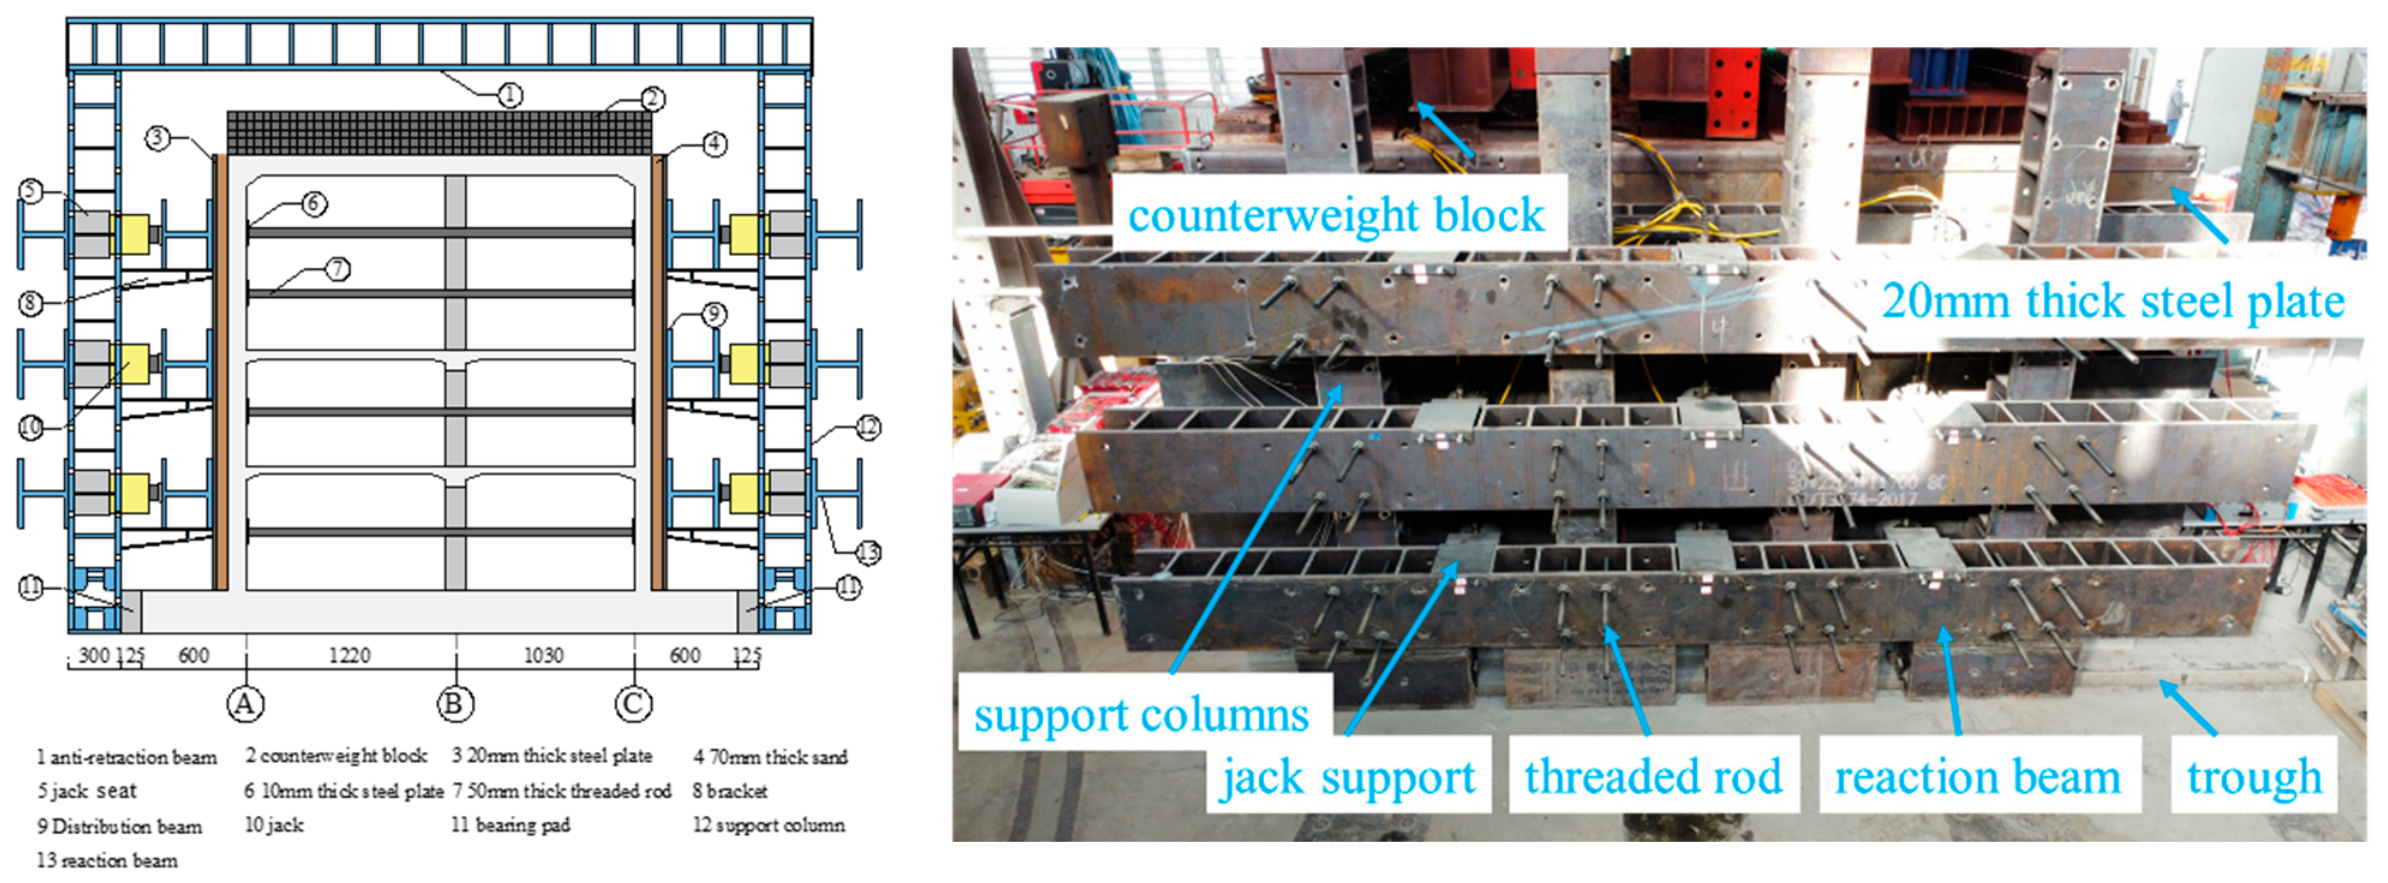
A loading simulation device was designed and fabricated to study the failure characteristics of subway station slabs with openings under different water and earth pressure loads. The design of the loading device is described as follows:
(1)
Place support columns within the laboratory channel and secure their positions by tightening ground anchor bolts. Install brackets inside the support columns and place distribution beams on the brackets. Position reaction beams on the outer sides of the support columns, and connect the reaction beams, brackets, and support columns using bolts.
(2)
Suspend jack seats on the reaction beam, and place jacks inside the jack seats. The soil profile was simplified into three loading levels. At each level, three jacks were arranged on each side, and the two sides were loaded symmetrically. Calculate the earth pressure values for the prototype station structure and determine the thrust for each layer of jacks based on similarity principles. The overlying load of the station is simulated using counterweights.
(3)
During model loading, a hydraulic system is used to push the distribution beam to simulate layered water and earth pressure loading. The thrust values are controlled based on the readings from the hydraulic control system display. The design and installation of the loading device are shown in Figure 3.
Before testing, the HC-F800 concrete defect testing instrument was checked using standard crack-width specimens, and representative cracks were repeatedly measured. During measurement, the probe was placed perpendicular to the crack direction and several positions were sampled along each crack. Crack paths were reconstructed from the marked surface grid, staged crack records, high-resolution photographs, and CAD drawings. Jack loads were monitored by pressure sensors with a range of 0–3000 kN, while slab displacement was measured using YHD-50 displacement transducers with a range of ±25 mm. Load and displacement signals were synchronously recorded by TDS-540 and TST3862E acquisition systems at 1 Hz. All channels were zeroed and sensitivity-calibrated before loading; after each load level stabilized, data were recorded for 10 min and the mean value was adopted.
The station model was placed in the laboratory trench, with the bottom slab supported by the trench foundation. The walls, slabs, and central columns were cast monolithically, providing continuous slab-wall and slab-column restraints consistent with the prototype. Lateral load was transferred through a 70 mm compacted sand layer and an external steel plate, thereby reducing direct contact and localized loading on the model surface. The reaction frame provided the required loading reaction but did not directly restrain slab deformation. Its potential influence was limited to small frame deformation and pressure nonuniformity; these effects were reduced by tightening all connections, checking frame stability, compacting the sand layer in lifts, and applying the loads symmetrically through distribution beams.

2.2.3. Loading Scheme

The specific loading steps are as follows:
(1)
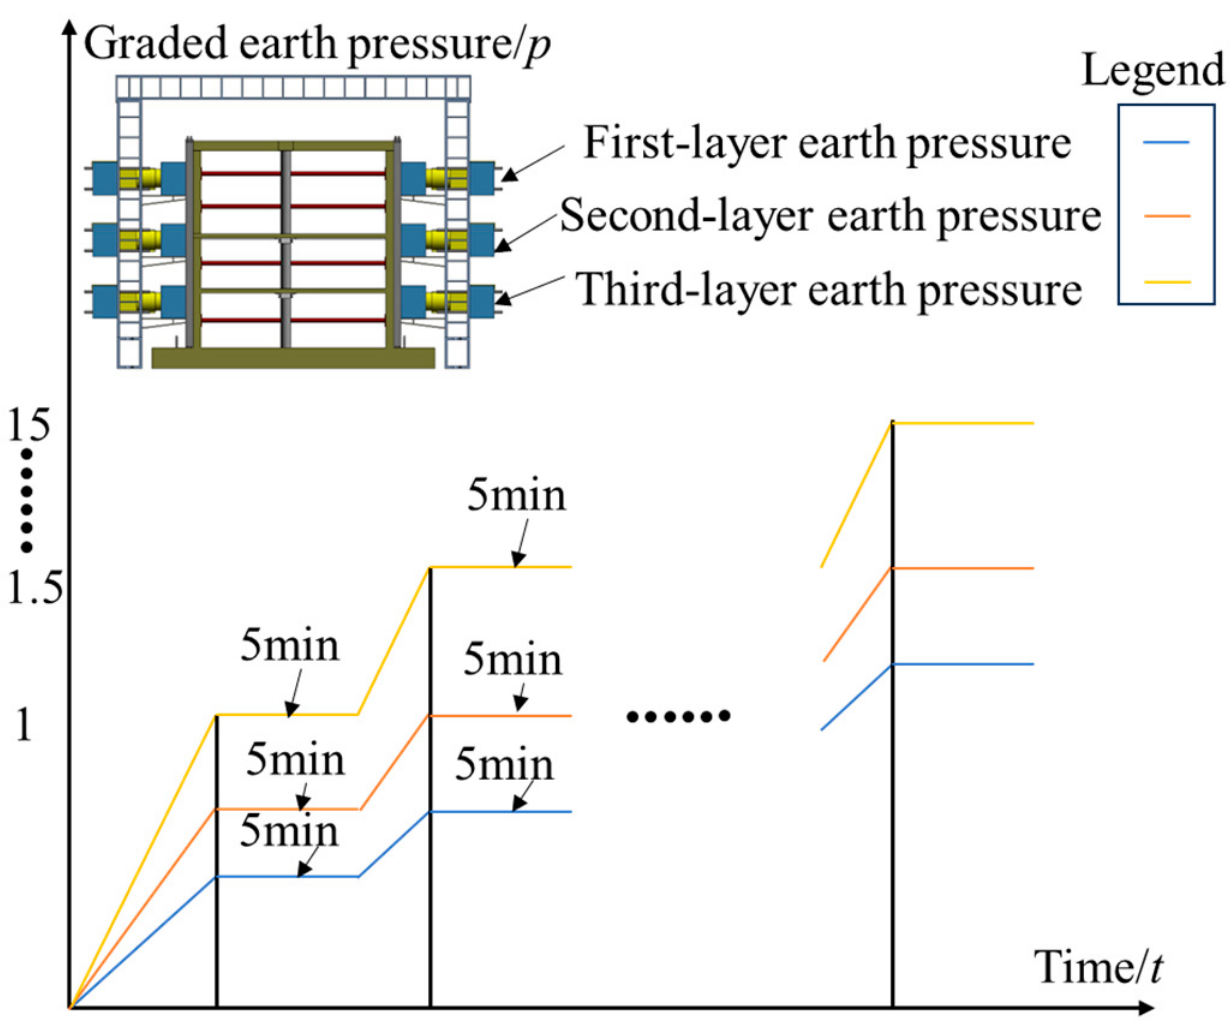
Symmetrically load the first layer of jacks on the sidewall to 1× earth pressure.
(2)
Symmetrically load the second layer of jacks on the sidewall to 1× earth pressure.
(3)
Symmetrically load the third layer of jacks on the sidewall to 1× earth pressure and hold for 5 min.
(4)
Load the first layer of jacks on the sidewall to 1.5× earth pressure.
(5)
Load the second layer of jacks on the sidewall to 1.5× earth pressure.
(6)
Load the third layer of jacks on the sidewall to 1.5× earth pressure and hold for 5 min. …Subsequent graded loading follows steps (4)–(6).
The loading regime is shown in Figure 4.

3. Experimental Results Analysis

3.1. Load–Displacement Curve

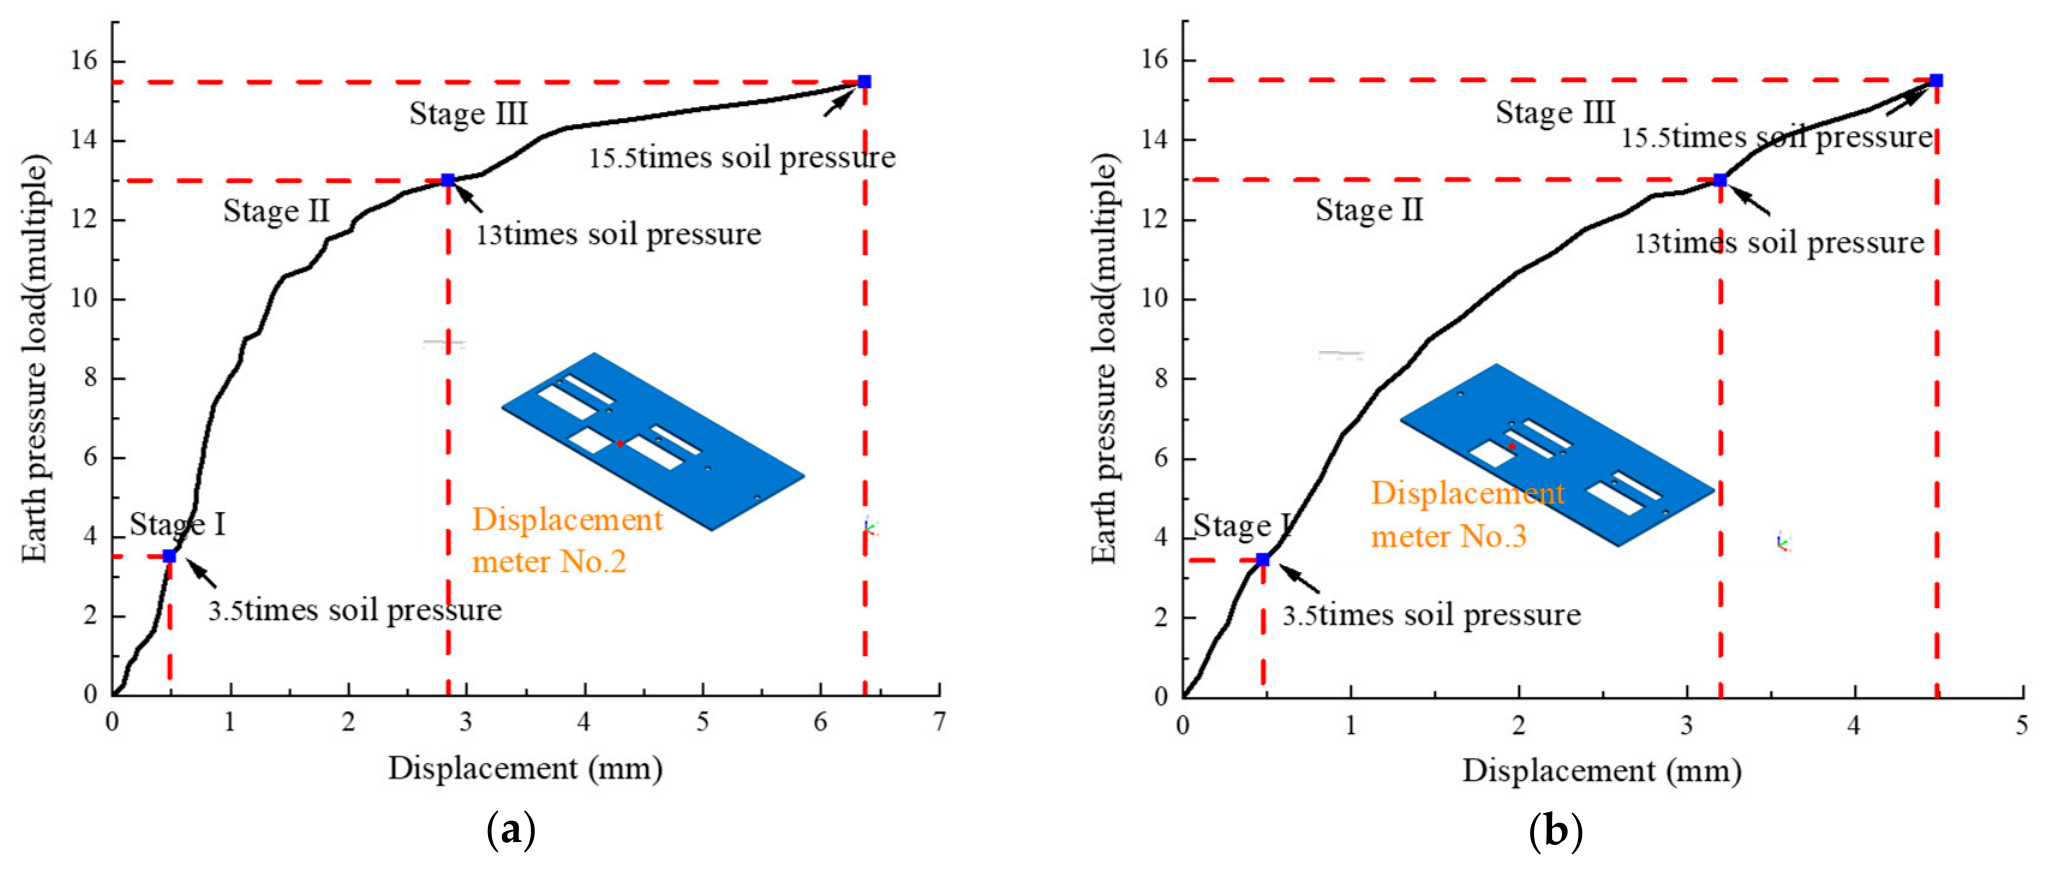
Figure 5 shows the load–displacement response of the slabs under graded earth pressure. Both slabs deflected downward, and the maximum measured displacements of the negative second- and third-floor slabs were 6.3 and 4.5 mm, respectively. These maxima occurred near the final loading stage and correspond to significant stiffness degradation and local failure rather than a serviceability limit displacement. Because the values were obtained from a 1:10 model under amplified loading, they should not be directly compared with prototype serviceability or ultimate limit criteria.
The transition points were identified by combining changes in the slope of the load–displacement curves with the observed cracking and failure phenomena. Stage I (1–3.5 times earth pressure) was approximately elastic, with nearly linear displacement growth and no visible surface cracking. The first transition, at approximately 4 times earth pressure, coincided with the appearance of visible cracks and the onset of stiffness degradation. Stage II (4–12 times earth pressure) was characterized by rapid displacement growth, crack propagation, and elastoplastic behavior. The second transition, at approximately 12 times earth pressure, coincided with accelerated displacement, concrete spalling, and local yielding. Stage III (12–15.5 times earth pressure) represented severe stiffness degradation and localized failure.

3.2. Surface Crack Evolution of Opening Slabs

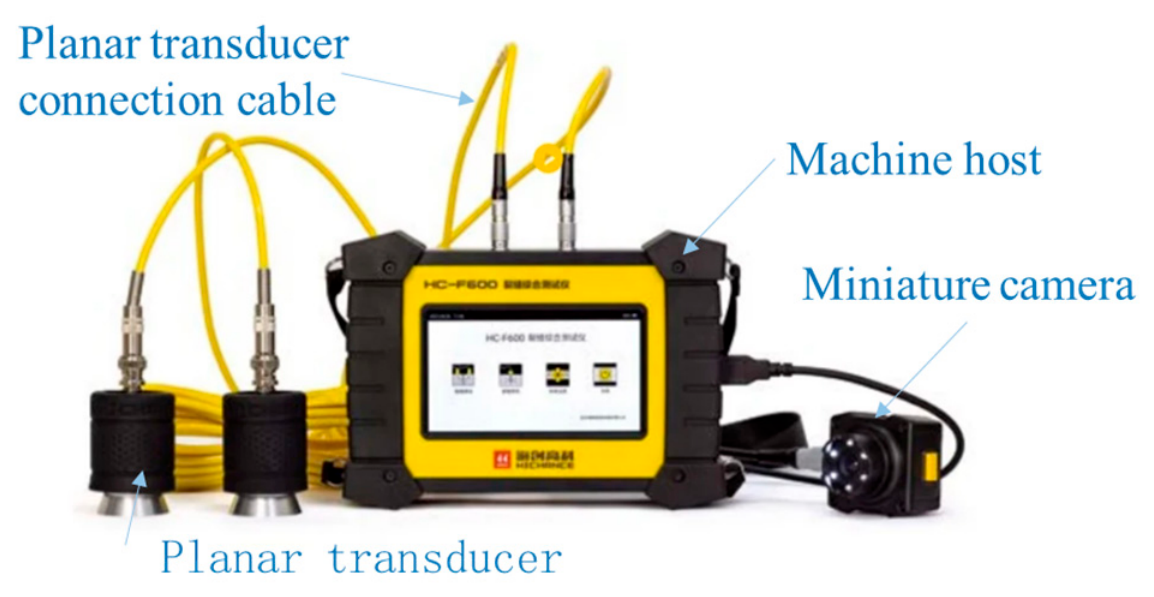
The degradation of concrete structural performance is directly related to crack initiation, propagation, quantity, and distribution [8,18]. The HC-F800 concrete defect testing instrument was used to measure representative crack widths and trace crack paths, as shown in Figure 6. Before testing, it was checked using standard crack-width specimens, and repeated measurements were performed at representative locations. The box-counting analysis primarily depends on crack spatial distribution rather than crack width or depth; therefore, measurement uncertainty mainly affects very fine cracks close to the detection threshold. Crack maps were reconstructed using the marked model grid, staged crack records, high-resolution photographs, and CAD drawings. The caption and terminology of the instrument have been unified as HC-F800 throughout the manuscript.
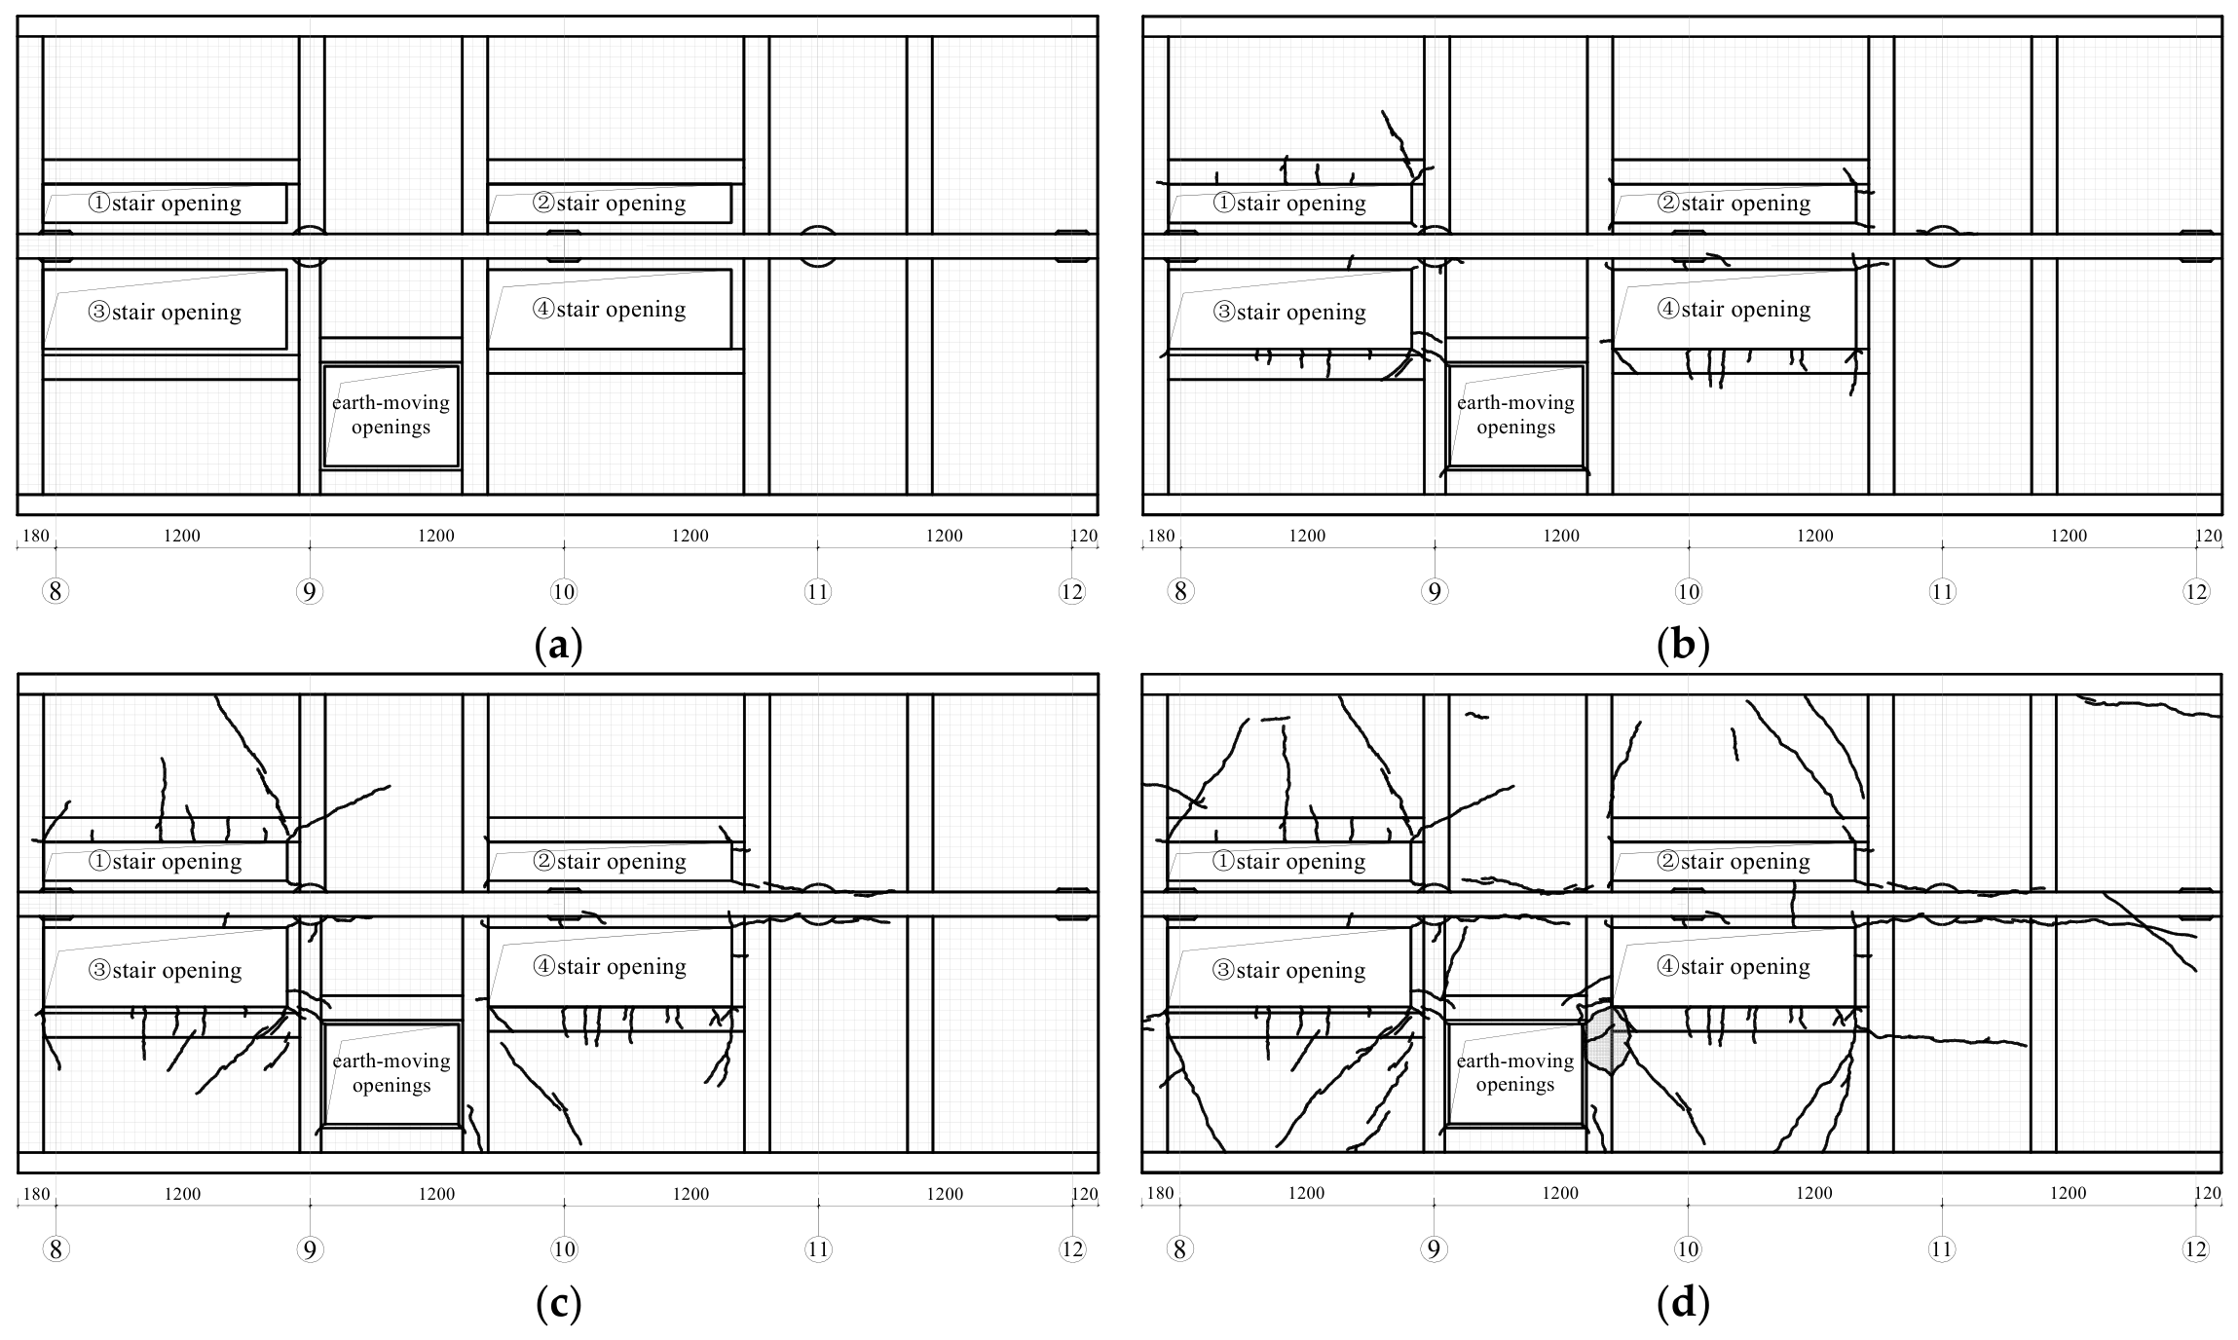
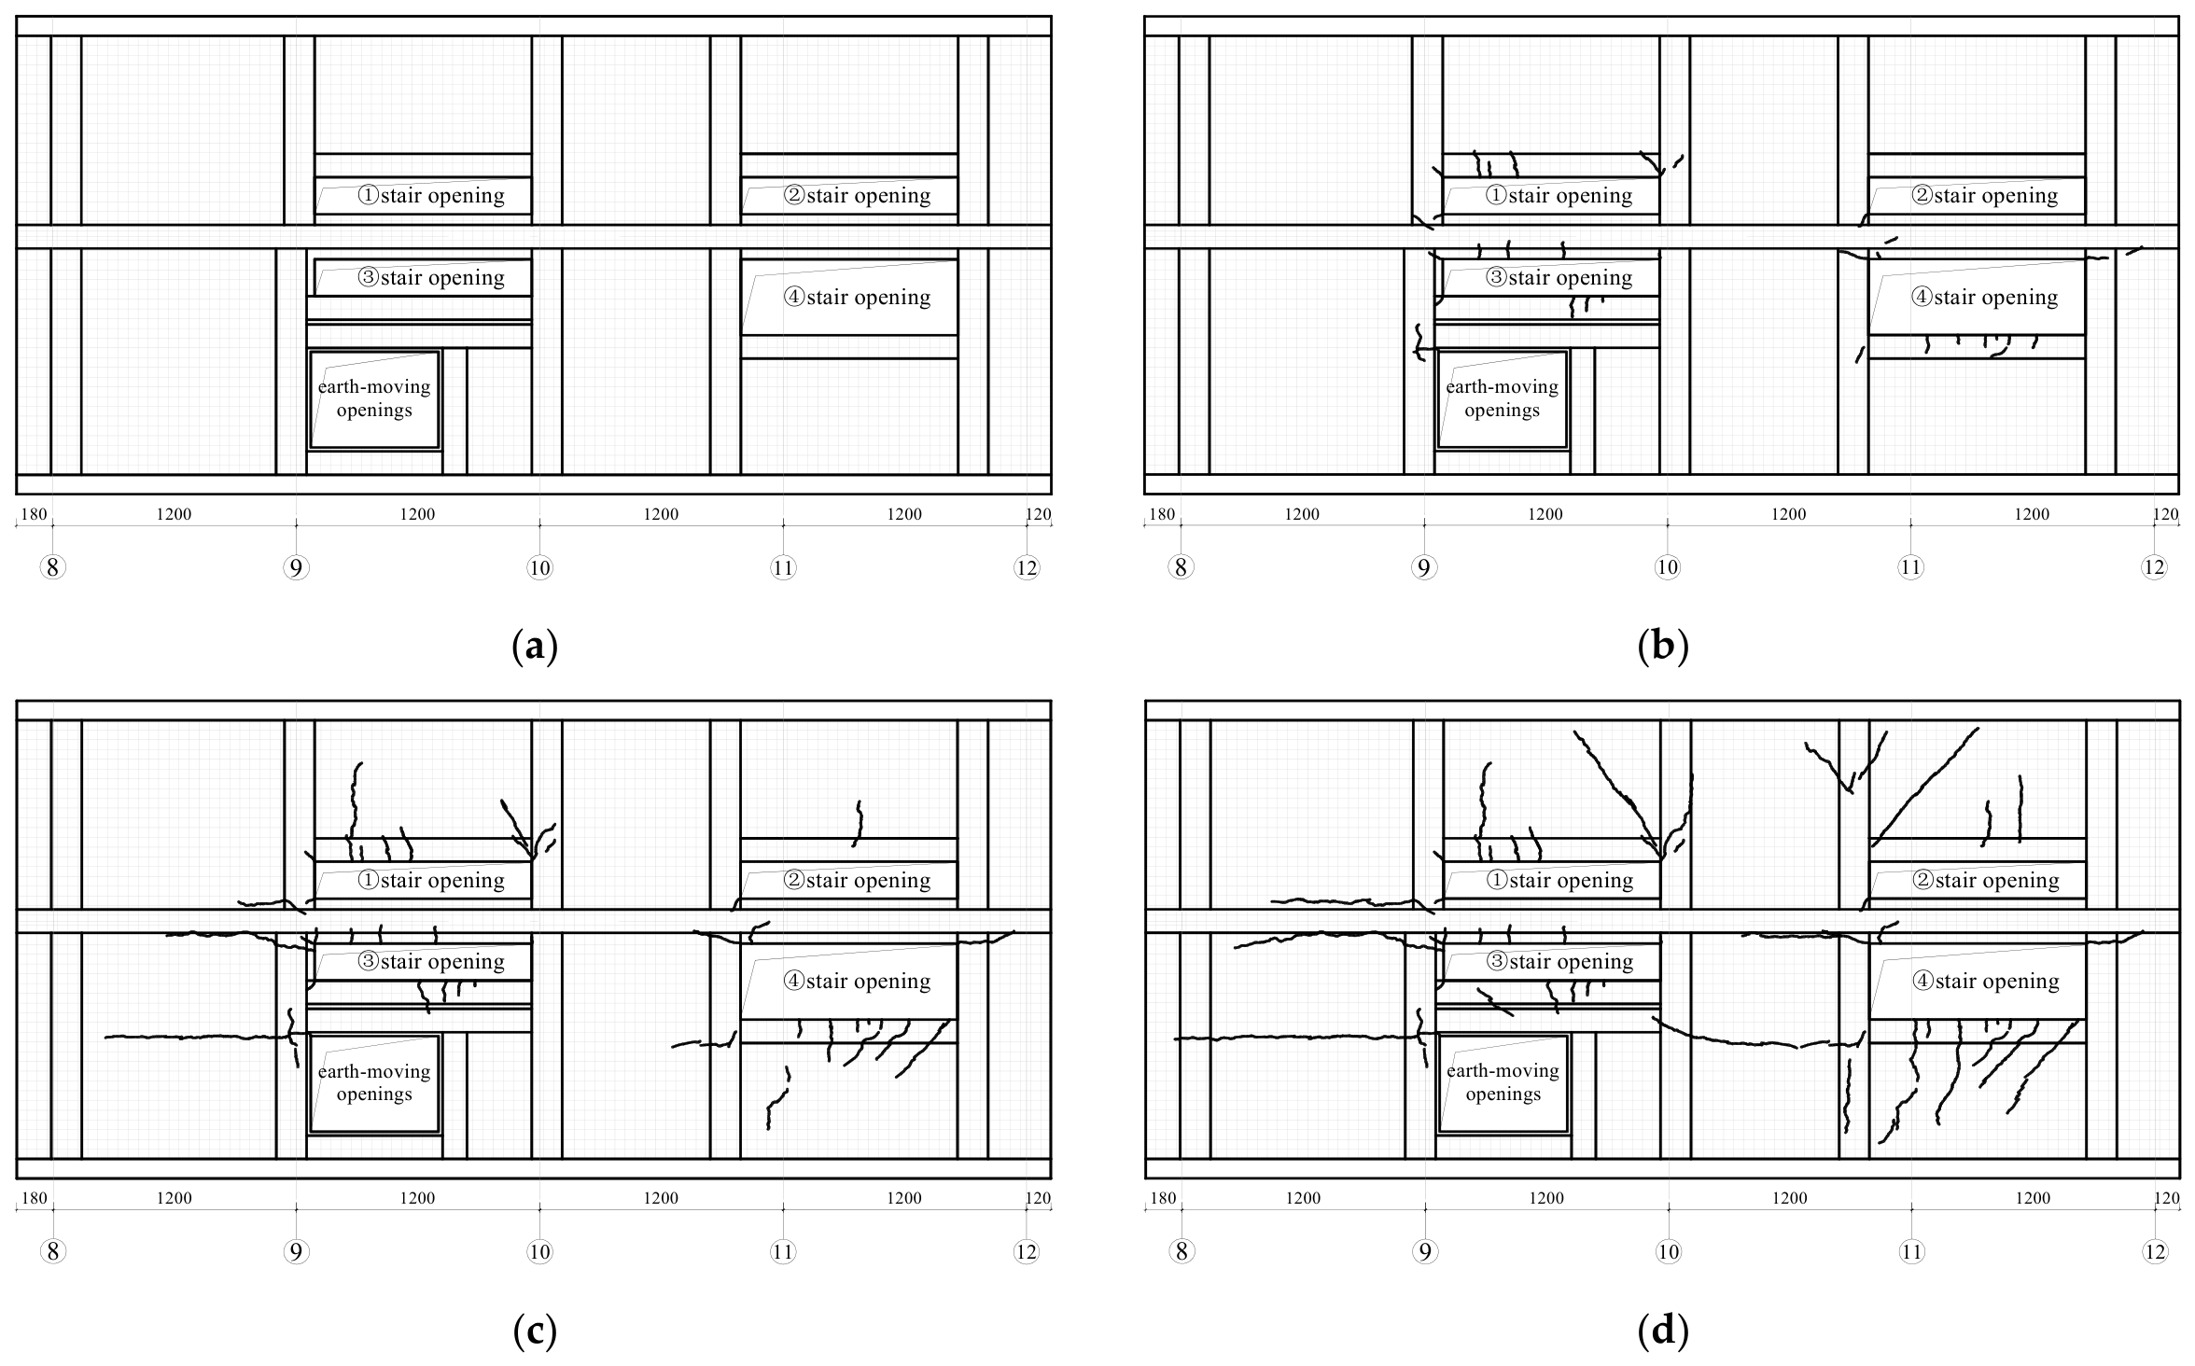
The four damage stages were determined by combining observable crack morphology with the load–displacement response and static-stiffness evolution [36]. Initial damage accumulation (0–3.5 times earth pressure) corresponded to an approximately elastic response without visible cracks. Damage manifestation began at approximately 4 times earth pressure, when the first visible cracks appeared and stiffness started to decrease. Damage intensification was characterized by rapid crack extension, branching, interaction, and accelerated stiffness degradation. Damage saturation (13–15.5 times earth pressure) corresponded to penetrating cracks, marked stiffness loss, concrete spalling, and local failure. No energy-based threshold was adopted because cumulative energy dissipation was not measured.

4. Calculation of Fractal Dimension

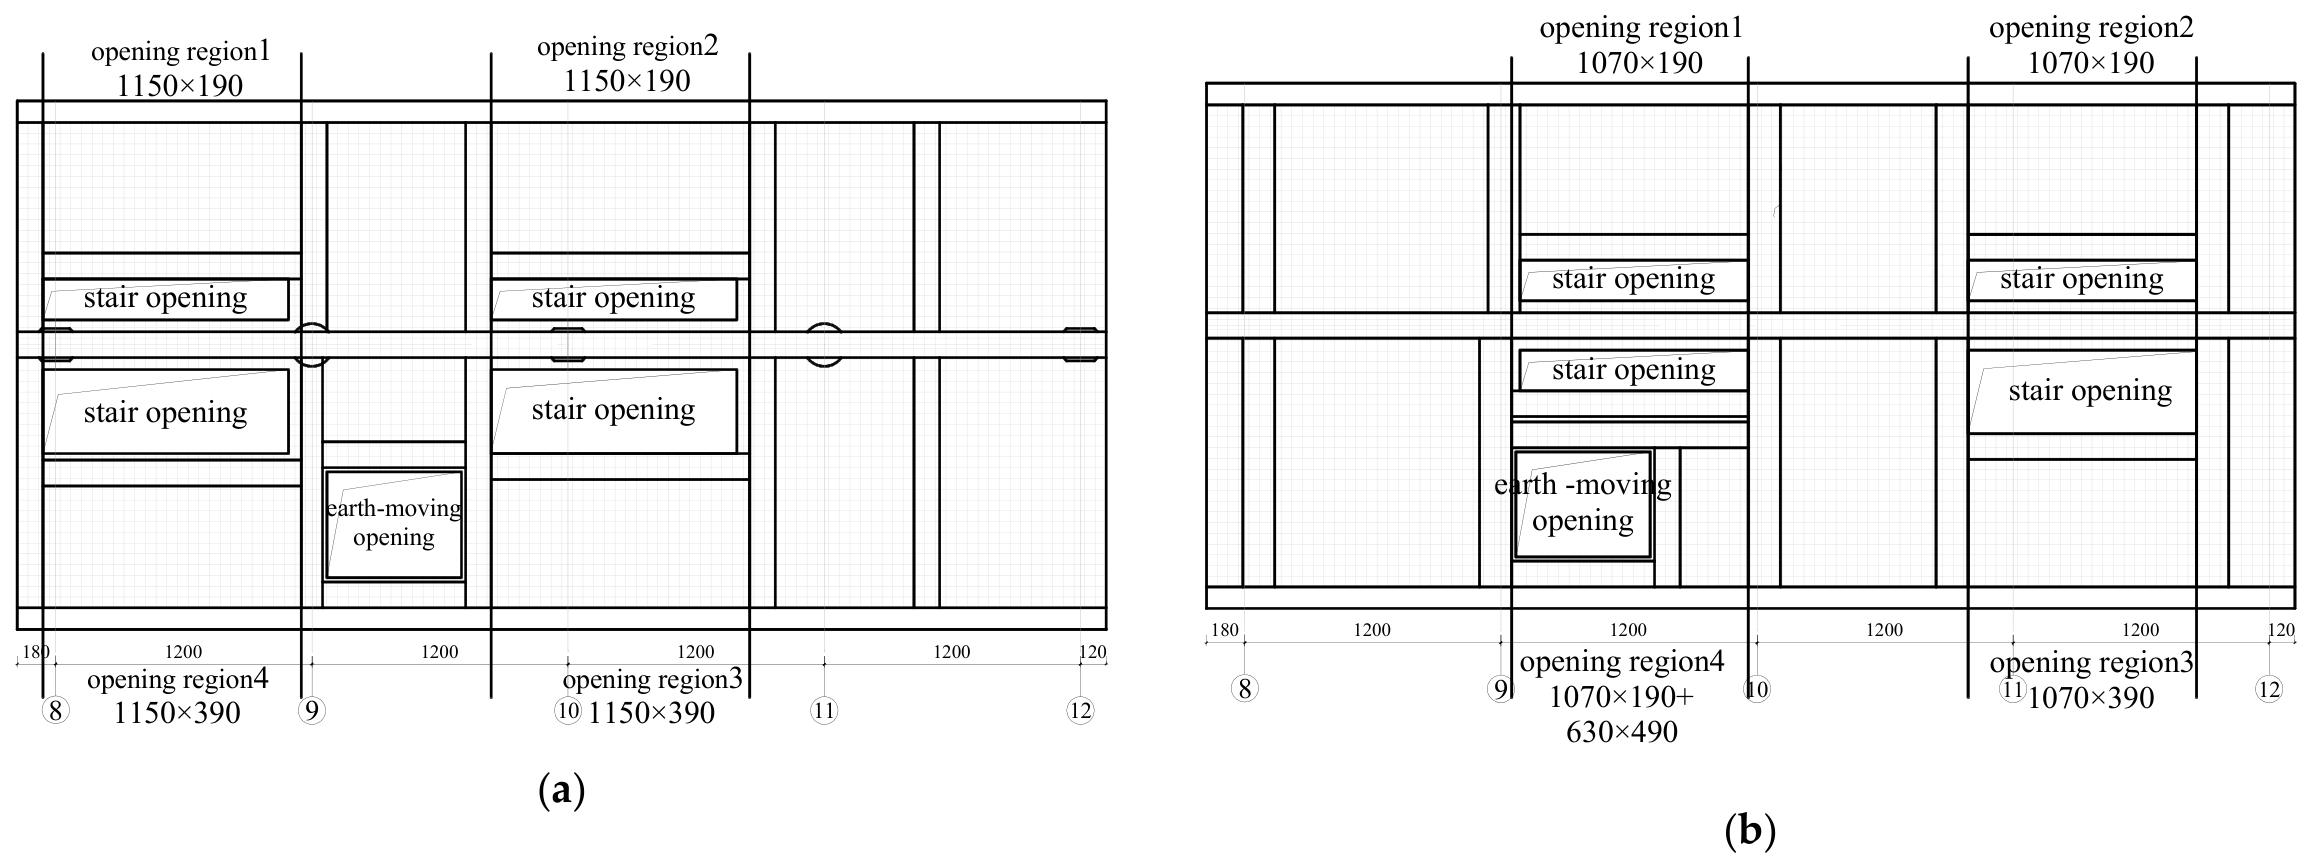
As shown in Figure 7 and Figure 8, during the experiment, the cracks in the opening slabs were numerous and dense, with crack development exhibiting a certain degree of randomness. Traditional terminology cannot accurately describe the characteristics of these cracks, making it difficult to qualitatively represent the evolution of the crack patterns. Fractal theory, which studies irregular geometry, is highly applicable for crack morphology analysis [37]. The fractal dimension not only characterizes the crack development process during the experiment but also quantifies the damage degree of the opening slab. It is one of the most important indicators in fractal theory [38,39]. Therefore, this study explores the use of fractal theory to investigate the crack development laws of the opening slab. From Figure 7 and Figure 8, it can be observed that under graded earth pressure loading, the cracks mainly distribute in the floor slab’s opening region. The opening is divided into four equal areas based on the span, as shown in Figure 9, collectively referred to as the opening region. The overall fractal characteristics of the opening slab cracks and the fractal characteristics of cracks in the opening region are comprehensively analyzed, thus achieving multiple applications of fractal theory.
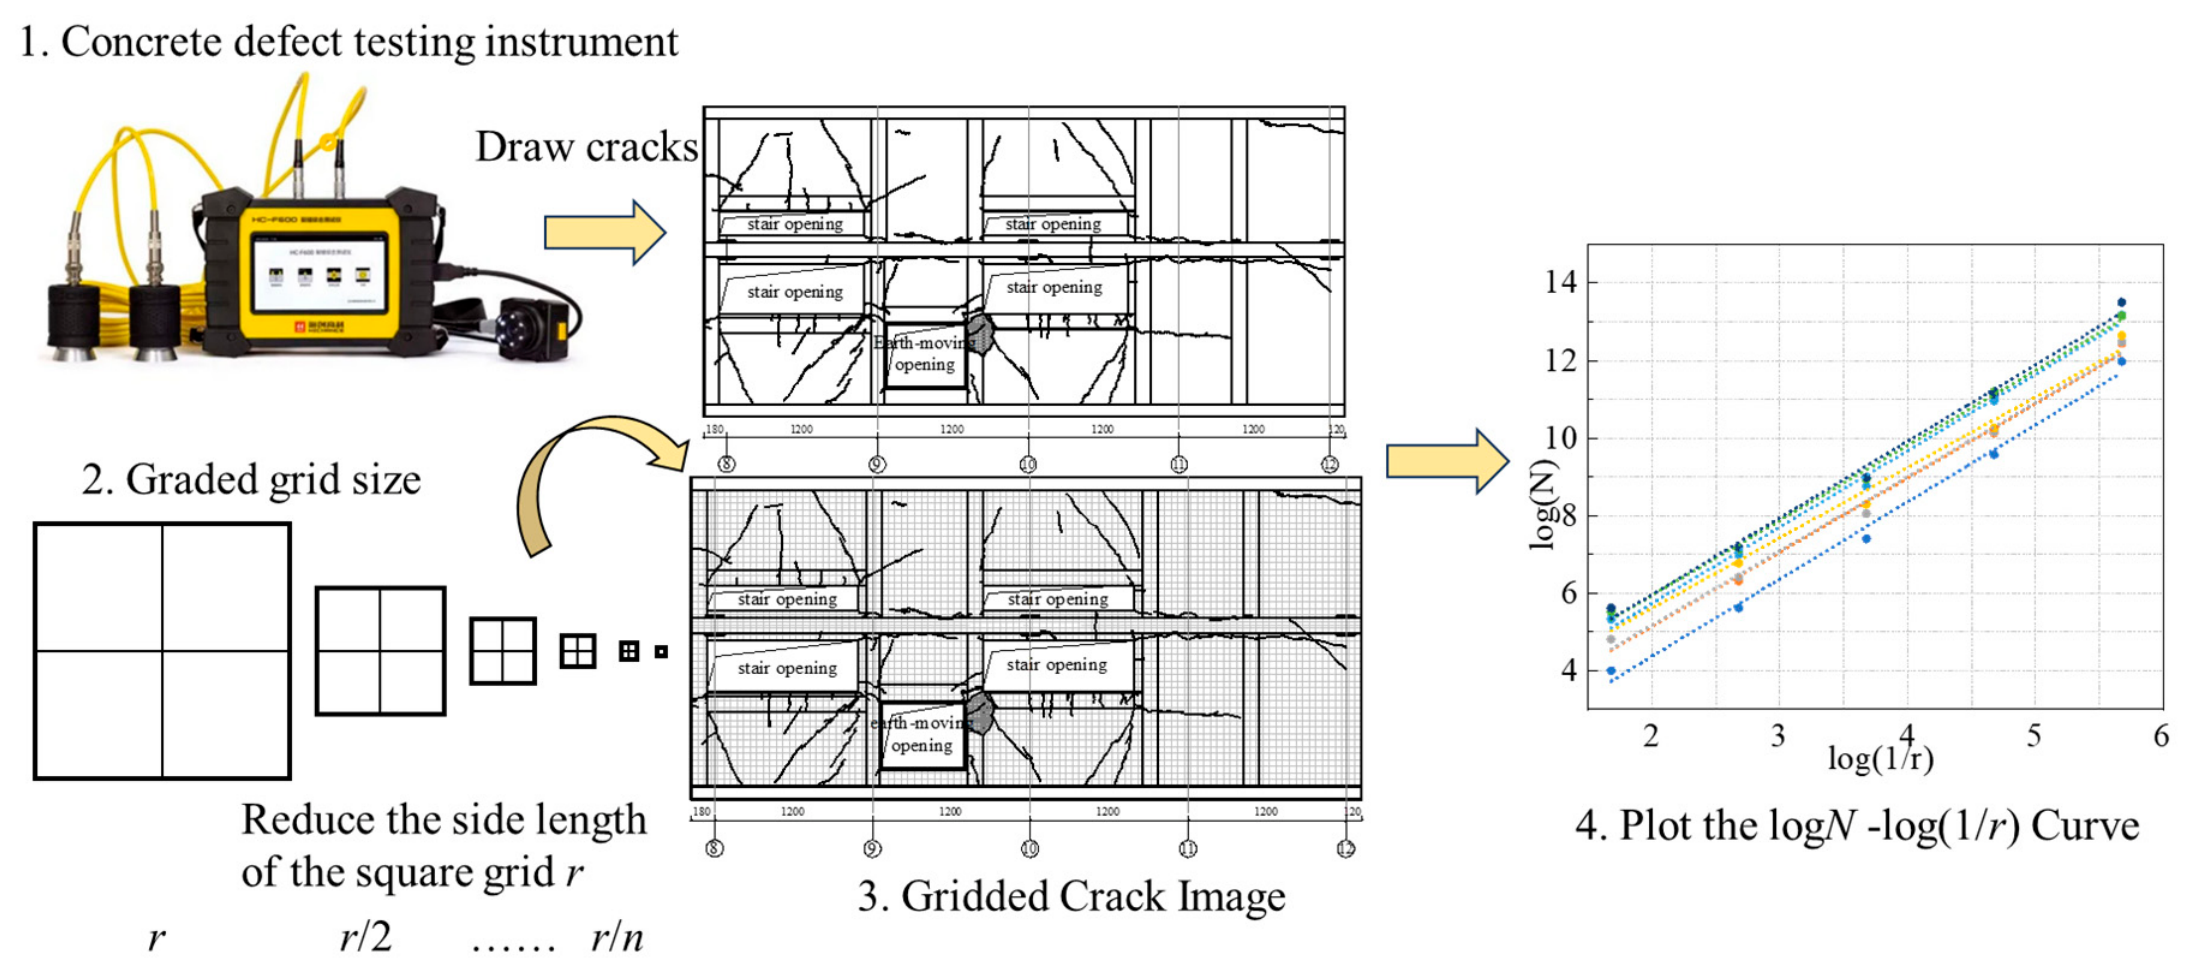
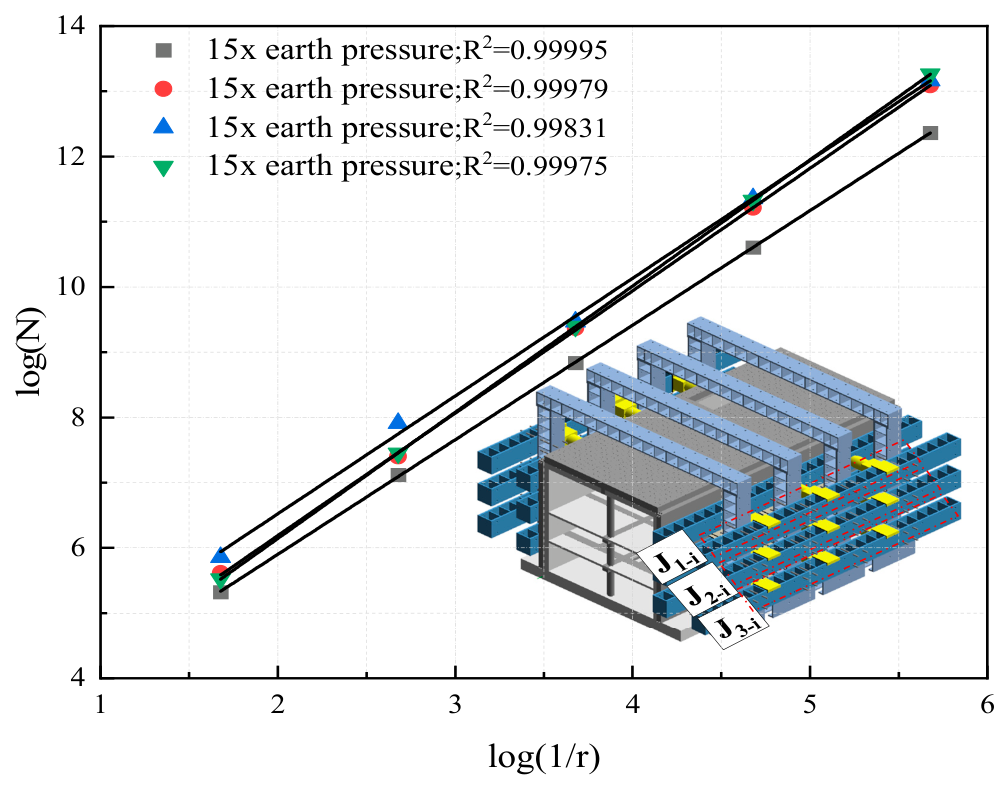
The calculation methods for fractal dimension primarily include the island method [40], ruler method [41], and box-counting method [42]. The box-counting method was adopted for the apparent crack maps. Crack distributions at different loading stages were first reconstructed from the experimental records and standardized to the same analysis scale and region. A sequence of progressively reduced square grids within the calibrated scale range was then superimposed on each crack map. For each grid size r, the number N of boxes containing cracks was counted. The fractal dimension Df was obtained as the slope of the linear regression between InN and In(1/r). The calculation process for the fractal dimension is shown in Figure 10:
D f = d I n N / d I n r
If the above curve is a linear function, it indicates that the crack image exhibits fractal characteristics in a statistical sense. Otherwise, fractal theory cannot be used for crack analysis.
The box-counting method was applied to physically calibrated CAD crack maps. Crack photographs were used to identify, stitch, and verify crack paths, whereas the box counts were performed on CAD drawings with millimetres as the drawing unit. Therefore, photograph pixel resolution is not a direct computational parameter, and no grayscale thresholding, raster binarization, or skeletonization was involved. Ten geometrically spaced square-box sizes from 5 to 50 mm were used. r i = 5 × 10 i 1 9 mm, i = 1, 2, …, 10.
The exact grid sizes were 5.000, 6.458, 8.341, 10.772, 13.913, 17.969, 23.208, 29.974, 38.713, and 50.000 mm. For each scale r, N(r) denotes the number of boxes intersected by the crack map.
ln N ( r ) = D f ln ( 1 / r ) + B
The fractal dimension Df was determined as the ordinary-least-squares slope of ln N(r) versus ln(1/r) over all ten scales. A regression was accepted as exhibiting statistical scale invariance when R2 > 0.95. Because the CAD-based counting and regression are deterministic under fixed input drawings and settings, repeating the identical calculation does not constitute a repeatability assessment.

4.1. Fractal Characteristics of Cracks in Slabs with Openings Under Graded Earth Pressure

4.1.1. Fractal Characteristics of Cracks in the Opening Region Under Graded Earth Pressure

Not all irregular shapes exhibit fractal characteristics; fractal properties are present only when a shape demonstrates self-similarity within a specific scale range [43]. The evolution of surface cracks in the concrete of the slab and opening region under different earth pressures exhibits randomness, and whether they conform to fractal characteristics requires further verification. Based on the above analysis, this study employs the box-counting method to calculate the fractal dimension of the surface cracks in the slab.
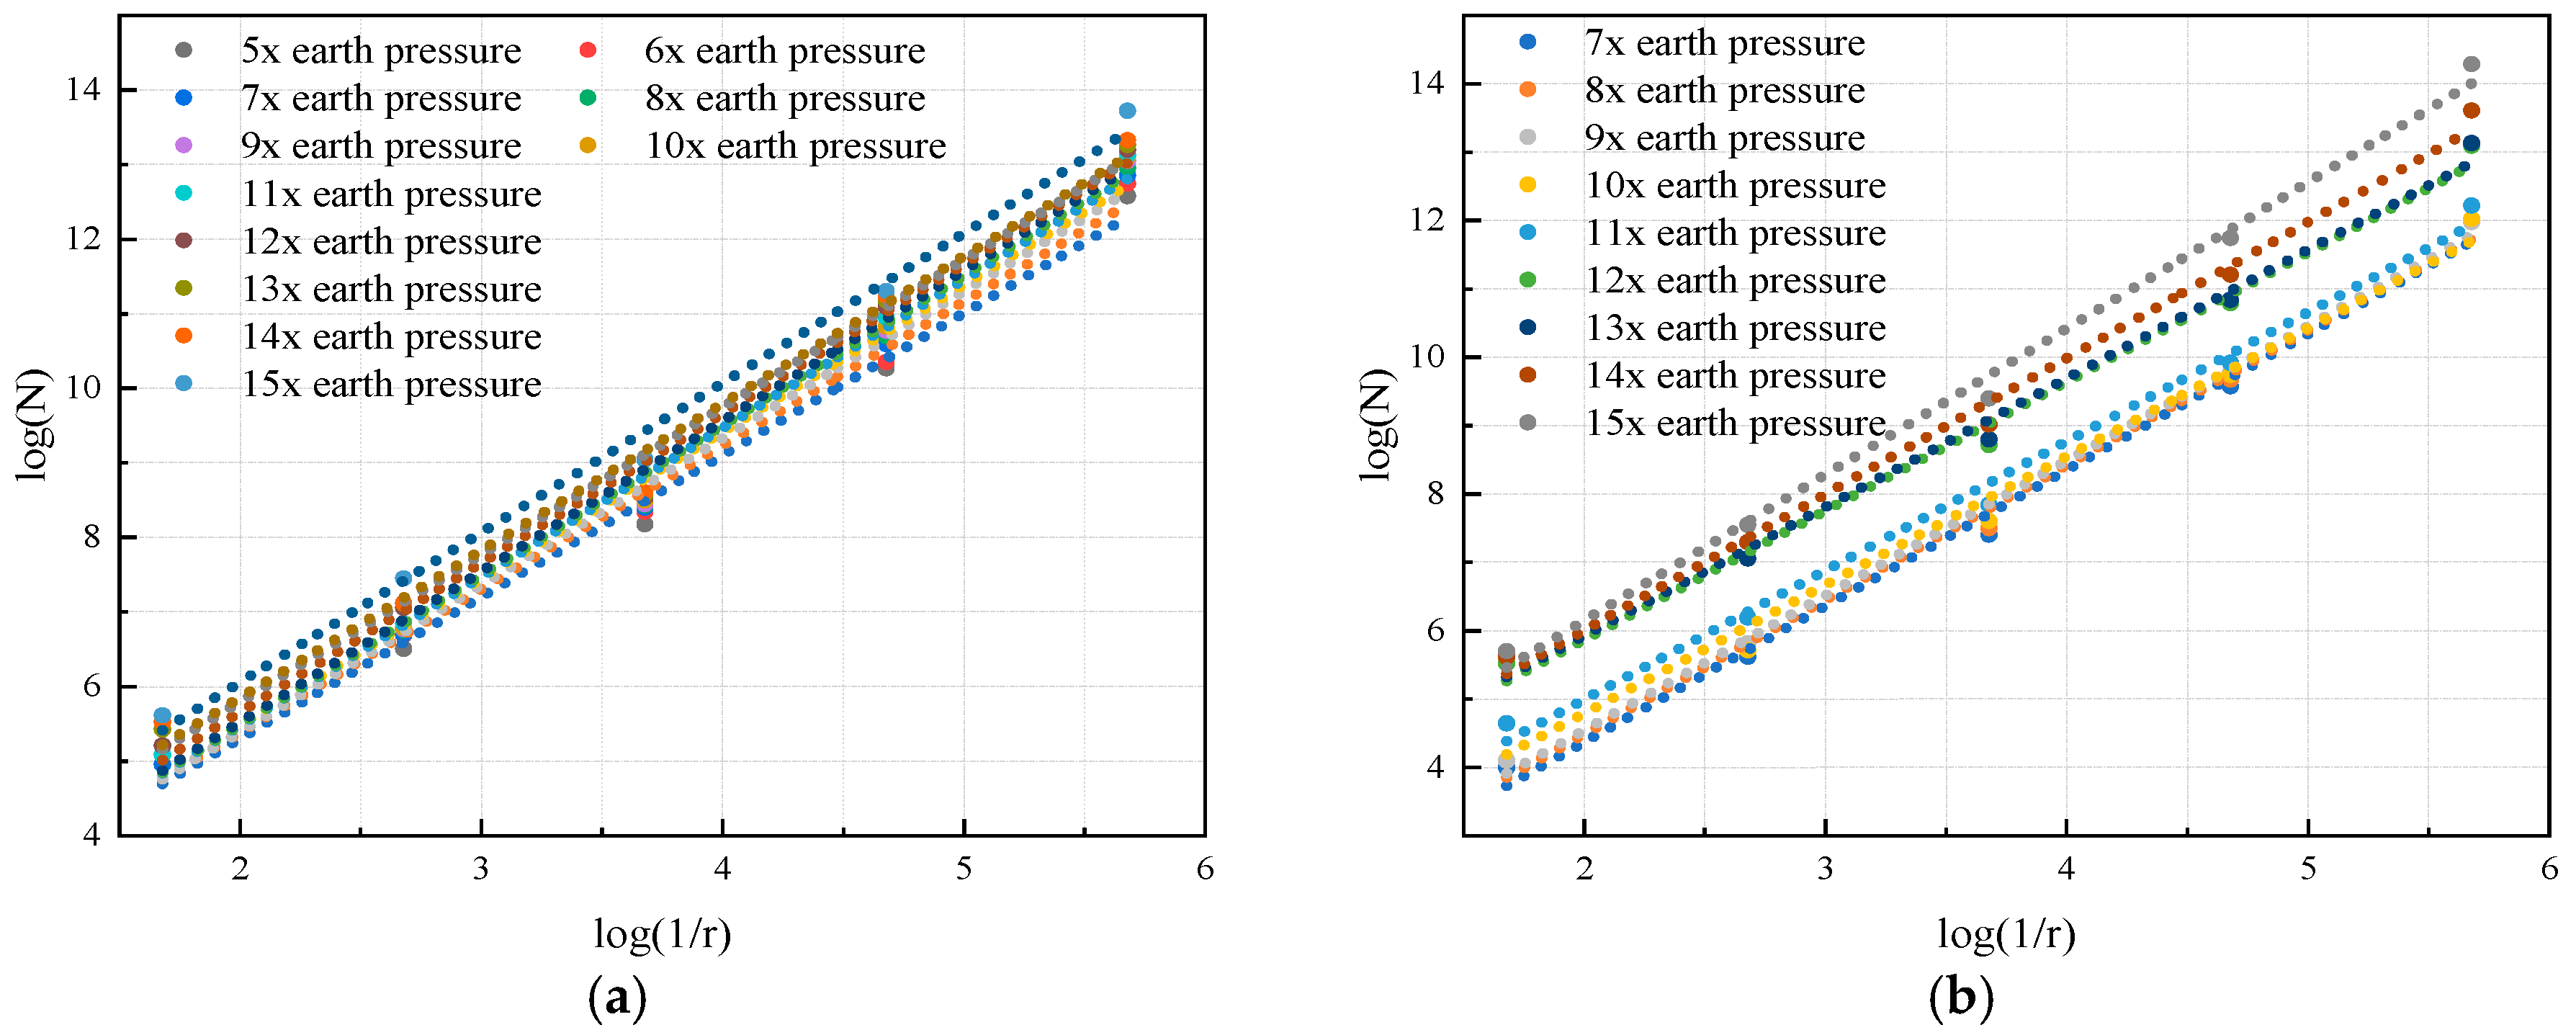
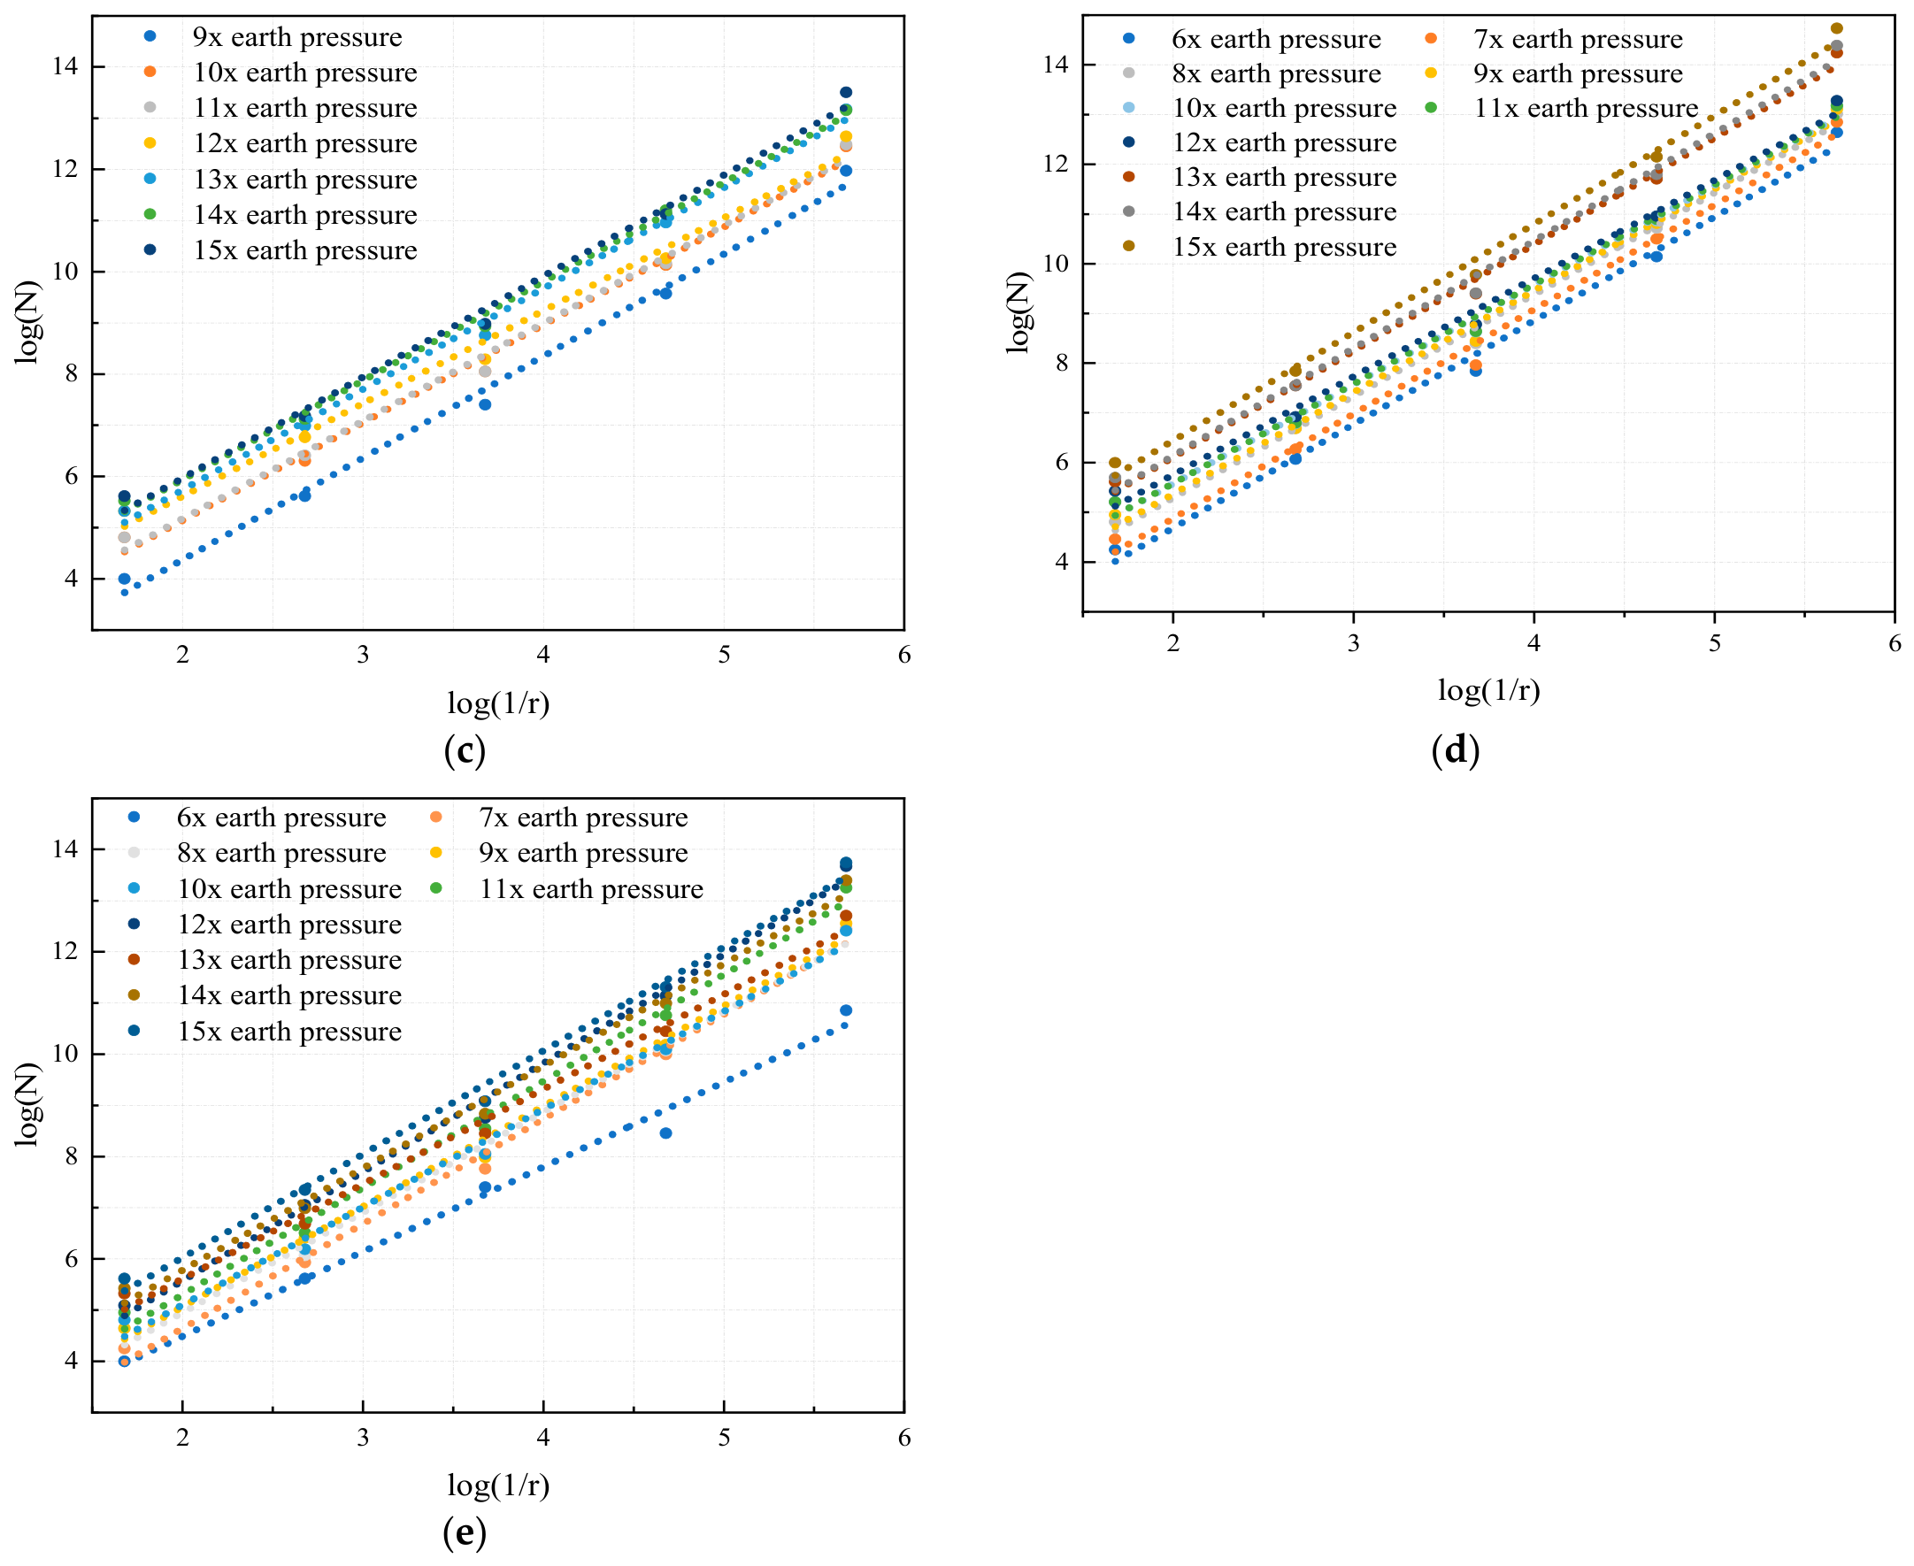
Based on the crack distribution maps collected during the experiment, the box-counting method was used to calculate the relationship between logN and log(1/r) under graded earth pressure in the opening region, as shown in Figure 11. From Figure 11, it can be observed that within the calibrated grid size range, the logN-log(1/r) curves exhibit a significant linear relationship under different earth pressures, with the coefficient of determination R2 approaching 1. This indicates that the crack distribution on the concrete surface in the opening region of the slab under various earth pressures possesses self-similarity and satisfies the statistical fractal characteristics. Therefore, using fractal theory to describe the evolution of surface cracks in the opening region of the slab is feasible.

4.1.2. Fractal Characteristics of Overall Cracks in Slabs with Openings Under Graded Soil Pressure

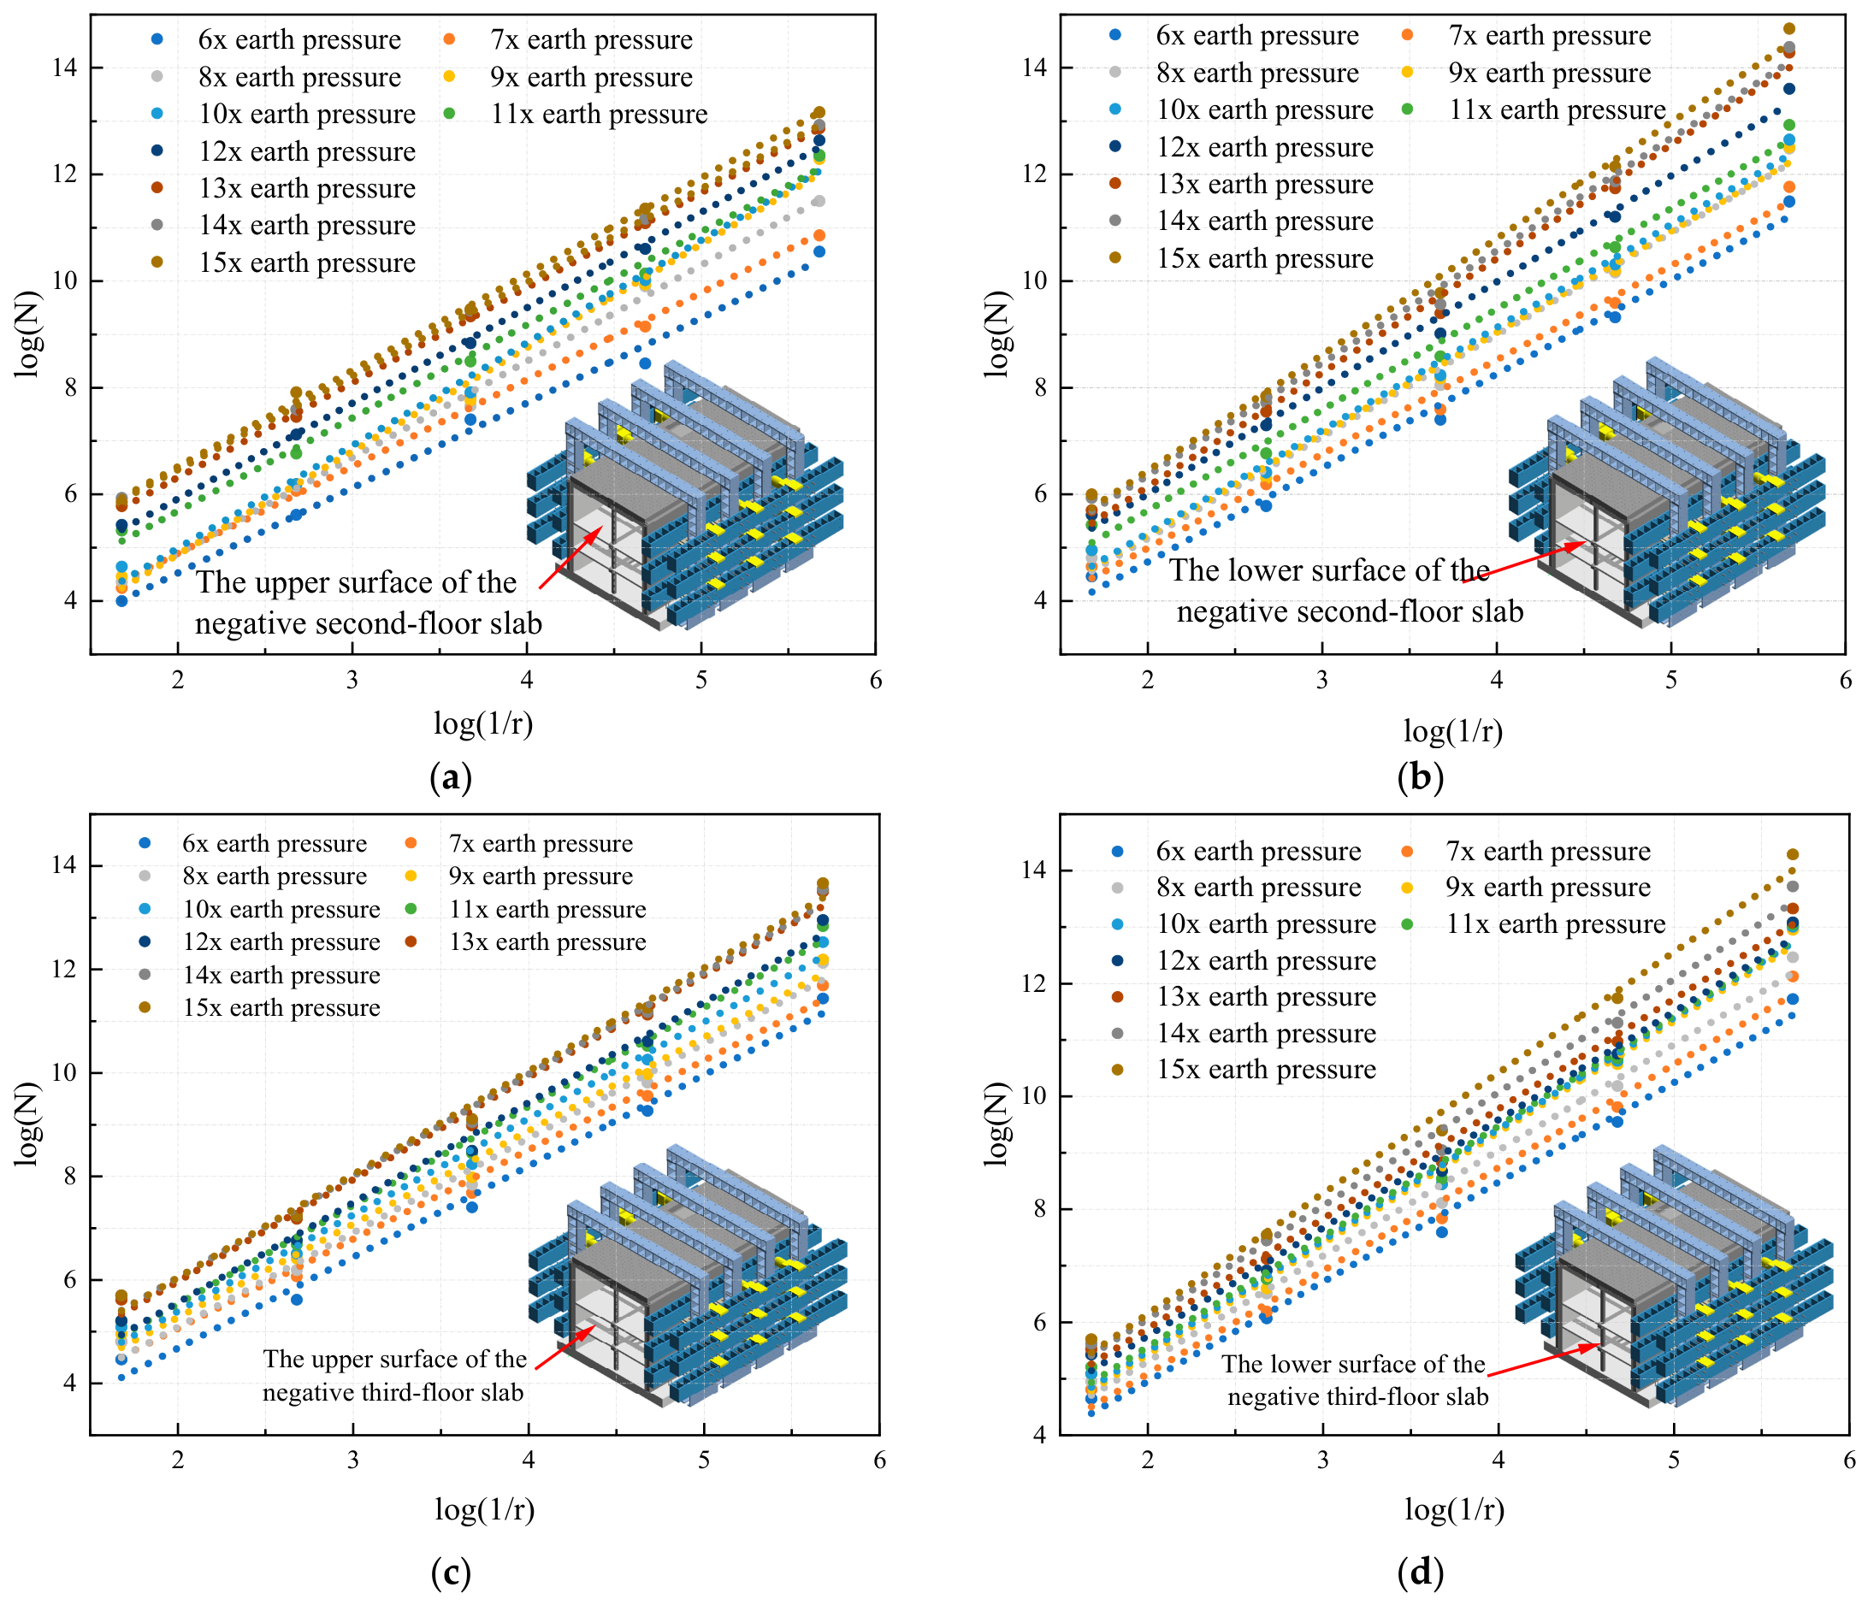
Using the box-counting method, the overall logN-log(1/r) curves for the upper and lower surfaces of the negative second- and third-floor slabs were calculated, as shown in Figure 12. From Figure 12, it can be observed that under different earth pressures, logN and log(1/r) exhibit a linear relationship. This indicates that within a certain scale range, the overall crack distribution on the surface of the opening slabs has self-similarity and satisfies the statistical fractal characteristics. Therefore, using fractal theory to describe the overall crack evolution characteristics of the surface of the opening slabs is both reasonable and feasible.

4.1.3. Fractal Characteristics of Cracks in Slabs with Openings Under Failure Loading

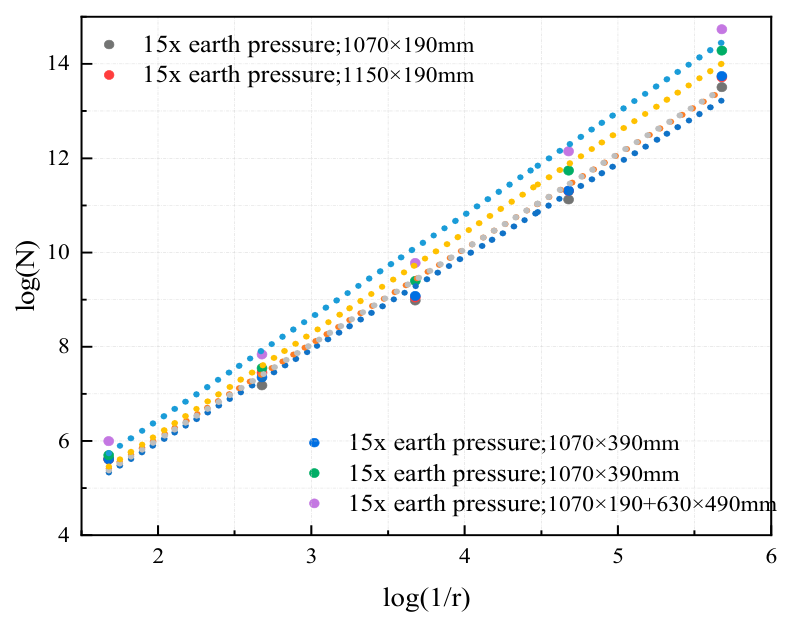
Figure 13 and Figure 14 show the logN-log(1/r) relationships for each opening region and the overall slab cracks under failure loading conditions, respectively. From the figures, it can be observed that in the failure state, the logN-log(1/r) curves for the upper and lower surfaces of the slabs at each level and the opening regions of different sizes exhibit a significant linear relationship. This indicates that under failure loading, the crack distributions on the slab surfaces and within the opening regions all possess self-similarity.

4.2. Fractal Dimension of Cracks in Slabs with Openings Under Failure Loading

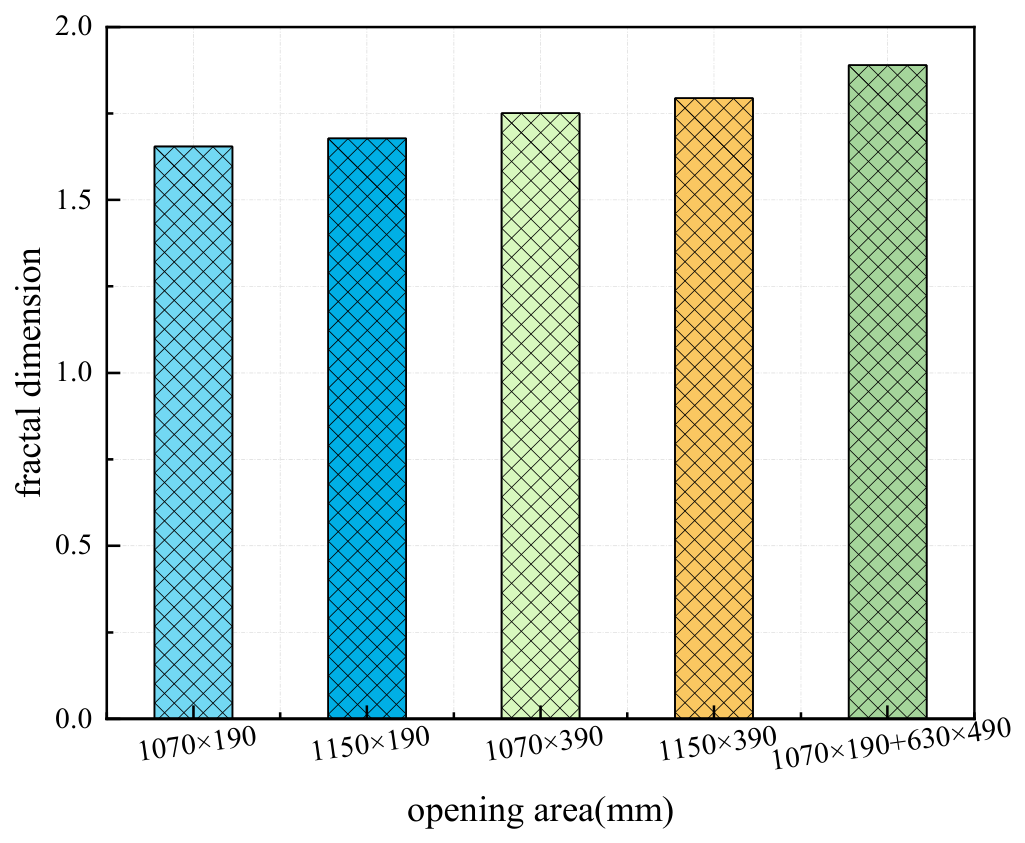
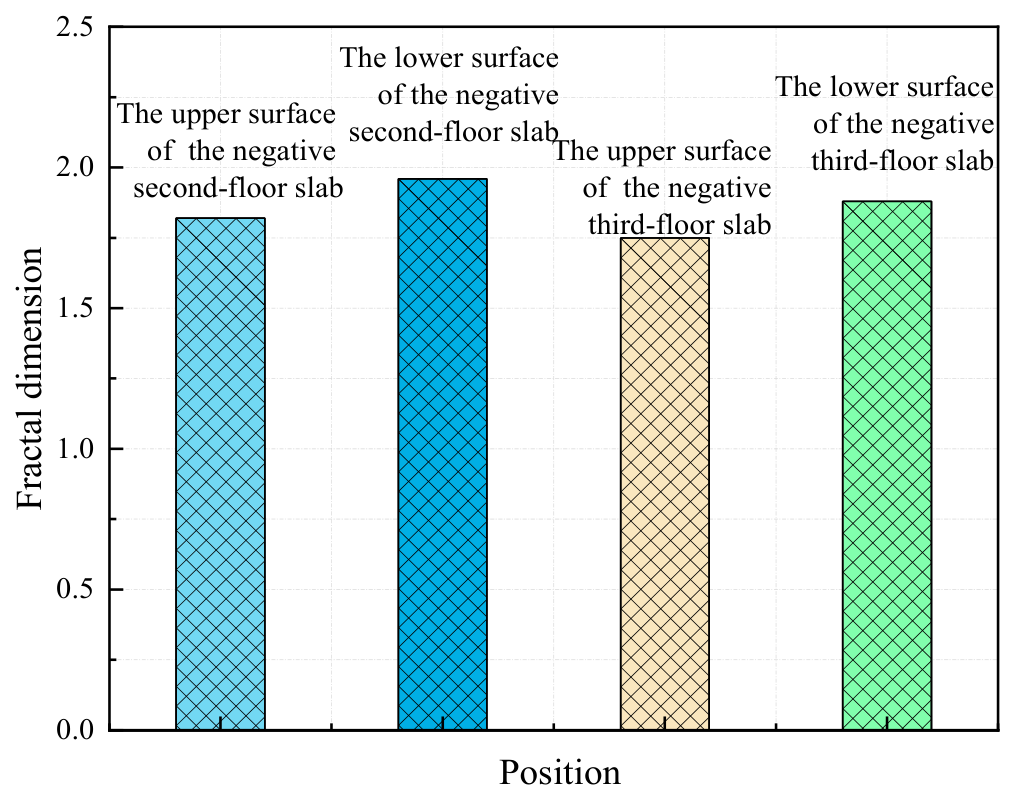
Figure 15 and Figure 16 show the fractal dimensions of the opening regions and the overall slabs under failure loading conditions, respectively. As shown in Figure 15, the fractal dimension increases with the area of the opening region. This is because larger opening areas lead to greater reductions in the sectional stiffness of the opening region [32], resulting in a higher energy release rate during structural failure. Additionally, more energy is utilized for crack generation and propagation, which increases the fractal dimension in regions with larger openings. Moreover, as the opening area increases, the remaining effective load-bearing area of the slab decreases, leading to denser cracks around the opening. The interactions between cracks intensify, and the overall crack network becomes more complex, contributing to an increase in the fractal dimension.
Table 2 presents the dimensions and opening ratios of the slabs. Combined with Figure 16, it can be observed that under failure loading conditions, the fractal dimension increases with the slab’s opening ratio. This is because a higher opening ratio leads to uneven stress distribution in the remaining structure of the slab. Crack propagation becomes constrained by the shape of the remaining structure, resulting in more irregular crack extension paths. Additionally, as the opening ratio increases, the overall stiffness of the slab decreases, reducing its load-bearing capacity. The failure behavior transitions from overall failure to localized failure, which is consistent with the experimental observations.

4.3. Fractal Dimension of Cracks in the Opening Region Under Graded Earth Pressure

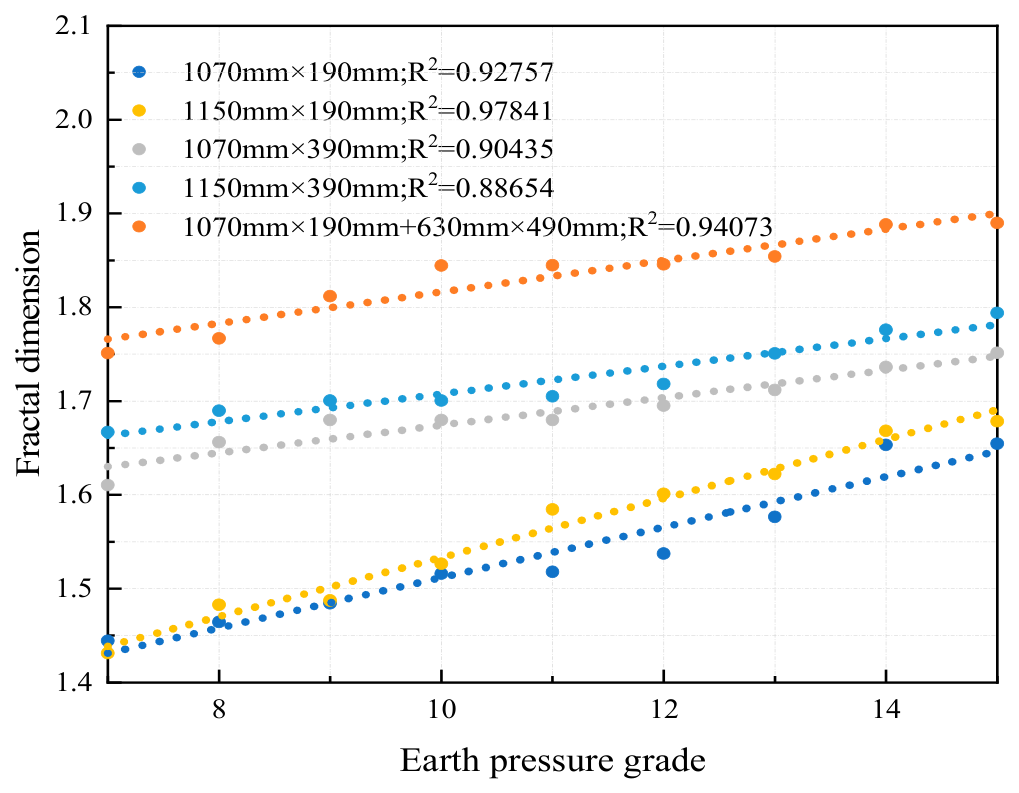
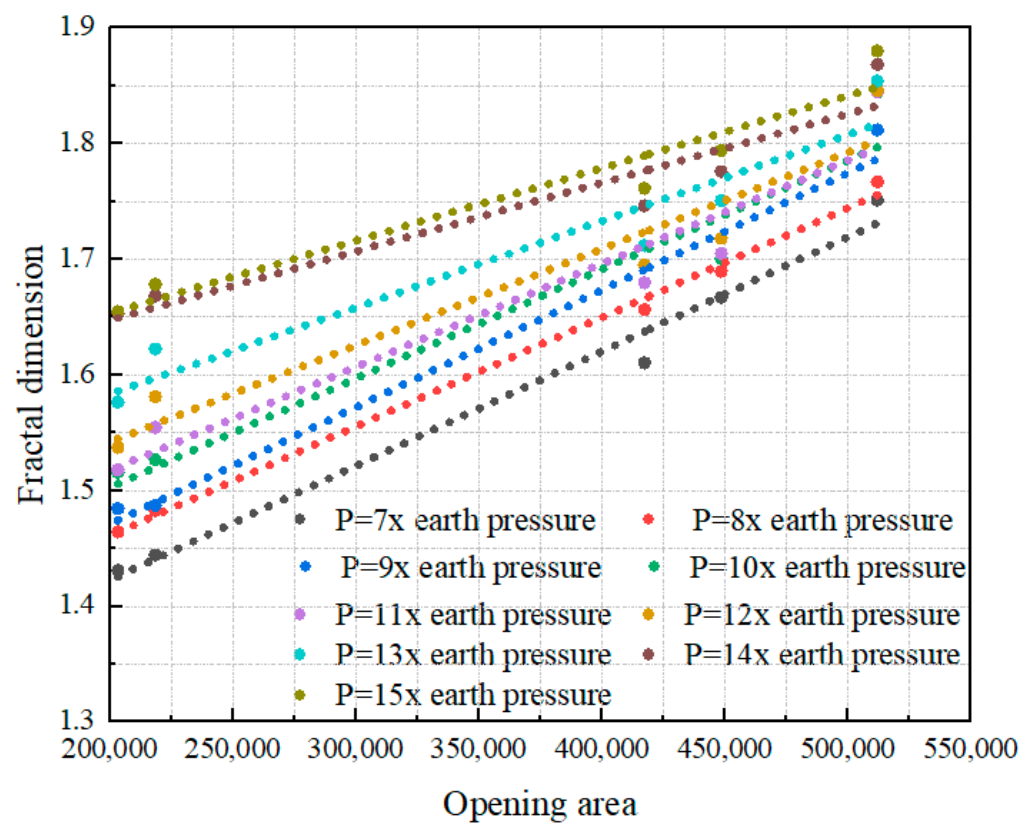
The concrete surface cracks in the opening region of the slab exhibit fractal characteristics within the calibrated range. A fitting analysis was performed on the fractal dimension of surface cracks in different opening sizes under graded earth pressure, as shown in Figure 17. From Figure 17, it can be observed that the fractal dimension of cracks differs among regions with different opening areas under varying earth pressure levels. For regions with the same opening area, the fractal dimension increases with the rise in earth pressure level, indicating that crack development becomes more irregular. This can be attributed to the elongation of existing cracks near the slab opening and the formation of new cracks as earth pressure increases, leading to more irregular crack paths and shapes, thereby increasing the fractal dimension. A linear relationship between the fractal dimension of the opening region and the earth pressure level is observed, with a general expression given by Equation (6). Additionally, it is evident from the figure that larger opening areas result in more complex crack development and higher fractal dimensions. This can be explained by the reduction in slab stiffness caused by openings. Under the same earth pressure, regions with larger openings experience greater stiffness reduction, leading to faster crack initiation and propagation, and consequently, larger fractal dimensions. During the graded earth pressure loading process, the change in fractal dimensions of cracks in the opening region ranges from 1.45 to 1.88, from the initial appearance of cracks to their eventual failure.
y = a x + b
Based on the crack distribution near the opening, it can be concluded that the larger the fractal dimension, the greater the area occupied by cracks in the slab and the more complex the crack patterns. As the lateral earth pressure on the slab increases, the fractal dimension grows, indicating faster crack development and greater structural damage. Using the fractal dimension to represent the extent of crack development provides a more intuitive depiction.
Finite-element analysis conducted for the same opening geometry confirmed pronounced stress concentration at the opening corners and adjacent edges [36], consistent with the experimentally observed crack-initiation regions. The openings therefore cause stiffness discontinuity and stress redistribution, explaining why cracking is concentrated around the opening areas.
The physical meaning of the fractal-dimension increase is associated with the morphological transition of the crack system. Relatively isolated cracks near opening corners correspond to lower fractal dimensions, whereas crack branching, interaction, and penetration increase the spatial complexity and therefore the fractal dimension. The measured range of 1.45–1.88 represents this progressive transition for the present specimens; it is not a universal damage threshold. The critical damage state was identified jointly from fractal-dimension growth, crack penetration, accelerated stiffness degradation, concrete spalling, and local failure.
Figure 18 illustrates the relationship between the opening area and the fractal dimension under a specific level of earth pressure. The figure shows that for all levels of earth pressure, the fractal dimension increases linearly with the increase in the opening area. This can be attributed to the redistribution of structural stress over a larger range as the opening area increases under lateral earth pressure. This redistribution intensifies uneven structural deformation, enhancing the randomness of crack initiation and propagation, thereby leading to an increase in the fractal dimension in regions with larger opening areas.

4.4. Fractal Dimensions of the Opening Region on the Upper and Lower Surfaces of the Slab Under Graded Earth Pressure

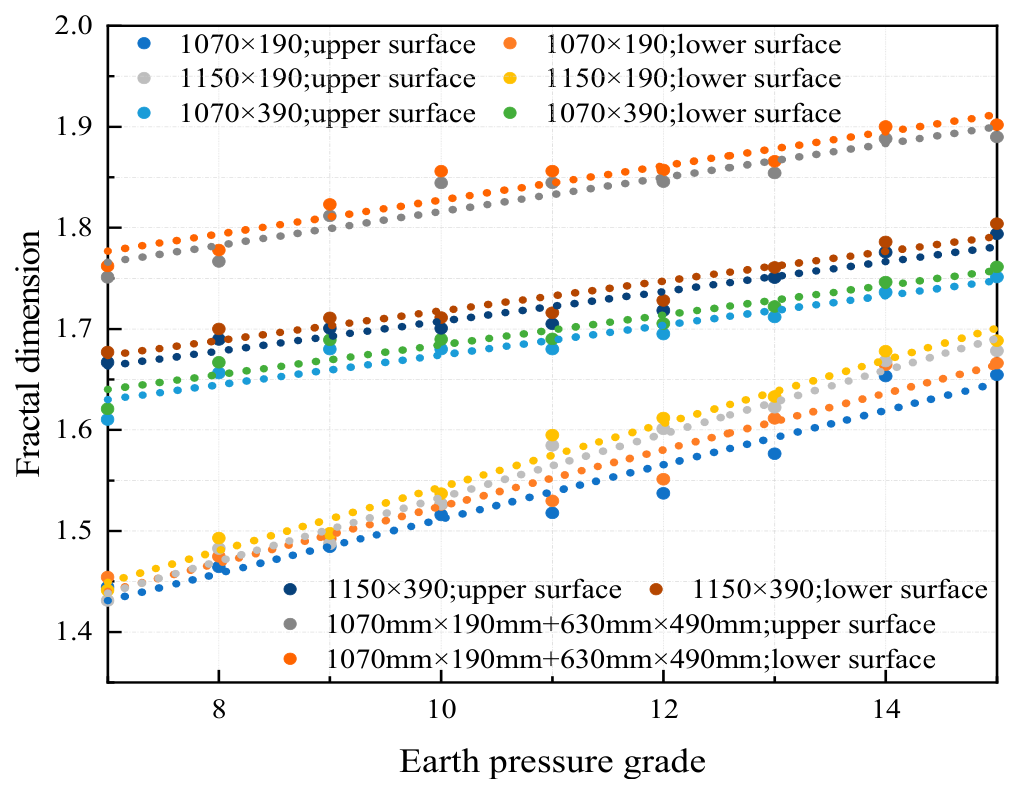
Figure 19 presents the fractal dimension curves for the upper and lower surfaces of the slab in the opening region under graded earth pressure. The figure shows that the fractal dimensions of the upper surface are consistently smaller than those of the lower surface. This can be explained by the bending deformation of the slab under earth pressure [44], which results in different stresses and deformations on the upper and lower surfaces. During bending, the upper surface is compressed, generating compressive stress, while the lower surface is stretched, generating tensile stress. Compared to the neutral axis, the upper surface experiences compression and is closer to the neutral axis, resulting in smaller deformations. In contrast, the lower surface undergoes tensile stress, is farther from the neutral axis, and experiences larger deformations. Due to the low tensile strength of concrete, cracks are more likely to form on the lower surface. Once cracks appear, they tend to propagate through the slab’s thickness. Under graded earth pressure, this ultimately leads to localized failure of the slab, explaining why the fractal dimensions of the upper surface are smaller than those of the lower surface.

4.5. The Relationship Between Fractal Dimension and Slab Deflection

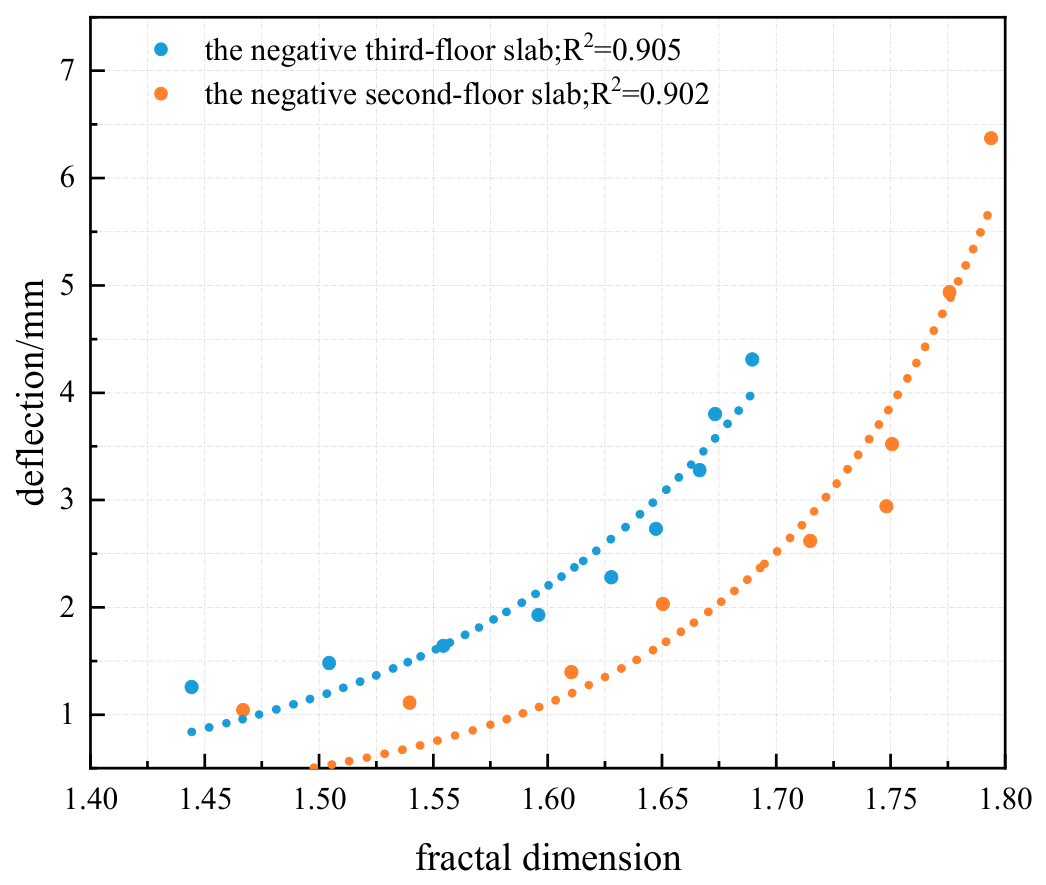
Under graded earth pressure, the deflection of the slab is a direct reflection of the evolution of its damage. Figure 20 illustrates the relationship between the fractal dimension of surface cracks on the opening slab and the mid-span deflection. The figure shows that, during the initial loading stage, the slab remains in an elastic state, with slow development of crack length and width. The crack patterns are simple, resulting in smaller fractal dimensions. As the load increases, the slab transitions from an elastic to a failure state, leading to more significant crack propagation, complex crack patterns, and rapid increases in both the fractal dimension and slab deflection. The fractal dimension of the opening slab increases exponentially with the mid-span deflection of the slab [45]. The fitted relationship between the fractal dimension and slab deflection is expressed in Equation (7).
δ = a e ( b D f 2 + c D f )
In the equation, δ represents the slab deflection, and Df denotes the fractal dimension. a, b, and c are fitting coefficients, which are related to the opening area of the slab. The fitting coefficients for the negative second- and third-floor slabs are listed in Table 3.
The exponential relationships were derived from the graded-loading observations of the present model and were not validated using an independent dataset. Their reliability was assessed through goodness-of-fit and consistency with the observed crack evolution, deflection growth, and stiffness degradation. Because independent repeated specimens were unavailable, confidence intervals and specimen-to-specimen standard deviations could not be determined reliably. The equations should therefore be interpreted as experiment-specific correlations rather than universal predictive models.

4.6. Fractal Dimension and Static Stiffness Theory

The physical meaning of static stiffness refers to a structure’s ability to resist deformation under external forces. For slabs, static stiffness primarily indicates their capacity to resist deformation under applied loads. Static stiffness can be determined from the measured load–displacement curves under different earth pressures. Additionally, the degradation rate of the slab’s static stiffness under various loads can be calculated using the crack fractal dimension, thereby allowing the slab’s damage degree to be directly represented through the fractal dimension [12,46].
The static stiffness of the slab is defined as the force required per unit displacement, as expressed in Equation (8):
k = P δ
where P represents the horizontal earth pressure.
Combining Equation (7), the empirical equation between static stiffness and fractal dimension is expressed as Equation (9):
k = P δ = P a e ( b D f 2 + c D f )
The damage index quantifies the static-stiffness degradation of the slab under monotonic loading, with the undamaged initial stiffness K0 taken as the reference and the current stiffness Kd representing the damaged state. This stiffness-based index was selected because the present experiment focuses on monotonic static loading. Park–Ang, Miner, and energy-based damage indices are principally intended for cyclic, fatigue, or energy-dissipation damage and were therefore not directly compared. The calculation method is shown in Equation (10):
D i = 1 K s d K s 0 = 1 P a e ( b D f 2 + c D f ) K s 0
In the equation, K0 represents the initial static stiffness of the opening slab, and Kd represents the current stiffness of the opening slab.
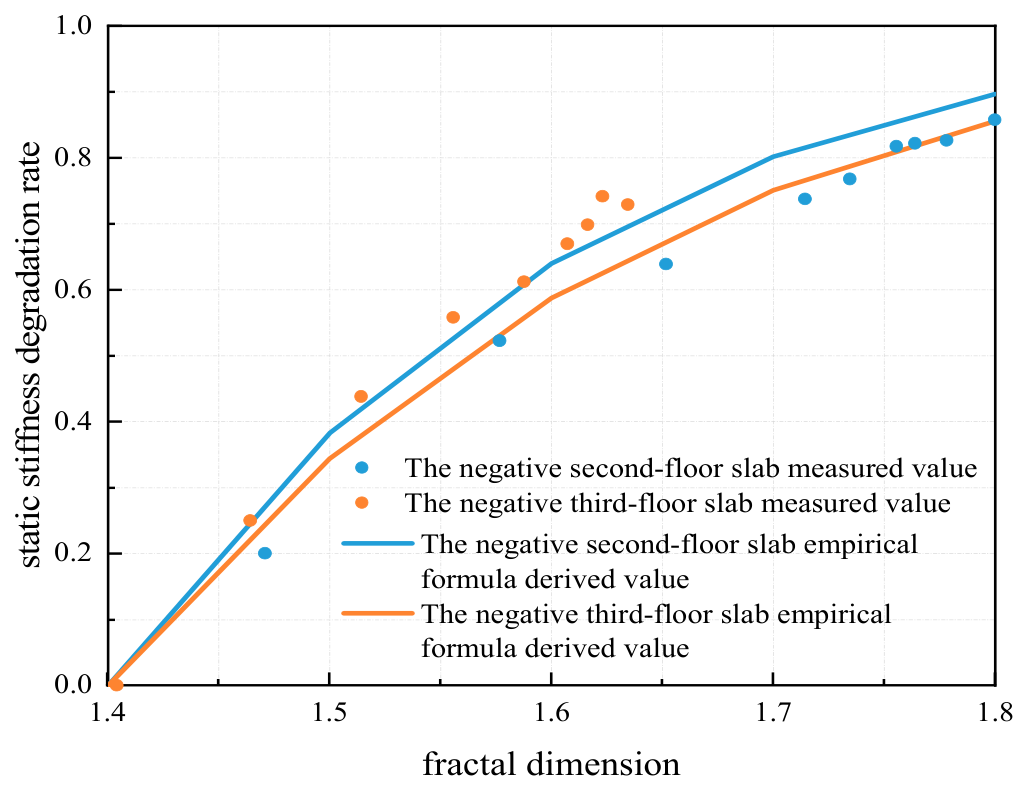
Figure 21 shows the relationship between the fractal dimension and stiffness degradation rate obtained from measured data and the empirical formula. As seen in the figure, the stiffness degradation curve of the opening slab calculated using Equation (10) is generally consistent with the variation pattern of the measured scatter data. This indicates that using the fractal dimension to assess the damage level of the opening slab is reasonable. The research results provide a new method for the damage assessment of opening slabs.
Analysis of the relationship between fractal dimension and stiffness degradation rate in Figure 21 shows a clear nonlinear behavior. Stage I: In the initial loading phase, stress concentration within the slab structure leads to the formation and expansion of cracks, significantly degrading the slab’s static stiffness. At this stage, there are relatively few cracks, the fractal dimension is small, and the increase in fractal dimension is slow. Stage II: As damage accumulates in the slab, crack propagation becomes more complex, and the fractal dimension increases at a faster rate. Meanwhile, the rate of stiffness degradation slows down. Under loading, both the slab’s static stiffness and fractal dimension increase simultaneously. Stage III: The slab gradually enters the plastic failure stage, where it bears part of the load through plastic deformation. At this point, internal structural damage is close to saturation, and the static stiffness degradation stabilizes further. The crack distribution increases, and their morphology becomes more complex, leading to a rapid increase in the fractal dimension.

4.7. Applicability and Limitations

The proposed relationships were established using a 1:10 model, one set of opening configurations, and monotonic static earth-pressure loading. Repeated traffic loads, construction vibration, and seismic excitation may alter crack opening-closure behavior, branching, and energy dissipation, so the fractal dimension–damage relationship cannot be assumed to remain unchanged under cyclic or dynamic conditions. Changes in opening size, shape, and location also modify stiffness distribution, stress concentration, and crack paths, and consequently require recalibration. Scale effects may influence absolute crack width, spacing, and local fracture behavior. Accordingly, broader application requires independent model tests, numerical analyses, full-scale tests, and field-monitoring data.

5. Conclusions

This study develops a quantitative framework that links observable crack morphology with deflection, static-stiffness degradation, and structural damage in subway-station slabs with openings. Beyond describing the experimental response, the results indicate that fractal dimension can support rapid, image-based screening of progressive damage. The main conclusions are as follows:
(1)
The crack and damage evolution was divided into four stages using combined morphological and mechanical criteria: initial damage accumulation, damage manifestation, damage intensification, and damage saturation. The transitions corresponded to the first visible cracking, accelerated crack interaction and stiffness degradation, and finally crack penetration, spalling, and local failure.
(2)
Crack distributions in both the opening regions and the overall slab surfaces exhibited statistical self-similarity within the calibrated scale range. The increase in fractal dimension reflected the transition from isolated cracks to branched and interconnected crack networks.
(3)
Experiment-based correlations were established among fractal dimension, mid-span deflection, static stiffness, and the stiffness-based damage index. The observed fractal-dimension range of 1.45–1.88 characterizes the tested specimens and loading conditions and should not be regarded as a universal threshold.
(4)
In engineering inspection, periodic acquisition of crack images around slab openings, followed by standardized box-counting analysis, can provide a rapid screening indicator. An increase in fractal dimension together with accelerated deflection or stiffness loss may be used to trigger detailed inspection, intensified monitoring, or strengthening. Project-specific calibration is required before field application.
The current findings are limited to monotonic static loading and the tested opening configurations. Validation under cyclic traffic loading, seismic excitation, alternative opening geometries, and full-scale field conditions is necessary before general application.

Author Contributions

T.M.: Conceptualization, Funding acquisition, Methodology, Supervision, Writing—review & editing. P.H.: Validation, Visualization. Y.Z.: Resources. N.Z.: Resources. Y.L.: Formal analysis, Visualization, Resources. D.Z.: Data curation, Formal analysis, Visualization, Investigation. All authors have read and agreed to the published version of the manuscript.

Funding

The research described in this paper was financially supported by the National Natural Science Foundation of China (Grant No. 52178302) and the Key R & D Projects in Shaanxi Province (No. 2020SF-373).

Data Availability Statement

The original contributions presented in the study are included in the article; further inquiries can be directed to the corresponding author.

Acknowledgments

The original contributions presented in the study are included in the article; further inquiries can be directed to the corresponding author.

Conflicts of Interest

Teng Ma, Hou Peng, and Yan Zhao were employed by China Railway Seventh Bureau Group Co., Ltd., and Nengwen Zhu and Yuhui Li were employed by Guangzhou Metro Design & Research Institute Co., Ltd. The remaining author declares that the research was conducted in the absence of any commercial or financial relationships that could be construed as a potential conflict of interest.

References

  1. Zhou, D.; Mei, Y.; Ke, X.; Liu, Z.; Xu, W. Study on the structural behavior and reinforcement design of openings in subway station floor slabs. J. Build. Eng. 2024, 98, 110994. [Google Scholar] [CrossRef] [Scilit]
  2. Chen, Q.; Zhang, T.; Hong, N.; Zhao, Z. Synthetic experimental and numerical investigation on the vertical seismic effect on underground structures. Structures 2022, 48, 1–20. [Google Scholar] [CrossRef] [Scilit]
  3. Tao, L.; Shi, C.; Ding, P.; Li, S.; Wu, S.; Bao, Y. A study on bearing characteristic and failure mechanism of thin-walled structure of a prefabricated subway station. Front. Struct. Civ. Eng. 2022, 16, 359–377. [Google Scholar] [CrossRef] [Scilit]
  4. Ma, C.; Zhao, Y.; Dong, H.; Lu, D.; Du, X. Comparative study on the seismic performance of subway stations using reinforced concrete cast-in-place columns and truncated columns. Soil Dyn. Earthq. Eng. 2023, 169, 107862. [Google Scholar] [CrossRef] [Scilit]
  5. Chen, X.; Xiong, Z.; Zhuge, Y.; Liu, Y. Numerical analysis on the seismic performance of subway station in ground crack area. Tunn. Undergr. Space Technol. 2023, 134, 105012. [Google Scholar] [CrossRef] [Scilit]
  6. Zhang, Z.; Li, Y.; Xu, C.; Du, X.; Dou, P.; Yan, G. Study on seismic failure mechanism of shallow buried underground frame structures based on dynamic centrifuge tests. Soil Dyn. Earthq. Eng. 2021, 150, 106938. [Google Scholar] [CrossRef] [Scilit]
  7. Xiong, E.; Gao, Y.; Cao, T.; Wang, W. Shaking-table tests and numerical simulations study of subway stations in loess region. Structures 2024, 69, 107283. [Google Scholar] [CrossRef] [Scilit]
  8. Xu, S.; Tang, H.; Wang, X.; Wang, D. Assessment of geometric parameters of segmented crack on concrete building facade using deep learning. Structures 2023, 57, 105188. [Google Scholar] [CrossRef] [Scilit]
  9. Chen, W.; Zhang, J. Efficient and lightweight monitoring network for cracks in complex background regions based on adaptive perception. Autom. Constr. 2024, 166, 105614. [Google Scholar] [CrossRef] [Scilit]
  10. Su, Z.; Zhou, F.; Liang, J.; Liu, A.; Wang, J.; Liang, J.; Chen, B.; Yang, J. Fractal theory based identification model for surface crack of building structures. Eng. Struct. 2024, 305, 117708. [Google Scholar] [CrossRef] [Scilit]
  11. Wang, Y.; Tang, L.; Wen, J.; Zhan, Q. Recognition of concrete microcrack images under fluorescent excitation based on attention mechanism deep recurrent neural networks. Case Stud. Constr. Mater. 2024, 20, e03160. [Google Scholar] [CrossRef] [Scilit]
  12. He, H.; Tian, S.; Zhang, Y. Refined fatigue damage assessment of RC beam based on fractal characteristics of cracks. Structures 2022, 46, 1595–1603. [Google Scholar] [CrossRef] [Scilit]
  13. Li, W.; Wu, M.; Shi, T.; Yang, P.; Pan, Z.; Liu, W.; Liu, J.; Yang, X. Experimental Investigation of the Relationship between Surface Crack of Concrete Cover and Corrosion Degree of Steel Bar Using Fractal Theory. Fractal Fract. 2022, 6, 325. [Google Scholar] [CrossRef] [Scilit]
  14. Ding, C.; Xu, T.; Chen, Q.; Su, C.; Zhao, P. Study on the Relationship between Fractal Characteristics and Mechanical Properties of Tensile Fracture of Reinforced Concrete Structures. KSCE J. Civ. Eng. 2022, 26, 2225–2233. [Google Scholar] [CrossRef] [Scilit]
  15. Macek, W.; Rozumek, D.; Faszynka, S.; Branco, R.; Zhu, S.; Masoudi Nejad, R. Fractographic-fractal dimension correlation with crack initiation and fatigue life for notched aluminium alloys under bending load. Eng. Fail. Anal. 2023, 149, 107285. [Google Scholar] [CrossRef] [Scilit]
  16. Savenkov, G.G.; Barakhtin, B.K. Relation of the fractal dimension of the fracture surface with a set of standard tension characteristics of the material. J. Appl. Mech. Tech. Phys. 2011, 52, 997–1003. [Google Scholar] [CrossRef] [Scilit]
  17. Ma, G.; Wu, C. Crack type analysis and damage evaluation of BFRP-repaired pre-damaged concrete cylinders using acoustic emission technique. Constr. Build. Mater. 2023, 362, 129674. [Google Scholar] [CrossRef] [Scilit]
  18. Pan, L.; Carrillo, J.; Cao, M.; Sha, G. Multifractal-spectrum shape parameters for characterizing distribution and evolution of multiple cracks in concrete structures. Eng. Fract. Mech. 2022, 264, 108329. [Google Scholar] [CrossRef] [Scilit]
  19. Carrillo, J.; Dominguez, D.; Prado, N. Seismic Damage Index Based on Fractal Dimension of Cracking on Thin Reinforced Concrete Walls. ACI Struct. J. 2017, 114, 1649–1658. [Google Scholar] [CrossRef] [Scilit]
  20. Wang, J.; Pu, G.; Yuan, Y.; Zhou, G. Multifractal characteristics of fatigue cracks in the full-scale reinforced concrete hollow-slab beams. Structures 2023, 57, 105149. [Google Scholar] [CrossRef] [Scilit]
  21. Liu, Y.; Dai, K.; Li, D.; Luo, M.; Liu, Y.; Shi, Y.; Xu, J.; Huang, Z. Structural performance assessment of concrete components based on fractal information of cracks. J. Build. Eng. 2021, 43, 103177. [Google Scholar] [CrossRef] [Scilit]
  22. Zhu, D.; Tang, A.; Wan, C.; Zeng, Y.; Wang, Z. Investigation on the flexural toughness evaluation method and surface cracks fractal characteristics of polypropylene fiber reinforced cement-based composites. J. Build. Eng. 2021, 43, 103045. [Google Scholar] [CrossRef] [Scilit]
  23. Azhari, S.; Hamidia, M. Data-driven crack image-based seismic failure mode identification for damaged RC columns. Eng. Fail. Anal. 2024, 160, 108160. [Google Scholar] [CrossRef] [Scilit]
  24. Gu, S.; Zhao, J.; Li, J.; Peng, F.; Kong, C.; Yang, L. Application of Fractal Theory to the Analysis of Failure Characteristics of Low-Velocity-Impact Concrete Slabs. Buildings 2023, 13, 2190. [Google Scholar] [CrossRef] [Scilit]
  25. Jin, Z.; Xie, F.; Yang, T.; Han, X.; Chen, X.; Zhang, Y. Fractal dimension analysis of concrete specimens under different strain rates. J. Build. Eng. 2023, 76, 107044. [Google Scholar] [CrossRef] [Scilit]
  26. Li, Z.; Liu, X.; Sun, G. Pore structure of fiber-reinforced geopolymer recycled concrete: Effects on mechanical properties and drying shrinkage. J. Build. Eng. 2025, 111, 112990. [Google Scholar] [CrossRef] [Scilit]
  27. Lu, C.; Zhang, X.; Chen, W.; Chen, X. Quantitative Analysis of Crack Propagation Behavior in Recycled Concrete Subjected to Axial Compression Using Digital Image Correlation (DIC) Technology and Fractal Theory. Fractal Fract. 2024, 8, 686. [Google Scholar] [CrossRef] [Scilit]
  28. Pan, T.; Xu, X.; Zheng, Y.; Wu, L.; Yang, C.; Aydin, B.B.; Li, Y.; Zhou, Y. Acoustic emission-driven fractal analysis for damage warning in FRP-strengthened corroded RC beams. Eng. Fract. Mech. 2025, 328, 111563. [Google Scholar] [CrossRef] [Scilit]
  29. Zhao, W.; Li, B.; Song, H.; Shi, K.; Zhang, Y. Bending performance and fractal analysis of ECC-concrete composite beams: Digital image technique. Structures 2026, 85, 111263. [Google Scholar] [CrossRef] [Scilit]
  30. Jiang, Z.; Wang, B.; Liu, H.; Zhang, J.; Zhou, J.; He, H.; Wei, H.; Zou, J. Experimental Study on Crack Evolution Law of a Full-Scale Prestressed Concrete Beam Based on Fractal Theory. Materials 2026, 19, 3129. [Google Scholar] [CrossRef] [Scilit]
  31. Lv, B.; Liu, H.; Zheng, L.; Zuo, Y.; Xiao, S.; Wang, Y.; Zhang, T.; Yang, Y. Study on the mesoscopic failure and fractal characteristics of concrete with holes and cracks. Sci. Rep. 2025, 16, 1219. [Google Scholar] [CrossRef] [Scilit]
  32. Xie, M.; Wang, Z.; Yin, L.; Xu, F.; Wu, X.; Xu, M. Study on Fractal Damage of Concrete Cracks Based on U-Net. Buildings 2024, 14, 3262. [Google Scholar] [CrossRef] [Scilit]
  33. Zhong, Q.; Wang, X.; Chen, Z.; Cui, B.; Han, X. Damage Assessment of RC Beam-Column Joints via Digital Image Correlation and Fractal Dimension Analysis. Buildings 2026, 16, 2583. [Google Scholar] [CrossRef] [Scilit]
  34. Son, B.; Li, G.; Luo, Z.; Sun, Y. Quantitative Seismic Damage Assessment of Resilient Concrete Columns Using Drift Ratio-Based Fractal Dimension. Materials 2024, 17, 5850. [Google Scholar] [CrossRef] [Scilit]
  35. Li, Y.; Yao, A.; Li, H.; Gong, Y.; Tian, T. Calculation method of multi-stage earth pressure for foundation excavation considering excavation process. Acta Geotech. 2023, 18, 6123–6141. [Google Scholar] [CrossRef] [Scilit]
  36. Zhou, D.; Mei, Y.; Ke, X.; Liu, Z.; Xu, W. Experimental study on large-scale subway station model considering adjustable water and soil pressure. Undergr. Space 2025, 25, 262–280. [Google Scholar] [CrossRef] [Scilit]
  37. Mandelbrot, B.B.; Passoja, D.E.; Paullay, A.J. Fractal character of fracture surfaces of metals. Nature 1984, 308, 721–722. [Google Scholar] [CrossRef] [Scilit]
  38. Wang, J.; Huang, P.; Yuan, Y.; Zhou, G.; Han, W. Multifractal analytical method and experimental study on crack evolution of dismantled RC hollow-slab beam. Structures 2022, 40, 524–535. [Google Scholar] [CrossRef] [Scilit]
  39. Teng, S.; Liu, A.; Situ, Z.; Chen, B.; Wu, Z.; Zhang, Y.; Wang, J. Plug-and-play method for segmenting concrete bridge cracks using the segment anything model with a fractal dimension matrix prompt. Autom. Constr. 2024, 170, 105906. [Google Scholar] [CrossRef] [Scilit]
  40. Shen, J.; Xu, Q.; Liu, M. Fractal Analysis of Defects in Concrete under Elevated Temperatures. ACI Mater. J. 2022, 119, 19–33. [Google Scholar] [CrossRef] [Scilit]
  41. Ramšak, M. Fractal Geometry as an Effective Heat Sink. Stroj. Vestn.-J. Mech. Eng. 2022, 68, 517–528. [Google Scholar] [CrossRef] [Scilit]
  42. Zhang, L.; Dang, F.; Ding, W.; Zhu, L. Comparative study on damage process of concrete subjected to uniaxial tensile and compression loads based on CT test and improved differential box counting method. Constr. Build. Mater. 2021, 285, 122693. [Google Scholar] [CrossRef] [Scilit]
  43. Ding, R.; Zhang, Y.; Zhao, Y.; Deng, X.; Zhang, Z. Experimental investigation on fractal mechanism and shear failure characteristics of cement mortar at different curing ages. J. Build. Eng. 2024, 93, 109851. [Google Scholar] [CrossRef] [Scilit]
  44. Jin, L.; Du, L.; Zhou, W.; Chen, S.; Zhou, Z.; Zhou, B. Influence of 3D spatial effect of underground structure on the nonlinear seismic response of subway station based on the comparison of 2D and 3D models. Tunn. Undergr. Space Technol. 2023, 139, 105119. [Google Scholar] [CrossRef] [Scilit]
  45. Li, L.; Sun, H.; Zhang, Y.; Li, Z. Dynamic evolution of crack fractal of polypropylene fiber reinforced geopolymer during flexural process. Eng. Fract. Mech. 2024, 300, 109992. [Google Scholar] [CrossRef] [Scilit]
  46. Madani, H.M.; Dolatshahi, K.M. Strength and stiffness estimation of damaged reinforced concrete shear walls using crack patterns. Struct. Control. Health Monit. 2020, 27. [Google Scholar] [CrossRef] [Scilit]
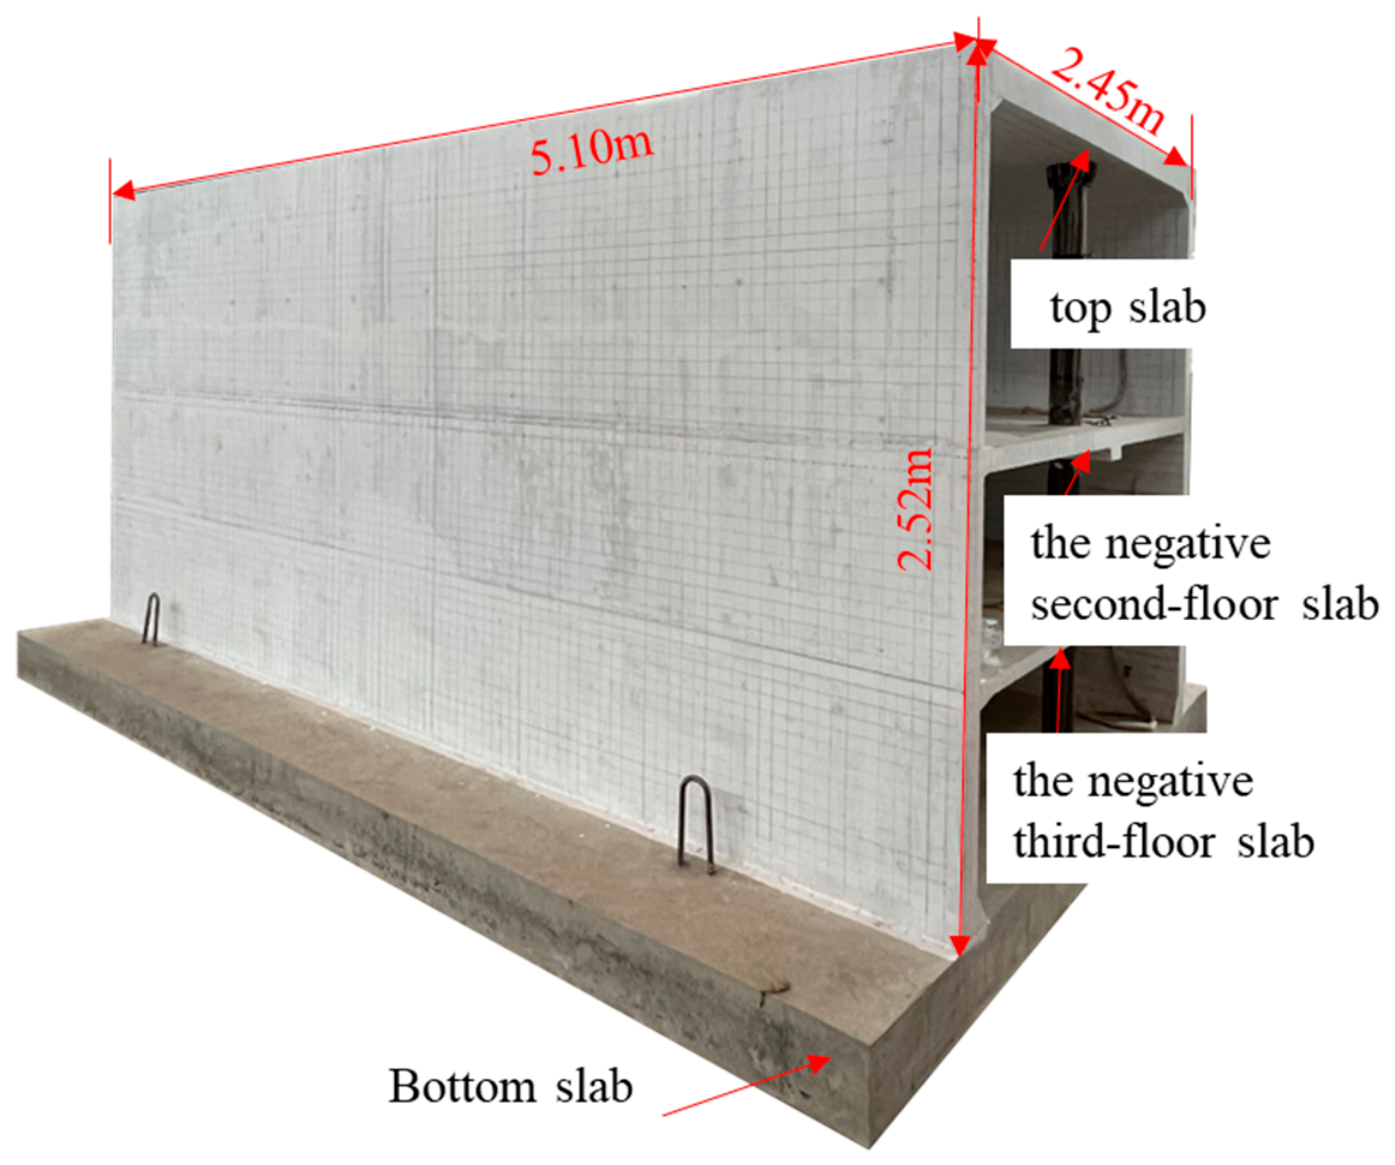
Figure 1. Scaled Model.
Buildings 16 03388 g001
Figure 2. Load Distribution.
Buildings 16 03388 g002
Figure 3. Loading device design and installation.
Buildings 16 03388 g003
Figure 4. Loading regime.
Buildings 16 03388 g004
Figure 5. Load–displacement curve. (a) Displacement of the negative second-floor slab. (b) Displacement of the negative third-floor slab.
Buildings 16 03388 g005
Figure 6. HC-800 concrete defect testing instrument.
Buildings 16 03388 g006
Figure 7. The crack development patterns of the negative second-floor slab. (a) Stage I. (b) Stage II. (c) Stage III. (d) Stage IV.
Buildings 16 03388 g007
Figure 8. The crack development patterns of the negative third-floor slab. (a) Stage I. (b) Stage II. (c) Stage III. (d) Stage IV.
Buildings 16 03388 g008
Figure 9. Division of the Opening Area. (a) Division of the opening area on the negative second-floor slab. (b) Division of the opening area on the negative third-floor slab.
Buildings 16 03388 g009
Figure 10. The calculation process for the fractal dimension.
Buildings 16 03388 g010
Figure 11. logN-log(1/r) curve of the opening region under graded earth pressure. (a) 1070 × 190. (b) 1150 × 190. (c) 1070 × 390. (d) 1150 × 390. (e) 1070 × 190 + 630 × 490.
Buildings 16 03388 g011aBuildings 16 03388 g011b
Figure 12. The overall logN-log(1/r) curves for the upper and lower surfaces of the negative second- and third-floor slabs. (a) The upper surface of the negative second-floor slab. (b) The lower surface of the negative second-floor slab. (c) The upper surface of the negative third-floor slab. (d) The lower surface of the negative third-floor slab.
Buildings 16 03388 g012
Figure 13. The logN-log(1/r) relationships for each opening region crack under failure loading.
Buildings 16 03388 g013
Figure 14. The logN-log(1/r) relationships for the overall slab cracks under failure loading.
Buildings 16 03388 g014
Figure 15. The fractal dimensions of the opening regions under failure loading conditions.
Buildings 16 03388 g015
Figure 16. The fractal dimensions of the overall slabs under failure loading.
Buildings 16 03388 g016
Figure 17. The fractal dimension of surface cracks in different opening sizes under graded earth pressure.
Buildings 16 03388 g017
Figure 18. The relationship between the opening area and the fractal dimension under a specific level of earth pressure.
Buildings 16 03388 g018
Figure 19. The fractal dimension curves for the upper and lower surfaces of the slab in the opening region under graded earth pressure.
Buildings 16 03388 g019
Figure 20. The relationship between the fractal dimension of surface cracks on the opening slab and the mid-span deflection.
Buildings 16 03388 g020
Figure 21. Relationship between fractal dimension and static stiffness degradation rate.
Buildings 16 03388 g021
Table 1. Definitions of similarity parameters used in the scaled-model test.
SymbolPhysical MeaningDefinitionValue Used
CLGeometric similarity ratioLm/Lp0.10 (1:10)
CσStress similarity ratioσm/σp1.00
CAArea similarity ratioAm/Ap = CL20.01 (1:100)
CFResultant-force similarity ratioFm/Fp = CσCL20.01 (1:100)
CwLine-load similarity ratiowm/wp = CF/CL0.10 (1:10)
Note: Subscripts m and p denote the model and prototype, respectively; w denotes line.
Table 2. Dimensions and opening ratio of slab openings.
Opening PositionStair Opening ① (mm/mm2)Stair Opening ② (mm/mm2)Stair Opening ③ (mm/mm2)Stair Opening ④ (mm/mm2)Earth-Moving
Opening (mm/mm2)
Opening Ratio%
The negative second-floor slab1150 × 190/218,5001150 × 190/218,5001150 × 390/448,5001150 × 390/448,500630 × 490/308,70014.32
The negative third-floor slab1070 × 190/203,3001070 × 190/203,3001070 × 190/203,3001070 × 390/417,300630 × 490/308,70011.64
Note: ①, ②, ③, and ④ denote the four stair openings at the corresponding positions shown in Figure 8.
Table 3. Fitting coefficient between the fractal dimension of slabs with openings and slab mid-span deflection.
Fitting Coefficientabc
The negative second-floor slab0.00472.8323−1.1203
The negative third-floor slab0.01332.0612−0.1063
Disclaimer/Publisher’s Note: The statements, opinions and data contained in all publications are solely those of the individual author(s) and contributor(s) and not of MDPI and/or the editor(s). MDPI and/or the editor(s) disclaim responsibility for any injury to people or property resulting from any ideas, methods, instructions or products referred to in the content.