1. Introduction
Cooking-generated fume particles have emerged as a significant source of both indoor and outdoor air pollution in China [
1,
2]. These particles have been associated with immunotoxicity, genotoxicity, pulmonary toxicity, and potential carcinogenic effects in humans [
3,
4]. Cooking fume particles include ultrafine particles (UFPs; aerodynamic particle size < 0.1 μm) [
5,
6,
7,
8,
9], fine particulate matter (PM
2.5; aerodynamic particle size < 2.5 μm) [
8,
9,
10,
11,
12,
13], and respirable particulate matter (PM
10; aerodynamic particle size < 10 μm) [
14,
15]. Accurate measurement of their concentrations is thus critical for assessing impacts on the environment and human health and provides the basis for the development of effective pollution control strategies and relevant emission standards.
Several methods are currently used for evaluating cooking fume particulate matter in different particle size ranges because of their diverse effects on indoor air quality, outdoor air quality and human health. In scientific validation, industrial quality control, and environmental regulation, mainstream monitoring methods include optical particle counters (OPC) [
16], photometers such as DustTrak aerosol monitors [
17,
18], infrared spectrophotometry [
19], and the manual gravimetric method based on filter weighing [
20]. Optical particle counters measure particle number and size distribution in real time by detecting light scattered from particles traversing a laser beam. Photometers estimate particulate mass concentration and size distribution using light scattering principles, usually after applying instrument-specific calibration, whereas infrared spectrophotometry determines concentration based on the selective absorption of infrared light by substances. The manual gravimetric method, a traditional and widely recognized benchmark [
21], determines mass concentration by weighing filters before and after sampling.
Currently, systematic biases in optical-based methods have received considerable attention in the field of cooking fume measurement. Chen et al. [
22] conducted hot oil experiments and found that light scattering methods such as DustTrak II may under-estimate mass concentration by 30–50% due to discrepancies between the default particle density assumed by the instrument and the actual density of cooking fumes, necessitating a correction factor. Similarly, Kim et al. [
23] compared the TSI DustTrak DRX 8533 photometer with the gravimetric method and found that light scattering methods overestimated PM
2.5 mass concentration by approximately 40% on average. They further noted that this bias varied with season and chemical composition, including the organic carbon/elemental carbon (OC/EC) ratio, emphasizing the need for aerosol-specific and condition-dependent calibration. Furthermore, Yun et al. [
24], in urban monitoring studies in South Korea, found that measurements from different light-scattering instruments including SidePak AM510 and DustTrak DRX, required correction factors of 0.42 and 0.29, respectively, to align with gravimetric data. These findings indicate that regional aerosol characteristics and instrument-specific responses can strongly influence correction models.
The main limitation of infrared spectrophotometry lies primarily in its limited ability to quantify all particulate components. Fan et al. [
25] reported that this method primarily quantifies organic particulate components such as oil-derived substances and captured only 75.6% of the concentration measured by the manual gravimetric method. Accordingly, a correction factor of 1.32 was required to compensate for components not effectively detected by infrared analysis, including inorganic components, such as metal oxides and salts. Additionally, they reported that the adsorption efficiency of metal cartridges for polar particles (98.7%) was higher than that of glass fiber cartridges (82.3%). Although the manual gravimetric method is considered accurate and is widely used as a reference method, it is labor-intensive and sensitive to environmental factors, including humidity, temperature variation, static electricity and vibration. A survey of 68 monitoring institutions by Chu et al. [
26] revealed that only 6% implemented static elimination measures. Manual weighing can be susceptible to errors from vibration and temperature-humidity fluctuations; for example, a 10% relative humidity (RH) change may cause measurable filter weight gains up to 0.5–1.2 mg, potentially leading to measurement uncertainties of up to 3.6%. In contrast, automated weighing equipment, through precise micro-environmental control, for example 20 ± 0.5 °C and RH 50 ± 1%, can suppress errors to within 0.48%, highlighting the importance of standardized operation in gravimetric measurement.
Although several studies have compared optical aerosol instruments with gravimetric methods for ambient particulate matter measurements, systematic evaluations focusing on cooking fume aerosols remain limited. Cooking fumes are characterized by high organic content, liquid or semi-volatile particle morphology, and distinct optical properties, which may result in measurement biases that differ substantially from those reported for ambient aerosols. Furthermore, previous studies have generally focused on individual instruments or single measurement principles, while comprehensive comparisons among gravimetric, optical particle counting, photometric, and infrared spectrophotometric methods under identical cooking-fume conditions are scarce.
Therefore, establishing a reliable correlation between real-time monitoring methods and the gravimetric benchmark method is crucial. In this study, we systematically compared the performance of an optical particle counter (PALAS Promo 3000), a photometer (DustTrak 8533), and infrared spectrophotometry against the manual gravimetric benchmark method to improve data accuracy in cooking fume measurement. By simulating fume-emission scenarios under typical cooking conditions, we evaluated the measurement performances of these methods and developed a correction approach for improving data quality. The objective of this study was to determine method-specific correction factors and provide a scientific basis for constructing a more precise and efficient monitoring framework, thereby enhancing data reliability for environmental monitoring and health risk assessment.
2. Methodology and Materials
2.1. Cooking Fume Measurement Platform
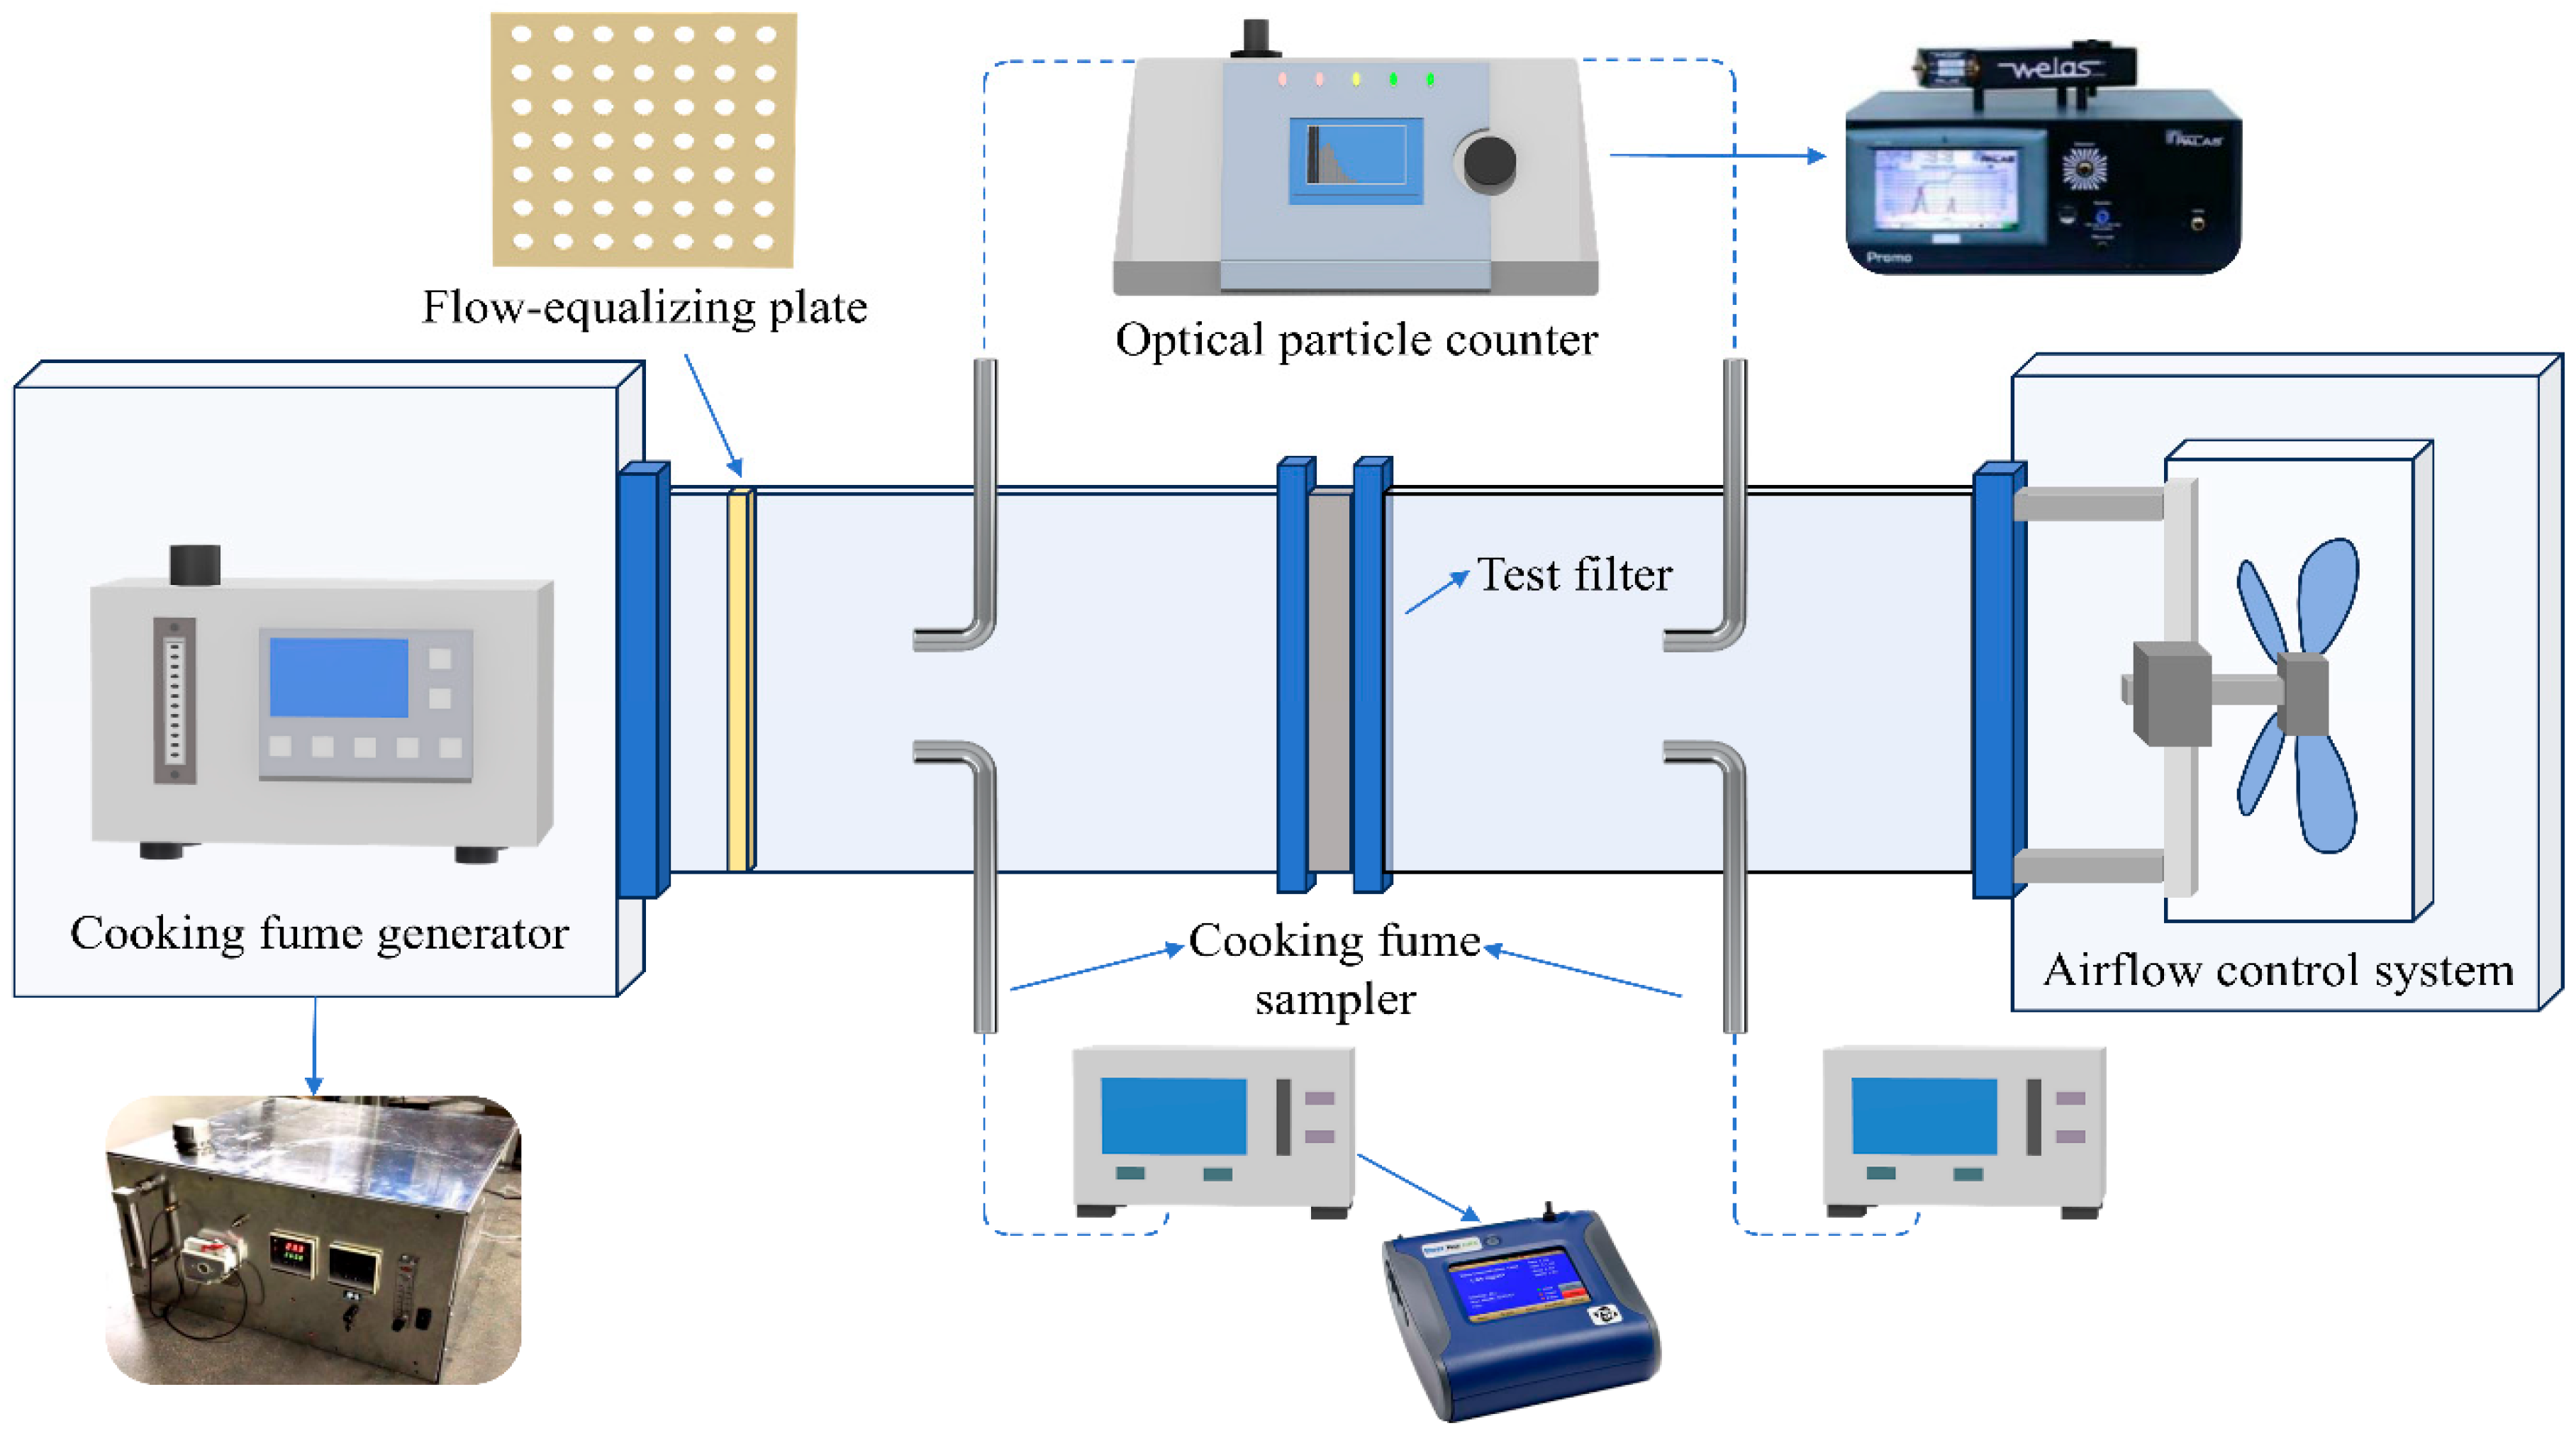
The cooking fume measurement platform was constructed in accordance with the EN 779:2012 standard [
27] (
Figure 1). The duct cross-section measured 0.6 m × 0.6 m. Cooking fume particles generated by the aerosol generator were injected into the test duct upstream of a porous flow-equalizing plate. This plate homogenized the upstream oil mist concentration, ensuring a stable particle distribution. During the experiment, airflow was precisely regulated by the platform’s control system, which comprised a fan and a flow meter. This system enabled real-time monitoring and adjustment of airflow, which was set to five specific conditions: 391, 488, 586, 684, and 781 m
3/h. Sampling ports were positioned 1.2 m downstream of the injection point. Sampling was conducted simultaneously across all five conditions using an optical particle counter, a photometer, and infrared spectrophotometry. Subsequently, filter samples were analyzed using the manual gravimetric method. To ensure data accuracy, six replicates were performed for each working condition.
2.2. Aerosol Generation
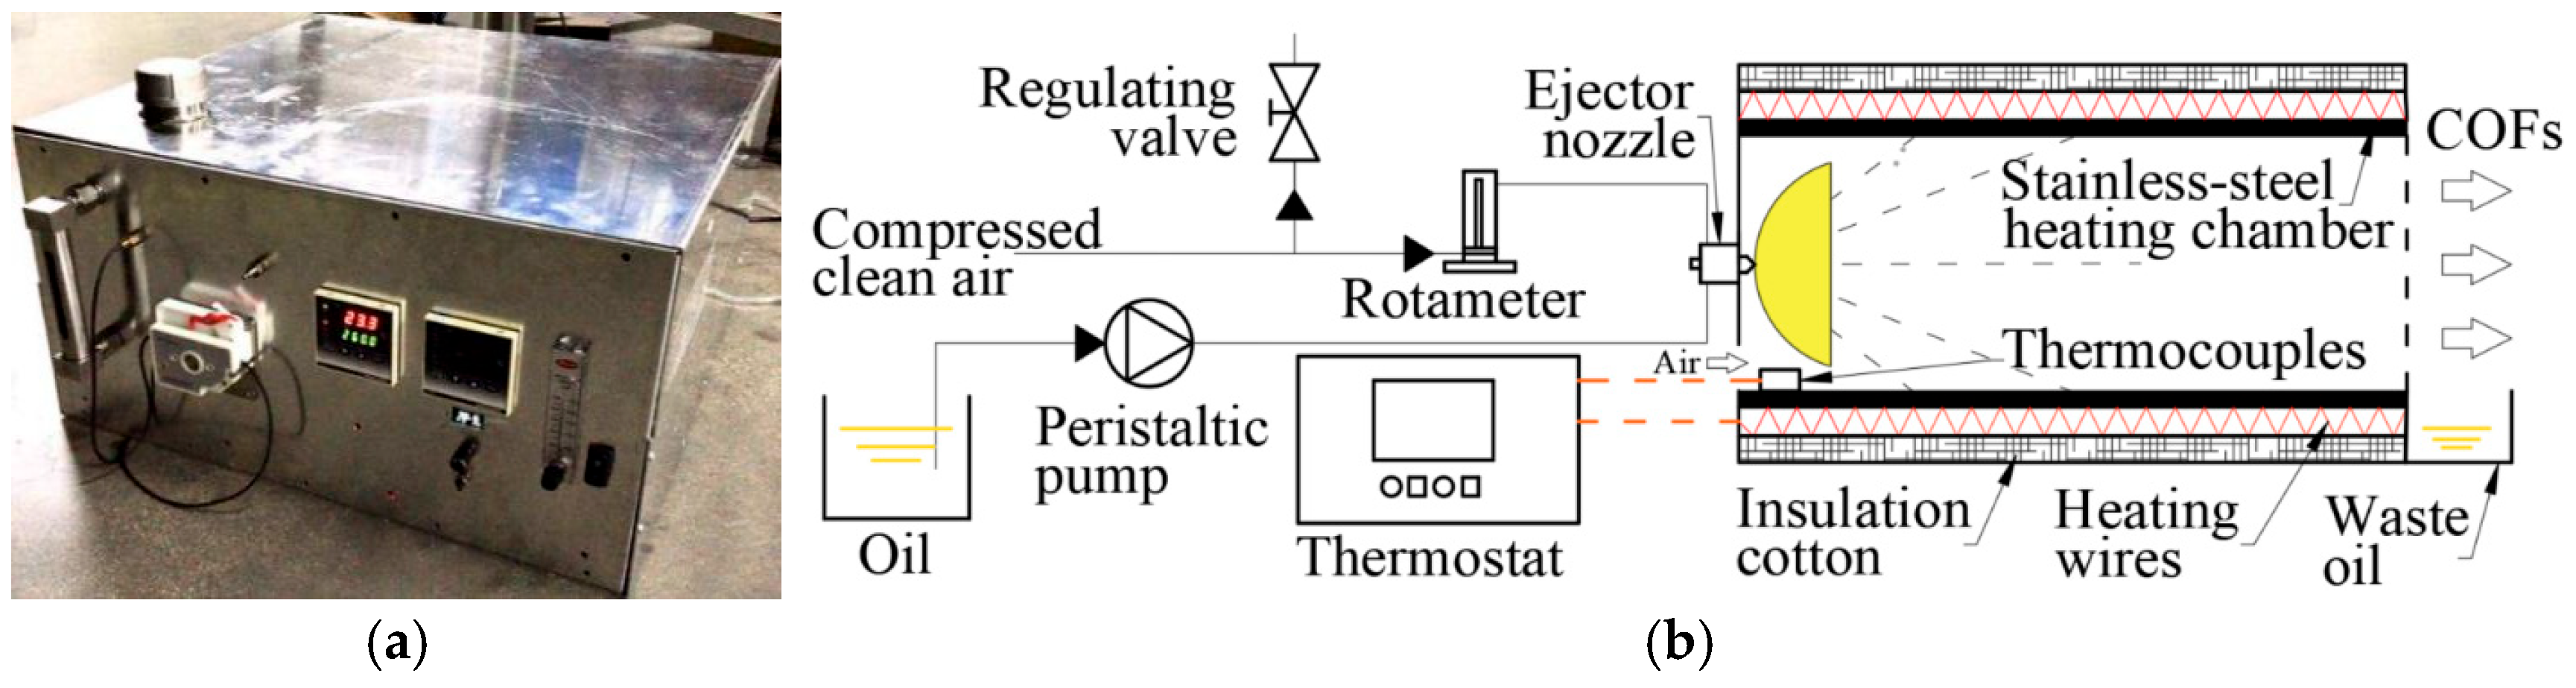
Given that actual cooking processes yield unstable and discontinuous aerosols, this study utilized a high-temperature cavity heating method to generate consistent cooking fume particles. This approach was used to simulate the fume production mechanism of oil droplets heated in a wok. As shown in
Figure 2, the system comprised a peristaltic pump for constant corn oil delivery and an air compressor equipped with a flowmeter for stable gas supply. High-velocity compressed air atomized the oil within the nozzle; the resulting mist impinged onto the heating chamber surface (controlled at 260 °C), where it underwent thermal evaporation and partial decomposition to produce cooking fumes.
2.3. Measurement Methods
2.3.1. Optical Particle Counter (OPC)
A Promo 3000 spectrometer (Palas GmbH, Germany Palas) was employed for this study. This instrument was connected with two optical sensors via fiber optics, allowing simultaneous determination of upstream and downstream particle size distributions and number concentrations. To minimize gravitational settling and transport losses, the optical sensor inlet was connected to the sampling port of the test duct via a short (0.3 m) rubber hose.
The measurement principle of the Promo 3000 and its optical sensor is primarily based on Mie scattering theory [
28]. When a laser beam illuminates particles within the measurement volume, light scattering occurs. According to light scattering principles, the diffraction parameter (
) is defined as [
29]:
where
is the particle equivalent diameter and
is the incident wavelength. Depending on the value of
, the scattering behavior falls into distinct regimes: Rayleigh scattering applies when
; geometric scattering applies when
; and Mie scattering applies when
. For a spherical particle of diameter
within the measurement volume, the intensity distribution of diffracted light at a scattering angle
follows Fraunhofer diffraction theory, expressed as:
where
is the distance between the particle and the detection position,
is the incident light source intensity, and
is the first-order Bessel function. The instrument determines particle size through a calibration process involving standard scattering particles. This establishes an empirical relationship between the detector’s pulse height (voltage signal) and the particle’s scattering cross-section. Subsequently, Mie scattering theory is applied to correlate the scattering cross-section with the optical equivalent diameter. Consequently, once the scattered light intensity is detected, the particle size is instantaneously calculated [
30].
The Promo 3000 is equipped with 128 particle size channels and offers four selectable measurement ranges. For this study, the 0.3–17 μm range was employed with a sampling frequency of 1 Hz. While the instrument directly measures number concentration based on pulse signals, the mass concentration is derived mathematically. Assuming spherical particles, the mass concentration is calculated using the following equations:
where
denotes the mass concentration of particulate matter in particle size channel
;
denotes the number concentration in channel
;
represents the geometric mean diameter of particles in channel
;
is the particle density; and
is the total mass concentration.
2.3.2. Photometer
Light scattering photometry operates based on Mie scattering theory [
28] to derive particulate mass concentration. Unlike particle counters that enumerate individual particles, this method analyzes the aggregate scattering characteristics of aerosol particles under monochromatic illumination, which are functions of particle size distribution and refractive index. The core principle is that, within a specific dynamic range, the total scattered light flux received by the detector exhibits a linear relationship with the particulate mass concentration. Internally, the instrument’s optical system converts the scattered light signal into an electrical signal. Following analog-to-digital conversion and processing via calibration algorithms, the device outputs real-time mass concentration data. As a non-invasive, online monitoring tool, the light scattering photometer enables continuous tracking of suspended particulate mass. This capability is particularly advantageous for analyzing the spatiotemporal distribution characteristics of aerosols under varying operational conditions.
This study utilized the TSI DustTrak Model 8533 (USA) photometer instrument capable of real-time aerosol mass concentration measurement. With a measurement ceiling of 400 mg/m
3, it is well-suited for detecting the high-concentration aerosols generated in this study. Operatively, an internal sampling pump draws aerosol into the instrument, splitting the flow into two streams: a sample stream that directly enters the optical chamber, and a sheath flow that passes through a High-Efficiency Particulate Air (HEPA) filter to protect the optics. The instrument employs laser scattering technology, where a laser diode emits a beam collimated by a lens to illuminate particles within the sample stream. A spherical mirror collects the scattered light and focuses it onto a photodetector. Within the instrument’s linear range, the photodetector’s voltage signal is directly proportional to the aerosol mass concentration. Real-time data is derived by applying a photometric calibration factor (PCF) to this voltage signal. This factor represents the ratio of the gravimetrically determined mass concentration to the photometer’s voltage response, ensuring measurement accuracy and traceability. The factory default calibration is typically established using ISO 12103-1 standard, A1 Test Dust (Arizona Road Dust) [
31].
2.3.3. Infrared Spectrophotometric Method
The infrared spectrophotometric method utilizes an infrared spectrophotometer to quantify cooking fume concentrations within an organic extract. The underlying principle relies on the selective absorption of infrared radiation by specific chemical bonds found in oil fumes. Specifically, absorbance is measured at three characteristic wavenumbers: 2930 cm−1, corresponding to C-H stretching vibration of the methylene groups, 2960 cm−1 corresponding to C-H stretching vibration of the methyl groups, and 3030 cm−1 corresponding to C-H stretching vibration of the aromatic C-H bonds. By analyzing the absorbance values A2930, A2960, and A3030 at these bands, the total oil content in the aerosol is quantitatively determined.
The procedural workflow for detection is as follows: First, aerosol samples were collected via the sampling assembly shown in
Figure 3. The filter membrane loaded with particulate matter was then immersed in carbon tetrachloride (CCl
4) and subjected to ultrasonic extraction to ensure complete dissolution of oil substances. Subsequently, anhydrous sodium sulfate was added to the extract to remove residual moisture. The solution was filtered through a microporous membrane and adjusted to a fixed volume with CCl
4. Absorbance was measured at the three characteristic wavenumbers (2930, 2960, and 3030 cm
−1) using pure carbon tetrachloride as the blank reference. Finally, the oil concentration was derived from a standard curve with correlation coefficient R
2 ≥ 0.999 and expressed in mg/m
3. Prior to analysis, the accuracy and stability of the spectrophotometer were verified.
2.3.4. Manual Gravimetric Method
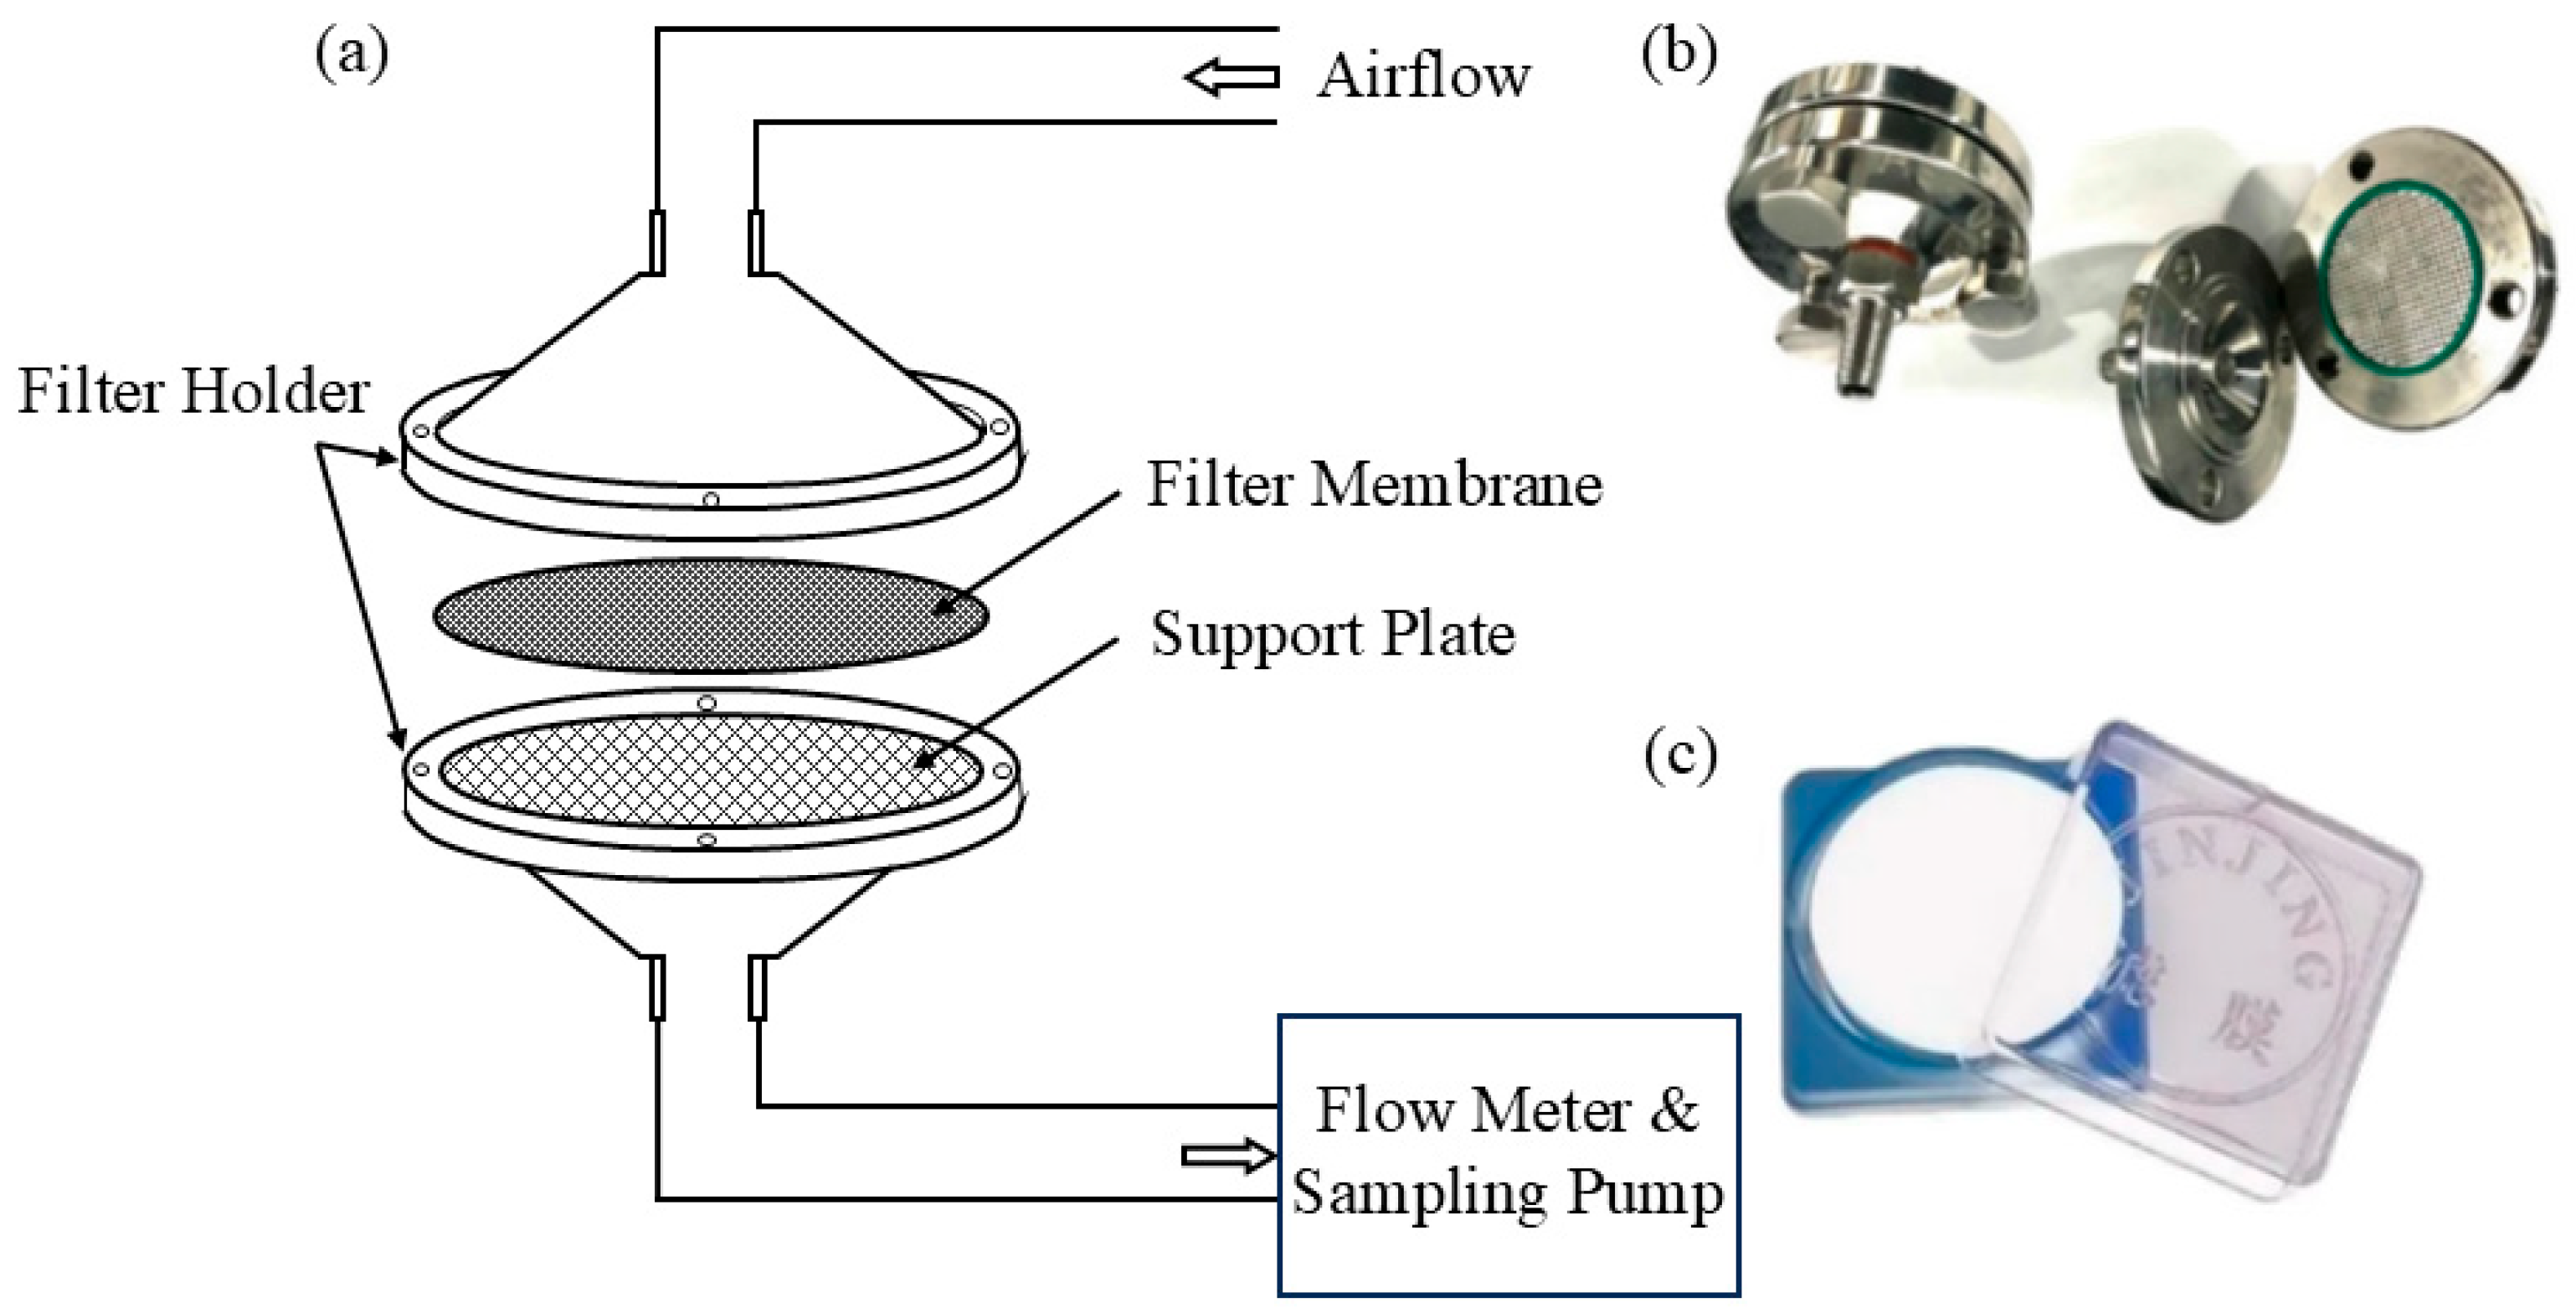
The manual gravimetric method, also known as filter membrane gravimetry, served as the benchmark method for particulate mass concentration and was conducted according to ISO 12141:2024 standard. Utilizing isokinetic sampling principles, the system comprises a filter holder assembly with a metal support grid, a constant-flow sampling pump, and a rotameter (flow measurement system). Particulate laden air is drawn through the filter isokinetically, where gas–solid separation is achieved via mechanisms of inertial impaction, diffusion deposition, and electrostatic adsorption. The filtered clean air is subsequently discharged through the flow metering system. To visualize the setup,
Figure 4 illustrates the key components: (a) a schematic diagram depicting the airflow path and the assembly of the filter holder, membrane, support grid, flowmeter, and pump; (b) a photograph of the filter holder assembly; and (c) a photograph of the filter membrane used for particle capture.
Filters were equilibrated in a temperature- and humidity-controlled environment at 20 ± 0.5 °C, 50 ± 1% RH for 24 h before and after sampling. The filter mass was determined using a microbalance with a precision of 0.01 mg. By combining the net mass gain with the standard sampling volume, the particulate mass concentration was calculated. This method achieves a capture efficiency exceeding 99.9% for PM2.5, PM10, and Total Suspended Particulates (TSP). A significant technical advantage is that the measurement is independent of particle physicochemical properties such as refractive index and color. Consequently, it is extensively used as the reference standard for instrument calibration and quality control in environmental monitoring.
Filter membranes used for aerosol collection are generally categorized into fibrous filters, porous membrane filters, and capillary pore filters. In this study, a dual-layer stacked configuration was utilized for sampling. The first layer (upstream) consisted of a glass fiber filter. This material was selected as a standard medium for airborne particulate sampling due to its high filtration efficiency (>99% for all particle sizes) and low hygroscopicity, which minimizes interference from humidity. In this setup, the vast majority of cooking fume particulate matter was captured by this layer. The filtration mechanisms of fibrous filters primarily include diffusion, interception, and inertial impaction. The second layer (downstream) was a Polytetrafluoroethylene (PTFE) membrane (a thin-film filter). PTFE membranes are characterized by a microporous structure that promotes surface adsorption, achieving a filtration efficiency exceeding 99.95% for particles 0.3 μm. Due to their chemical inertness, hydrophobicity, and low contamination background, PTFE membranes are suitable for subsequent mass and elemental analyses.
The total efficiency of a fibrous filter membrane can be expressed as [
30]:
where
represents the packing density (or solidity) of the filter membrane (calculated as 1-porosity);
denotes the filter thickness;
is the fiber diameter; and
represents the single-fiber efficiency.
accounts for the cumulative collection efficiency of a single fiber resulting from mechanisms including diffusion, interception, inertial impaction, electrostatic attraction, and gravitational settling.
The manual gravimetric procedure was conducted under strictly controlled environmental conditions. By determining the net mass gain of the filter membrane before and after sampling, and simultaneously recording the total volume of gas sampled over the corresponding duration, the particulate mass concentration is calculated using the following formula:
where
and
represent the mass of the filter membrane before and after sampling, respectively (g);
denotes the sampling volume converted to standard conditions (m
3), which is calculated in accordance with the methodology specified in GB/T 16157 [
32]; and
represents the particulate mass concentration during the sampling period (mg/m
3).
2.4. Measurement Experimental Flow
The experimental procedure utilized the measurement platform detailed in
Figure 1 and the aerosol generator shown in
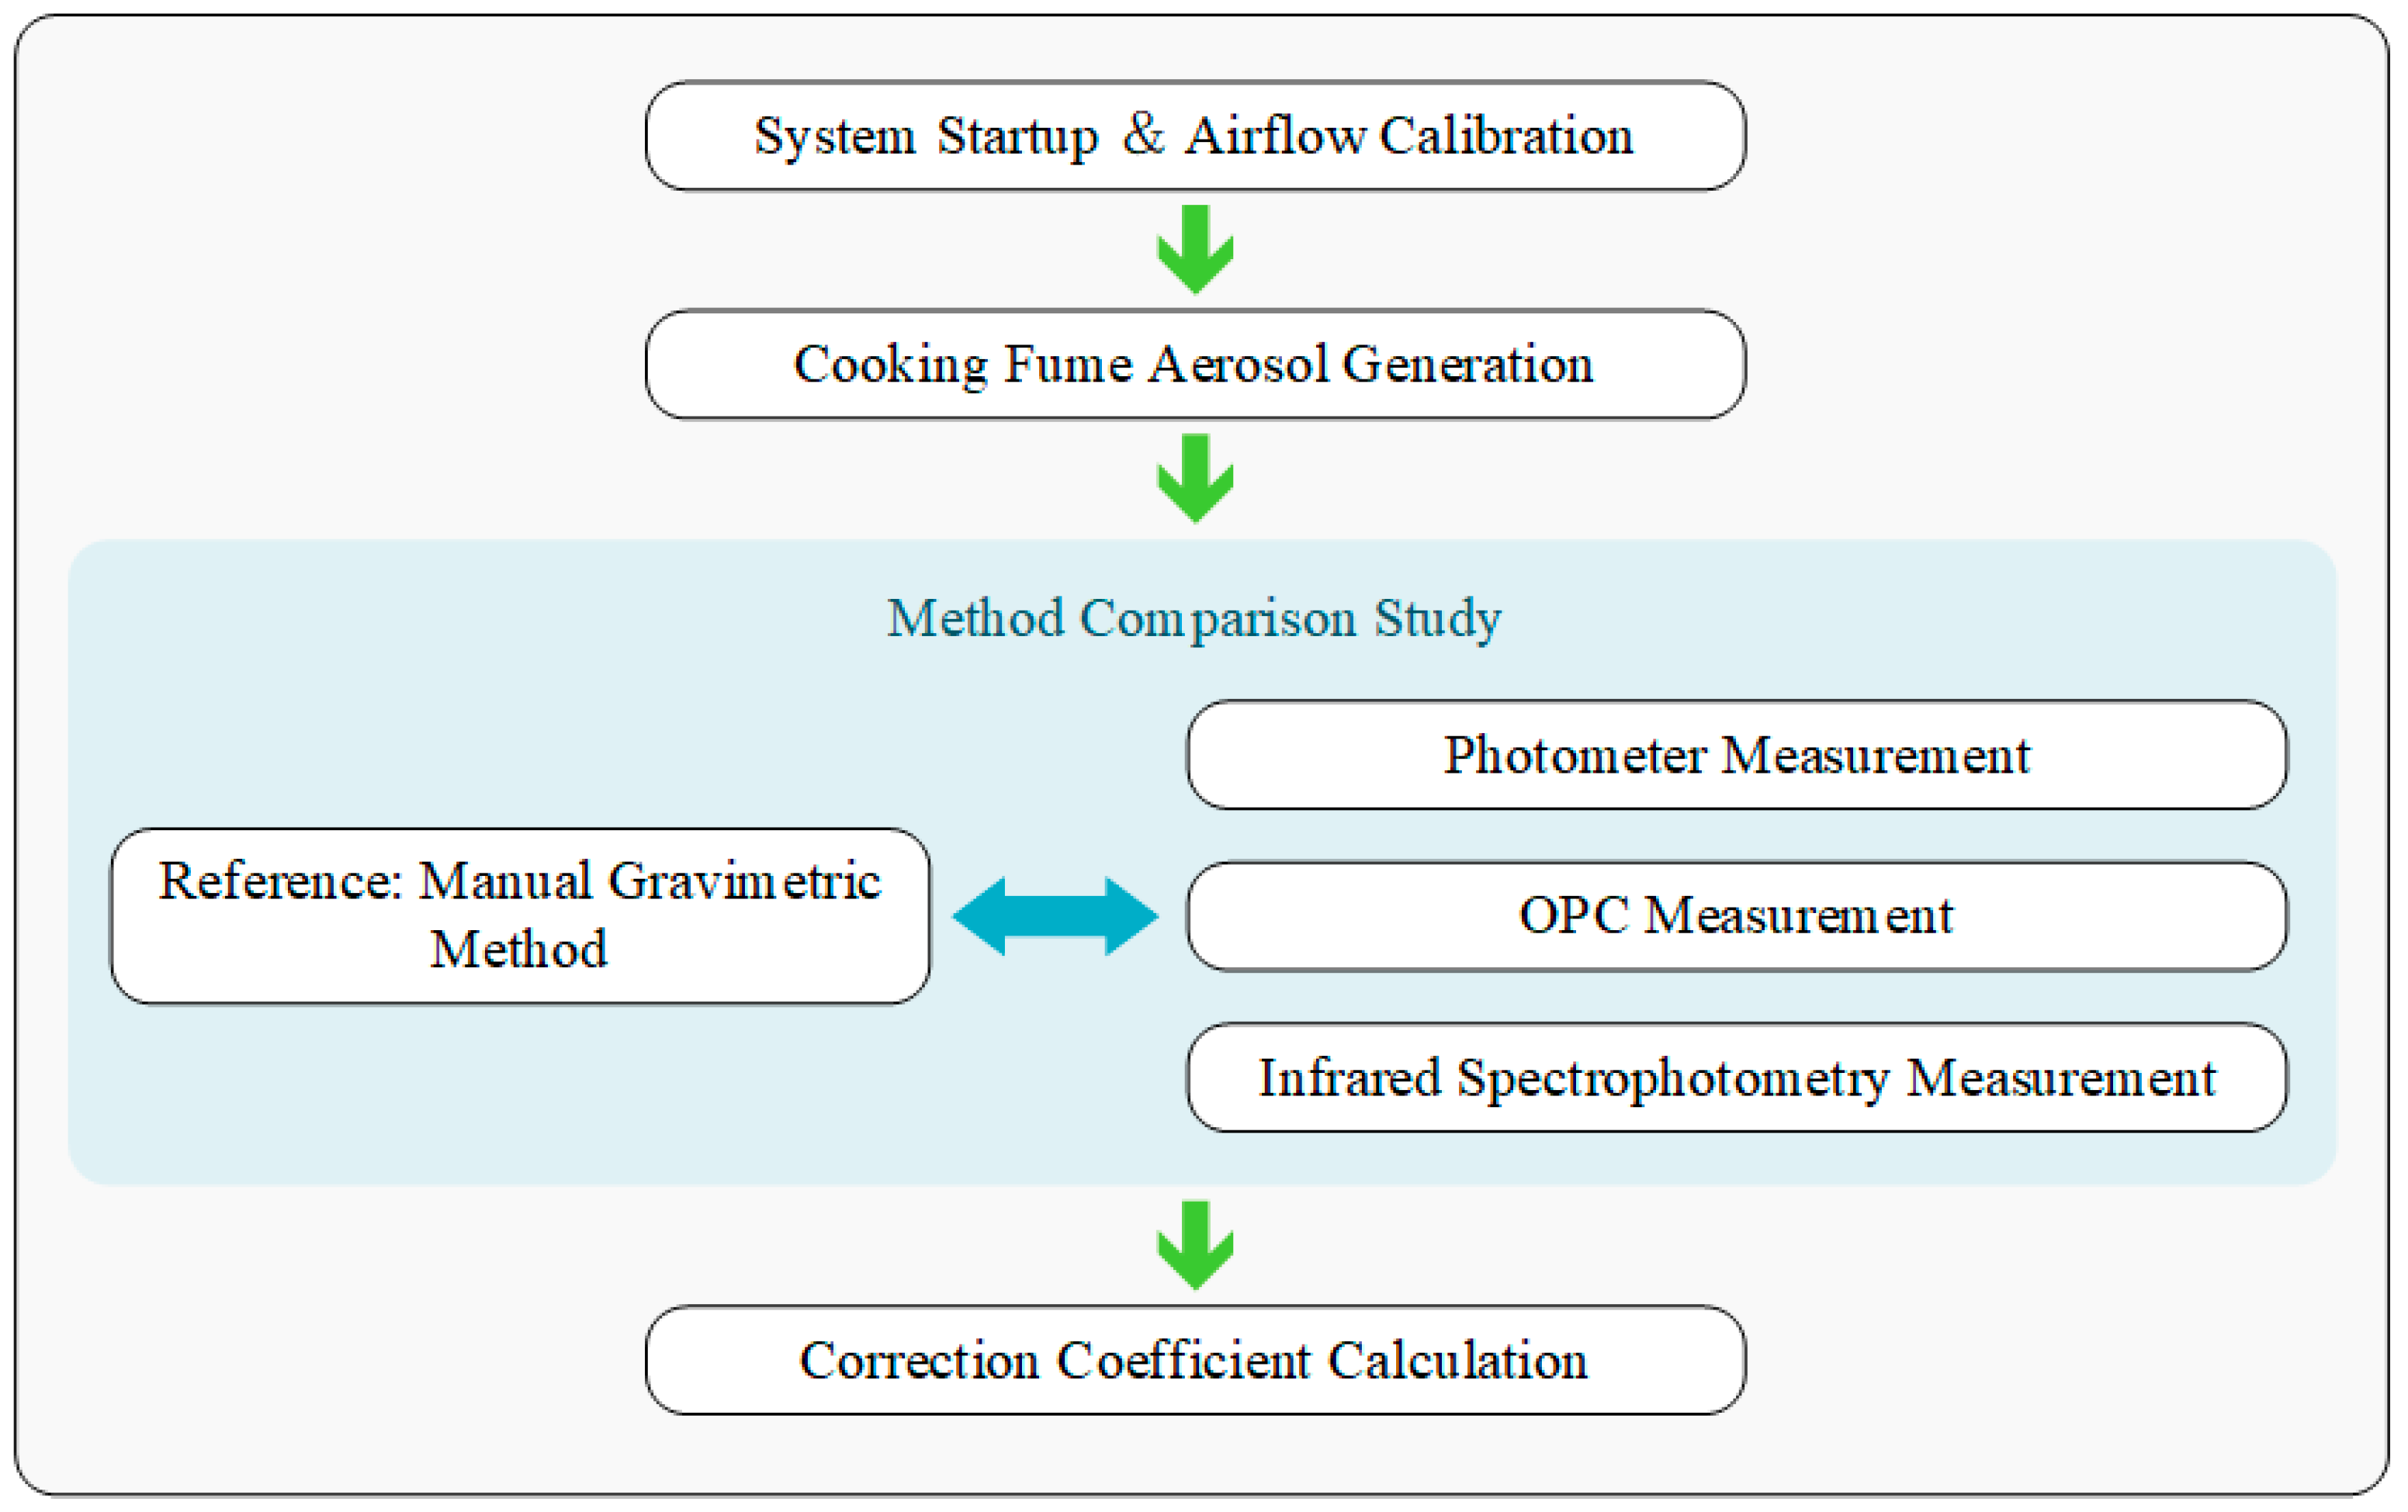
Figure 2. The specific workflow is outlined in the flowchart in
Figure 5 and discussed step by step below:
- (1)
System Startup and Airflow Calibration: The cooking fume measurement system was activated, and the airflow rate was sequentially adjusted to 391, 488, 586, 684, and 781 m3/h. At each set point, the system was operated for 15 min to ensure flow stability downstream of the porous flow straightener. Flow stability was verified using an anemometer.
- (2)
Cooking Fume Aerosol Generation: To simulate Chinese cooking conditions, the high-temperature chamber shown in
Figure 2 was employed. Corn oil was delivered by a peristaltic pump at a constant flow rate to an atomizing nozzle, where it was atomized by compressed air calibrated via a flow meter. The resulting oil mist entered the heating chamber, which was maintained at a surface temperature of 260 °C, where it thermally decomposed to generate cooking fume aerosols. These aerosols were injected into the inlet of the measurement platform. The oil pump flow rate and heating temperature were adjusted to stabilize the fume concentration within the duct was stabilized at 5–20 mg/m
3, simulating realistic cooking environments.
- (3)
Reference Measurement via Manual Gravimetric Method: Simultaneous isokinetic sampling was conducted at a position 1.2 m downstream of the porous flow straightener using the dual-layer filter system composed of glass fiber and PTFE filters.
The sampling duration was set to 30 min at a controlled flow rate of 16.7 L/min, in accordance with the GB/T 16157 standard. Sampling was repeated six times for each experimental condition. After sampling, filter membranes were equilibrated in a controlled environment at 20 ± 0.5 °C, 50 ± 1% RH for 24 h. The mass difference was determined using a microbalance with 0.01 mg precision. The mass concentration was calculated using Equation (6). For data quality control, repeated measurements were screened to identify occasional abnormal values caused by sampling interruption, filter handling errors, unstable aerosol generation, or instrument malfunction. Data points lower than 25% of the maximum measured value under the same experimental condition were considered abnormal and excluded from further analysis. This threshold was adopted as a conservative quality-control criterion to eliminate measurements showing substantial deviation from the remaining repeated observations. The influence of the screening procedure on the final results was evaluated by comparing average concentrations calculated with and without the excluded values, and the resulting correction coefficients differed by less than 3%. Therefore, the screening procedure did not significantly affect the overall conclusions. A minimum of three valid measurements was retained for each experimental condition to ensure statistical reliability, .
- (4)
Comparative Measurements using Alternative Methods: While maintaining constant airflow and fume concentration, synchronous sampling was performed at the same location using three additional methods: (a) The optical particle counter, PALAS Promo 3000, monitored real-time particle size distribution and number concentration via a 0.3 m sampling tube. Mass concentration was derived using Equations (3) and (4). (b) The TSI DustTrak 8533 (USA) photometer measured total mass concentration in real-time, utilizing a dual-path design having sheath gas and sample flow. (c) For infrared spectrophotometry, samples were collected on filter membranes and ultrasonically extracted with carbon tetrachloride (CCl4). Absorbance was measured at 2930, 2960, and 3030 cm−1, and the concentration of organic components was calculated based on the standard curve. The concentration results obtained from these alternative methods were collectively denoted as .
- (5)
Calculation of Correction Coefficients: The correction coefficient (
) for the cooking fume concentration measurement method is calculated as follows:
where
is the correction coefficient;
is the reference cooking fume concentration obtained by the manual gravimetric method (mg/m
3); and
is the concentration measured by the alternative mass concentration tester (mg/m
3).
3. Results
3.1. Emission Characteristics of Oily Cooking Fume Sources Under Different Air Flow Rates
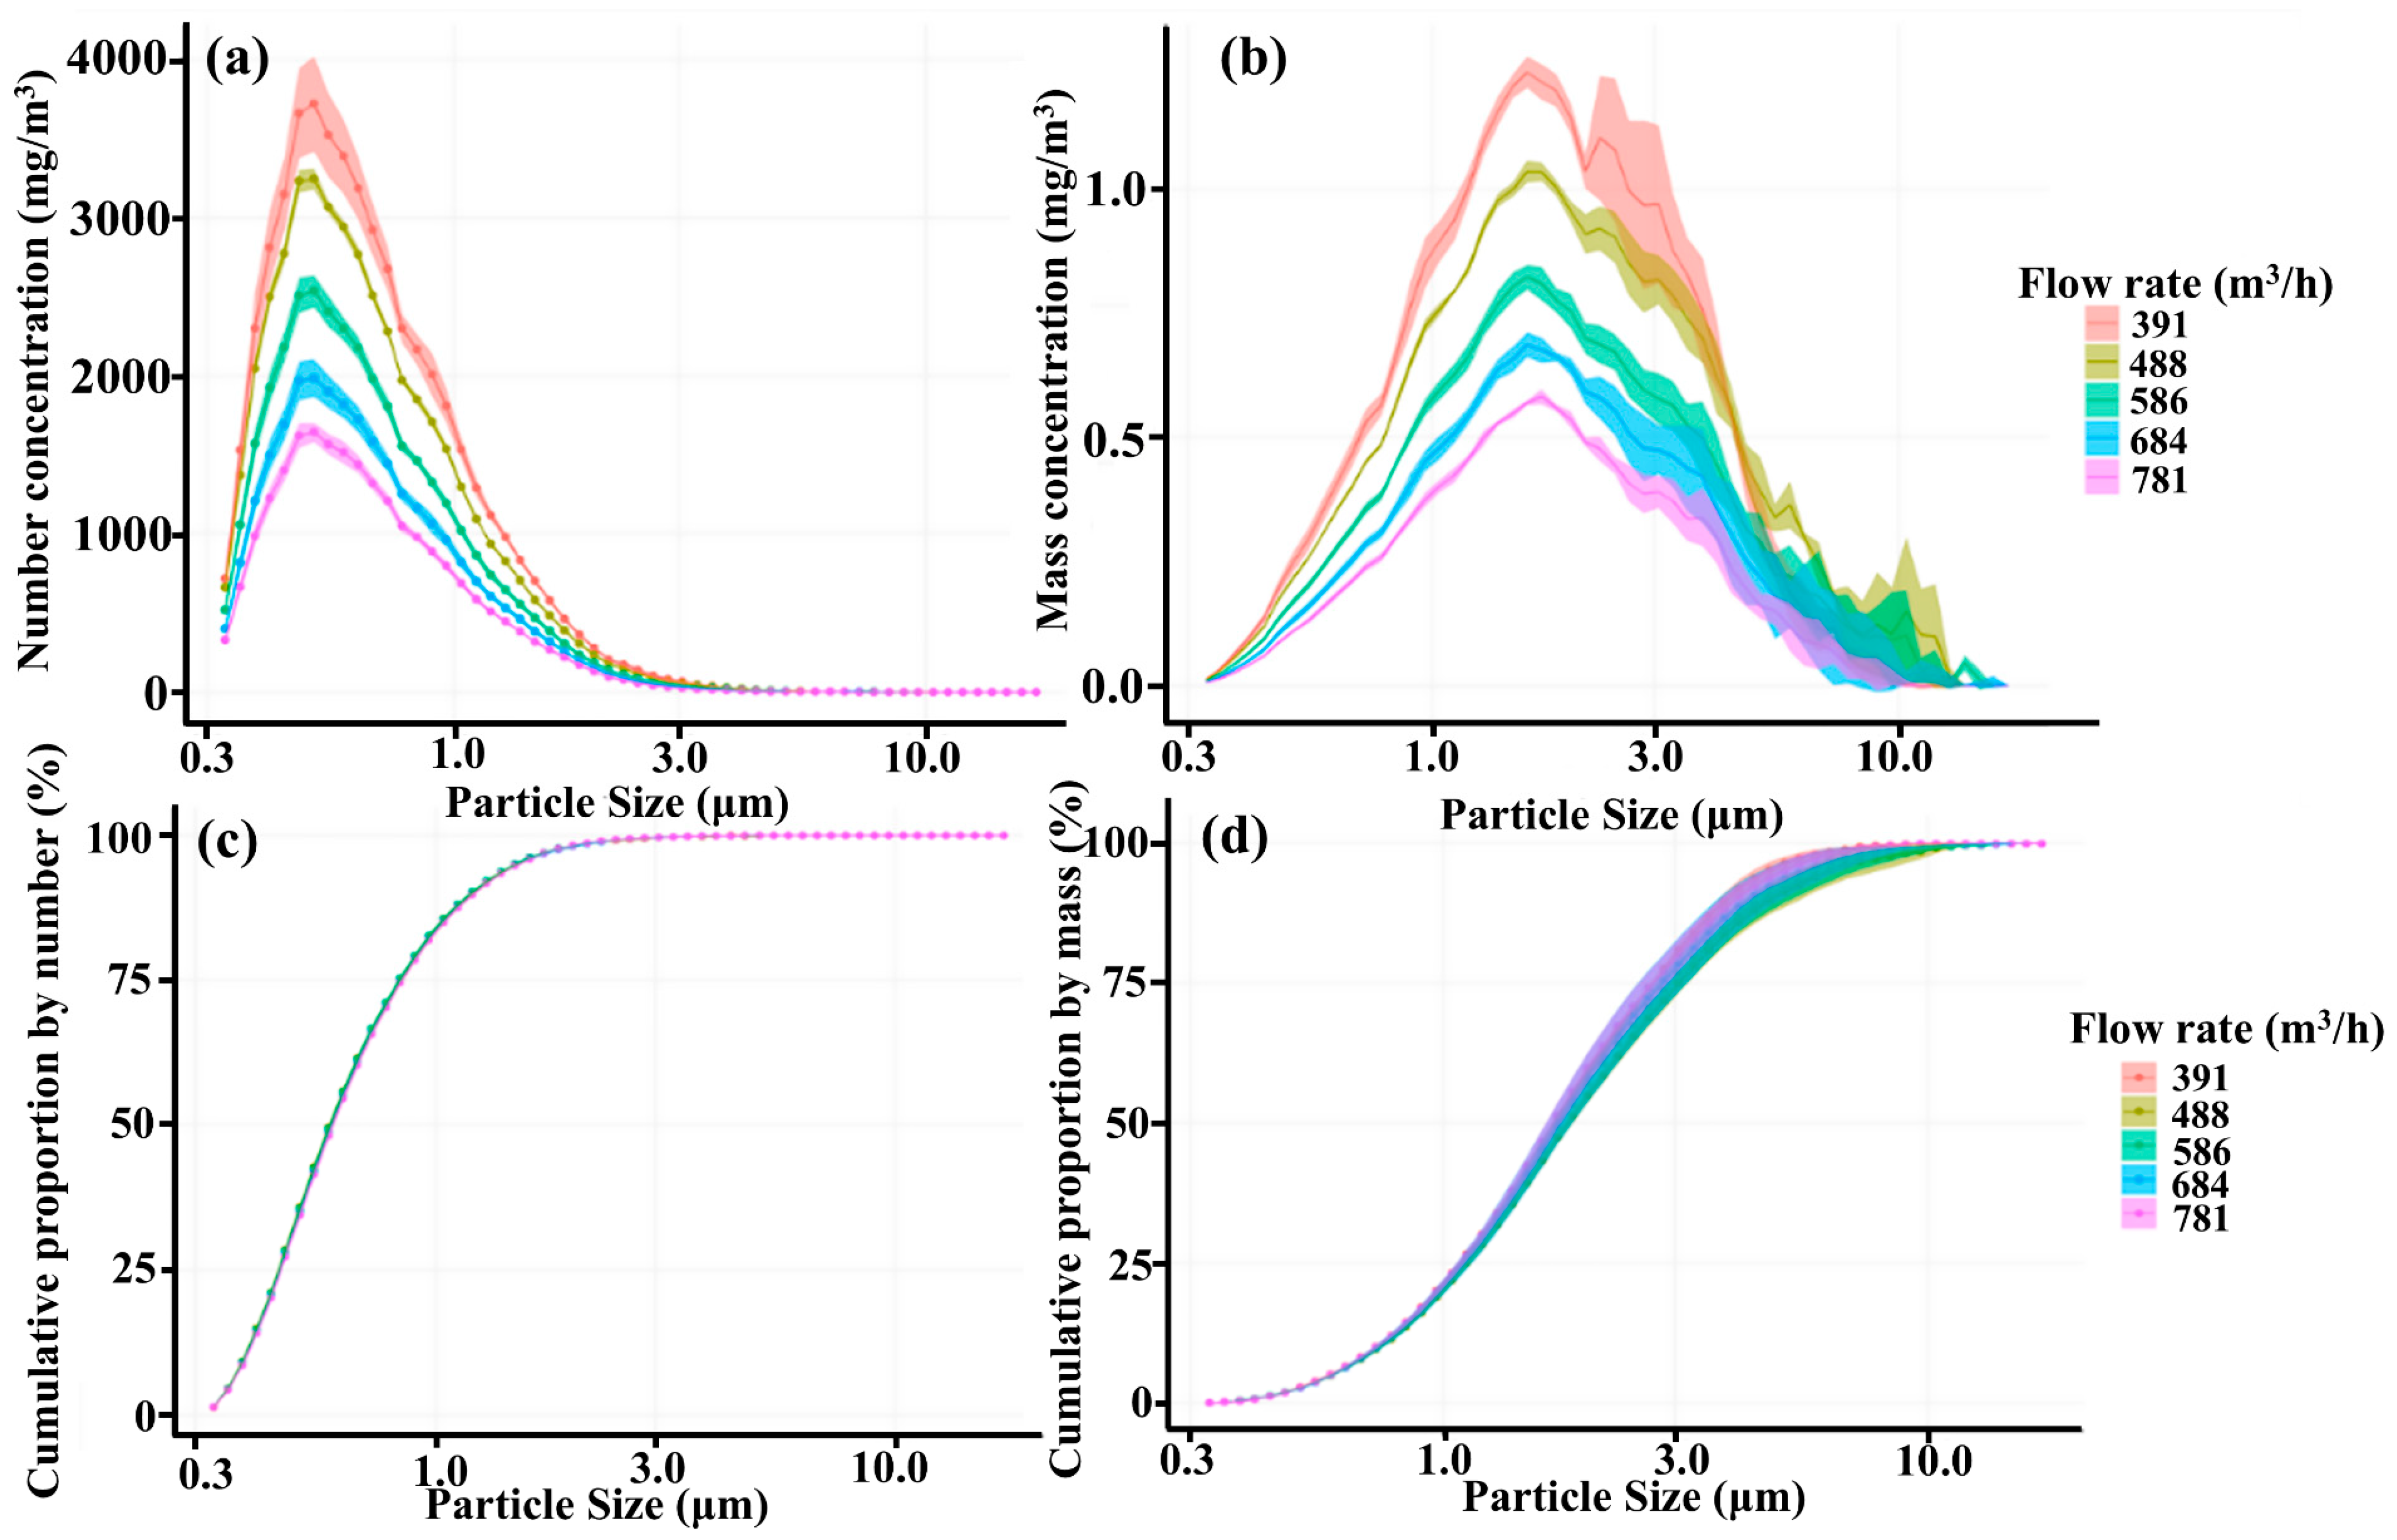
Figure 6a illustrates the particle number concentration size distribution of the generated cooking fumes, measured using the Promo 3000 OPC under varying airflow rates. The distributions exhibit a consistent unimodal pattern across all five airflow conditions, with the peak number concentration occurring at a particle diameter of approximately 0.50 μm. Conversely, the mass concentration size distribution, calculated using Equation (3) and presented in
Figure 6b, indicates that the peak particle size for mass concentration shifts to approximately 2.3 μm.
Figure 6c,d depict the cumulative distributions for number and mass concentrations, respectively. Quantitative analysis reveals distinct distribution characteristics for particles within the 0.3–10 μm measurement range: fine particles with diameters of 0.3–1.0 μm dominate the number concentration, accounting for 80.3% of the total count. In contrast, coarser particles with diameters of 1.0–4.0 μm dominate the mass concentration, contributing 73.1% of the total mass.
These findings are consistent with existing literature. Gao et al. [
33] and Wallace et al. [
10] investigated the size fractionation of real-world cooking fumes within the 0.1–10 μm range and reported that while the number concentration is overwhelmingly dominated by sub-micron particles (<1.0 μm), the mass concentration is primarily attributed to particles in the 1–4 μm range. The results of this study align closely with these established trends.
Furthermore, the operating parameters of the aerosol generator were validated against real-world conditions. Previous studies indicate that oil temperatures of 130, 160, 190, 220, and 270 °C correspond to the cooking modes of steaming, roasting, pan-frying, stir-frying, and deep-frying, respectively [
33]. In this study, the jet-type aerosol generator operated at an oil temperature of 260 °C, thereby simulating the cooking fumes produced during typical high-temperature stir-frying or deep-frying processes.
3.2. Cooking Fume Concentration Measured by Different Instruments
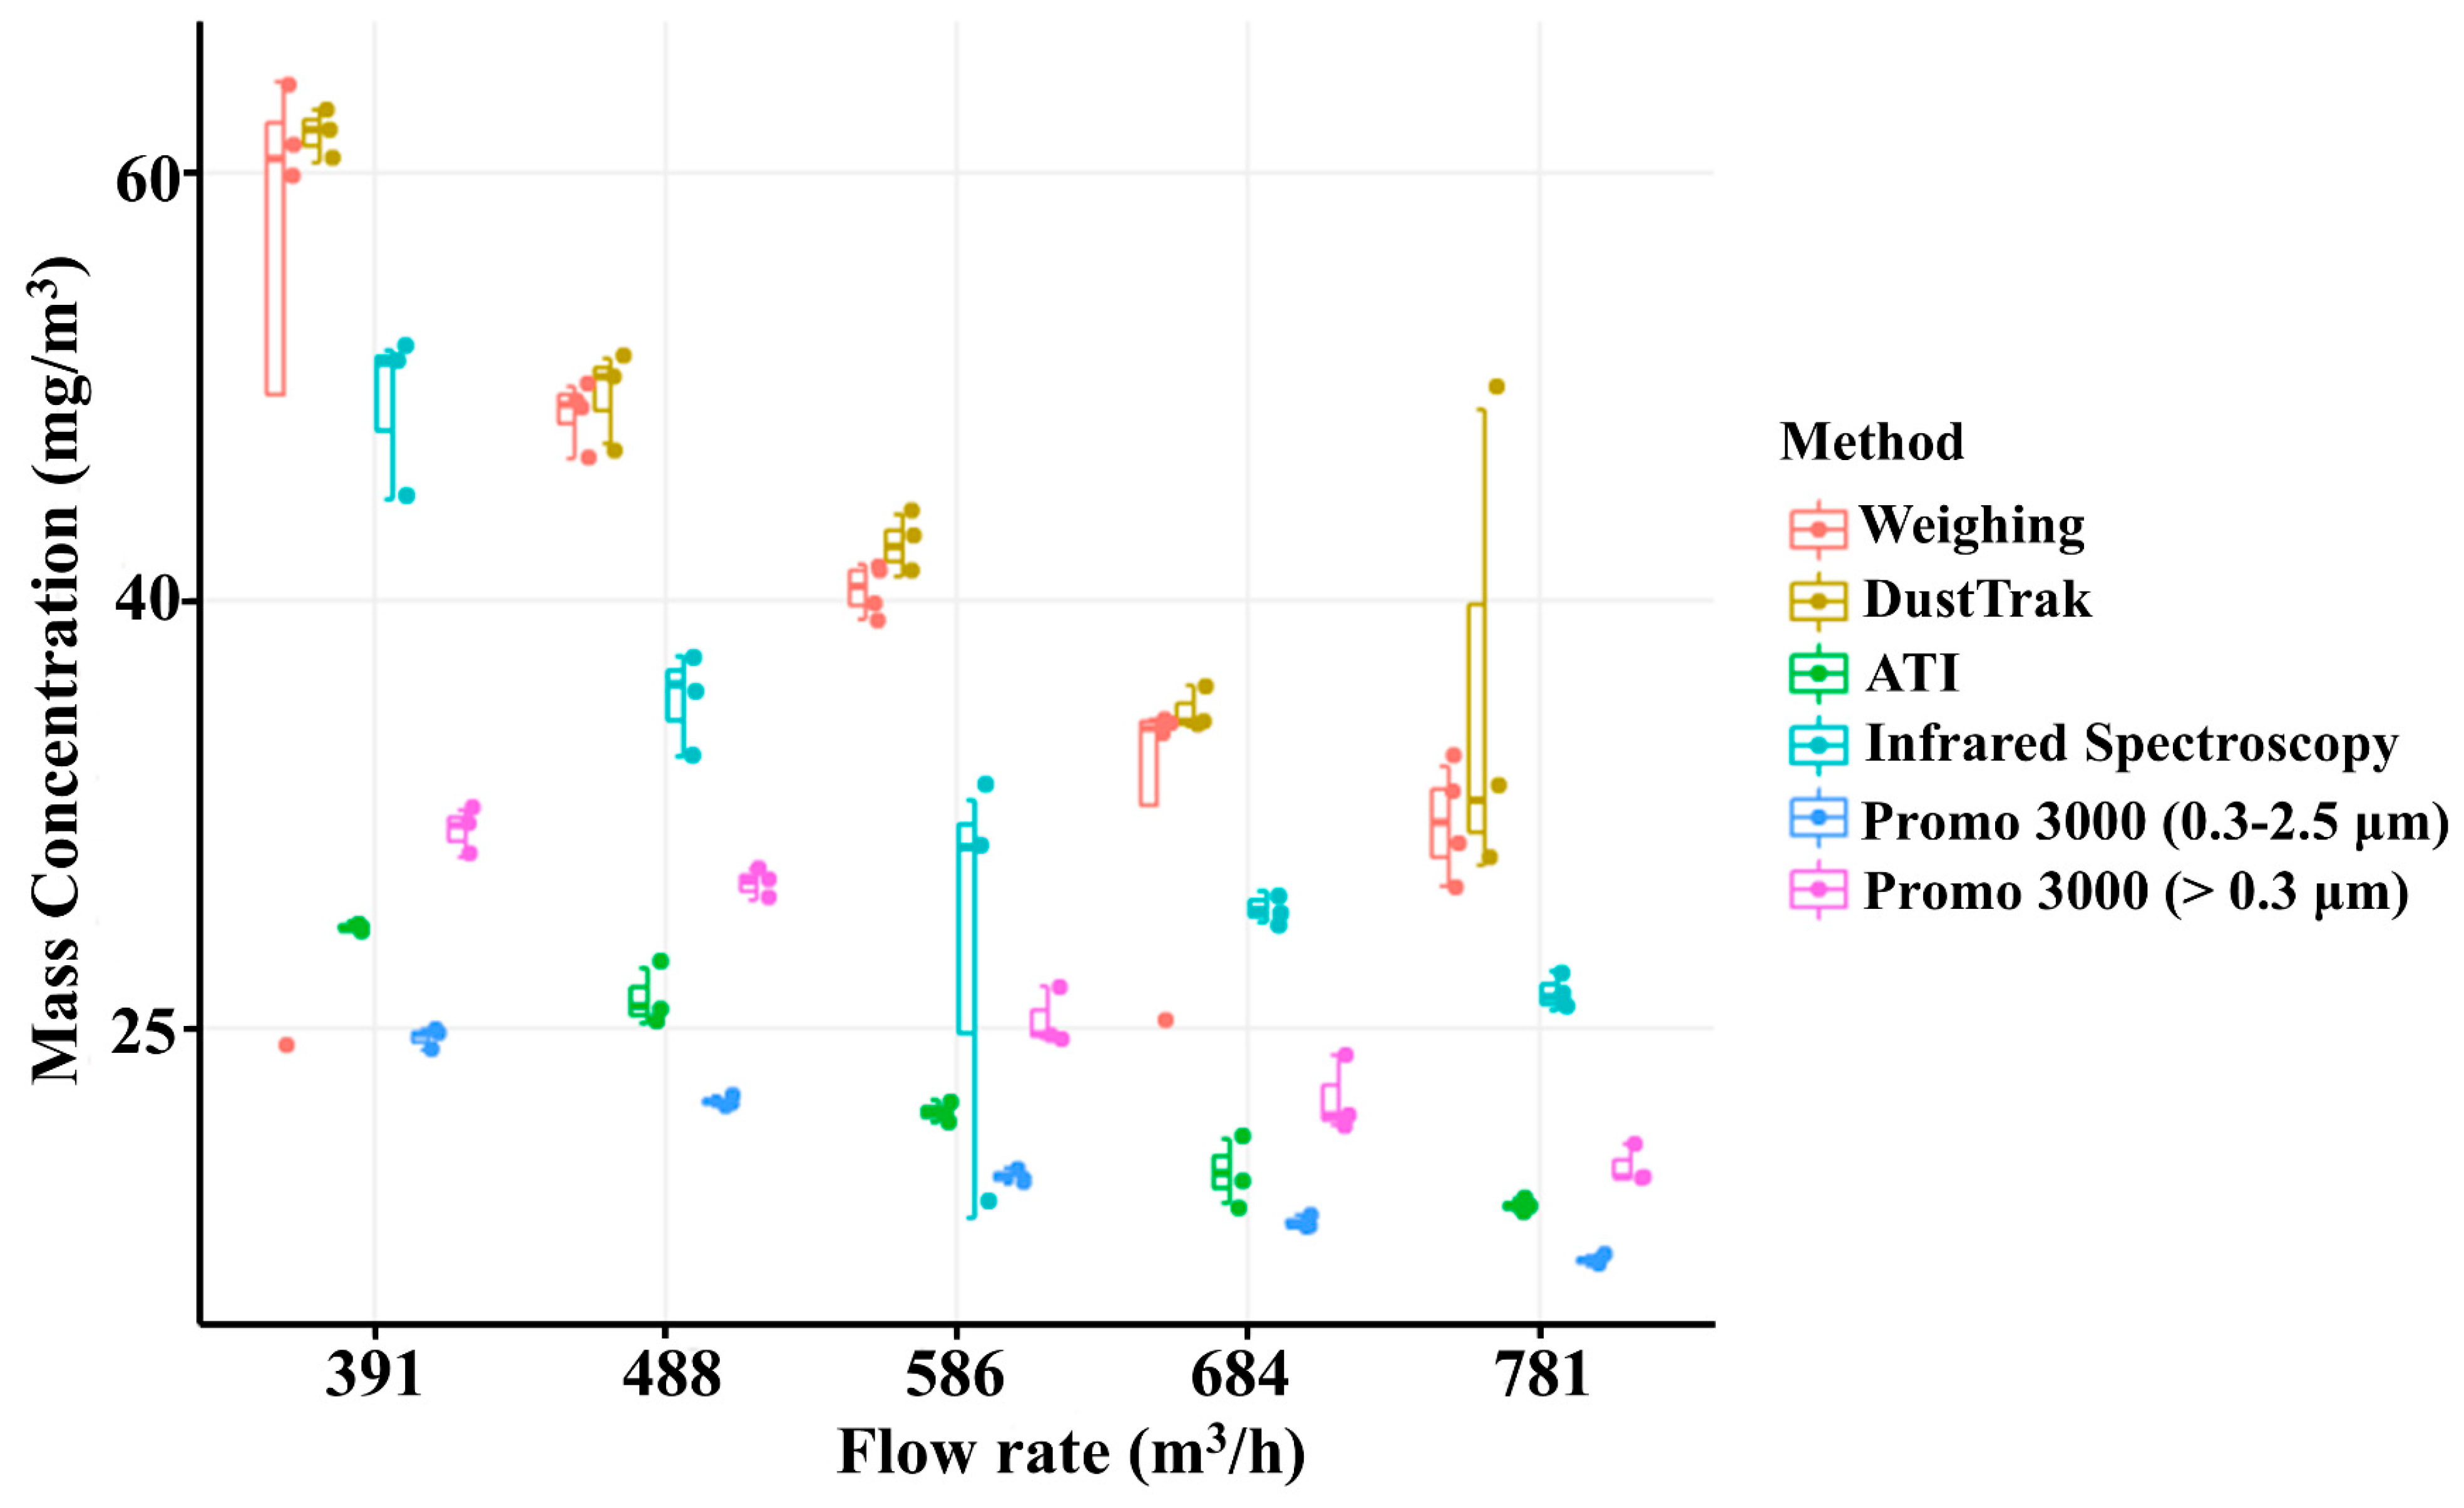
Figure 7 illustrates the mass concentrations of cooking fumes measured by different instruments under varying airflow rates. Significant discrepancies are observed among the results obtained from different measurement principles at identical airflow settings. The manual gravimetric method yielded the highest mass concentration values. As calculated via Equation (6), this method directly determines the total particulate mass and is largely independent of particle optical properties such as refractive index and color, thus serving as the benchmark reference method. The measurements obtained using the DustTrak aerosol photometer were closest to this benchmark, followed by those obtained using infrared spectrophotometry method.
In contrast, the total mass concentration derived from the Promo 3000 OPC was significantly lower than that of the other three methods. Specifically, mass concentrations for the total range (>0.3 μm) and the respirable range (0.3–2.5 μm) were calculated using Equations (3) and (4). The substantial underestimation by the OPC compared to the manual gravimetric method can be attributed to the fundamental differences in measurement principles.
3.2.1. Mechanism of Measurement Deviation
The discrepancy between optical instruments including OPC and photometers and the manual gravimetric method primarily stems from differences in the physicochemical properties of actual cooking fume particles and the standard calibration aerosols used for instrument calibration. These properties include refractive index, particle density, morphology, and chemical composition. As indicated by Equations (1) and (2) based on light scattering theory, the scattering intensity is influenced by refractive index, particle size and the diffraction parameter (). Cooking fume particles, which are largely composed of liquid or semi-volatile oil droplets, have optical properties that differ from those of standard solid particles. These differences alter scattering behavior and can introduce systematic bias during conversion from optical signals to particle size or mass concentration. Optical instruments typically assume a predefined density (often 2.65 g/cm3 for mineral dust or 1.0 g/cm3 depending on settings) to convert volume to mass concentration. This assumes density may differ from the actual density of cooking fume oil particles. Cooking oil droplets generally have a lower density than mineral dust, approximately 0.9 g/cm3, which can further contribute to the mass calculation error.
Although both the OPC and the DustTrak photometer rely on light-scattering principles, their responses to cooking-fume aerosols differ substantially because of differences in signal processing and mass-concentration estimation procedures. The OPC first determines particle size from scattered light intensity and subsequently converts particle size to volume and mass using assumptions regarding particle shape and density. Consequently, uncertainties associated with optical sizing, particle morphology, and density estimation may accumulate and lead to larger deviations from the gravimetric reference method. In contrast, the DustTrak photometer estimates aerosol mass concentration directly from the integrated scattering signal through an instrument-specific calibration relationship, reducing the influence of uncertainties associated with particle size classification and volume conversion. This difference may explain why the DustTrak measurements exhibited closer agreement with the gravimetric method.
In addition, cooking-fume aerosols are primarily composed of liquid or semi-liquid organic droplets rather than ideal spherical solid particles. Variations in particle morphology and internal composition can modify scattering behavior and affect optical sizing accuracy. Furthermore, cooking aerosols often contain semi-volatile organic compounds that may partially evaporate during sampling and transport. Such evaporation can decrease particle diameter and scattering intensity before detection, potentially contributing to the underestimation observed in optical measurements. These effects are expected to be particularly important for submicron particles, which dominate the concentration of cooking-fume aerosols.
In addition to density effects, uncertainties may also arise from the determination of optical-equivalent particle diameter. The OPC estimates particle size from scattered-light intensity according to Mie scattering theory, which is sensitive to particle refractive index and morphology. Cooking-fume aerosols are predominantly composed of liquid and semi-volatile organic droplets whose optical properties differ from those of the calibration aerosols commonly used for OPC calibration. Consequently, the measured optical-equivalent diameter may deviate from the actual particle diameter, leading to errors in particle volume estimation. Because particle mass is calculated from both particle volume and density, these uncertainties can propagate and result in substantial deviations between OPC-derived and gravimetric mass concentrations. Furthermore, partial evaporation of semi-volatile organic components during sampling and transport may alter particle size and optical properties, introducing additional uncertainty into optical measurements.
It should be noted that particle refractive index and density were not directly measured in this study. Therefore, the above interpretation is based on the measurement principles of the OPC, aerosol optical theory, published literature, and the systematic underestimation observed in the experimental results. Direct analyses of aerosol density, refractive index, and chemical composition will be incorporated in future studies to further quantify the contribution of these factors.
3.2.2. Correction Coefficients
To quantify this variability and enable accurate data reporting, correction coefficients (
) were computed using Equation (7). The results are summarized in
Table 1. The DustTrak photometer exhibited high accuracy with a correction coefficient of 0.97, indicating that its direct readings are very close to the gravimetric reference values under the tested conditions. Infrared spectrophotometry required a correction coefficient of 1.32. The Promo 3000 OPC (>0.3 μm) showed the largest deviation, requiring a correction coefficient of 2.13. These coefficients were critical for calibrating real-time monitoring data in this experiment and provide a reference for the rapid detection and correction of cooking fume concentrations in practical engineering applications.
To further evaluate the statistical reliability of the correction coefficients, the mean value, standard deviation (SD), relative standard deviation (RSD), and 95% confidence interval (CI) were calculated for each measurement method based on the correction coefficients obtained under the five airflow rates. The mean correction coefficients were 1.320 ± 0.007 for infrared spectrophotometry, 2.134 ± 0.021 for the Promo 3000 OPC (>0.3 μm), and 0.974 ± 0.009 for the DustTrak photometer. The corresponding 95% CIs were 1.31–1.33, 2.11–2.16, and 0.96–0.99, respectively. The low RSD values, ranging from 0.54% to 0.97%, indicate good repeatability and stability of the correction coefficients. A two-way ANOVA further revealed significant differences among measurement methods (p < 0.001), whereas airflow rate did not significantly affect the correction coefficients (p = 0.134 > 0.05). These statistical results further support the repeatability, robustness, and internal consistency of the proposed correction factors.
Further analysis was conducted to elucidate the reasons why the cooking fume concentrations measured by the infrared spectrophotometric method accounted for only 75.6% of the values obtained by the benchmark manual gravimetric method. General discrepancies in aerosol measurements typically stem from factors such as sampling and transmission losses, detector response sensitivity, recombination errors, and variations in particle density and physical properties [
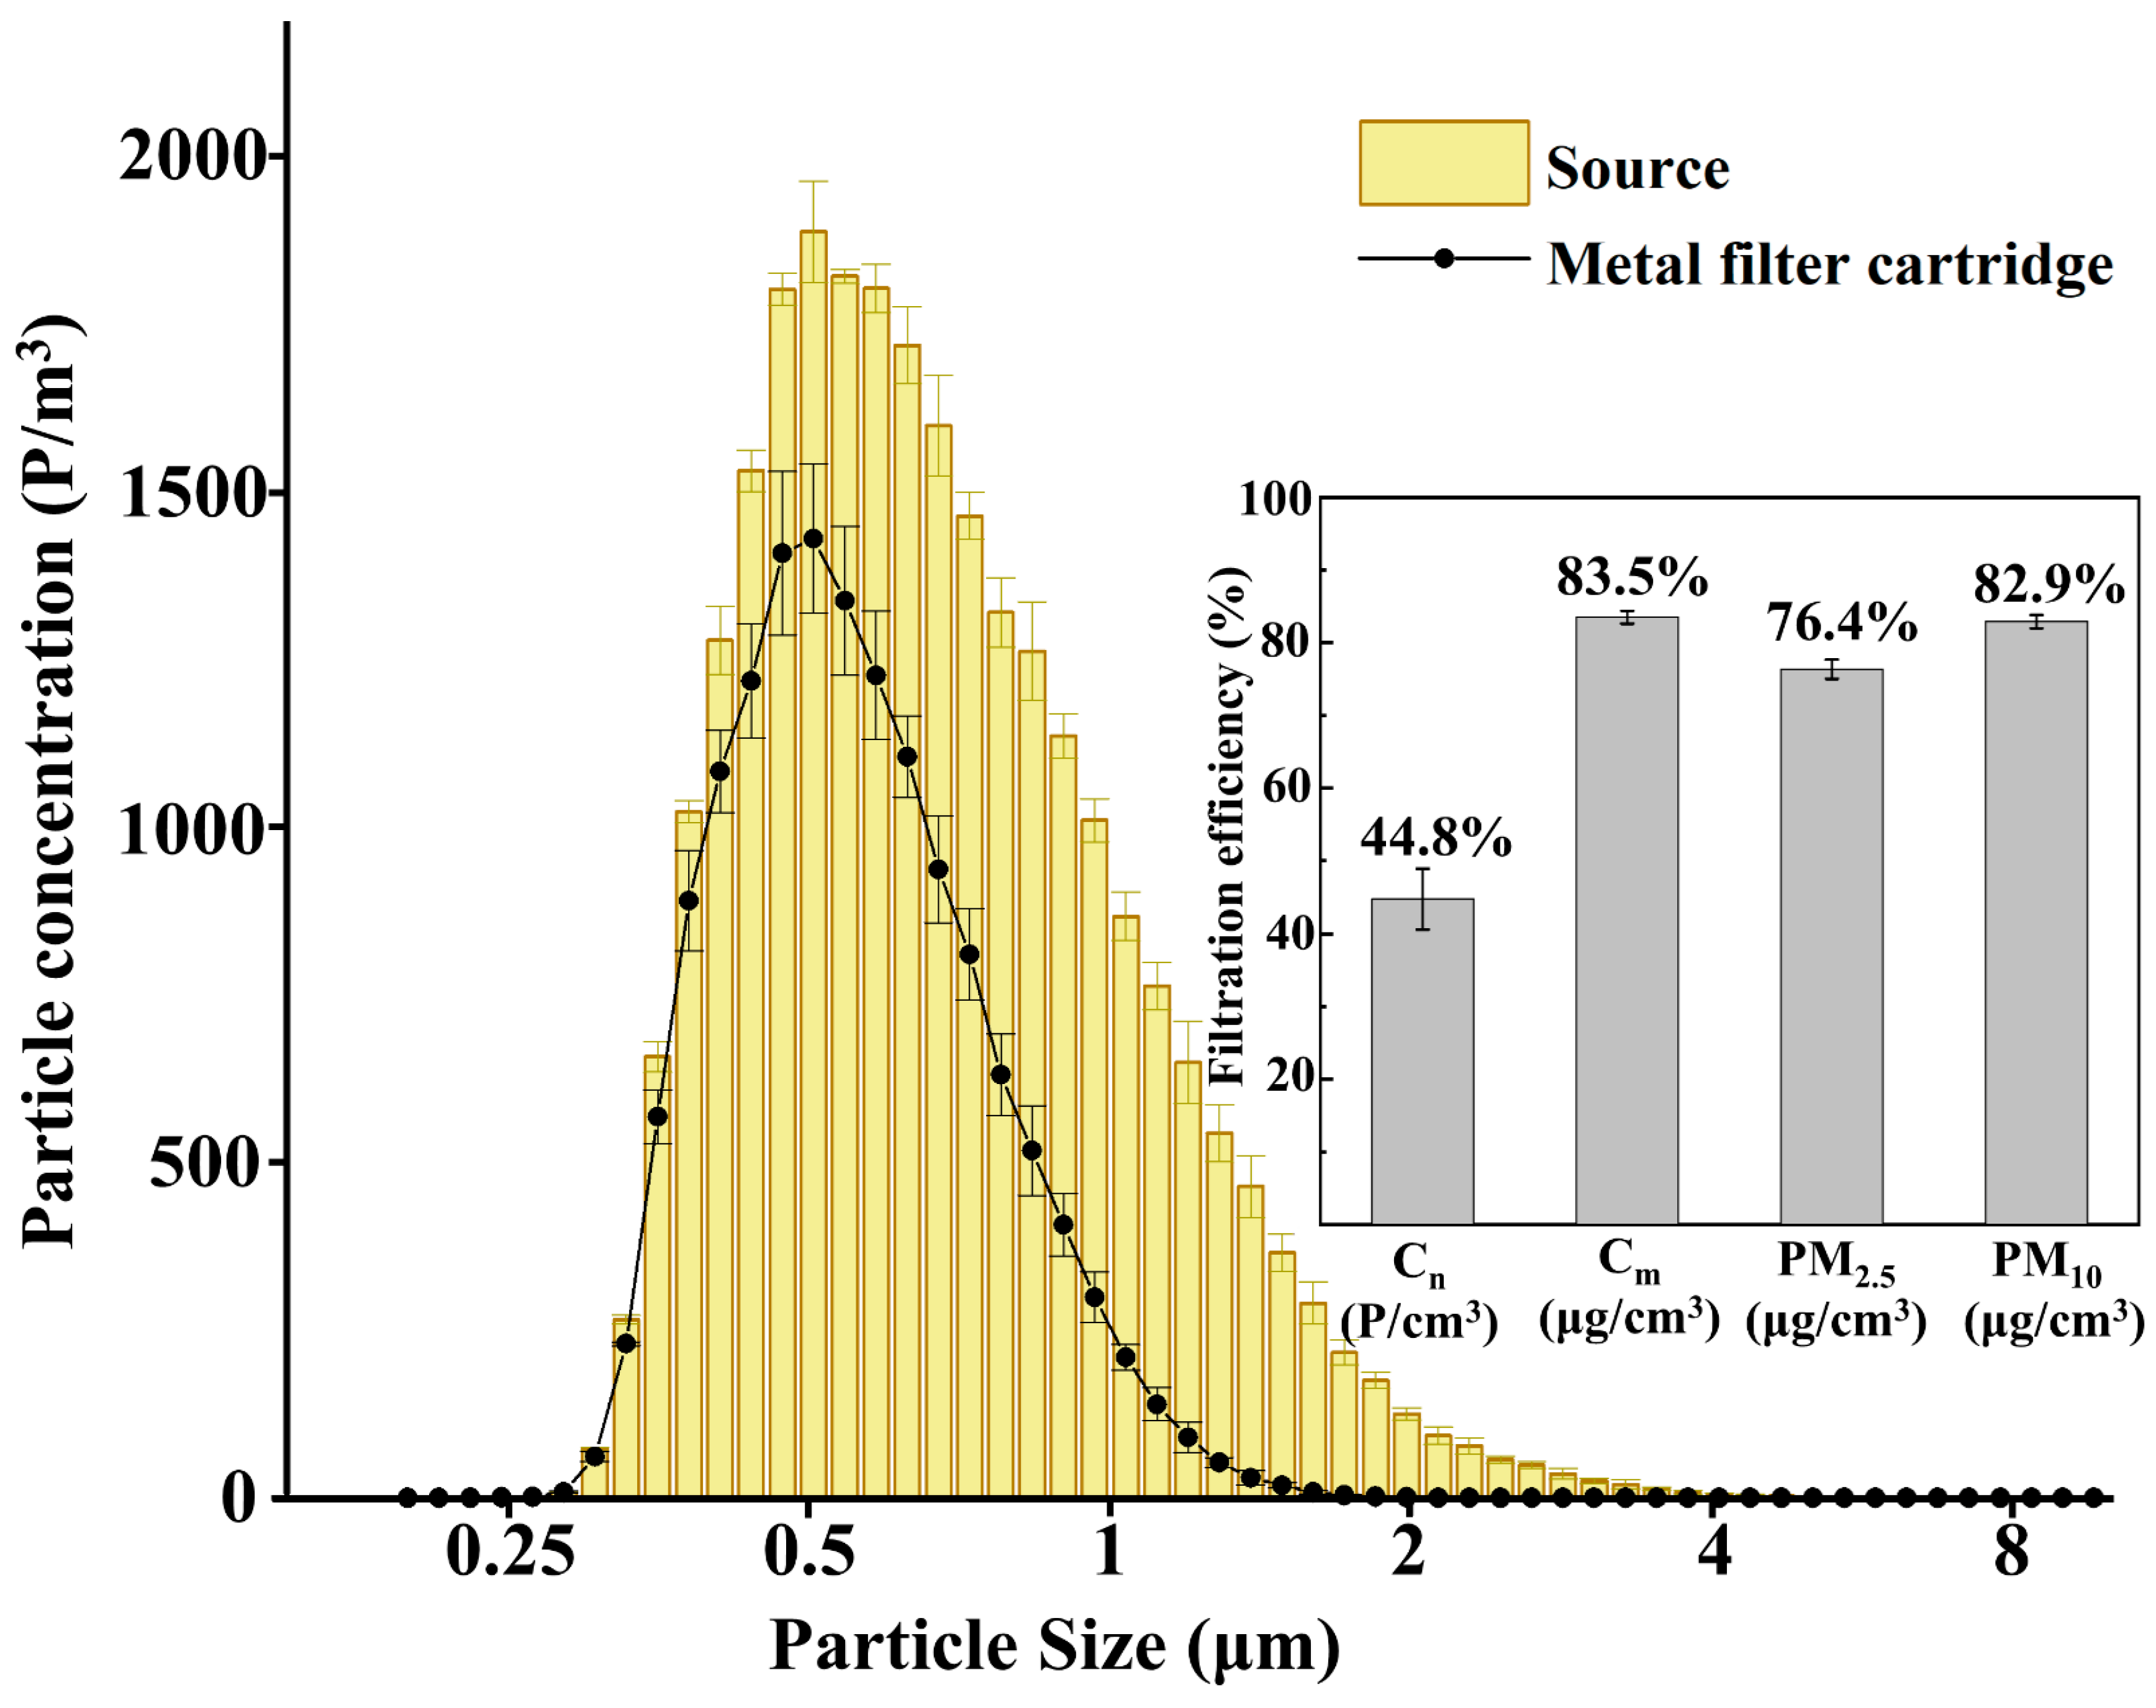
33]. To investigate specific causes, the collection efficiency of the sampling cartridge used in the infrared spectrophotometer was evaluated by measuring concentrations upstream and downstream of the device, as shown in
Figure 8. The results indicated notable capture losses. The number collection efficiency for total particulate matter > 0.3 μm was only 44.8%. The efficiency dropped to 19.1% for fine particles in the 0.3–0.5 μm range, whereas for particles > 0.5 μm, the efficiency improved to 56.5%. In terms of mass, the total mass collection efficiency of the cartridge for particles > 0.3 μm was 83.5%. This implies that approximately 16.5% of the particulate mass penetrated the cartridge and is not detected by the infrared method.
Furthermore, the composition of the particulate matter contributes to the discrepancy. The manual gravimetric method measures the total mass of all collected matter, including oil droplets and solid impurities. In contrast, infrared spectrophotometry selectively detects C-H bonds specific to oil. Non-oily impurities present in cooking fumes, such as carbonized ash or dust, contribute to the gravimetric weight but do not absorb infrared light at the characteristic wavenumbers. Consequently, the combination of sampling cartridge inefficiency (mass loss) and the exclusion of non-oil components (detection selectivity) results in the lower concentration values observed with the infrared method.
3.3. Filtration Efficiency Measured by Different Instruments
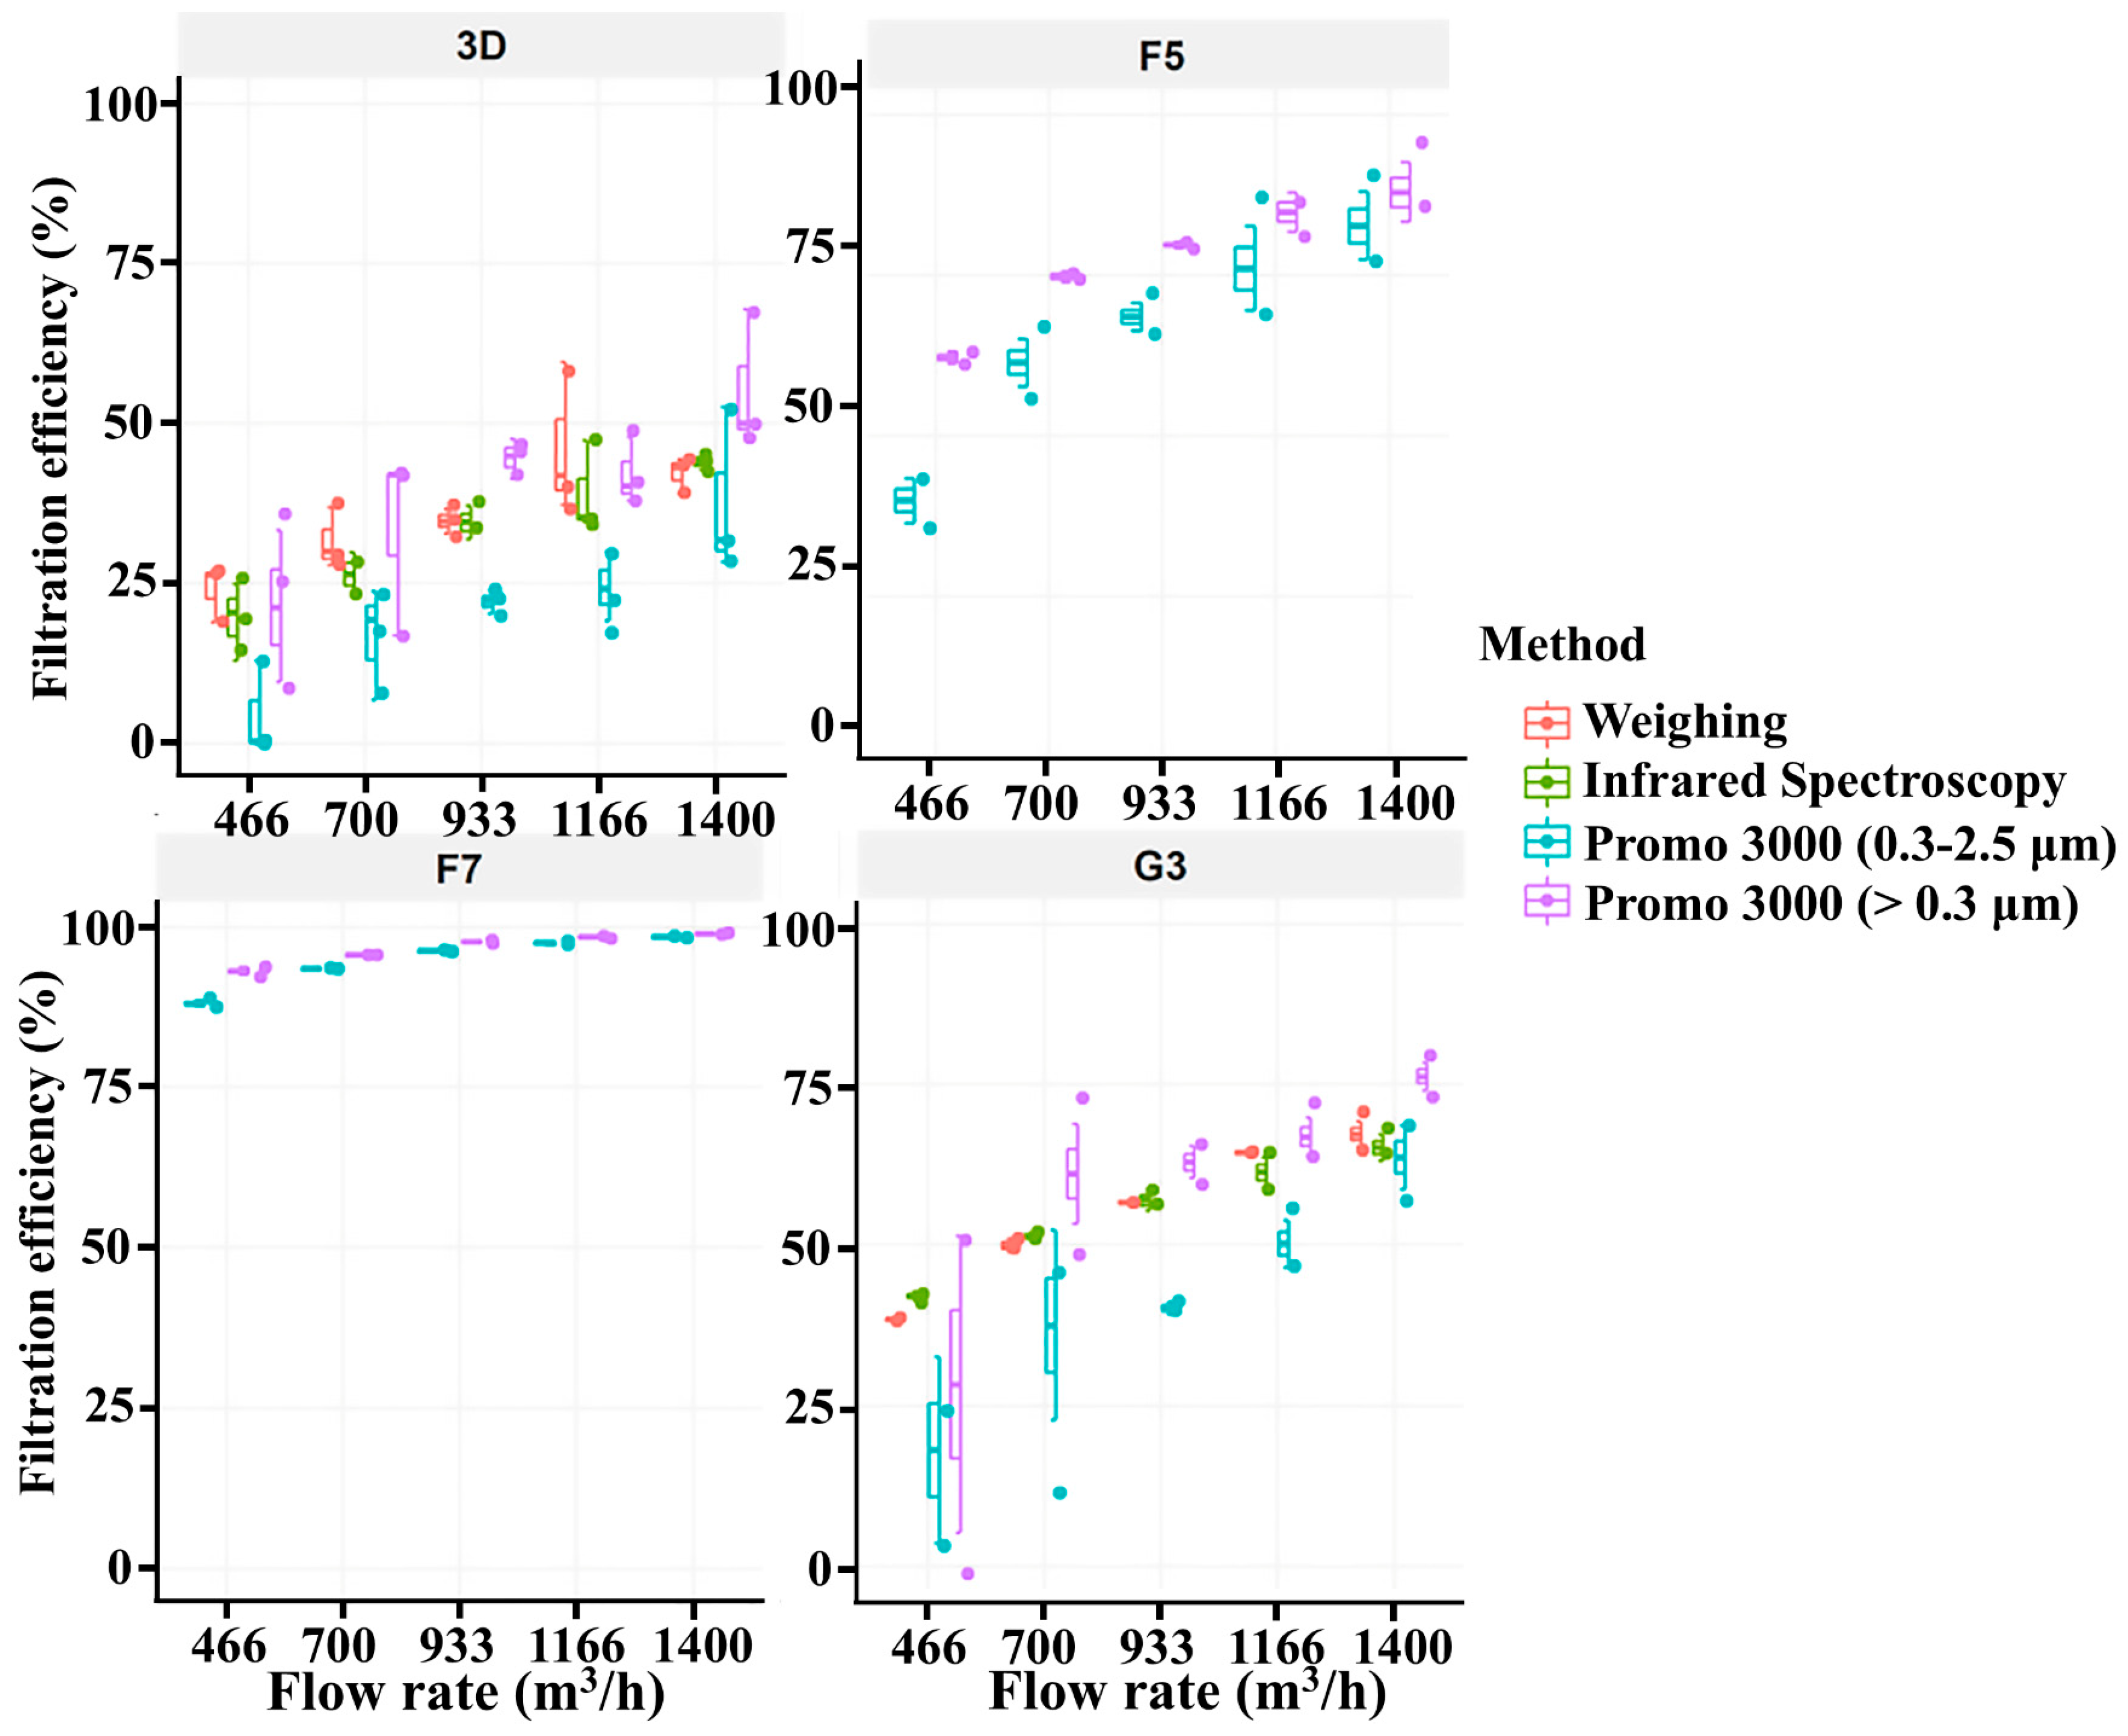
Figure 9 presents the filtration efficiencies of various filter media for cooking fume particles under different airflow rates, comparing the results obtained via the manual gravimetric method, infrared spectrophotometry, and the OPC measurements.
3.3.1. Efficiencies of Filters
For high-efficiency filters such as F5 and 3D filters, the data obtained from the manual gravimetric method and infrared spectrophotometry exhibit a high degree of overlap. This indicates that the retention capacity of these filters for cooking fume particles is consistent across both total mass detection (gravimetric) and oil-specific detection by infrared spectrophotometry. The observed filtration efficiency aligns well with the theoretical mechanisms described by Equation (5), where high-efficiency retention is achieved through the combined effects of diffusion, interception, and inertial impaction.
For coarse filters such as G3, the subplots reveal significant discrepancies among the measurement methods. The larger pore size and specific surface characteristics of the G3 media result in a lower retention rate for fine particles and non-oil particles such as inorganic aerosols. This contributes to data divergence between the measurement methods, particularly because infrared spectrophotometry selectively detects oil-related organic components and may not fully account for inorganic or carbonaceous particle mass. These correction coefficients are required to eliminate the bias caused by incomplete component detection and method-dependent response.
3.3.2. OPC Measurement Characteristics
The filtration efficiency measured by the OPC was strongly influenced by particle size and airflow rate. For the G3 filter, the filtration efficiency for fine particles (0.3–2.5 μm) was low (<50%) at low flow rates. However, this efficiency increased to 75–100% at higher flow rates. This phenomenon is attributed to the enhancement of inertial impaction at higher velocities, reflecting the filter’s sensitivity to operating conditions.
For the F7 filter, the filtration efficiency was nearly 100% for all particles >0.3 μm, indicating strong correlation between filtration performance, filter pore size, and particle diameter. Overall, the G3 filter exhibited weak capture capacity for fine particles (<5 μm). Consequently, the efficiency detected by the OPC for the 0.3–2.5 μm range was significantly lower than that for coarse particles (>5 μm). This highlights the necessity of applying particle size-segmented corrections when evaluating filtration efficiency using optical counting methods.
4. Discussion
The correction coefficients proposed in this study provide a practical approach for converting measurements obtained from different monitoring instruments into gravimetric-equivalent cooking-fume concentrations. Under operating conditions similar to those investigated in this study, the correction coefficients can be applied directly to improve the consistency and comparability of monitoring results. A correction coefficient of 2.13 is recommended for the Promo 3000 OPC (>0.3 μm), 1.32 for infrared spectrophotometry, and 0.97 for the DustTrak photometer.
However, these correction coefficients should not be considered universal constants. Their values are instrument-specific and aerosol-specific because they depend on particle size distribution, density, refractive index, chemical composition, morphology, and volatility. Therefore, the coefficients are expected to be most applicable to cooking aerosols with physicochemical characteristics similar to those generated in this study.
The practical applicability and limitations of the proposed correction factors should also be considered. The correction coefficients reported in this study were derived under controlled laboratory conditions using cooking fumes generated from corn-oil at a fixed generation temperature of 260 °C. Corn oil was selected because it is a commonly used edible oil and can generate stable cooking-fume aerosols under controlled heating conditions, which is beneficial for comparing different measurement instruments under repeatable experimental conditions. Nevertheless, various edible oils may generate aerosols with different particle size distributions, densities, refractive indices, chemical compositions, and semi-volatile fractions. Previous studies have shown that aerosol emissions from cooking processes are influenced by oil type, cooking method, and heating conditions [
22,
34,
35,
36], which may alter aerosol optical properties and consequently affect instrument responses and the corresponding correction coefficients.
The concentration range used in this study should also be considered when applying the proposed correction coefficients. In the present experiments, the cooking-fume concentration was controlled within 5–20 mg/m3 to ensure stable aerosol generation and reliable comparison among different measurement methods. At lower concentrations, the performance of both optical and gravimetric methods may change. For optical instruments, reduced particle number concentrations can decrease the signal-to-noise ratio and increase the relative influence of background particles, zero drift, and instrumental detection limits. For gravimetric measurements, the collected particle mass may become small, making weighing uncertainty more important relative to the measured mass. In addition, correction relationships for optical PM measurements may become concentration-dependent, meaning that a single linear correction coefficient may not fully describe instrument behavior across a wide concentration range. Therefore, the correction coefficients obtained in this study should be regarded as most applicable to cooking-fume concentrations within or close to the tested range of 5–20 mg/m3. When these coefficients are applied to lower-concentration residential kitchen environments, additional validation or recalibration is recommended. Future studies should further evaluate the concentration dependence of correction coefficients over a wider range of cooking-fume concentrations.
Environmental conditions may also affect measurement performance. Elevated relative humidity can alter particle size through hygroscopic growth and modify aerosol optical properties, thereby influencing light-scattering-based measurements. Furthermore, real residential and commercial kitchens typically exhibit transient emission patterns, fluctuating cooking temperatures, variable ventilation rates, mixed aerosol sources, and different fuel types, which may differ substantially from the controlled conditions employed in this study. Under such circumstances, additional calibration may be required before directly applying the correction coefficients reported here. It should be noted that the correction coefficients reported in this study are instrument-specific and were derived under controlled laboratory conditions. Their numerical values may vary with instrument design, calibration protocol, aerosol composition, particle size distribution, and environmental conditions. Therefore, the coefficients should be regarded as baseline calibration factors. The principal contribution of this work is the establishment of a gravimetric-reference-based correction framework that can be adapted to other monitoring instruments through parallel calibration measurements under representative operating conditions. Despite these limitations, cooking aerosols generated from commonly used edible oils are generally dominated by organic liquid droplets and submicron particles, suggesting that the correction factors obtained in this study provide useful reference values for cooking-fume monitoring and instrument calibration under similar operating conditions. Therefore, the proposed coefficients should be regarded as reference calibration values rather than universally applicable conversion constants. Future studies should further evaluate their applicability across different cooking oils, humidity levels, cooking styles, fuel sources, and real kitchen environments to establish more broadly applicable calibration relationships.
5. Conclusions
(1) Particle Size Distribution Characteristics
Data from the Promo 3000 Optical Particle Counter reveal distinct distribution patterns across all the tested airflow conditions. The number concentration exhibits a unimodal peak at 0.50 μm, with fine particles in the range of 0.3–1.0 μm accounting for 80.3% of the total count. Conversely, the mass concentration peaks at 2.3 μm, with medium-sized particles in the range of 1–4 μm contributing 73.1% of the total mass. This profile is characterized by a numerical dominance of sub-micron particles contrasted with a mass dominance of medium-sized particles. These findings corroborate observations from real-world cooking fume studies by Gao et al. [
33] and Wallace et al. [
10]. Furthermore, the use of an oil temperature of 260 °C reasonably simulated actual high-temperature frying conditions, supporting the reliability and representativeness of the experimental data.
(2) Bias Mechanisms and Correction Coefficients
Systematic biases arising from differing detection principles were quantified using the manual gravimetric method as the benchmark reference. The Promo 3000 OPC substantially underestimated gravimetric concentration for particles > 0.3 μm, requiring a correction coefficient k = 2.13. This deviation is primarily attributed to discrepancies in refractive index and particle density between the calibration aerosols and the actual cooking fume droplets.
Infrared Spectrophotometry yielded measurements equivalent to 75.6% of the gravimetric mass concentration, corresponding to a correction coefficient k = 1.32. This underestimation resulted from the method’s selectivity for organic components, because inorganic mass was not fully detected (e.g., carbonized ash).
The DustTrak 8533 aerosol photometer exhibited the closest agreement with the reference method, with a correction coefficient k = 0.97, indicating that its light-scattering response model closely matched the characteristics of cooking fume particles.
(3) Engineering Application and Scientific Significance
The correction system established in this study enables measurements obtained from diverse techniques, including optical particle counting, infrared spectrophotometry, and photometric monitoring, to be normalized using a unified gravimetric reference method. This approach resolves the issue of data incomparability caused by different instrument principles. By considering airflow rate and particle size resolved characteristics, this study provides useful parameters for the calibration of monitoring equipment in both laboratory and field settings. Overall, these findings provide a scientific basis for improving the reliability of environmental monitoring data and can support more precise pollution control, health risk assessment, and the selection of air purification technologies in the catering industry.