1. Introduction
Externally prestressed steel–concrete composite I-beams (EPCIBs) have attracted increasing attention in bridge engineering and structural rehabilitation because they combine the high tensile resistance of steel, the compressive efficiency of concrete, and the serviceability advantages provided by external prestressing. Compared with conventional composite systems, external prestressing can improve flexural capacity, reduce deflections, delay cracking in concrete slabs, and enhance structural efficiency without substantial increases in member self-weight or cross-sectional dimensions. Consequently, EPCIBs have been investigated using experimental, analytical, and numerical approaches to understand their structural behavior under positive and negative bending moments.
Early analytical investigations by Saadatmanesh et al. [
1] examined externally prestressed composite I-beams subjected to positive and negative bending moments under different prestressing levels. Their work demonstrated that external tendons primarily improve yield behavior and ultimate capacity, while prestressing in negative moment regions significantly delays cracking in concrete slabs. Although the study provided important insight into the mechanics of prestressed composite members, the analytical formulation relied on simplified assumptions that limited its applicability to broader nonlinear response prediction and parametric evaluation.
Experimental research by Ayyub et al. [
2] further investigated the influence of tendon configuration and tendon type on prestressed composite girders. Their results confirmed that external prestressing substantially enhances yield and ultimate resistance, while draped tendons improve ductility compared with straight tendons. The accompanying analytical approaches, including transformed-section and strain-compatibility methods, showed acceptable agreement with experiments. However, the study primarily focused on a limited number of beam configurations, restricting the generalization of the observed trends across wider geometric and material ranges.
Chen and Gu [
3] experimentally and analytically studied composite beams prestressed with external tendons under positive bending moments. Their simplified analytical formulation accurately predicted tendon stress increments and ultimate strength, confirming the effectiveness of prestressing in improving structural performance. Nevertheless, their approach mainly emphasized ultimate response prediction and did not provide a generalized framework capable of systematically accounting for broader nonlinear material behavior or extensive parametric variations.
Lorenc and Kubica [
4] experimentally evaluated externally prestressed composite beams with different tendon layouts under sagging bending moments. Their results showed approximately 25% enhancement in load capacity, while tendon profile exhibited limited influence at equal eccentricity. Failure was governed by yielding of the steel tension flange followed by concrete crushing. Although the study clarified several important behavioral mechanisms, its conclusions were primarily derived from a relatively small experimental database, emphasizing the continuing need for analytical tools capable of efficiently extending experimental observations to wider design scenarios.
To overcome the limitations associated with full nonlinear structural simulations, Zona et al. [
5] proposed a simplified analytical approach for predicting tendon stress increments and collapse load in externally prestressed composite beams. Their method demonstrated good agreement with nonlinear finite element analyses while significantly reducing computational complexity. Despite these advantages, simplified formulations may not fully capture complex interactions among material nonlinearity, prestressing effects, and section equilibrium across different loading stages.
Finite element modeling has been widely employed to investigate EPCIB behavior. Ibrahim et al. [
6] developed validated ANSYS-based models capable of predicting beam response with satisfactory accuracy. El-Zohairy et al. [
7] introduced a detailed three-dimensional finite element model for externally post-tensioned composite beams and demonstrated that external prestressing increases beam capacity while reducing stress demands in both steel and concrete components. Subsequent work by El-Zohairy and Salim [
8] extended the investigation to evaluate tendon profile, tendon length, fatigue loading, and degree of shear connection. Their findings indicated that trapezoidal tendon configurations provide improved performance, full-length prestressing enhances fatigue resistance, and high shear connection levels are essential for effective strengthening. Although these numerical investigations provided valuable insight into governing behavioral parameters, detailed FE modeling generally requires substantial computational effort and specialized expertise, which may limit its practicality for routine design applications and rapid parametric studies.
Additional experimental and design-oriented studies have further contributed to understanding EPCIB systems. Marcela da Rocha and de Souza [
9] investigated prestressed composite beams with profiled steel decking and observed approximately 19% strength enhancement compared with non-prestressed specimens. Ribeiro et al. [
10] addressed the absence of clear design provisions by developing a computational framework based on international and Brazilian code [
11] methodologies. Their study demonstrated that external prestressing effectively increases flexural strength and reduces deflections but may induce unfavorable compressive stresses in certain steel configurations, particularly monosymmetric sections. Turini and Calenzani [
12] analytically investigated 120 beam models and concluded that tendon eccentricity has limited influence on flexural resistance, whereas prestressing force variations affect negative moment resistance more significantly than positive moment behavior.
Recent developments have focused on improving analytical efficiency while incorporating more advanced behavioral mechanisms. Yan et al. [
13] developed a beam–tendon hybrid model incorporating interfacial slip and unbonded tendon behavior using fiber-beam and slipping-cable elements within the OpenSees platform. Their model provided improved capability for simulating partial interaction and nonlinear flexural response. However, advanced numerical formulations involving multi-degree-of-freedom elements and specialized computational implementation may present challenges for widespread engineering application.
Although previous studies investigated externally prestressed composite beams using experimental, analytical, and FE approaches, most available analytical models remain limited by simplified assumptions regarding tendon compatibility, material nonlinearity, or restricted validation ranges. Moreover, a unified framework capable of combining strain compatibility, nonlinear section analysis, experimental verification, FE comparison, and broad parametric assessment remains insufficiently addressed.
The novelty of this study lies in developing a comprehensive analytical framework for externally prestressed steel–concrete composite beams that integrates nonlinear material behavior, equilibrium-based section analysis, partial tendon compatibility considerations, experimental validation, FE verification, and systematic parametric evaluation.
The model employs strain compatibility and equilibrium principles to derive closed-form solutions for deflection and load capacity. The proposed method is validated against published experimental results and a developed FE model. Furthermore, a parametric study is conducted to assess the model performance under different tendon layouts and loading conditions. This analytical framework offers a simple yet accurate tool that can support both research and practical design applications for EPCIBs.
3. FEM Description
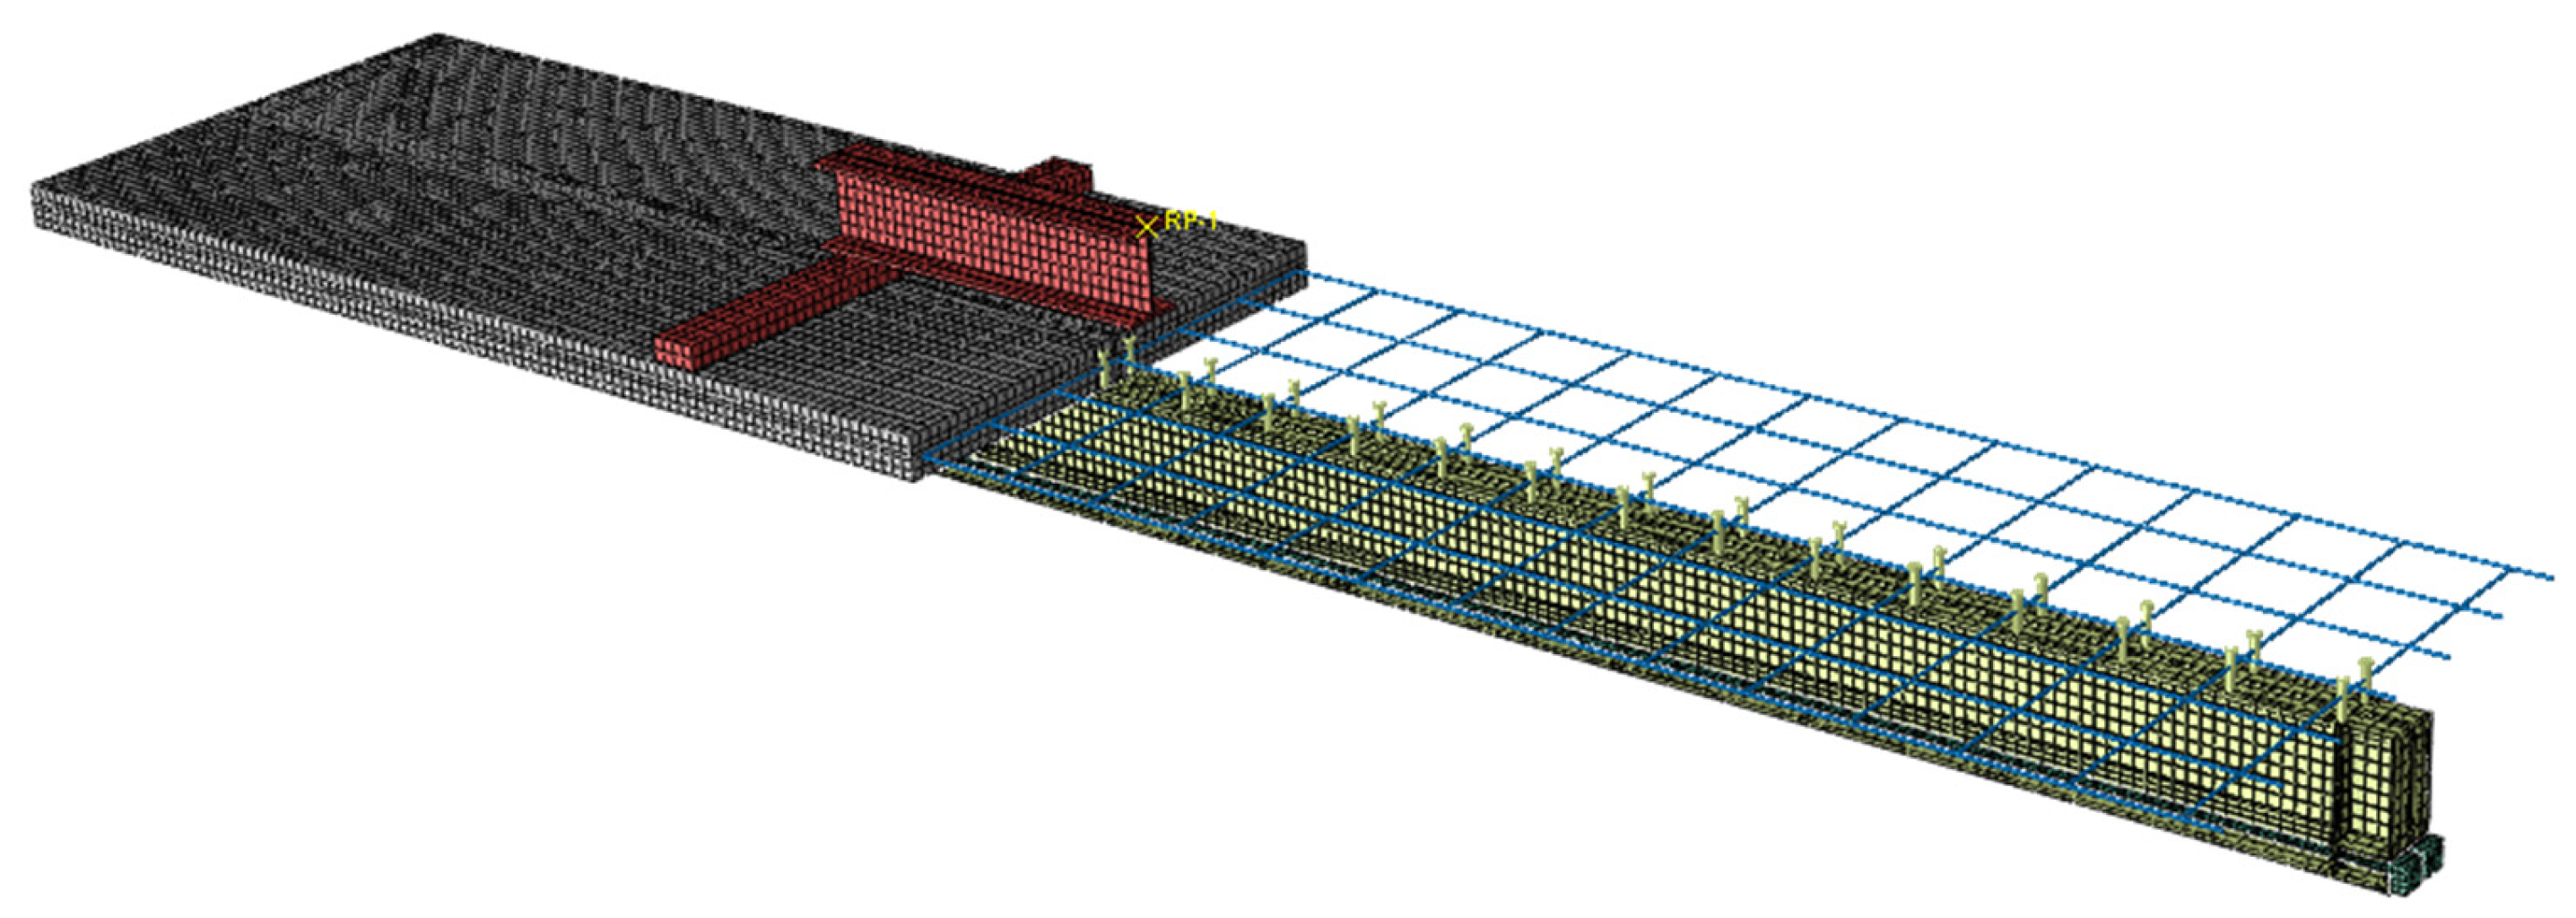
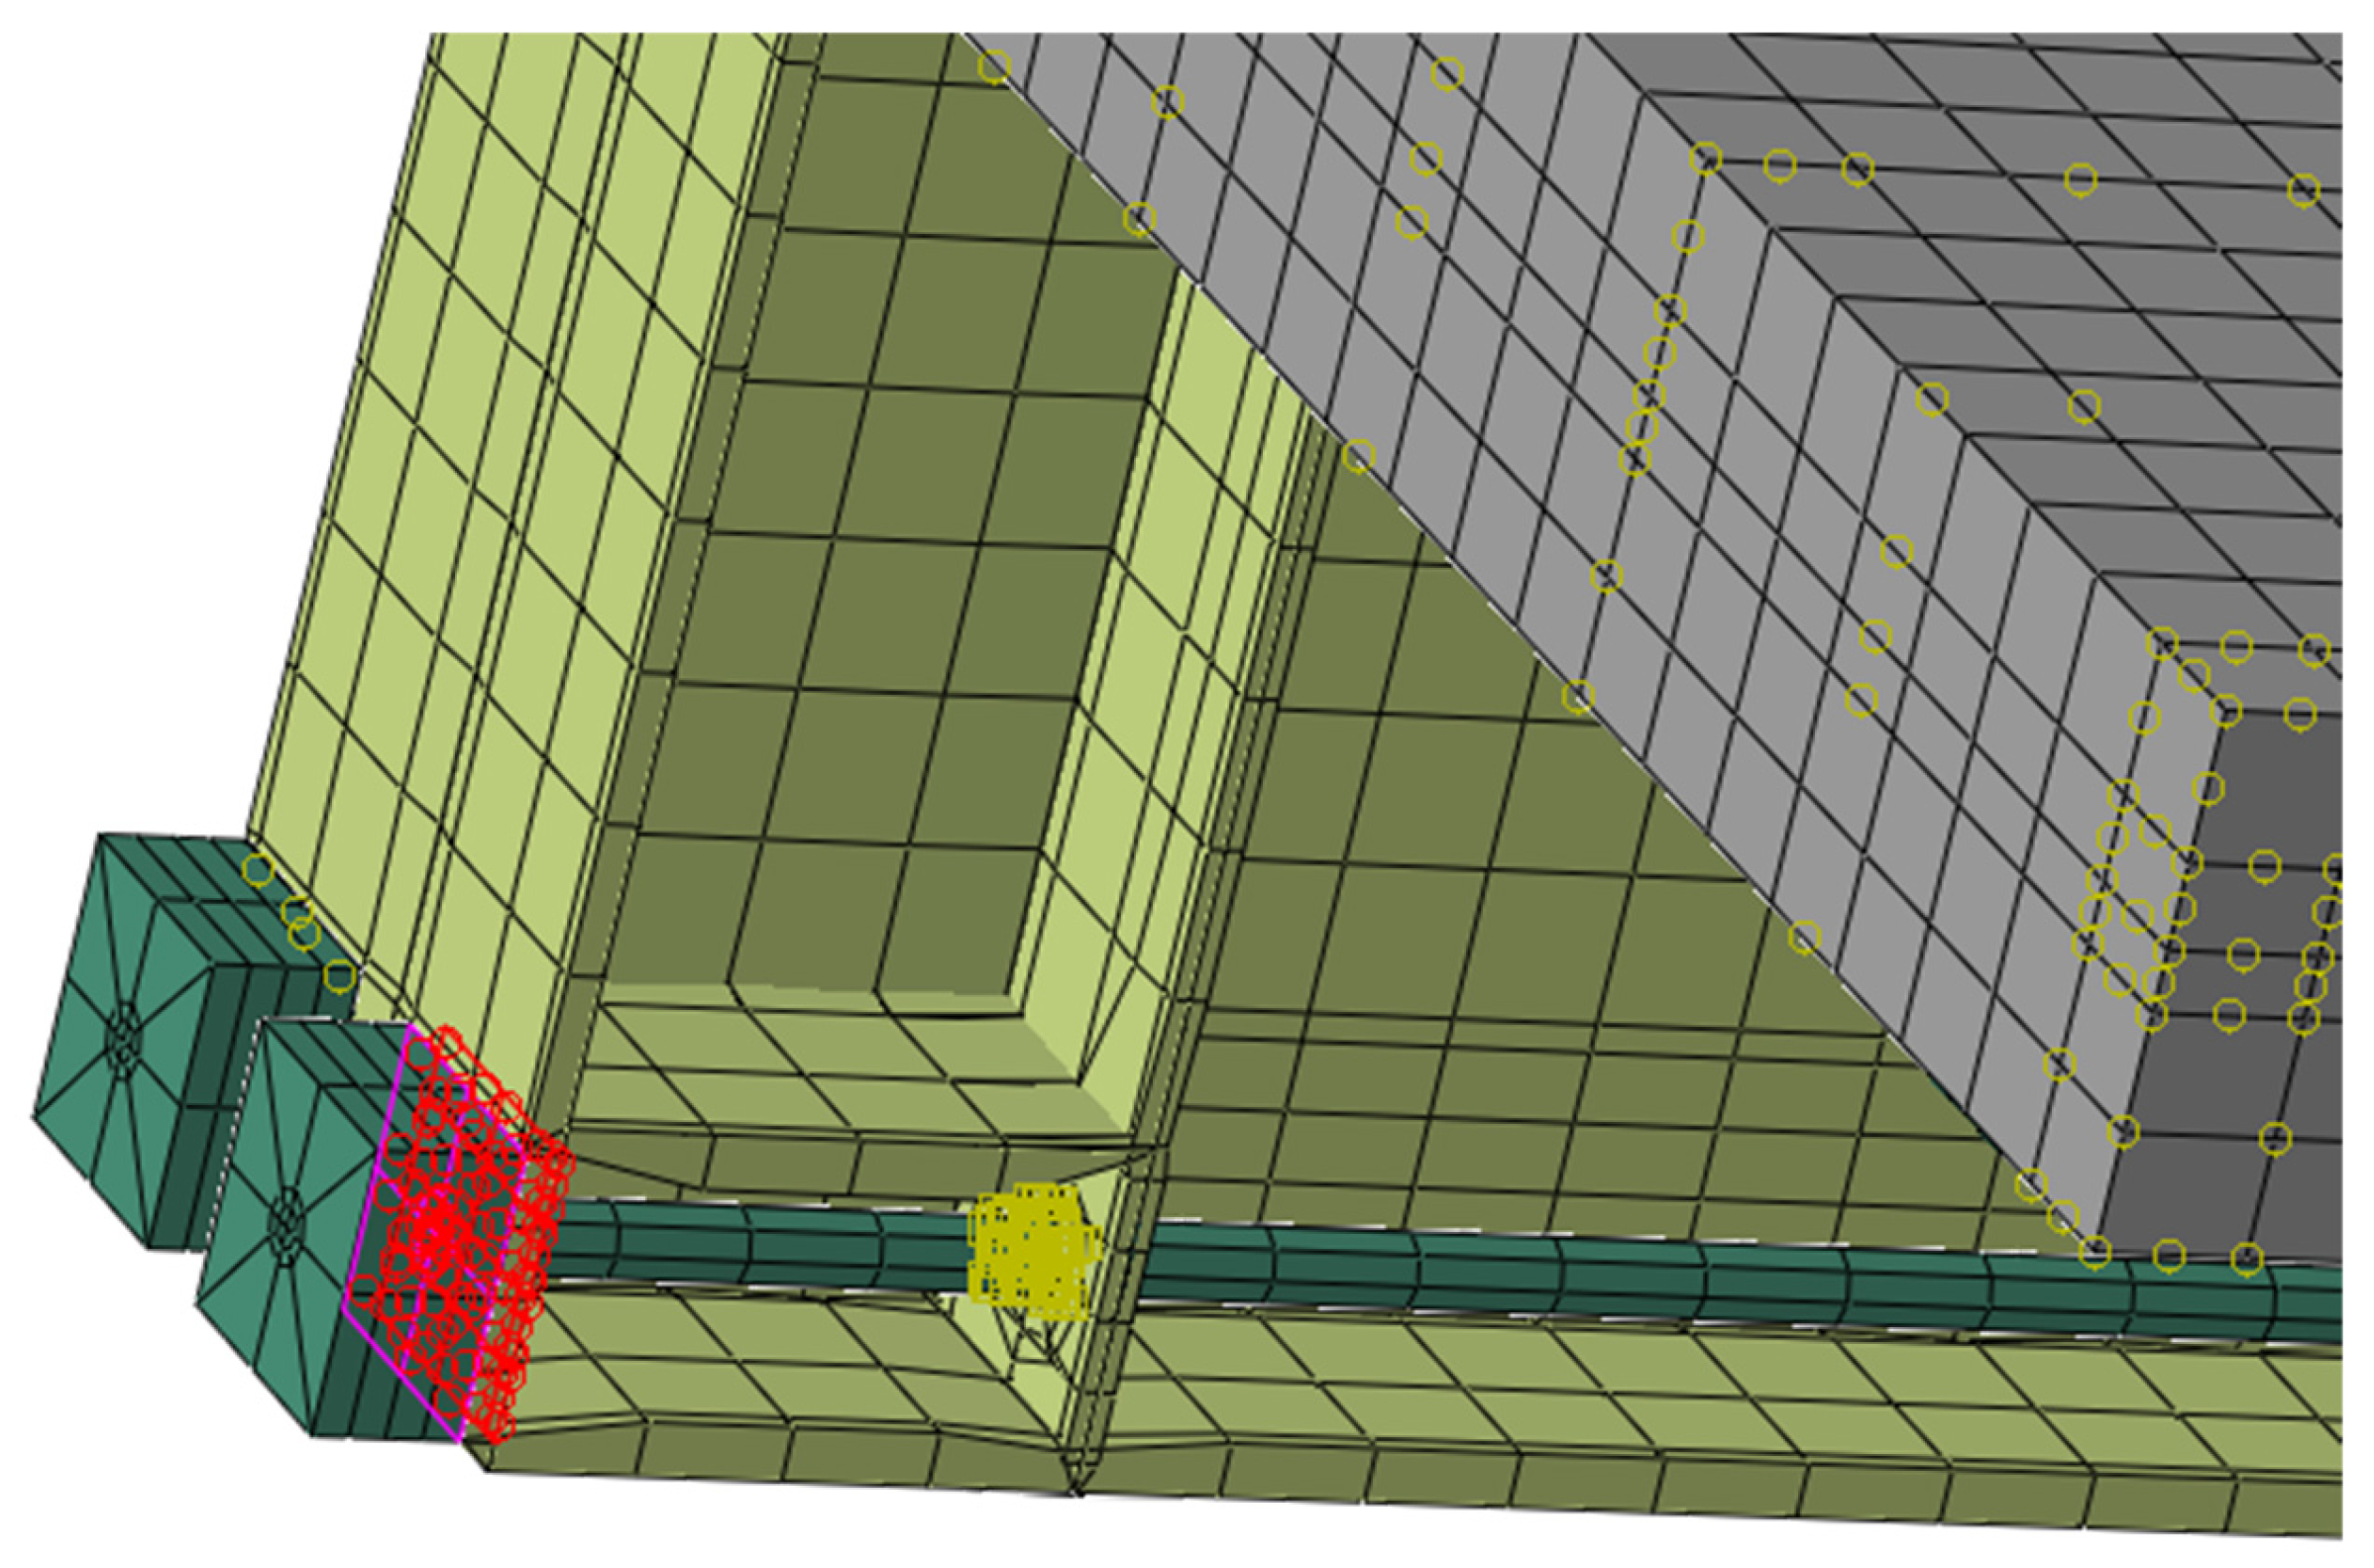
Nonlinear finite element simulations were conducted using the Abaqus/CAE software package (2016). A dynamic implicit solution scheme was employed for the analysis. The model components were discretized with the following element types (
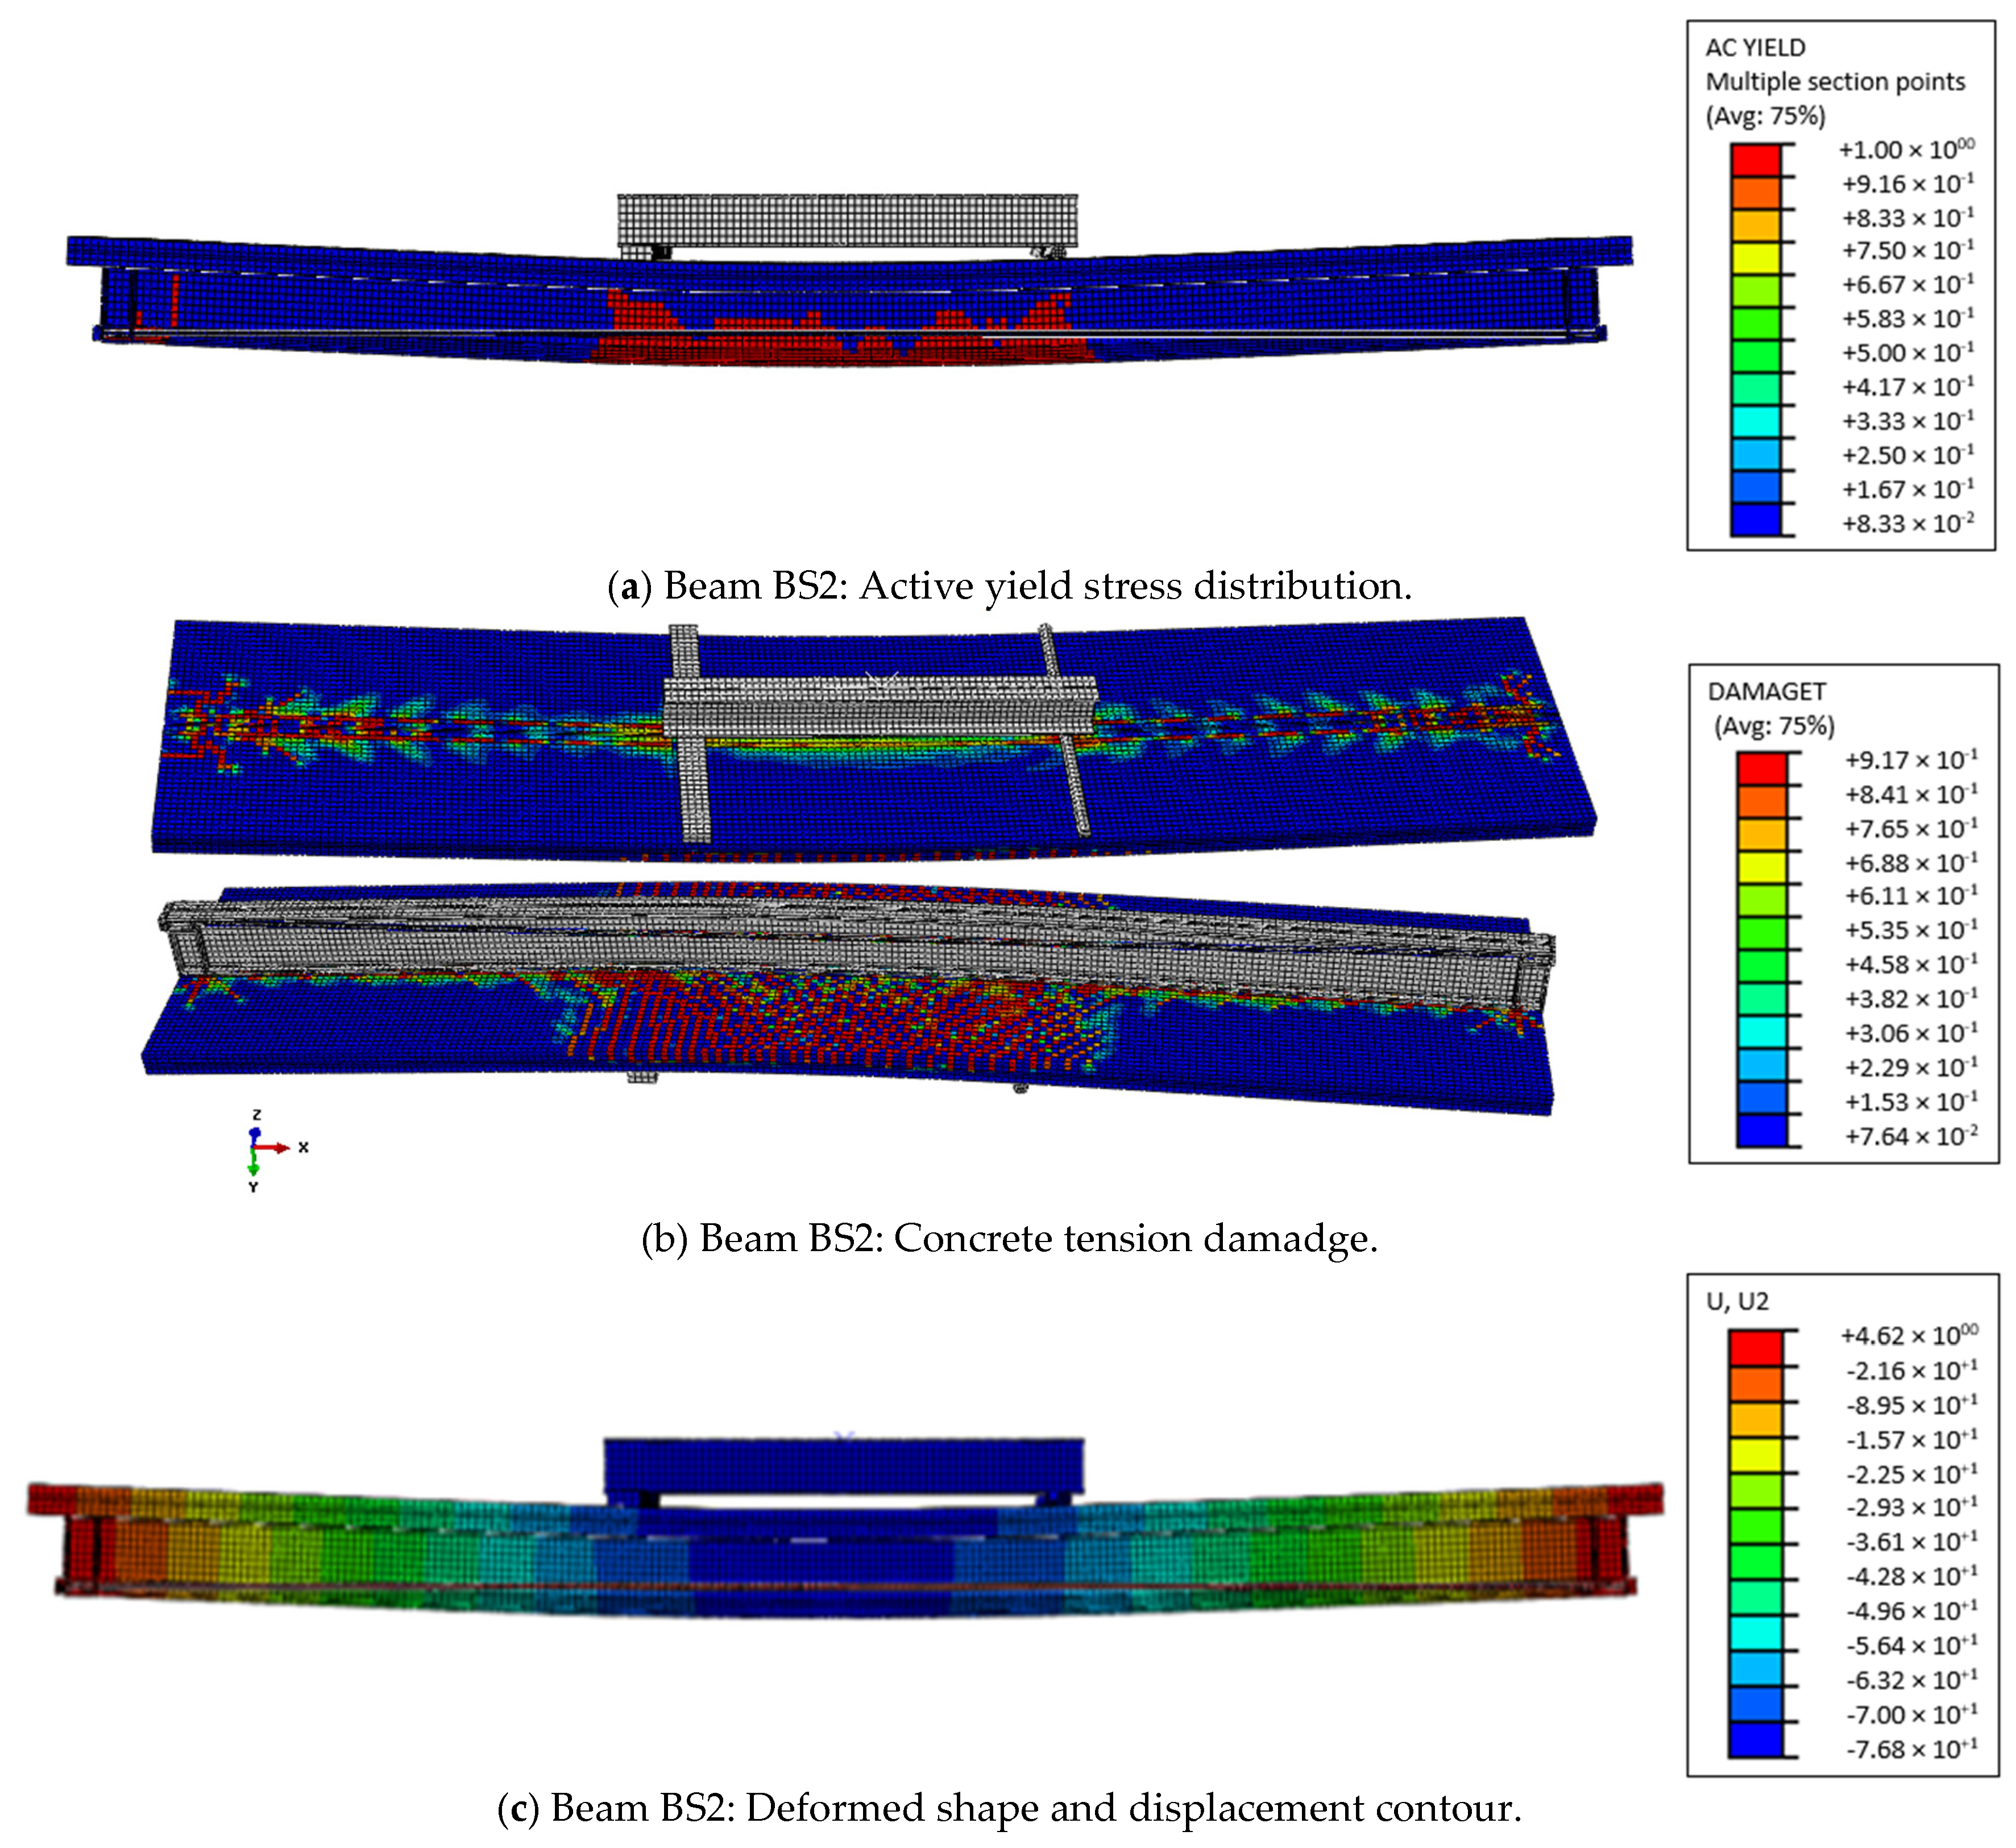
Figure 8): the concrete slab, tendons, and anchors were modeled with 3D solid elements (C3D8R); the steel beam was meshed using quadrilateral and triangular shell elements (S4R and S3); steel reinforcement was represented with truss elements (T3D2); and shear connectors were modeled using beam elements (B31). A mesh sensitivity assessment was carried out to ensure a proper balance between numerical accuracy and computational efficiency. Several mesh refinements were examined, and it was observed that further reduction in element size led to only minor variations in the load–deflection response. Accordingly, a uniform mesh size of 25 mm was adopted in all analyses, as it provided stable and converged results while maintaining reasonable computational cost. The interaction between the steel beam and the concrete slab, as well as between the tendons and stiffeners, was simulated with a surface-to-surface contact. For the steel beam–concrete slab interface, hard contact was assigned in the normal direction, while a penalty friction formulation with a friction coefficient of 0.4 was adopted in the tangential direction to represent the steel–concrete interaction behavior. Similarly, the interaction between the prestressing tendons and steel stiffeners was modeled using hard contact in the normal direction and a penalty friction formulation with a tangential friction coefficient of 0.2 to simulate the steel-to-steel contact behavior.
A tie constraint was applied to connect the anchor surfaces of the tendons to the end stiffeners (
Figure 9). The load was applied as a displacement at a reference point, which was coupled to the beam via a rigid body constraint. The interactions between the concrete slab and both the steel rebars and shear studs were simulated by embedded region constraint. The analyzed beams were modeled as simply supported systems using a hinge and a roller support. At the hinged support, all translational degrees of freedom were restrained, while at the roller support, translational restraints were applied in the vertical and transverse directions, allowing longitudinal movement. The analysis was carried out in two sequential steps. In the first step, the prestressing force was applied to the tendons, while in the second step, the external loading was applied to simulate the loading stage of the test.
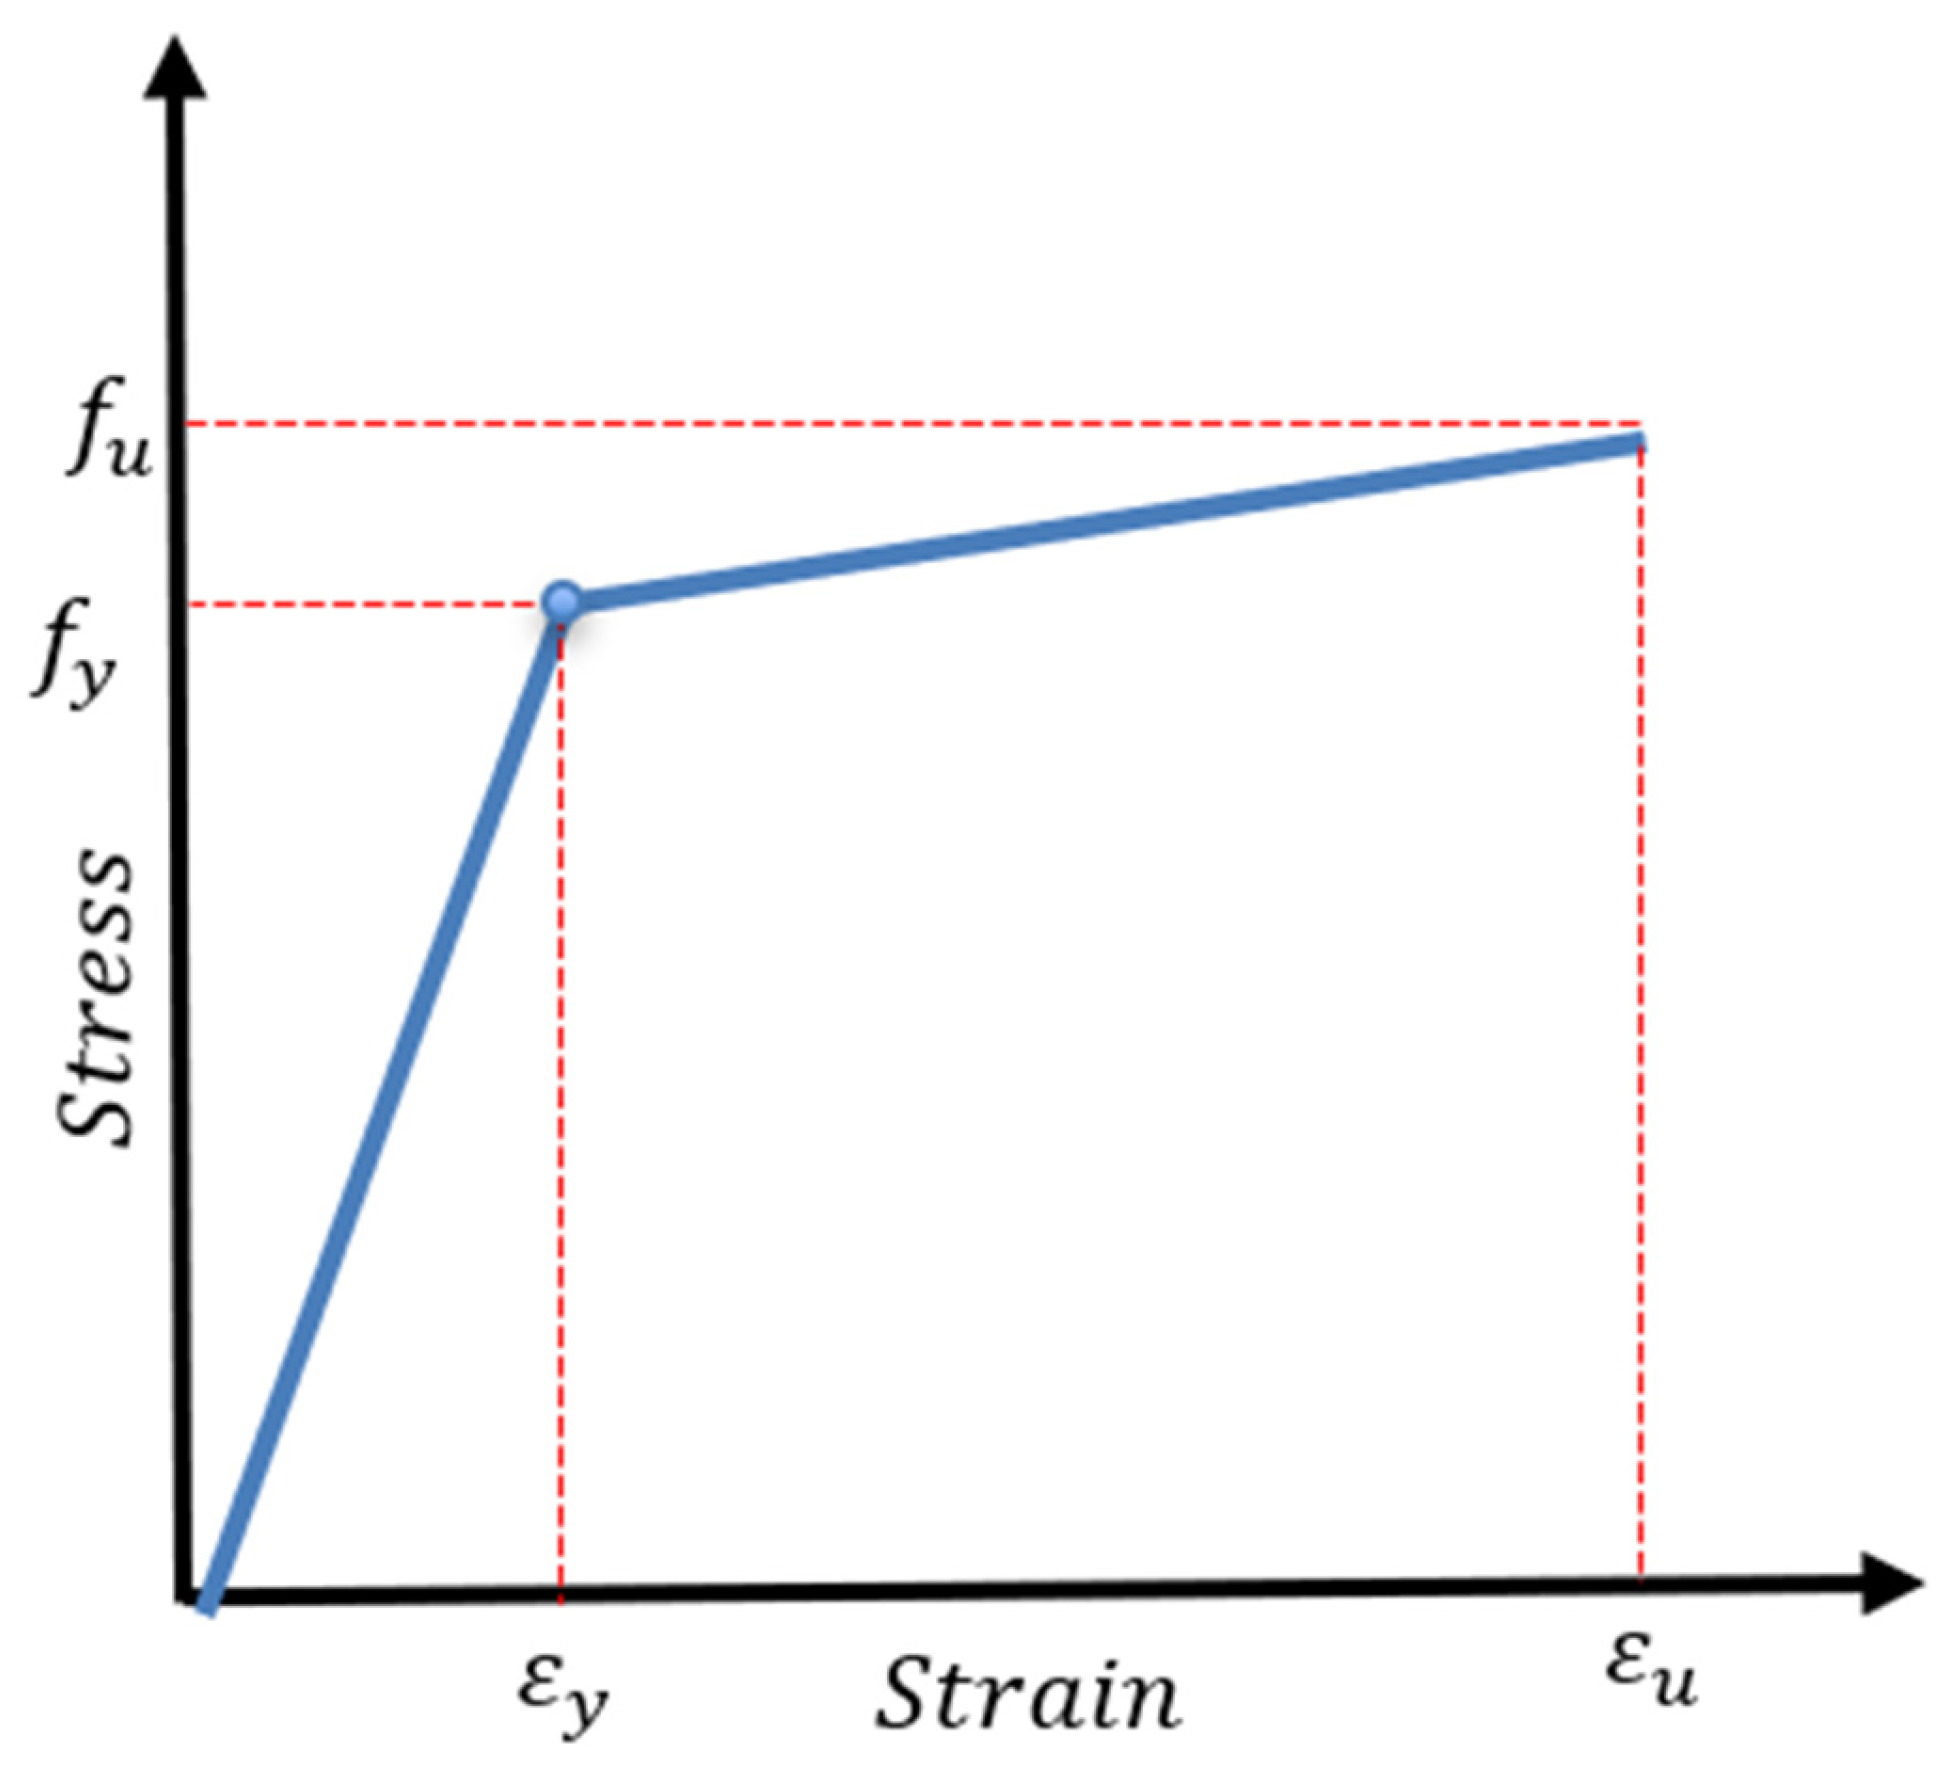
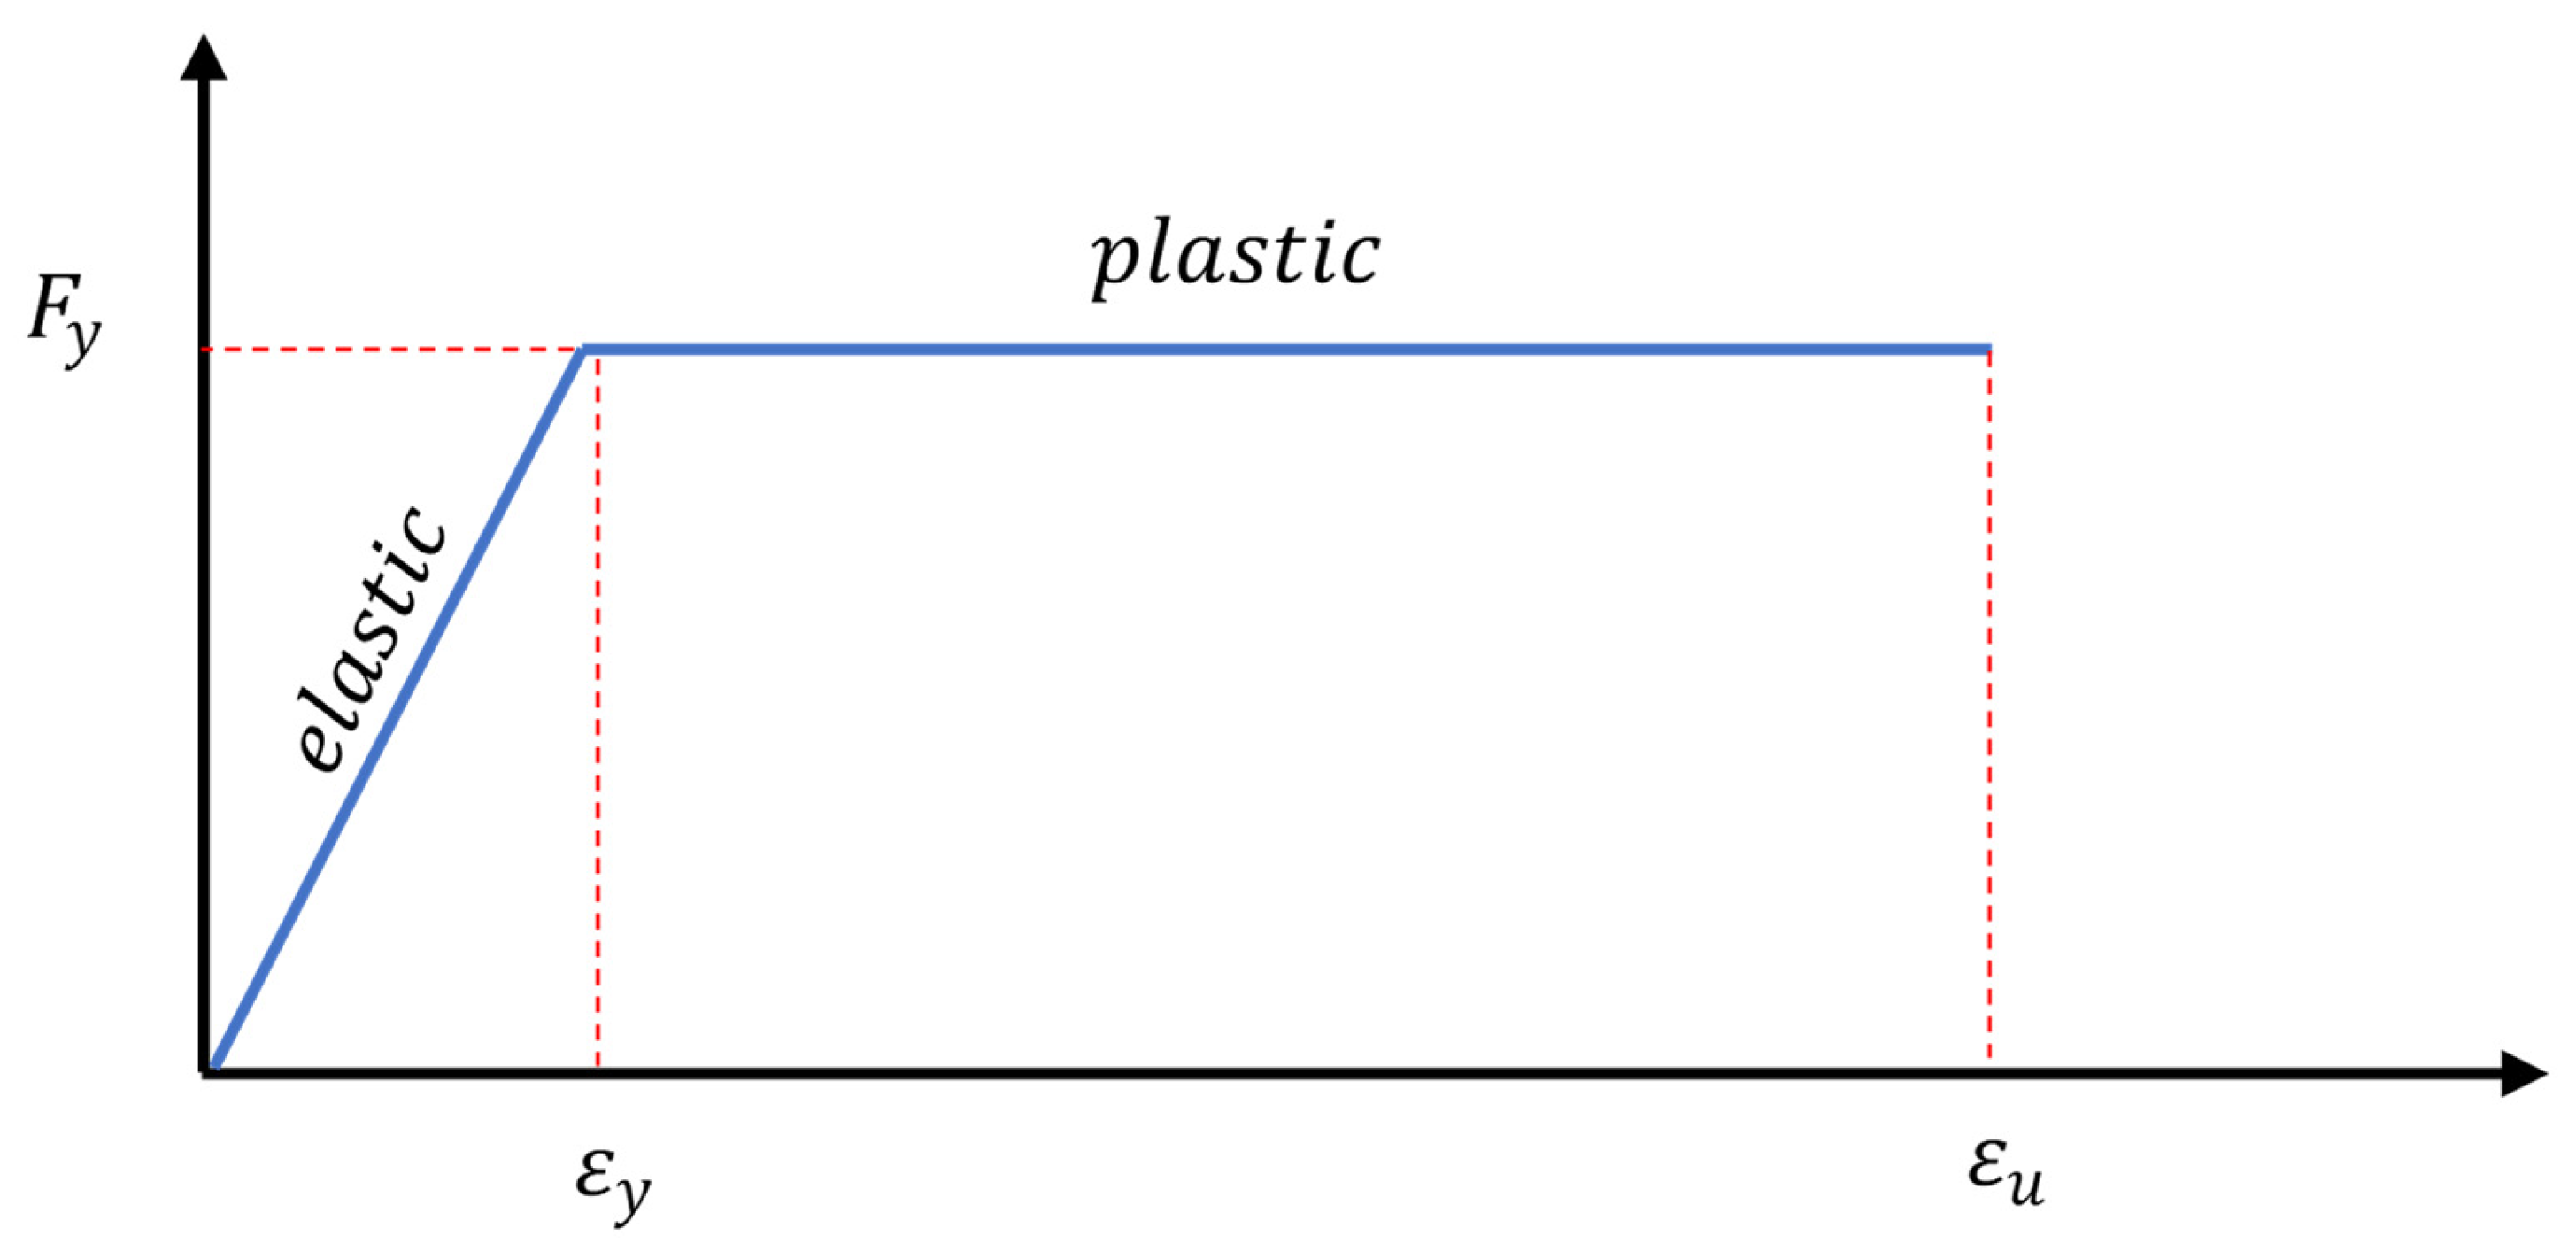
The bi-linear elastic plastic stress–strain models [
19,
20] were used to model steel and prestressing tendons (see
Figure 10).
A general capability for modeling concrete in all different types of structures is provided by the concrete damage plasticity model (CDP) model in Abaqus. The model presupposes that concrete exhibit damaged plasticity in its uniaxial tensile and compressive response. Except for the dilation angle of 32 [
21] and the viscosity parameter of 0.001 [
22,
23], the remaining CDP parameters were kept at the default values implemented in Abaqus (eccentricity = 0.1, fb0/fc0 = 1.16, and Kc = 0.667 [
24]). The strain-softening behavior for cracked concrete is defined by modeling the post failure behavior for direct straining with tension stiffening. The concrete damaged plasticity model requires tension stiffening. Tension stiffening can be specified using a post failure stress–strain relation or a fracture energy cracking criterion. The cracking strain is used to express tension stiffening data. By using the equation below, Abaqus automatically transforms the cracking strain
values into the plastic strain values
.
where E
o is the initial elastic stiffness of concrete and
can be defined as a function of either cracking strain or cracking displacement. If there is no tensile damage,
. The stress–strain behavior of concrete in uniaxial compression beyond the elastic range is computed as a function of inelastic (or crushing) strain,
. The hardening data are given in terms of an inelastic strain, instead of a plastic strain
. The compressive inelastic strain is calculated by subtracting the elastic strain from the total strain (see Equation (68)). By using Equation (70), Abaqus automatically converts inelastic strain values to plastic strain values.
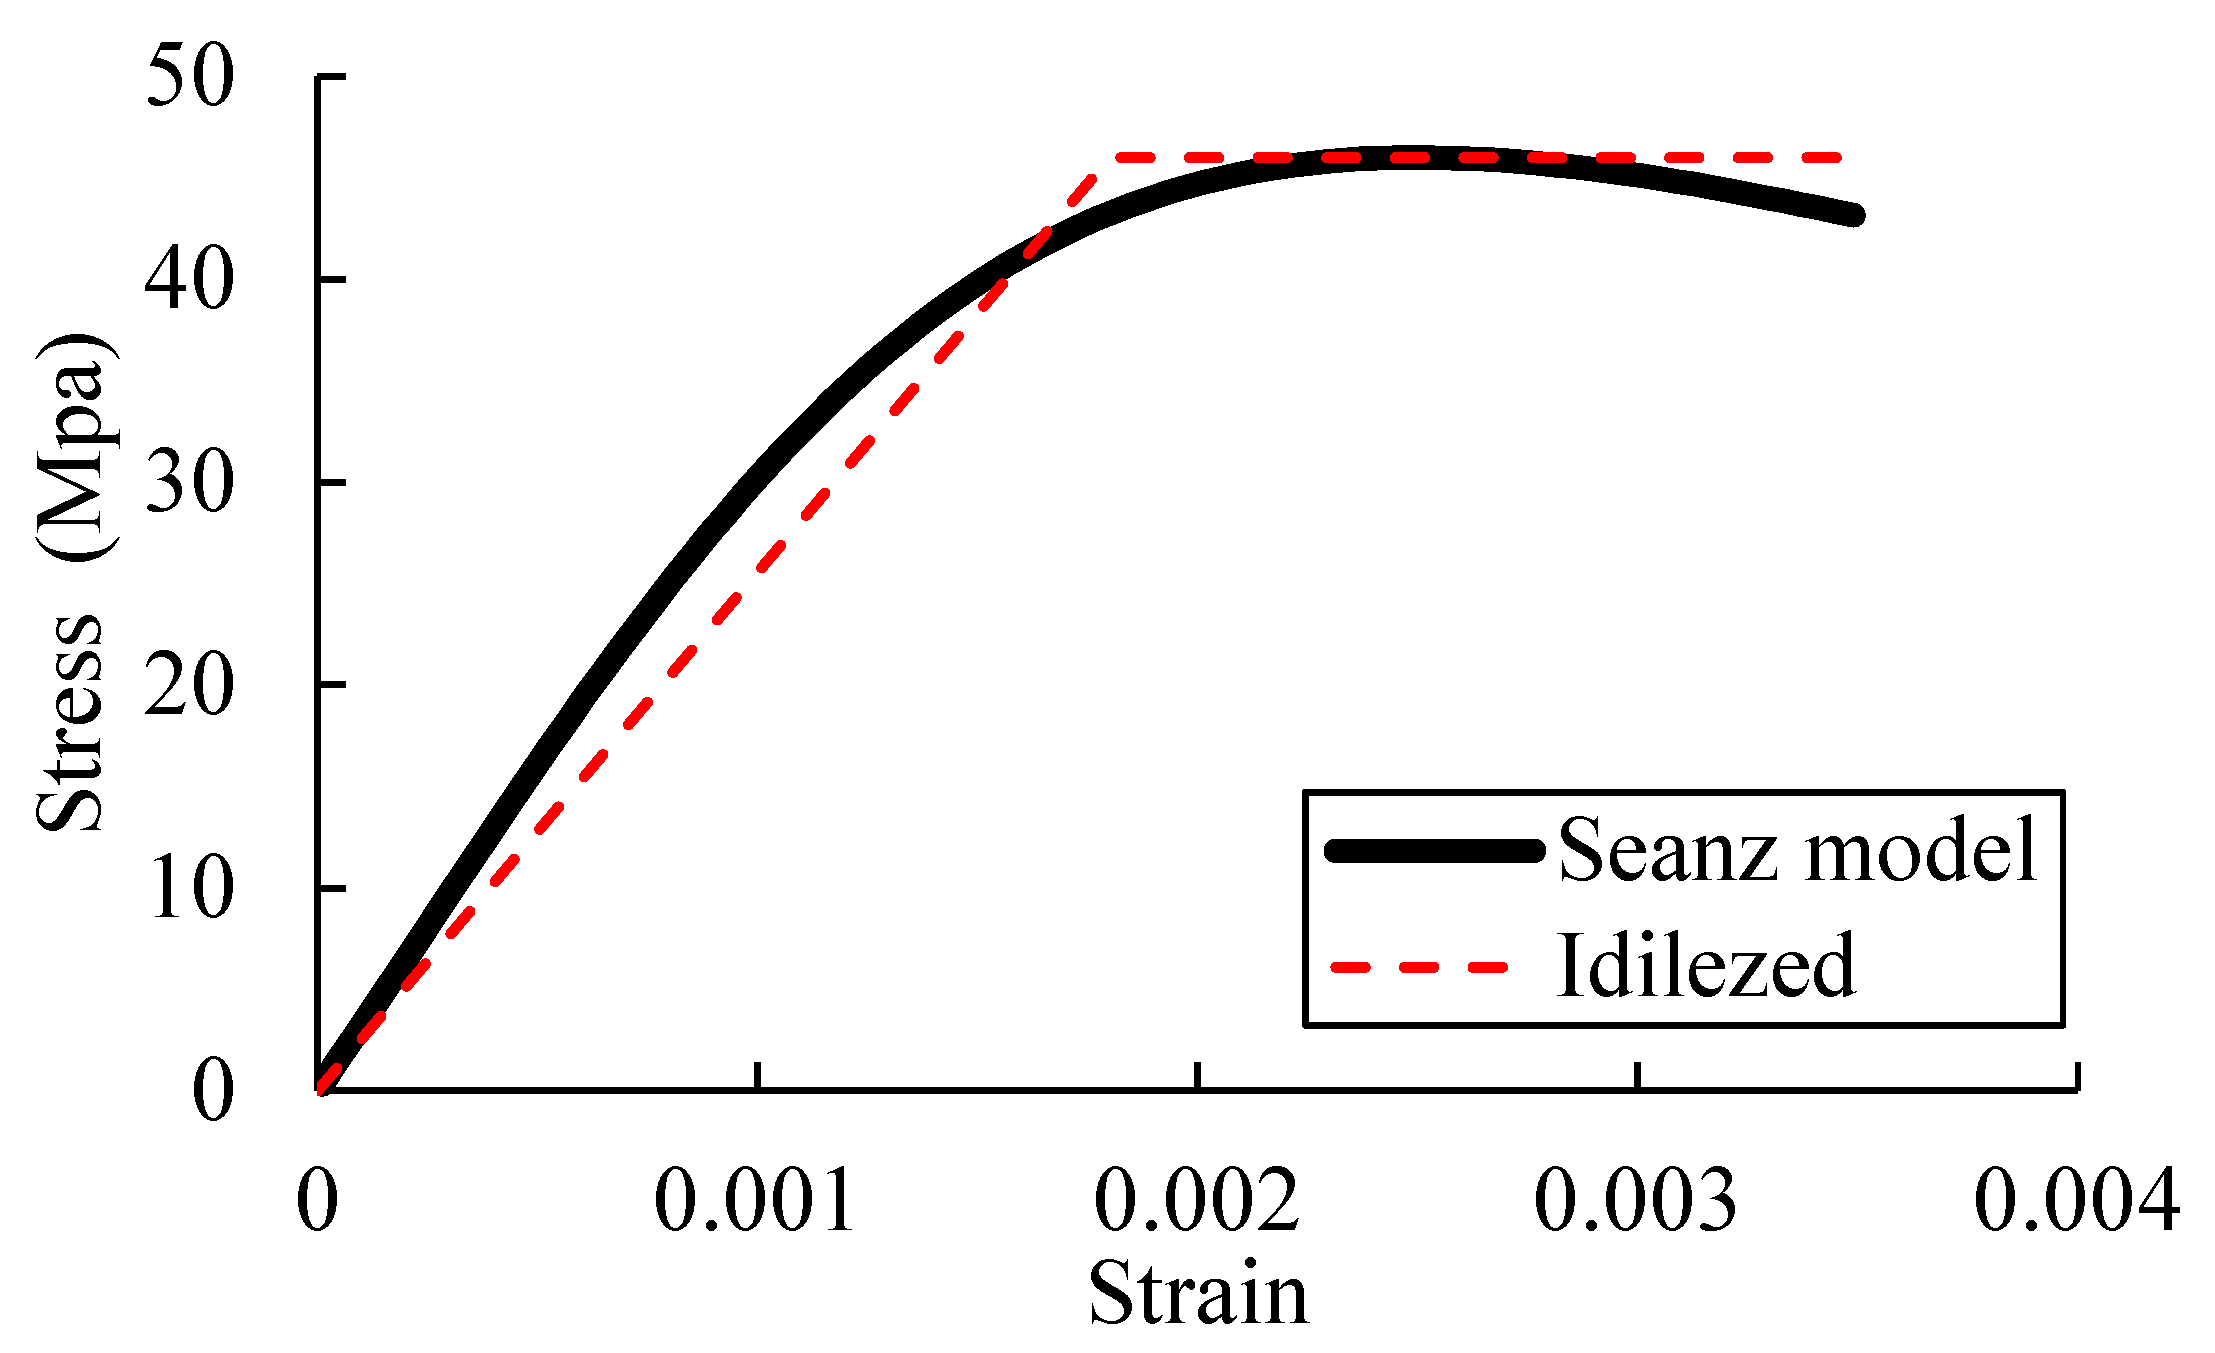
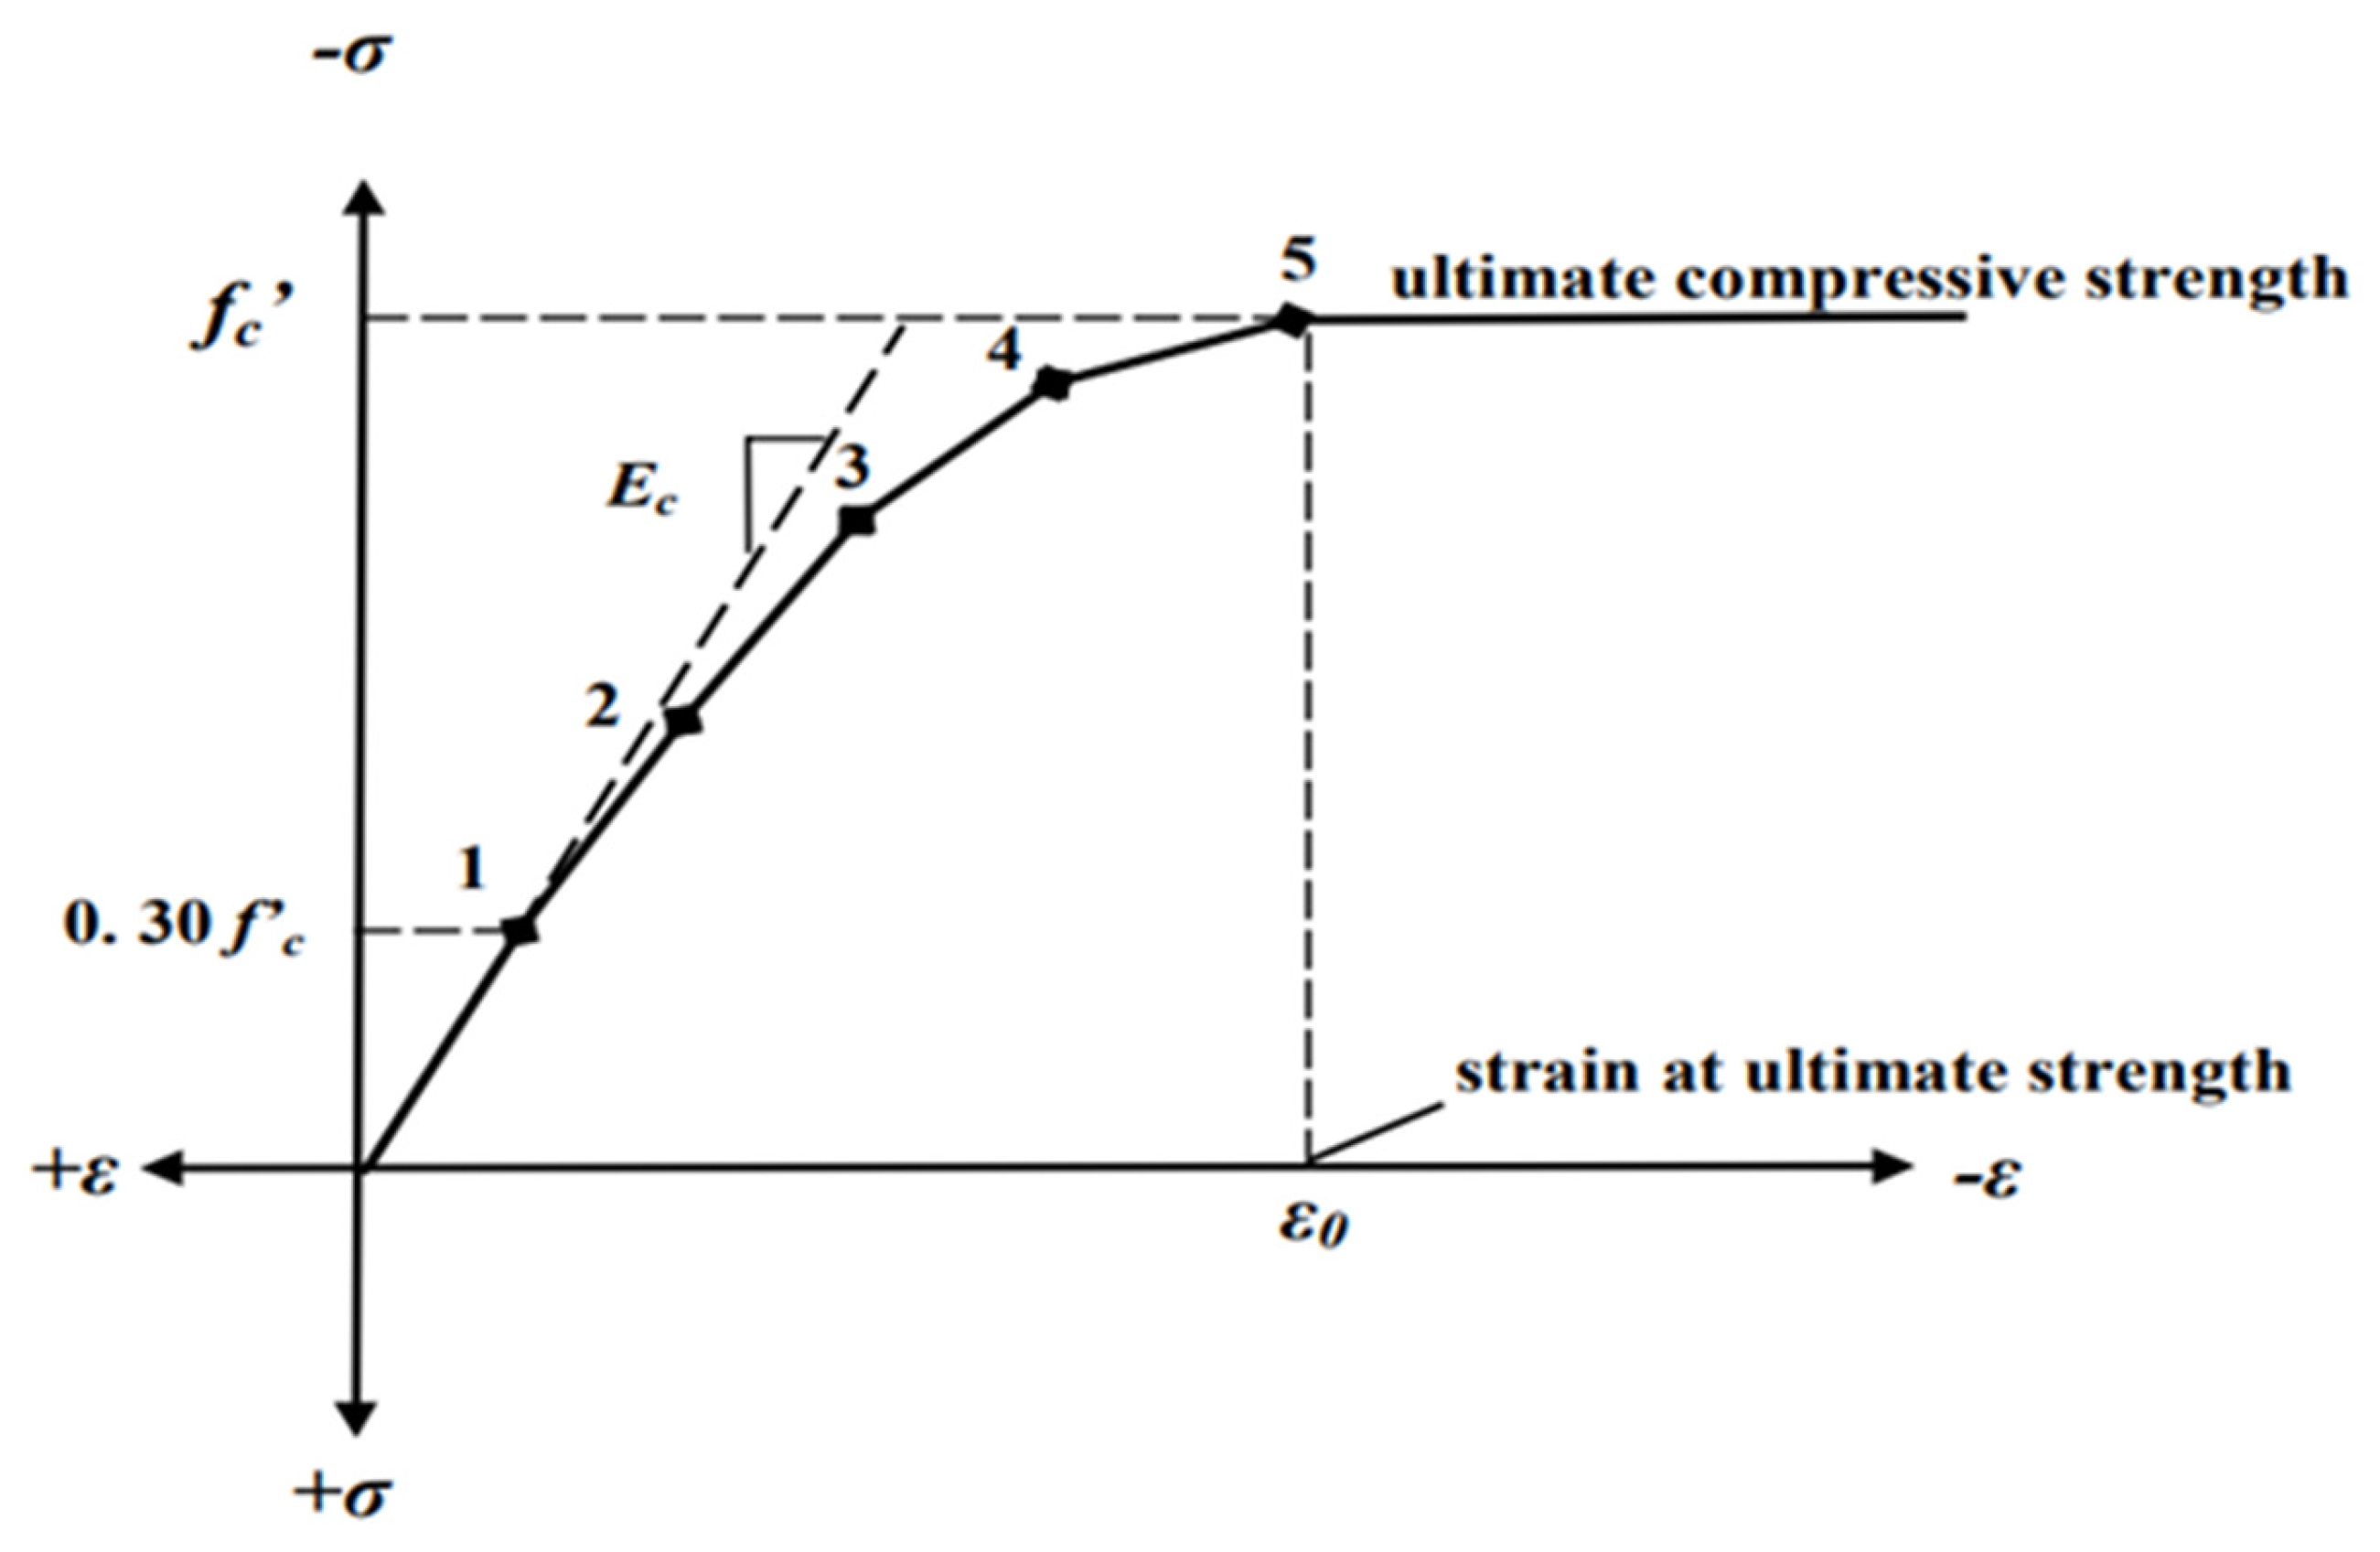
The compressive response of concrete was idealized using the simplified model introduced by Kachlakev, Miller [
25]. The stress–strain curve was assumed to follow a linear elastic branch up to about 30% of the compressive strength, after which the material behavior was considered perfectly plastic until reaching the peak stress (see
Figure 11). The model is defined by a set of discrete points, where the initial strain corresponding to 0.3 fc′ is obtained from Equation (1). Intermediate stress values for any strain ε are calculated through Equation (2), while the peak strain ε0, associated with the ultimate compressive strength fc′, is evaluated from Equation (3). The elastic modulus of the concrete Ec was determined in accordance with the provisions of ACI 318.
The softening behavior is defined by the simplified model presented in [
26,
27,
28,
29] (Equation (74)), while the tensile strength is determined from Equation (75) [
30]. The softening (descending) part of the curve was neglected in order to enhance the stability of the numerical solution.
5. Parametric Study
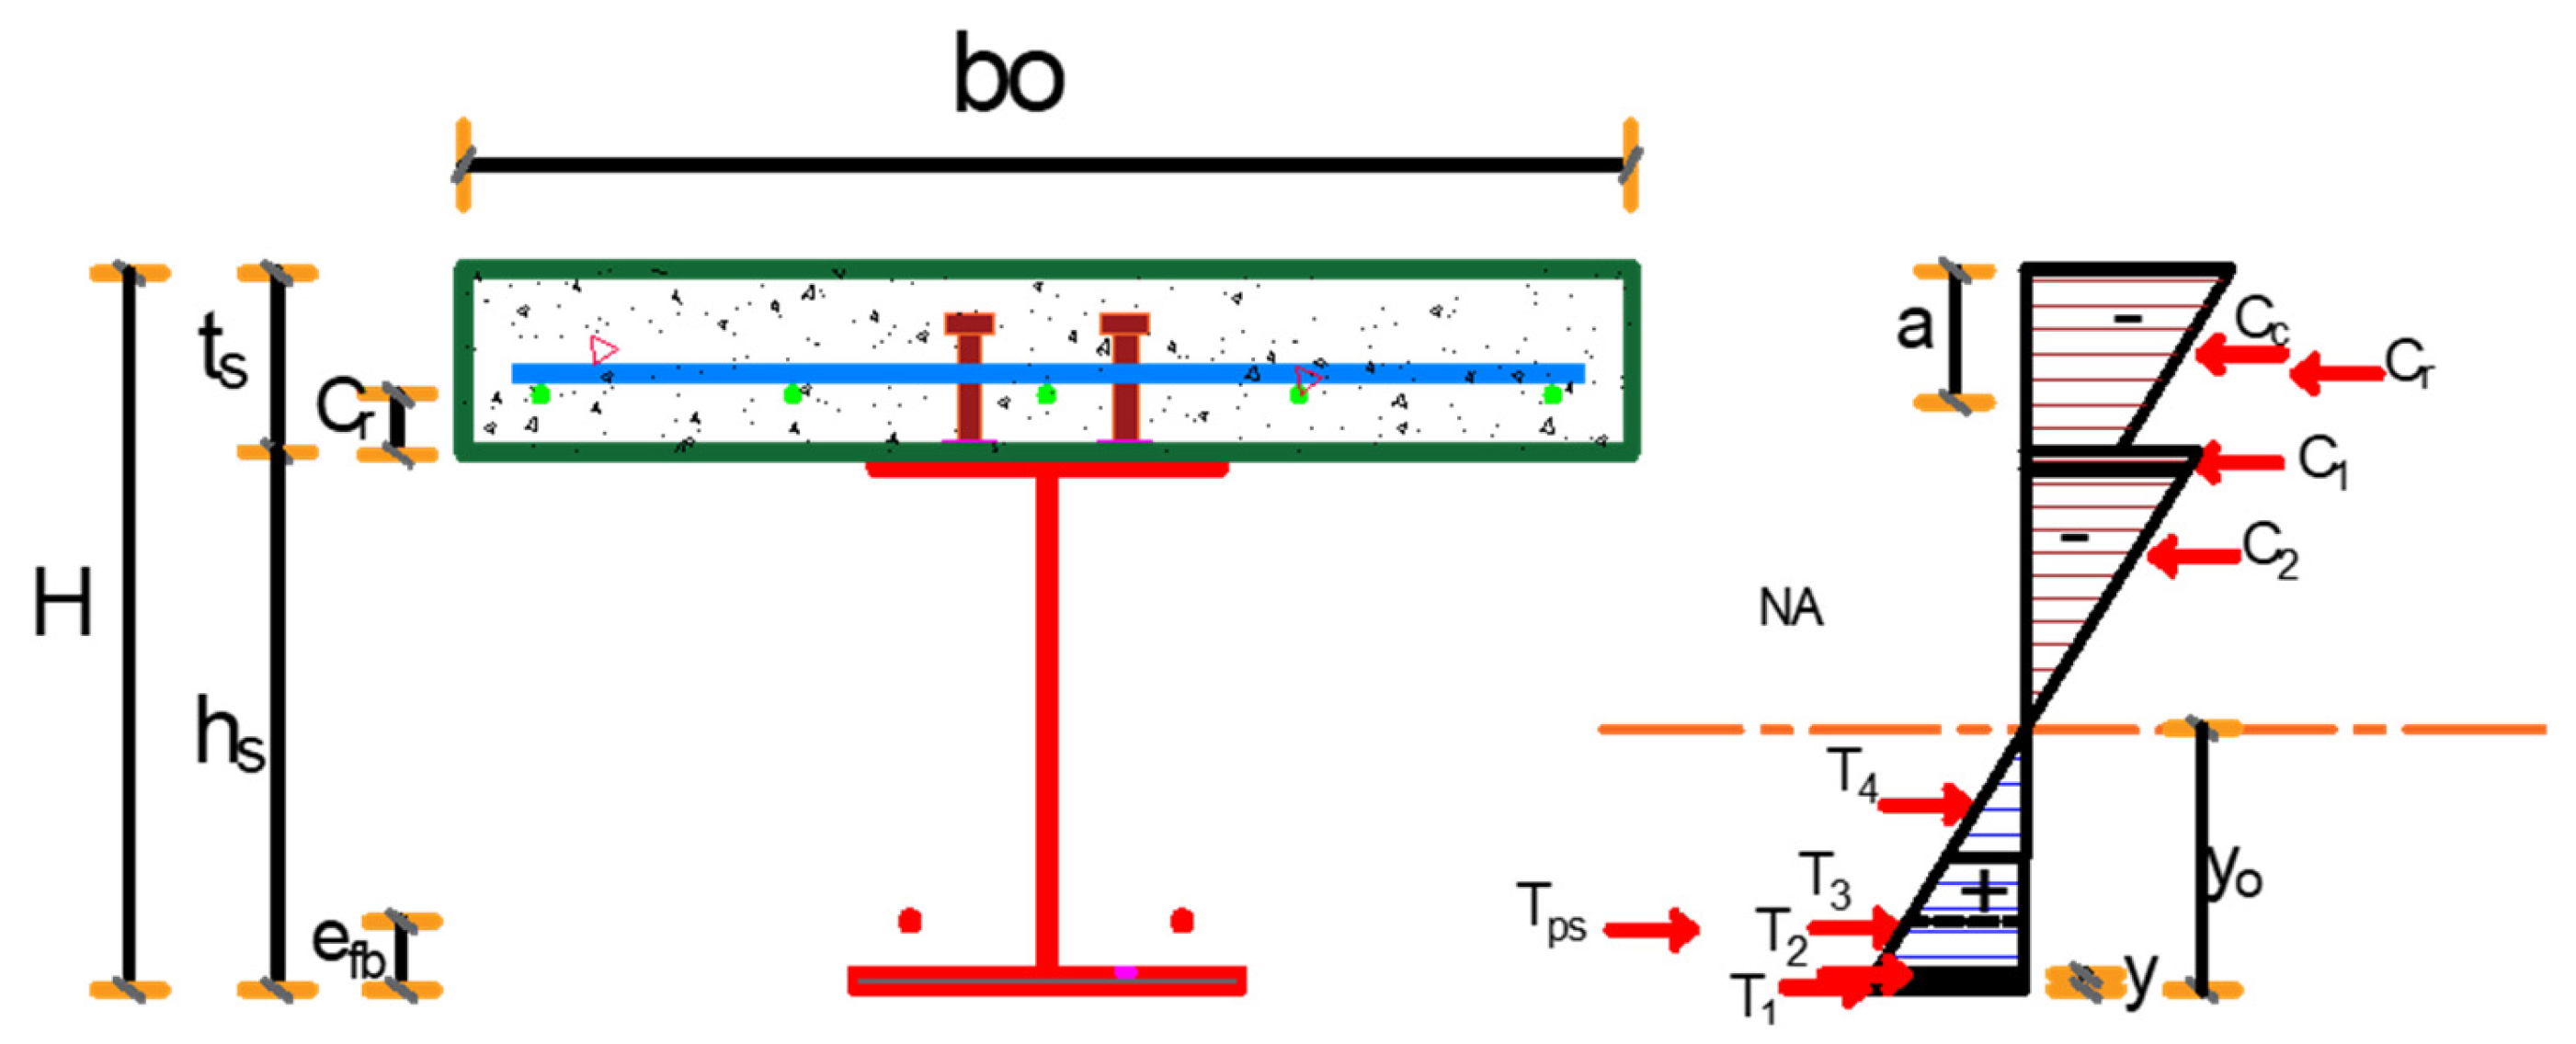
To evaluate the sensitivity of prestressed composite girders to key design variables, a systematic parametric study was carried out using the validated analytical model. The reference configuration, designated as FW5200N-A1, consisted of a composite girder with a 5000 mm span, a steel I-section composed of a 200 mm wide × 8 mm thick bottom flange, a 250 mm deep × 5 mm thick web, and a 200 mm wide × 8 mm thick top flange. The steel section was combined with a reinforced concrete slab measuring 800 mm in width and 80 mm in thickness. Unless otherwise specified, these dimensions were adopted as the baseline for comparison across the parametric cases.
The parametric variables were selected to cover both prestressing-related parameters and sectional geometric properties, as listed in
Table 2. These parameters are span length (L
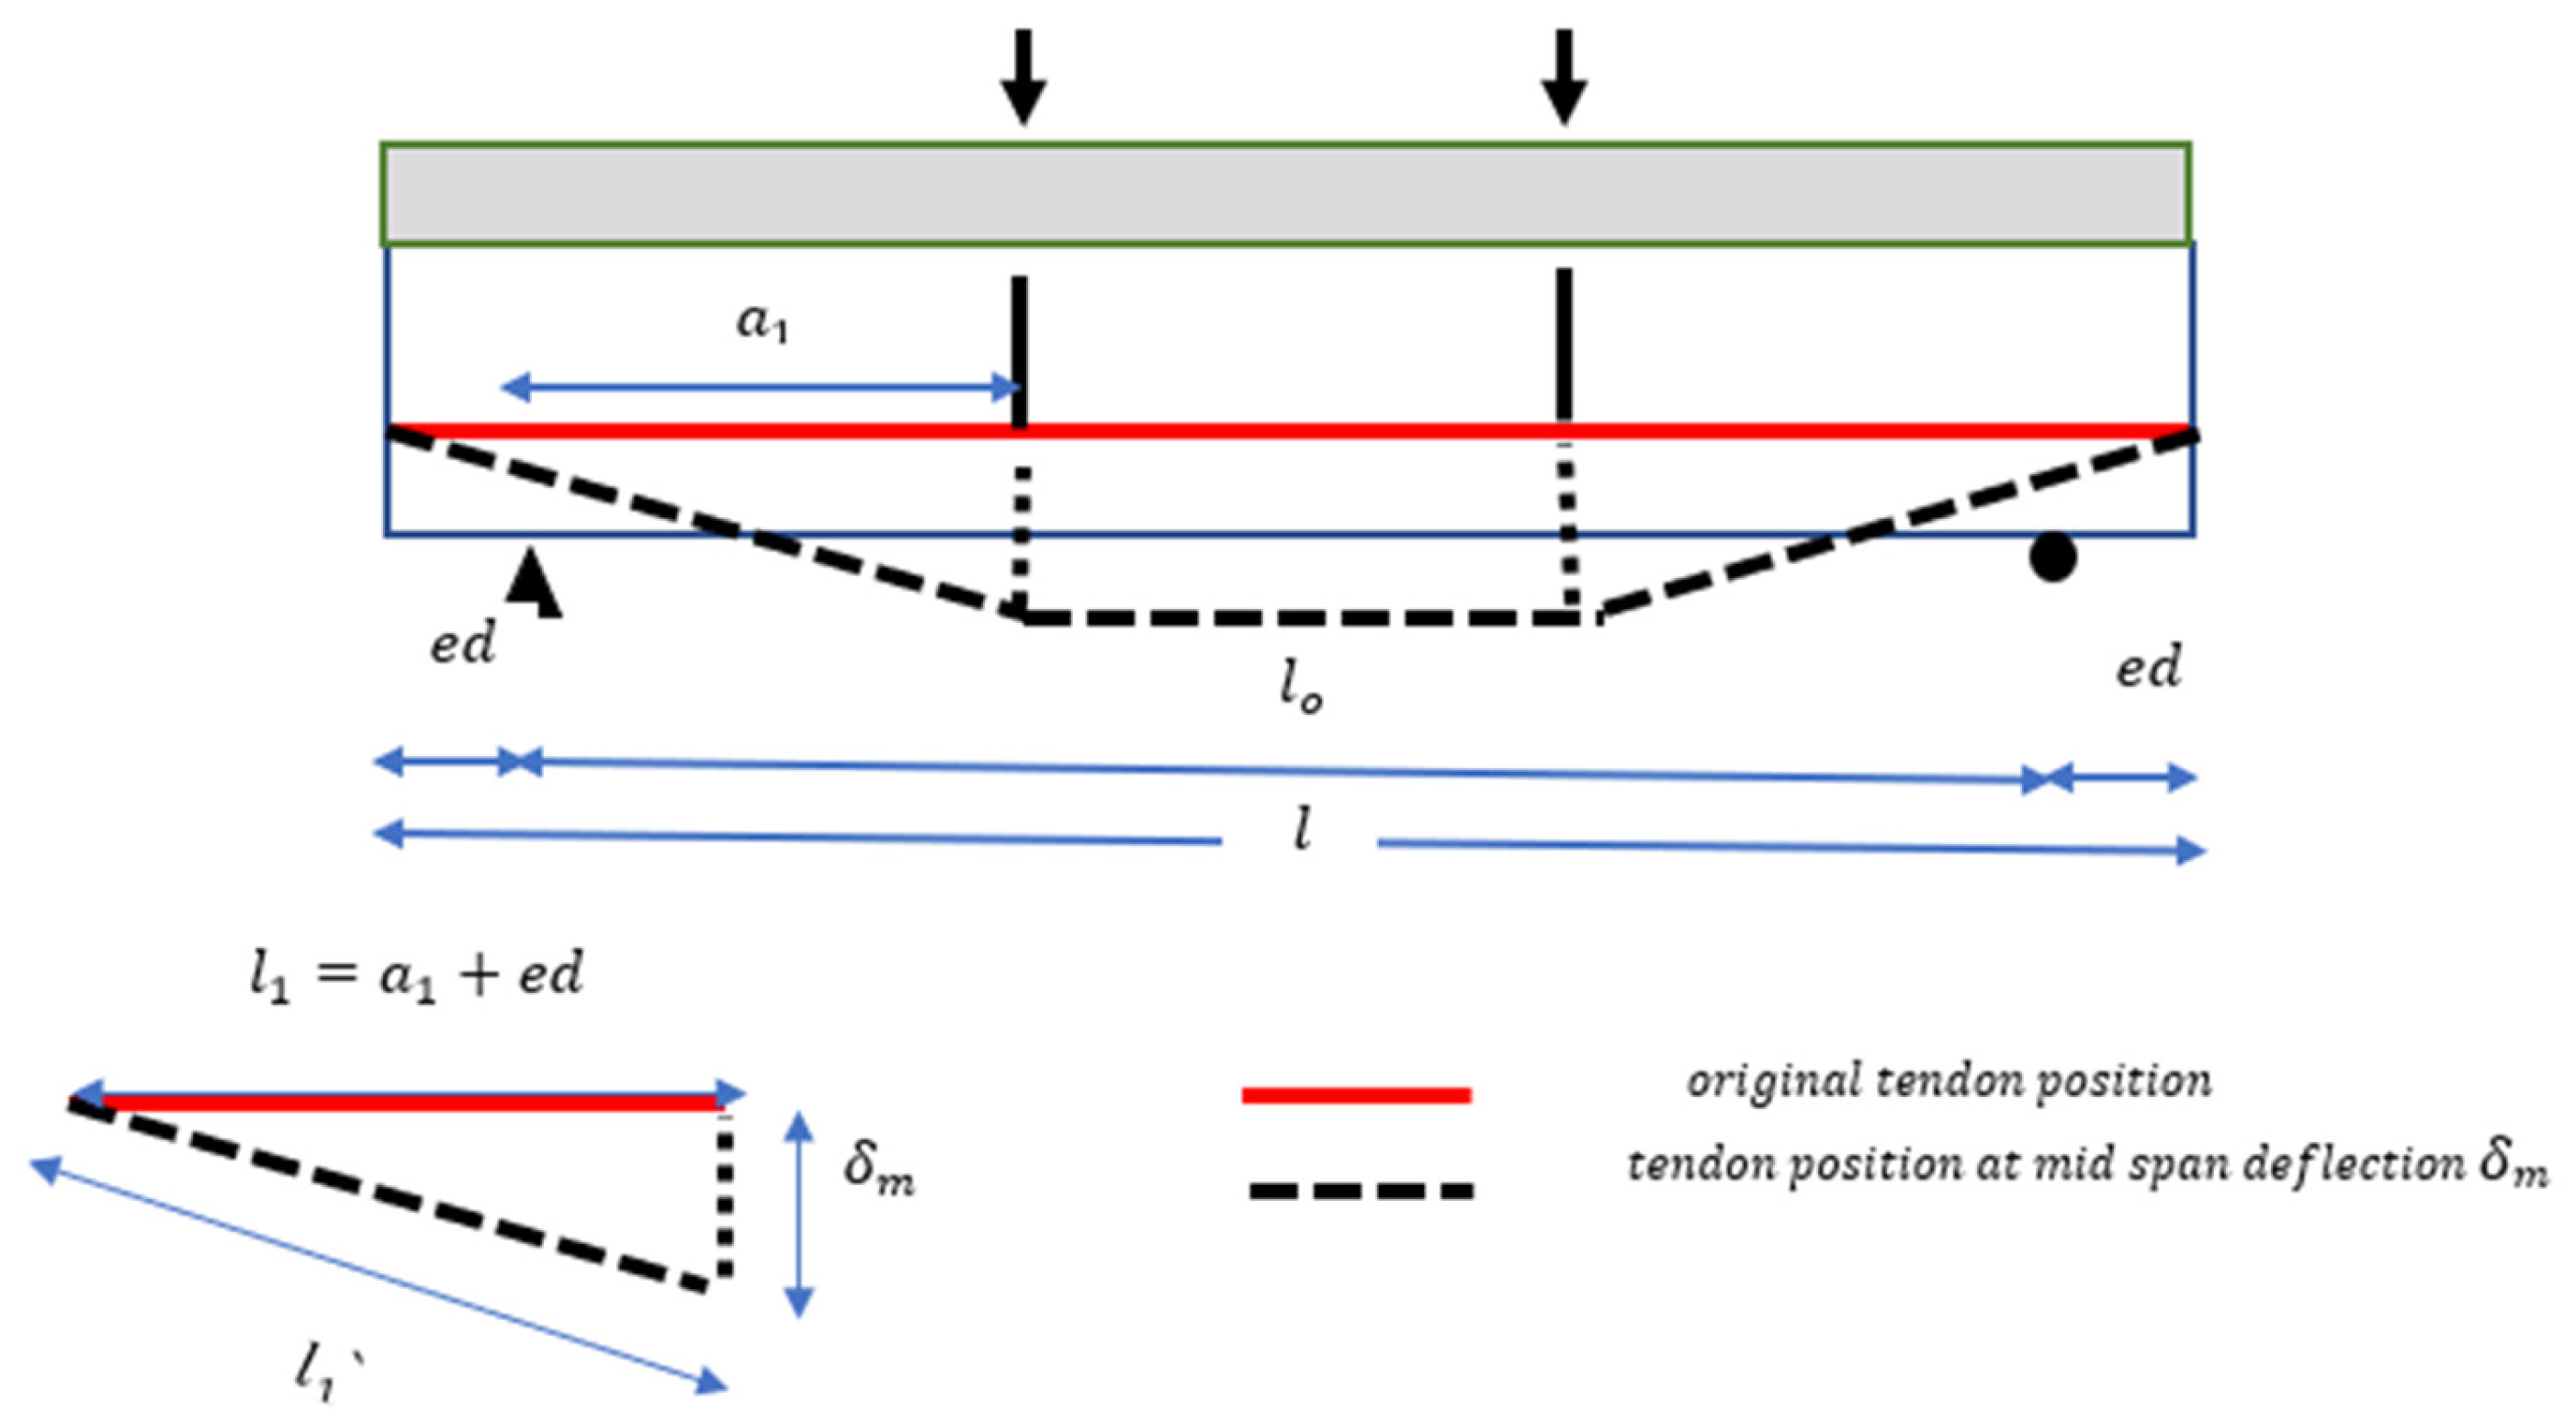
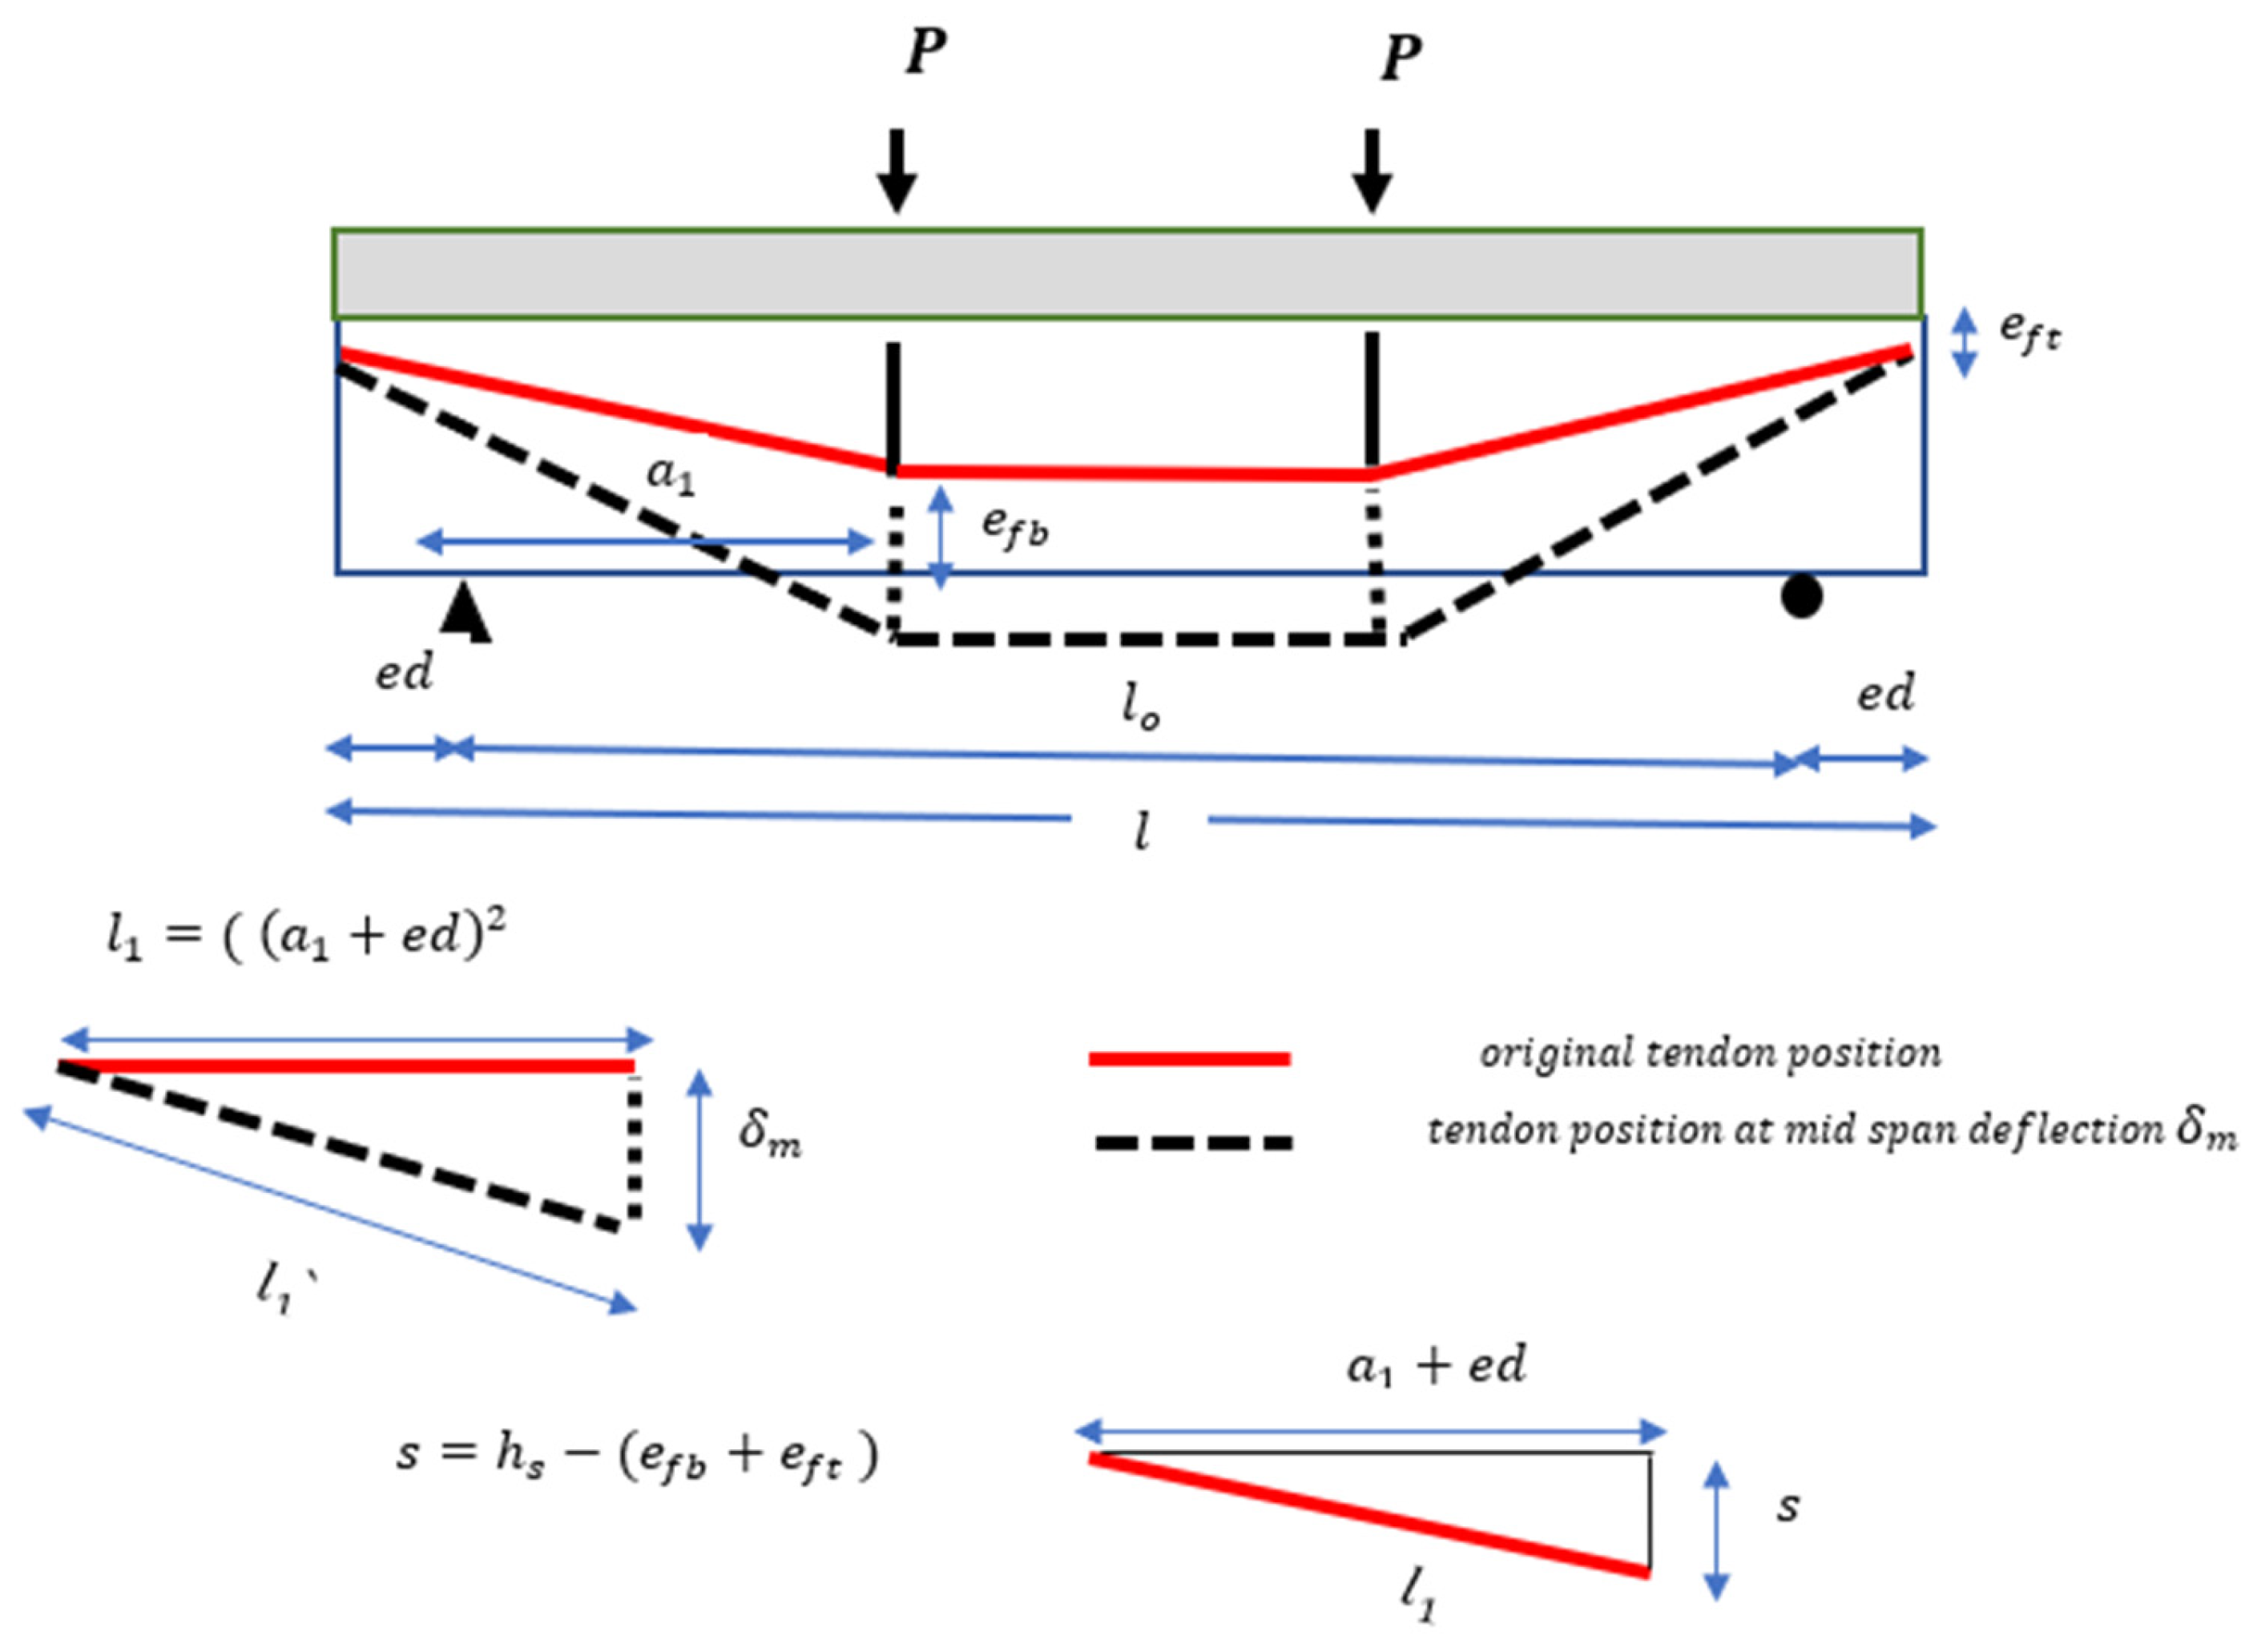
0), the clear span was varied between 4000 mm and 7000 mm to investigate the influence of beam slenderness on stiffness and ultimate load capacity; shear span-to-span ratio (
), ratios ranging from 0.30 to 0.40 were considered to assess the effect of load position on flexural and shear interaction; prestressing force (T
psi), the initial prestressing level was varied from 160 to 300 kN to examine its impact on cracking load, service deflections, and tendon stress development; concrete slab properties, both slab thickness (t
s = 60–120 mm) and slab width (b
o = 600–1200 mm) were varied to capture the role of the concrete deck in the composite action and flexural rigidity; and steel section parameters, a series of variations were introduced in the steel girder dimensions. The steel section parameters include: bottom flange width (
= 200–300 mm) and thickness (
= 8–14 mm), and web depth (
= 200–400 mm) and web thickness (
= 3–8 mm). Each parameter was varied independently while keeping the remaining variables constant, ensuring that the isolated influence of each factor could be captured. This approach provides a clear understanding of the relative significance of prestressing levels, tendon eccentricity, and sectional properties on the overall beam performance.
The specimen nomenclature was systematically defined to indicate both the baseline series and the parameter under investigation. For example, FW5200N-A2-a1/lo-0.35 refers to a beam with span 5000 mm, belonging to series A2, in which the load ratio is equal to 0.35. Such a systematic naming convention enables straightforward comparison among specimens where only a single parameter is varied at a time.
In all parametric cases, the same material properties were adopted to ensure consistency and isolate the effect of geometric and prestressing parameters. The concrete slab was modeled with a compressive strength of = 40 MPa, while the structural steel section was characterized by a yield strength of = 300 MPa and an ultimate tensile strength of = 550 MPa. Prestressing tendons were assumed to be seven-wire strands with a yield strength of = 1680 MPa, an ultimate strength of = 1860 MPa, and a nominal cross-sectional area of 140 mm2 per strand. These material properties are consistent with typical values used in composite girder design and ensure realistic representation of both concrete and steel components in the analytical model.
5.1. Effect of Clear Span Length (L0)
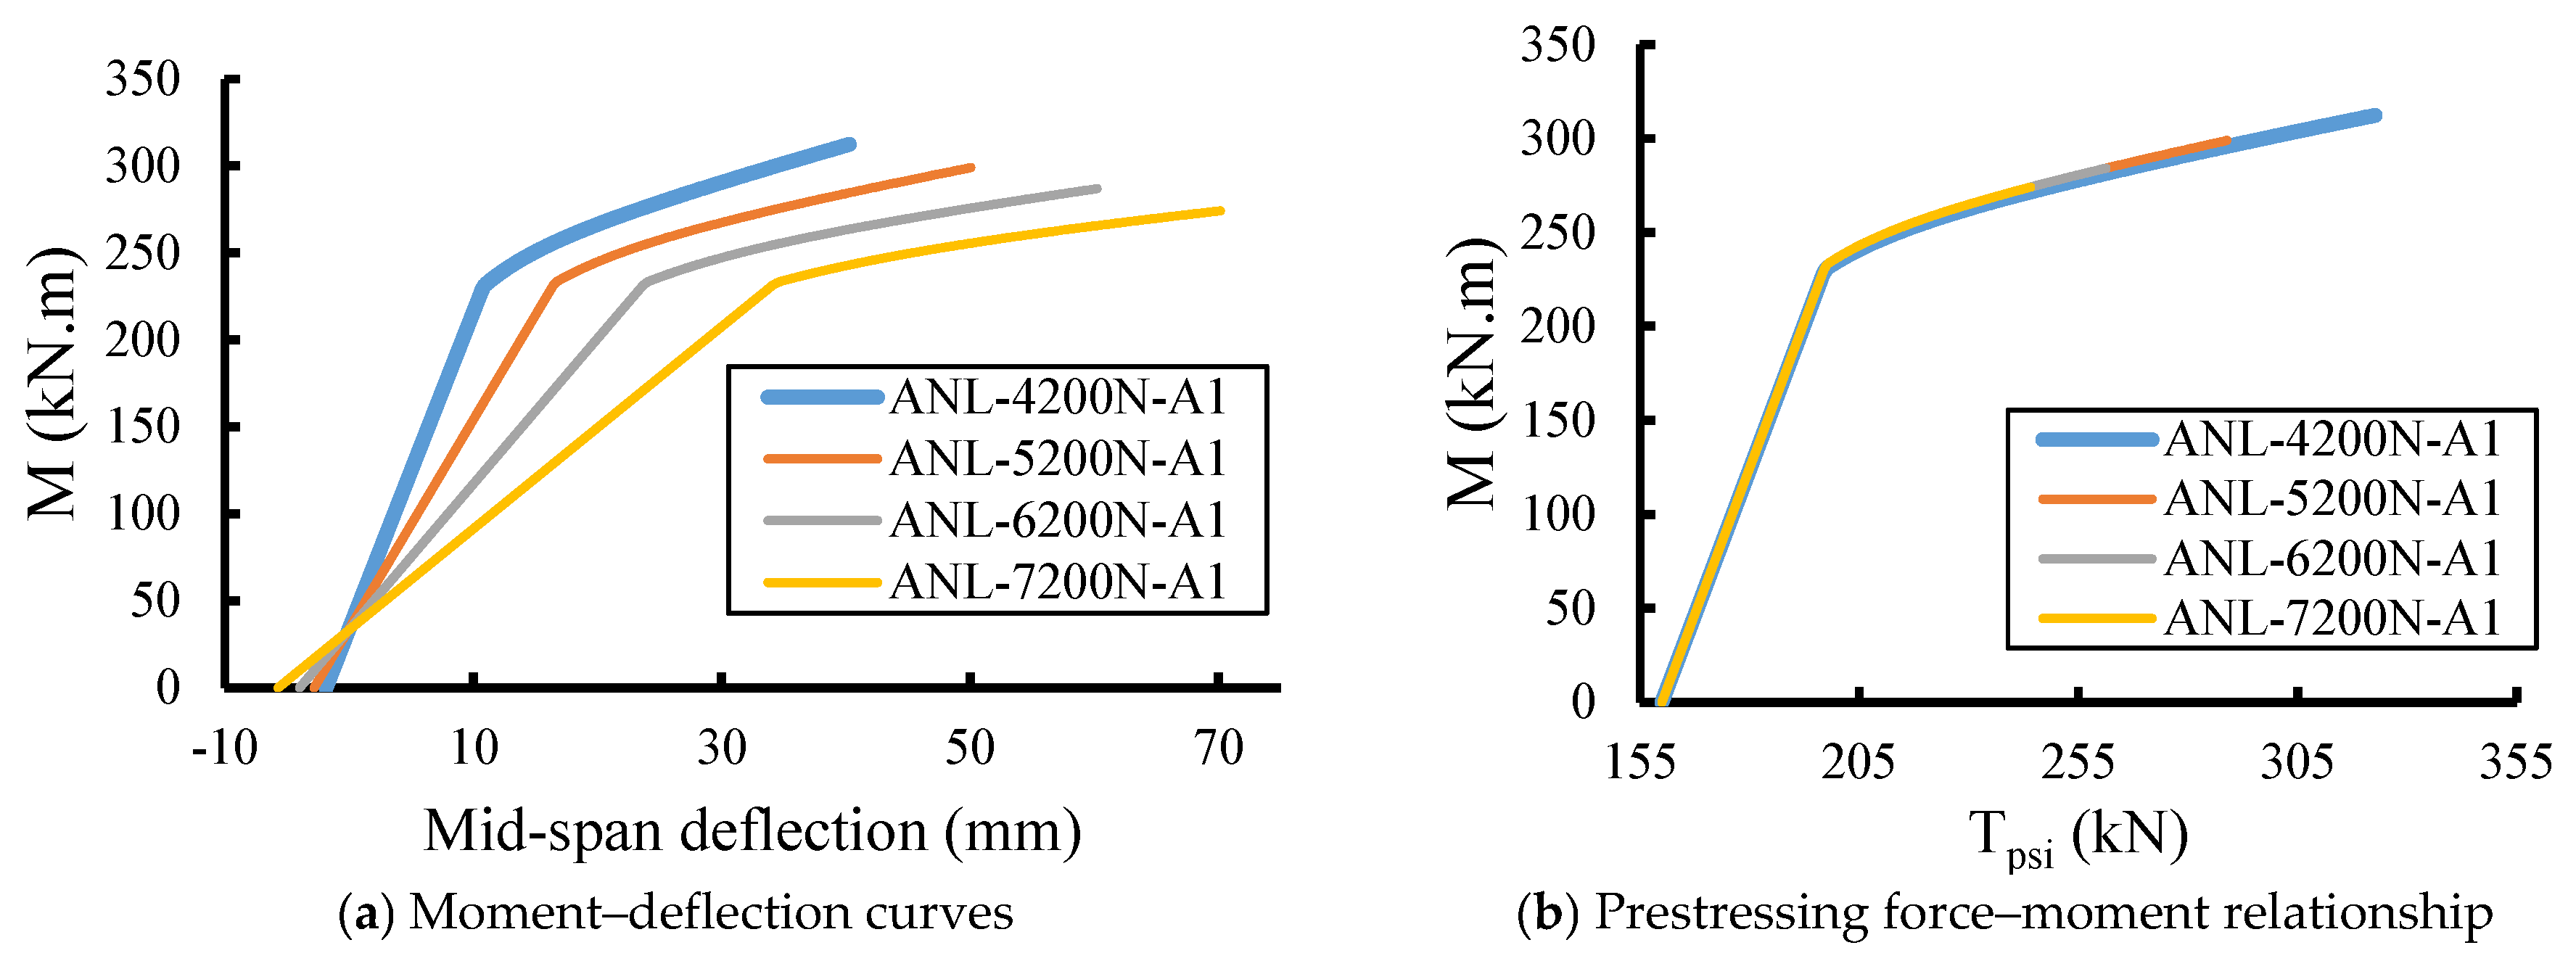
Figure 17 illustrates the effect of clear span length (L
0) on the flexural response of prestressed composite girders through both the moment–deflection relationship and the prestressing force–moment relationship. The analytical results include four specimens with different spans of 4200 mm, 5200 mm, 6200 mm, and 7200 mm, while all other parameters were maintained constant to isolate the influence of span length.
As shown in
Figure 17a, increasing the clear span length results in a noticeable reduction in both flexural stiffness and ultimate moment capacity. The shortest specimen, ANL-4200N-A1, exhibited the highest strength, reaching an ultimate moment of approximately 320 kN·m, accompanied by the smallest mid-span deflection at failure. In contrast, the longest span specimen, ANL-7200N-A1, achieved a lower ultimate moment of about 240 kN·m and experienced a much larger deflection exceeding 60 mm. This behavior indicates that longer spans lead to greater bending moments and deflections for a given load intensity, which accelerates cracking and yielding in the steel and concrete components. Moreover, the post-yield region demonstrates that shorter spans retain higher residual stiffness, whereas longer spans exhibit more pronounced nonlinearity due to geometric effects and tendon stress redistribution. Consequently, beam slenderness significantly influences the stiffness and ductility of composite girders; as the span increases, the stiffness decreases, resulting in higher deflections and reduced overall rigidity.
The prestressing force–moment relationship shown in
Figure 17b reveals that the influence of span length on prestressing efficiency is relatively minor. All specimens display nearly overlapping curves up to the service range of prestressing force (approximately 200–300 kN), indicating that the moment response is primarily governed by the tendon force rather than by geometric variation. However, at higher prestressing levels, the shorter spans (e.g., ANL-4200N-A1) maintain slightly higher ultimate moments for the same prestressing force, reflecting their greater flexural rigidity and smaller moment arm. The results confirm that the prestressing mechanism remains effective across all span lengths and that tendon stress development is not significantly affected by changes in L
0 within the studied range.
5.2. Effect of Shear Span-to-Span Ratio
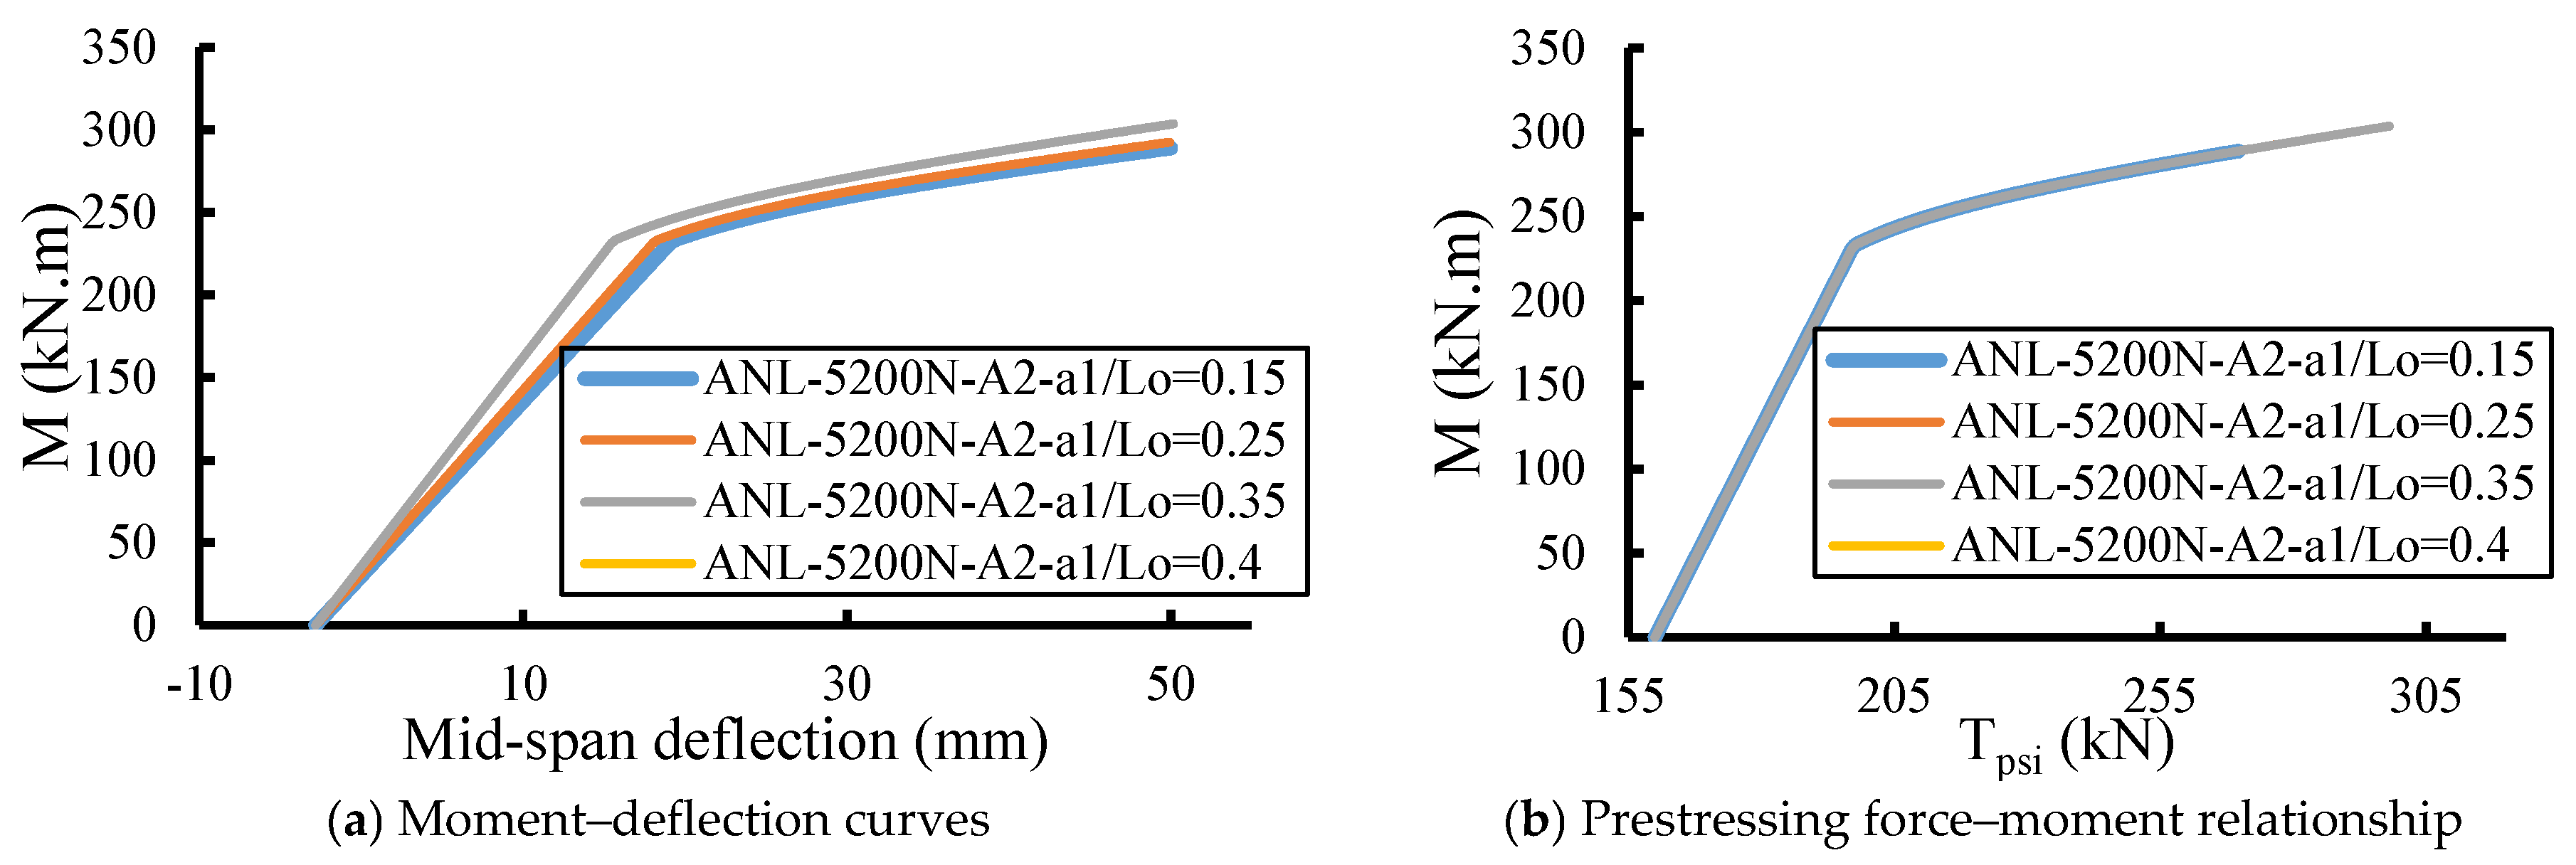
Figure 18 presents the analytical results illustrating the influence of the shear span-to-span ratio (a
1/L
0) on the flexural performance of prestressed composite girders. Four analytical models with ratios of 0.15, 0.25, 0.35, and 0.40 were evaluated while maintaining constant material properties, span length (L
0 = 5200 mm), and cross-sectional geometry. This parameter primarily affects the load position and, consequently, the interaction between shear and flexural behavior.
As shown in
Figure 18a, the moment–deflection curves reveal that increasing the shear span-to-span ratio slightly reduces both the stiffness and ultimate moment capacity of the beam. Specimens with lower ratios, such as a
1/L
0 = 0.15 and 0.25, exhibit higher load-carrying capacities and smaller deflections, indicating a stiffer flexural response. The specimen with a
1/L
0 = 0.15 reaches the highest moment of approximately 315 kN·m, while the one with a
1/L
0 = 0.40 shows a reduced ultimate moment of about 290 kN·m and greater mid-span deflection, exceeding 50 mm. This behavior can be attributed to the increased lever arm of the applied load as the shear span grows, which amplifies the bending moment demand and leads to greater flexural deformation before failure. At smaller ratios, the applied load acts closer to the support, resulting in a more favorable shear–flexure interaction and higher resistance against bending deformation.
The differences among the curves, although moderate, indicate that reducing the shear span enhances the flexural stiffness and strength of composite girders. This effect becomes more evident in the nonlinear region beyond cracking, where beams with lower a1/L0 ratios exhibit higher residual stiffness and a slower reduction in moment capacity. The post-yield behavior shows that the beams with smaller shear spans maintain more stable moment capacities due to better utilization of composite action and reduced shear-induced cracking in the concrete flange.
The prestressing force–moment relationship shown in
Figure 18b demonstrates that the effect of a
1/L
0 ratio on the prestressing efficiency is minimal. The curves for all ratios nearly overlap, confirming that the prestressing force contributes uniformly to moment resistance regardless of load position. However, slight variations in the nonlinear region suggest that beams with smaller a
1/L
0 ratios achieve marginally higher moment capacities for the same level of tendon force, owing to reduced bending-induced strain and better stress distribution within the section. This finding confirms that the shear span ratio influences the flexural response primarily through geometric effects rather than through alterations in prestressing performance.
5.3. Effect of Prestressing Force (Tpsi)
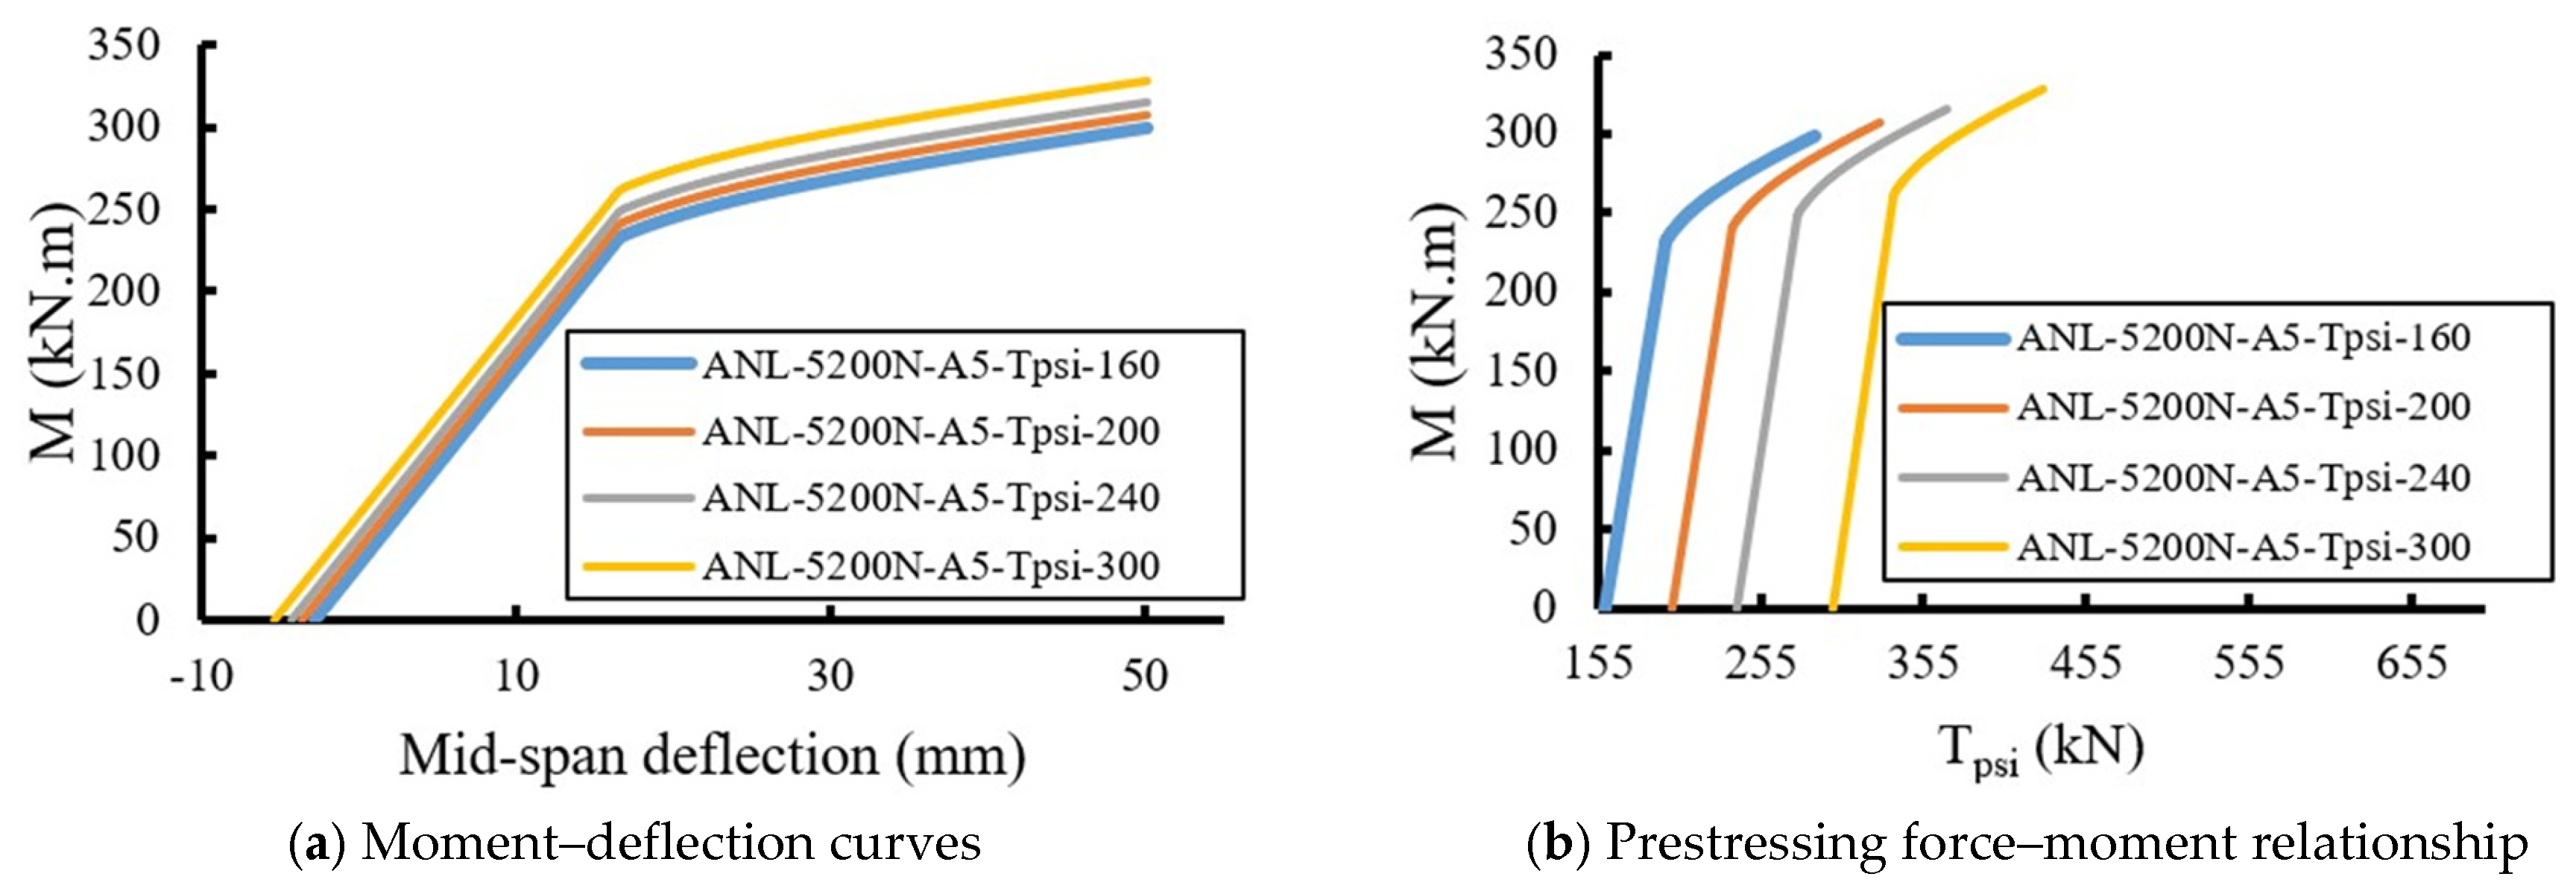
Figure 19 illustrates the influence of the initial prestressing force
Tpsi on the flexural response of the prestressed composite girder series ANL-5200N-A5, where the span length, cross-section, and material properties are kept constant and only the initial tendon force is varied (160, 200, 240, and 300 kN). The moment–deflection curves in
Figure 19a show that increasing the initial prestressing force leads to a clear improvement in both stiffness and load-carrying capacity. Beams with higher prestress exhibit larger cracking and yielding moments, reflected by a rightward shift in the nonlinear response and reduced mid-span deflection at comparable moment levels. In addition, increasing the prestressing force alters the internal force distribution within the composite section, resulting in a shift in the neutral axis and improved utilization of the concrete compression zone. This behavior contributes to enhanced composite action and more efficient stress redistribution between the steel and concrete components. The specimen with the lowest prestressing force (
Tpsi = 160) attains the smallest ultimate moment and shows the largest deflection, whereas the beam with
Tpsi = 300 kN achieves the highest ultimate moment—on the order of about 10–15% greater than the lowest level—and maintains a steeper post-cracking slope, indicating enhanced utilization of composite action and better control of tensile stresses in the concrete slab and steel section.
The prestressing force–moment relationships in
Figure 19b further clarify the interaction between tendon force development and global flexural response. Each curve originates at its respective initial prestressing level and increases as external loading is applied and strain in the tendon grows. Higher initial prestressing levels are associated with higher moment capacities, confirming that increased prestress effectively contributes to resisting external bending by pre-compressing the concrete and delaying tensile cracking at the soffit. However, as
Tpsi increases, the incremental gain in tendon force from loading becomes relatively smaller (the curve shortens horizontally), indicating that the strand approaches its effective stress limit more rapidly and that the margin for additional stress increase under overload is reduced. Overall, the results demonstrate that raising the initial prestressing force within the investigated range significantly enhances serviceability performance—by reducing deflections and delaying cracking—and moderately increases the ultimate moment capacity, while also highlighting the practical need to avoid excessively high prestress levels that may limit reserve capacity or introduce other serviceability constraints. This improvement may allow more efficient utilization of the steel and concrete sections and contribute to more economical structural designs.
5.4. Effect of Concrete Slab Properties
5.4.1. Slab Thickness
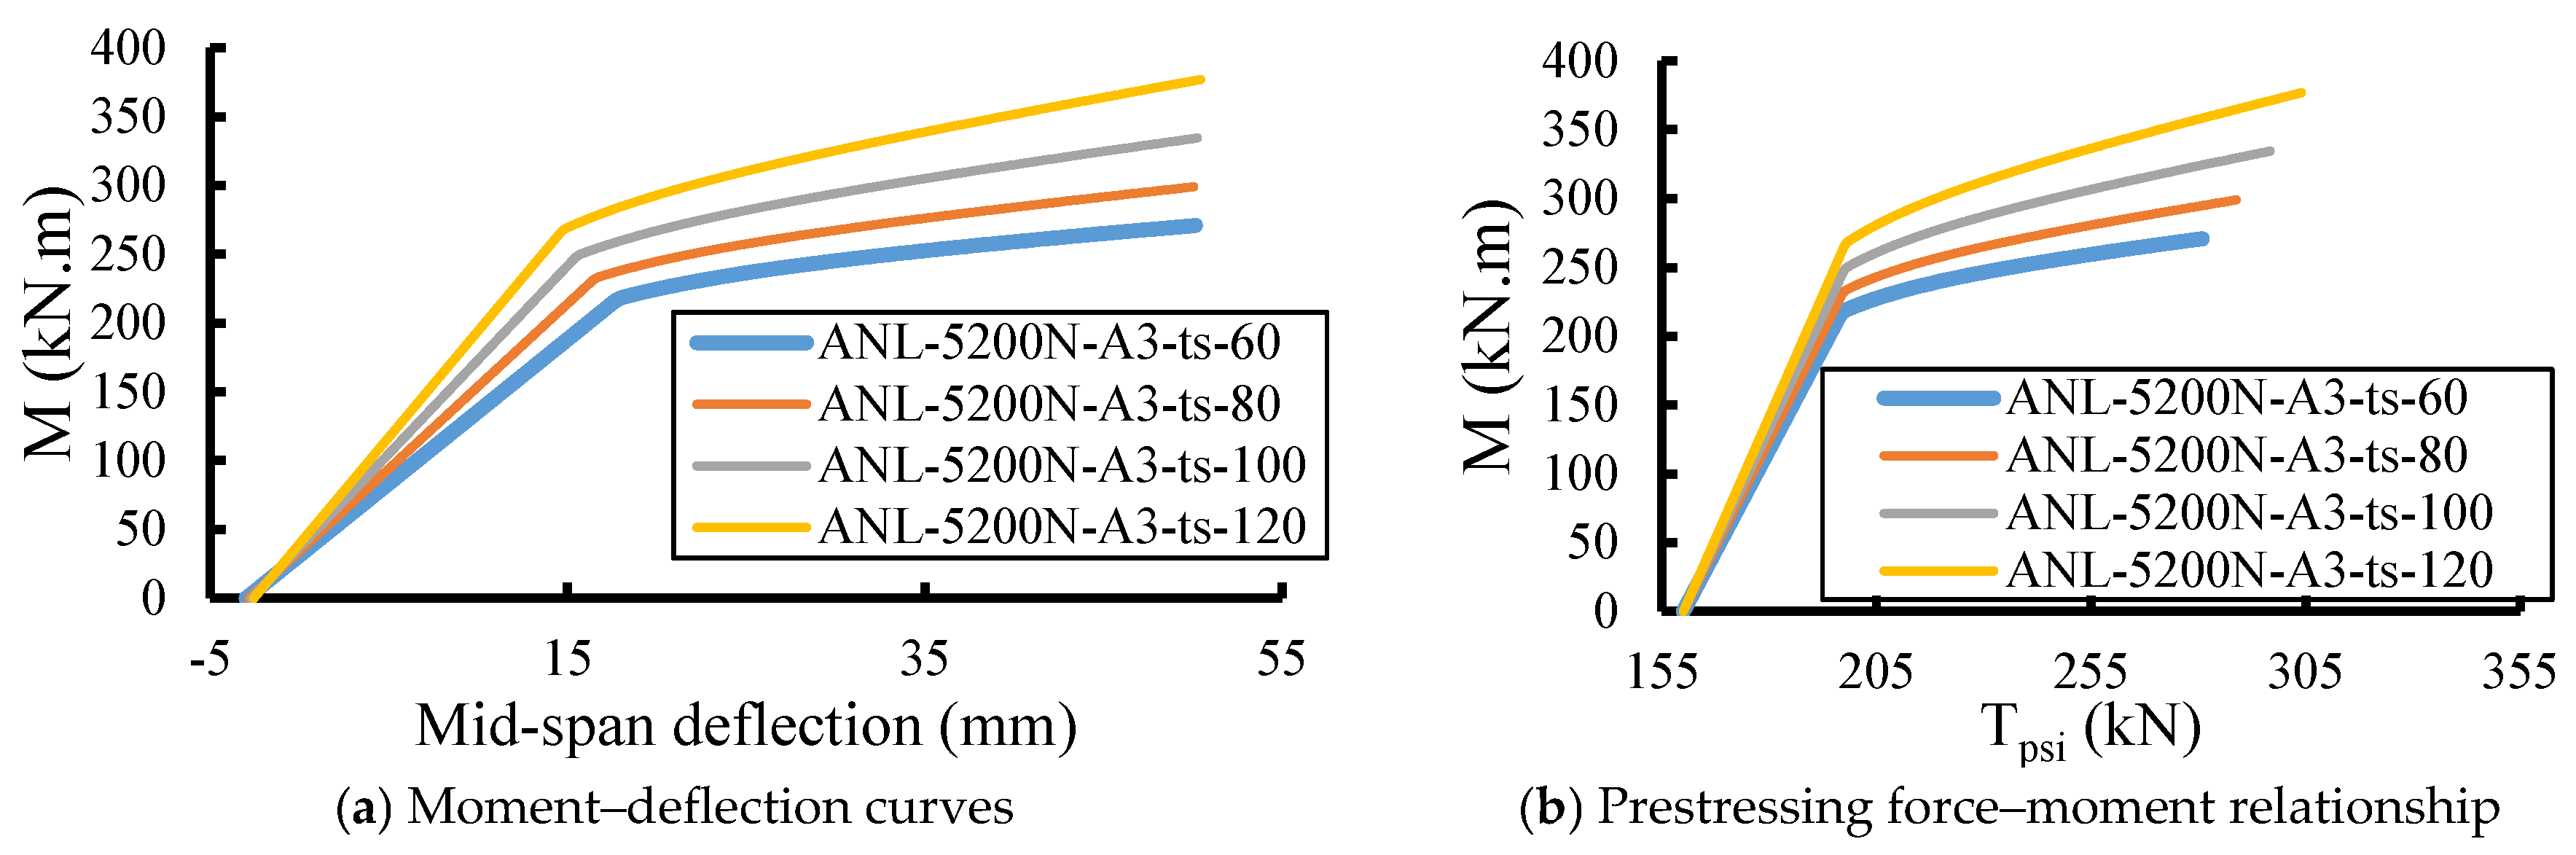
Figure 20 illustrates the influence of the reinforced concrete slab thickness (t
s) on the flexural performance of prestressed composite girders. The analytical models considered slab thicknesses of 60 mm, 80 mm, 100 mm, and 120 mm, while all other geometric and material parameters were kept constant. This parameter directly affects the composite section’s flexural stiffness, neutral axis location, and degree of interaction between the concrete and steel components.
As shown in
Figure 20a, increasing the slab thickness markedly enhances both the stiffness and moment capacity of the composite girder. The beam with the thinnest slab (t
s = 60 mm) exhibits the lowest stiffness and the largest mid-span deflection, reaching an ultimate moment of approximately 230 kN·m. In contrast, the beam with the thickest slab (t
s = 120 mm) shows a substantially higher ultimate moment, approaching 370–380 kN·m, along with significantly reduced deflection at similar load levels. The improvement in flexural performance with greater slab thickness is primarily attributed to the increased concrete compression area, which shifts the neutral axis upward and enhances the composite section’s moment of inertia. Consequently, both cracking and yielding are delayed, resulting in greater load-carrying capacity and improved serviceability. The post-cracking region also becomes steeper for thicker slabs, indicating superior stiffness retention and reduced ductility loss as the section transitions into nonlinear behavior.
The prestressing force–moment relationship presented in
Figure 20b confirms the same trend. As the slab thickness increases, the ultimate moment achieved for a given prestressing force consistently rises. Beams with thicker slabs not only utilize the prestressing force more efficiently but also demonstrate a wider nonlinear range, showing that the increased compression zone helps in maintaining equilibrium at higher moment levels. This finding suggests that a thicker concrete slab enhances the effectiveness of the prestressing system by providing better stress distribution and reducing strain concentrations in both the steel and concrete components.
5.4.2. Slab Width
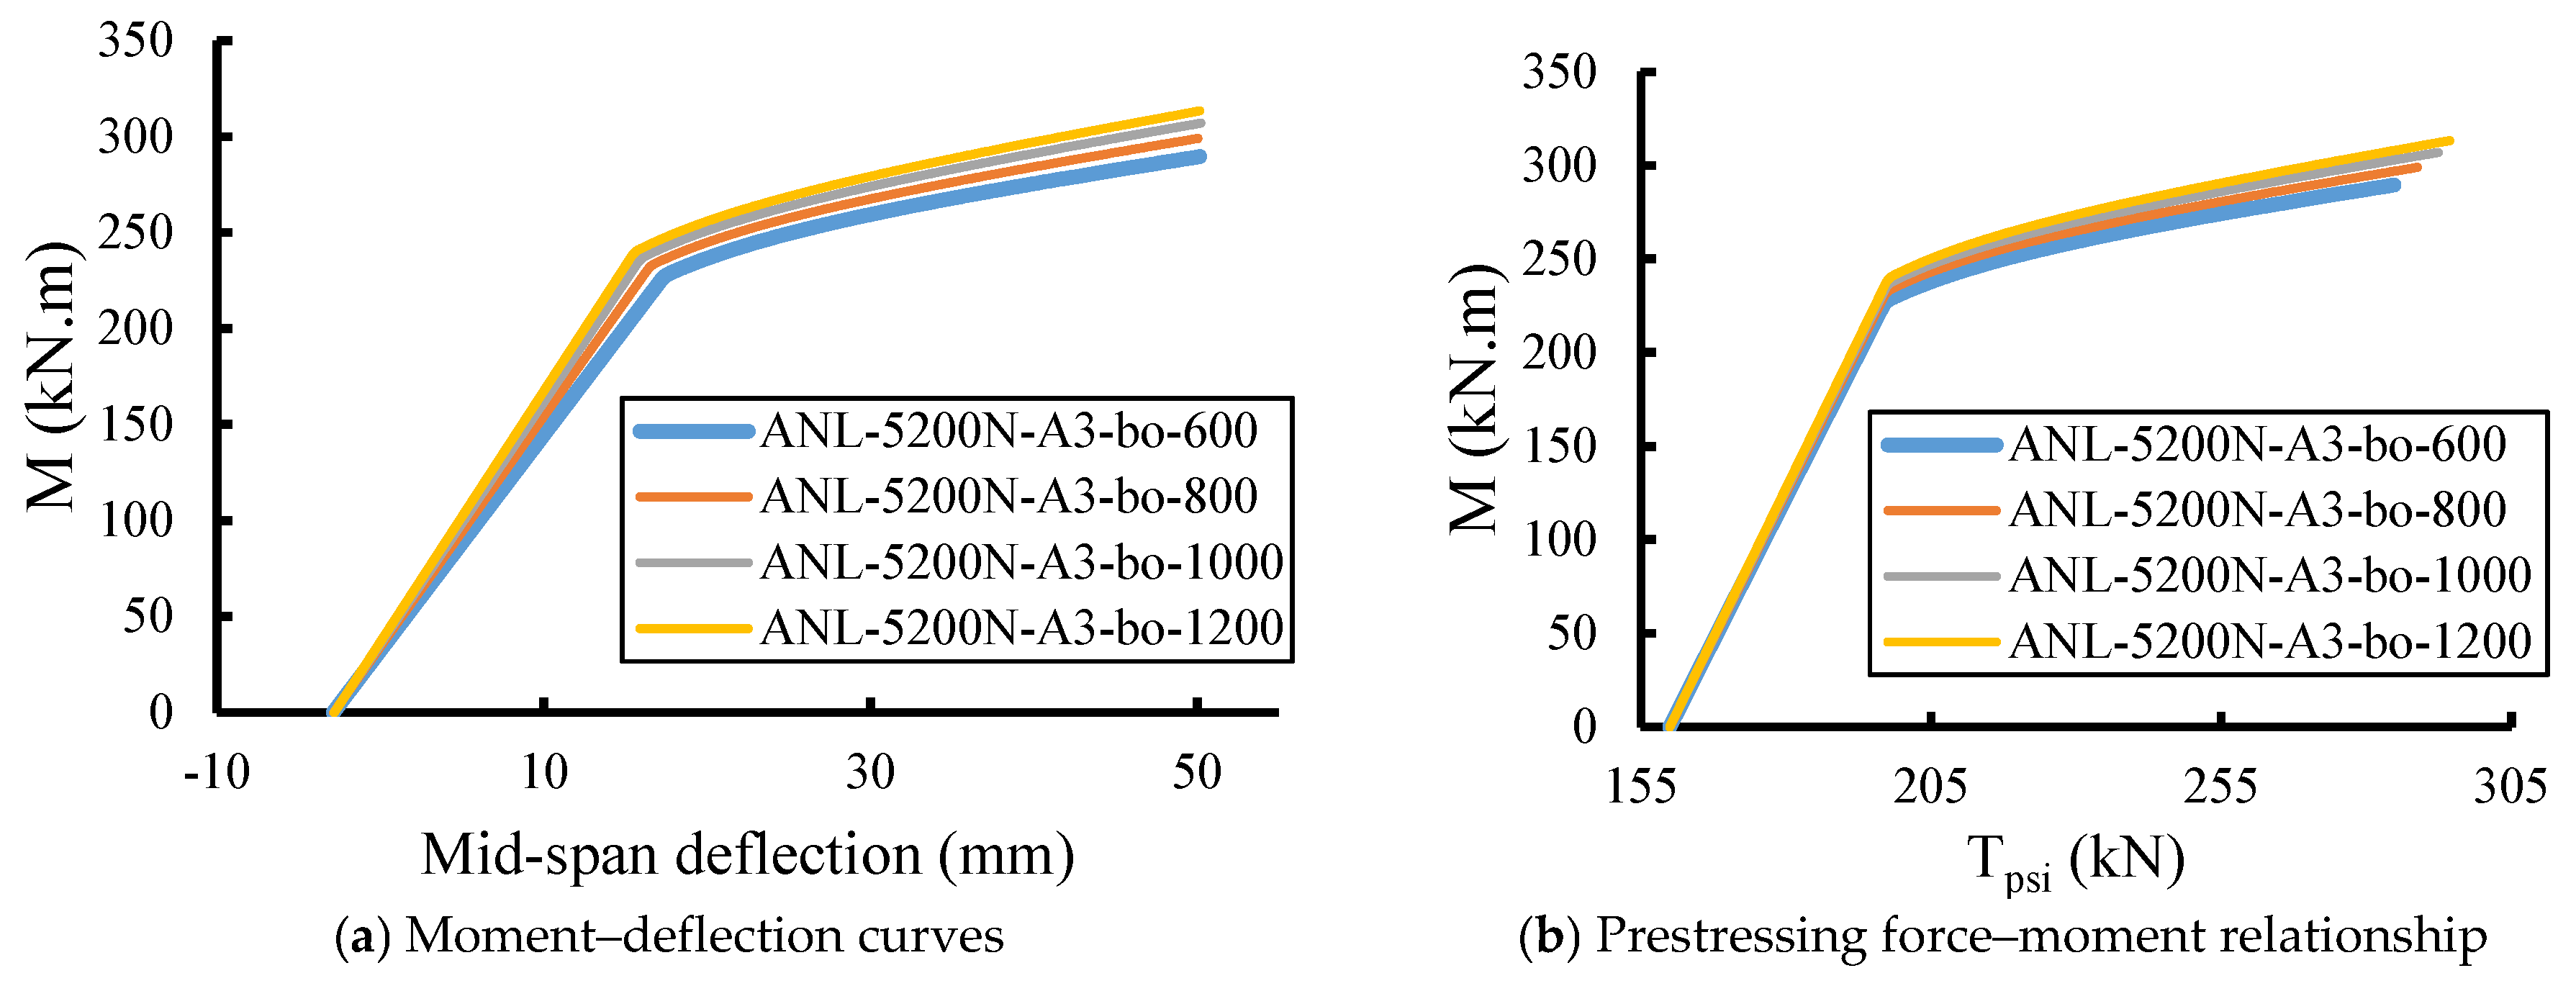
Figure 21 presents the analytical results demonstrating the influence of the reinforced concrete slab width (b
o) on the flexural performance of prestressed composite girders. The studied slab widths were 600 mm, 800 mm, 1000 mm, and 1200 mm, while all other parameters, span length, slab thickness, and material properties, were kept constant. The slab width directly affects the effective composite area, which in turn governs the flexural stiffness, neutral axis position, and distribution of compressive stresses in the composite section.
As shown in
Figure 21a, the moment–deflection curves exhibit a consistent trend of increasing moment capacity and stiffness with wider slab configurations. The specimen with the narrowest slab (b
o = 600 mm) demonstrates the lowest flexural strength and highest mid-span deflection, whereas the girder with the widest slab (b
o = 1200 mm) achieves the maximum ultimate moment, approximately 10–12% higher than that of the narrowest specimen. The initial slopes of the curves indicate improved elastic stiffness as slab width increases, reflecting greater resistance to bending and reduced deformation under service loads. This enhancement arises because a wider slab increases the effective flange width, providing a larger compression zone and improving the moment of inertia of the composite section. Consequently, cracking is delayed, and both the serviceability and ultimate flexural performance are improved. However, the differences among the curves remain moderate, suggesting that the flexural behavior is less sensitive to width variation than to slab thickness.
The prestressing force–moment relationships in
Figure 21b confirm the same general trend. All specimens display similar shapes, but girders with wider slabs exhibit slightly higher moments for the same prestressing force. This indicates that increasing the slab width allows more efficient utilization of prestress, as the additional concrete area in compression reduces stress concentrations and enhances composite interaction. The nearly overlapping curves imply that, while width expansion contributes positively, its effect is secondary compared to other parameters such as slab thickness or prestressing level. Nonetheless, the marginal improvement in both stiffness and ultimate moment demonstrates that slab width plays a supplementary role in enhancing the global flexural response.
5.5. Effect of Steel Section Parameters
5.5.1. Bottom Flange Width
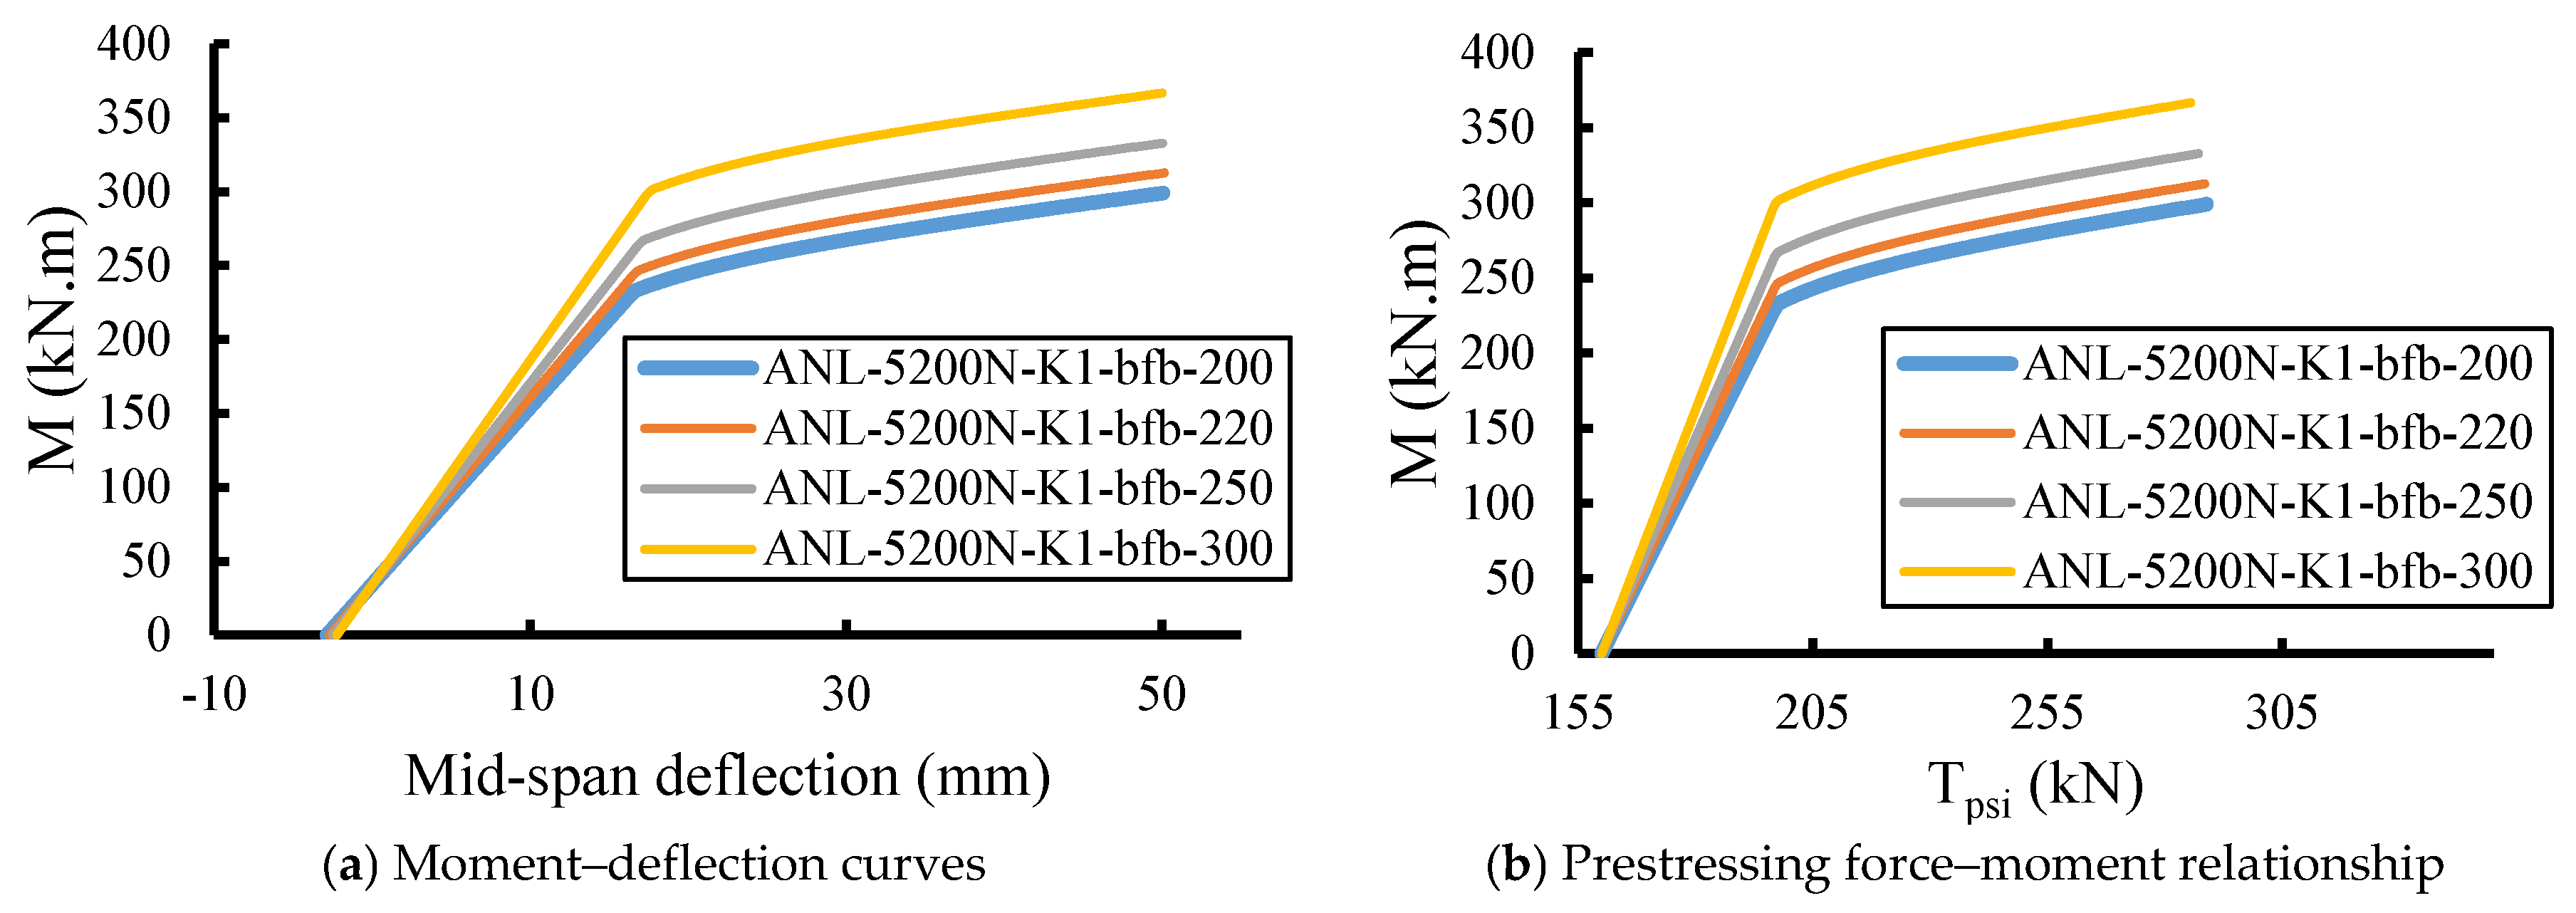
Figure 22 illustrates the effect of the steel bottom flange width (b
fb) on the flexural behavior of prestressed composite girders. Four analytical models were analyzed with bottom flange widths of 200 mm, 220 mm, 250 mm, and 300 mm, while keeping all other parameters constant, including flange thickness, web dimensions, slab geometry, and prestressing conditions. This parameter directly influences the tensile resistance, composite stiffness, and stress distribution in the lower portion of the steel section, which is crucial for flexural capacity and overall ductility.
As shown in
Figure 22a, the moment–deflection curves reveal a distinct increase in both stiffness and ultimate moment capacity as the bottom flange width increases. The specimen with the smallest flange width (b
fb = 200 mm) exhibits the lowest stiffness and ultimate moment (approximately 270 kN·m), whereas the beam with the widest flange (b
fb = 300 mm) reaches the highest ultimate moment of about 370–380 kN·m, with significantly reduced mid-span deflection. The progression between the curves indicates a steady enhancement of flexural performance, with an approximate 30–35% gain in ultimate capacity as the flange width increases from 200 mm to 300 mm. This improvement is attributed to the enlarged tensile area in the bottom flange, which provides greater resistance against bending tension and delays yielding of the steel section. Additionally, a wider bottom flange improves the stress distribution between the steel girder and the concrete slab, resulting in increased composite action and better energy absorption under loading.
The prestressing force–moment relationships in
Figure 22b exhibit a similar trend, showing that girders with wider bottom flanges achieve higher moment capacities for the same level of prestressing force. The curves shift upward with increasing flange width, indicating a more efficient conversion of prestressing force into flexural resistance. For smaller flange widths, the prestressing tendons induce higher localized stresses and early yielding in the steel section, limiting the moment capacity. Conversely, the wider flange provides a more effective anchorage region and a larger area for stress transfer, leading to smoother stress distribution and enhanced utilization of prestressing.
5.5.2. Bottom Flange Thickness
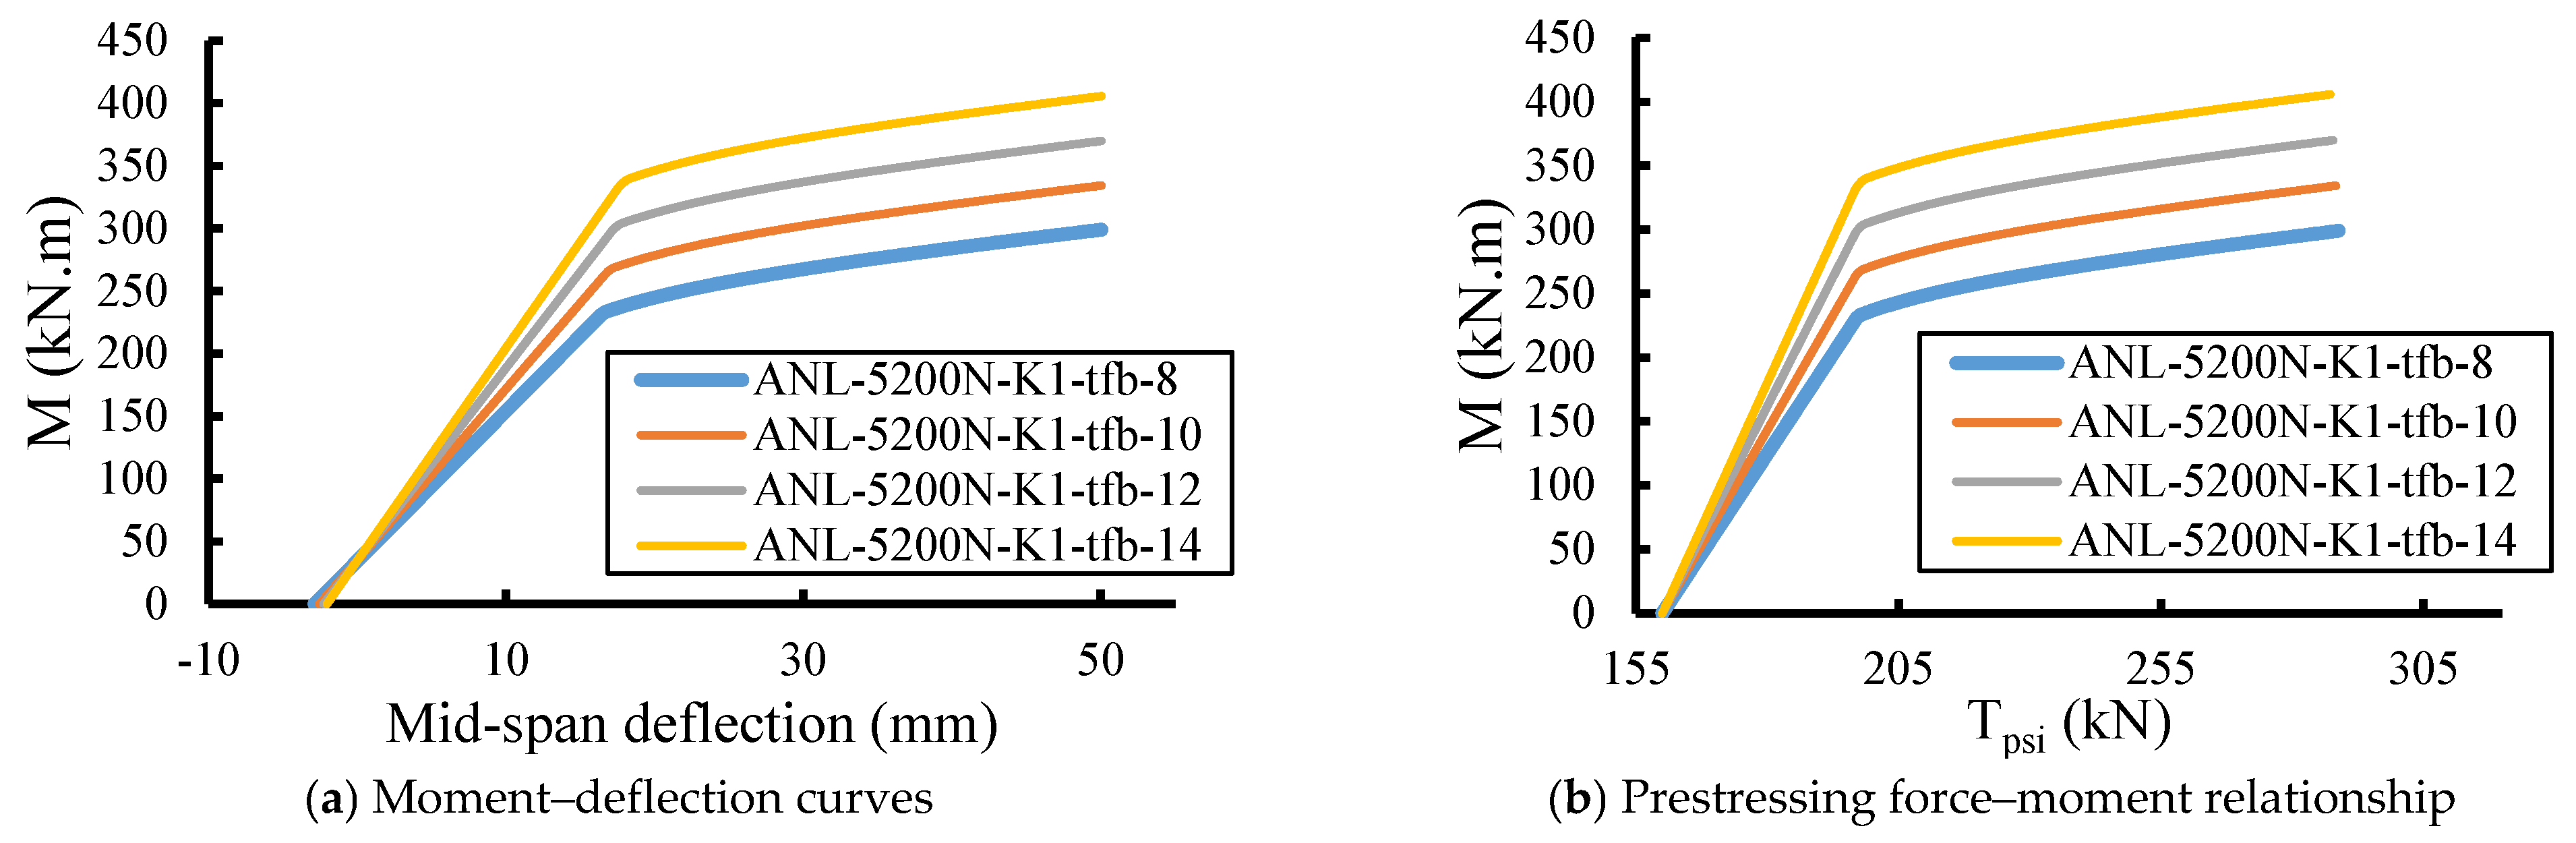
Figure 23 presents the analytical results illustrating the influence of the steel bottom flange thickness (t
fb) on the flexural performance of prestressed composite girders. Four thicknesses, 8 mm, 10 mm, 12 mm, and 14 mm, were investigated while maintaining all other parameters constant, including flange width, web geometry, concrete slab dimensions, and prestressing level. The bottom flange thickness primarily governs the tensile capacity, bending stiffness, and yield strength of the steel girder, all of which strongly influence the overall flexural response of the composite system.
As shown in
Figure 23a, the moment–deflection curves demonstrate a pronounced enhancement in both stiffness and ultimate moment capacity as the bottom flange thickness increases. The specimen with the thinnest flange (t
fb = 8 mm) exhibits the lowest flexural strength, with an ultimate moment of approximately 270 kN·m, and experiences the largest mid-span deflection. In contrast, the girder with the thickest flange (t
fb = 14 mm) achieves an ultimate moment of around 420–430 kN·m, marking an increase of roughly 55–60% compared to the thinnest section. The stiffer response of the thicker flanges is evident from the steeper initial slopes and smaller deflections at equivalent moment levels, indicating greater rigidity and delayed yielding. The improvement is mainly attributed to the increased tensile area and higher moment of inertia of the section, which enhances the overall bending resistance and delays the onset of plasticity in the steel flange.
The prestressing force–moment relationships shown in
Figure 23b reinforce this observation. For a given prestressing force, girders with thicker bottom flanges exhibit significantly higher moment capacities. The upward shift in the curves demonstrates that increasing flange thickness enhances the efficiency of stress transfer from the prestressing tendons to the composite section. In thinner flanges, higher local stresses develop more quickly, leading to premature yielding and limiting the moment gain from additional tendon force. Conversely, thicker flanges provide greater stress redistribution capacity and improved anchorage for the tendons, resulting in higher ultimate strength and more stable post-yield behavior.
5.5.3. Web Depth
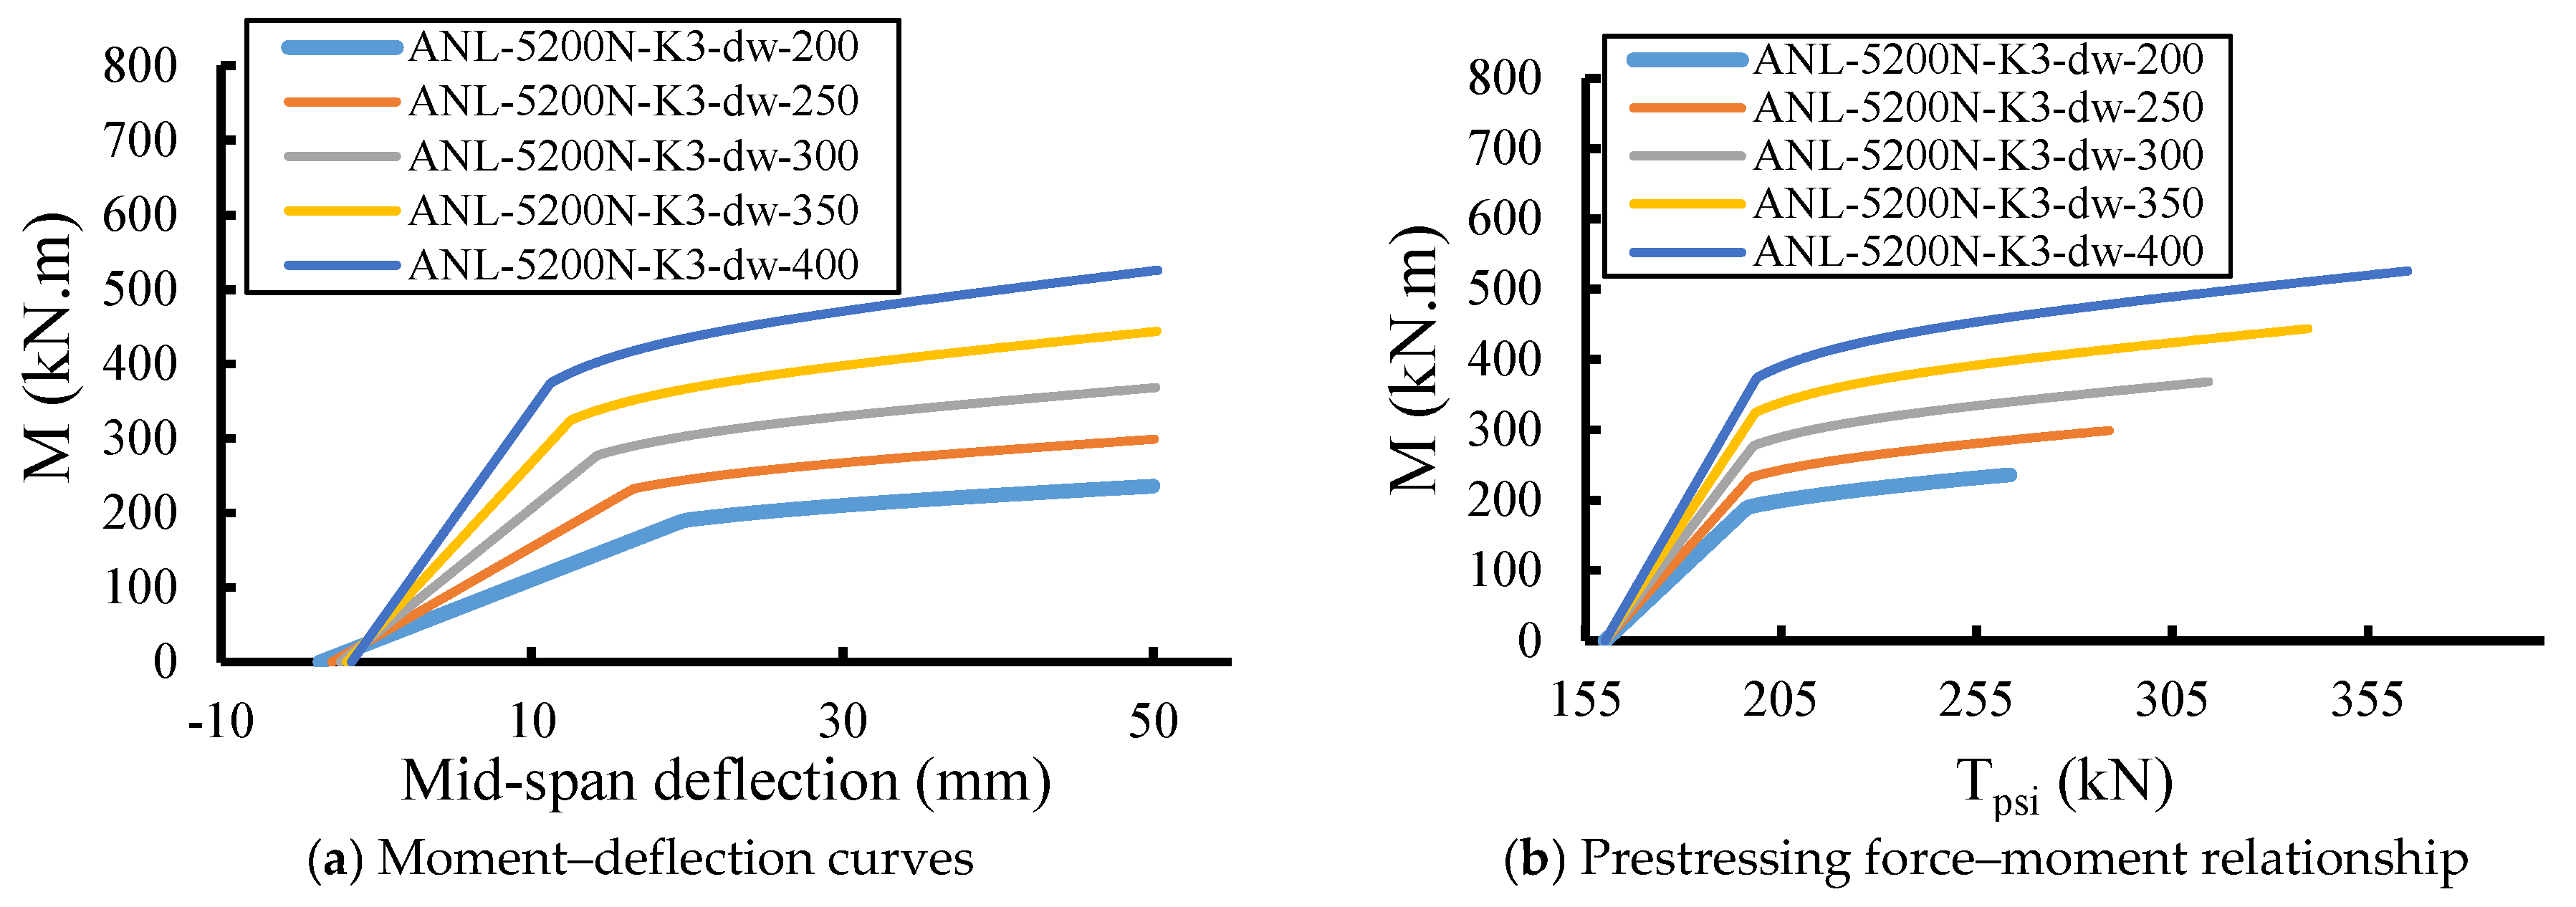
Figure 24 illustrates the effect of the steel web depth (d
w) on the flexural performance of prestressed composite girders. Five analytical models were examined with web depths of 200 mm, 250 mm, 300 mm, 350 mm, and 400 mm, while all other geometric parameters (flange dimensions, slab geometry, and prestressing force) were held constant. The web depth plays a dominant role in determining the sectional stiffness, moment of inertia, and overall flexural strength, as it directly influences the distance between the compression and tension zones and the efficiency of composite action.
As shown in
Figure 24a, the moment–deflection curves reveal a significant enhancement in both stiffness and ultimate moment capacity as the web depth increases. The beam with the smallest web depth (d
w = 200 mm) shows the lowest flexural strength, with an ultimate moment of approximately 300 kN·m and relatively large deflections at mid-span. In contrast, the specimen with the largest web depth (d
w = 400 mm) demonstrates a much higher ultimate moment, approaching 780–800 kN·m, along with a considerably stiffer response and smaller deflection. This represents an increase of more than 150% in load-carrying capacity compared with the shallowest section. The observed improvement is attributed to the increase in the sectional modulus (S = I/c) and the moment of inertia (I) with greater web depth, which enhances both the elastic stiffness and the ultimate bending resistance. A deeper web provides a larger lever arm between the compression zone in the concrete slab and the tension zone in the steel flange, thereby improving the structural efficiency of the composite section. The steeper initial slope and delayed yielding in the deeper webs further confirm that flexural rigidity and strength are strongly dependent on this parameter.
The prestressing force–moment relationships shown in
Figure 24b exhibit a consistent pattern, where the moment capacity at a given prestressing force increases markedly with web depth. Beams with deeper webs display a more gradual rise in moment with prestressing force, indicating more efficient utilization of prestress due to the enhanced section stiffness and reduced strain concentrations in the steel section. For shallower sections, the tendons contribute less effectively because the reduced depth limits the stress gradient, causing earlier yielding and a steeper loss of stiffness beyond the elastic range. Conversely, deeper webs ensure better distribution of stresses, improved compatibility between concrete and steel, and greater energy absorption before failure.
5.5.4. Web Thickness
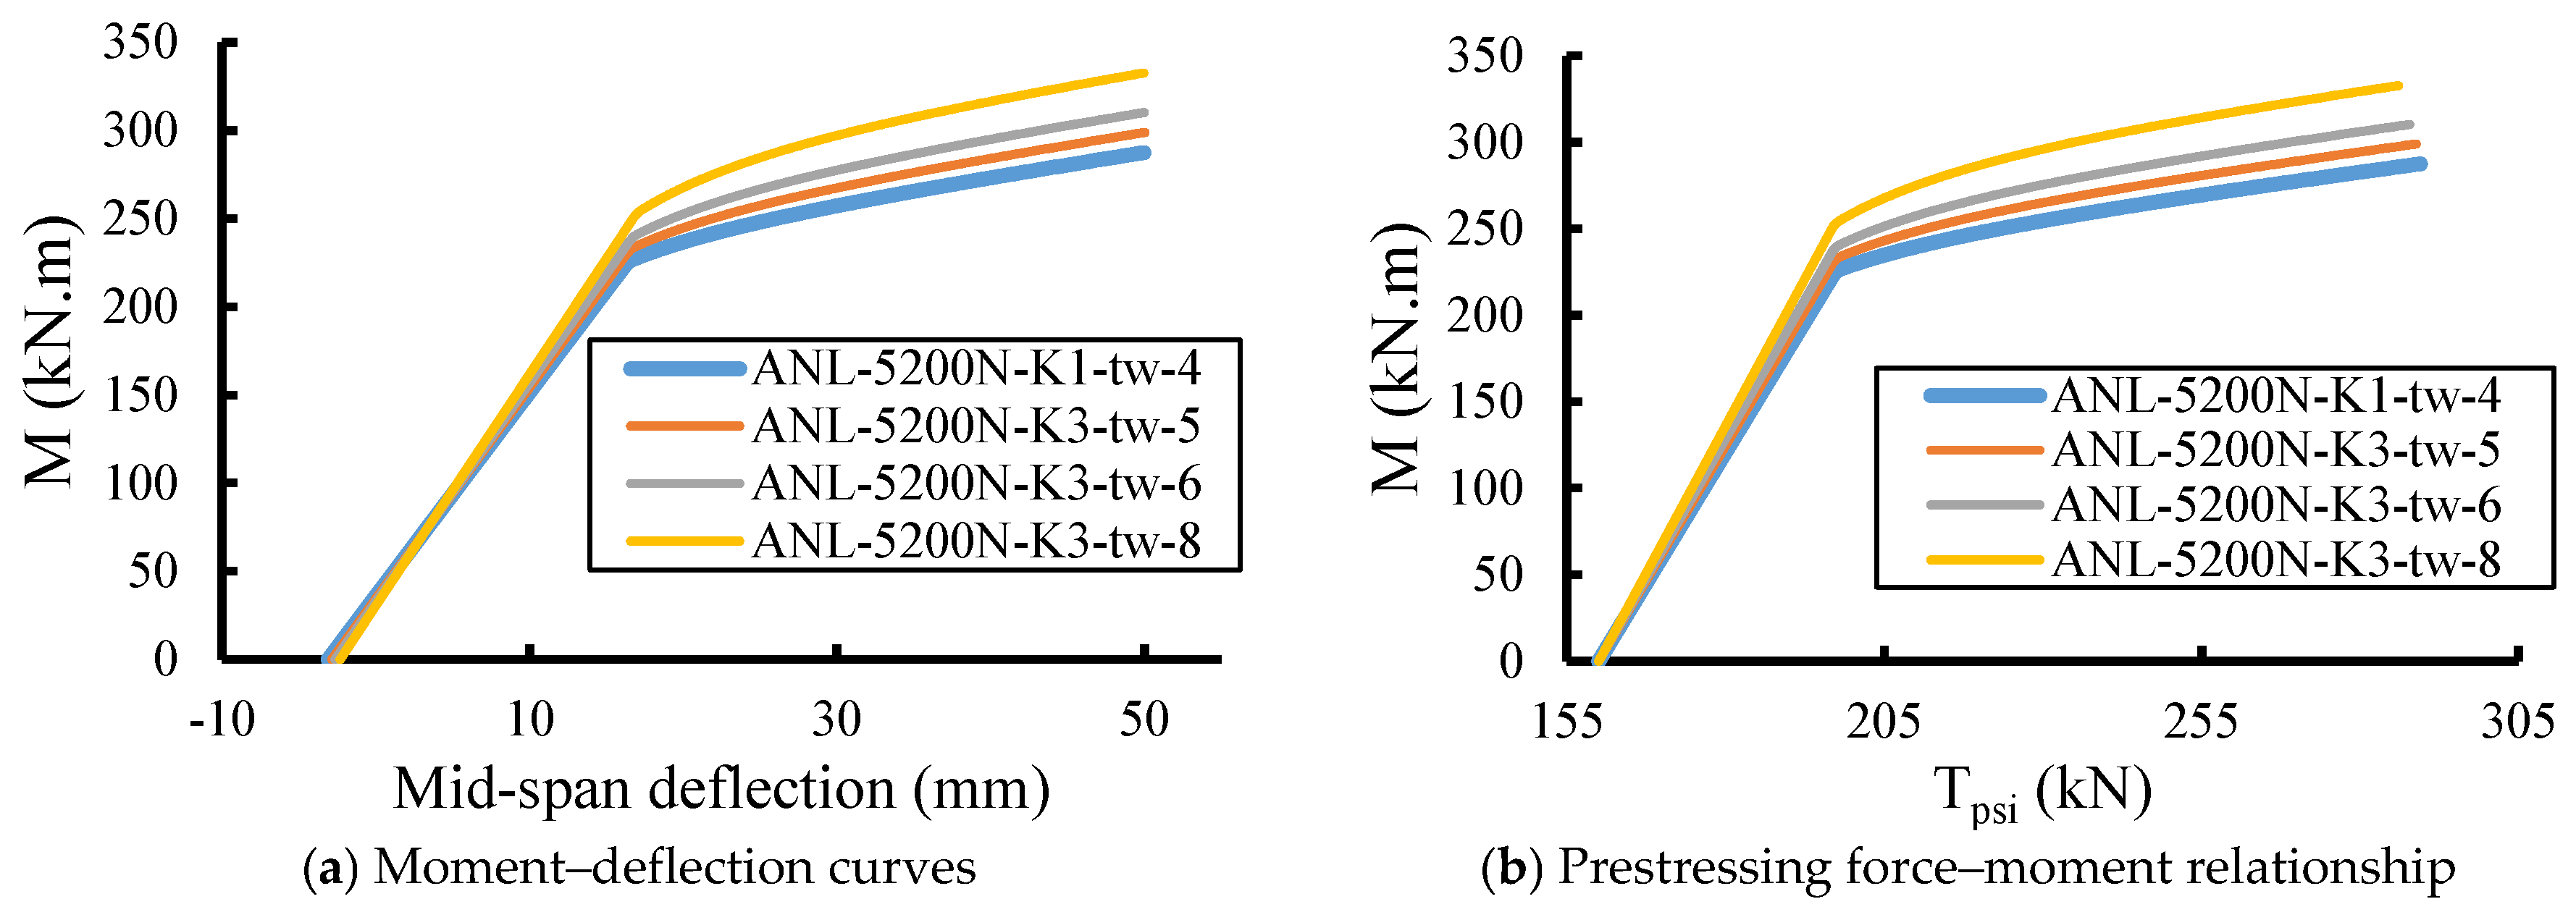
Figure 25 illustrates the influence of the steel web thickness (t
w) on the flexural response of prestressed composite girders. Four analytical models were analyzed with web thicknesses of 4 mm, 5 mm, 6 mm, and 8 mm, while keeping all other parameters constant (including web depth, flange geometry, slab properties, and prestressing force). The web thickness directly affects the shear resistance, local buckling capacity, and overall flexural stiffness of the composite section, making it an important factor in the structural behavior of slender steel webs under combined bending and prestressing.
As shown in
Figure 25a, the moment–deflection curves exhibit a consistent improvement in flexural strength and stiffness as the web thickness increases. The specimen with the thinnest web (t
w = 4 mm) shows the lowest ultimate moment of approximately 260 kN·m, along with larger mid-span deflection. Conversely, the girder with the thickest web (t
w = 8 mm) achieves the highest ultimate moment, approaching 330–340 kN·m, and displays the smallest deflection. This trend indicates that a thicker web enhances the overall bending resistance and stiffness by providing greater confinement to the flanges and delaying web yielding or local buckling. The increased web thickness also strengthens the shear transfer mechanism between the steel and concrete components, resulting in improved composite action. The post-yield response shows that thicker webs maintain a higher residual stiffness, demonstrating better energy dissipation and reduced nonlinear deformation.
The prestressing force–moment relationship in
Figure 25b confirms these findings. Beams with thicker webs exhibit slightly higher moment capacities for the same level of prestressing force, reflecting a more efficient interaction between prestressing tendons and the steel section. The curves for thicker webs (6 mm and 8 mm) display an extended nonlinear range, suggesting improved ductility and stress redistribution capacity before reaching the ultimate state. Meanwhile, the difference between the 4 mm and 5 mm webs is relatively small, indicating that a minimum threshold thickness (around 5–6 mm) is required for effective prestress utilization and stiffness enhancement. Beyond this range, the rate of improvement tends to decrease, implying diminishing returns for excessively thick webs in terms of flexural strength.
6. Conclusions
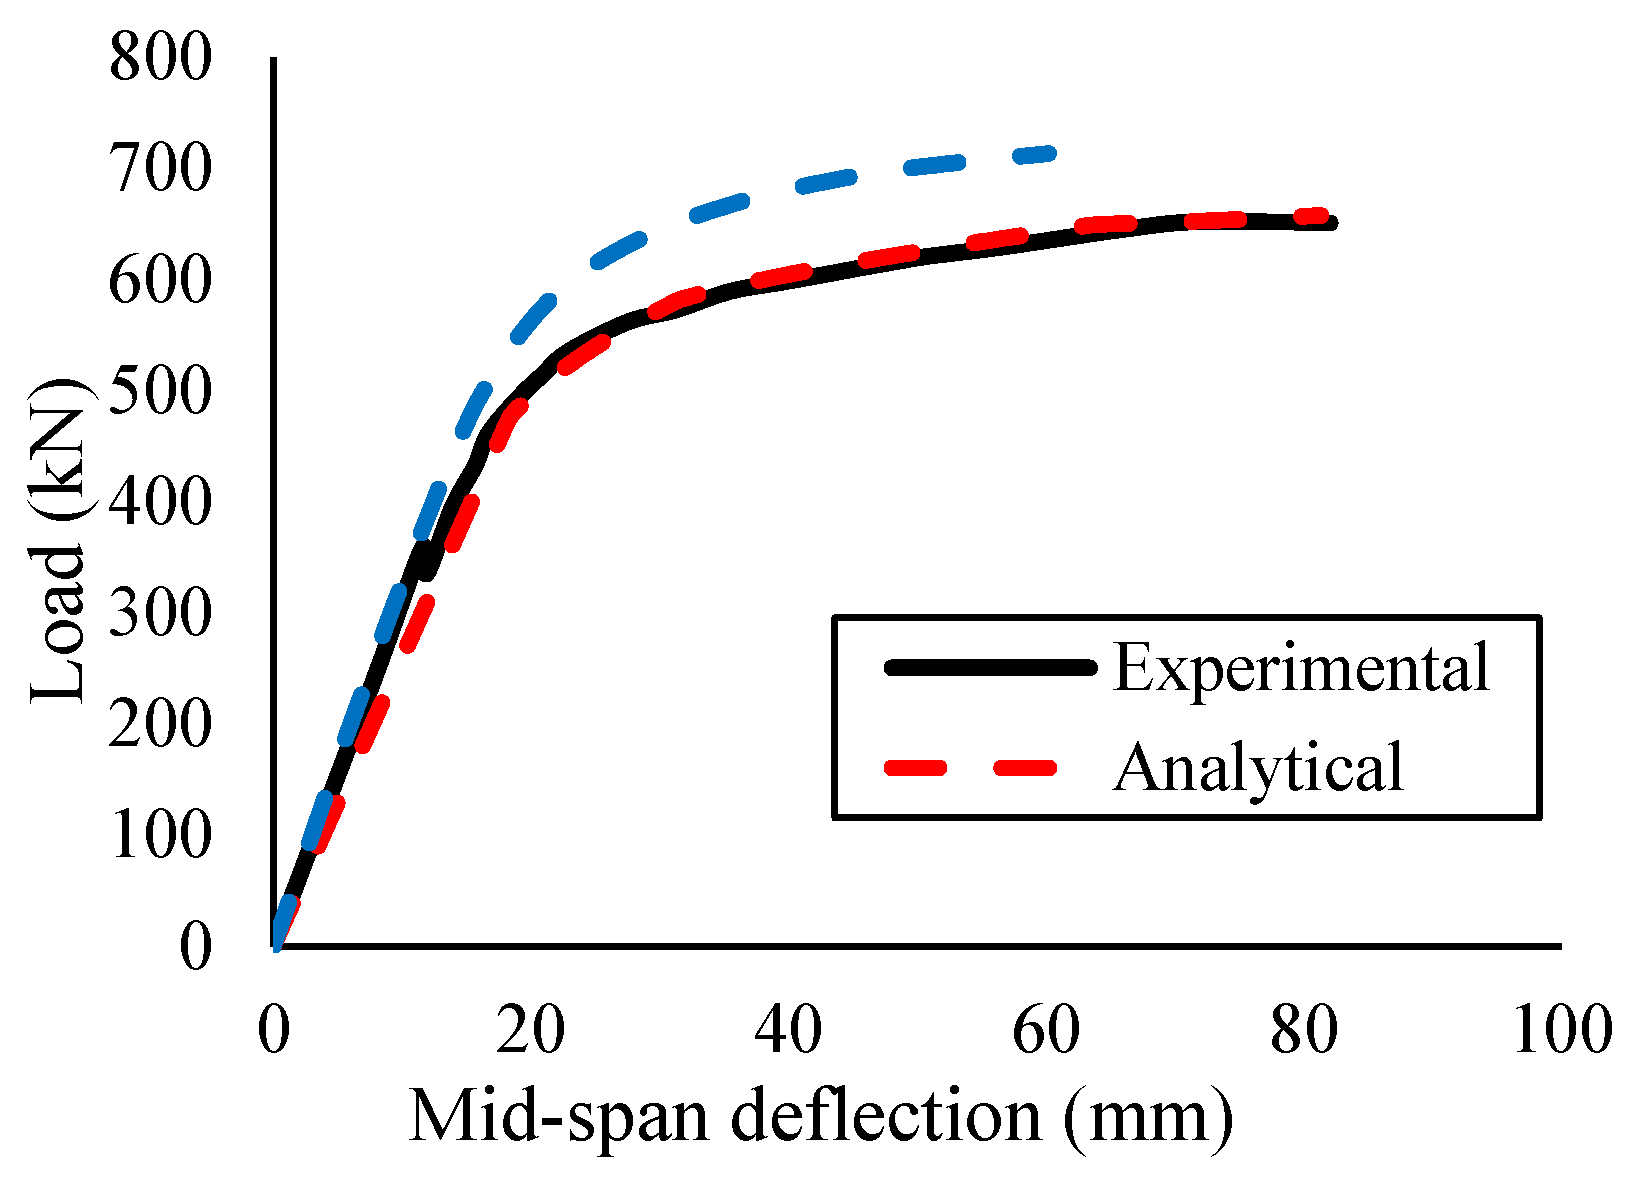
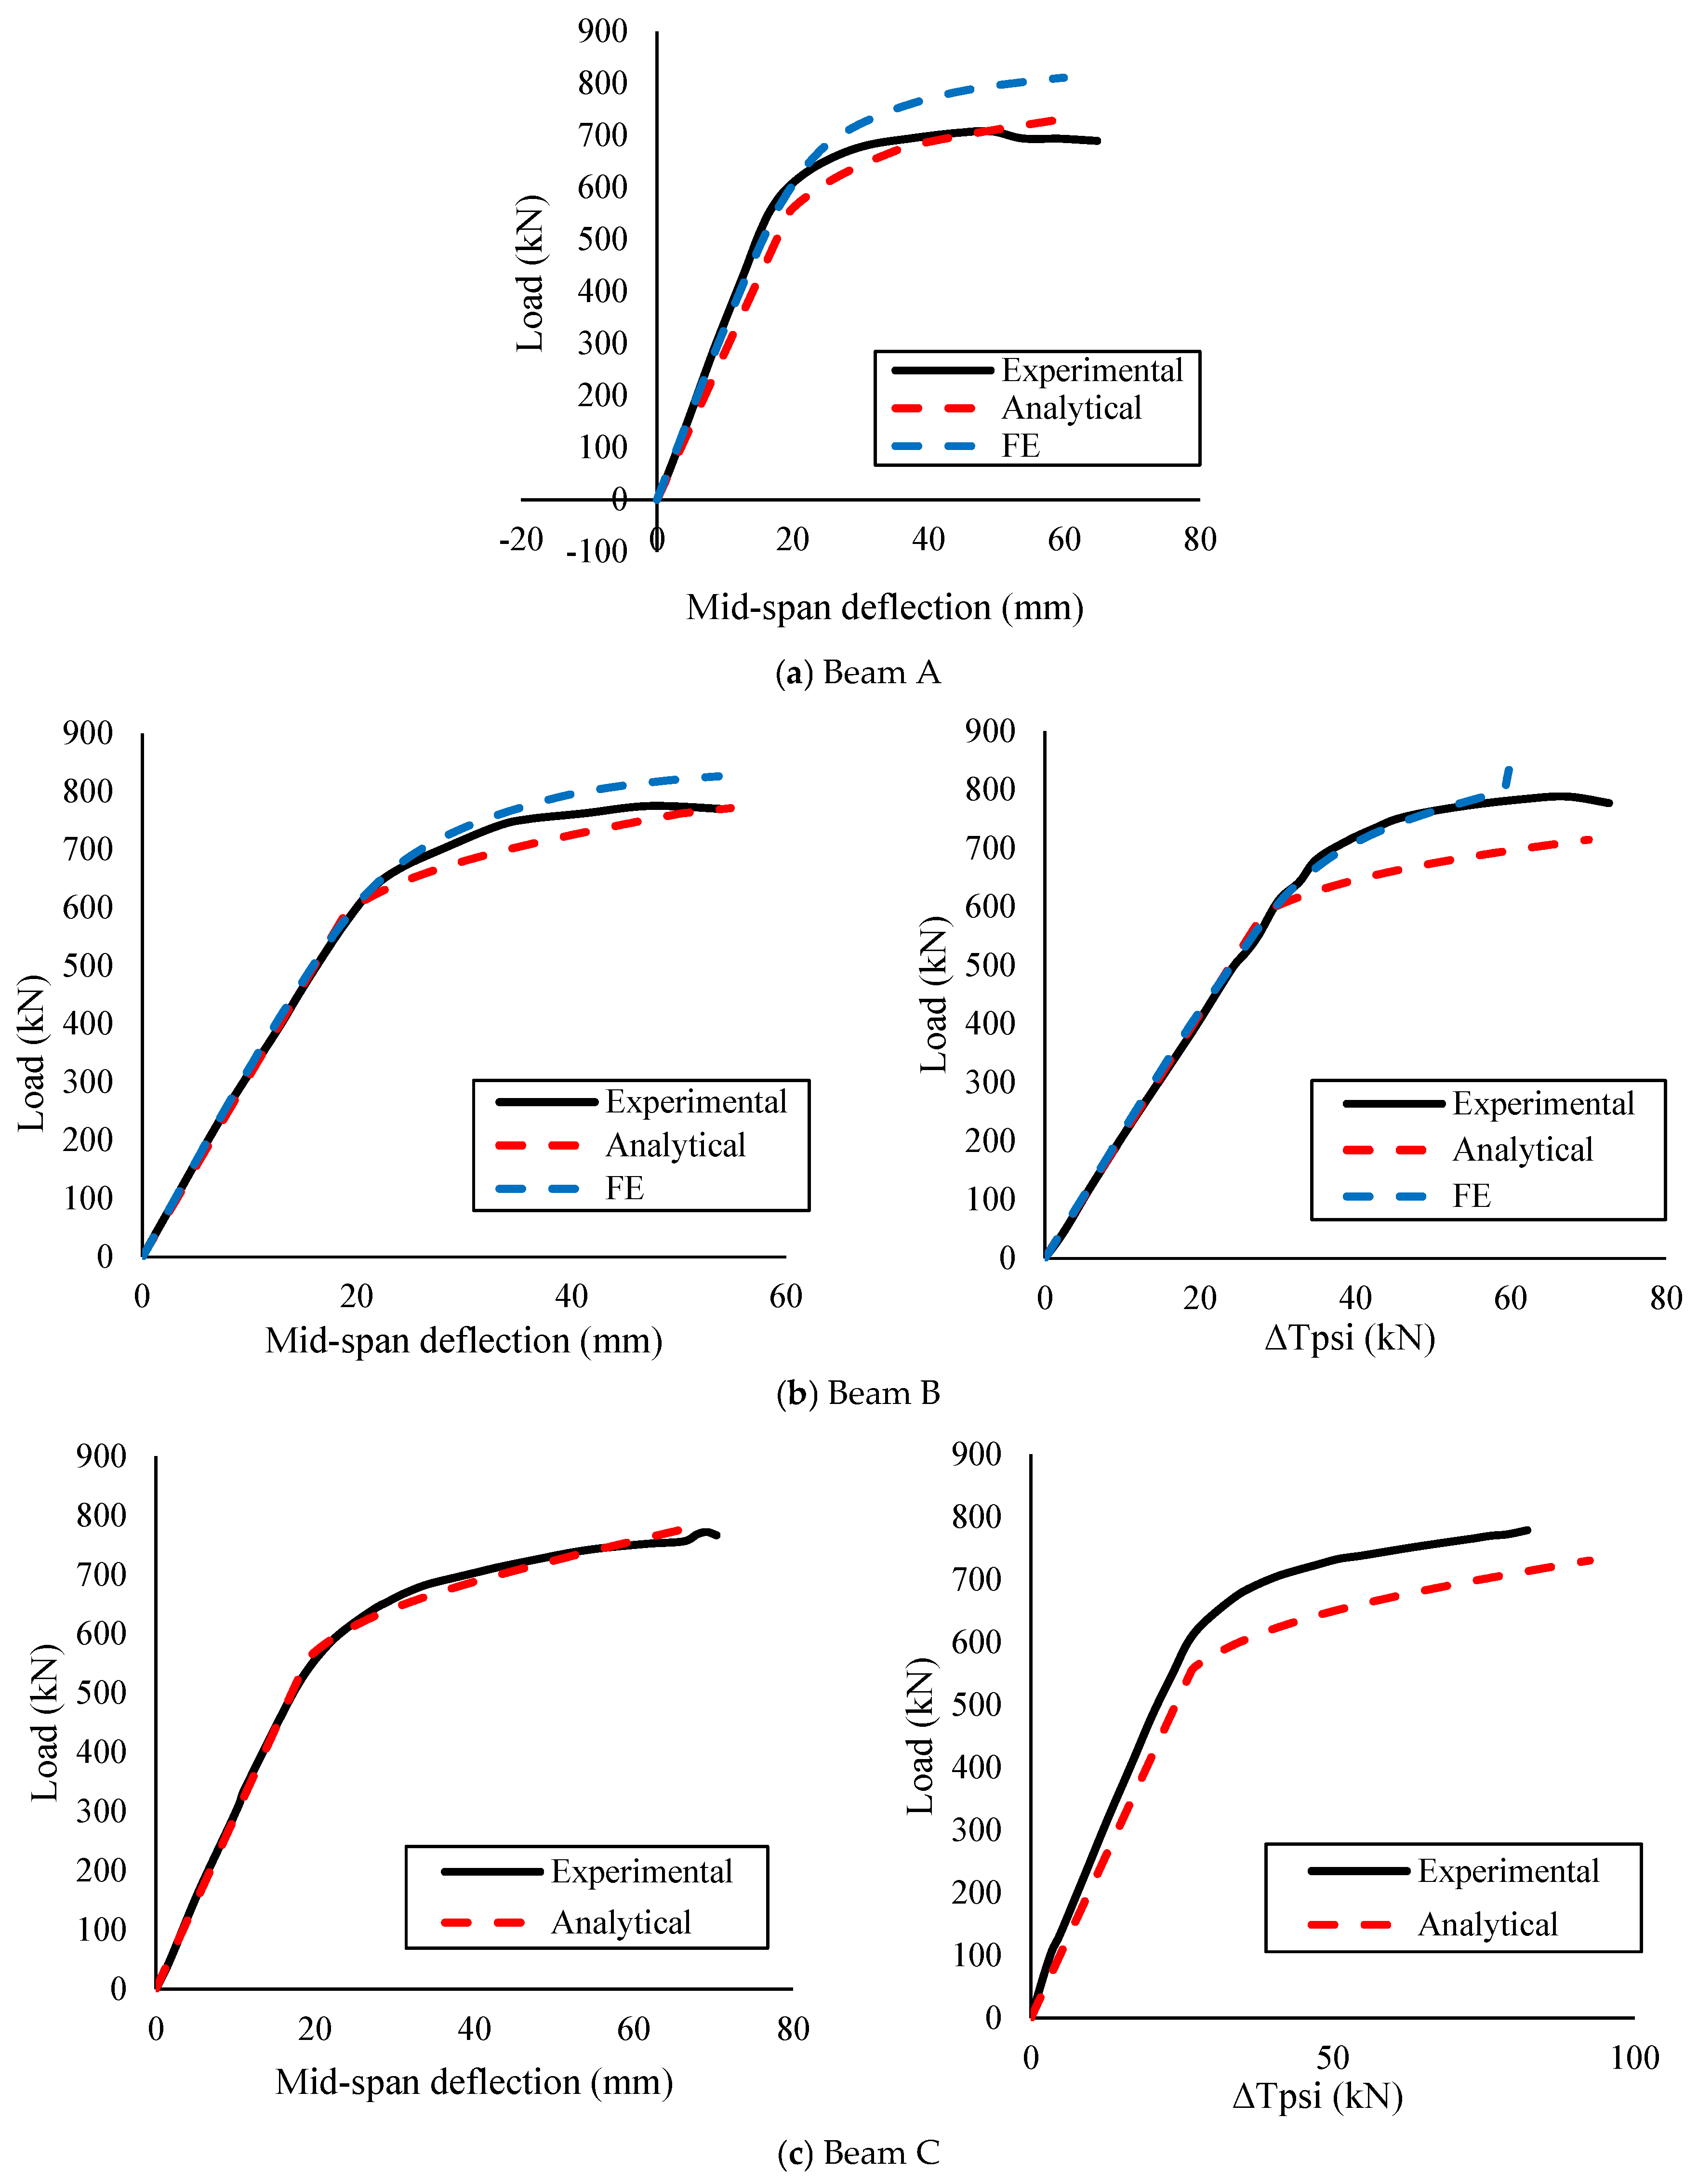
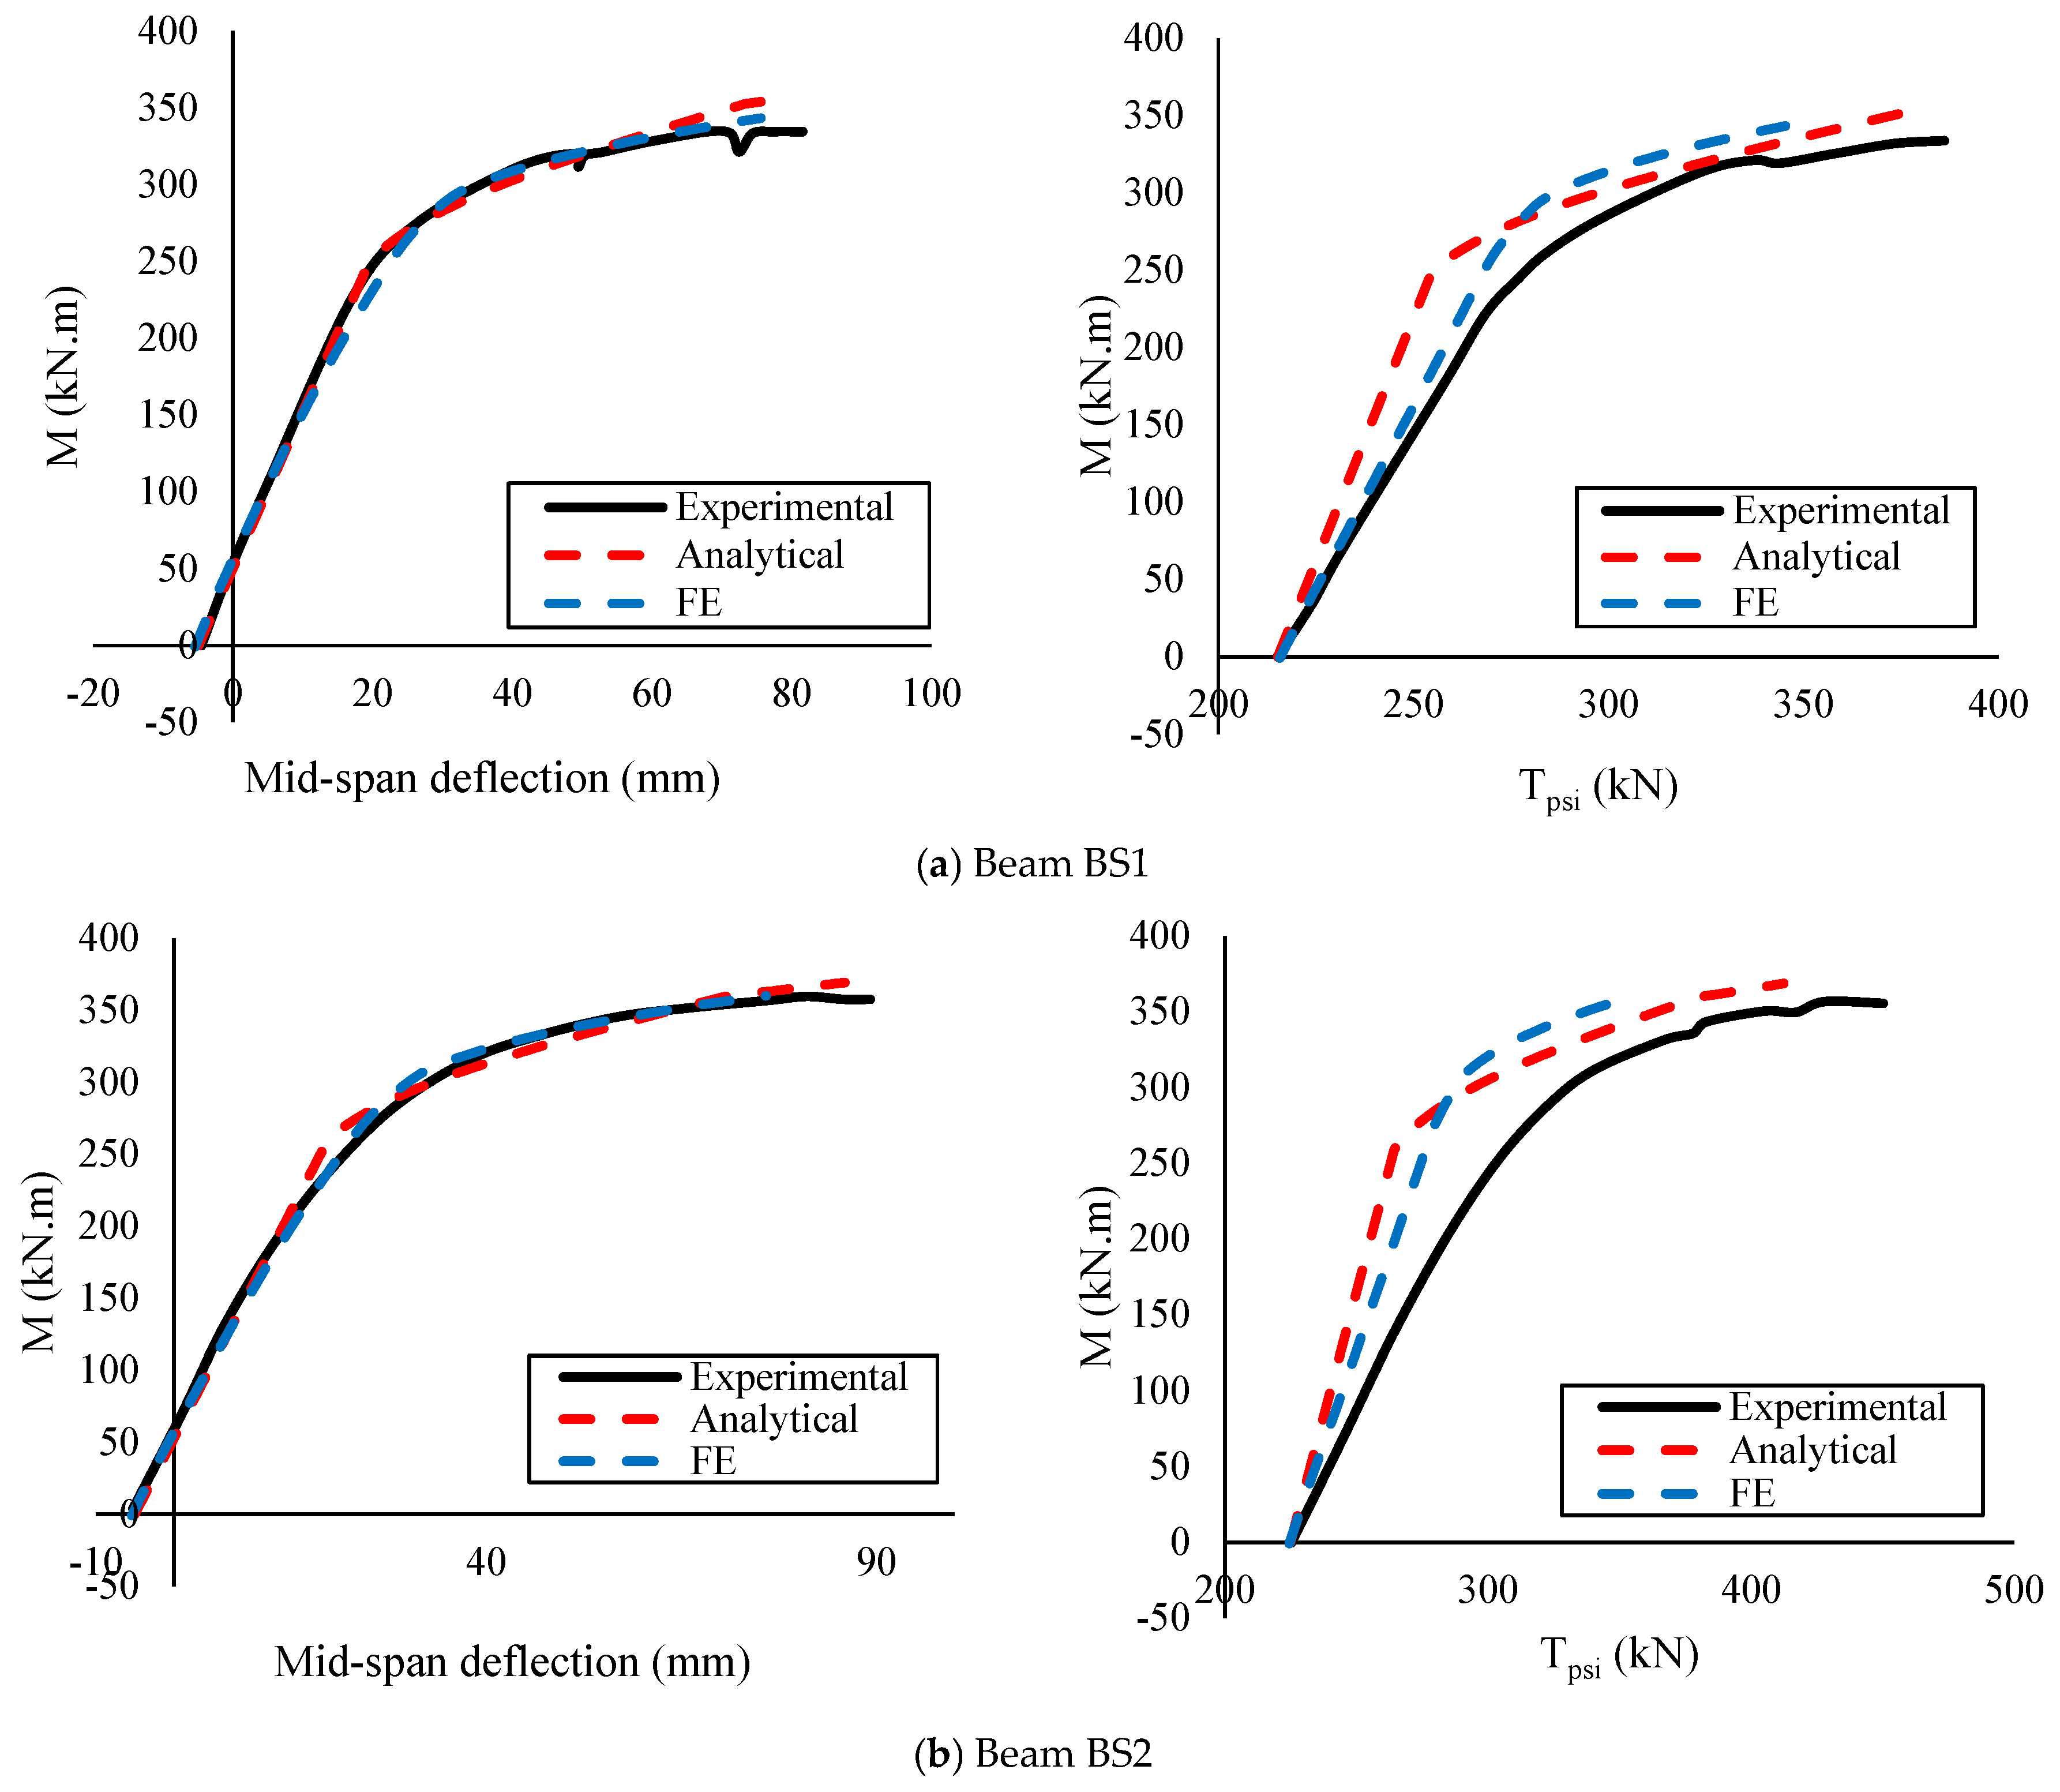
This study developed a detailed analytical framework capable of accurately predicting the flexural behavior of EPCIBs under positive bending. The analytical model, formulated using strain compatibility and internal force equilibrium while incorporating elastic–plastic material behavior, was rigorously validated against three independent experimental programs and nonlinear finite element (FE) simulations.
The model demonstrated excellent predictive capability, with differences in ultimate moment within 5–8%, mid-span deflection within 6–10%, and tendon-stress increments within less than 6% of measured experimental values. Comparisons with FE simulations showed similarly strong agreement, with ultimate moment discrepancies generally below 8%, confirming the reliability of the proposed approach across multiple verification platforms.
Increasing initial prestressing force from 160 kN to 300 kN enhanced ultimate moment capacity by 10–15% and reduced service deflection by approximately 18%.
Modifying the concrete slab significantly affected composite action: increasing slab thickness from 60 mm to 120 mm increased ultimate moment from 230 kN·m to 380 kN·m (a 65% increase), while doubling slab width produced moderate gains of 10–12%.
Variations in steel-section geometry showed the most pronounced effects. Increasing bottom-flange thickness from 8 mm to 14 mm improved capacity by 55–60%, increasing flange width from 200 mm to 300 mm raised moment resistance by 30–35%, and increasing web depth from 200 mm to 400 mm more than doubled the capacity (up to 150%, reaching 780–800 kN·m). In contrast, web-thickness changes (4–8 mm) yielded smaller improvements of 25–30%.
The analytical framework presented in this study provides an accurate, efficient, and practical tool for evaluating and optimizing the flexural behavior of externally prestressed composite girders. The model’s strong agreement with experimental and FE results, combined with its ability to capture the effects of prestressing level, slab properties, and steel-section dimensions, supports its use in design, strengthening, and assessment of EPCIB systems. From an economic perspective, externally prestressed systems improve structural efficiency by increasing load-carrying capacity and reducing service deflections, which may lead to optimized section dimensions and reduced material usage in practical design applications.
Limitations and Future Work
This study investigated the global flexural response of externally prestressed composite I-beams under monotonic loading through simplified analytical and numerical approaches. Some structural effects, including local buckling of steel components, geometric imperfections, residual stresses, interface slip between steel and concrete, fatigue and cyclic loading, and corrosion-related deterioration, were not included in the present analysis.
Further studies are needed to extend the proposed approach to continuous beams, prestress losses with time, tendon deviator arrangements, and shear–flexure interaction. Considering durability-related effects, such as corrosion-induced prestress reduction and degradation of the steel–concrete interface, would also improve the applicability of externally prestressed composite systems in practical engineering applications.