Article

Thermal Performance of Artificial Turf for Roof Greening in Northern China: Insulation, Dissipation, and Urban Heat Island Mitigation

School of Architecture and Fine Art, Dalian University of Technology, Dalian 116024, China
*
Author to whom correspondence should be addressed.
Buildings 2026, 16(12), 2452; https://doi.org/10.3390/buildings16122452
Submission received: 24 May 2026 / Revised: 11 June 2026 / Accepted: 17 June 2026 / Published: 20 June 2026
(This article belongs to the Section Building Energy, Physics, Environment, and Systems)

Abstract

The northward shift in climate zones and the urban heat island effect demand passive cooling for building roofs in northern regions. Artificial turf is a lightweight candidate, but existing studies treat it as homogeneous material, overlooking blade morphology and roof-scale thermal performance. This study conducted a scaled indoor experiment using a 1 m3 building model. Three artificial turfs with different blade lengths (Type A long, Type B medium, Type C short) were compared against concrete and XPS roofs under simulated summer solar radiation. Results show that blade morphology governs thermal performance. Type A exhibited the lowest peak surface temperature (48.9 °C vs. 53.4 °C and 60.6 °C), and its interface temperature (37.0 °C) was 15.1–19.0 °C lower than Types B and C, attributed to a static air insulation layer and enhanced convection. Its cooling rate (0.98 °C/min) was 1.69–2.33 times faster. Compared to concrete and XPS, Type A had lower surface temperature, less downward heat conduction, and a 29.3 °C drop in 30 min (concrete: 22.3 °C; XPS: 21.7 °C), showing urban heat island mitigation potential. Its heat flux reduction ratio reached 42.9%, with equivalent thermal resistance of ~0.40 m2·K/W, reducing summer peak indoor temperature by 3–6 °C in aging buildings. Double-layer stacking underperformed a single long-blade layer due to heat accumulation. Optimised long-blade turf challenges the view that low albedo inevitably causes high temperature, offering dual benefits of insulation and rapid dissipation for passive cooling in urban renewal.

1. Introduction

1.1. Research Background

Over the past half-century, driven by climate change, global climate zones have exhibited a pronounced northward shift. Studies indicate that northern China has experienced a temperature increase of 2.5–3.0 °C, with high-latitude areas warming by up to 4 °C, causing the northern boundary of the subtropical zone to shift northward by more than 1.3 degrees of latitude in some regions [1]. This change has directly led to more frequent and intense summer heatwaves in northern cities, posing unprecedented demands on building thermal insulation and urban cooling.
At the same time, the urban heat island (UHI) effect induced by high-density urban construction further aggravates thermal environmental pressures, threatening resident health, building energy consumption, and urban ecological security. Taking Shenyang, a typical industrial city in northern China, as an example, research has shown that land surface temperatures in its built-up areas are significantly higher than those in surrounding suburbs, creating a pronounced UHI [2]. Therefore, finding building and urban cooling technologies that can effectively mitigate the UHI while adapting to northern climatic conditions has become an urgent scientific and engineering challenge.
As a major component of urban underlying surfaces [3], building roofs absorb substantial solar radiation and are thus a key factor exacerbating urban thermal problems. Against this background, roof greening is widely recognized as an effective ecological technology for mitigating the UHI and improving building thermal performance. Traditional intensive or semi-intensive green roofs have been proven to effectively reduce roof surface temperatures, cut building heat gains, and provide ecological benefits through plant transpiration, shading, and substrate thermal insulation [4]. However, their promotion faces several core bottlenecks: climatic constraints, structural load limitations [5], high water consumption [6], and high maintenance costs and technical requirements [7].
Thus, can artificial turf replace natural turf—especially in northern regions where natural turf use is restricted—to deliver comprehensive benefits in climate regulation and environmental beautification?

1.2. Comparison Between Natural Turf and Artificial Turf

Natural turf reduces surface and air temperature through transpiration and shading. A recent study by Peking University, published in Nature Cities, found that turf adopts a “rapid response mode” during heatwaves. Its stomata remain open even under high heat and radiation. Evapotranspiration increases by 37.65% on average. This leads to a short-term decrease in surface temperature [8]. He Yunfei et al. used EnergyPlus to simulate green roofs in Nanjing. They showed that green roofs regulate roof surface temperature through evapotranspiration and insulation. In summer, the maximum cooling reaches 29.3 °C. In winter, the maximum warming reaches 13 °C. For intensive green roofs, summer cooling load reduction is 2.4%. Winter heating load reduction is 28.3%. Annual building energy saving ranges from 1.9% to 5.9% [9]. Natural turf also provides a green visual environment. This environment is positively related to human emotions. It has a restorative effect on mental health [10].
However, natural turf faces major obstacles when applied to rooftops in northern cities. In summer, it requires high irrigation and maintenance costs. In winter, severe cold kills the turf. It loses its aesthetic function. In building retrofits, the thick growing medium adds heavy loads. It may threaten older building structures. These limitations have led researchers to explore artificial turf as an alternative.
Artificial turf cannot regulate temperature through transpiration. This limits its climate regulation ability. However, our preliminary experiment compared artificial and natural turf cooling effects. We found that artificial turf dissipates heat well. It cools down quickly. At night, it may rapidly release the heat absorbed during the day. This could have a positive effect on the urban night environment. Artificial turf also has clear practical and economic advantages. These advantages can be grouped into three aspects.
Lightweight advantage: Artificial turf has a very low dead load. It imposes almost no extra load on building structures. This makes it especially suitable for retrofitting old buildings [11].
Maintenance-free advantage: Artificial turf needs no irrigation, mowing, or fertilising. Long-term operational costs are very low. Installation is quick. It provides an immediate greening effect.
Landscape and psychological value: Artificial turf is designed to look like natural grass. A study from Tongji University showed that artificial turf positively affects human psychology. It makes people feel relaxed and joyful [12]. Thus, like natural turf, it can relieve stress and beautify the environment. It also provides a comfortable space for urban residents.
In summary, natural turf is superior in many ways. However, its use in northern regions is unavoidably restricted. Artificial turf offers similar positive effects in climate adaptability, visual appearance, and maintenance cost. It is a viable alternative.

1.3. Research Problem

Existing studies have preliminarily revealed the thermophysical deficiencies and potential thermal insulation value of artificial turf, but three key research gaps remain. First, there is a misalignment of research scenarios. The vast majority of thermal measurements on artificial turf have been conducted on ground sports fields or urban parks, whereas the rooftop environment features higher wind speeds, stronger radiation exposure, and the thermal coupling effect of the indoor space below. Whether ground-based conclusions can be directly extrapolated to rooftops lacks experimental evidence. Second, there is a lack of quantitative analysis on the independent role of “blade morphology”. Existing literature largely treats artificial turf as a homogeneous material, emphasizing its intrinsic properties of low albedo and low heat capacity, while overlooking the regulatory effects of structural parameters such as blade length, density, and porosity on convective heat dissipation and the air insulation layer. This leads to a key question: can the thermal insulation and heat dissipation performance of artificial turf be improved by optimizing blade morphology without changing the material composition? No study has yet answered this question. Third, the net value of the diurnal dual effect has not been quantified. During the day, artificial turf absorbs substantial radiation and reaches high surface temperatures, potentially exacerbating the urban heat island; at night, however, its rapid heat dissipation may alleviate the tropical night phenomenon. What is the net value of these two effects at the rooftop scale? What are its advantages and disadvantages compared to conventional roofing materials (concrete, XPS insulation board)? These issues directly determine whether artificial turf can serve as a climate-adaptive roofing technology in northern regions.
Based on the above research gaps, this study proposes the following core research questions: What are the differences in the thermal performance of artificial turf with different blade morphologies at the rooftop scale? What is the mechanism linking structural parameters to performance? Compared with conventional roofing materials, does artificial turf offer comprehensive advantages in terms of “daytime insulation” and “nighttime heat dissipation”? Can structural optimizations such as double-layer stacking and ventilated air gaps further improve the thermal performance of artificial turf?
The significance of this study lies in its quantitative evaluation, through rigorous experiments and simulations, of the thermal benefits and climatic impacts of artificial turf as a roof covering material. It first clarifies the physical properties of artificial turf at the building level, including thermal insulation and cooling rates, thereby laying the groundwork for subsequent simulations on whether artificial turf roofs can regulate the urban climate. Ultimately, this study aims to provide a feasible, lightweight technology option based on empirical data for northern cities in the context of climate adaptation and building energy efficiency.

2. Literature Review

2.1. Existing Research on the Thermal Performance of Artificial Turf

This section systematically reviews existing research on the thermal performance of artificial turf, aiming to reveal a core contradiction: traditional studies, mostly based on ground-level experiments, consider that artificial turf leads to higher surface temperatures due to its low albedo, thus intensifying the heat island effect; however, the recent literature has also reported its potential “insulation capacity” and “rapid nighttime cooling” phenomenon, which may play a positive role in mitigating the heat island effect. Further analysis indicates that existing studies have largely been conducted in ground-level scenarios, neglecting the particularities of the rooftop environment (strong convection, thermal coupling), and rarely treating grass fiber structural morphology as an independent variable. The above cognitive contradiction and scenario mismatch constitute the logical starting point for this study.

2.1.1. Research Consensus

Regarding the thermal performance of artificial turf, existing research has basically formed the following consensus: artificial turf is composed of polyethylene grass fibers and black rubber granule infill; these materials have low specific heat capacity and no water-holding capacity [13], low albedo, and low volumetric heat capacity, causing surface temperatures to rise sharply under solar radiation. Jim [14] found in field measurements in Hong Kong that the albedo of natural turf was about 0.23, while that of artificial turf was only 0.073, meaning that under the same radiation conditions artificial turf absorbs more shortwave radiation. Field research at Texas A & M University further confirmed that among all tested landscape materials (natural turf, artificial turf, decomposed granite, and hardwood mulch), artificial turf had the lowest albedo and highest net radiation [15]. Research by Tebakari et al. [16] also showed that the albedo of water-retentive artificial turf was only one-quarter that of natural turf, with significantly lower shortwave radiation reflection capacity. Devitt et al. [17], through spectral reflectance measurements, found that green artificial turf reflected less than 10% of incident radiation in the 350–2500 nm wavelength range, directly leading to abnormally high surface temperatures, revealing the relationship between material spectral properties and temperature rise.
The above research reveals the inherent thermophysical deficiencies of artificial turf: low albedo leads to high net radiation absorption, and low heat capacity leads to rapid temperature response and large diurnal temperature range. However, it should be noted that these conclusions are mostly based on ground-level sports fields or urban park scenarios, focusing primarily on the single indicator of surface temperature, lacking rooftop-scale studies, and not involving key data such as heat insulation and heat dissipation.

2.1.2. Research Controversy

Although numerous studies indicate that artificial turf may become a strong “heat source” in unshaded open spaces such as rooftops during the daytime [18], recent years have seen phenomena inconsistent with the above classical understanding. Choi et al. [19], in a comparative experiment of various roof covering materials, explicitly pointed out: “Although artificial turf is thin and has low albedo, it effectively protects the roof surface from temperature increase,” but did not explain the mechanism. Tebakari et al. [16] confirmed through comparative experiments that the thermal conductivity of artificial turf is lower than that of natural turf, presenting a barrier to conducted heat, thus possessing a certain insulating capacity, but also did not investigate the principle. The latest research by Abuseif [20] indicated that although the surface temperature of artificial turf was 2.60 °C higher than asphalt during peak temperature periods, it performed better than dry turf or bare soil in reducing air temperature and improving thermal comfort; this study introduced thermal comfort indices for evaluation but still did not differentiate the influence of grass fiber structure.
In sharp contrast to daytime behavior is the thermal behavior of artificial turf at night. Tebakari [16] found that the heat capacity of artificial turf is lower than that of natural turf, resulting in higher surface temperatures during the day but lower temperatures at night. This characteristic suggests that artificial turf, by virtue of its low heat capacity and rapid heat dissipation ability, may alleviate the urban “tropical night” phenomenon at night, thereby providing a more comfortable activity space. Moreover, nighttime heat island effects are more pronounced in some cities: measured data of the urban heat island in Zhengzhou show that the core urban area nighttime surface urban heat island intensity (SUHII) is 1.39 °C [21], higher than the daytime value of 1.10 °C, and peaks at 21:00 at night [22]. Therefore, although artificial turf can be a significant “heat source” during the day, its mitigating effect on the urban heat island at night may be more substantial.

2.1.3. Research Gap

It is worth emphasizing that the aforementioned studies were basically conducted on the ground, whereas the rooftop environment differs significantly from the ground: wind speeds are higher, enhancing convective heat dissipation; there is less shading, resulting in stronger solar radiation; and there is an indoor space below, forming thermal coupling. Therefore, whether ground-level conclusions can be extrapolated to rooftops is highly questionable. For example, the site studied by Jim [14] was a ground-level sports field; the 70.2 °C surface temperature measured there might be significantly lower under the stronger convective conditions of a rooftop. Conversely, the elevated ventilation structure of a rooftop might further enhance the nighttime heat dissipation advantage of artificial turf.
In summary, the key research gaps in existing studies are manifested in the following two aspects: first, no study has yet systematically quantified the all-day thermal performance of artificial turf at the rooftop scale, especially through direct comparison with traditional roofing materials, to evaluate the net value of the two effects of “daytime heat island intensification” and “nighttime heat island mitigation”; second, existing literature generally treats artificial turf as a homogeneous material, ignoring the regulatory role of grass fiber structural morphology (length, density, and porosity) on convective heat dissipation and air insulation layers—and this might precisely be the key to compensating for the material’s thermophysical deficiencies.

2.2. Comparative Study

This section compares artificial turf with traditional roofing materials and with other roof treatments that may mitigate the UHI effect, analysing the advantages and feasibility of artificial turf in northern urban environments and identifying research gaps and future directions.

2.2.1. Artificial Turf vs. Cast-in-Place Concrete Roofs

Cast-in-place concrete is the most widely distributed impervious underlying surface in cities, and its contribution to the UHI effect has been confirmed by multiple studies. Research by the Institute of Ecological Science, Chinese Academy of Sciences, in Beijing showed that concrete structures significantly raise soil temperatures in adjacent areas, with the most pronounced effect in summer and autumn—a direct contributor to the UHI [23]. Zhou Yaopeng et al. in Changsha demonstrated that compared with bare concrete roofs, “artificial vegetation” roofs exhibit a surface temperature difference of 26.2 °C at 13:30; the diurnal temperature range of the bare roof is about 28 °C, while the green roof surface remains around 30 °C [24]. This indicates that artificial turf can effectively reduce heat gain in concrete building envelopes. Furthermore, artificial turf roofs provide a green landscape; the Architectural Institute of Japan confirmed that artificial turf spaces influence users’ “preference” and “vitality” through visual impressions, positively contributing to urban aesthetics [25].

2.2.2. Artificial Turf vs. XPS-Insulated Roofs

XPS-insulated roofs exhibit a “scale paradox” [26]—they reduce indoor heat gain at the building scale but may aggravate the local thermal environment at the urban scale. Studies show that the outer-to-inner surface temperature difference in an XPS-insulated roof can reach 9.3 °C, compared with only 2.9 °C for a traditional roof [25], confirming the intense surface heat accumulation caused by XPS. Owing to its low thermal conductivity, XPS prevents absorbed solar heat from being conducted downward, causing a large amount of heat to accumulate at the surface and be released into the air. Artificial turf may also exhibit such a paradox. On the one hand, Jim reported that artificial turf surface temperatures can reach 70.2 °C during the day, releasing substantial sensible heat to the near-ground air via conduction and convection [14]. On the other hand, Choi et al. confirmed that artificial turf effectively reduces roof surface temperatures, thereby decreasing night-time heat release [19]. This day–night difference gives artificial turf the potential to mitigate the UHI at night—a possibility that this study aims to verify.

2.2.3. Artificial Turf vs. Natural Turf Roofs

Undeniably, natural turf warms up slowly and maintains low temperatures (typically <40 °C) [14], favouring UHI mitigation. However, natural turf’s soil layer has a strong heat storage capacity, continuing to release heat at night [27]. Moreover, for northern cities, climatic conditions do not support large-scale planting of natural turf on roofs [28], and natural turf also suffers from heavy load, high maintenance costs, and high water demand. Considering these factors, although artificial turf cannot mitigate the UHI as effectively as natural turf, it remains a viable option in northern regions.

2.2.4. Artificial Turf vs. High-Reflectivity Coating Roofs

High-reflectivity coatings lower surface temperatures by increasing solar reflectance. Takebayashi and Moriyama showed that white high-reflectivity coatings have low net radiation and low sensible heat flux due to high solar reflectance, whereas grey coatings have similar reflectance to concrete and comparable sensible heat flux. In terms of reflective cooling, there is a large gap between artificial turf (albedo 0.073) and high-quality high-reflectivity coatings (albedo typically >0.60) [29]. However, high-reflectivity coatings, especially white ones, have notable drawbacks: Baneshi et al. pointed out that they produce visually uncomfortable glare, and the coating itself may spoil the aesthetic appearance of the coated object [30]. In contrast, artificial turf is light, resistant to foot traffic, and easy to maintain. It is more forgiving on old, uneven, or frequently accessed roofs, and plays an irreplaceable role in improving the “fifth facade” of cities and enhancing users’ psychological comfort.

2.2.5. Artificial Turf vs. Ventilated Cavity Roofs

Ventilated cavity roofs use an air layer in an elevated structure, driven by natural wind or thermal pressure, to remove heat. Their insulation performance is not sensitive to the material’s own thermophysical properties. However, ventilated roofs are not well suited to northern regions [31]. Studies clearly indicate that in cold and cool climates, the operational efficiency of ventilated roofs is much lower than in southern regions. The fundamental reason is that outdoor air temperatures in winter are extremely low and the air’s moisture-holding capacity is poor, greatly weakening the natural ventilation driven by thermal pressure [32]. Field measurements of a PVT ventilated pitched roof in Dalian showed that in winter, compared with an ordinary roof, the thermal resistance of the ventilated roof increased by only 15%, daily total heat consumption decreased by only 5%, and peak heat load decreased by only 4% [33]. In summer, the same system reduced daily total heat gain by 54.4% and peak cooling load by 76.7%. This stark contrast reveals that ventilated roofs essentially lose their core energy-saving value in northern winters [34]. In addition, to achieve both winter condensation prevention and summer insulation, ventilated roofs often require additional structural layers, significantly increasing construction costs. Therefore, in northern regions, artificial turf—with its moderate thermal performance, good environmental beautification capacity, and low cost—offers a practical solution for improving the urban environment.
In summary, artificial turf has certain application value in northern regions due to its acceptable thermal performance, good climate adaptability, excellent visual effect, and low maintenance cost.

2.3. Research Summary

Based on the above literature review, we conclude that artificial turf has some value for roof applications in several respects. With regard to its core objective—regulating the urban climate—artificial turf exhibits complex day–night dual effects and technology potential worth exploring. Although its higher daytime surface temperature has a negative impact on the urban climate, its rapid night-time cooling may, to some extent, improve the urban climate and provide a more comfortable activity space for city residents. To resolve this, we need first to clarify the actual physical properties of artificial turf and systematically quantify its 24 h thermal performance, evaluating the net balance between “daytime UHI aggravation” and “night-time UHI mitigation”. Moreover, further empirical research is required on the heat transfer mechanisms of artificial turf on building envelopes, its applicability boundaries in different climate zones, and the long-term durability of improved materials. This study, based on the identified research gaps, uses small-scale experiments under controlled conditions to provide evidence for the thermal performance of artificial turf on roofs in northern regions.

2.4. Research Objective

In summary, given the severe situation of the climate-zone northward shift and UHI intensification in northern regions, exploring lightweight, low-cost roof cooling technologies is of great practical significance. Artificial turf, as a controversial but potentially promising material, remains a “blind spot” for roof thermal performance. Existing studies have revealed its inherent thermophysical drawbacks (e.g., low albedo, high surface temperature) but also suggested its potential value as a physical shading layer.
Future research should move beyond simple qualitative “good or bad” debates and focus on precise quantitative performance evaluation and climate-adaptive optimisation. At the small scale, the physical properties and differences among various artificial turf products should be clarified, and the mechanisms of thermal behaviour should be understood. At the medium scale, artificial turf should be installed on real building roofs for more realistic and detailed investigation. At the large scale, software simulations of cities with extensive artificial-turf roofs should be used to analyse their impact on urban climate and explore the causes. This study represents a first step in that direction, aiming to provide a scientific basis for this emerging field through solid experimental data and simulation analyses, thereby promoting the synergistic development of urban buildings and the climate environment.

3. Method

3.1. Preliminary Experimental Research

Before the main experiment, a summer outdoor comparative study of temperature variations among artificial turf, natural turf, and a brick-paved surface was conducted. This preliminary work provided a basic understanding of some physical properties of artificial turf and laid a foundation for the present roof-application study.
The preliminary experiment mainly compared the temperature changes in artificial and natural turf under direct sunlight, as well as the cooling benefit of increasing transpiration by watering. Four experimental groups (each 1.5 m2) were set up: natural turf without watering, natural turf with watering, artificial turf without watering, artificial turf with watering. Two control groups were also included: a brick-paved surface and ambient air. Temperature sensors were placed 3 cm above each surface, and readings were recorded every five minutes. An automatic sprinkler system sprayed 1 kg of water per hour onto each 1.5 m2 plot of natural and artificial turf. To test the insulation effect of artificial turf, sensors were placed underneath the two artificial turf plots.
The data showed: (1) Under direct sunlight, the surface temperature of artificial turf was significantly higher than that of natural turf and similar to that of the brick-paved surface; when shaded, artificial turf cooled down much faster than natural turf. (2) Watering 1 kg per hour per 1.5 m2 of artificial turf reduced the surface temperature by 1–2 °C. (3) The temperature under artificial turf was significantly lower than that under the brick surface. Thus, artificial turf is sensitive to temperature changes, has good insulation properties, and watering provides a modest cooling effect.
Although watering can slightly reduce the surface temperature of artificial turf by 1–2 °C, in real-world roof applications, frequent watering is logistically difficult, incurs high maintenance costs, and is economically unsustainable. The increased humidity caused by watering may also worsen human thermal comfort, and the wet surface creates a slippery, unpleasant experience for users. Therefore, the main experiments in this study focused on passive design strategies rather than active watering.

3.2. Research Strategy

Based on the preliminary experiment, to precisely control variables and quantify the thermal performance of artificial turf, this study adopted a physical simulation experiment under a controlled indoor environment (Figure 1). The core strategy was to construct an isolated space with minimal external climate disturbance and place a reduced-scale building model inside. By comparing roof systems made of typical envelope materials (e.g., extruded polystyrene board, concrete) and three different types of artificial turf (Table 1), the study aimed to systematically reveal the insulation, heat storage, and heat dissipation performance of artificial turf, and to investigate the influence of key parameters (e.g., material type, structure) on these properties. Infrared heaters and full-spectrum lamps were used to simulate solar radiation heating and illumination. The radiation loading was terminated when the surface temperature of the specimens reached a quasi-steady state, rather than being set to a fixed duration. This approach ensured that the subsequent comparison of thermal performance was based on an equilibrated thermal condition, avoiding interference from transient meteorological variability. Multi-point temperature and humidity changes in the platform environment, on the surfaces and interfaces of various materials, and inside the building model were synchronously monitored. This strategy effectively isolates uncertain environmental interference, providing reliable experimental evidence for evaluating the application potential and limitations of artificial turf in roof greening.

3.3. Experimental Equipment and Materials

3.3.1. Main Experimental Instruments

To ensure accurate, synchronous, and automated data acquisition, the instrument system listed in Table 2 was used.

3.3.2. Test Materials and Experimental Groups

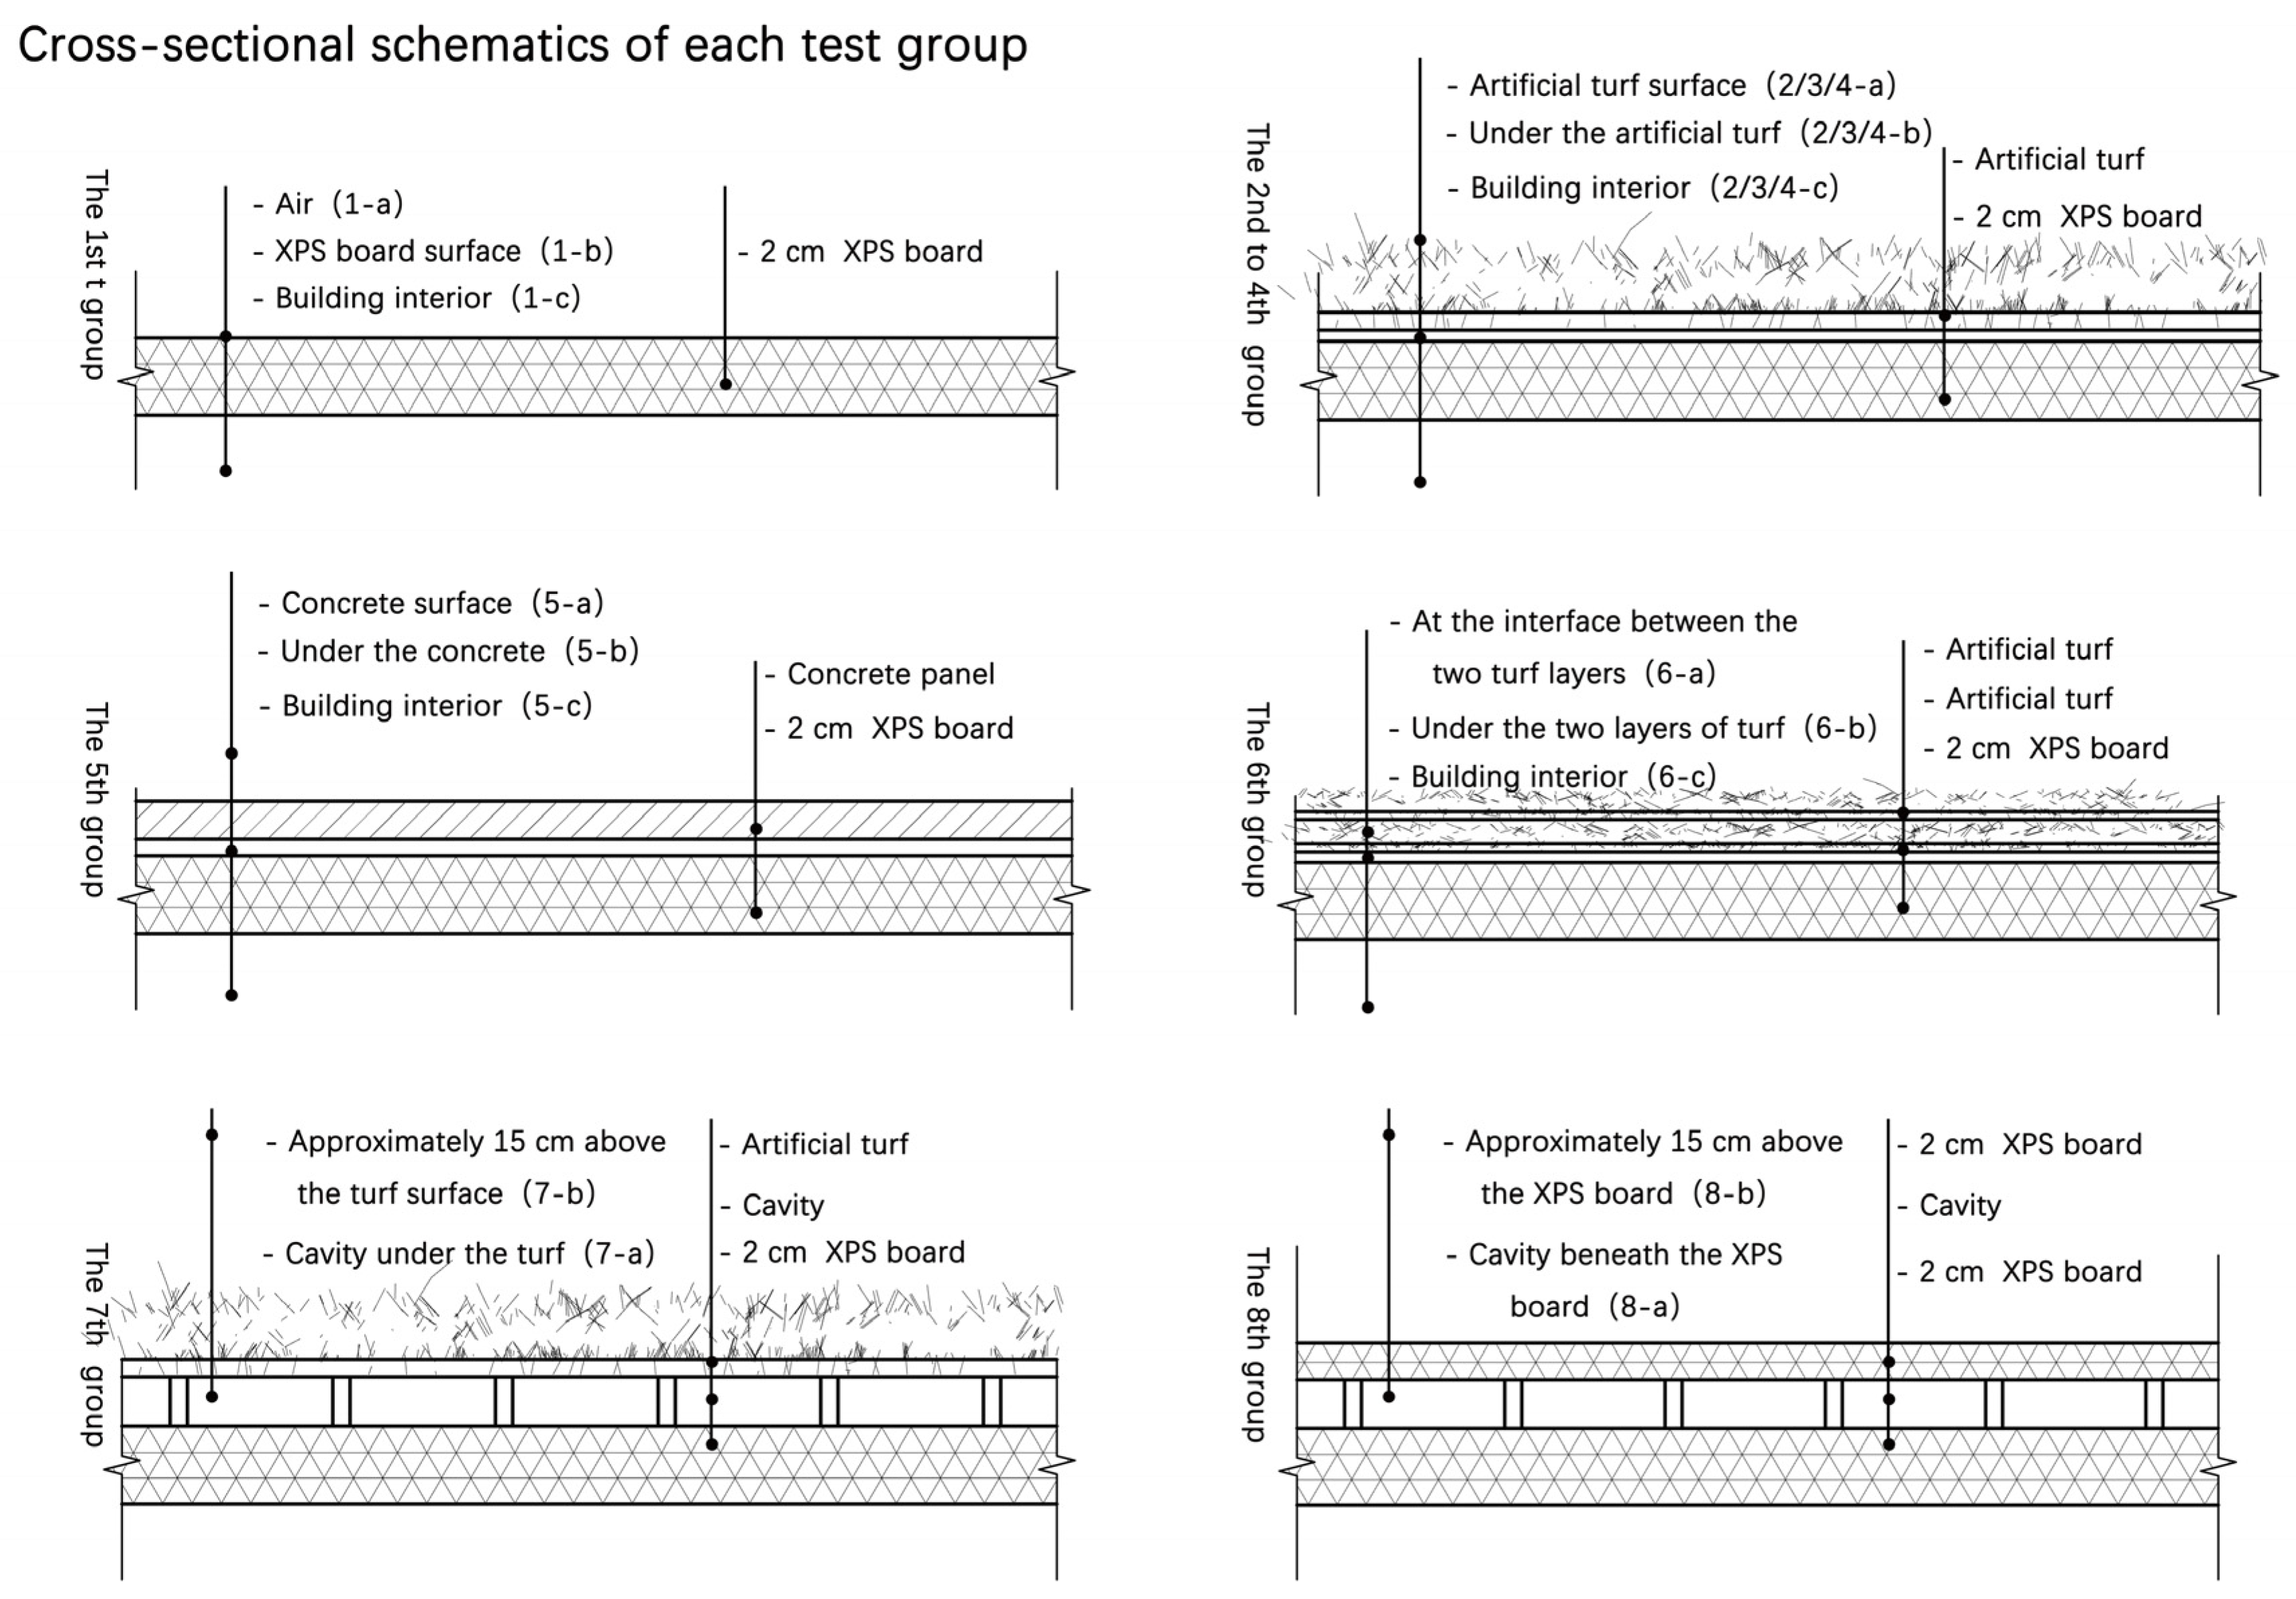
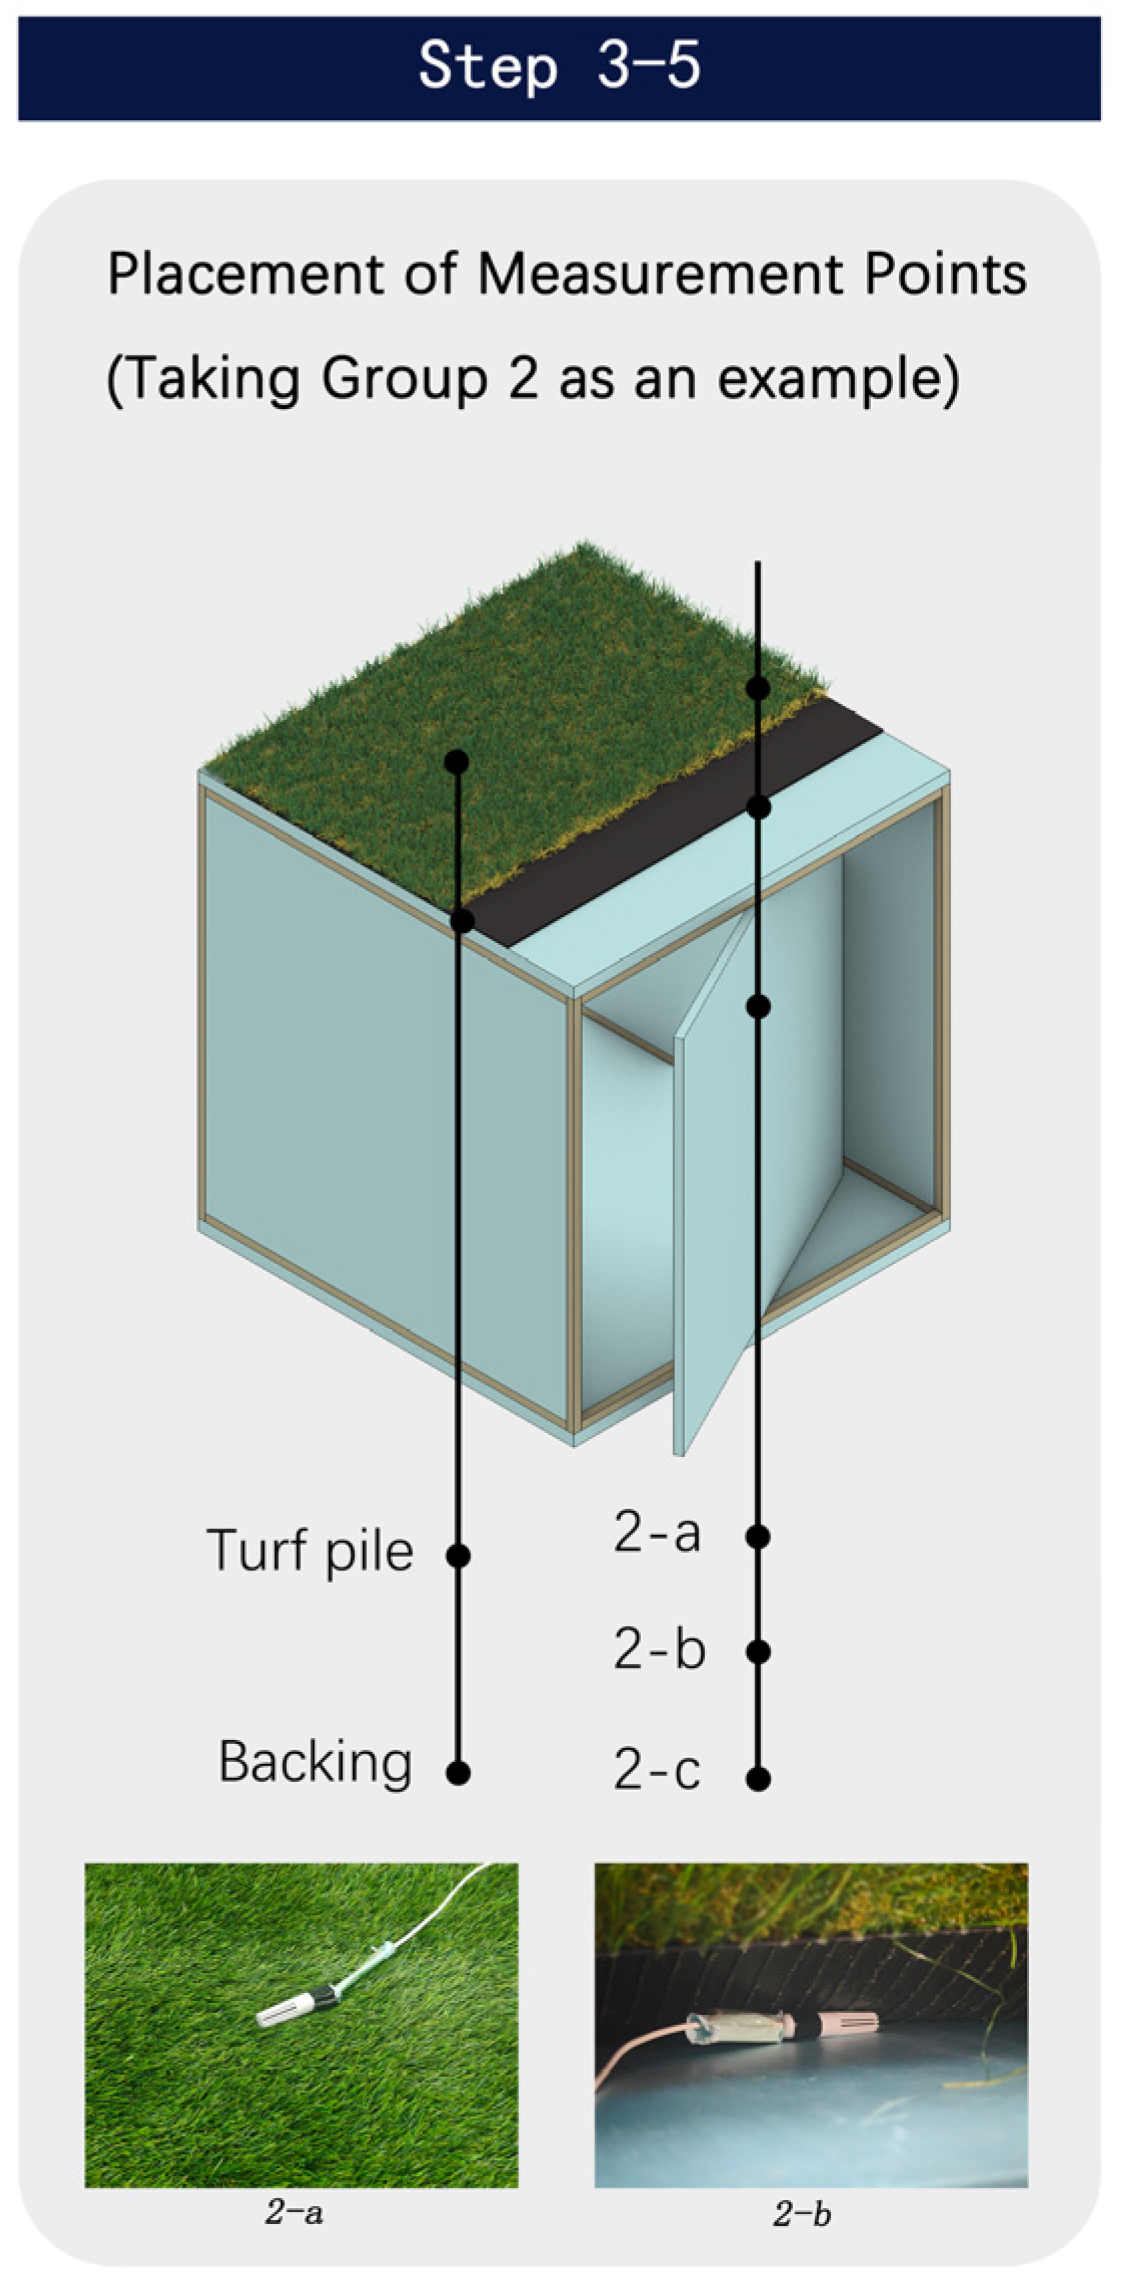
The study was conducted using a 1 m3 reduced-scale building model, with its top serving as the test base. To comprehensively investigate the thermal response characteristics of different materials and constructions, eight experimental groups were designed. Each group specified the test sample configuration, core measurement points, and scientific rationale (Table 3) (Figure 2).

3.4. Experimental Procedure

3.4.1. Experimental Platform Construction

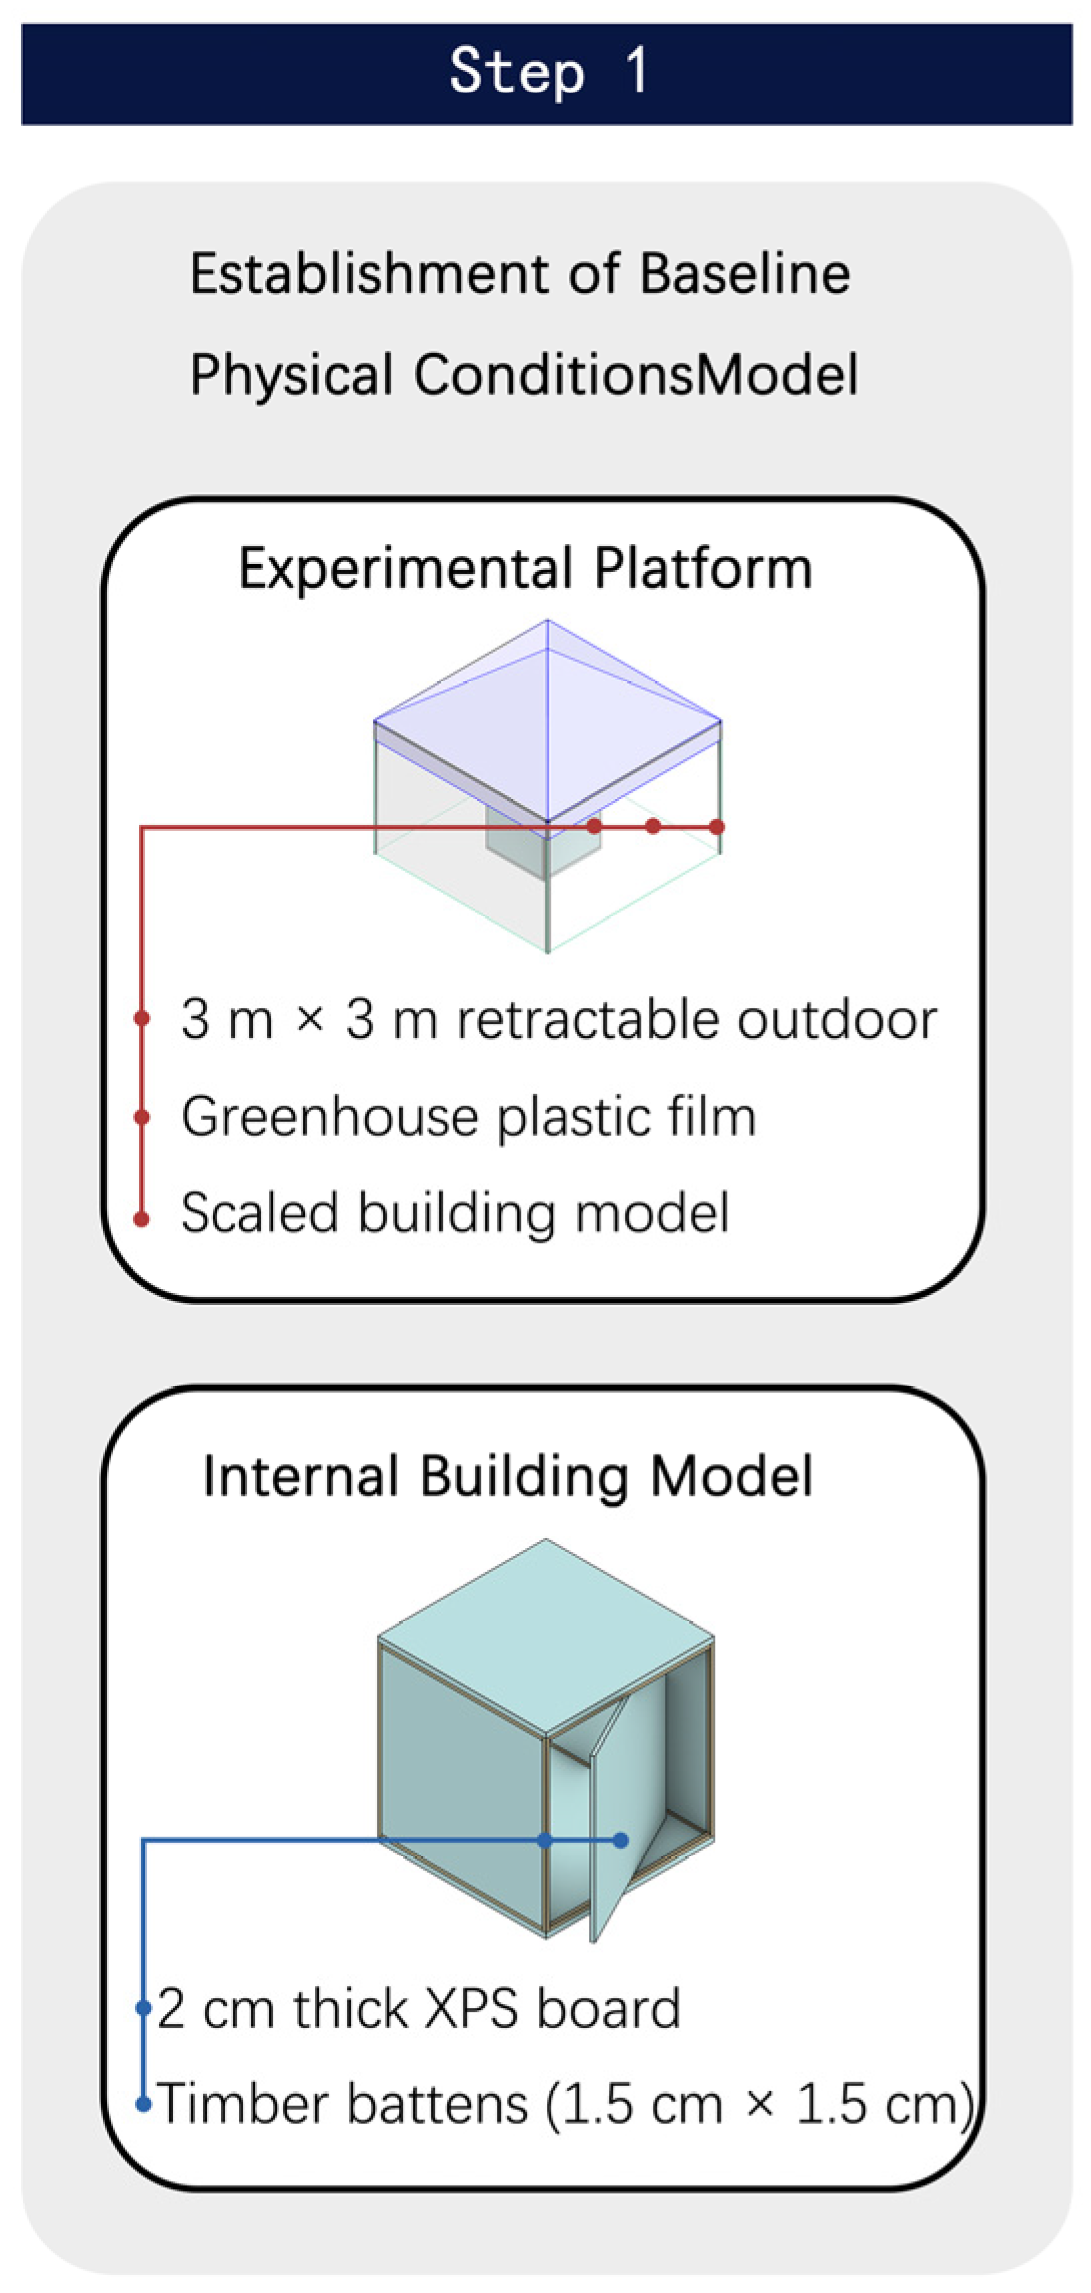
The experiment was carried out in a basement laboratory with minimal disturbance to ensure a stable baseline. The main platform consisted of an outer enclosure and an inner building model (Figure 3).
Outer enclosure: A 3 m × 3 m outdoor retractable awning was used as the main frame, and the sides and top were covered with highly transparent, low-thermal-conductivity greenhouse plastic film. This created a sealable independent space that effectively buffers fluctuations in the laboratory environment, providing a relatively stable and controllable air boundary for the internal experiment.
Inner building model: A 1 m × 1 m × 1 m cubic reduced-scale building model was constructed. The structural skeleton was made of 1.5 cm × 1.5 cm wooden strips, and all six sides were clad with 2 cm-thick extruded polystyrene boards to simulate a building envelope with thermal insulation. One side of the model was designed as an openable panel to facilitate sensor placement and adjustment inside.

3.4.2. Initial Simulated Environment Adjustment

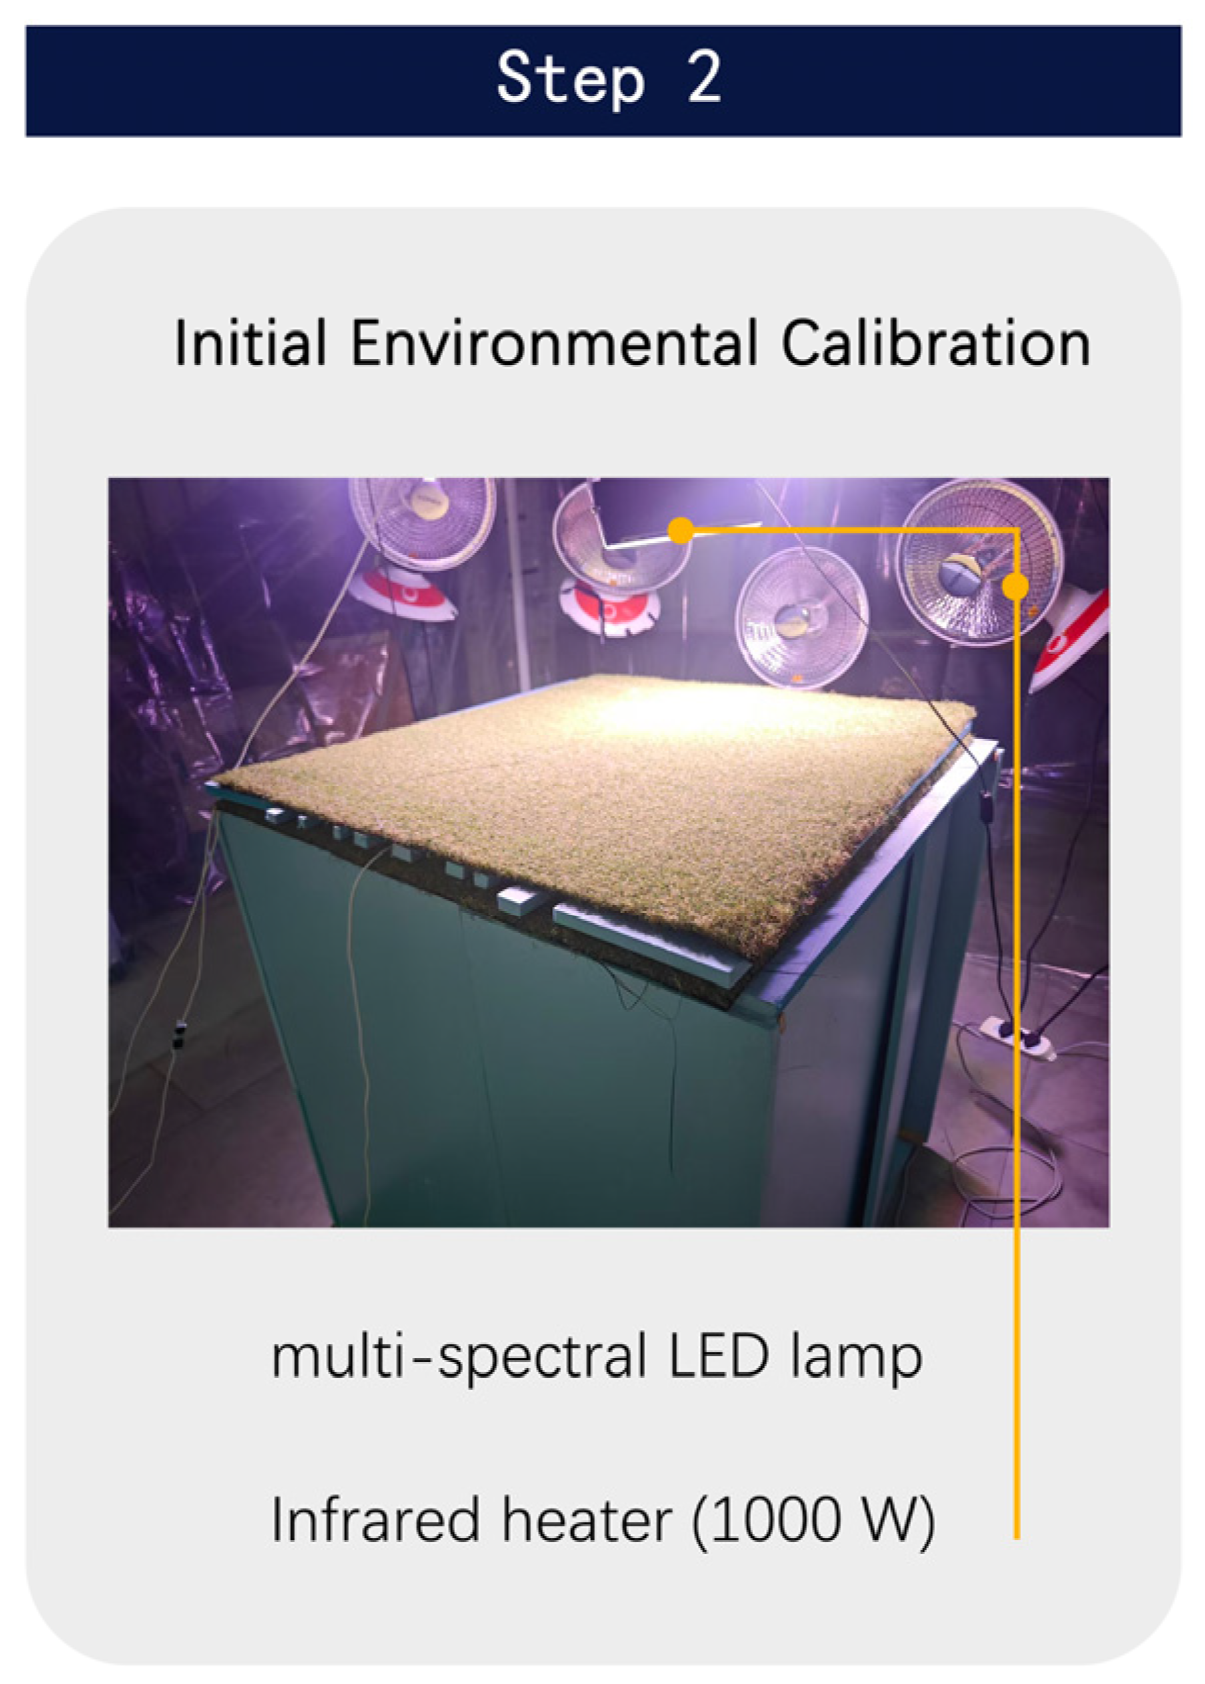
After platform construction, system calibration was performed under the “blank control (Group 1)” condition. By adjusting the number, arrangement angle, and relative power of the infrared heaters and multi-spectrum lamps, the radiation intensity incident on the central area of the model top was set to a predetermined target. After repeated adjustments, a stable thermal environment was achieved: the outer surface temperature of the model top was maintained in the typical summer high-temperature range of 52–54 °C, while the ambient air temperature 1.5 m above the platform was stable at 32–34 °C, successfully simulating the solar radiation and air temperature conditions of a typical sunny summer afternoon in northern regions. This calibrated lighting configuration was used as a fixed parameter for all subsequent experimental groups, ensuring identical thermal radiation input across all conditions (Figure 4).

3.4.3. Data Collection

Each experimental group followed the same standardised procedure:
Radiation loading phase: All infrared heaters and lamps were switched on simultaneously to continuously irradiate the test sample. This phase simulated prolonged exposure. A data logger automatically recorded readings from all sensors at 2 min intervals.
Natural decay phase: All radiation sources were turned off, and the system was allowed to cool naturally in the sealed state. Monitoring continued, recording temperature decay curves to evaluate the thermal inertia and heat dissipation characteristics of the materials.
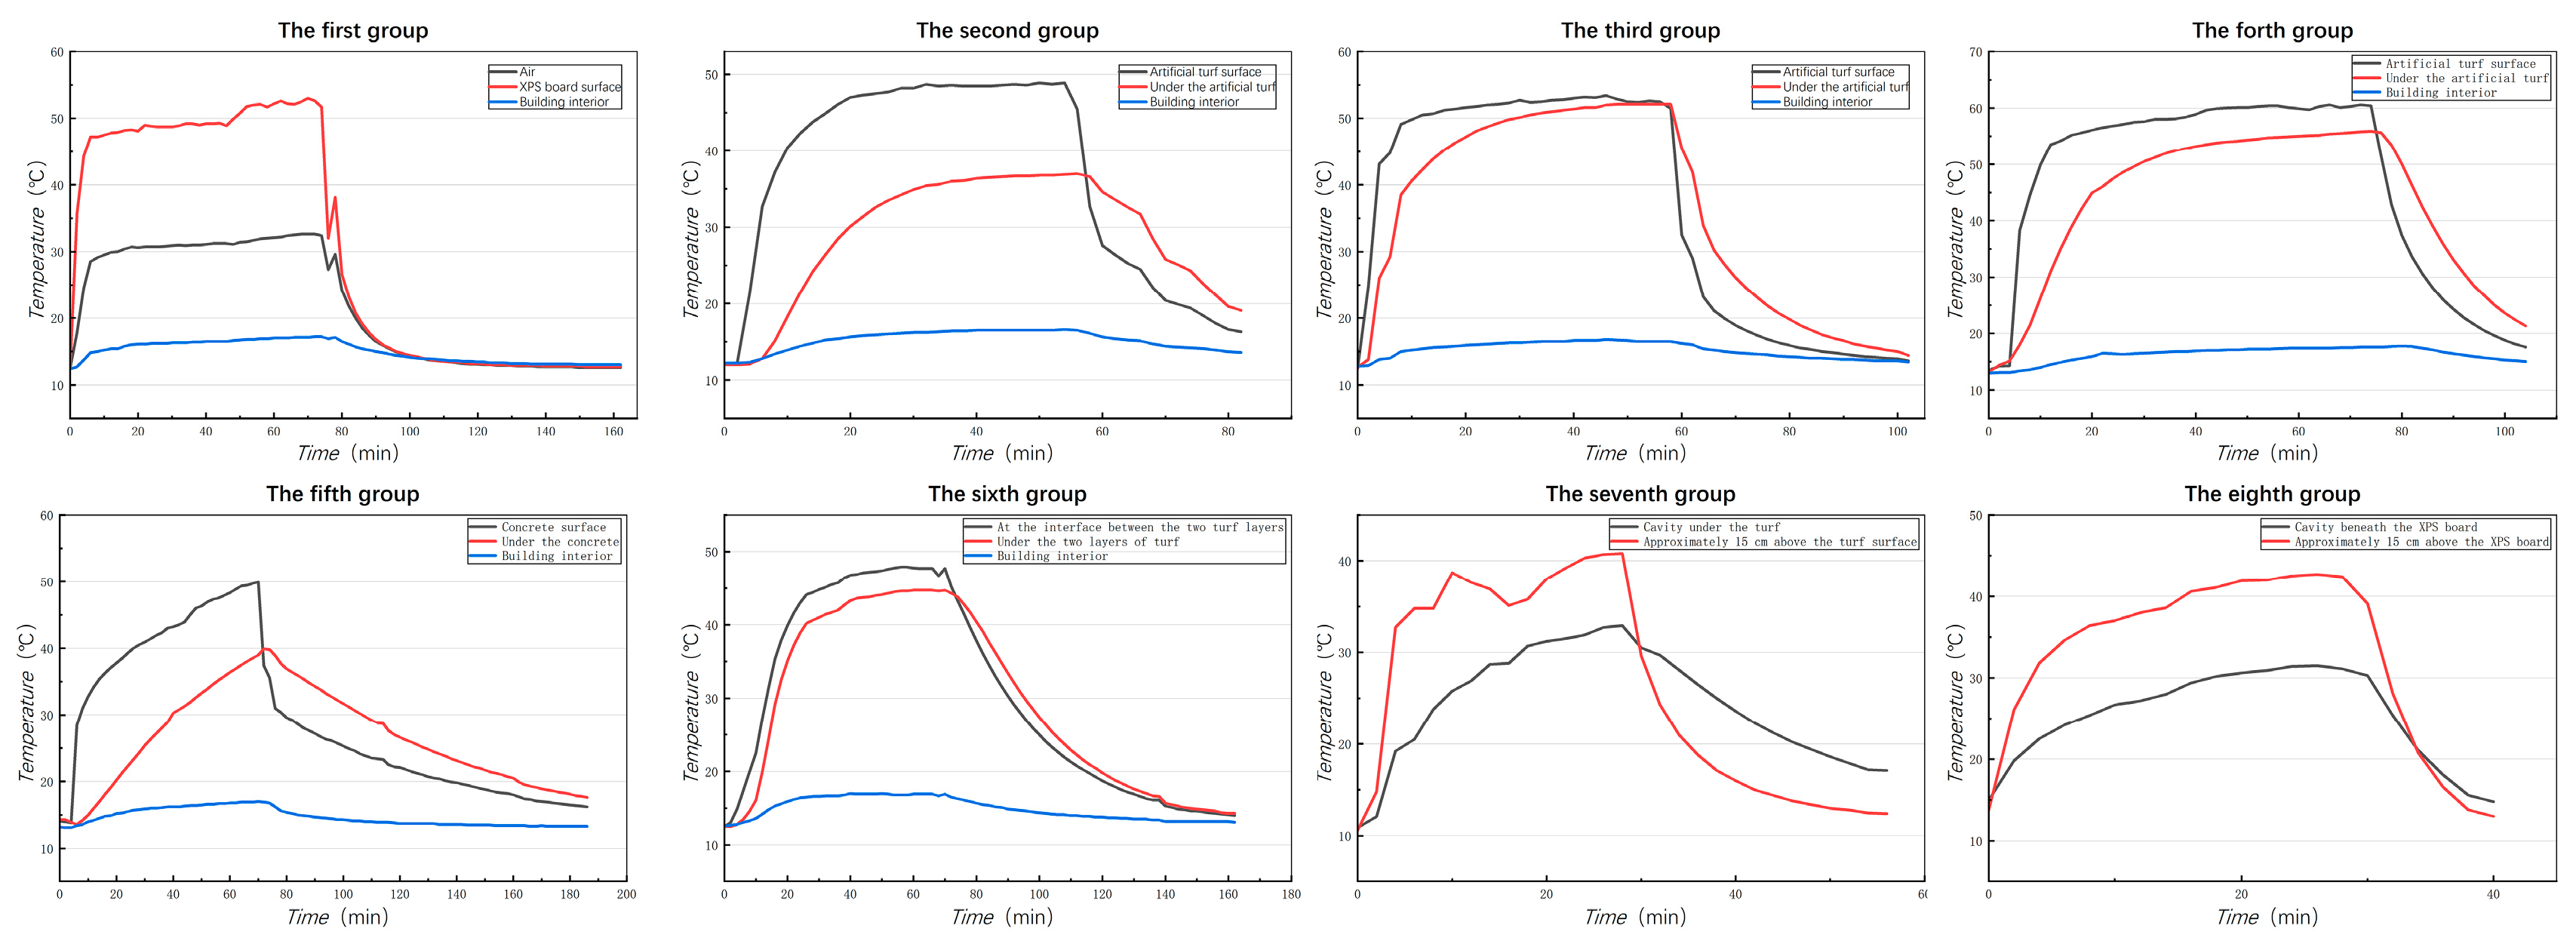
Condition switching: After completing one group, the system was left idle for a sufficient period until all components returned to the initial thermal equilibrium. The next experimental group sample was then installed, and the same procedure was repeated under identical initial environment and radiation parameters (Figure 5).

3.4.4. Data Processing Methods

To verify the insulation and heat-dissipation potential of artificial turf for roof applications in northern regions and to explore the influence of different factors, the collected temperature data were processed and analysed as follows:
(1)
Extraction and comparison of key temperature indicators: From the steady-state radiation phase of each group, the maximum temperatures at key measurement points were extracted to evaluate the peak thermal load under extreme heat conditions.
(2)
Visualisation and trend analysis of the dissipation process: For the natural decay phase, temperature–time curves of key points (e.g., grass blade surface, adhesive-backing interface, model interior) were plotted for each group. By comparing the slopes of the cooling curves after the radiation sources were turned off and the time required to reach thermal equilibrium with the ambient environment, the cooling rates and thermal inertia of different materials and constructions were qualitatively and quantitatively evaluated.

4. Experimental Data

4.1. Comparison of Thermal Performance of Artificial Turf with Different Blade Structures

To investigate the influence of blade structure morphology on the thermal performance of artificial turf, three types—Type A (long blades), Type B (medium blades), and Type C (short blades)—were tested simultaneously. Table 4 summarises the key temperature indicators of the three turf types.
Surface temperature characteristics:
The peak surface temperatures of the three types showed a clear gradient difference. Type A reached 48.9 °C, Type B 53.4 °C (4.5 °C higher), and Type C 60.6 °C (11.7 °C higher than Type A).
Interface insulation performance:
Attenuation factor (β) is a core indicator of the roof system’s insulation capability, defined as the ratio of the outer-surface temperature amplitude to the interface temperature amplitude:
β = ( T o u t e r , p e a k T o u t e r , i n i t i a l ) / ( T i n t e r f a c e , p e a k T i n t e r f a c e , i n i t i a l )
A higher β indicates stronger attenuation of the external heat wave.
Using the initial temperatures from Appendix A (t = 0: Type A 12.0 °C, Type B 12.5 °C, Type C 13.5 °C), the calculated β values are shown in Table 4.
Type A exhibits the highest attenuation factor (1.48), meaning it best reduces the transmission of outdoor temperature fluctuations. In contrast, Type B (β = 1.04) and Type C (β = 1.10) show almost no attenuation, indicating that heat almost directly penetrates the blade layer to reach the backing interface. For reference, the corresponding surface-to-interface temperature differences are 11.9 °C (Type A), 1.3 °C (Type B), and 4.6 °C (Type C), which further illustrate the thermal buffer effect of the long-blade structure.
Impact on indoor thermal environment:
Under Type A, the peak indoor temperature was 16.6 °C; under Type B, 17.5 °C; under Type C, 17.8 °C; and the blank control was 17.2 °C. Thus, Type C showed minimal insulation and even increased heat transfer to the interior due to its own heat absorption (Table 4).
Overall, Type A (long blades) outperformed Types B and C significantly in surface temperature control, interface insulation, and indoor thermal environment impact, making it the best-performing type (Table A1, Table A2, Table A3 and Table A4).

4.2. Performance Comparison of Type A (Long-Blade) Artificial Turf with Concrete and XPS- Insulated Roofs

To evaluate the comprehensive performance of Type A artificial turf in a roof system, it was compared with a concrete roof (Group 5), an XPS-insulated roof (Group 8), and the blank control (Group 1).
Surface temperature control:
Type A surface peak was 48.9 °C, lower than concrete’s 49.9 °C (–1.0 °C), XPS’s 52.2 °C (–3.3 °C), and the bare substrate’s 52.1 °C (–3.2 °C).
Interface insulation performance:
Using initial temperatures from Appendix A: β c o n c r e t e : = ( 49.9 14.1 ) / ( 39.9 14.3 ) = 1.40 . Type A exhibits a higher attenuation factor than concrete, indicating stronger suppression of outdoor temperature fluctuations.
Impact on indoor thermal environment:
Under Type A, the indoor temperature (16.6 °C) was 0.6 °C lower than the blank control (17.2 °C), and 0.7 °C lower than the concrete group (17.3 °C). Notably, the experimental model already had a 2 cm XPS base insulation layer; the surface material still exerted a measurable positive effect on the indoor thermal environment.
Comparison of heat dissipation characteristics:
Based on the natural decay phase data, the time required for the surface temperature to drop to near-indoor temperature (approximately 17 °C) was extracted from Appendix A, and the corresponding average cooling rates were calculated (Table 5).
Type A cools to near-indoor temperature more than three times faster than concrete (1.10 vs. 0.33 °C/min). Although XPS exhibits the highest average cooling rate (1.53 °C/min), this is largely due to its extremely low thermal mass and much higher starting temperature (52.2 °C). Type A achieves a better combination: a significantly lower peak surface temperature (48.9 °C) while still maintaining a fast cooling rate (1.10 °C/min), which is particularly beneficial for mitigating both daytime overheating and the nighttime urban heat island effect (Table A1, Table A2 and Table A5).

4.3. Influence of Structural Optimisation on Thermal Performance

4.3.1. Double-Layer Stacked vs. Single-Layer Construction

Because Type A (long blades) showed the best insulation performance, it was unclear whether this was due to thickness or blade structure. Therefore, a double-layer of Type B (medium blades)—with total thickness similar to Type A—was compared with single-layer Type A (Group 6 vs. Group 2).
Peak temperature comparison:
The double-layer Type B bottom interface peak was 44.7 °C, which was 7.7 °C higher than the single-layer Type A interface (37.0 °C). Despite doubling the thickness, the double-layer construction was less effective in insulation than the single-layer Type A, showing that blade structure morphology is more important than thickness alone.
Interlayer air temperature:
The peak air temperature in the double-layer’s interlayer reached 47.9 °C, forming a hot air pocket and indicating heat accumulation between the two layers rather than effective dissipation.
Cooling process comparison:
During the natural decay phase (30 min after radiation off), the double-layer Type B bottom temperature dropped from 44.7 °C to 19.8 °C (a 24.9 °C decrease), while the single-layer Type A interface dropped from 37.0 °C to 14.3 °C (22.7 °C decrease). However, the double-layer started from a higher initial temperature and had a gentler cooling curve; its cumulative heat release was 30.2% higher than that of the single-layer Type A. This indicates that the double-layer stored more heat and released it more slowly (Table A6).

4.3.2. Elevated Ventilated Construction Optimisation

To explore the potential of a ventilated construction for improving heat dissipation, three configurations were compared: Type A directly laid (Group 2), Type A elevated (Group 7), and XPS elevated (Group 8).
Comparison of bottom cavity thermal environment:
The peak air temperature in the bottom cavity of elevated Type A was 40.8 °C, 1.9 °C lower than that of elevated XPS (42.7 °C). The average bottom cavity temperature for elevated Type A was 35.2 °C, 2.9 °C lower than for elevated XPS (38.1 °C). Under identical ventilation conditions, Type A absorbed and conducted less heat downward than XPS, resulting in a cooler hot-air layer beneath it.
Comparison of near-surface air temperature impact:
The near-surface air temperature peak for elevated Type A was 32.9 °C, 2.5 °C lower than for directly laid Type A (35.4 °C). Elevated XPS gave 31.5 °C, which was 1.4 °C lower than elevated Type A. The elevated construction significantly reduced the heating effect of both materials on the near-ground air. However, although elevated XPS produced a lower near-surface air temperature, its bottom cavity temperature was higher (42.7 °C), indicating that XPS stored more heat in the cavity. Elevated Type A achieved a better balance between near-surface air temperature and bottom cavity temperature.
Cooling characteristics comparison:
After radiation shutoff, the cooling behaviours differed markedly:
Direct-laid Type A (interface): 37.0 °C → 19.6 °C, drop 17.4 °C, rate 0.87 °C/min.
Elevated Type A (bottom cavity): 40.8 °C → 24.3 °C, drop 16.5 °C, rate 0.82 °C/min.
Elevated XPS (bottom cavity): 42.7 °C → 26.8 °C, drop 15.9 °C, rate 0.80 °C/min (Table A7 and Table A8) (Figure 6).

5. Data Analysis and Discussion

5.1. Mechanism of Thermal Performance of Artificial Turf

Based on the experimental data, this section systematically explains the mechanisms by which blade morphology determines the thermal performance of artificial turf from three aspects: convective heat transfer, thermal insulation buffering, and heat dissipation decay.

5.1.1. Mechanism of Blade Structure Enhancing Convective Heat Transfer

The experimental data show significant gradient differences in peak surface temperature among artificial turf types with different blade lengths. Type A (long-blade turf) exhibited a peak surface temperature of 48.9 °C, Type B (medium-blade turf) 53.4 °C, and Type C (short-blade turf) 60.6 °C. This difference cannot be explained solely by material thermophysical properties; rather, it should be attributed to the regulation of convective heat transfer efficiency by blade structure. The long-blade structure significantly increases the contact area between the blades and the surrounding air. Its fluffy three-dimensional structure simultaneously enhances air turbulence within the blade layer, destroys the thermal boundary layer near the surface, reduces thermal resistance, and allows heat to be transferred more efficiently to the flowing air.
This finding challenges the common assertion in existing literature that “artificial turf inevitably leads to high surface temperatures.” Through appropriate structural design—using blades of sufficient length and fluffiness—the surface temperature of artificial turf can be controlled to levels lower than those of concrete and XPS insulation boards, demonstrating that structural optimisation can partially compensate for the thermophysical deficiency of low albedo.

5.1.2. “Equivalent Thermal Resistance of Static Air Layer” and Thermal Insulation Mechanism

The excellent thermal insulation performance of artificial turf protects the roof surface temperature. Experimental data show that Type A turf achieved a surface-interface temperature difference of 11.9 °C, whereas Type B exhibited only 1.3 °C and Type C 4.6 °C. This difference reveals the decisive influence of blade morphology on insulation effectiveness.
The high porosity of Type A turf traps a large amount of nearly static air between its blades. Air has an extremely low thermal conductivity (approximately 0.026 W/(m·K), far lower than that of polyethylene blades, which is 0.35–0.45 W/(m·K)). Consequently, the blade layer forms an effective “static air insulation layer”, with an equivalent thermal resistance much higher than that of a solid material of the same thickness. Type B turf has a surface-interface temperature difference of only 1.3 °C, indicating that its blade length is insufficient to form an effective air-trapping layer. Heat almost directly penetrates the blade layer to reach the backing interface, and the turf only provides weak physical shading. Although Type C turf has a surface-interface temperature difference of 4.6 °C, its surface temperature reaches as high as 60.6 °C and its interface temperature also reaches 56.0 °C, indicating that its insulation is achieved at the cost of surface temperature—the blade layer is short and dense, providing some thermal resistance, but a large amount of heat accumulates at the surface and cannot be effectively dissipated by convection, leaving the interface temperature still high.
Notably, the peak interface temperature of Type A turf (37.0 °C) is significantly lower than that of Type B (52.1 °C) and Type C (56.0 °C), and is also lower than the lower surface temperature of concrete (39.9 °C) and the bottom cavity temperature of XPS (42.7 °C). This result proves that optimised artificial turf can serve as an effective roof thermal buffer layer, significantly reducing the conductive heat flux into the building envelope.
To further exclude the possibility that “increased thickness leads to improved insulation performance”, this study specifically set up a double-layer stacked configuration of Type B turf (medium blades) (Group 6) for comparison with single-layer Type A turf (long blades, Group 2). The total thickness of the two configurations was similar. Experimental results show that the double-layer Type B turf achieved a bottom peak temperature of 44.7 °C, which is 7.7 °C higher than the interface temperature of single-layer Type A turf (37.0 °C). Its indoor peak temperature (17.0 °C) was also higher than that of single-layer Type A (16.6 °C). Although the double-layer configuration had nearly twice the thickness, its insulation effect was significantly inferior to that of the single long-blade layer. This comparison strongly proves that simply increasing material thickness cannot effectively improve thermal insulation performance; rather, blade morphology—specifically blade length, fluffiness, and the resulting air-trapping layer—is the core factor determining the thermal performance of artificial turf. The double-layer configuration suffers from heat accumulation between layers because the interlayer air cannot be effectively ventilated to the outside.

5.1.3. Cooling Rate and Diurnal Rapid Thermal Response Characteristics

Temperature change data during the natural decay phase (30 min after radiation shutoff) show that the cooling rate of Type A turf (0.98 °C/min) was significantly higher than that of Type B (0.58 °C/min) and Type C (0.42 °C/min), being 1.69 and 2.33 times that of the latter two, respectively. Since the three turf types have the same material composition (all polyethylene blades and rubber granules), this difference cannot be attributed to intrinsic material properties and must be explained by blade morphology.
Specifically, the long-blade three-dimensional structure of Type A turf enhances the cooling rate through three mechanisms: (1) A significant increase in convective heat transfer area. The long blades greatly enlarge the contact area with the surrounding air. After radiation shutoff, cool air can rapidly exchange heat with the blade surface, carrying away more sensible heat per unit time. (2) Thinning of the thermal boundary layer. The fluffy blade structure allows air to flow freely between the blades, making it difficult for a stable thermal boundary layer to form. Cool air can penetrate deep into the blade layer, shortening the heat transfer path from the blade surface to the airflow, thereby improving dissipation efficiency. (3) Extremely low volumetric heat capacity. Although Type A turf has a large surface area, its solid volume fraction is very low, meaning the actual heat-storage material per unit projected area is minimal. After radiation stops, the small amount of sensible heat stored in the blades and the interstitial air dissipates rapidly, and the temperature drops quickly—unlike concrete or XPS, which remain hot for long periods.
These mechanisms together create a unique “rapid heating and rapid cooling” diurnal thermal response pattern for Type A turf. During the day, after absorbing solar radiation, the surface temperature of artificial turf rises, but most of the heat is immediately dissipated into the air through convective heat transfer, preventing deep heat accumulation. At night, after radiation stops, the limited stored heat and open convective channels allow the surface temperature to drop rapidly to near-ambient levels, avoiding the “daytime storage, nighttime release” behaviour of high-thermal-inertia materials such as concrete, which continuously release heat at night and exacerbate the urban tropical night phenomenon.
This characteristic gives Type A turf a dual advantage in roof applications: during the day, its good thermal insulation reduces heat transfer into the interior; at night, its rapid heat dissipation avoids a continuous contribution to the urban heat island.

5.1.4. Enhancement by Elevated Ventilation and Seasonal Applicability

The Group 7 (elevated turf) experiment further demonstrates that introducing a ventilated cavity beneath the turf layer can enhance the overall thermal performance. Compared with the turf directly laid on the roof surface, the elevated configuration provides an additional airflow channel that carries away heat from the underside of the turf, reducing downward heat transfer into the building. This mechanism effectively amplifies the cooling advantage already provided by the long-blade structure.
It should be noted, however, that the function of ventilation is fundamentally the removal of heat. This is beneficial in summer, when the primary goal is to dissipate solar heat gain and reduce cooling load. In winter, when the roof’s main function shifts to heat retention, the same ventilated cavity would facilitate unwanted heat loss from the interior. The present study focuses on summer overheating mitigation, and the elevated design is evaluated within this specific seasonal context. For year-round application in cold regions, the ventilation openings could be designed to be closable in winter, allowing the cavity to function as an additional insulating air layer when needed.

5.2. Analysis of Contradictions in Existing Research

Reasons why the present experimental data differ from some existing experiments and previous preliminary experimental data (i.e., in this experiment the steady-state peak temperature of long-blade artificial turf was lower than that of concrete) are hypothesised as follows:
(1)
Scenario differences in heat dissipation. Existing studies were mostly conducted on ground sports fields, where the artificial turf is laid on a compacted gravel or asphalt base, making downward heat conduction difficult, and near-ground wind speeds are low, limiting convective heat dissipation. In this study, the artificial turf was installed above an elevated or insulation board base, with an air layer or low-thermal-conductivity material underneath, allowing heat to dissipate through bottom ventilation. More importantly, the rooftop environment typically has higher wind speeds, which enhances convective heat transfer. The study further explains this using the Stefan–Boltzmann law:
P = ε σ T 4 A
P: the total radiated power (total rate, in watts);
A: the surface area;
T: the absolute temperature (in kelvin);
ε: the emissivity (dimensionless, ranging from 0 to 1).
This equation expresses the radiation ability of an actual object surface relative to a blackbody at the same temperature. The thermal emissivity of conventional artificial turf is 0.87, while that of concrete is typically between 0.85 and 0.90, both being similar [35]. It follows that the much larger surface area of artificial turf due to its blade structure gives it a significantly greater total radiative capacity than concrete. However, in real environments, artificial turf dissipates a higher proportion of heat through convection due to ambient airflow, so its overall heat dissipation advantage over concrete and other roofing materials may be even greater:
(2)
Spectral matching of the radiation source. Spectral reflectance measurements show that green artificial turf has a reflectance of less than 10% in the 350–2500 nm band, but its reflectance increases significantly in the mid-to-far infrared band (2.5–15 μm) [17]. The infrared heat source used in this study has its main radiation band exactly in the 2.5–15 μm range, and artificial turf has a higher reflectance for this band than for solar shortwave radiation. This differs from the actual solar spectrum (peak at approximately 0.5 μm, with most energy concentrated in 0.3–2.5 μm), which may have led to a lower absorbed radiation energy by artificial turf in this study than in real outdoor conditions. In other words, this experiment may have “underestimated” the surface temperature rise in artificial turf under real sunlight.
(3)
Scale effect of the reduced-scale model. The building model used in this study had dimensions of 1 m × 1 m × 1 m, while the artificial turf samples were full-scale, with blade lengths (approximately 3–4 cm) being relatively large compared to the model scale. On a real building roof (scale 10–100 m), the proportion of blade length is negligible, and scale effects such as edge flow may weaken the heat dissipation advantage of the blade structure. Therefore, the relative advantage of Type A turf measured in this experiment may be reduced at real scale, but the qualitative trend—that long-blade structures outperform short-blade ones—should still hold.
In summary, the unexpectedly lower peak surface temperature of long-blade artificial turf compared to concrete, which deviates from much of the existing literature, prompted a systematic analysis of the underlying physical mechanisms. By examining the roles of installation scenario, radiation spectrum, and blade-scale structure, we identified blade morphology—specifically, the formation of a static air insulation layer and enhanced convective-radiative surface area—as the dominant factor enabling this cooling effect. Rather than merely defending our experimental conditions, this analysis serves to clarify how artificial turf’s peak temperature can be deliberately suppressed. The findings indicate that optimising blade length, porosity, and under-layer ventilation can transform artificial turf from a perceived daytime heat source into a passive cooling component. These insights provide a concrete direction for subsequent material–structure co-design and field validation studies.

5.3. Dual Effect of Artificial Turf on Urban Heat Island Mitigation and Net Benefit Analysis

Artificial turf has a complex day–night dual effect on the urban thermal environment, and cannot be simply judged as “good” or “bad”.
Under strong solar radiation, the surface temperature of artificial turf rises (even Type A turf reaches 48.9 °C), releasing sensible heat to the near-ground air through convection and longwave radiation, potentially intensifying the daytime heat island. However, the data from this study show that the downward heat conduction of Type A turf (peak interface temperature 37.0 °C) is significantly less than that of concrete (39.9 °C) and XPS (42.7 °C). This means that less heat invades the building interior, while more sensible heat is released to the atmosphere. From the perspective of the urban canopy heat balance, daytime heat island intensity is primarily influenced by sensible heat flux. Artificial turf allocates a larger fraction of absorbed radiant energy to sensible heat (via convection) rather than to stored heat (accumulated inside the material). This contrasts sharply with concrete, which stores a large amount of heat in its mass and releases relatively less sensible heat during the day. In this sense, artificial turf effectively releases a portion of the heat that would otherwise be slowly emitted at night, earlier during the day, thereby playing a positive role for the nighttime urban environment.
At night, the urban heat island intensity is often stronger than during the day, because high-heat-capacity materials such as concrete and asphalt store heat during the day and release it slowly at night. Artificial turf, owing to its low heat capacity and rapid heat dissipation, cools quickly after sunset. Experimental data show that the surface temperature of Type A turf dropped from 48.9 °C to 19.6 °C (a decrease of 29.3 °C) within 30 min after radiation shutoff, whereas the concrete surface dropped from 49.9 °C to only 27.6 °C (a decrease of 22.3 °C). This means that at the same time after sunset, the surface temperature of artificial turf will be lower than that of concrete.
In summary, although daytime sensible heat release from artificial turf may raise air temperatures, its rapid nighttime cooling helps narrow the temperature difference between urban and suburban areas, and can provide a more comfortable activity space for city residents. If the coverage of artificial turf in urban areas is increased, the nighttime cooling rate of the urban area may approach that of suburban areas, thereby weakening the heat island intensity.
Although this study did not directly quantify the net heat island mitigation benefit, the following inference can be made: In northern cities where tropical nights are frequent and nighttime heat island intensity is higher than daytime, the nighttime advantage of artificial turf—“rapid dissipation and rapid cooling”—may partially offset or even exceed its negative daytime warming effect. Whether the net effect is positive or negative depends on local climatic conditions (daytime radiation intensity, nighttime cooling rate), artificial turf coverage, and the thermophysical properties of the reference surface. Answering this question requires inputting the material thermophysical parameters obtained in this study into urban climate models such as ENVI-met V5.9.1 for more accurate simulation in the next phase.

5.4. Idealised Expectations for Indoor Thermal Environment of Buildings

At the current stage of research, at the individual building level, the existing experimental data can support an estimation of the indoor thermal environment benefits from reduced daytime downward heat conduction. Based on this, this section provides a quantitative prediction of the indoor cooling effect of roofs covered with artificial turf under idealised assumptions.

5.4.1. Basic Assumptions

To establish an analytical heat transfer model, the following simplified assumptions are introduced: (1) Quasi-steady-state approximation: the strongest summer solar radiation period is considered, and roof heat transfer is treated as one-dimensional and steady. This assumption facilitates horizontal comparison of different surface materials but may underestimate the heat storage and attenuation effects of heavy roofs. (2) The indoor air temperature is assumed equal to the inner surface temperature of the roof, ignoring the convective temperature difference between the inner surface and the air, to evaluate room temperature under the most unfavourable scenario. (3) The heat flux reduction ratio is assumed independent of the substrate condition. The ability of Type A turf to attenuate downward heat flux is determined by its convective heat dissipation and its own thermal resistance. Under the radiative and convective boundary conditions measured in the experiment, this attenuation ratio can be approximately applied to different substrates. (4) Outdoor thermal conditions are assumed constant, and the net radiative heat input under different roof conditions is taken as the same, using the radiation conditions of the experimental control group as the baseline.

5.4.2. Heat Transfer Model and Calibration

For one-dimensional steady-state heat transfer, the heat flux density through the roof can be expressed as:
q     T out   -   T in R surface   +   R base
where T out is the equivalent outdoor sol-air temperature (including solar radiation and convective heat transfer effects), T in is the indoor temperature, R surface is the thermal resistance of the surface material, and R base is the thermal resistance of the structural substrate.
Calibration was performed using the control group (2 cm XPS, R base     0.67   m 2 · K / W ). The measured outer surface temperature was 52.5 °C and the indoor temperature was 17.2 °C. Substituting into the formula gives a baseline heat flux q 0 52.7   W / m 2   . For the Type A turf group, the measured interface temperature (between turf backing and XPS) was 36.7 °C and the indoor temperature was 16.5 °C, giving a transmitted heat flux q A 30.1   W / m 2 Hence, the heat flux reduction ratio is η   =   1   - q A / q 0   42.9 % . Back-calculating gives the effective thermal resistance of Type A turf as R turf ≈ 0.40 m 2 ∙K/W. Taking the effective blade-layer thickness as approximately 30 mm, the effective thermal conductivity is λ = 0.03/0.40 = 0.075 W/(m·K). The thermal conductivity of the dense parent polymer (PE/PP) is typically 0.35–0.45 W/(m·K). The blade structure therefore reduces the effective thermal conductivity by a factor of roughly 5–6 relative to the solid material, representing a substantial improvement in insulation performance.

5.4.3. Indoor Cooling Estimation for Different Substrates

The model essentially calculates the indoor temperature rise caused by outdoor heat penetrating through the roof assembly. When the substrate thermal resistance is sufficiently large, the outdoor heat flux is largely attenuated before reaching the indoor space, and the additional thermal resistance of the turf contributes negligible further reduction.
Assuming that without turf, the indoor temperature T in (0) is determined by the substrate thermal resistance R base After laying Type A turf, the transmitted heat flux is reduced to (1 − η) = 57.1% of its original value. Thus:
T in ( A )   =   T i n t   ( 1     η )   q 0 · R b a s e
T in ( 0 ) = T r e f q 0 · R b a s e
Typical roof substrates in northern regions are selected for calculation, and the results are shown in the table below.

5.4.4. Limitations of Idealised Conditions and Interpretation of Results

The above estimates are based on idealised conditions of quasi-steady state, no ventilation, and no edge heat loss (Table 6). The resulting temperature reductions represent the theoretical upper limit of this strategy’s potential. In real buildings, the thermal storage effect of heavy materials such as concrete will cause a time lag and some attenuation of the indoor peak temperature. Meanwhile, factors such as indoor ventilation, roof slope, and surrounding shading will also affect the final outcome. However, for older buildings with weak insulation and limited substrate thermal capacity, the steady-state approximation still captures the main trends reasonably well.
Overall, the primary benefit of laying long-blade artificial turf on a roof is the reduction in heat absorbed by the roof surface and transmitted into the building envelope. For the large number of existing older buildings in northern regions that lack professional insulation and have limited structural thermal resistance, this reduction in heat gain can translate into a noticeable decrease in indoor peak temperature—conservatively estimated at up to approximately 10 °C under typical summer conditions. For roofs that already possess substantial insulation, the outdoor heat flux is largely attenuated before reaching the indoor space. The additional thermal resistance of the turf reduces the already small inward heat flux further, but the corresponding indoor temperature reduction becomes negligible; in this case, the benefit lies mainly in lowering the roof surface temperature and reducing heat released to the surrounding urban environment, which contributes to mitigating the local heat island effect.
If combined with an elevated ventilated construction, the cooling effect is expected to be further improved. This result provides a quantitative theoretical basis for the adoption of lightweight, maintenance-free passive roof cooling strategies in urban renewal.

5.5. Summary

(1)
Blade morphology is the core factor determining the thermal performance of artificial turf. Type A turf, by enhancing convective heat dissipation and forming a static air insulation layer, significantly outperformed medium- and short-blade turfs in terms of surface temperature rise, interface insulation, and cooling rate. Double-layer stacking experiments confirm that simply increasing thickness cannot improve insulation; structural optimisation is superior to material thickening.
(2)
In this study, the surface temperature of Type A turf was lower than that of concrete. The differences from existing literature are attributed to differences in heat dissipation scenario, spectral matching, and scale effects. However, qualitatively, this proves that an optimised structure can break the limitation that “low albedo inevitably leads to high temperature”.
(3)
Artificial turf primarily dissipates heat by convection during the day, with little downward heat conduction. At night, it cools rapidly (29.3 °C temperature drop within 30 min, outperforming concrete), which helps mitigate the “daytime storage, nighttime release” type of heat island in northern cities.
(4)
Artificial turf reduces roof heat flux by approximately 42.9%, adding an equivalent thermal resistance of 0.40 m2·K/W. For older buildings with weak thermal insulation, the summer indoor peak temperature can be reduced by 3–6 °C under idealised conditions, providing data support for lightweight roof cooling.

6. Conclusions

This study systematically compared three artificial turf types (long-blade Type A, medium-blade Type B, and short-blade Type C) with concrete and XPS roofs under controlled indoor conditions, and explored the optimisation potential of double-layer stacking and elevated ventilated constructions.
Blade morphology is the decisive factor. Type A significantly outperformed Types B and C in peak surface temperature, interface insulation, and cooling rate, while Type C showed almost no insulation. This finding breaks away from the prevalent “material determinism” view that low albedo inevitably causes high temperature.
Mechanism and UHI dual effect. Type A’s insulation originates from a stagnant air layer trapped by its long blades, and its rapid cooling avoids the daytime-storage–nighttime-release pattern that aggravates the urban heat island.
Advantage over conventional materials. Type A outperformed concrete and XPS in all key temperature indicators. Even on a well-insulated XPS base, the turf layer provided measurable additional cooling benefits.
Structural optimisation. Doubling the thickness via a double-layer configuration was ineffective due to interlayer heat accumulation, whereas an elevated ventilated cavity significantly improved cooling performance.

7. Limitations and Future Improvements

This study has several limitations. First, the reduced-scale model introduces scale effects and cannot fully replicate real building thermal processes. Second, static radiation conditions do not account for dynamic meteorological factors such as changing solar altitude, wind speed, or wind direction. Third, material ageing and dust accumulation effects on long-term performance were not considered. Fourth, only summer conditions were examined; winter performance was not covered. Fifth, the net diurnal thermal benefit was not quantified, as this would require systematic investigation under varied conditions. Sixth, the benefits depend on blade-induced surface area and air-trapping capacity; tuft density affects both, but excessive density may promote direct conduction through blades, counteracting these advantages, and the optimal density range could not be determined with the present specimens and awaits future study.
Future research can be extended in the following directions: full-scale building measurements; performance evaluation under dynamic meteorological conditions with controlled wind speeds and multi-city weather data to address regional applicability; long-term ageing studies; annual energy simulations and life-cycle assessment; urban-scale climate modelling (e.g., with ENVI-met, TUF-3D) to quantify the net UHI mitigation benefit; systematic evaluation of the integrated day–night thermal performance of artificial turf to determine the net diurnal benefit; material improvement (e.g., near-infrared reflective pigments, phase-change material composites) and structural optimisation (cavity height, vent design); experiments isolating tuft density to determine its optimal range; and development of a multi-objective comprehensive evaluation system to provide optimal solutions for different building types in northern regions.

Author Contributions

Conceptualization, Y.Y., G.L. and H.Y.; Methodology, Y.Y., G.L. and H.Y.; Software, Y.Y.; Validation, Y.Y. and H.Y.; Formal analysis, Y.Y., G.L. and H.Y.; Investigation, Y.Y. and H.Y.; Resources, G.L.; Data curation, Y.Y., G.L. and H.Y.; Writing—original draft, Y.Y. and H.Y.; Writing—review and editing, G.L.; Visualization, Y.Y. and H.Y.; Supervision, Y.Y., G.L. and H.Y.; Project administration, Y.Y.; Funding acquisition, G.L. All authors have read and agreed to the published version of the manuscript.

Funding

This research was funded by the National Natural Science Foundation of China, grant number 51808093. The APC was funded by the same grant.

Institutional Review Board Statement

The authors declare that their Institutional Ethics Committee confirmed that no ethical review was required for this study. Written informed consent for participation was not required because all participants’ data were anonymized before the statistical analyses were done.

Data Availability Statement

All relevant data supporting the findings of this study are presented in the Appendix A of this paper. Raw data are available on request from the corresponding author.

Conflicts of Interest

The authors declare no conflict of interest.

Appendix A

Table A1. Group 1 data (blank control).
Time (min)1-a1-b1-cTime (min)1-a1-b1-c
012.512.512.48221.823.216.1
217.835.712.7842020.815.7
424.544.313.78618.519.115.4
628.547.214.88817.417.815.2
829.147.2159016.516.815
1029.547.515.29215.91614.8
1229.947.815.49415.415.514.6
143047.915.49614.91514.4
1630.448.215.89814.614.714.3
1830.748.31610014.314.414.1
2030.648.116.110214.114.214
2230.74916.110413.91413.9
2430.748.816.210613.713.813.9
2630.748.716.210813.613.613.8
2830.848.716.211013.513.513.7
3030.948.716.311213.413.413.6
323148.916.311413.313.413.6
3430.949.216.311613.213.313.5
363149.216.411813.113.213.5
38314916.412013.113.213.4
4031.149.216.51221313.113.4
4231.249.216.5124131313.3
4431.249.316.512612.91313.3
4631.248.916.512812.91313.3
4831.149.916.613012.912.913.2
5031.450.816.713212.812.913.2
5231.551.816.813412.812.913.2
5431.75216.813612.812.913.1
5631.952.116.913812.712.913.1
583251.716.914012.712.813.1
6032.152.21714212.712.813.1
6232.252.61714412.712.813.1
6432.452.21714612.712.813.1
6632.552.117.114812.712.813.1
6832.652.517.115012.612.813
7032.65317.115212.612.713
7232.652.617.215412.612.713
7432.451.717.215612.612.713
7627.33216.915812.612.713
7829.638.117.116012.612.713
8024.226.616.516212.612.713
Table A2. Group 2 data (long-blade turf A).
Time (min)2-a2-b2-cTime (min)2-a2-b2-c
0121212.24448.636.616.5
212.11212.24648.736.716.5
421.312.112.34848.636.716.5
632.712.812.85048.936.816.5
837.215.113.45248.736.816.5
1040.418.313.95448.936.916.6
1242.321.414.45645.53716.5
1443.824.214.85832.736.616.1
1644.926.415.26027.634.615.6
1846.128.515.46226.433.615.4
204730.115.66425.332.615.2
2247.331.415.86624.531.715.1
2447.532.615.96822.128.514.7
2647.733.5167020.425.814.4
2848.234.216.17219.925.114.3
3048.234.916.27419.424.314.2
3248.735.416.27618.422.614.1
3448.535.616.37817.421.113.9
3648.63616.48016.619.613.7
3848.536.116.48216.319.113.6
4048.536.416.5
4248.536.516.5
Table A3. Group 3 data (medium-blade turf B).
Time (min)3-a3-b3-cTime (min)3-a3-b3-c
012.512.612.85252.452.116.5
224.813.812.95452.652.116.5
443.12613.85652.552.116.5
644.829.2145851.552.116.5
849.138.5156032.545.516.2
1049.840.615.2622941.916
1250.542.315.46423.233.915.4
1450.743.915.66621.130.215.2
1651.245.215.76819.92815
1851.446.315.87018.926.114.8
2051.647.215.97218.124.514.7
2251.848.1167417.423.114.6
245248.716.17616.821.814.5
2652.149.316.27816.320.714.3
2852.349.816.38015.919.814.2
3052.750.116.38215.518.914.1
3252.450.516.48415.318.214
3452.550.816.5861517.514
3652.75116.58814.81713.9
3852.851.216.59014.616.613.8
405351.416.69214.416.113.8
4253.251.616.69414.215.813.7
4453.151.616.69614.115.513.6
4653.45216.8981415.213.6
4852.952.116.710013.91513.6
5052.552.116.610213.614.413.4
Table A4. Group 4 data (short-blade turf C).
Time (min)4-a4-b4-cTime (min)4-a4-b4-c
013.513.2135460.454.717.2
214.214.413.15660.454.817.3
414.315.113.15860.154.917.4
638.31813.46059.95517.4
844.621.513.66259.755.117.4
1049.926.3146460.355.217.4
1253.53114.56660.655.417.4
1454.235.214.96860.155.517.5
1655.238.915.37060.355.617.5
1855.642.115.67260.655.817.6
2056.144.915.97460.455.917.6
2256.54616.57651.455.617.6
2456.847.416.47842.853.417.7
2657.148.616.38037.45017.8
2857.549.616.48233.646.217.7
3057.650.516.58430.642.417.4
325851.216.68628.13917.1
345851.916.7882635.916.7
3658.152.416.89024.333.116.4
3858.452.816.89222.830.716.2
4058.953.216.99421.628.515.9
4259.653.5179620.526.715.7
4459.953.8179819.62515.5
46605417.110018.823.615.3
4860.154.117.110218.122.415.2
5060.154.317.210417.621.315
5260.354.517.2
Table A5. Group 5 data (concrete slab).
Time (min)5-a5-b5-cTime (min)5-a5-b5-c
014.114.313.29426.333.214.5
21414.313.19626.132.714.4
413.813.913.19825.732.214.3
628.413.613.410025.331.714.3
83114.213.610224.931.214.2
1032.8151410424.630.714.1
1234.21614.210624.130.214.1
1435.41714.510823.829.714
1636.318.114.811023.529.214
1837.119.114.911223.428.813.9
2037.820.215.211423.328.713.9
2238.521.315.311622.527.613.9
2439.322.315.511822.22713.8
264023.315.712022.126.613.7
2840.524.315.812221.826.213.7
3040.925.415.912421.525.913.7
3241.426.31612621.225.513.7
3441.927.2161282125.113.7
3642.32816.113020.724.813.7
384328.916.213220.524.413.7
4043.230.316.213420.424.113.6
4243.530.816.213620.123.813.6
4443.931.316.313819.923.413.6
464531.916.414019.823.113.6
484632.616.414219.622.813.6
5046.333.316.514419.422.513.5
5246.933.916.614619.222.213.5
5447.334.616.6148192213.5
5647.535.216.715018.821.713.5
5847.935.816.715218.621.413.5
6048.336.416.815418.421.213.4
6248.836.916.815618.32113.4
6449.337.516.915818.220.713.4
6649.43816.91601820.513.4
6849.738.516.916217.719.913.4
7049.9391716417.419.513.4
7237.439.916.916617.319.313.3
7435.639.816.816817.119.113.3
763138.916.21701718.913.4
7830.437.715.617216.918.713.3
8029.636.915.417416.818.613.3
8229.236.415.217616.718.413.3
8428.635.91517816.618.313.3
862835.414.918016.518.113.3
8827.634.814.818216.417.913.3
9027.234.314.718416.317.813.3
9226.733.814.618616.217.613.3
Table A6. Group 6 data (double-layer medium-blade turf).
Time (min)6-a6-b6-cTime (min)6-a6-b6-c
012.512.512.68236.139.115.5
213.112.512.78434.537.615.4
414.912.812.8863336.215.2
617.413.513.18831.634.815.1
82014.613.39030.333.414.9
1022.516.113.69229.132.114.8
1227.219.914.2942830.814.7
1431.424.414.89626.929.614.6
1635.329.115.39825.928.514.5
1837.932.515.61002527.414.4
2039.935.115.910224.126.414.3
2241.637.216.210423.325.414.2
244338.916.410622.624.514.1
2644.140.216.510821.923.714.1
2844.440.616.611021.322.914
3044.84116.611220.722.214
3245.141.416.711420.221.513.9
3445.541.716.711619.720.913.9
3645.74216.711819.220.413.8
3846.442.716.812018.719.813.8
4046.843.31712218.319.313.7
4246.943.616.912417.918.813.7
4447.143.716.912617.518.413.6
4647.243.816.912817.21813.6
4847.34416.913016.917.613.5
5047.444.11713216.617.313.5
5247.644.316.913416.31713.5
5447.844.516.813616.116.713.4
5647.944.616.813816.116.613.4
5847.944.616.814015.315.713.2
6047.844.716.914215.115.513.2
6247.744.716.914414.915.313.2
6447.744.716.914614.815.113.2
6647.744.716.914814.61513.2
6846.744.616.715014.614.913.2
7047.744.716.915214.514.813.2
7245.244.316.515414.414.713.2
7443.343.816.315614.314.613.2
7641.542.816.115814.214.413.2
7839.641.715.916014.114.313.2
8037.840.415.71621414.313.1
Table A7. Group 7 data (elevated long-blade turf).
Time (min)7-a7-bTime (min)7-a7-b
010.910.63030.529.6
212.114.83229.724.3
419.232.73428.121
620.534.83626.518.8
823.834.8382517.1
1025.838.74023.616
1226.937.64222.315
1428.736.94421.214.4
1628.835.14620.213.8
1830.735.84819.413.4
2031.2385018.613
2231.539.25217.912.8
2431.940.35417.212.5
2632.740.75617.112.4
2832.940.8
Table A8. Group 8 data (elevated XPS board).
Time (min)8-a8-bTime (min)8-a8-b
01513.82230.942
219.826.12431.442.5
422.531.82631.542.7
624.234.62831.142.4
825.436.43030.339.1
1026.7373225.428.1
1227.2383421.120.8
142838.63618.116.6
1629.440.63815.613.8
1830.241.14014.813
2030.641.9

References

  1. Hu, Y.B.; Xiao, G.J.; Li, Y.P. Research advances in northward shifting of climatic-zones and the influence on crop-planting systems in China. Agric. Res. Arid Areas 2020, 38, 269–274. [Google Scholar] [CrossRef]
  2. Zhang, Z.; Dong, Y.; Li, C.; Wu, C.; Wang, Q.; Liu, X. Impacts and spatiotemporal differentiation of built environments on the urban heat island effect in cold-climate cities based on local climate zones. IEEE J. Sel. Top. Appl. Earth Obs. Remote Sens. 2025, 18, 5406–5422. [Google Scholar] [CrossRef]
  3. Tang, J.; Zhang, S.; Shao, Z.; Zou, C.; Yi, X. Impact of Roof Shape on Micro-environment in Street Canyons by Numerical Simulation. Geomat. Inf. Sci. Wuhan Univ. 2020, 45, 888–894. [Google Scholar] [CrossRef]
  4. Schmidt, M.; de Souza, S.N.M.; Secco, D.; Snak, A.; Bassegio, D. Thermal performance of green roofs influenced by substrate composition. Eng. Agrícola 2025, 45, e20240146. [Google Scholar] [CrossRef]
  5. Nuñez, F.; Contreras, O. Influence of an extensive green roof in the non-linear structural behavior of self–construction households. Rev. Ing. De Construcción 2021, 36, 157–172. [Google Scholar] [CrossRef]
  6. Huang, J.; Kong, F.; Yin, H.; Middel, A.; Green, J.K.; Liu, H. Green roof plant physiological water demand for transpiration under extreme heat. Urban For. Urban Green. 2024, 98, 128411. [Google Scholar] [CrossRef]
  7. López-Silva, D.V.; Sigala-Meza, E.; Bullock, S.H.; Hernández-Pérez, I.; Sauceda-Carvajal, D.; Zavala-Guillén, I.; Méndez-Alonzo, R. Maintenance, operational costs, and plant performance in three extensive green roof designs from Northwest México. Urban For. Urban Green. 2024, 101, 128521. [Google Scholar] [CrossRef]
  8. Fang, T.; Hu, W.; Yan, C.; Zhang, C.; Wang, B.; Hayat, M.; Qiu, G. Observed evaporative cooling of urban trees and lawns during heatwaves. Nat. Cities 2025, 2, 86–95. [Google Scholar] [CrossRef]
  9. He, Y.F.; Peng, L.H.; Yang, X.S.; Feng, N.Y. Annual Energy Consumption Reduction and Cost-Benefit of Green Roofs in Hot Summer and Cold Winter Zone. Resour. Environ. Yangtze Basin 2021, 30, 2253–2263. [Google Scholar]
  10. Yin, Y.; Shao, Y.; Meng, Y.; Hao, Y. The Effects of the Natural Visual-Aural Attributes of Urban Green Spaces on Human Behavior and Emotional Response. Front. Psychol. 2023, 14, 1186806. [Google Scholar] [CrossRef] [PubMed]
  11. Wang, J.L.; Tong, Y.Q.; Liu, J.H.; Zhang, T.; Han, C.N.; Han, Z.J. Application of Roof Turf in the Roof Greening of Old Buildings in Xianyang District. North. Hortic. 2018, 13, 95–101. [Google Scholar]
  12. Hassan, A.; Zhang, D.S. Psychophysiological Impact of Touching Landscape Grass among Older Adults. J. Urban Health 2024, 101, 792–803. [Google Scholar] [CrossRef] [PubMed]
  13. Thoms, A.W. Sources of Heat in Synthetic Turf Systems. Ph.D. Thesis, University of Tennessee, Knoxville, TN, USA, 2015. [Google Scholar]
  14. Jim, C.Y. Solar–terrestrial radiant-energy regimes and temperature anomalies of natural and artificial turfs. Appl. Energy 2016, 173, 520–534. [Google Scholar] [CrossRef]
  15. Chang, B.; Da Ros Carvalho, H.; Wherley, B.; Aitkenhead-Peterson, J.A.; McInnes, K.J.; Heilman, J.L. Radiation Balance of Different Materials Used in Urban Landscaping. In Proceedings of the ASA, CSSA, SSSA International Annual Meeting Abstracts, San Antonio, TX, USA, 9–13 November 2020; ASA-CSSA-SSSA: Madison, WI, USA, 2020; p. 126871. [Google Scholar]
  16. Tebakari, T.; Maruyama, T.; Inui, M. A Study on Thermal Environment Properties of the Water-Retentive Artificial Turf System. J. Jpn. Soc. Hydrol. Water Resour. 2010, 23, 18–31. [Google Scholar] [CrossRef]
  17. Devitt, D.A.; Young, M.H.; Baghzouz, M.; Bird, B.M. Surface Temperature, Heat Loading and Spectral Reflectance of Artificial Turfgrass. J. Turfgrass Sports Surf. Sci. 2007, 83, 68–82. [Google Scholar]
  18. Yaghoobian, N.; Kleissl, J.; Krayenhoff, E.S. Modeling the Thermal Effects of Artificial Turf on the Urban Environment. J. Appl. Meteorol. Climatol. 2010, 49, 332–345. [Google Scholar] [CrossRef]
  19. Choi, D.H.; Lee, B.Y. An Experimental Study of Surface Materials for Planting of Building Surface by the Radiant Heat Balance Analysis in the Summer. J. Korean Sol. Energy Soc. 2010, 30, 71–80. [Google Scholar]
  20. Abuseif, M. The Thermal Effect of Various Local Park Settings: A Simulation-Based Case Study of Sunshine Coast, Australia. Architecture 2023, 3, 195–212. [Google Scholar] [CrossRef]
  21. Meng, F.; Yan, S.; Tian, G.; Wang, Y. Surface urban heat island effect and its spatiotemporal dynamics in metropolitan area: A case study in the Zhengzhou metropolitan area, China. Front. Environ. Sci. 2023, 11, 1247046. [Google Scholar] [CrossRef]
  22. Zhang, W.W.; Jia, R.Y.; Tian, M.; Xu, X.L.; Liu, J.W.; Han, D.R.; He, T.; Sun, Z.Y.; Cong, H.; Qiao, Z. Exploring the Diurnal Dynamics of Urban Thermal Environment Within and Across Local Climate Zones Using ECOSTRESS. J. Geo-Inf. Sci. 2024, 26, 679–692. [Google Scholar] [CrossRef]
  23. Ma, S.L.; Wu, X.G.; Sun, F.; Li, Y.Z.; Hu, D.; Yuan, J.J.; Zhang, F.H. Effects of Artificial Structures on Adjacent Green Space Soil Temperature and Moisture Content in Urban Beijing. Acta Ecol. Sin. 2015, 35, 537–546. [Google Scholar] [CrossRef][Green Version]
  24. Zhou, Y.P.; Huang, L.Z.; Zhong, J.X. Experimental Study on Heat Transfer Performance of Roof with Artificial Vegetation. Shanghai Energy Conserv. 2025, 10, 1568–1574. [Google Scholar] [CrossRef]
  25. Sahito, A.A.; Memon, R.A.; Harijan, K.; Shaikh, P.H. Simulation of Thermal Performance and Cost Benefits of Cool Roof Options through Building Engineering System Software. Mehran Univ. Res. J. Eng. Technol. 2020, 39, 806–814. [Google Scholar] [CrossRef]
  26. Tariku, F.; Shang, Y.; Molleti, S. Thermal performance of flat roof insulation materials: A review of temperature, moisture and aging effects. J. Build. Eng. 2023, 76, 107256. [Google Scholar] [CrossRef]
  27. Ding, Z.W.; Wen, Z.P.; Li, W.B.; Jian, M.Q.; Yan, Z.C.; Li, W.Q. Observation and Analysis of Surface Radiation and Energy Balance over Grassland Underlying Surface in Longmen Area, Guangdong Province. J. Sun Yat-Sen Univ. (Nat. Sci. Ed.) 2011, 50, 123–129. [Google Scholar]
  28. Chen, W. Exploration on the Design of Roof Greening for Public Buildings in Northern China. Master’s Thesis, Hebei University of Technology, Tianjin, China, 2018. [Google Scholar]
  29. Takebayashi, H.; Moriyama, M. Surface Heat Budget on Green Roof and High Reflection Roof for Mitigation of Urban Heat Island. Build. Environ. 2007, 42, 2971–2979. [Google Scholar] [CrossRef]
  30. Baneshi, M.; Maruyama, S.; Komiya, A. The Effects of TiO2 Pigmented Coatings Characteristics on Temperature and Brightness of a Coated Black Substrate. Sol. Energy 2012, 86, 200–207. [Google Scholar] [CrossRef]
  31. Long, Z.Y.; Li, G.H.; Luo, Q.H.; Deng, T.W.; Li, X.J. Analysis of Thermal Insulation Performance and Climate Adaptability of Ventilated Sloping Roof. Shanghai Energy Conserv. 2023, 8, 1167–1177. [Google Scholar] [CrossRef]
  32. Chen, Y.R.; Xiao, L.; Xu, H.T.; Wang, Z.J.; Mei, G.X.; Jiang, M.J.; Huang, S. Experimental and numerical analysis of thermal performance and energy consumption of ventilated green roof. Energy Build. 2025, 330, 115330. [Google Scholar] [CrossRef]
  33. Liu, Y.B. Study on Thermal Performance and Energy Supply Characteristics of Heat Pump Type PVT Ventilated Roof for Rural Residential Buildings in Northern China. Ph.D. Thesis, Dalian University of Technology, Dalian, China, 2021. [Google Scholar]
  34. Gao, F.; Wang, J.J.; Liu, Y.; Zhou, Z.; Zhang, C.X. An experimental study of the summer and winter thermal performance of an opaque ventilated facade in cold zone of China. Build. Environ. 2022, 218, 109379. [Google Scholar] [CrossRef]
  35. Amaripadath, D.; Sailor, D.J. Unlocking Cooler Artificial Turf Materials Infused With Infrared-Reflective Organic Green Pigments for Urban Landscapes. J. Eng. Sustain. Build. Cities 2025, 6, 031002. [Google Scholar] [CrossRef]
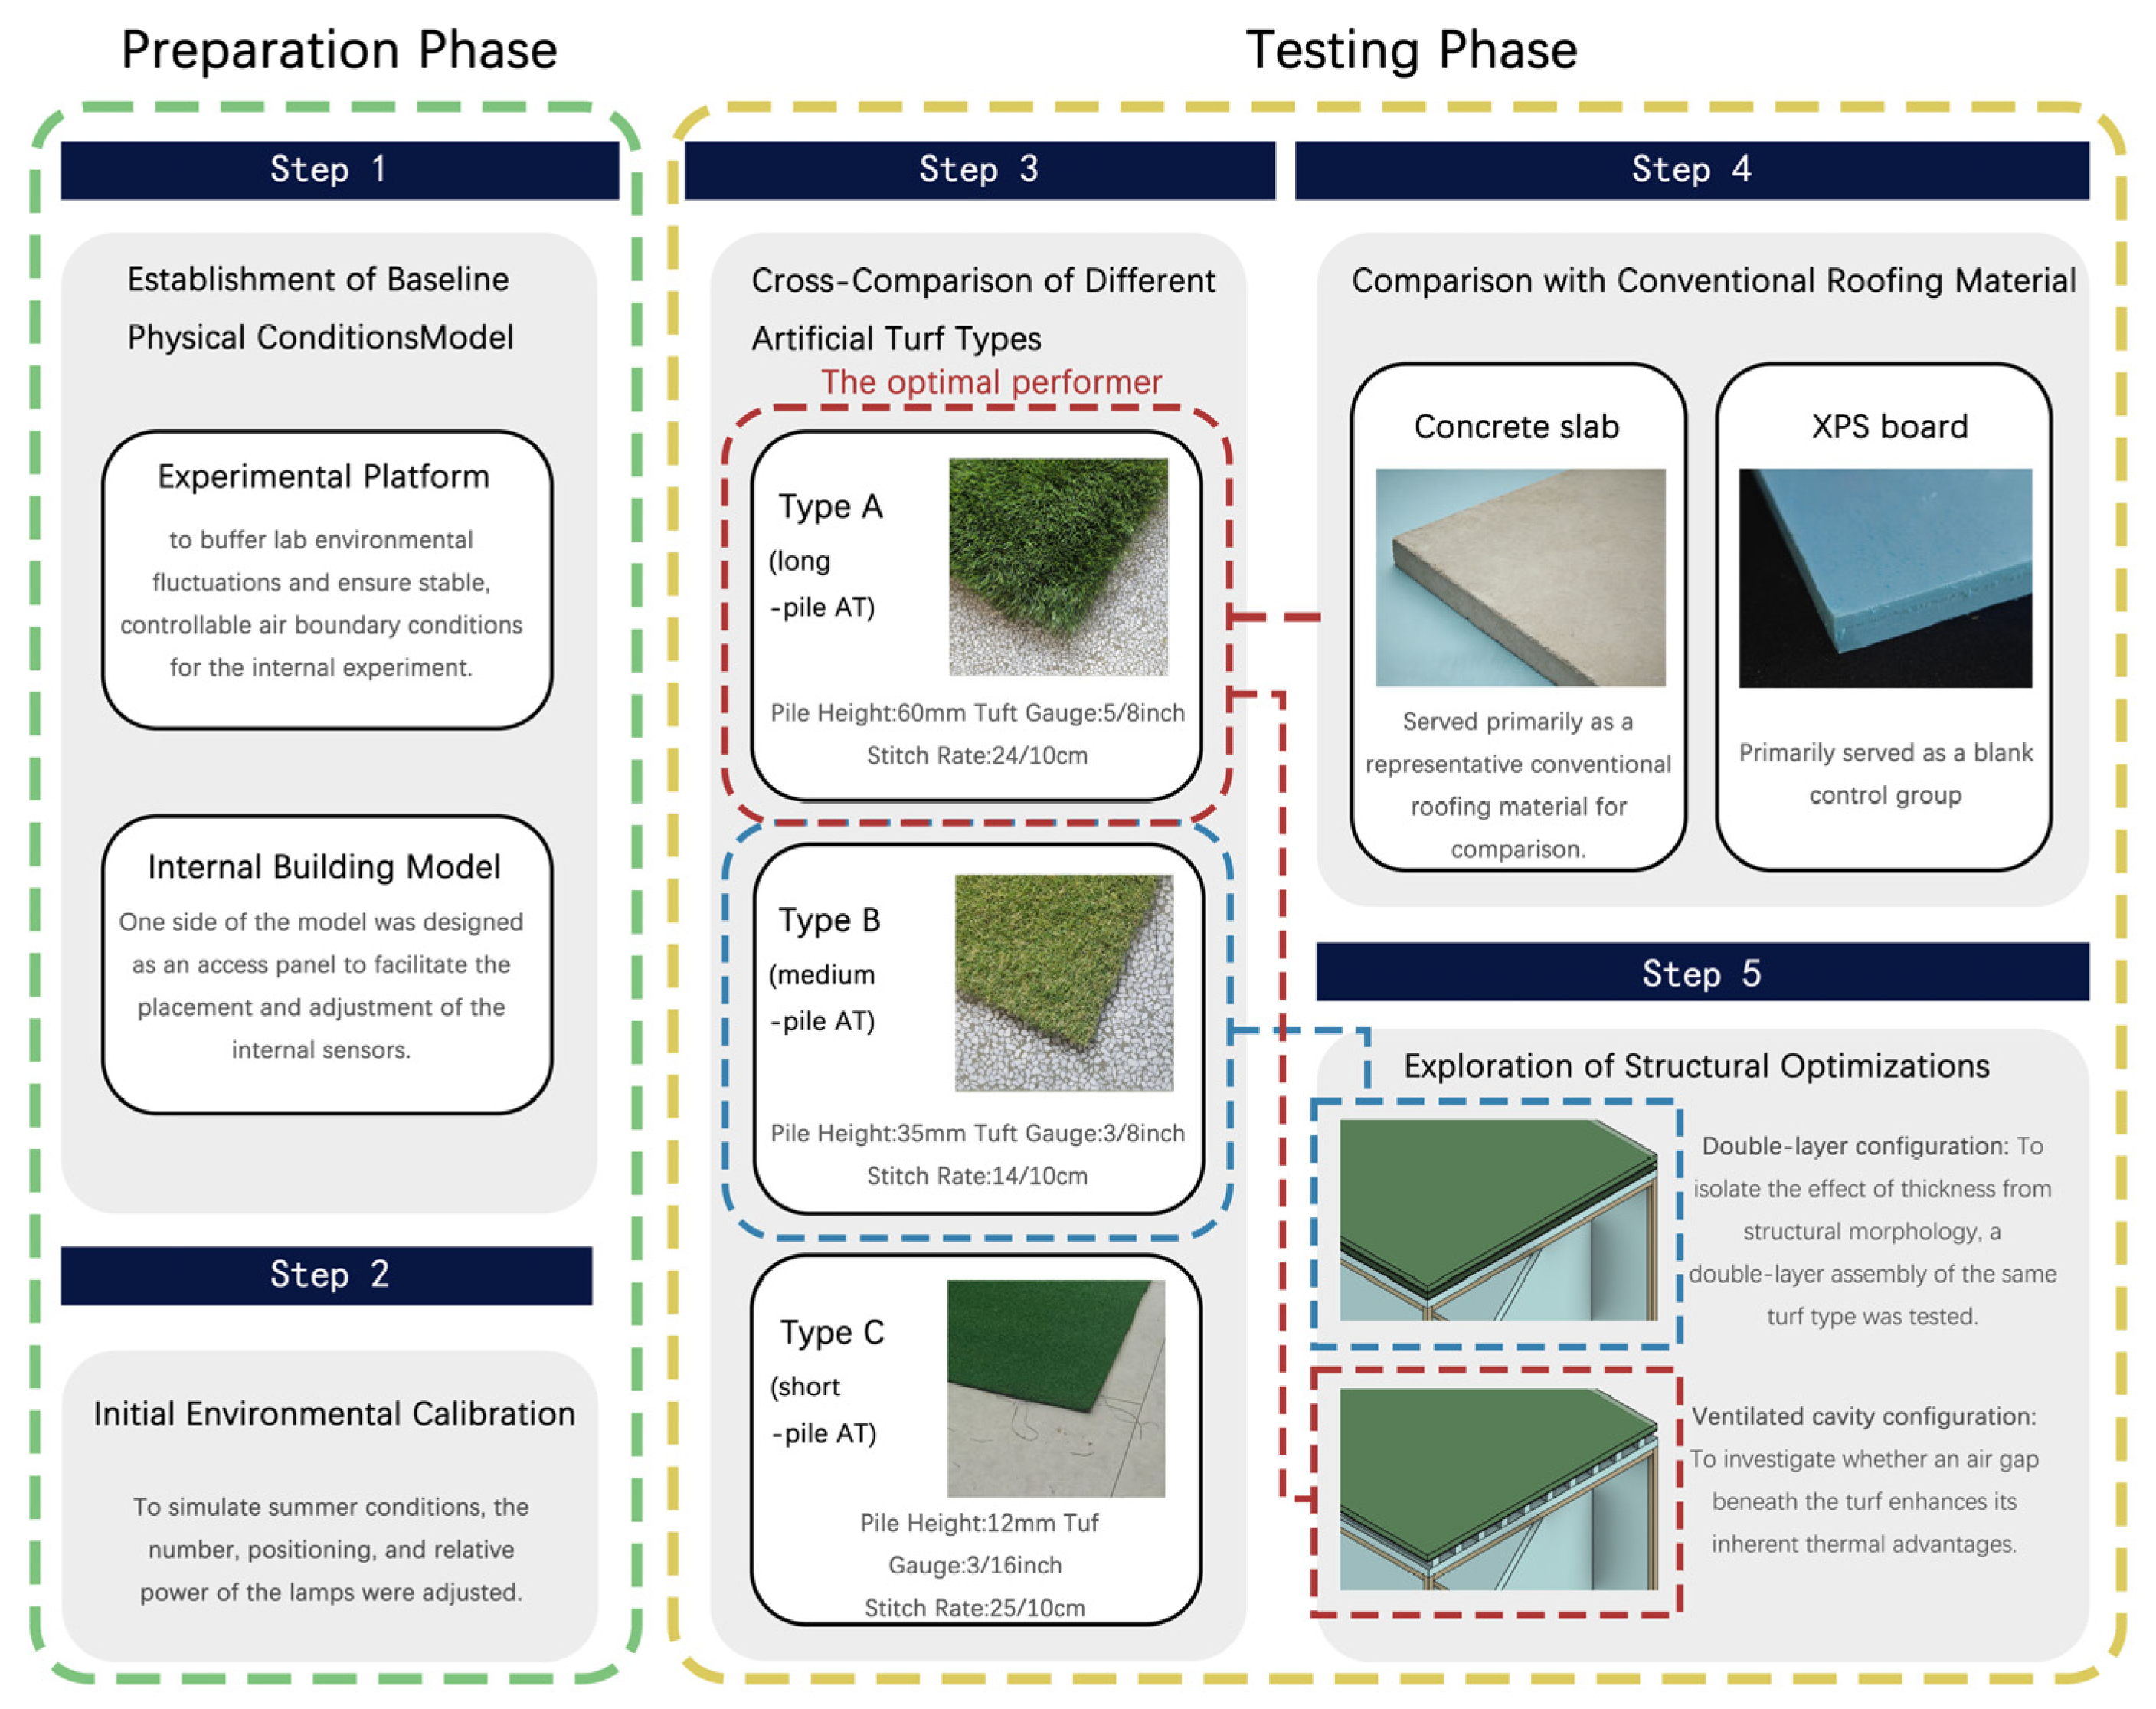
Figure 1. Experimental framework diagram.
Buildings 16 02452 g001
Figure 2. Cross-sectional schematics of each test group.
Buildings 16 02452 g002
Figure 3. Establishment of baseline physical conditions model.
Buildings 16 02452 g003
Figure 4. Initial environmental calibration.
Buildings 16 02452 g004
Figure 5. Placement of measurement points.
Buildings 16 02452 g005
Figure 6. Line charts of temperature data for each group.
Buildings 16 02452 g006
Table 1. Parameters of the three tested turf types.
Blade CompositionMaterialColor
AVario SP-60 mm
Pile Height: 60 mm Tuft Gauge: 5/8 inch Stitch Rate: 24/10 cm
PE & PP12200Ordinary Green & Matt Olive & VVei Green & Mango Lime & Wei Green & Wei Yellow
BCrazy PX2-35 mm Pile Height: 35 mm Tuft Gauge: 3/8 inch Stitch Rate: 14/10 cmPE & PP5700Jane Emerald & Jane Lime Bi-color & Light Yellow
CGreen HF-12 mm Pile Height: 12 mm Tuft Gauge: 3/16 inch
Stitch Rate: 25/10 cm
PE8000Emerald
The nominal pile heights are 60 mm, 35 mm, and 12 mm, respectively. But under self-weight and mutual fibre support, the effective upright thickness of the blade layer is approximately 20–30 mm for Type A, and proportionally less for Types B and C.
Table 2. Main experimental instruments and equipment.
Equipment NameModel/SpecificationMain Technical ParametersQuantityPurposeRemarks
Digital temperature and humidity sensorTemperature: −40~80 °C, Humidity: 0–100% RHTemperature: ±0.2 °C, Humidity: ±2% RH8 pcsAmbient temperature and humidity monitoringIngress protection rating IP65
Data logger16 channels, storage capacity ≥ 1 GBSampling interval adjustable from 1 to 3600 s2 unitsAutomatic data acquisitionPrimary and backup configuration
Wireless transmission moduleTransmission distance ≥ 500 mReal-time data transmission4 pcsRemote monitoring4G/WiFi dual-mode
Infrared heat sourceKONKA KH-TY15, Konka Group Co., Ltd., Shenzhen, China1000 W5 unitsProvide infrared radiant heat source
Multi-spectrum fill lightSMD-2835-96 LEDs, generic LED module, ChinaSpectral combination: 3000 K/5000 K warm white light + 660 nm red light + 730 nm far-red light + 395 nm UV light4 unitsProvide visible light and partial UV spectral energy to simulate solar radiation
Table 3. Experimental test groups and measurement points.
GroupDescriptionMain Measurement Points
1Blank control: Building model top directly exposed to radiation.1-a:Model outer surface center temperature
1-b:Model internal center air temperature
1-c:Ambient air temperature at 1.5 m height
2Single-layer turf: Single-layer artificial turf of models A, B, C laid sequentially on top.2/3/4-a:Turf surface peak temperature
2/3/4-b:Turf-backing interface temperature
2/3/4-c:Model internal air temperature
3
4
5Concrete control: Concrete slab of identical area at test position.5-a:Concrete upper surface center temperature
5-b:Concrete lower surface center temperature
5-c:Model internal air temperature
6Double-layer turf: Two layers of specified turf stacked vertically.6-a:Interlayer air temperature (between two turf layers)
6-b:Lower turf bottom interface temperature
6-c:Model internal air temperature
7Elevated turf: Specified turf raised on all sides with XPS strips, forming a ventilated bottom cavity open to outside air.7-a:Ventilated cavity air temperature (under turf)
7-b:Air temperature 15 cm above turf surface
7-c:Model internal air temperature
8Elevated XPS control: Whole XPS board raised on spacers to form a ventilated bottom cavity.8-a:XPS bottom cavity air temperature
8-b:Air temperature 15 cm above XPS board
8-c:Model internal air temperature
Table 4. Comparison of main parameters of the three turf types.
ParameterLong-Blade Turf AMedium-Blade Turf BShort-Blade Turf C
Peak surface temperature48.9 °C53.4 °C60.6 °C
Peak adhesive-backing interface temperature37.0 °C52.1 °C56.0 °C
Peak internal model temperature16.6 °C17.5 °C17.8 °C
attenuation factor (β)1.481.041.10
Table 5. Thermal performance summary: Type A turf vs. concrete vs. XPS.
ParameterLong-Blade Turf AConcreteXPS
Peak surface temperature48.9 °C49.9 °C52.2 °C
Peak internal model temperature16.6 °C17.3 °C17.2 °C
Attenuation factor (β)1.4814.0
Data during the natural decay phase1.10 °C/min0.33 °C/min1.53 °C/min
Table 6. Indoor cooling effect of Type A turf on various roof substrates.
Roof TypeSubstrate Thermal Resistance
(m2·K/W)
Indoor Peak Temperature Without Turf
(°C)
Indoor Peak Temperature with Type A Turf (°C)Indoor Temperature Reduction
(°C)
2 cm XPS0.6717.1916.530.66
5 cm aerated concrete0.3335.1126.778.34
100 mm Dry furnace slag0.5026.1521.654.50
40 mm Wheat straw mud0.2539.3329.1810.15
Stagnant air layer (enclosed attic) 200 mm0.3534.0626.177.89
Note: The first row is the experimentally measured value; the remaining rows are theoretical estimates.
Disclaimer/Publisher’s Note: The statements, opinions and data contained in all publications are solely those of the individual author(s) and contributor(s) and not of MDPI and/or the editor(s). MDPI and/or the editor(s) disclaim responsibility for any injury to people or property resulting from any ideas, methods, instructions or products referred to in the content.