1. Introduction
In steel structural engineering, accounting for fatigue is essential to ensure the integrity and safety of infrastructure throughout its service life. Fatigue remains a critical concern, as steel continues to play a central role in modern civil engineering. In 2025, global crude steel production reached approximately two billion metric tons, with about 52% used in the building and infrastructure sector [
1]. Given the extensive reliance on steel for bridges, buildings, and other load-bearing systems, it is imperative to monitor its long-term performance and safety by understanding its behavior under cyclic loading through multiple complementary variables.
The study of fatigue and its associated failure mechanisms has become a crucial research area, as understanding this phenomenon is essential to prevent catastrophic structural collapses [
2,
3]. Fatigue refers to the progressive degradation of a material subjected to cyclic or fluctuating loads over time. Under repeated stress, dislocation structures within the steel’s crystalline lattice accumulate and reorganize, eventually leading to the nucleation of nano-scale cracks. These microcracks coalesce and propagate, producing characteristic striation patterns on the fracture surface [
4,
5]. As damage advances, crack growth evolves into cleavage and high-energy dimple formation, ultimately causing the fracture of the component or complete system failure [
6,
7].
The scientific study of fatigue originated in the late nineteenth century, driven by the rapid expansion of iron use in infrastructure and machinery during the Industrial Revolution [
8]. As industrial systems faced widespread service, structural failures began to emerge due to the repeated loading of metallic components. A notable early example was the 1842 railway accident in Versailles, France—considered the first documented case of fatigue-induced failure in wagon axles [
8].
Although several numerical methods have been developed to predict fatigue failure [
9,
10], their accuracy is often limited by microscopic variations inherent to steel production. Subtle differences in composition, grain structure, and residual stresses can significantly influence a material’s fatigue performance and reliability, thereby constraining the predictive capability of purely computational models.
Nevertheless, recent research has sought to overcome these computational bottlenecks through interpretable surrogate modeling and data-driven frameworks. For instance, Chen et al. [
11] developed an interpretable random forest surrogate for rapid stress intensity factor (SIF) prediction in bridge welds, utilizing SHAP techniques to reveal the physical logic behind predictions. Similarly, multi-source ‘authentic’ data-driven frameworks have been proposed by Zhang et al. [
12] to integrate computer vision for correcting geometric deviations in existing structures. These methodologies have extended to predicting fatigue strength based on material composition and processing parameters, as demonstrated by Kookalani et al. [
13], as well as analyzing steels in hydrogen-rich environments using physics-informed learning, as reported by Wu et al. [
14]. In specific industrial applications, machine learning-based surrogate models have been implemented to evaluate crack propagation in offshore steel jackets [
15] and structural steels through regression-based benchmarking, as studied by Arvanitis et al. [
16]. Furthermore, large-sample machine learning substitution frameworks, such as the CNN-LSTM model developed by Xiao et al. [
17], have demonstrated high precision in predicting structural responses, while other evidence-enhanced models have focused on dynamic prediction under fluctuating superimposed loads [
18]. Additionally, multi-scale mechanical models have been refined by Zhang et al. [
19] to characterize fatigue expansion in corroded elements, accounting for reinforcement barrier effects. While these data-driven approaches offer unprecedented efficiency, their reliability is inherently tied to the quality of training data, highlighting the critical need for direct physical monitoring methods—such as the surface-magnetic-flux-monitoring approach proposed in this study—that provide real-time physical indicators with which to validate these advanced computational frameworks.
While there are various experimental techniques for characterizing fatigue behavior in steel, destructive testing remains the most reliable approach for obtaining precise and verifiable results.
As steel approaches the point of fatigue failure, microstructural changes occur within the base metal—particularly in the crystalline lattice—that alter its mechanical properties [
20]. Several techniques are currently used to evaluate the mechanical behavior of steel components subjected to cyclic loading, especially in bridge applications [
21]. Some of the most important ones are (i) visual inspection, (ii) destructive testing, and (iii) non-destructive testing. However, because fatigue damage initiates at the microscopic scale, early detection often depends on invasive or localized methods, which limits their practicality for continuous monitoring in service structures.
Given these challenges, it is essential to use testing approaches that directly assess the fatigue behavior of steel elements with the highest possible accuracy. Such tests should provide critical insight into the material’s current condition and enable the development of complementary methodologies capable of anticipating potential failures before they compromise structural safety.
Ferromagnetism, an intrinsic property of steel, has been explored in several studies as a means of predicting fatigue failure under controlled laboratory conditions [
22,
23,
24]. This approach relies on the behavior of magnetic dipoles within the metal’s crystalline lattice. Each grain or crystal acts as an individual magnetic domain, and when the material is exposed to an external magnetic field, these domains align, producing measurable magnetic and electrical responses [
25,
26]. Similar magnetic variations have been observed when mechanical deformation alters the orientation of steel crystals, generating detectable spikes in surface magnetic emissions [
22].
Focusing on steel’s ferromagnetic properties, several studies have investigated the use of magnetic responses to better understand fatigue behavior. These studies have demonstrated that variations in ferromagnetic signals can serve as indicators of damage accumulation during cyclic loading. In practical applications, magnetic emission measurements have been correlated with the progression of fatigue damage in low-carbon steel specimens subjected to repeated loading [
22,
27,
28].
Previous studies have suggested that variations in the magnetic fields emitted from within steel components can reflect different stages of fatigue damage [
27,
28]. This relationship offers the potential to assess stress levels, detect early signs of fatigue, and anticipate failure in structural elements [
29,
30].
Although previous studies have established a correlation between magnetic field variations and the onset of fatigue failure, no research to date has validated this relationship using full-scale structural elements or by monitoring surface magnetic flux directly [
31]. This study addresses this gap by experimentally investigating the behavior of steel beams subjected to cyclic bending loads that induce fatigue cracking without necessitating investigation of crack advance, as this also necessitates the performance of visual inspections, which often cannot be performed periodically. The tests begin with a mechanically introduced visible crack on the tension flange, allowing for controlled observation of damage evolution and corresponding magnetic flux responses throughout the fatigue process.
2. Materials and Methods
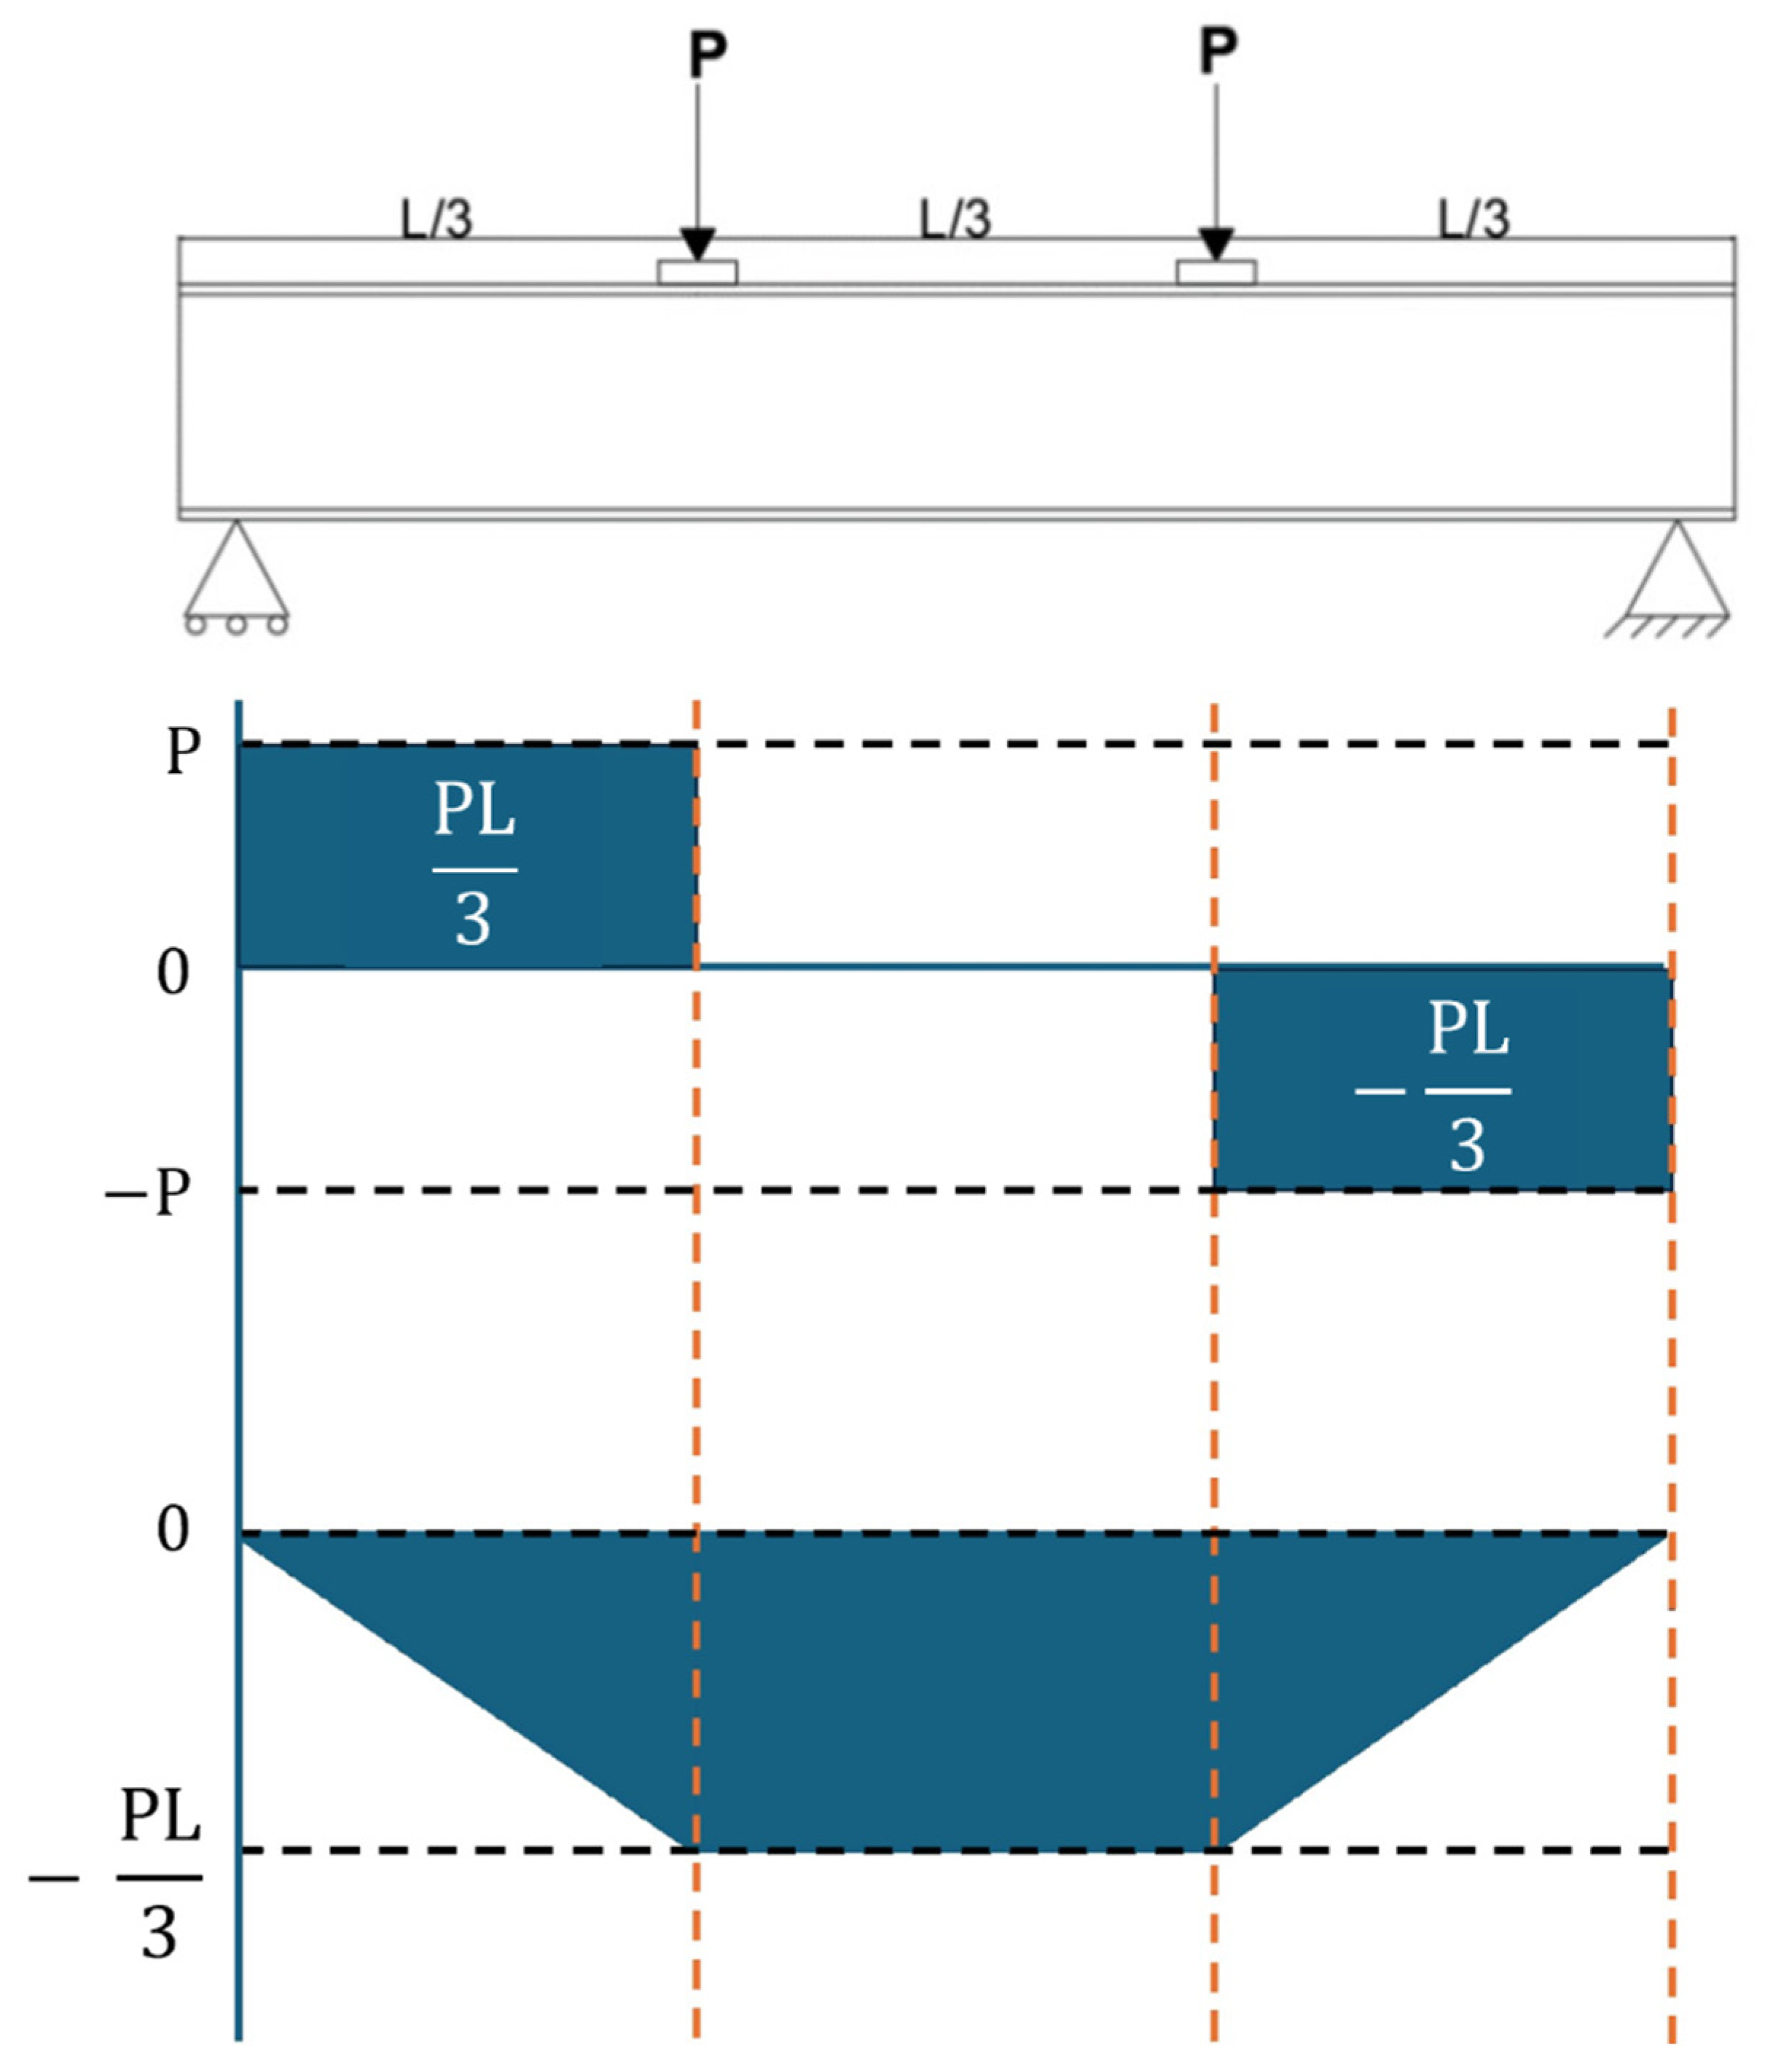
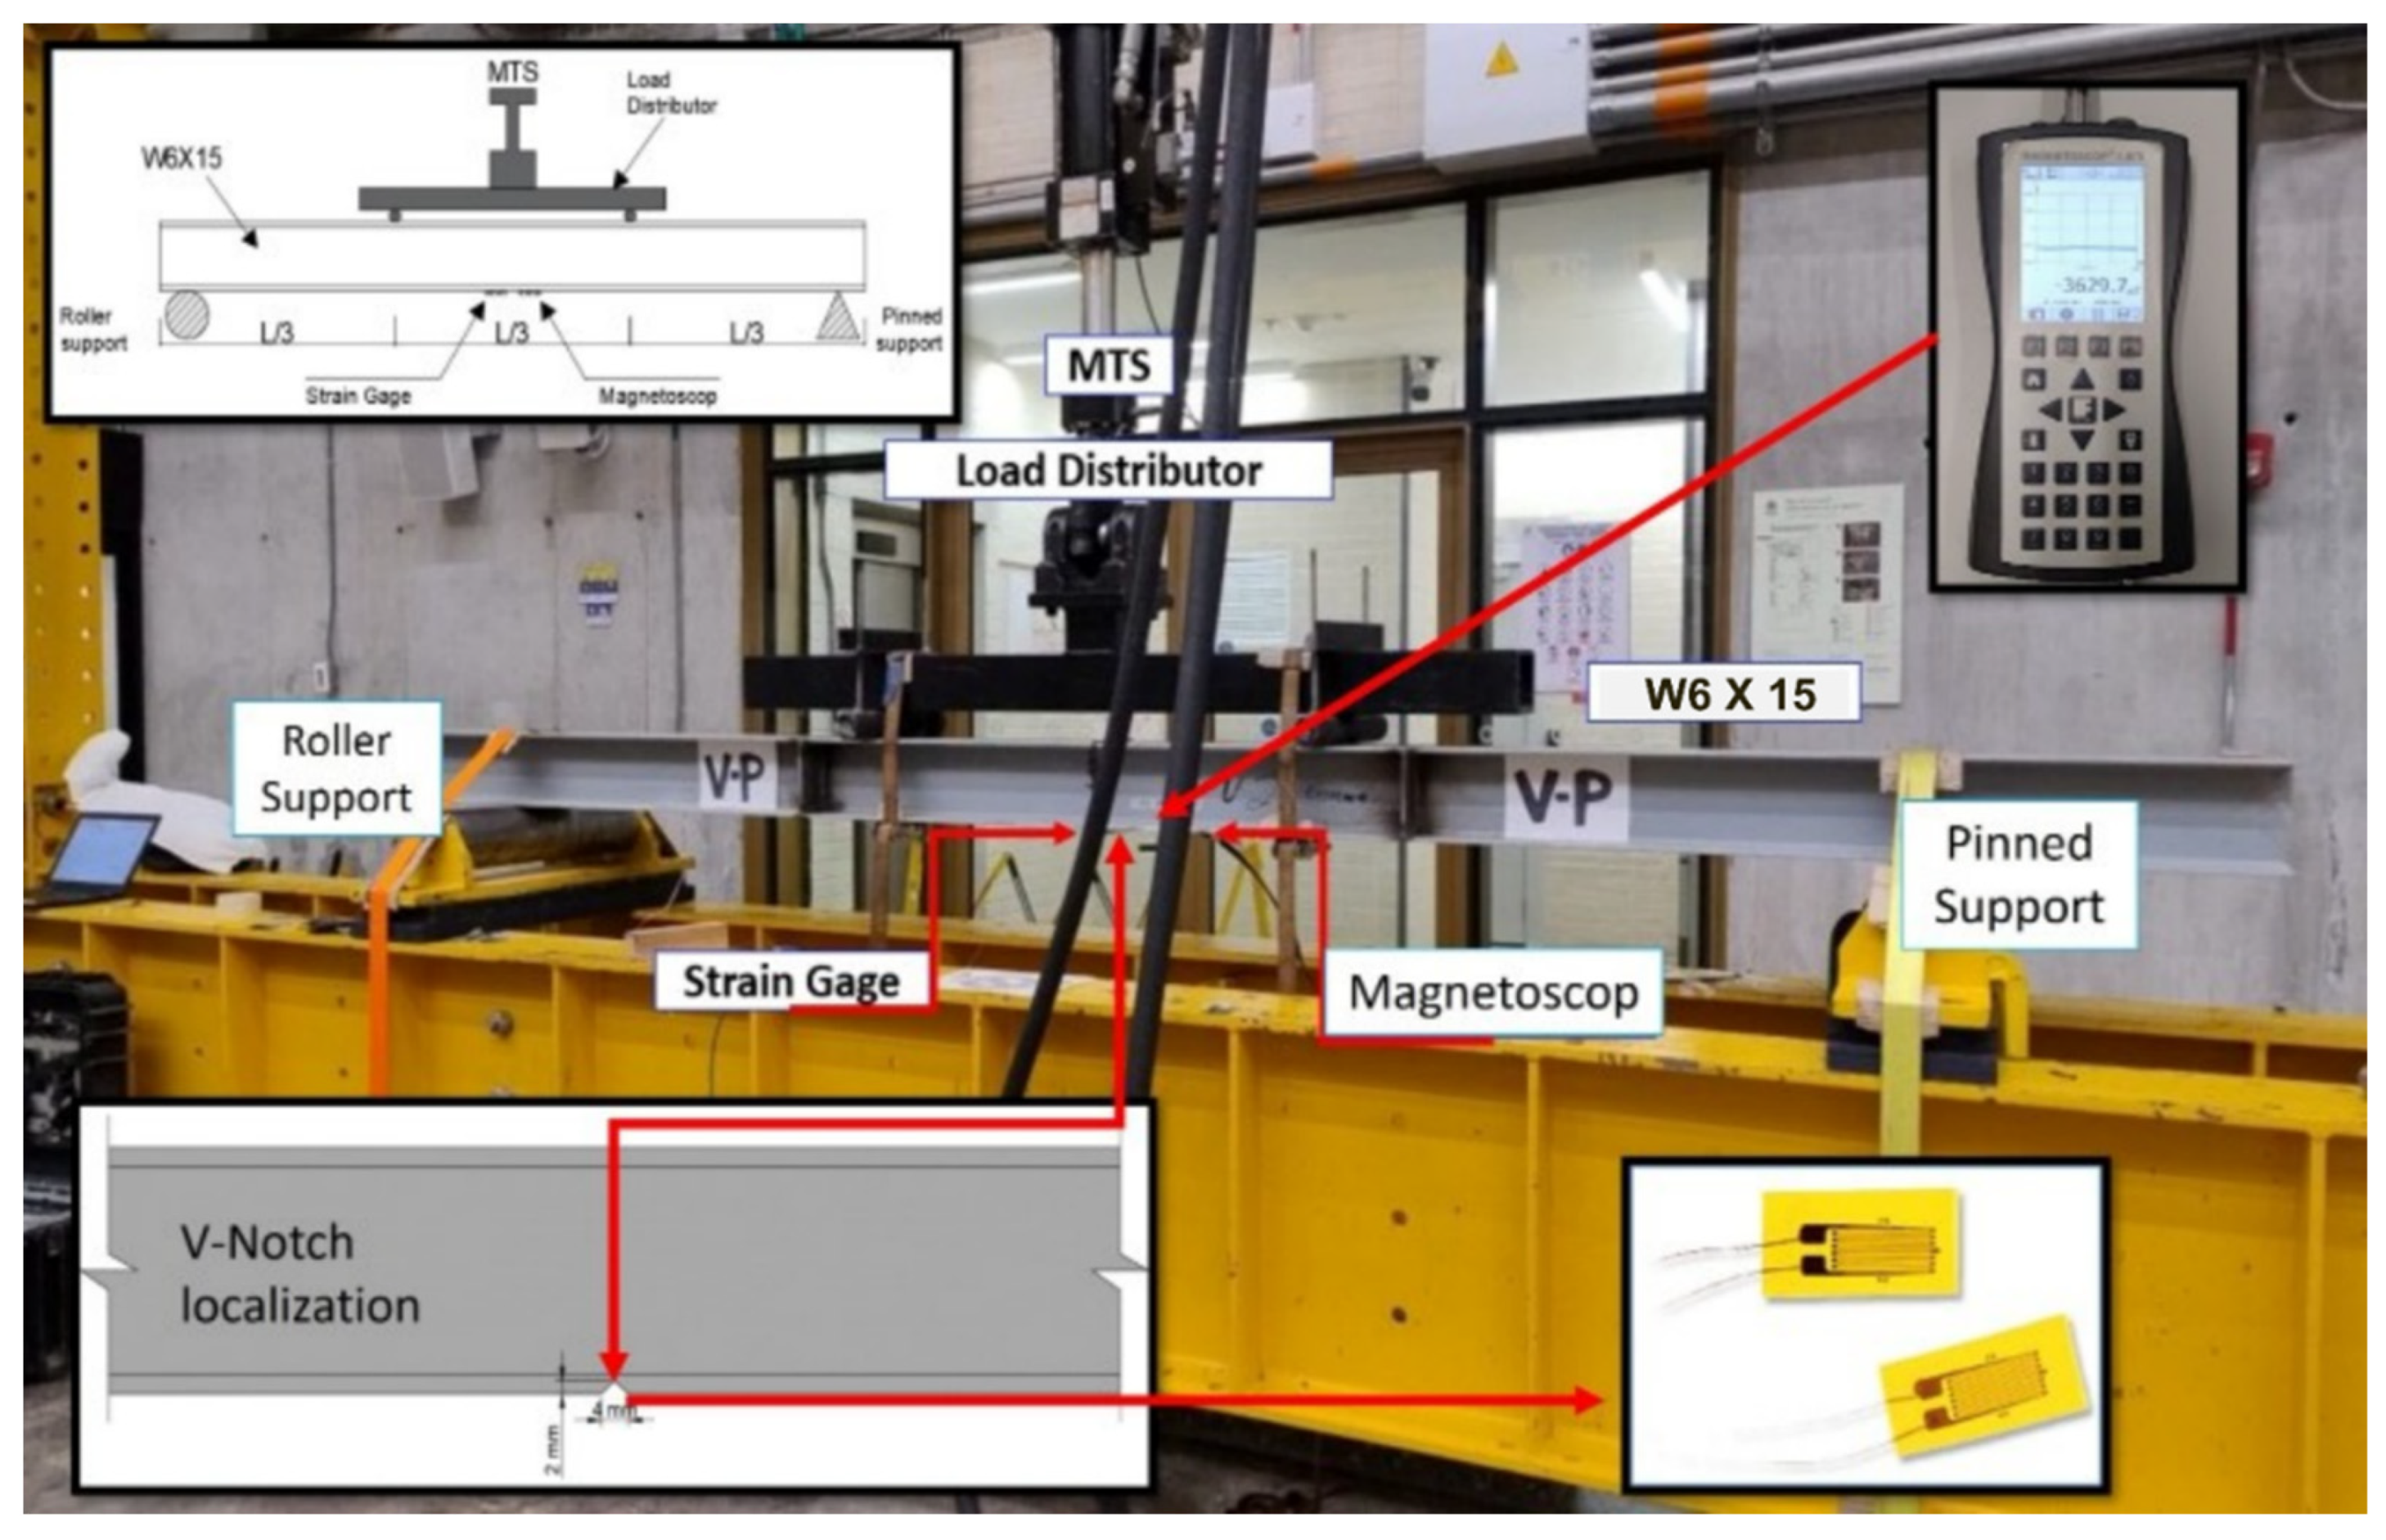
Six simply supported W6×15 steel beams made of ASTM A572 Grade 50 steel and measuring 4 m in length were tested under a four-point cyclic bending configuration. In
Figure 1, the theoretical approach to determining the exact moment expression at the midspan is given, while
Table 1 summarizes the chemical composition of the base metal, which complies with the Grade 50 requirements specified by [
32], particularly regarding the maximum allowable phosphorus and sulfur content. The load level in terms of applied bending moment for this structural member was determined to be 70% of the plastic capacity, as follows (Mp = 61 kN-m):
where
Ma = acting moment (representing 70% of Fy);
Fy = yield strength, i.e., 344.74 MPa—(50 ksi);
Zx = the plastic modulus for the highest moment of inertia, 176,980 mm3—(10.8 in3).
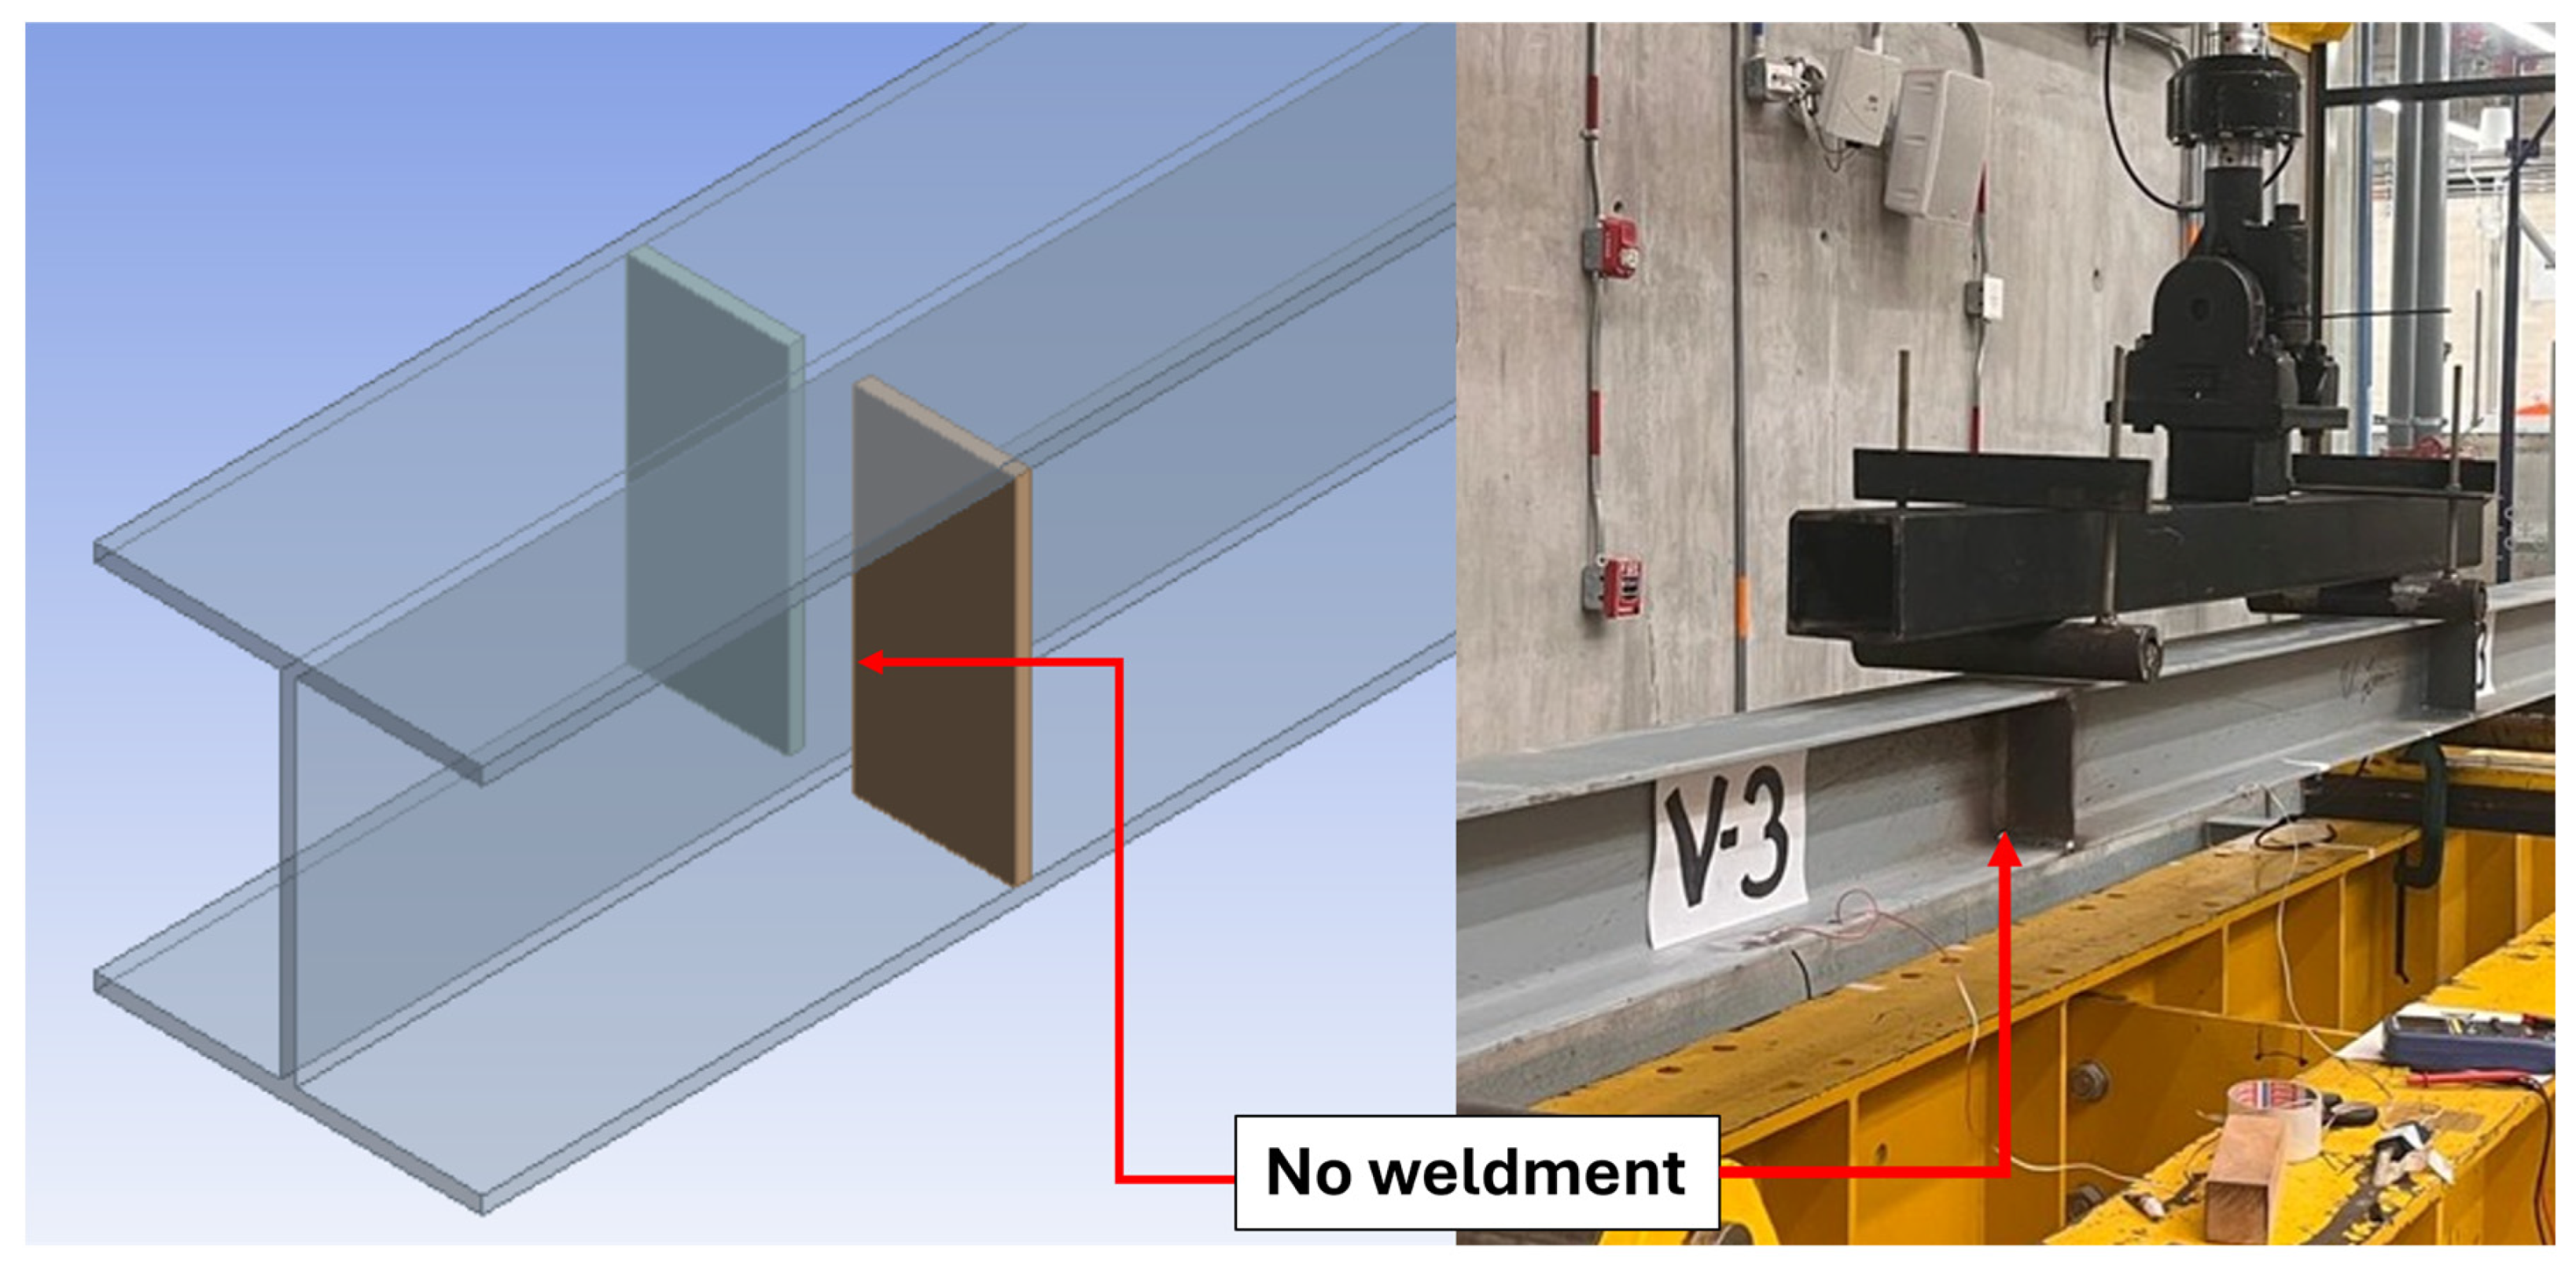
Three limit states were accounted for, as W6×15 is a non-compact-flange structural shape: (i) flange compression buckling, which, for the non-compact flange in the present case, represents only a reduction of 5.87% of the full plastic capacity, meaning there is no problem regarding the desired applied moment; (ii) web slenderness, which, in the present case, presents a compact web theoretically allowing a full plastic bending moment; and (iii) an unsupported length, which is 4 m (157.8 in) between supports, controlled on the compression flanges by means of slings tensed at the thirds of the center span connected to the load-applying device. These slings help avoid local lateral torsional buckling (LTB). However, considering that the slings might not be able to control LTB, the bending moment capacity was determined to be governed by the unsupported length, representing an available nominal moment capacity of 44.98 kN-m, enough to let the experimental loads be applied for the scope of the present research. Also, two pairs of flange stiffeners were welded to the lower face of the higher flange and to the higher face of the lower flange (no web shear was triggered, as shown in
Figure 2) to improve any unaccounted-for local buckling that might still take place near the load distributor (see
Figure 3).
Based on the parameters described above, the applied load followed a sinusoidal waveform at a frequency of 4 Hz (four cycles per second) to avoid an undesired rise in temperature near the introduced damage at midspan. The maximum load
P was determined from the static equilibrium equation for the applied bending configuration, as expressed below:
A servo-hydraulic MTS actuator (Eden Prairie, MN, USA) with a maximum load capacity of 250 kN was used to apply the dynamic bending loads, following the fatigue protocol illustrated in
Figure 2. An extra 20 in. of overhanging length was intentionally left on either side of the beam to avoid slippage and to include an adequate setting distance for dynamic loads, accounting for this extra length in a 0.051% stress modification, accepted as negligible for the present research.
Five of these steel beams were initially affected by introducing a mid-span notch with a geometry similar to that of a Charpy V-notch test simulating an initial state of damage (cracking formation and advance) detectable by visual inspection [
21]. The remaining beam was left intact to allow it to serve as a reference specimen. In addition, ¼-inch (6.35 mm) thick stiffeners were welded at the third points along the span to reinforce the compression flange and web, thereby preventing local buckling and web crippling under the localized application of load.
A 1070 Magnetoscop FOERSTER fluxgate sensor (Reutlingen, Germany) was used to accurately measure the surface magnetic flux emitted from the lower flange in the vicinity of the induced V-notch damage (without touching the surface of the lower flange). Magnetic data were recorded at a sampling rate of 2 kHz within a measurement range of 0.1 nT to 50 mT, allowing for the detection of subtle variations in the magnetic signal. This sensitivity enables the non-destructive evaluation of potential defects such as crack initiation, crack propagation, and residual stress changes.
Data acquisition began 30 s prior to the start of each test and continued until complete separation of the specimen. Variations in surface magnetic flux were converted into electrical signals and subsequently processed to enable a time-based analysis of damage evolution from the initial defect onward [
33].
In this study, a sinusoidal load was applied at every third point along the 4 m span (of the steel beam) to further the induced damage in the notched lower flange. Each steel beam was simply supported, and to control lateral displacements (lateral torsional buckling—LTB), safety slings were used to provide lateral restraint. A load distributor was positioned on top of the upper flange, as illustrated in
Figure 3.
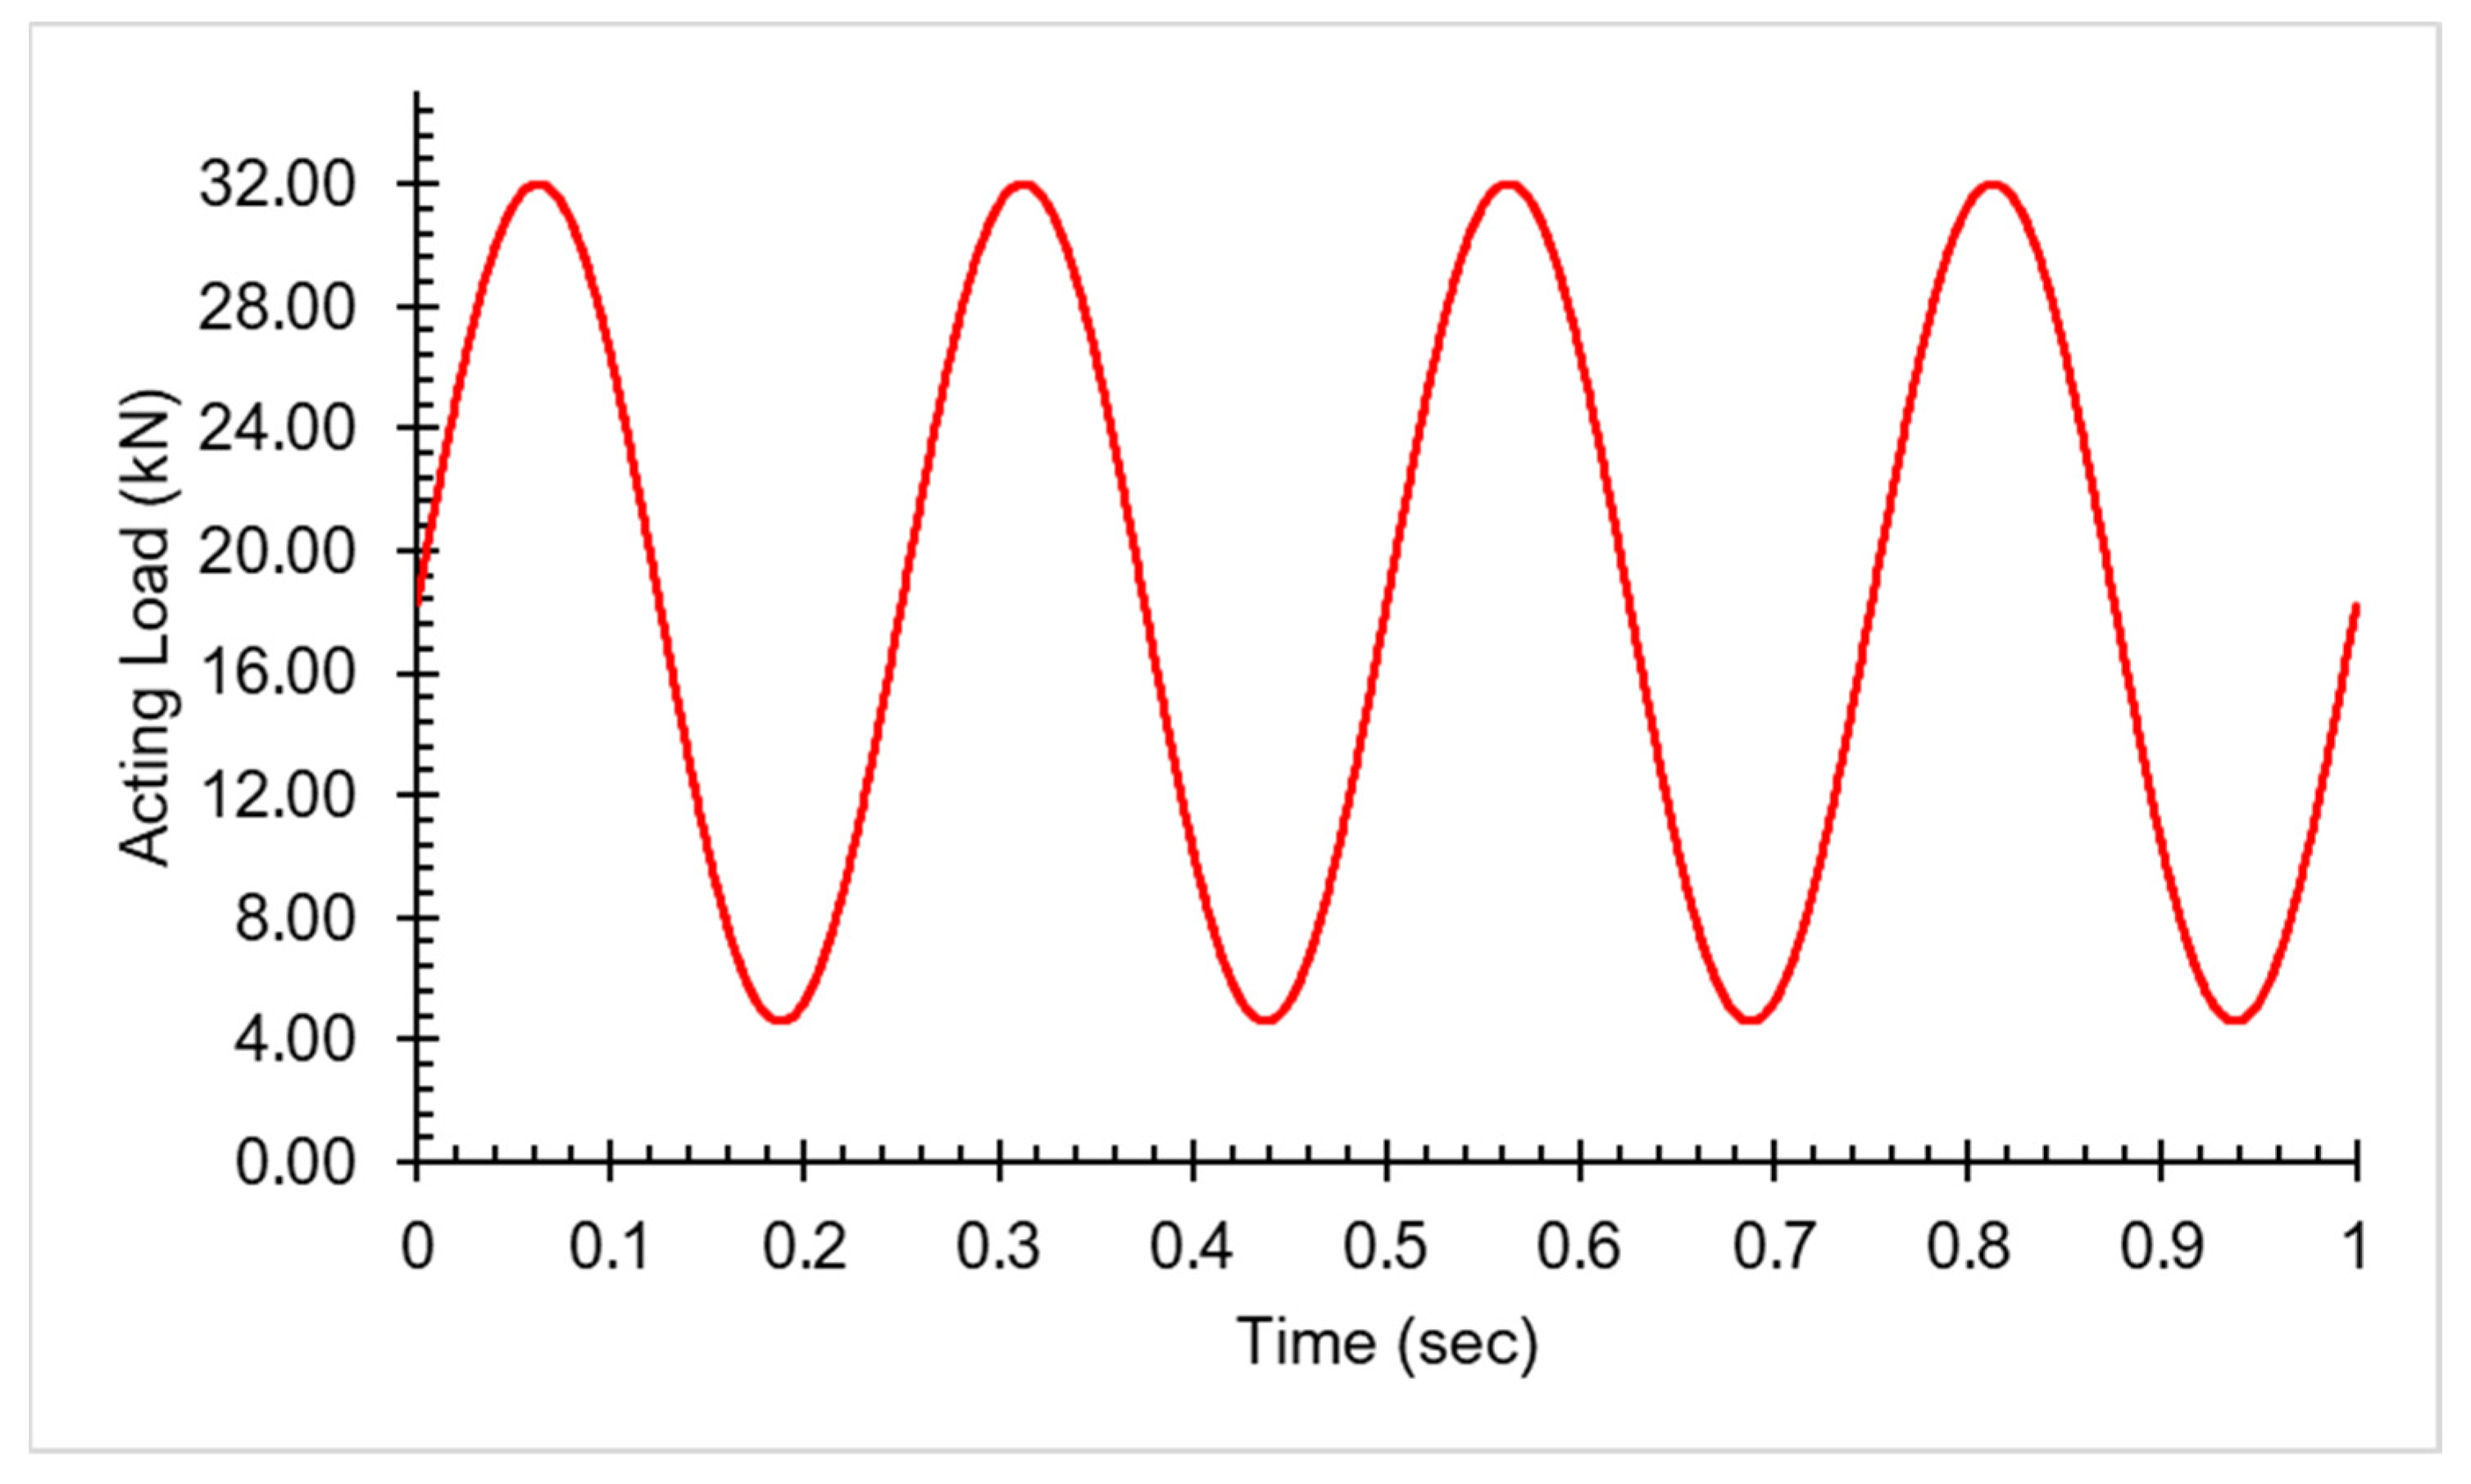
The loading protocol was designed to maintain applied stresses within the elastic range and below the nominal capacity of the section (plastic moment). Two concentrated loads of 32 kN were applied in a sinusoidal pattern (
Figure 4), corresponding to approximately 70% of the yield stress in the tensile fibers of the lower flange. Under this loading condition, the measured midspan displacement was approximately 15 mm. The minimum load level consisted of two concentrated loads of 4.6 kN, equivalent to 10% of Fy, resulting in a midspan deflection of about 2 mm. Thus, the acting load followed a fatigue stress ratio of R = (10% Fy/0.70% Fy) = 0.1428.
Based on these parameters, the actuator was programmed to apply the cyclic load at a frequency of 4 Hz. One strain gage located near the tension flange (of each beam under study) was set with an acquisition or sampling frequency of 24 Hz. This sampling rate, being six times higher than the loading frequency, provided the resolution necessary to accurately capture the maximum and minimum strain peaks in each cycle.
The test was automatically stopped when any of the following conditions were met:
- (i)
The applied load at the upper limit dropped below 20 kN (capacity-loss criterion);
- (ii)
The applied load reached 80 kN at any point during the test (restraint or maximum-load criterion);
- (iii)
The midspan deflection exceeded 20 mm (maximum-deflection criterion);
- (iv)
More than 500,000 cycles were completed without failure, in which case the specimen was considered to have reached an infinite-life stage.
When failure occurred, the specimen was loaded until complete separation was reached to expose a clean fracture surface. This surface was subsequently examined under an optical microscope to identify regions of interest for detailed fractographic analysis using scanning electron microscopy (SEM) of the cracked zone.
Because it is impossible to eliminate the influence of the Earth’s magnetic field near the steel specimen [
34], precautions were taken to minimize interference from other external magnetic sources. A 1 m radius exclusion zone was established around the setup, within which magnetic devices such as cell phones, smartwatches, and computers were prohibited. Magnetic field readings were also collected 30 s prior to the start of each test to establish a baseline “environmental noise” level, which was used as the magnetic zero reference. The pure bending fatigue test was then initiated following the previously defined loading protocol. One final element of control was that no test was done or authorized to start if there was a possibility of an electric storm or if, at the moment of the test, there was an electric storm going on. This condition was established to avoid electromagnetic noise that was not accounted for from the beginning.
3. Results
The six fatigue tests lasted between 35 and 210 min, with one specimen (the unnotched steel beam) not reaching failure. Throughout the tests, the following variables were recorded as functions of time: (i) applied load (kN), (ii) midspan deflection (mm), and (iii) surface magnetic flux (nT).
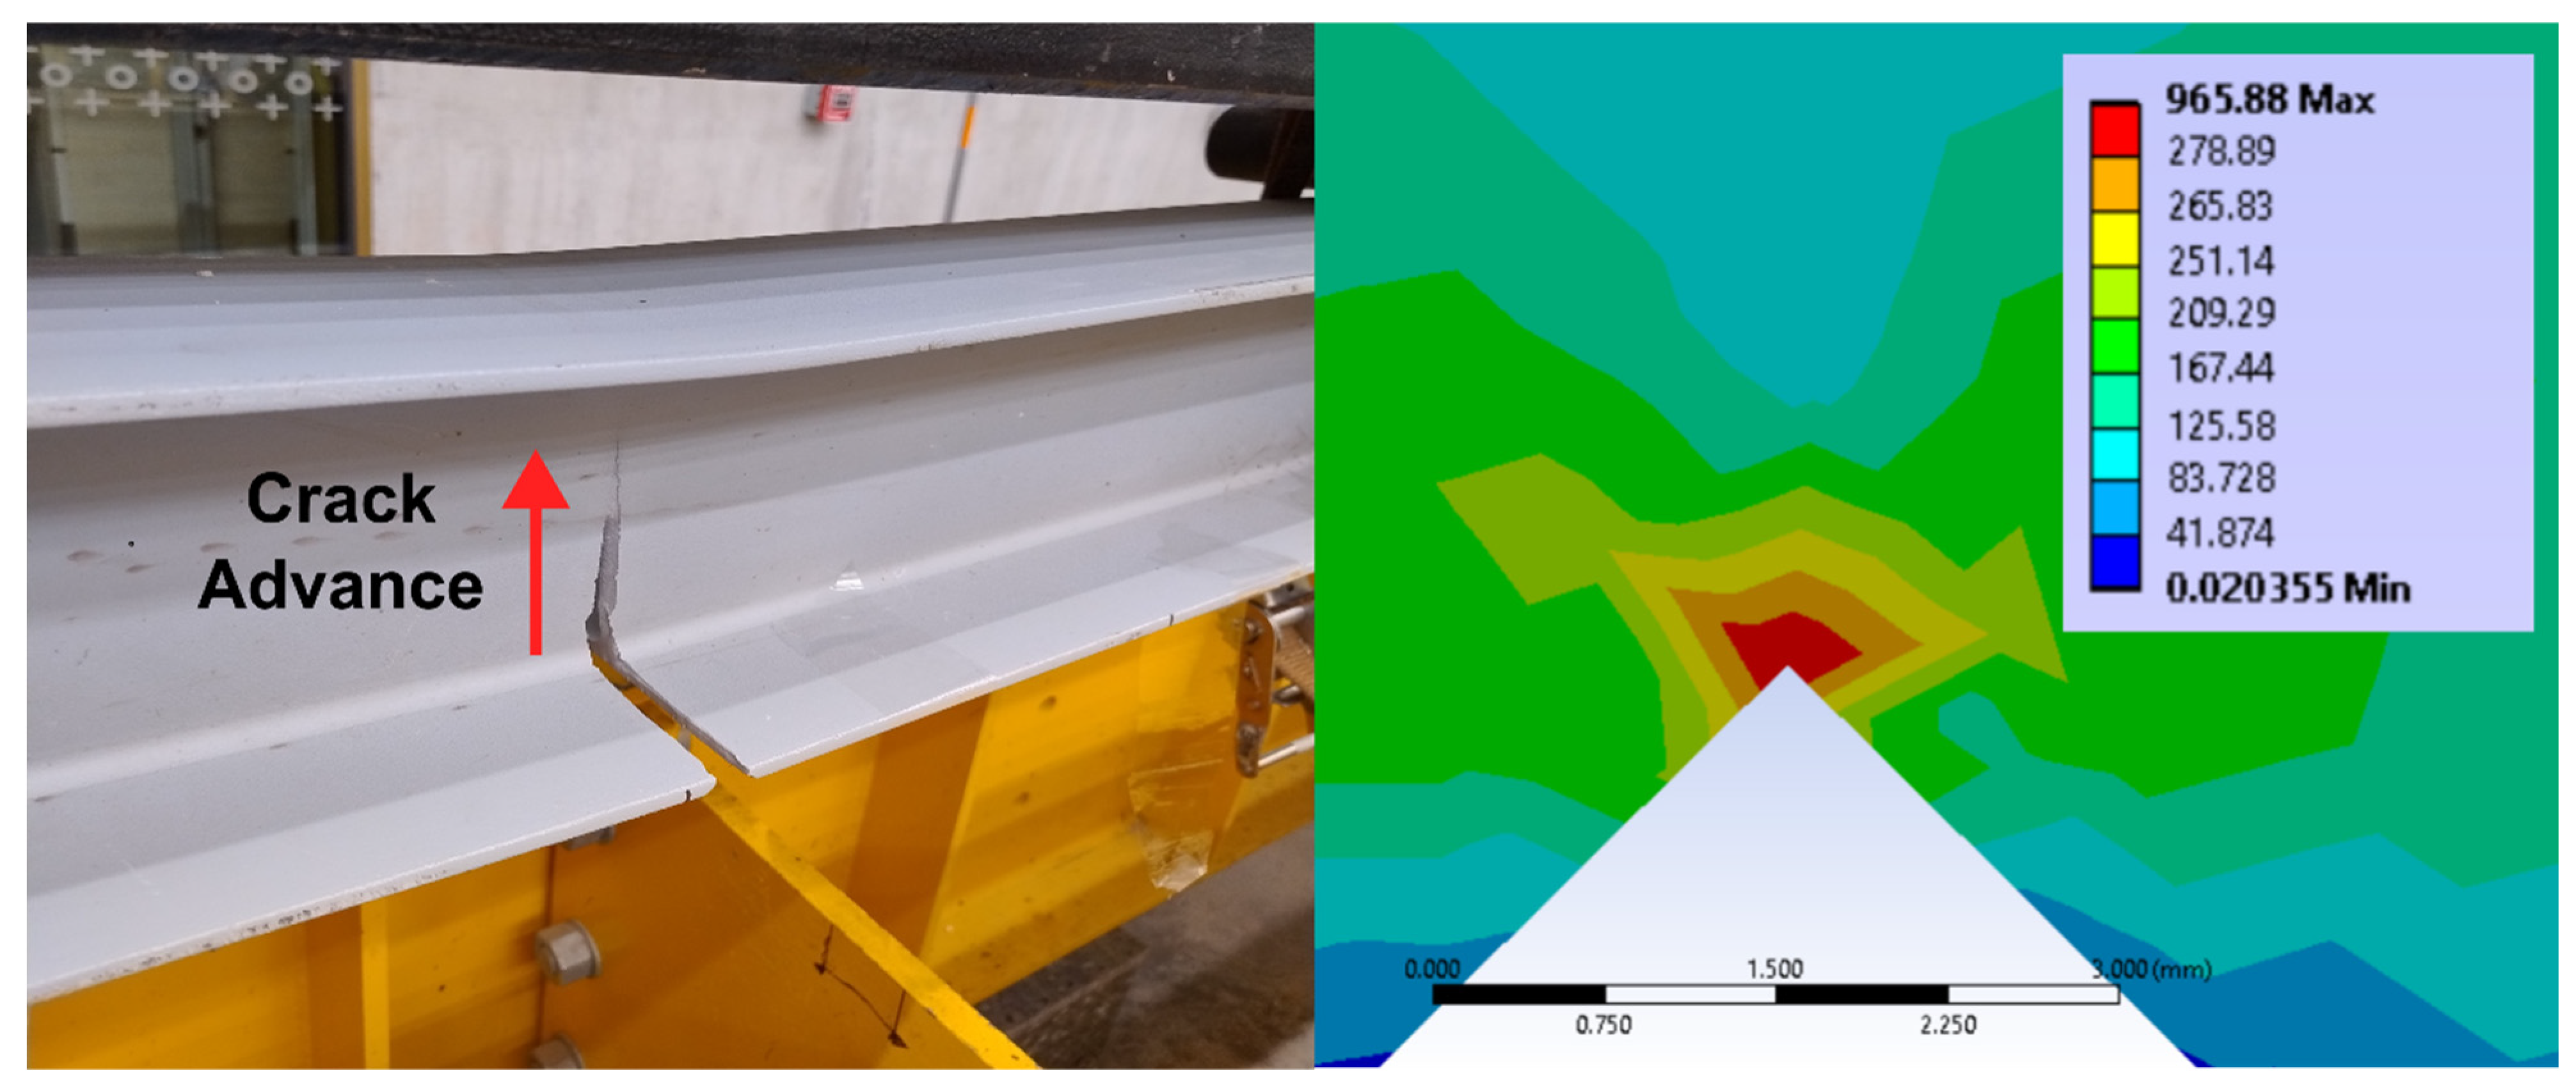
Specimen V-4 posed difficulties in magnetic field data acquisition during the final hour of testing. Nevertheless, the available data were analyzed in the same manner as for the other five specimens. All beams with induced damage reached fatigue failure (as numerically expected) through the furtherance of the induced damage in the tension flange at the tip of the V-Notch (see
Figure 5), whereas the control beam (V-P) exceeded 500,000 cycles, indicating that it had achieved an assumed infinite-life condition. Consequently, the control-beam test was stopped afterwards (see
Table 2).
Midspan deflections of the tested steel beams were recorded directly from the MTS crosshead sensor, providing insight into the elastic structural response under cyclic loading. The data served as the reference for comparison with the corresponding surface magnetic field measurements over time. Deflections remained stable and controlled throughout each test. Even though the displacement was recorded, the test was done under load control conditions to keep the bending moment lower than or at the 0.7 × Fy × Zxx of the cross section under study. The maximum and minimum deflections recorded for each specimen are summarized in
Table 3.
The strain response followed the applied sinusoidal loading pattern throughout the test. Monitoring the strain provided direct insight into the mechanical behavior of each steel specimen, serving as a reference for comparing the coupling between the mechanical and magnetic responses as the test progressed across multiple sampling intervals. Although strain was not the primary variable of interest in this study, it was recorded using OMEGA strain gauges. Measurements were taken over 10 s windows at various stages during each test.
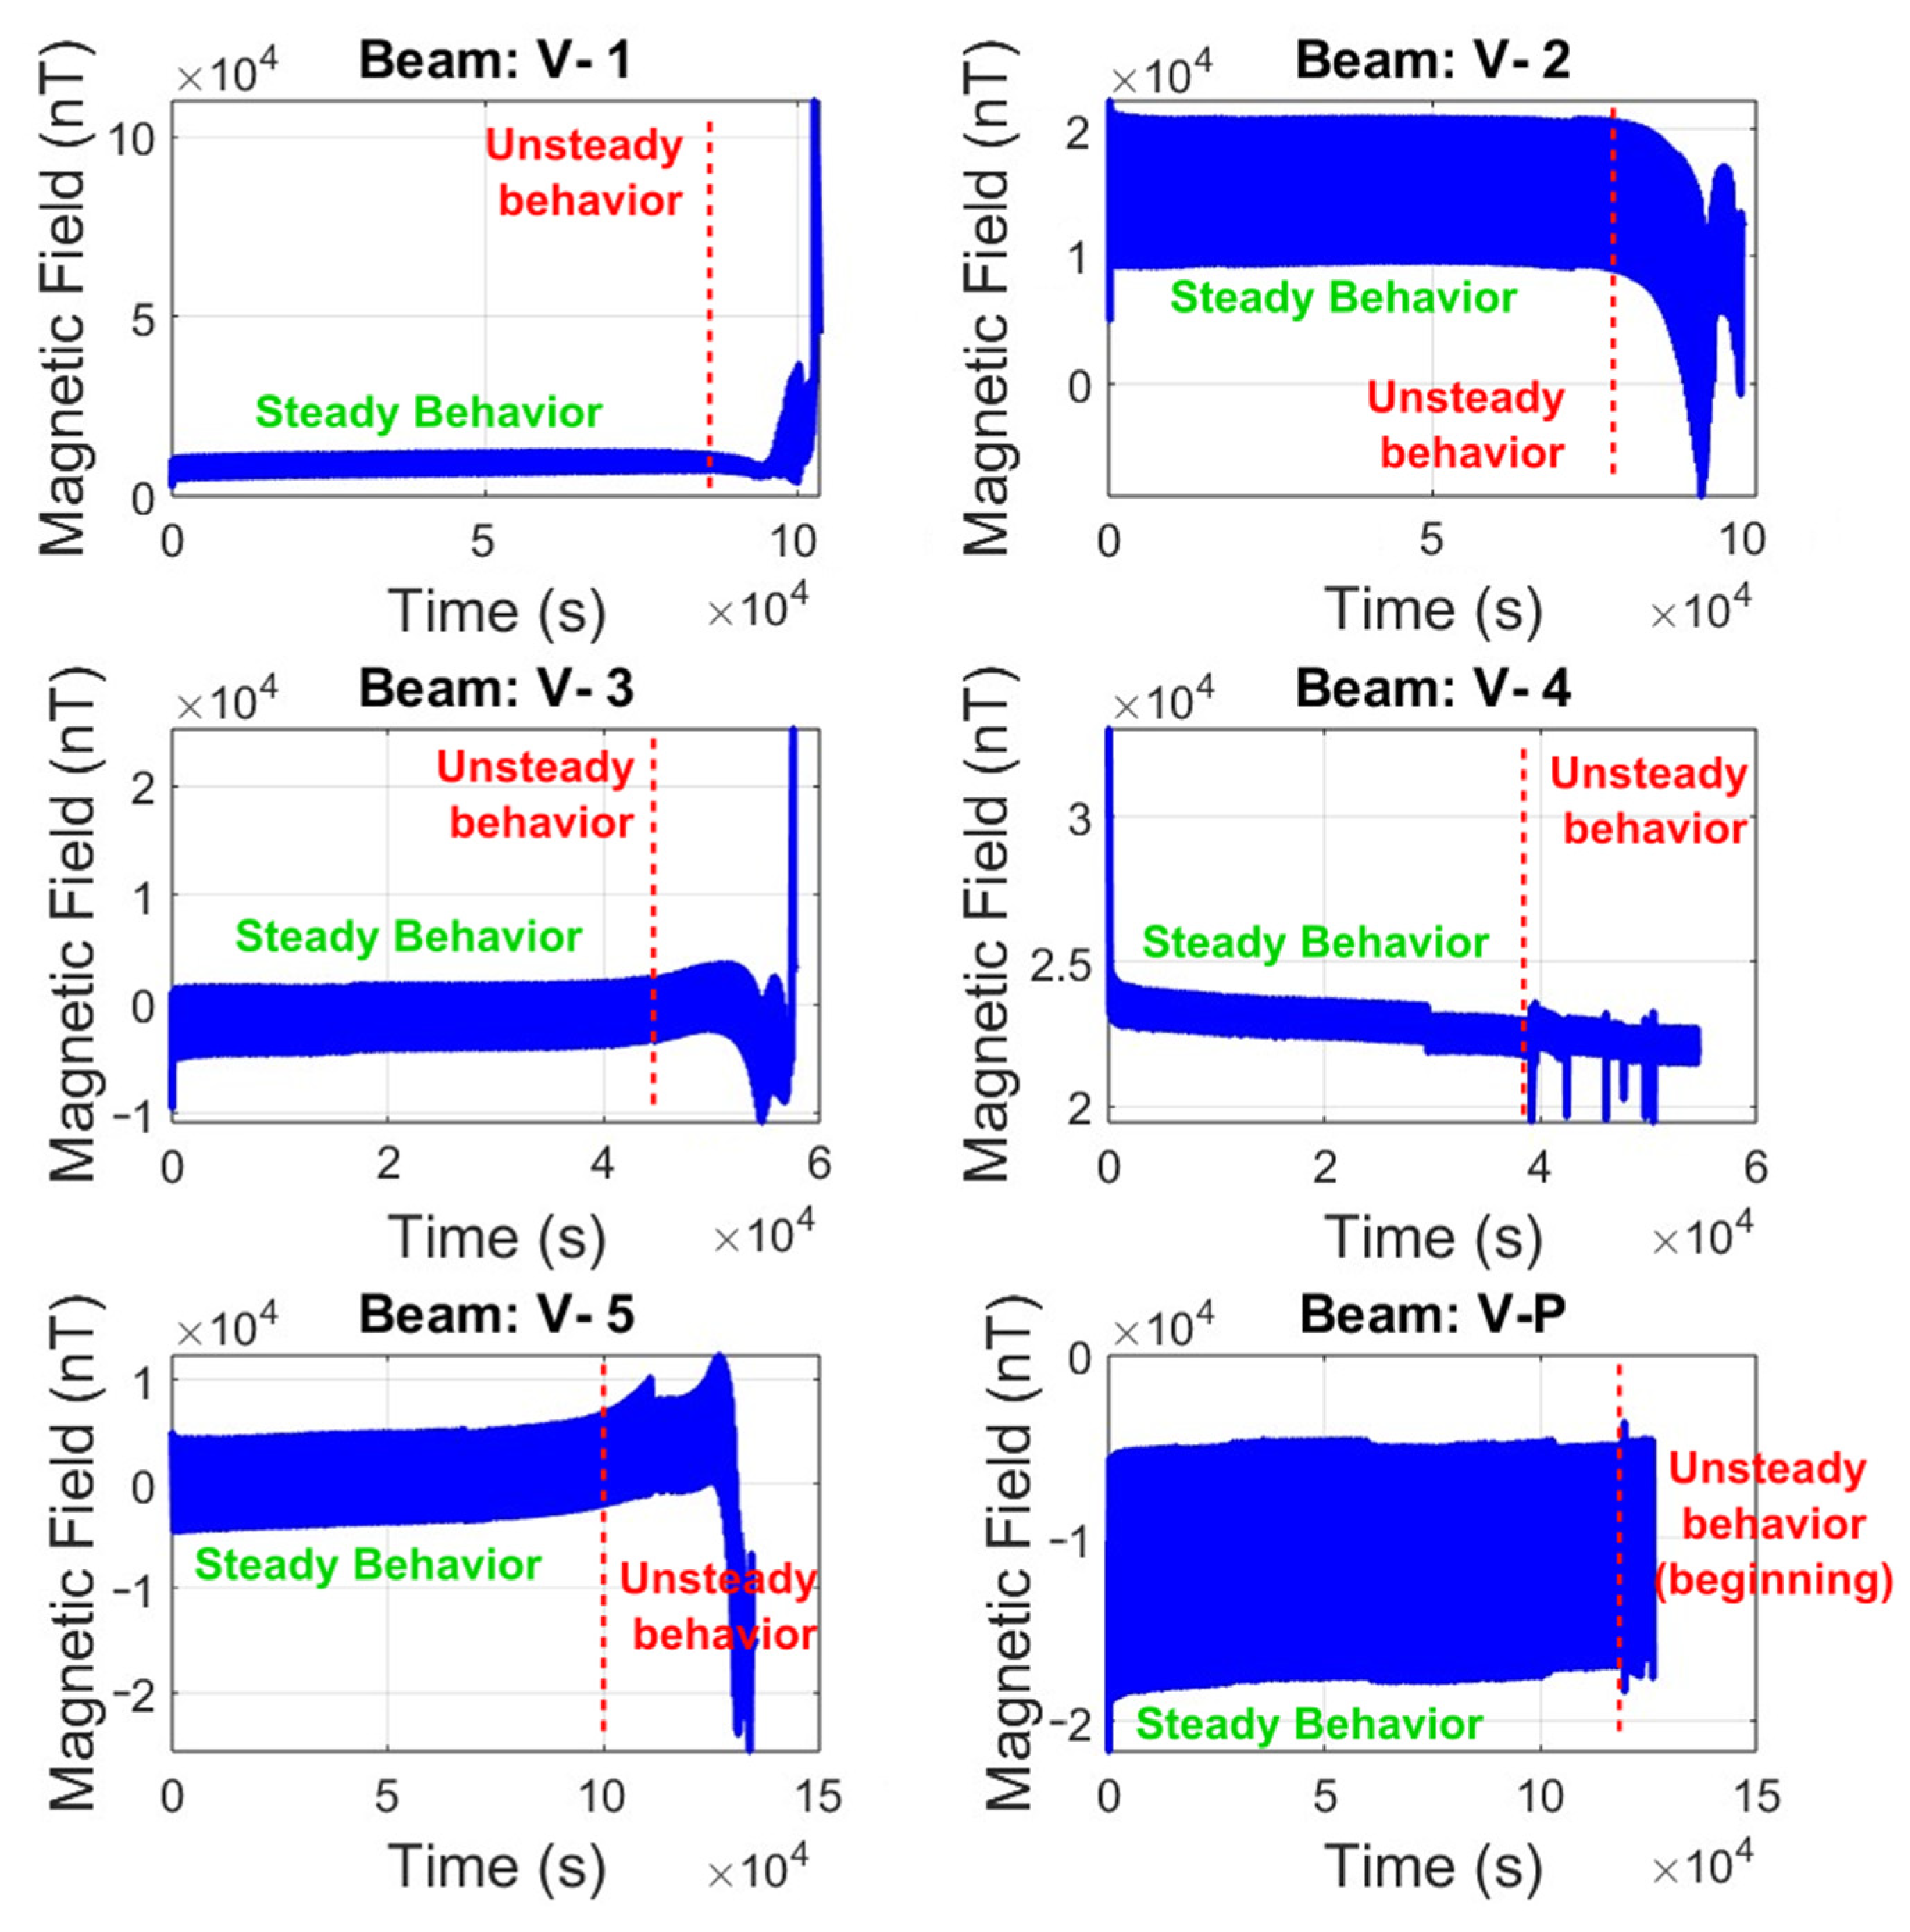
Figure 5 illustrates the magnetic flux response of each beam over the entire test. The data show that steel emits a measurable magnetic signal within a defined range (maximum–minimum surface magnetic flux), forming a curve whose thickness represents this variation. The magnetic response also exhibits a sinusoidal pattern that closely follows the applied cyclic loading.
Distinct differential stages—visible as peaks, jumps, or abrupt shifts—appeared throughout the test, corresponding to key phases of damage accumulation within the steel beam as fatigue progressed. These behaviors include gradual changes in the average flux range, sudden drops or fluctuations in magnetic intensity, and short-term magnetic signal excursions associated with crack initiation and propagation (see
Figure 6).
Figure 6 also highlights that the magnetic responses of the tested beams under bending stress differ from one another, indicating that the analysis must be conducted on a case-by-case basis. The key observation from these figures is that any variation in the baseline magnetic range—whether through a gradual change in slope or an abrupt fluctuation—reflects a mechanical alteration in the beam’s bending capacity as cracking propagates upward from the induced notch toward the compression flange.
Consistent with previous studies [
22,
35], this research introduces the parameter K
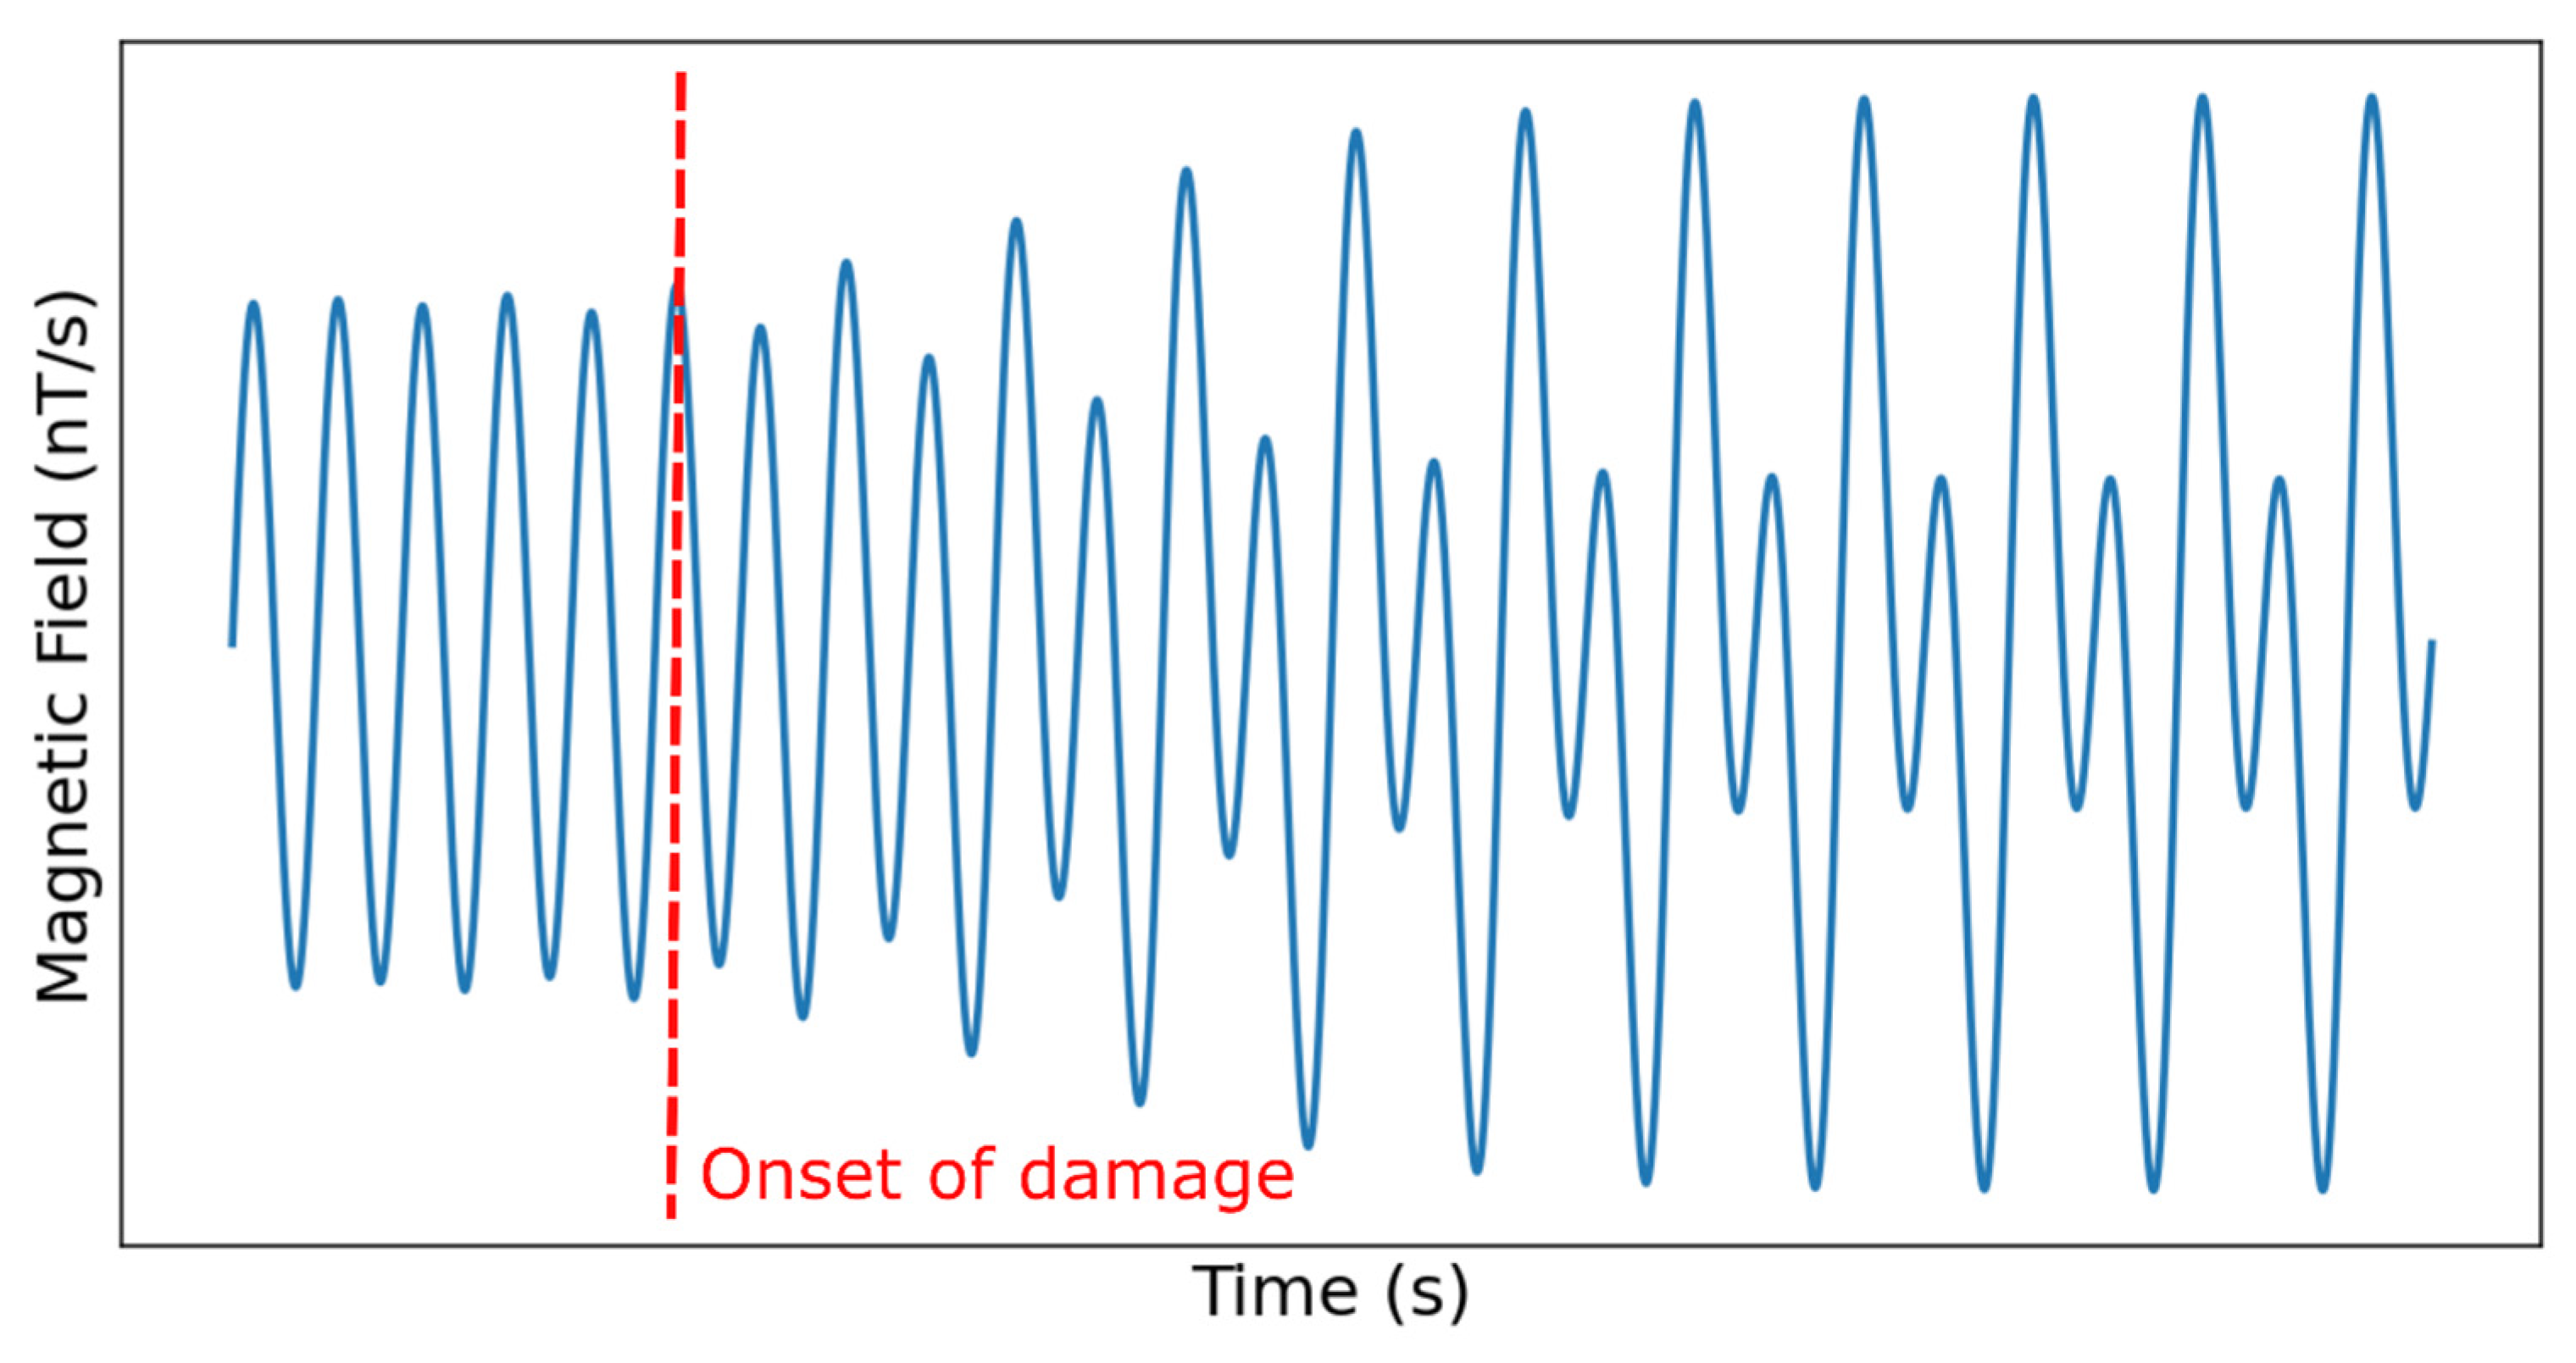
mag as an indicator of the onset of non-linear magnetic behavior. The point at which the magnetic range response deviates from its steady-state pattern is interpreted as a precursor of damage progression. Therefore, K
mag can serve as an estimator of the fraction of fatigue life at which the surface magnetic flux begins to indicate unsafe structural behavior (see
Table 4):
Considering the factors discussed above, all tests were conducted at the same geographical location (4°37′38.1″ N, 74°03′50.5″ W) and within the same week of the year to ensure environmental consistency. This approach minimized potential variations in the Earth’s magnetic field and ambient conditions that could otherwise influence local magnetic measurements. Nevertheless, despite these precautions, the reproducibility of the fatigue life results remained affected by intrinsic microstructural variability within the steel [
36], which was neither explicitly characterized nor controlled in the present study.
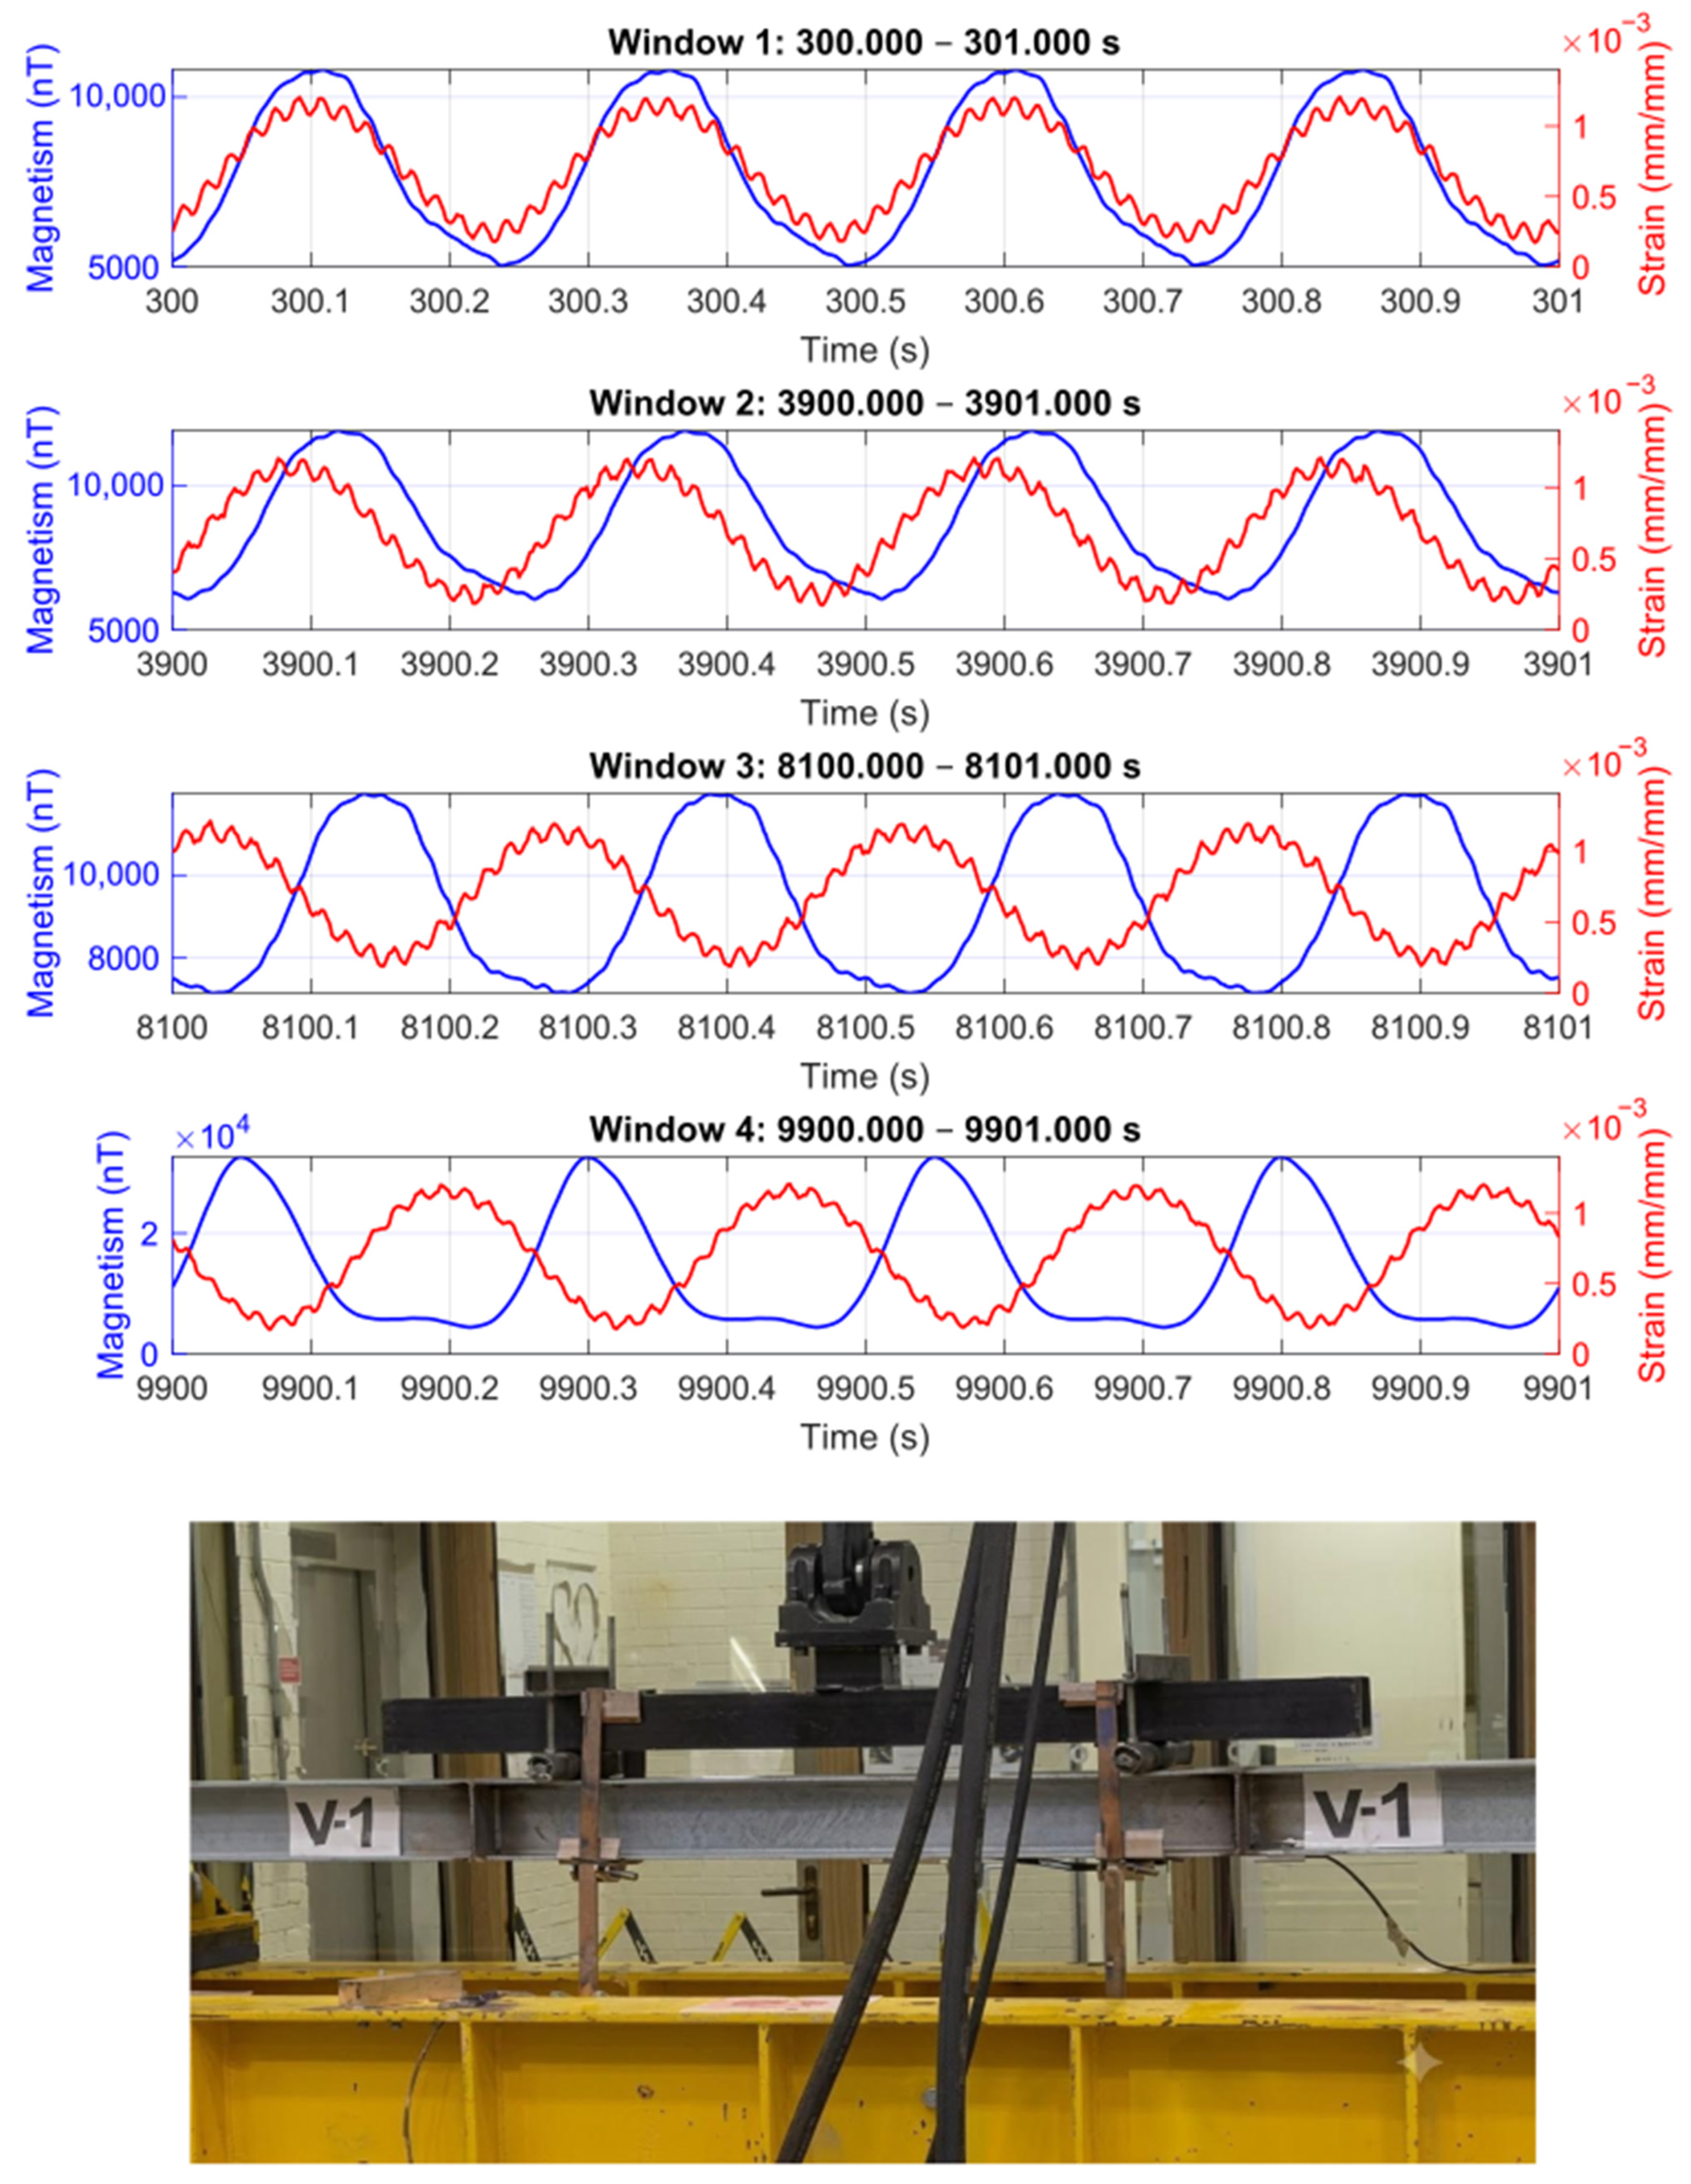
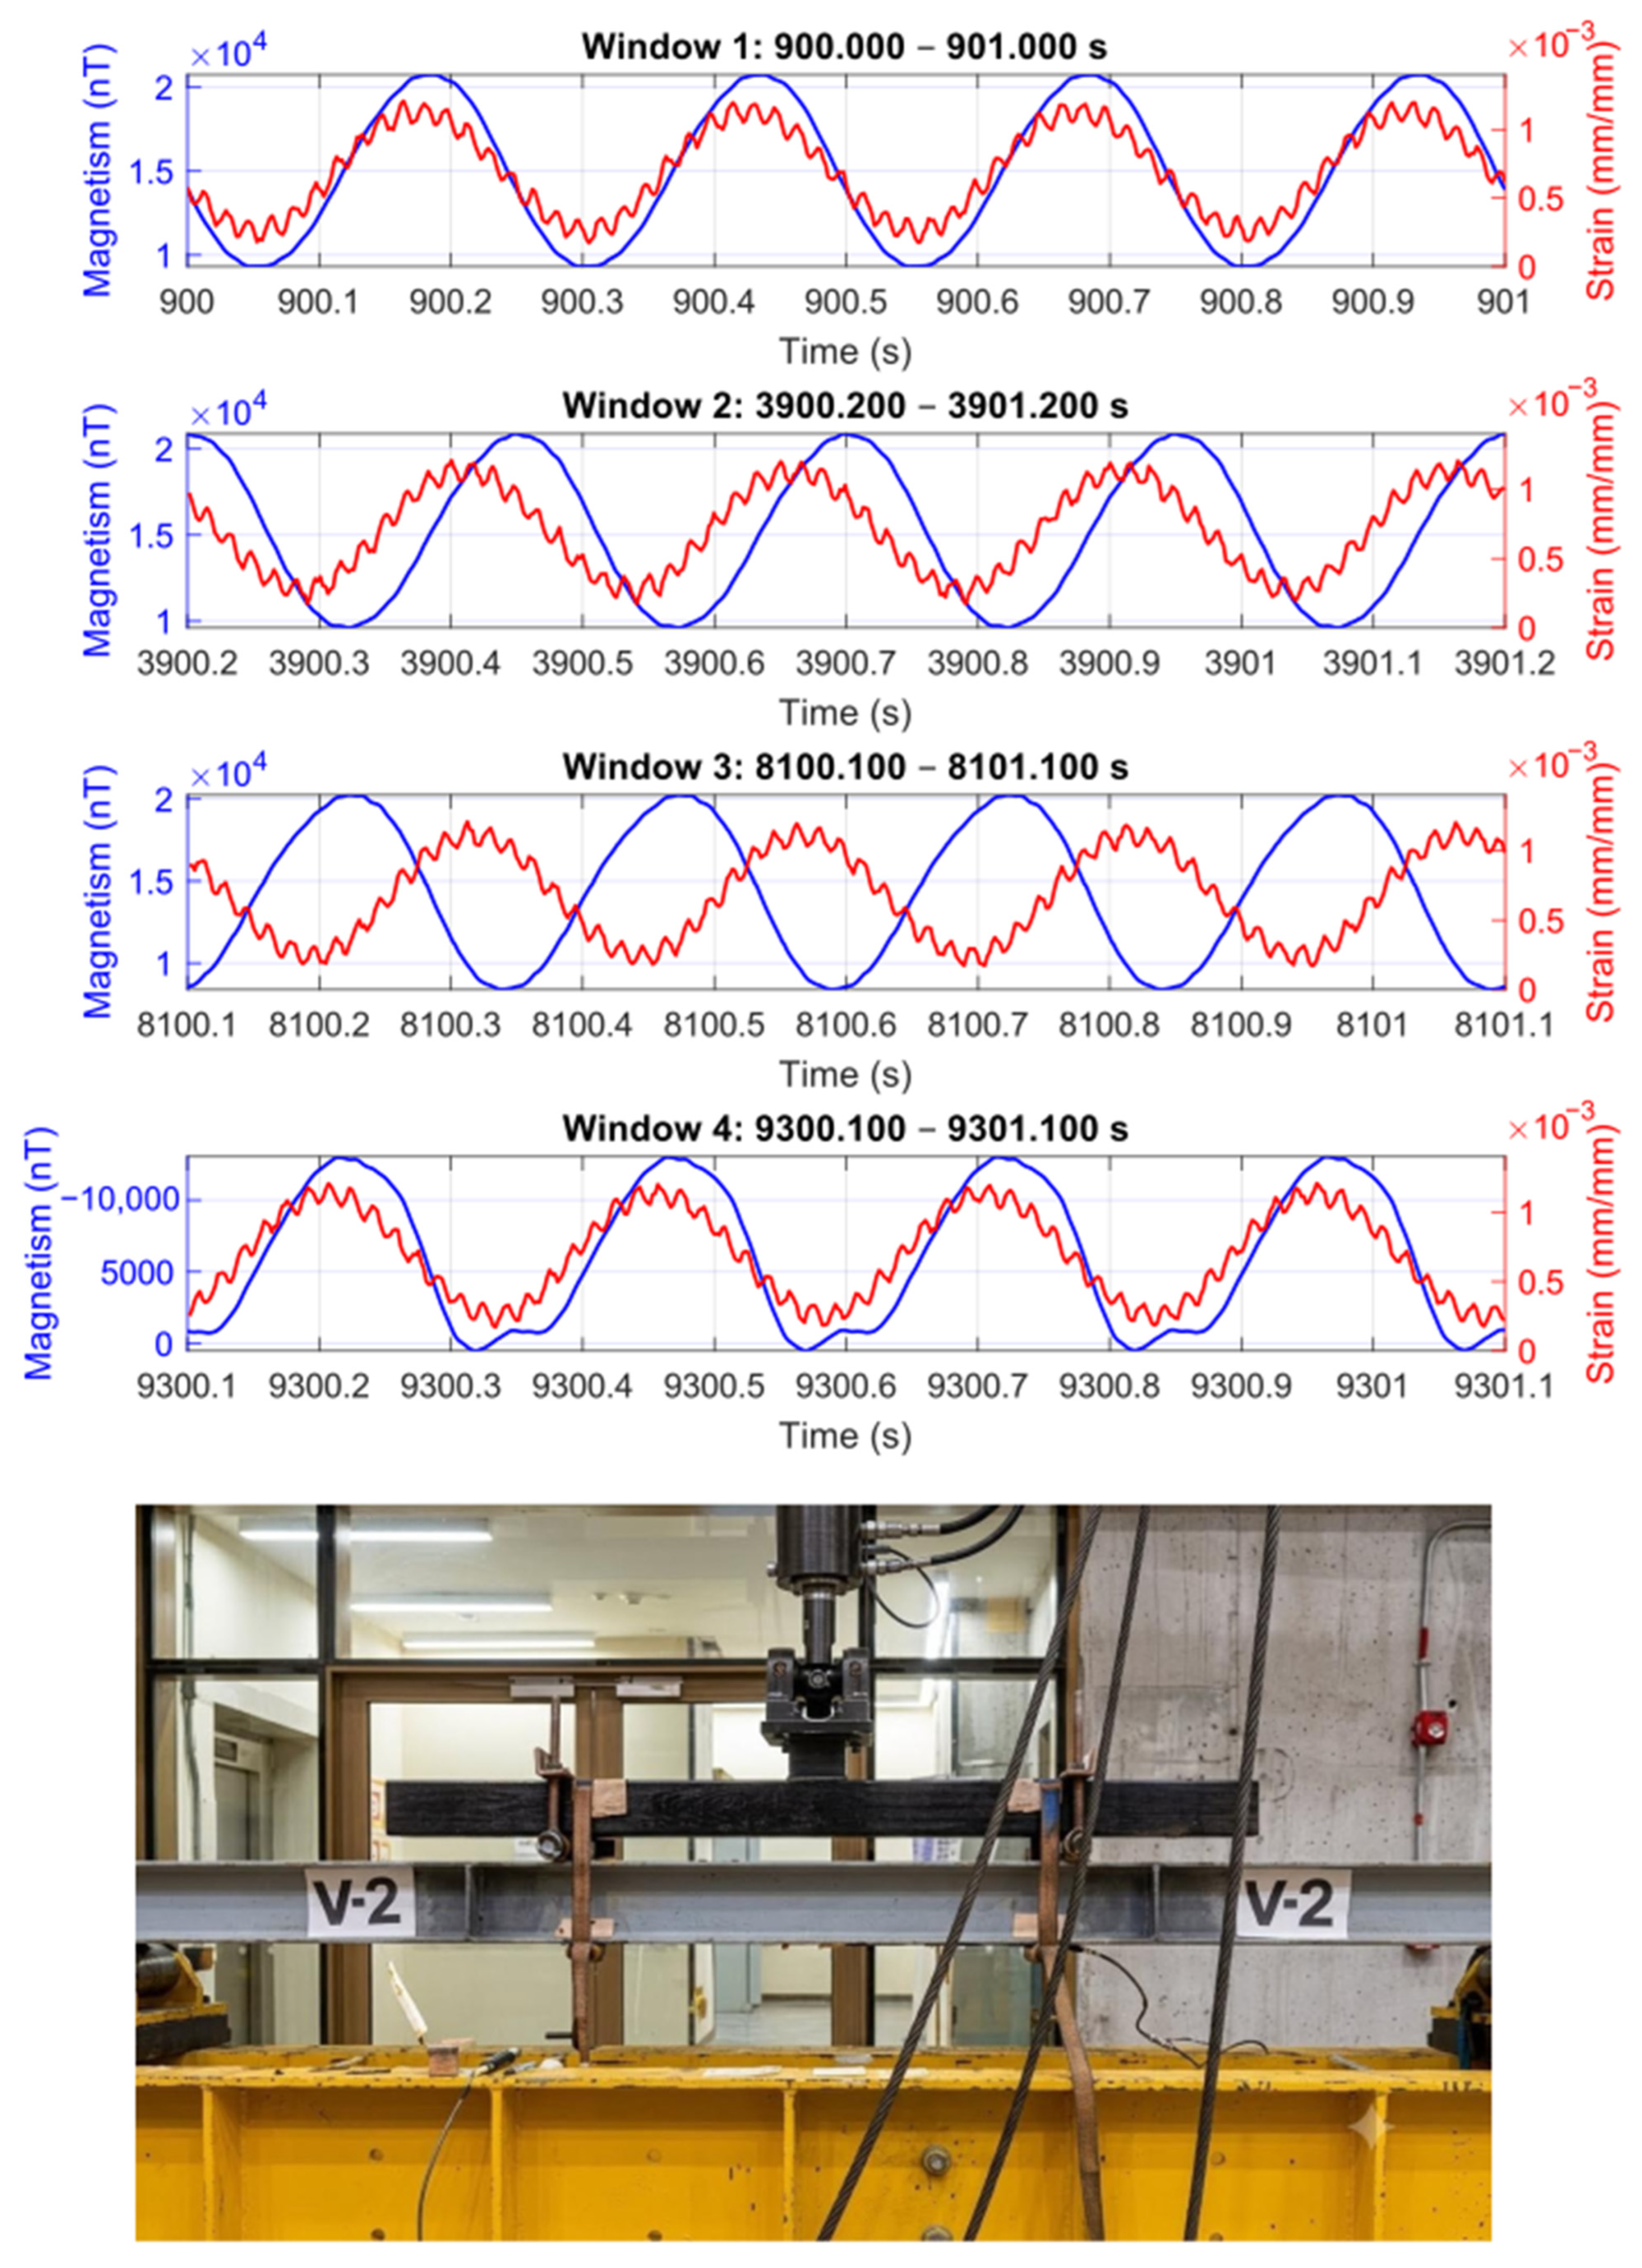
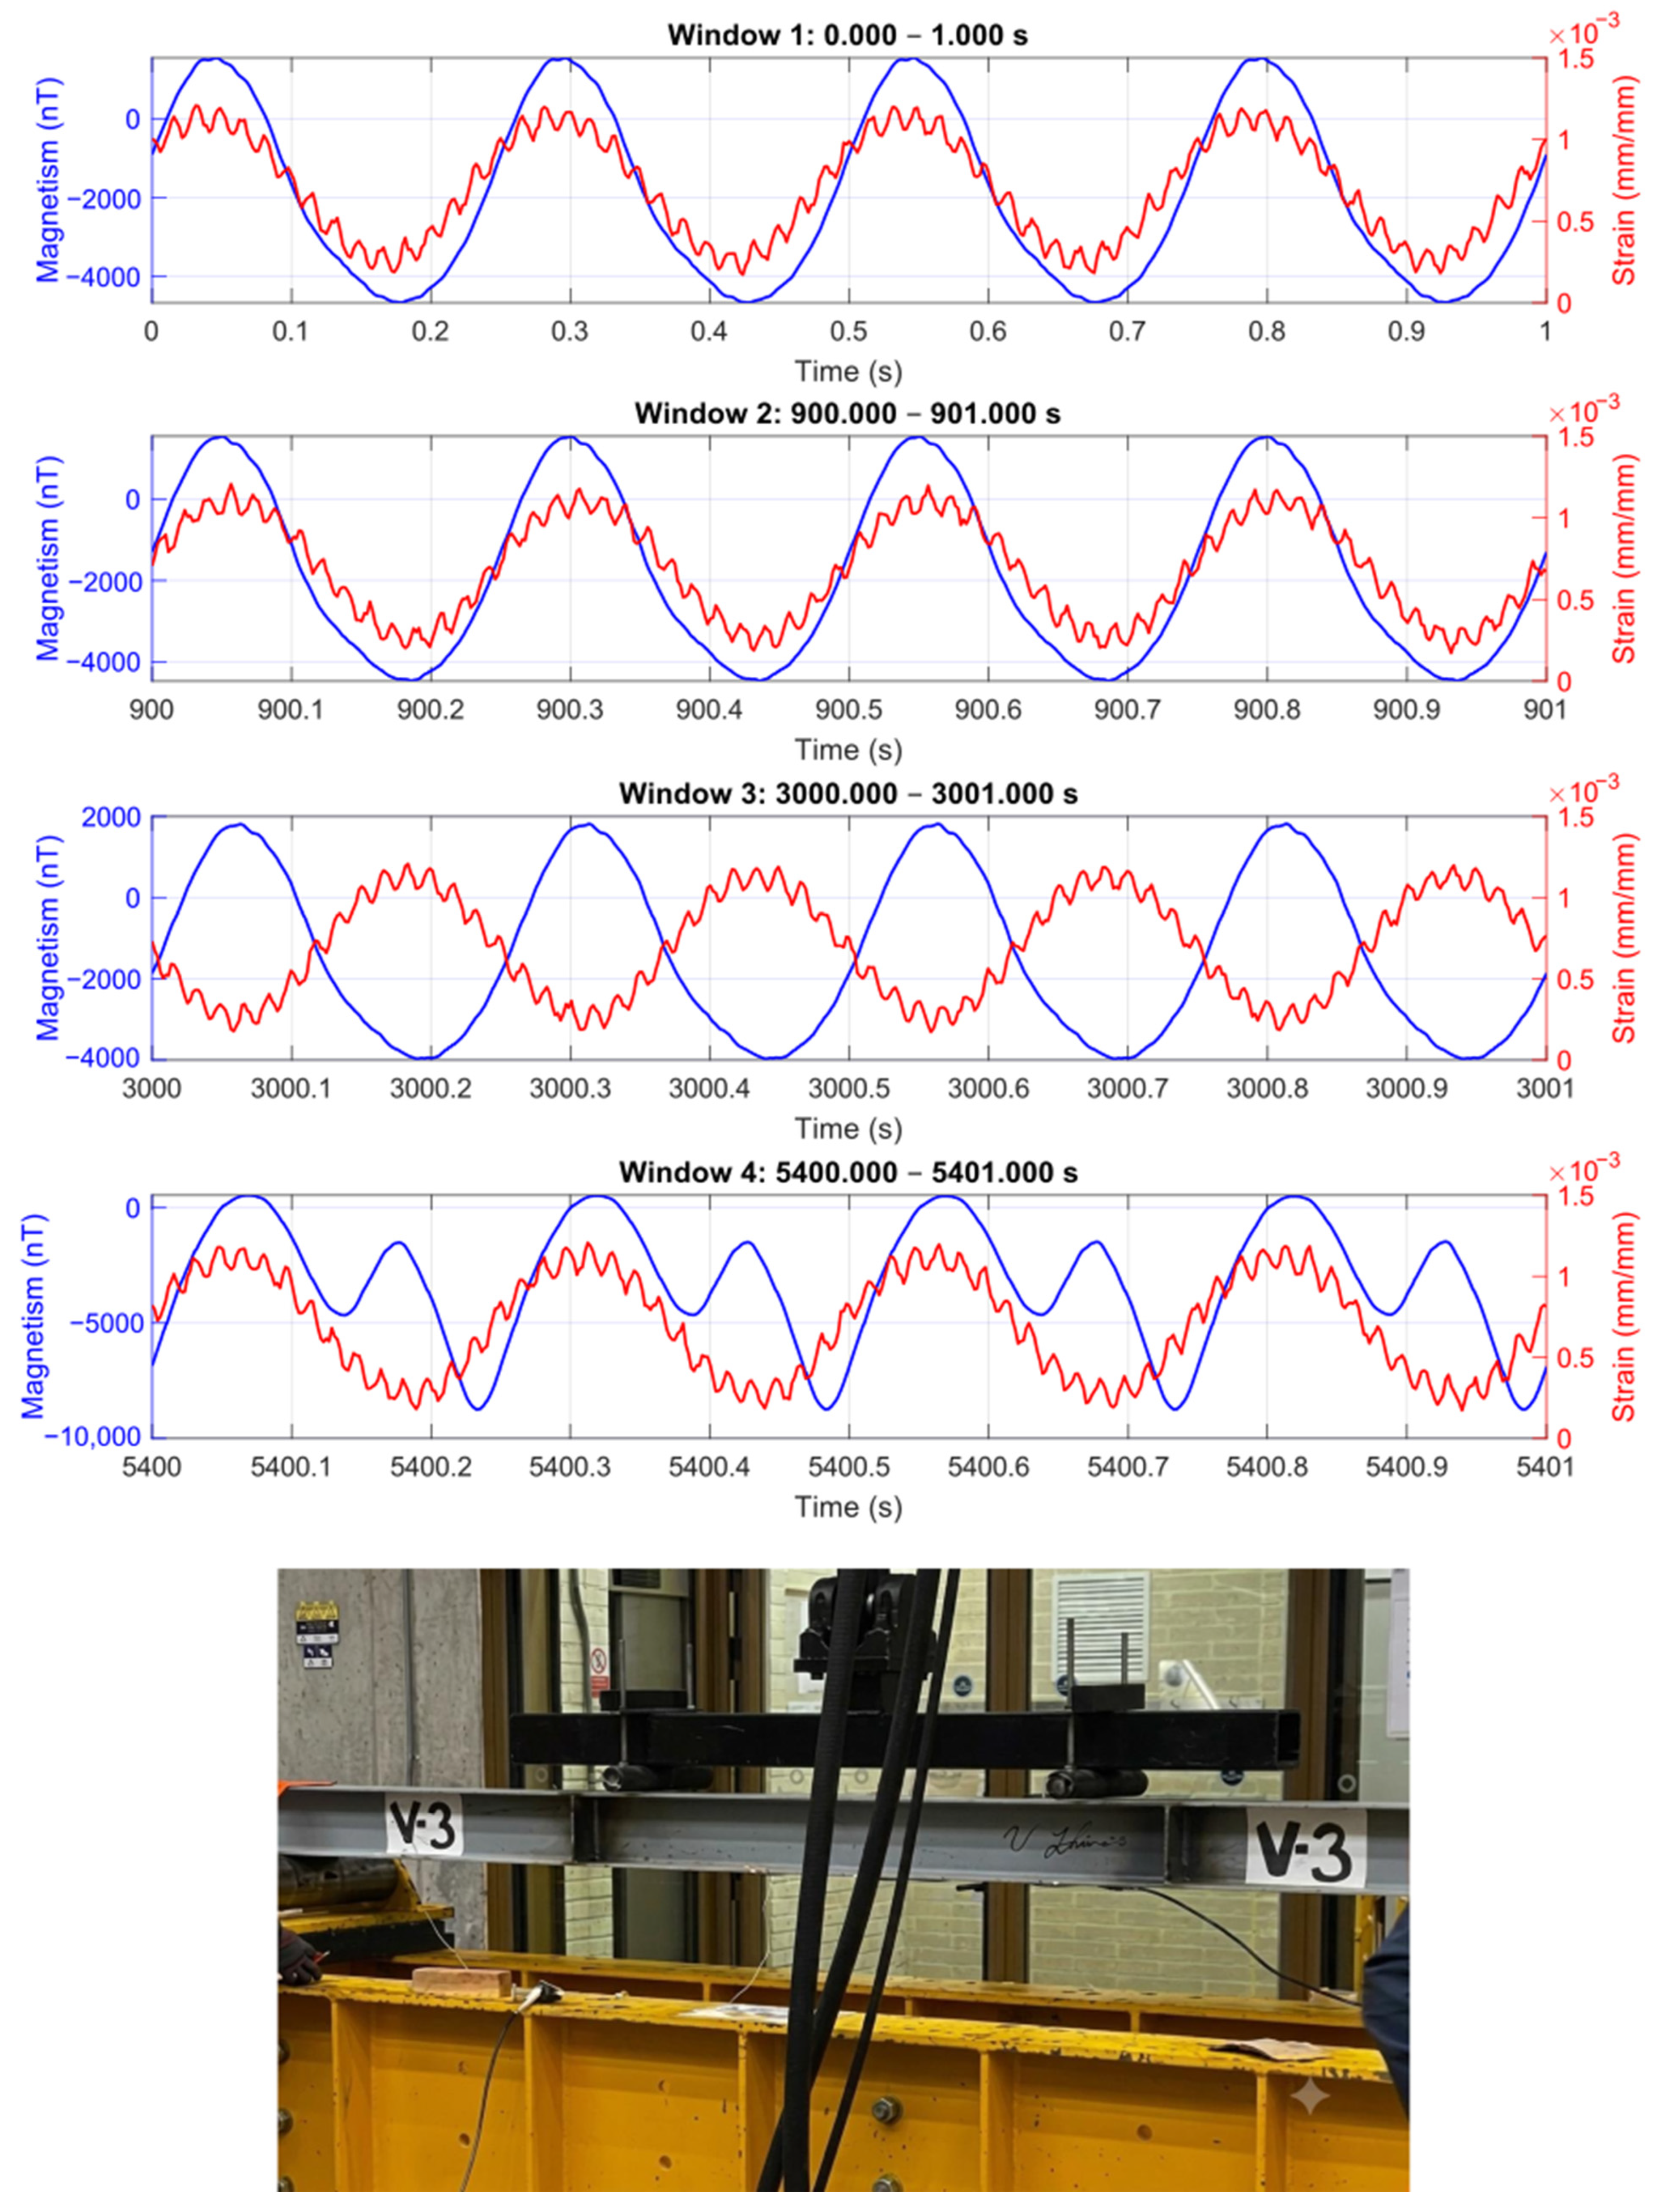
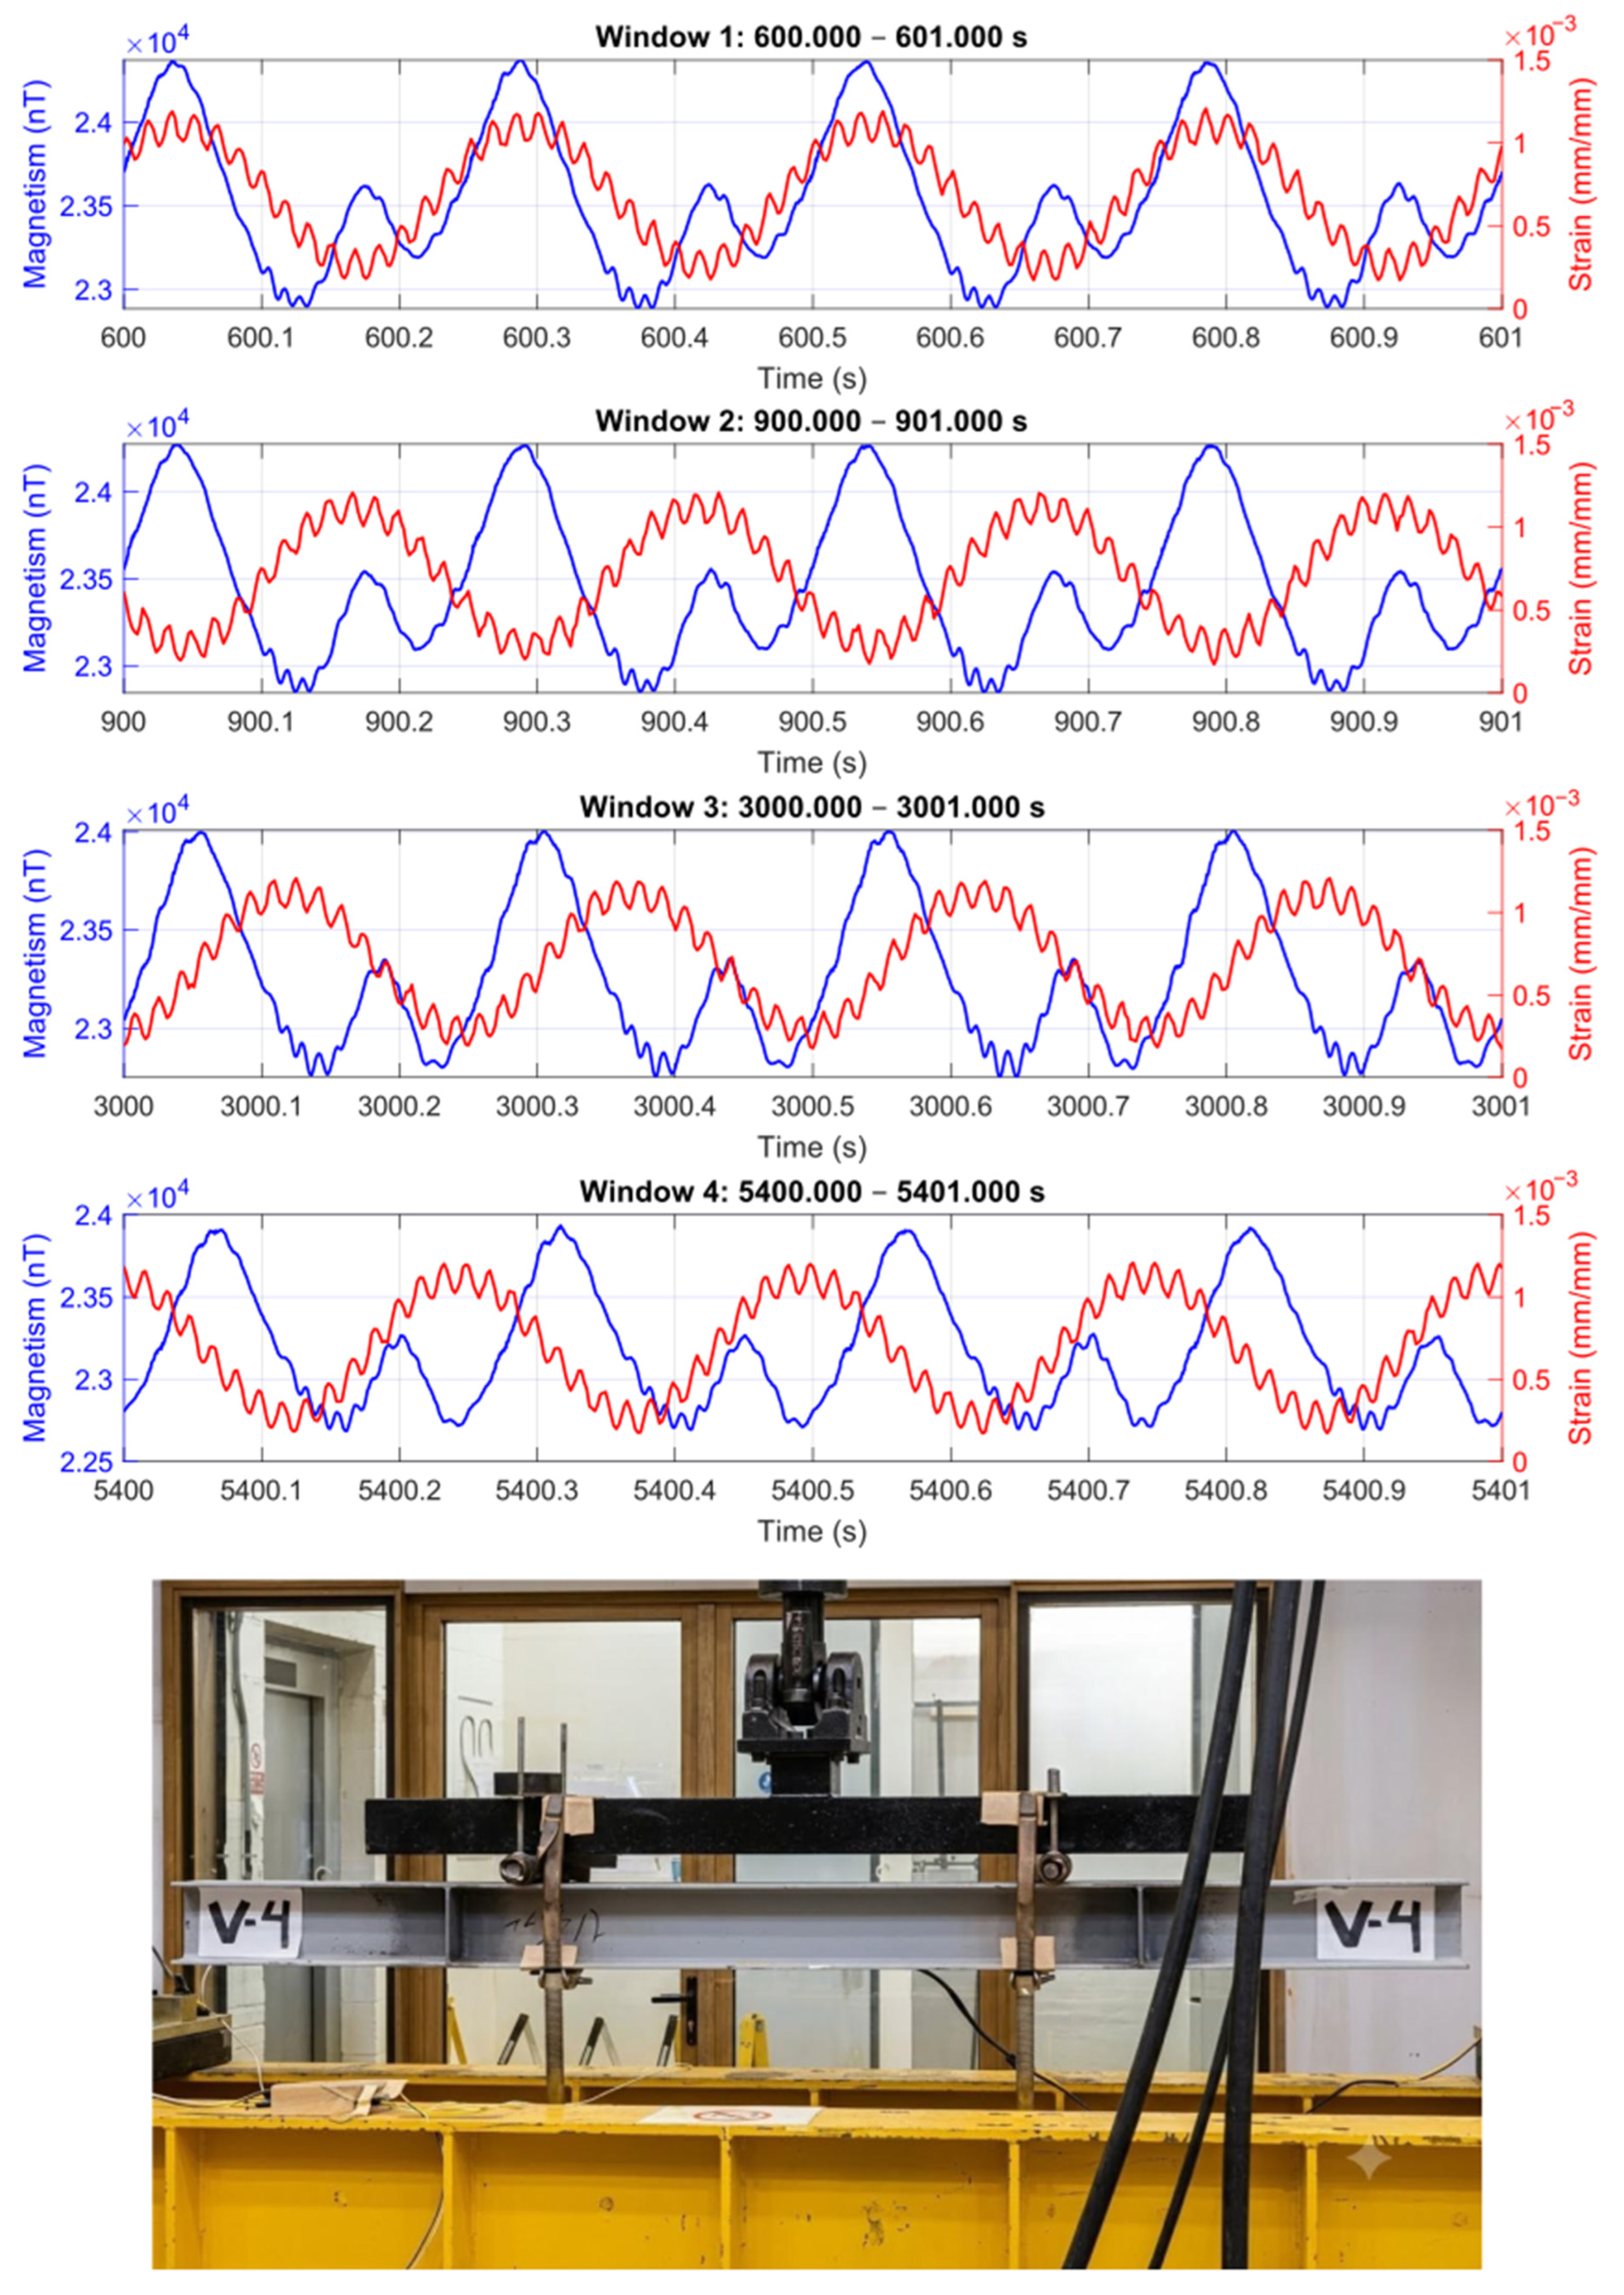
In
Figure 7,
Figure 8,
Figure 9 and
Figure 10, the strain ranged from 0 to +1.158 × 10
−3 mm/mm, consistent with the intended strain level within the elastic range (0.7 × ε
y = 1.207 × 10
−3 mm/mm).
Towards the end of the test, a clear phase shift developed between the applied load and the strain response, indicating a progressive reduction in girder stiffness as cracking advanced and damage accumulated.
These figures also present the evolution of surface magnetic flux as a function of time, comparing 5 s observation windows from the early stages of testing to cycles approaching fracture. In all the steel girders subjected to flexural fatigue that ultimately led to failure, a distinct shift in magnetic polarization was detected. This behavior indicates progressive alterations in the crystalline structure of the magnetic domains and a corresponding reorientation of the surface magnetic flux, driven by the evolving tensile stress field in the lower flange [
37].
At both the beginning of the test and at its termination after reaching 500,000 cycles, the data from specimen V-P displayed a constant amplitude and stable slope, confirming a consistent magnetic response and purely elastic behavior. In contrast, specimens V-1, V-2, V-3, V-4 and V-5 exhibited noticeable variations in magnetic range (and response) shortly before failure. These variations indicate that the recorded magnetic excursions were not instantaneous events but rather developed progressively over time, mirroring the gradual accumulation of microstructural damage. Consequently, these magnetic excursions can be interpreted as indicators of material discontinuity—specifically crack propagation—and may serve as early-warning signals for the onset of unsafe structural behavior in steel members under bending.
A correlation between strain measurements and stress data provides insight into how the steel evolves as fatigue damage accumulates, reflecting the progressive degradation of its elastic response. Conventional strain monitoring can also effectively aid in constructing stress histories and estimating fatigue cycles; however, strain data requires post-processing, which prevents real-time evaluation. This time lag between data acquisition and analysis introduces a critical service-gap by the time conclusions are drawn. Thus, the monitored structural element may have already failed by the time the post-process is available, limiting the practical utility of strain-based approaches.
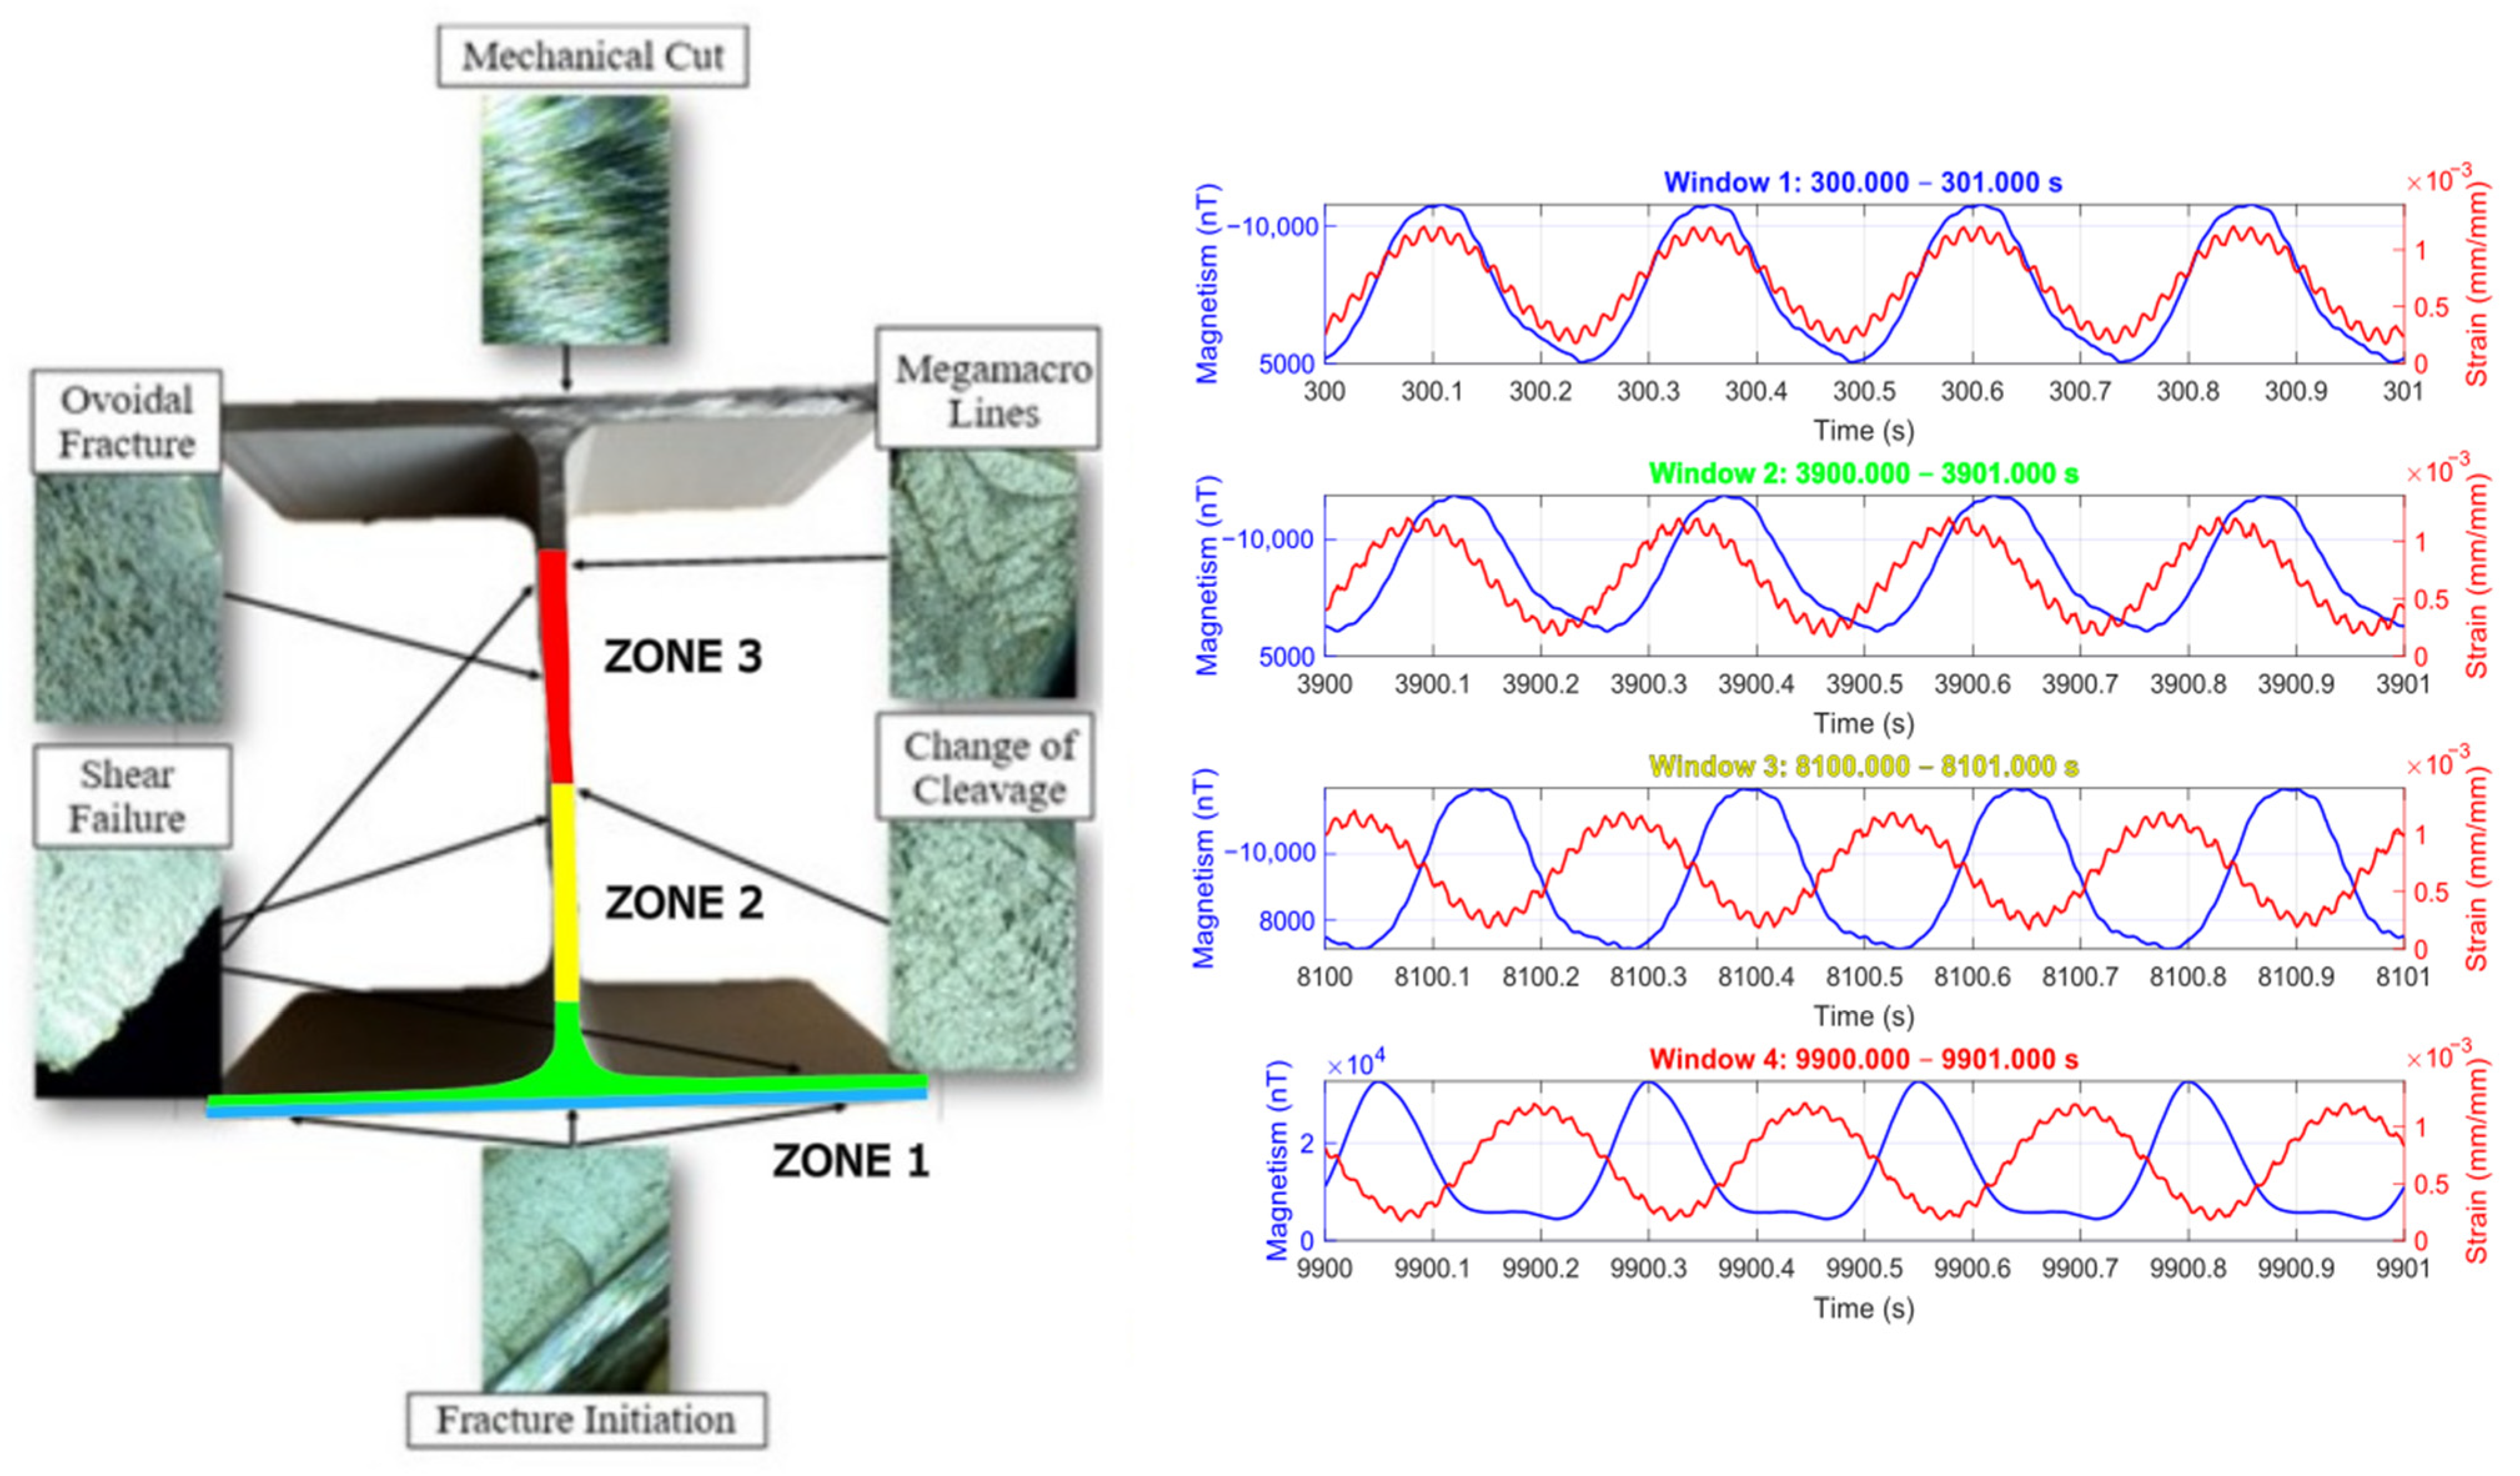
Strain behavior followed the applied sinusoidal loading throughout the test from early stages to midlife and up to failure, showing consistent elastic behavior until collapse. In contrast, the surface magnetic flux exhibited a markedly different trend: while it mirrored the sinusoidal response during the early and midlife stages (windows 1 and 2), its waveform distorted significantly near the end of the test, signaling the onset of non-linear magnetic behavior (windows 3 and 4) associated with damage accumulation in each test, as shown in
Figure 7,
Figure 8,
Figure 9 and
Figure 10. This clear deviation in the magnetic signal suggests that surface magnetism can serve as a real-time indicator of structural integrity and evolving safety conditions in steel elements under flexural fatigue.
These findings demonstrate a progressive deterioration in the elastic response of steel (for all steel beams that reached fatigue failure at a final time
—see
Table 2.), which can be effectively mapped through the evolution of the surface magnetic flux waveform even for natural-sized structural elements. Equation (4) introduces a non-linear sinusoidal mathematical model representing the magnetic field variation of a steel structural member subjected to bending at mid-span until reaching fatigue from a visually observed crack, according to the point in time in which the response ceased to be harmonically coupled with applied strain (K
mag as reported in
Table 4). This formulation includes a secondary sinusoidal component within the original magnetic response function, enabling the visual representation of the observed decay behavior from the initial magnetic records obtained at the beginning of each test (see
Figure 11):
where
Φ(t) is the magnetic signal as a function of time—;
A is the time amplitude of the surface magnetic response;
B is the magnetic constant produced by material degradation;
ω is angular frequency;
v is frequency as an absolute value representing the post-rupture emanation of the material (which must be at least twice the test frequency);
φ is material degradation phase shift;
k is a factor associated with the cumulative onset of inelastic damage;
t0 is initial degradation time.
All parameters presented in Equation (4) will need a larger number of tests in order to be validated and are out of the scope of the present research. However, the behaviors observed in all tests performed in the present research match this waveform and reflect a plausible mathematical model to be coupled based on physical magnetic observations.
The proposed equation (Equation (4)), once all the parameters are determined by means of a larger set of tests (an endeavor out of the scope of the present research), might help in modeling the magnetic response degradation of a steel structural member subjected to cyclic loading by characterizing how its magnetic signature evolves over time. At the beginning of the test, the magnetic response closely follows the sinusoidal shape of the applied load. As fatigue progresses, however, deviations from this periodicity become evident, reflecting the material’s progressive loss of stiffness and internal damage accumulation. This behavior is represented by the superposition of an additional sinusoidal component within the primary load waveform, which captures the onset and growth of non-linear magnetic behavior associated with microstructural degradation (see each window 4 in
Figure 7,
Figure 8,
Figure 9 and
Figure 10). To ensure a smooth and continuous transition between undamaged and degraded states, a sigmoid function (1 + e
(−k(t − t0)) was incorporated into the model, representing the gradual evolution of material deterioration rather than an abrupt shift (see
Figure 11), such as the shift that happens with steel fatigue.
This analysis was prepared for only one of the samples, as we expected to observe similar fracture mechanisms in all samples. Thus, this analysis is just a descriptive evolution of cracking, and it should be understood as complementary, not a fact for all the possible experimental outcomes for a beam under fatigue testing until failure. It will only help reveal what happened to the beams presented in this research and describe three main zones of interest. The inspection zones for complete fatigue cracking in the cross-section under study reveal three critical areas. Zone-1 marks the initiation of fatigue cracking, zone-2 is located midway between the lower flange and the termination of fatigue cracking, and zone-3 corresponds to a high-energy crack with the presence of a shear lip near the web’s termination. These zones each represent distinct stages of fatigue crack propagation.
Crack initiation occurred at the pre-machined V-notch (with the same geometry that is used for a standard Charpy V-notch test [
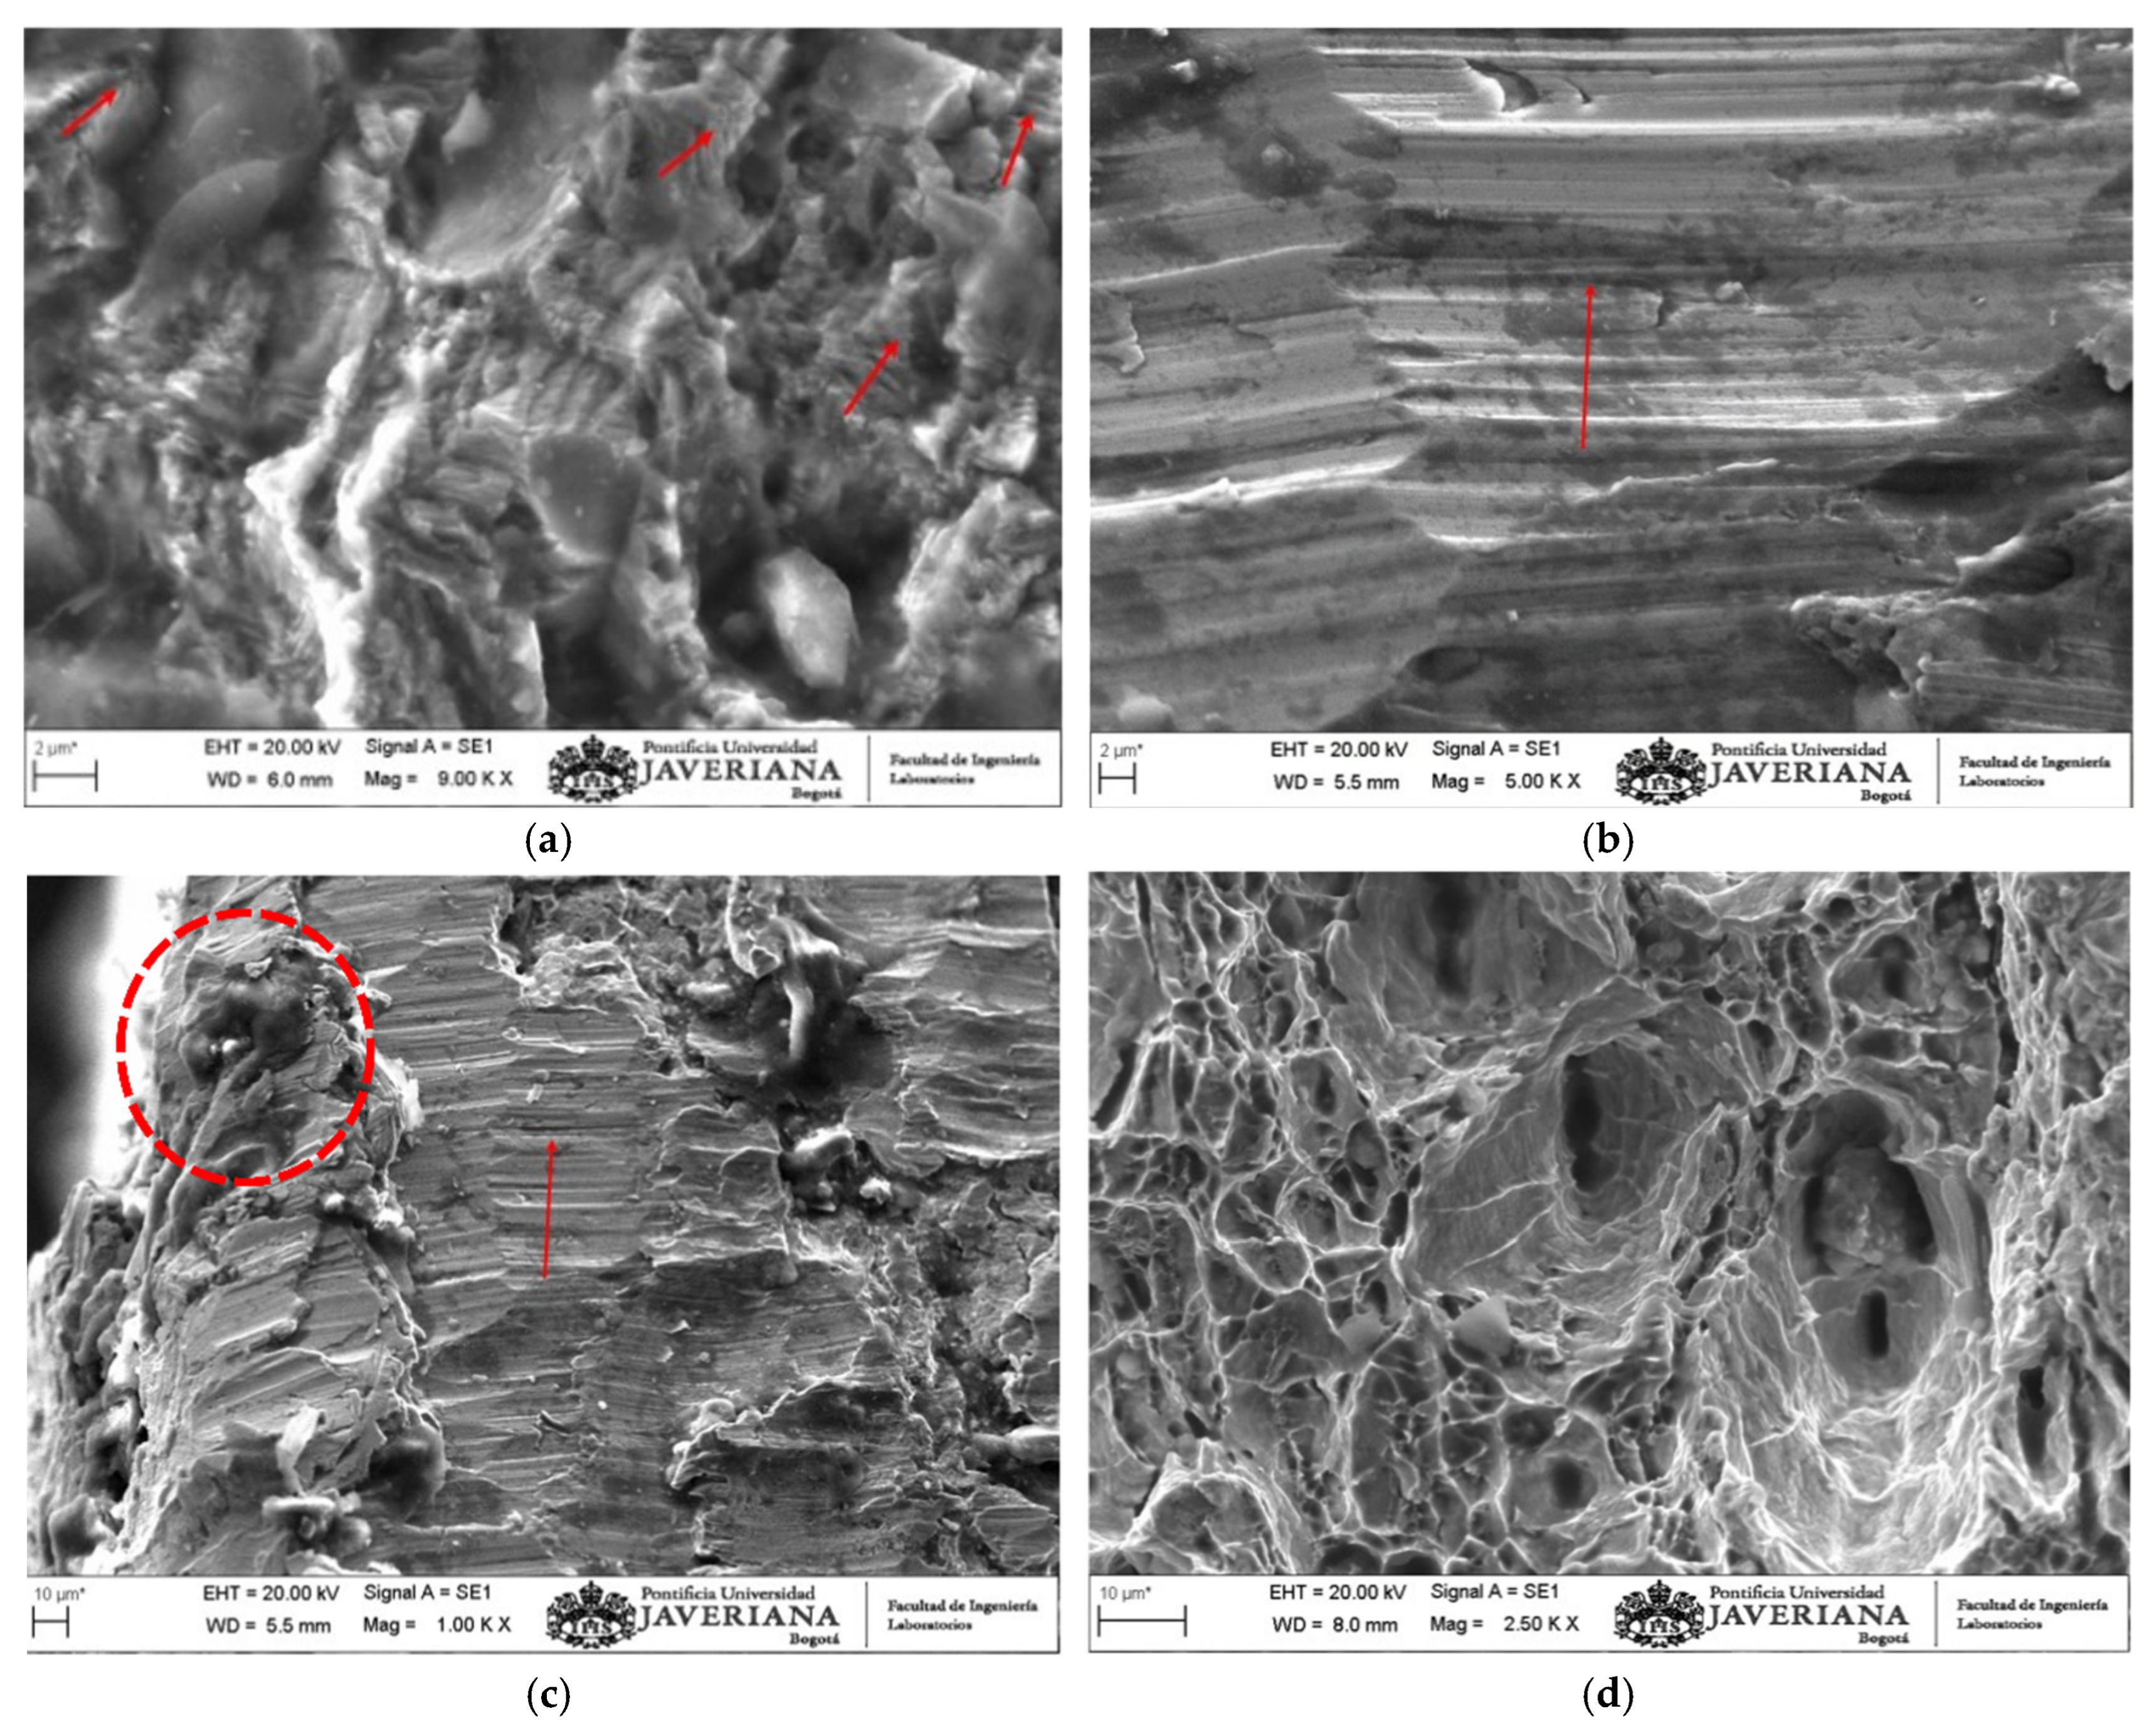
38]) located on the tension flange (Zone 1), propagating through multiple directions along the lower flange (see
Figure 12). Sections of the fractured area were extracted using a precision cutter for further surface characterization via scanning electron microscopy (SEM). SEM observations were performed with a Zeiss Evo HD 15 microscope operating under high vacuum conditions, complemented by energy-dispersive X-ray spectroscopy (EDS) performed using an Oxford Instruments X-Max 20 detect.
Figure 12 presents the identified inspection areas on the cross-section following crack propagation, highlighting Zone 1 near the V-notch region (the one induced by mechanical damage).
The initial nano-fatigue striations exhibited an average spacing of approximately 100 nm, which progressively developed into micro-fatigue striations with an average spacing of about 5 μm (see
Figure 12a). Above the neutral axis—where fatigue cracking transitions into high-energy fracture—the surface displayed a combination of small dimples and large, open dimples ranging from 2 μm to 25 μm in diameter (see
Figure 12c). This morphological transition confirms the end of the fatigue propagation stage and the onset of final fracture separation (owing to the safety interlocks implemented in the MTS actuator, complete specimen separation was prevented; instead, the steel member exhibited significant midspan deflection, marking the final “failure state.”).
The observed fractographic features are consistent with previously reported crack-growth mechanisms [
38], supporting the interpretation of progressive cumulative degradation governed primarily by fatigue prior to collapse. The results obtained across all tests reveal two converging behaviors: (i) the progressive evolution of cracking into an unsafe condition leading to beam failure, and (ii) the corresponding non-steady increase in the magnetic range towards the end of the fatigue life. This correlation demonstrates that the magnetic emissions recorded throughout the tests effectively capture the progressive accumulation of fatigue damage in full-scale structural elements. As cyclic loading advances, the magnetic signal intensifies and loses stability, reflecting the underlying deterioration processes that culminate in structural failure.
In Zone 2, micro-fatigue crack stabilization became evident near the onset of the region, close to the web, with the crack propagating towards the upper flange. The spacing between striations ranged from approximately 500 nm to 2 µm, occasionally exceeding this range (see
Figure 12b,c). As the test progressed, fatigue reached a steady evolution stage within Zone 2, where the recorded striation spacing increased to about 5 µm or more (see
Figure 12c). This widening of striation spacing was attributed to elevated local stresses in the cross-section, as the effective bending area decreased due to crack propagation. As cracking advanced through Zone 2, the upper region of
Figure 12c reveals the onset of cleavage and small dimple formations, marking a transition towards the final fracture region. Zone 3 represents the last stage of crack evolution, where failure occurs rapidly, characterized by large dimples of approximately 25 µm in diameter (see
Figure 12d). This progressive cracking behavior aligns with previous observations describing stress intensification under tensile loading [
7].
Upon specimen failure, a complementary inspection was conducted using a 1000× optical microscope to assess the fatigue-induced damage features (see
Figure 13). Examination of the fracture surface across three distinct zones revealed a clearly defined shear lip, indicative of high-energy crack propagation during the final stages of fatigue failure [
38]. Adjacent to this region, a transition zone displaying cleavage-to-dimple morphology was observed, while the third zone exhibited large, open dimples characteristic of near-final rupture. Zone 3, therefore, represents a region of pronounced plastic deformation, where fatigue microcracking evolves into cleavage and ductile dimple rupture [
38], leading to complete discontinuity of the cross-section due to cumulative fatigue mechanisms.
This qualitative analysis of one of the fracture surfaces provides valuable insight into the relationship between crack evolution and the corresponding magnetic signal as time passes and fatigue accumulates in the steel element under flexure.
Figure 13 presents a conceptual physical model illustrating how crack propagation might correlate with variations in the recorded surface magnetic flux. This model depicts the coupled evolution of mechanical damage and magnetic response, showing that as cyclic loading progresses, magnetic emissions evolve in tandem with fatigue mechanisms. Consequently, these emissions can serve as an effective indicator for identifying the onset of unsafe conditions in steel members subjected to repeated bending.
4. Conclusions
The present research investigates the bending behavior of W6×15 steel elements subjected to cyclic loading until failure governed by fatigue mechanisms. The primary variable monitored was surface magnetic flux, recorded continuously from the onset of testing until separation occurred. This defined failure due to excessive crack propagation and loss of bending stiffness. Measurements were taken near an induced-damage region at the midspan tension flange, where a machined V-notch served as a controlled crack initiator. This artificial defect represented a visually detectable damage condition, allowing fatigue to progress along a defined failure plane as loading cycles advanced. In parallel, strain was measured using a strain gauge positioned at the tension flange of each girder, serving as a control element with which to monitor the induced deformation.
At the beginning, midpoint, and end of the test, the strain response consistently mirrored the applied load, maintaining a stable sinusoidal pattern throughout the experiment and up to the point of separation. In contrast, the recorded surface magnetic flux exhibited a steady range only until a specific point in time—marking the transition from the safe stage to the damage-accumulation stage. Beyond this point, the magnetic response became nonlinear, presumably due to the accelerated propagation of fatigue cracks. On average, the calculated Kmag parameter reached a value of 0.774, corresponding to approximately 77.4% of the total fatigue life, during which all specimens displayed a stable magnetic range. In the remaining 22.6% of the fatigue life—specifically, the final phase before failure—the magnetic range increased significantly in magnitude, indicating a shift in the cracking mechanism from micro-fatigue striations to cleavage and dimple rupture. This transition reflects the onset of rapid, high-energy fracture processes driven by localized stress concentrations at the tip of the crack.
The observed transition from steady to non-steady behavior in the surface magnetic flux indicates that it is possible to identify unsafe mechanical conditions in a steel element subjected to cyclic bending at a point where approximately 22.5% of damage has occurred before failure occurs. A plausible mathematical model that might, in the future, allow one to predict said behavior in terms of magnetism was introduced by Equation (4). It presents a sigmoid function combined with a secondary sinusoidal term exhibiting inverse exponential behavior. The approximation, although only qualitatively for the present research, allows one to reproduce the magnetic signal’s nonlinear evolution over time. However, further research and physical tests are required to calibrate and determine the various parameters needed.
This magnetic degradation phenomenon has been previously reported in the literature, though primarily for small-scale specimens under axial loading, typically using AISI 1018 steel or similar alloys. In contrast, the present study shows this behavior in full-scale structural elements subjected to bending fatigue. The magnetic excursions identified here confirm that the surface magnetic field of large steel members is equally sensitive to microstructural and mechanical changes, as observed in laboratory-scale tests. These findings suggest that magnetic flux monitoring can be effectively applied as a non-destructive diagnostic tool for assessing the structural integrity of steel components under real service conditions, serving as a complementary means of making decisions with classical models such as fracture mechanics or strain-controlled fatigue degradation models.
While similar responses have been reported for small-scale fatigue tests, the present research demonstrates that this phenomenon also holds for full-scale structural elements, thereby confirming its potential applicability for real-world steel structures in service conditions.





 ,
,