1. Introduction
This paper investigates how ML-supplemented workflows can facilitate design decision-making across the early design stages of the Royal Institute of British Architects (RIBA) Plan of Work (PoW). It aims to define and validate a framework for stadium design that can automate repetitive work such as the design review of multiple options, explore new design solutions, and evaluate and develop designs based on performance data.
The methodological contribution of this research lies in the integration of parametric modelling grounded in a typological analysis with supervised, semi-supervised, and evolutionary ML techniques to address common design tasks within a professional design delivery framework. Previous studies have often focused on isolated optimisation problems such as structure, circulation, and morphology, while this study maps practice-oriented ML pipelines to the requirements of each RIBA PoW stage and their specific tasks in order to relate these tasks to a wider, data-driven design process.
Stadium design can be understood as a parametric challenge with clearly defined functional and formal constraints that brings together performance-driven design, modularity, automation, and prefabrication. Its well-established relationship with engineering and the development of construction technology [
1,
2,
3] has brought stadium design to the forefront of computational application and innovation.
The first researcher to define the role of the parametric designer within stadium design project teams was Hudson [
4], whose work was later developed by Turrin [
5,
6,
7,
8], Joseph and Kim [
9], and Pan [
10,
11,
12] with a focus on computational and ML-supplemented optimisation of engineering and design tasks related to indoor arenas or other types of assembly buildings. From a professional perspective, Castro [
13] presented the practical application of computational approaches for the development of complex morphological and performance-data-driven relationships during the early design stages. Hudson [
4,
14,
15,
16,
17] and Zarei [
18] further framed parametric design as a supporting element of the broader design process. Due to changes in UK procurement strategies [
19,
20,
21], UK government policy [
22], and rapid technological advancements [
23,
24], the balance of roles has shifted, and today the position of computational designer has evolved from auxiliary to one increasingly central to most aspects of the stadium design process.
With respect to existing academic research and professional practice, the primary tasks that the human designer faces in ML-supplemented workflows are the definition of the initial problem and constraints, the selection and curation of data for the training of models, the selection and fine-tuning of off-the-shelf ML algorithms, the interpretation and validation of results, and ultimately the decision as to whether a design solution will be implemented. While significant aspects of these tasks can benefit from the use of ML-supplemented workflows, this also means an increasing importance of human judgement in problem definition, data preparation, and post-analysis review. In the context of the PoW, the RIBA has also sought to better understand this transformative process through its AI Report [
23], which focuses on sustainability, off-site manufacturing, design workflows, and policy formation. In the report, the RIBA highlighted the shift of the human designer’s role from technical production to the curation of meaning [
23].
The utilisation of computational methods in existing research has demonstrated substantial value within well-defined design domains. The work of Nagy [
25] presented a link between the parametric generation of layouts and ML, while Mukkavaara and Sandberg [
26] systematised this process into a generative framework within the context of residential blocks.
ML is traditionally used to simulate and analyse design performance, for example, in terms of crowd flow [
27,
28,
29,
30,
31,
32,
33] and structural optimisation in the context of stadiums [
34]. These studies, however, typically focus on isolated problems rather than the wider design process. They rarely integrate typological analysis, modular parametric modelling, and ML approaches within a professional project delivery framework of design. To address this gap, this paper develops a stadium-specific workflow that maps supervised, semi-supervised, and evolutionary ML methods to RIBA PoW Stages 0 to 3.
The relevant core stadium design characteristics are defined in the work of John and Sheard [
35,
36,
37,
38]. As appendices to the multiple editions of their
Stadia design manual, they provide a client briefing guide that lists design considerations such as legal and administrative concerns, project objectives and parameters, site considerations, and considerations relating to spectators, participants, media, management, general services, and ancillary areas [
35]. This provides the primary reference framework for the parameters to be included in the parametric and ML models presented in this paper in terms of capacity ranges, seating bowl morphology, sightline quality, programme area allocations and adjacencies, and circulation requirements. Additional guidance from the DCMS [
39,
40], FIFA [
41,
42], UEFA [
43], and International Olympic Committee (IOC) [
44] is used to establish safety compliance thresholds and benchmark metrics. By translating these criteria into parametric variables, evaluation metrics, and decision rules, the study extends existing guidance beyond precedent-based advice towards ML-supplemented design.
Stages 0–3 of the RIBA PoW are the primary focus of this study because these early project phases establish the strategic brief, site response, concept design, and spatial coordination decisions. They have a fundamental influence on project cost, performance, and overall design development. In current practice, the stages are often based on precedent, manual development of options, and consultant inputs that require time-consuming coordination. The rapid generation of alternatives, performance benchmarking, narrowing down of design space, and support for informed decision-making make ML-supplemented approaches particularly suitable for this type of design task. The proposed framework therefore aligns computational methods with the stages where they can have the greatest strategic impact.
Accordingly, the research asks:
How can stadium design be represented through shared typological characteristics, including sightline quality, circulation distances, statutory requirements, and functional space provision, within a parametric model?
How can supervised, semi-supervised, and evolutionary machine learning workflows be integrated with that parametric model to support RIBA Plan of Work Stages 0–3 (site appraisal, brief definition, concept development, and layout optimisation)?
What are the benefits and limitations of this ML-supplemented parametric design framework for early-stage stadium design?
2. Methodology
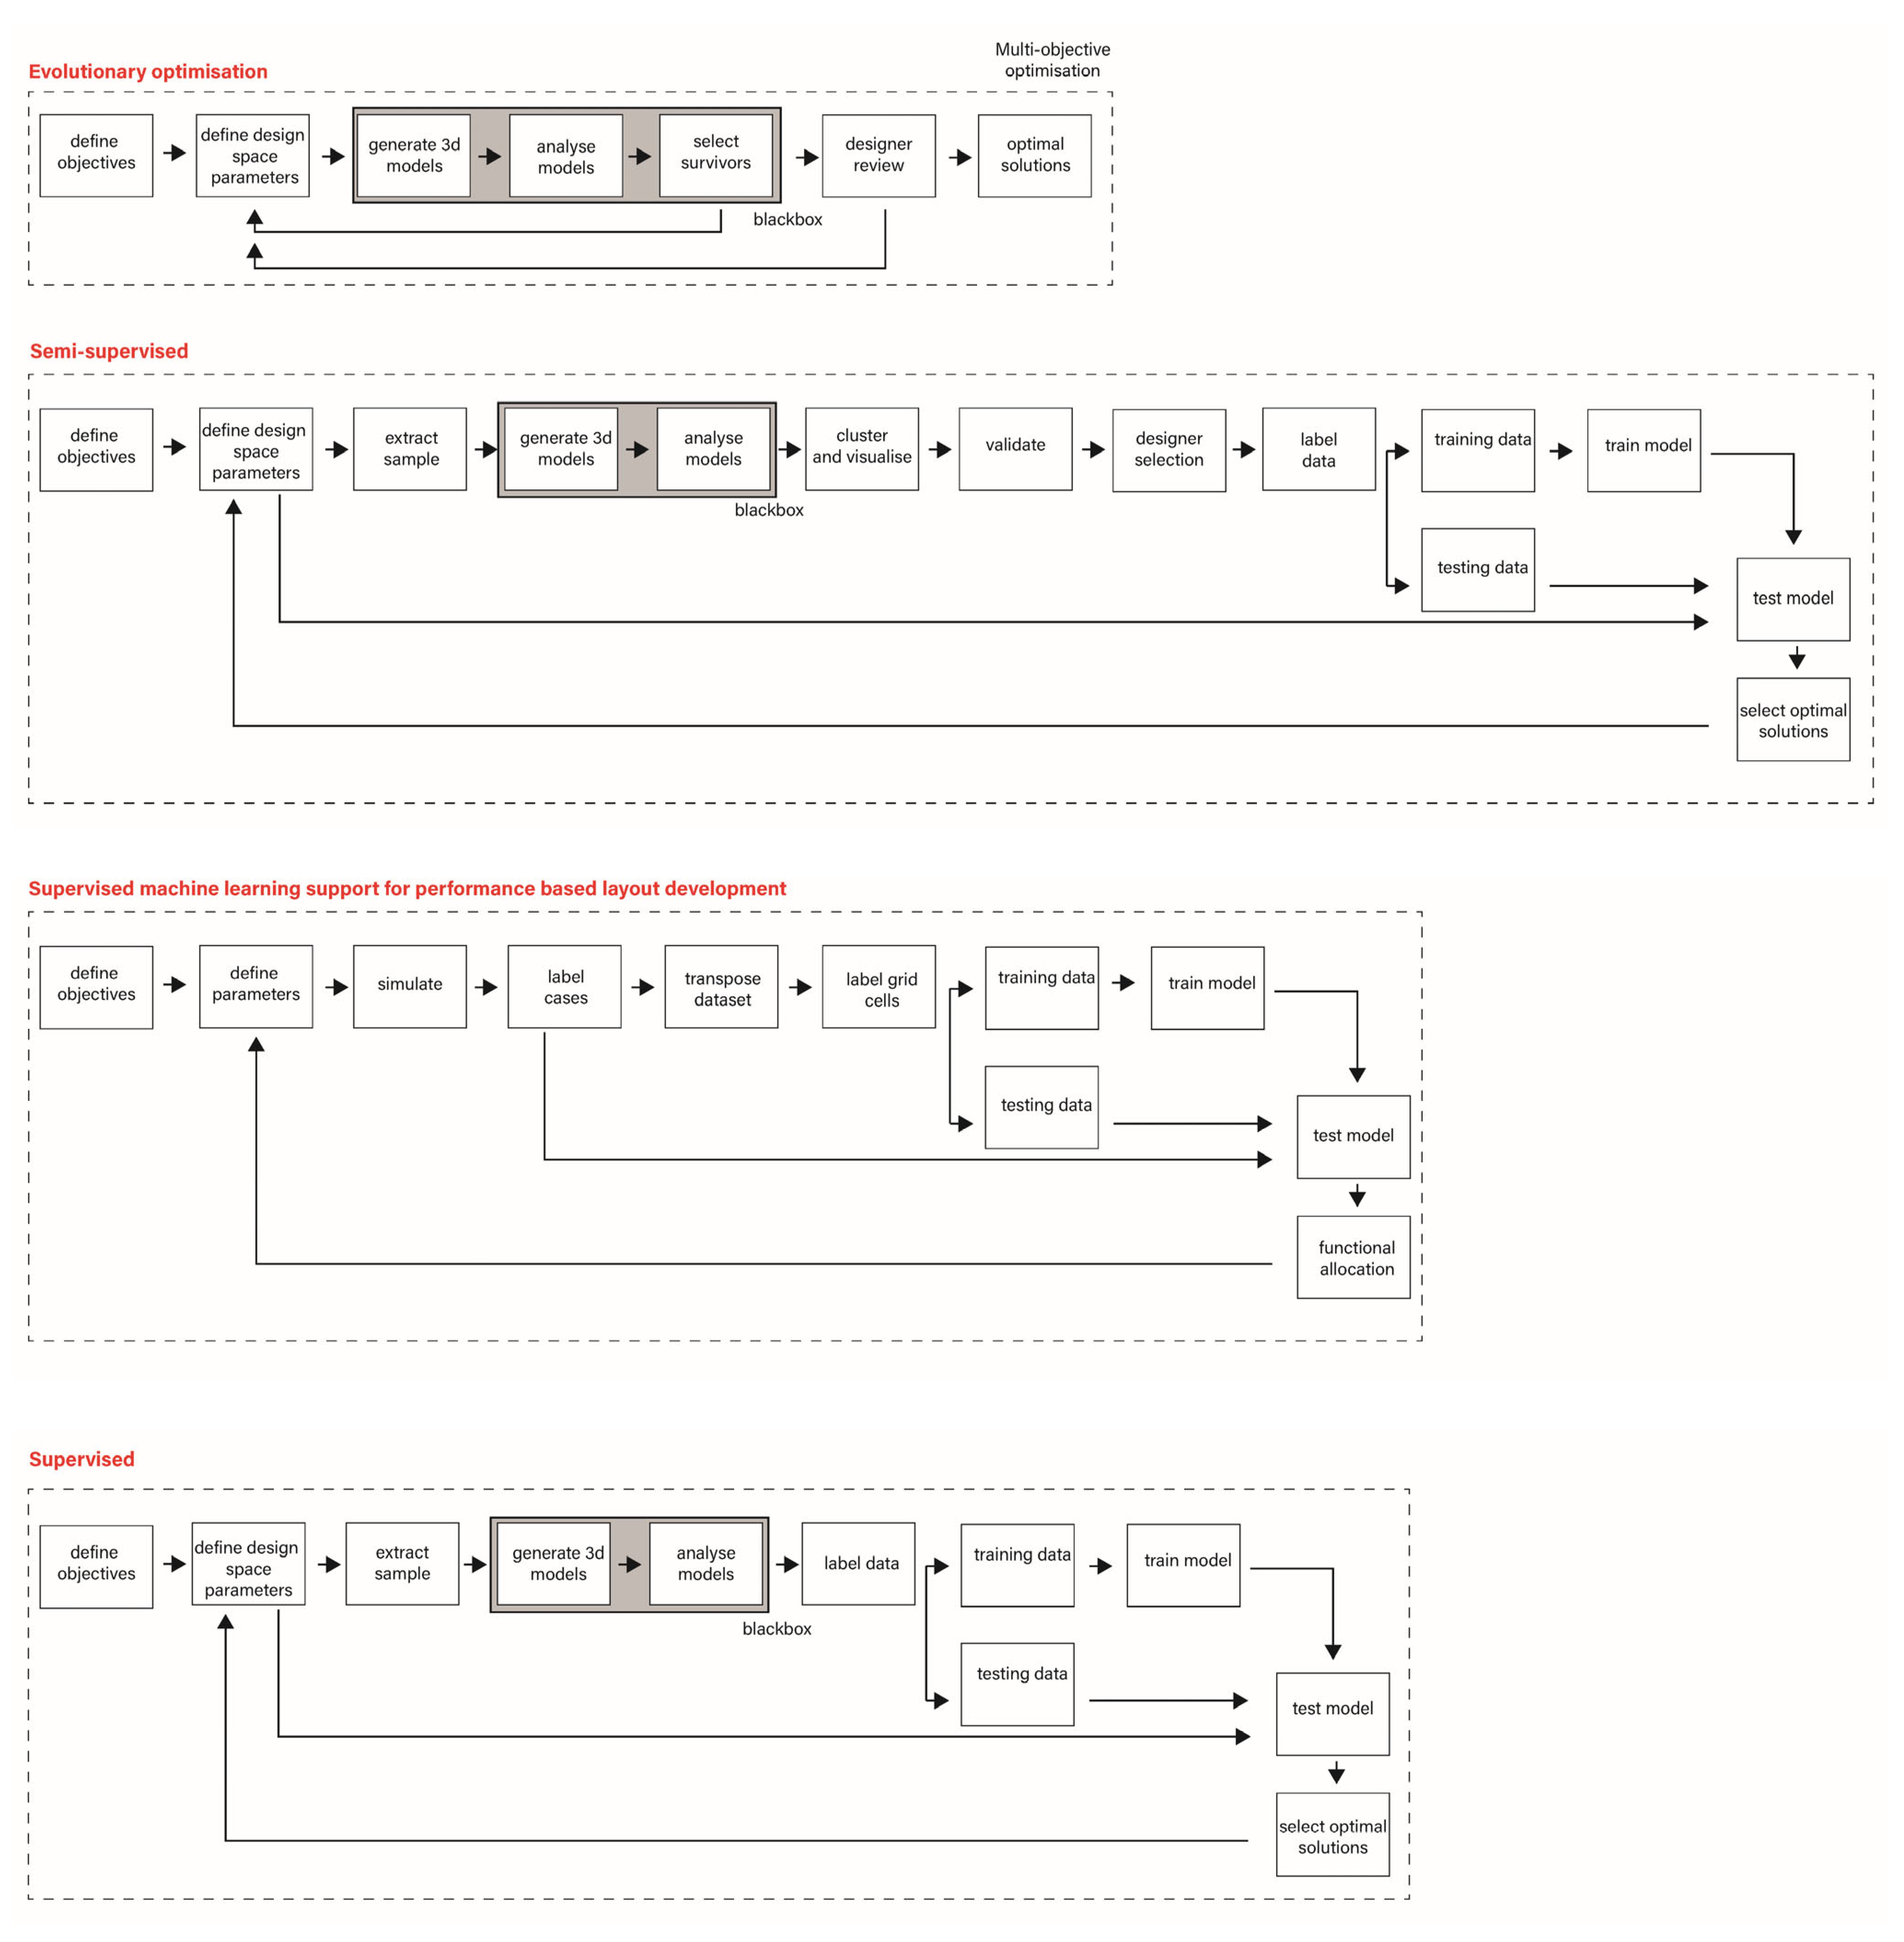
The research adopts a cross-subject methodology to explore the challenges and gaps identified in the existing literature. While current ML applications in architectural design tend to focus on isolated optimisation tasks, early RIBA PoW stages remain dominated by manual optioneering and fragmented consultant inputs. To address this, the study integrates typological analysis, modular parametric modelling, and three complementary ML pipelines. These are matched to decision-making needs at each PoW stage: supervised learning for feasibility testing and brief definition in Stages 0 and 1; semi-supervised learning for concept exploration in Stage 2; and evolutionary optimisation for multi-objective optimisation (MOO) in Stage 3.
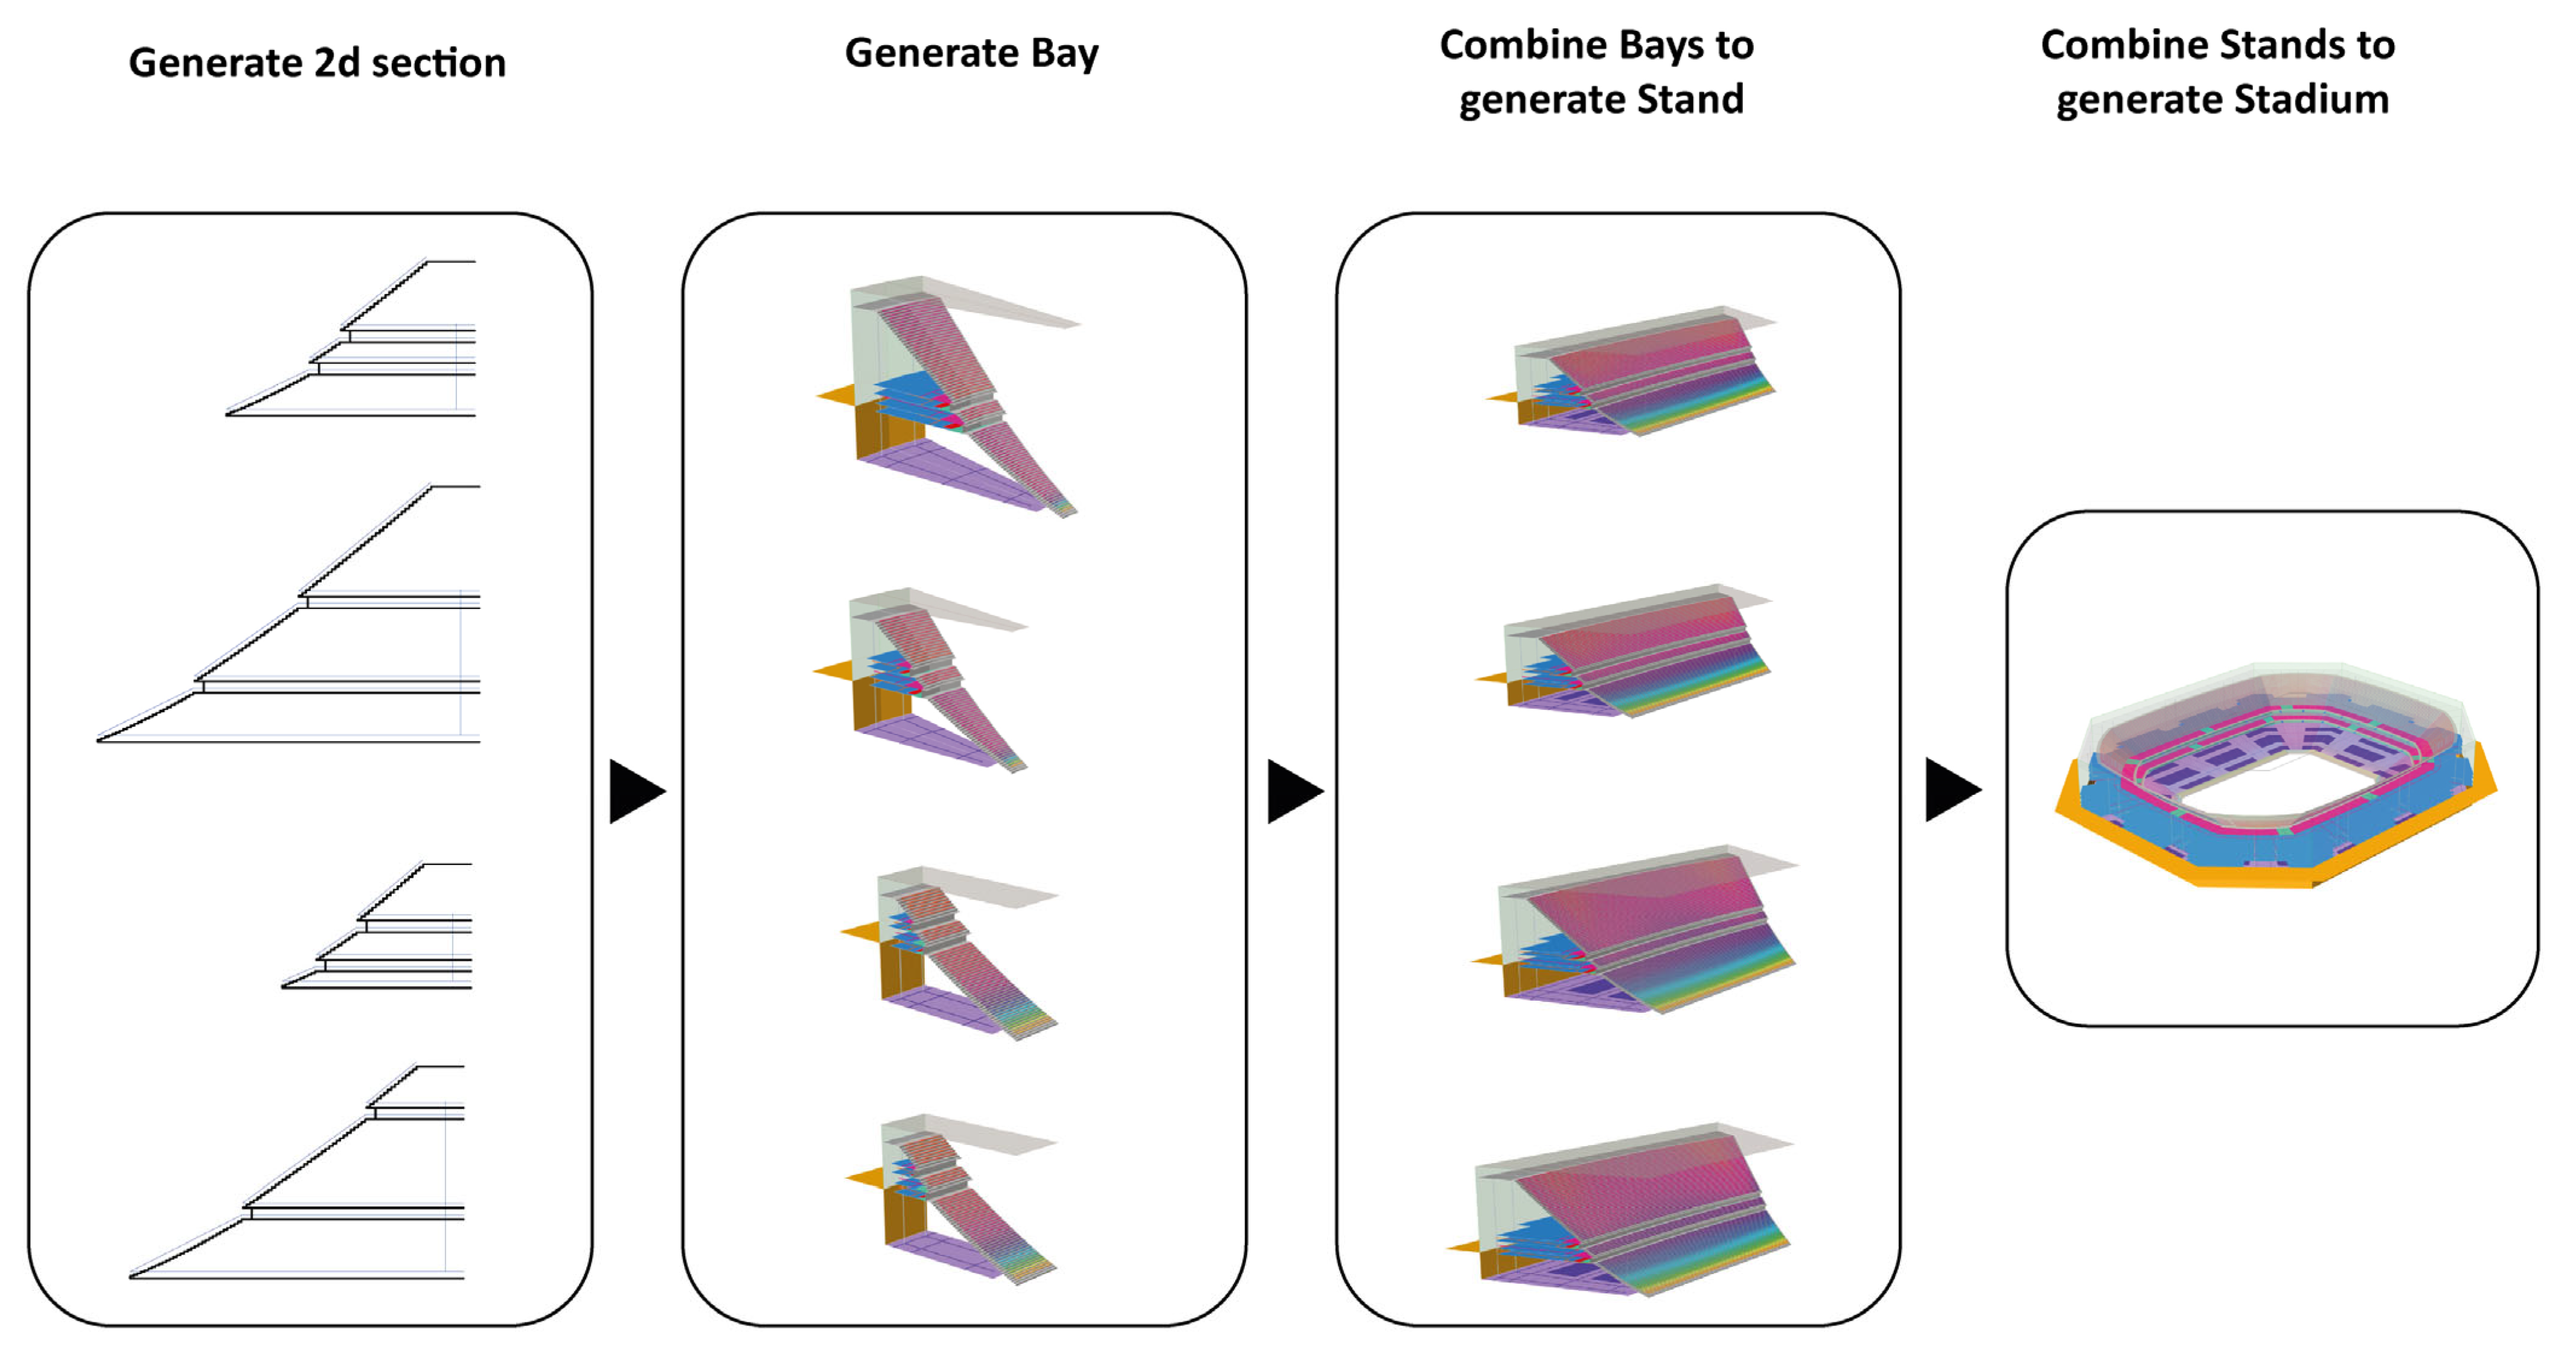
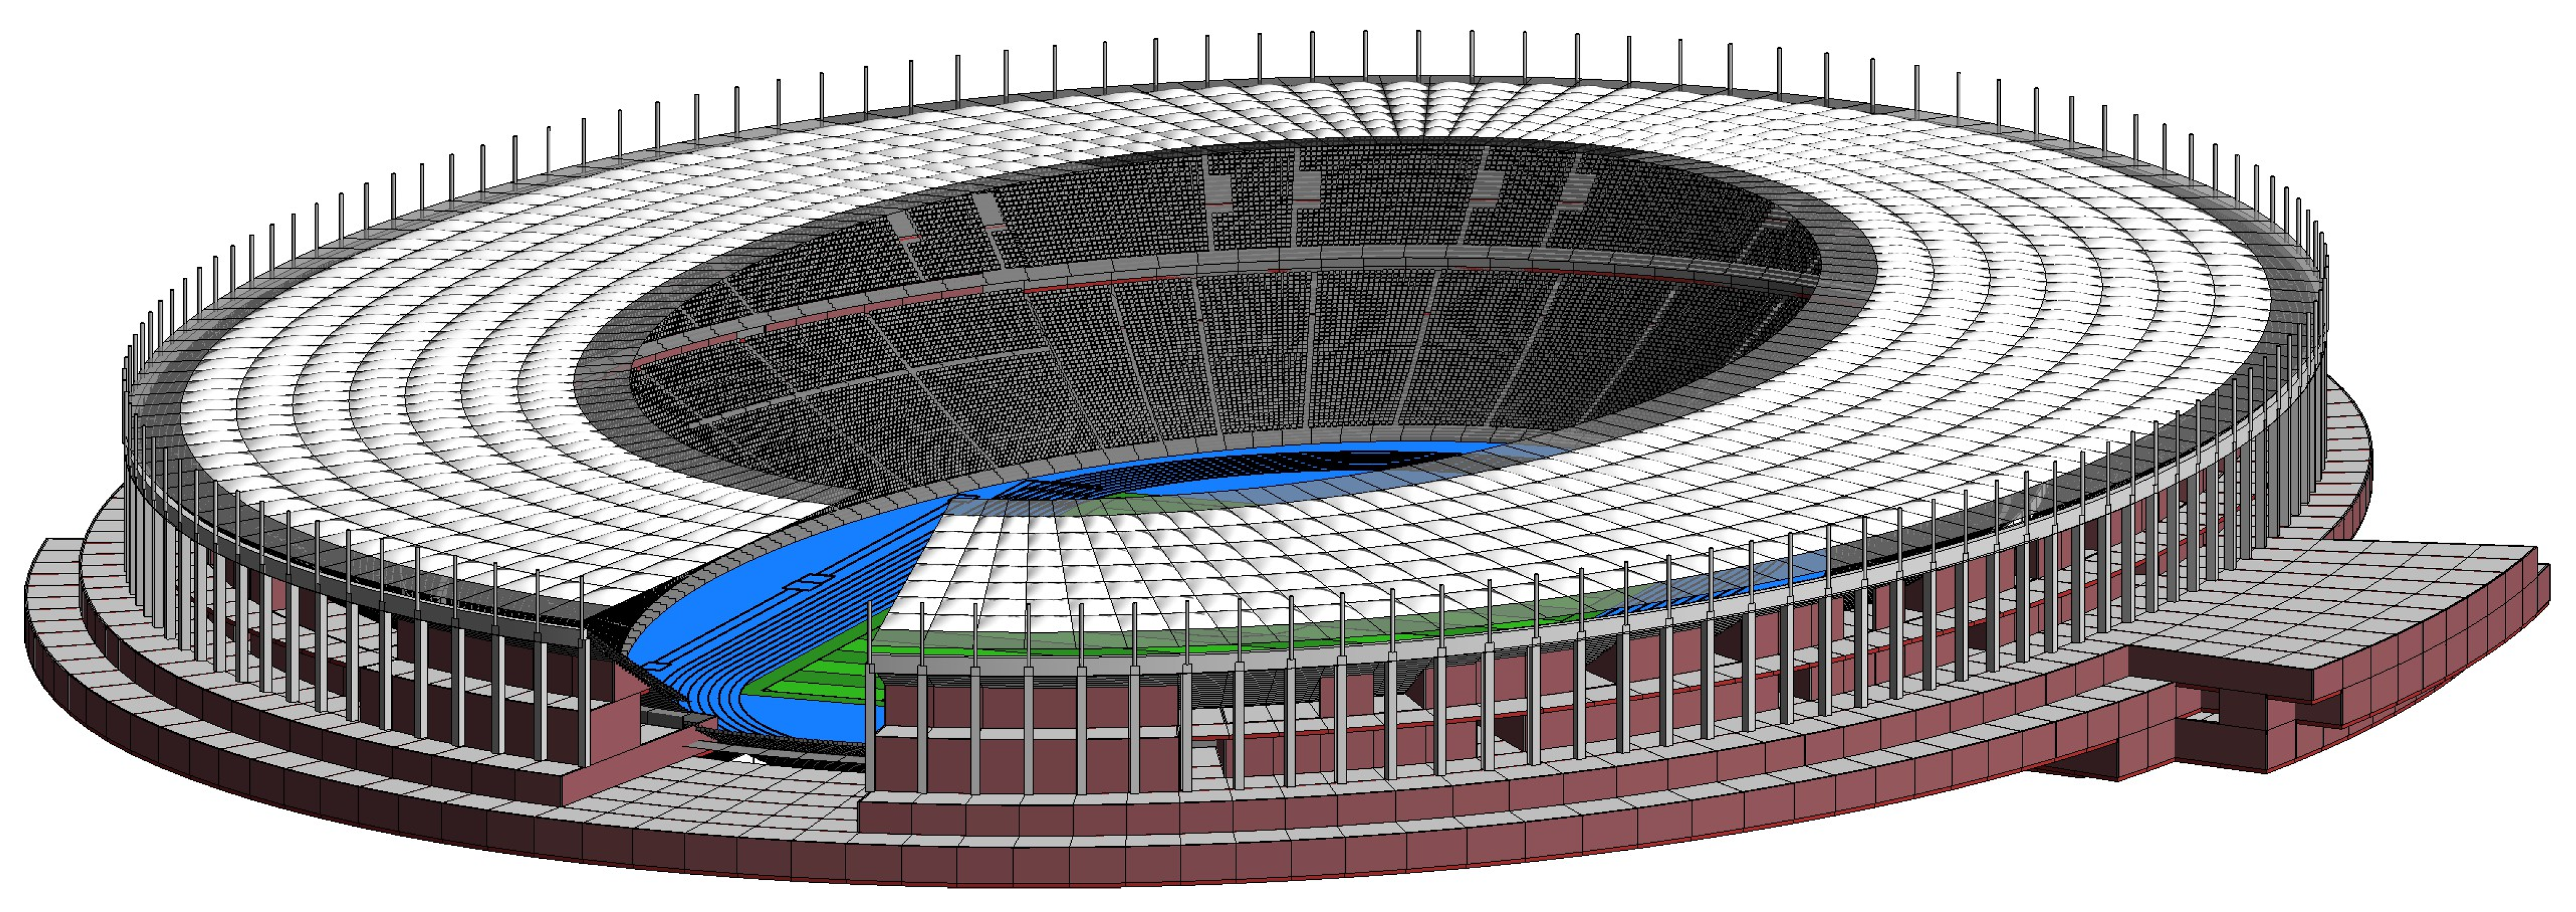
Underlying the study is a parametric model developed in Grasshopper/Rhino 7 to translate the shared typological characteristics of stadiums into quantifiable parametric relationships. The model is structured around four primary modular scales of a stadium: 2D section, bay, sector, and stadium (
Figure 1). These scales allow for stadium design decisions to be based on different levels of resolution from seating geometry and structural build-up to sector organisation and evaluation of overall stadium design performance.
Table 1 summarises how each scale converts typological design drivers and regulatory constraints into parametric model outputs and performance data.
The modular representation is chosen as it captures design problems occurring at different scales. Sightline quality and row geometry are resolved at the section scale; structural repetition and modular construction logic at the bay scale; programme and circulation at the sector scale; and capacity, footprint, site fit, and masterplan access at the stadium scale. This allows the ML workflows to operate at the appropriate design resolution rather than treating the stadium as a single undifferentiated object.
The model represents stadium design as assemblies of modules arranged around a playing field. The 2D section is generated first, then the structural bay is generated based on the section and programme requirements, then the bays are assembled around the playing field (
Figure 1). The modular approach allows the generation and comparison of diverse types, including new conceptual and past designs.
The framework was implemented in Grasshopper/Rhino 7, using Lunchbox for NNs and k-means clustering, Octopus for evolutionary optimisation, and scikit-learn for the validation metrics. The geometry and data outputs can be exported to BIM environments such as Revit through Industry Foundation Classes (IFC) workflows (
Figure 2). Relevant UK regulatory constraints are embedded as parameter limits or validation criteria where applicable to each design stage.
The three ML pipelines reflect the requirements for the type of decision needed at each PoW stage. Stages 0 and 1 require rapid classification of feasible options based on defined constraints; Stage 2 requires exploration of wider design spaces; and Stage 3 requires optimisation between competing performance objectives. As a result, the methods move from supervised classification to semi-supervised exploration and finally to evolutionary multi-objective optimisation (
Figure 3).
Supervised NNs with the Lunchbox standard set of hyperparameters (
Table 2) are used where the design task can be labelled against clear criteria such as sightline quality, distances, and area ratios. This provides a deterministic rule- and benchmark-based assessment within the generated design space. NNs were selected due to their efficiency in processing the classification tasks required in early building procurement stages and their adaptability to comparable decision-support tasks across multiple RIBA PoW stages. The networks use one hidden layer, and the number of hidden neurons varies according to dataset sizes. All input values (
Table 3) are normalised to the range 0–1 before being passed to the NN. The Lunchbox operator does not provide a random seed input, so weight initialisation is not fixed across runs. Nevertheless, the reported evaluations are reproducible because they were generated from saved NN models evaluated against fixed datasets.
In Stage 0, the process of site appraisal is based on the requirements set out in the Green Guide [
39,
40] and FIFA Stadium Safety and Security Regulations [
41]. Accordingly, the primary parameters used in this analysis are stadium capacity, the area of the safety zones around the venue, and distance from seat to the entry points to the external controlled zone (Green Guide’s Zone 4 [
40]) around the stadium (
Table 3). These variables generate the training and testing data for the supervised classification.
In Stage 1, the same supervised approach builds on the additional set of information typically provided by an architect or specialist designer. This allows the evaluation of generated stadium options against site morphology, internal distances, access locations, safety zones, structural properties, and target capacity ranges (
Table 3). The generated cases are labelled by summing the corresponding performance values and used to train classification models that can identify viable site and capacity combinations, thus reducing the design space.
In Stage 3, NNs are used for a performance-based layout analysis. A subset of design options is evaluated within the parametric model and used as training data for the NN to predict the likely performance of alternatives. This enables rapid comparison of circulation, internal sightlines, and layout variations (
Table 3) without requiring the full simulation of every option. Following validation, the trained models can then be used to classify or predict the performance of unexplored solutions within the wider design space.
Semi-supervised learning is applied during concept development, when the design space is too broad or ambiguous to be fully labelled in advance. At this stage, project objectives are normally still being refined across multiple morphological, spatial, and commercial possibilities. This approach combines the benefits of computational exploration and human decision-making. The process begins by defining the objectives and design space, followed by the generation of 6870 design solutions within the parametric model. A subset of 50 examples is extracted from the main set and clustered three times using unsupervised k-means, once for each performance dimension—sightline, layout distribution, and circulation (
Table 3). The resulting three sets of clusters are subsequently manually reviewed, graded from 1 to 4, and labelled by the designer against predefined performance thresholds derived from benchmarks and statutory requirements [
39,
40,
41,
42,
43,
44,
45]. The resulting three labels are then added together to define a final label between 3 and 12. The labels are weighted equally, reflecting their comparable influence over the final design. Those labels are then used to train a supervised NN to classify the remaining design space into ten performance groups.
This pipeline corresponds to a cluster-then-label semi-supervised approach where the unsupervised step structures the data, and the small set of designer labels is then used for the supervised classification of 6820 entries in the design space. The manual intervention is limited to grading of the three sets of clusters. This workflow combines broad computational exploration with targeted refinement. To ensure consistency, the workflow allows the option of multiple designers to cross-check selections.
In Stage 2, the design space is developed from a more defined set of parameters, including capacity range, orientation, location of the centre of the playing field, ranges for the height of the different levels, spatial and programmatic requirements, morphology and structural grid division. As with the other workflows, the positioning of Zone 4 entry points is critical, but by this stage there should also be a clearer understanding of how the stadium sits within its urban context. In terms of circulation, the parametric model includes more advanced circulation elements such as vomitories, stairs to concourse levels, internal vertical circulation, stadium gates, podiums, and podium access stairs. Sightline performance is assessed at the same time using the number of high-quality seats with a C-value above 120 mm as per the Green Guide [
40].
Evolutionary optimisation is used in Stage 3, when multiple conflicting objectives must be balanced. At this stage, the overall project direction, capacity, and broad spatial strategy have been established, but significant decisions remain in terms of efficiency, buildability, circulation quality, commercial provision, and user experience. This method is chosen because it allows systematic comparison of alternatives in situations where improving one objective may compromise performance in another.
The process involves the definition of objectives, design space parameters, and their corresponding ranges. The automated multi-objective optimisation (MOO) solver Octopus in Grasshopper was used to iteratively generate solutions, evaluate their performance within the parametric model, and identify the best-performing alternatives. The outputs were reviewed to select the preferred design solution. The primary benefit of this approach is that it combines computational search with professional judgement, rather than relying on automatically selected outcomes.
2.1. Dataset Generation, Labelling, and Validation
The training and testing datasets are generated within the parametric model. For each PoW stage, each parametric representation describes a possible stadium configuration using numerical and categorical variables such as morphology, capacity, pitch position, diagrammatic seating geometry, number and locations of bays, and Zone 4 entry point locations.
The outputs of the parametric model are evaluated against statutory requirements, case study benchmarks, and PoW stage-specific objectives. The feasibility of a design solution is tested through its compliance with morphological, statutory, and site-fit requirements such as safety zones, internal layout organisation, and circulation. Designs that fail the test are removed from the dataset. The remaining entries are then classified based on the PoW stage-specific requirements for performance in the categories of sightline quality, circulation, and internal layout. The numerical inputs for the NNs are listed in
Table 3. In Stages 0 and 1, the classification is based on ten performance groups defined through a scored assessment of the design performance and deterministic labelling criteria. The best-performing solutions are selected based on the specific performance objectives at each design stage. The Stage 3 optimal solutions are identified through MOO as Pareto-efficient trade-offs between competing objectives.
For the supervised pipelines, the datasets for the case studies are divided into training and testing subsets at an approximate ratio of 80:20. The Stage 0 and 1 case studies use 800 balanced training examples and 164 testing examples. The criteria are weighted equally unless a stage-specific objective requires the prioritisation of a specific metric. The reported accuracy is the proportion of correctly classified test samples, and the model is validated against a majority-class baseline. As a diagnostic comparison, the dataset was also tested with an untrained NN model. Class-level evaluation measures, such as confusion matrices, precision, F1 macro-average and recall metrics, were calculated using scikit-learn to further strengthen the interpretability of the results.
There are a limited number of data examples because, in contrast to an open-ended classification problem, the task is bound and rule-governed. The classes are bands defined by deterministic performance thresholds. Each example represents a combination of variables within the categories of sightline quality, circulation, and internal layout produced through the parametric model, and these differ substantially from the rest of the cases. As a result, the model is not generalising from a real-world set of variations but learning from a limited set of variables with rule-based labels within a constrained design space. Another reason for the low number of data entries is the slow process of synthetically generating typological stadium representations. The dataset size, however, is considered sufficient for this task as the validation performance showed no consistent improvement when additional examples were added, with empirical results indicating the viability of the workflow within the tested design spaces.
Class distributions in the training data are balanced by trimming larger classes and repeating examples in the smaller ones. The class imbalance originates from the additive labelling approach, where each class label is the sum of the variable grades. Intermediate sums are prevalent because they result from multiple grade combinations, while extreme classes arise from single combinations. Oversampling by repetition of small class entries prevents the model from being dominated by intermediate classes, but the duplication only reweights the examples instead of adding new variety. The data and model fidelity are validated through comparison of the simulation with the base 2D drawings and benchmark performance results in published stadium research such as Hudson and Westlake [
14] and Fenwick Iribarren Architects [
46]. The evolutionary optimisation output is validated through comparison with the existing Kyiv Olympic Stadium configuration, and the layout analysis workflow is validated visually through comparison with the generated graphic outputs. This establishes consistency with selected benchmarks and precedent.
2.2. Application and Case Studies
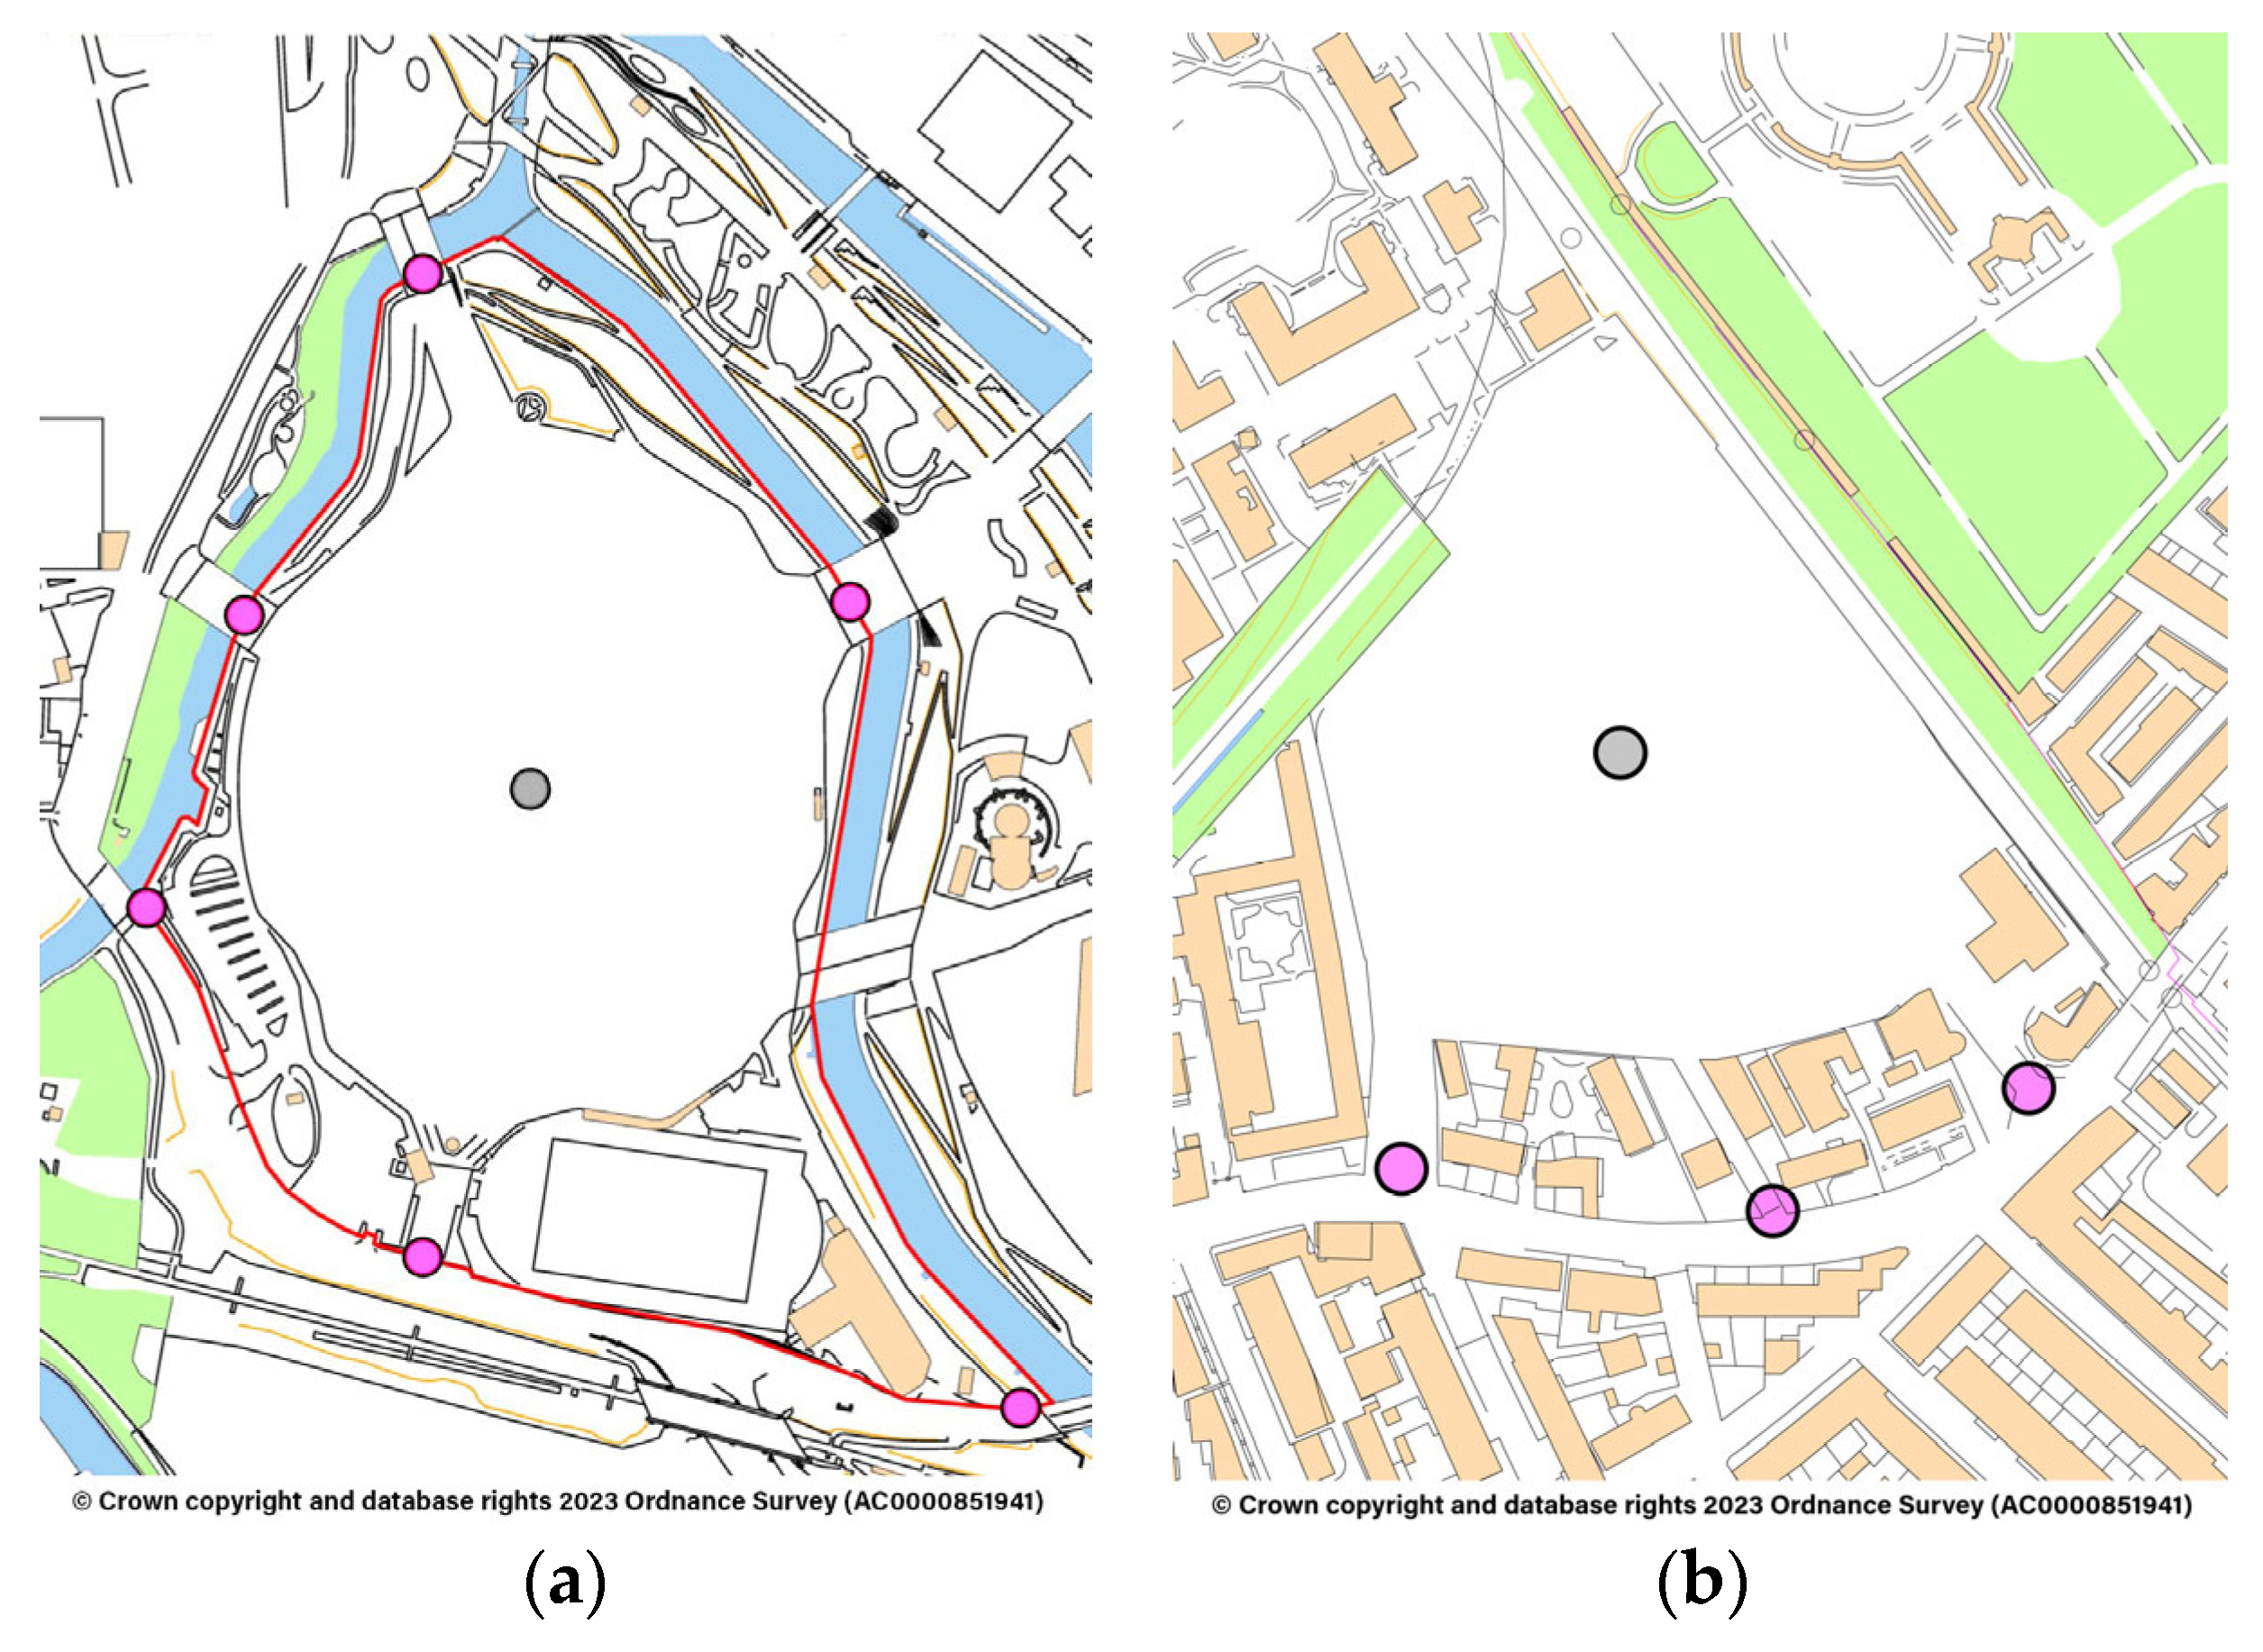
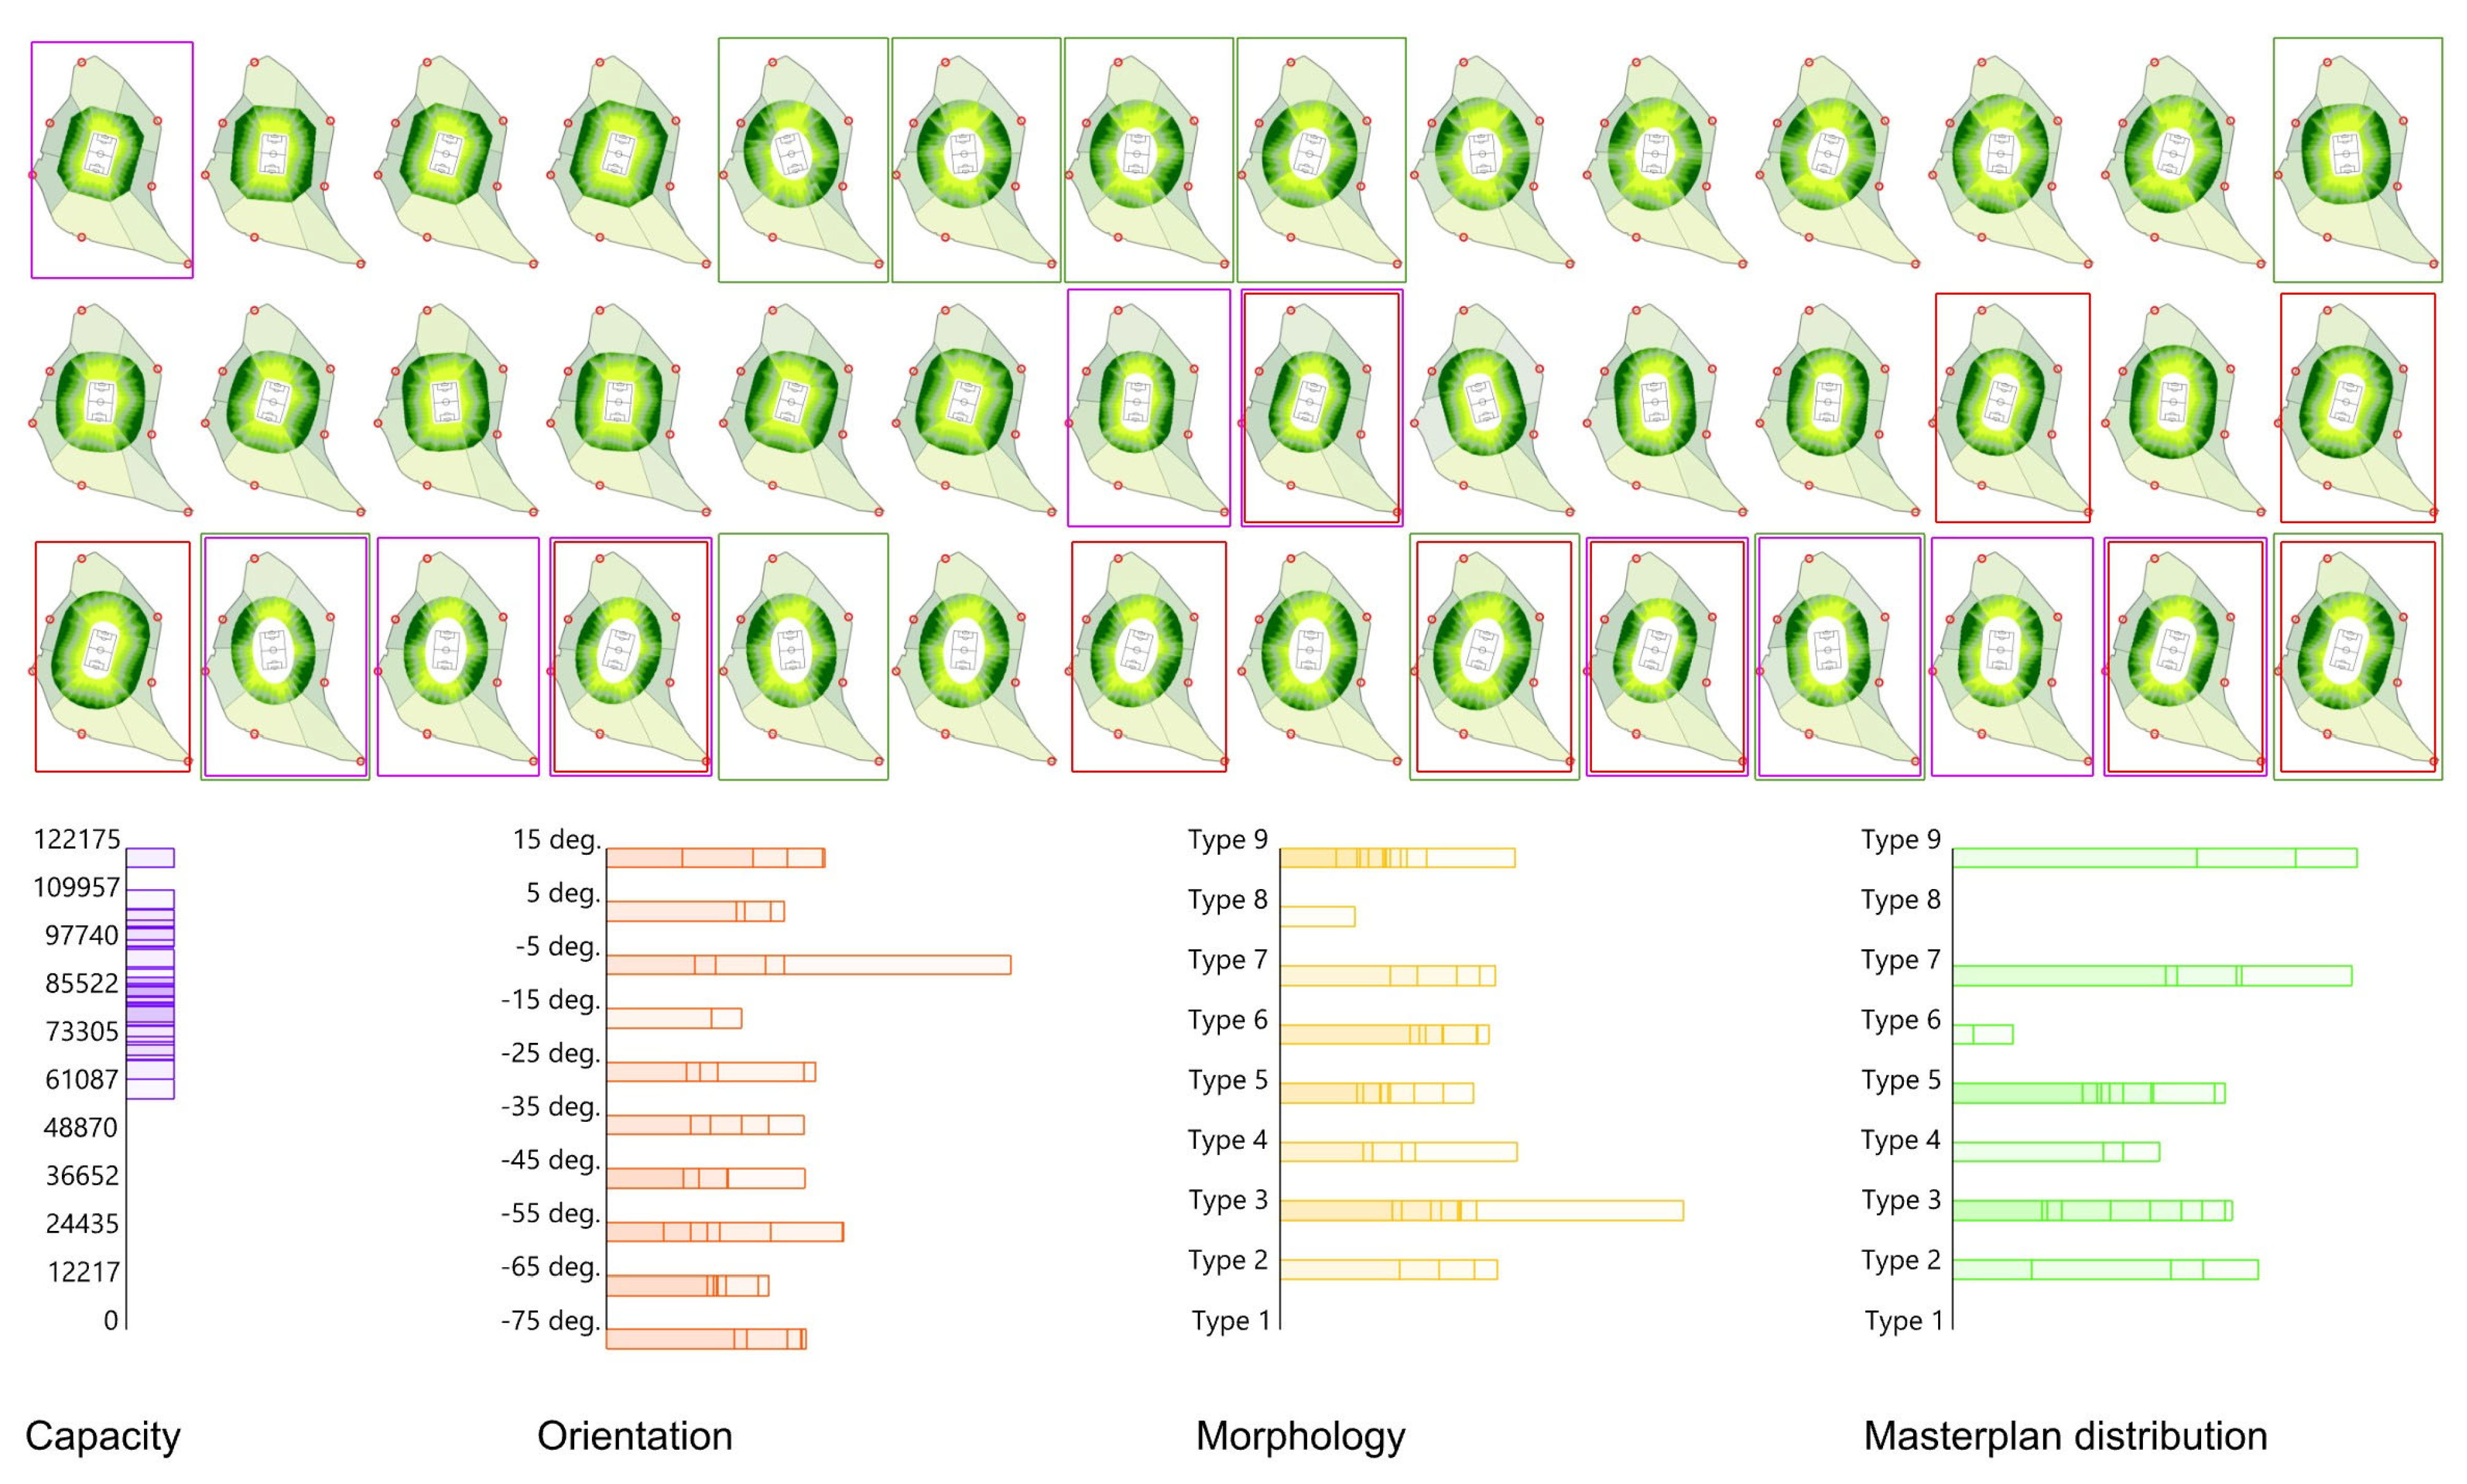
A practical example of the supervised workflow is the review of the London Stadium site (
Figure 4a). The case study was selected because it occupies a constrained site in East London with legacy access infrastructure, multiple perimeter conditions, and a high-capacity brief. The objective is to demonstrate whether the framework can rapidly identify viable site–capacity combinations and report how stadium form responds to access, orientation, and safety constraints. The simulation considers two additional entry points, and the venue was originally designed as an 80,000-seat Olympic stadium.
The case study examines the basic design suitability requirements within the existing park and site boundaries defined by the nearby rivers, using the supervised method.
Once the cases are processed, the framework reports a set of feasible ranges in terms of capacity, orientation, and a ranking of which morphologies perform best. Those are then validated by comparing them to a benchmark dataset of existing stadium designs (
Figure 5). The model also outputs the best-performing cases and highlights the best-performing solutions.
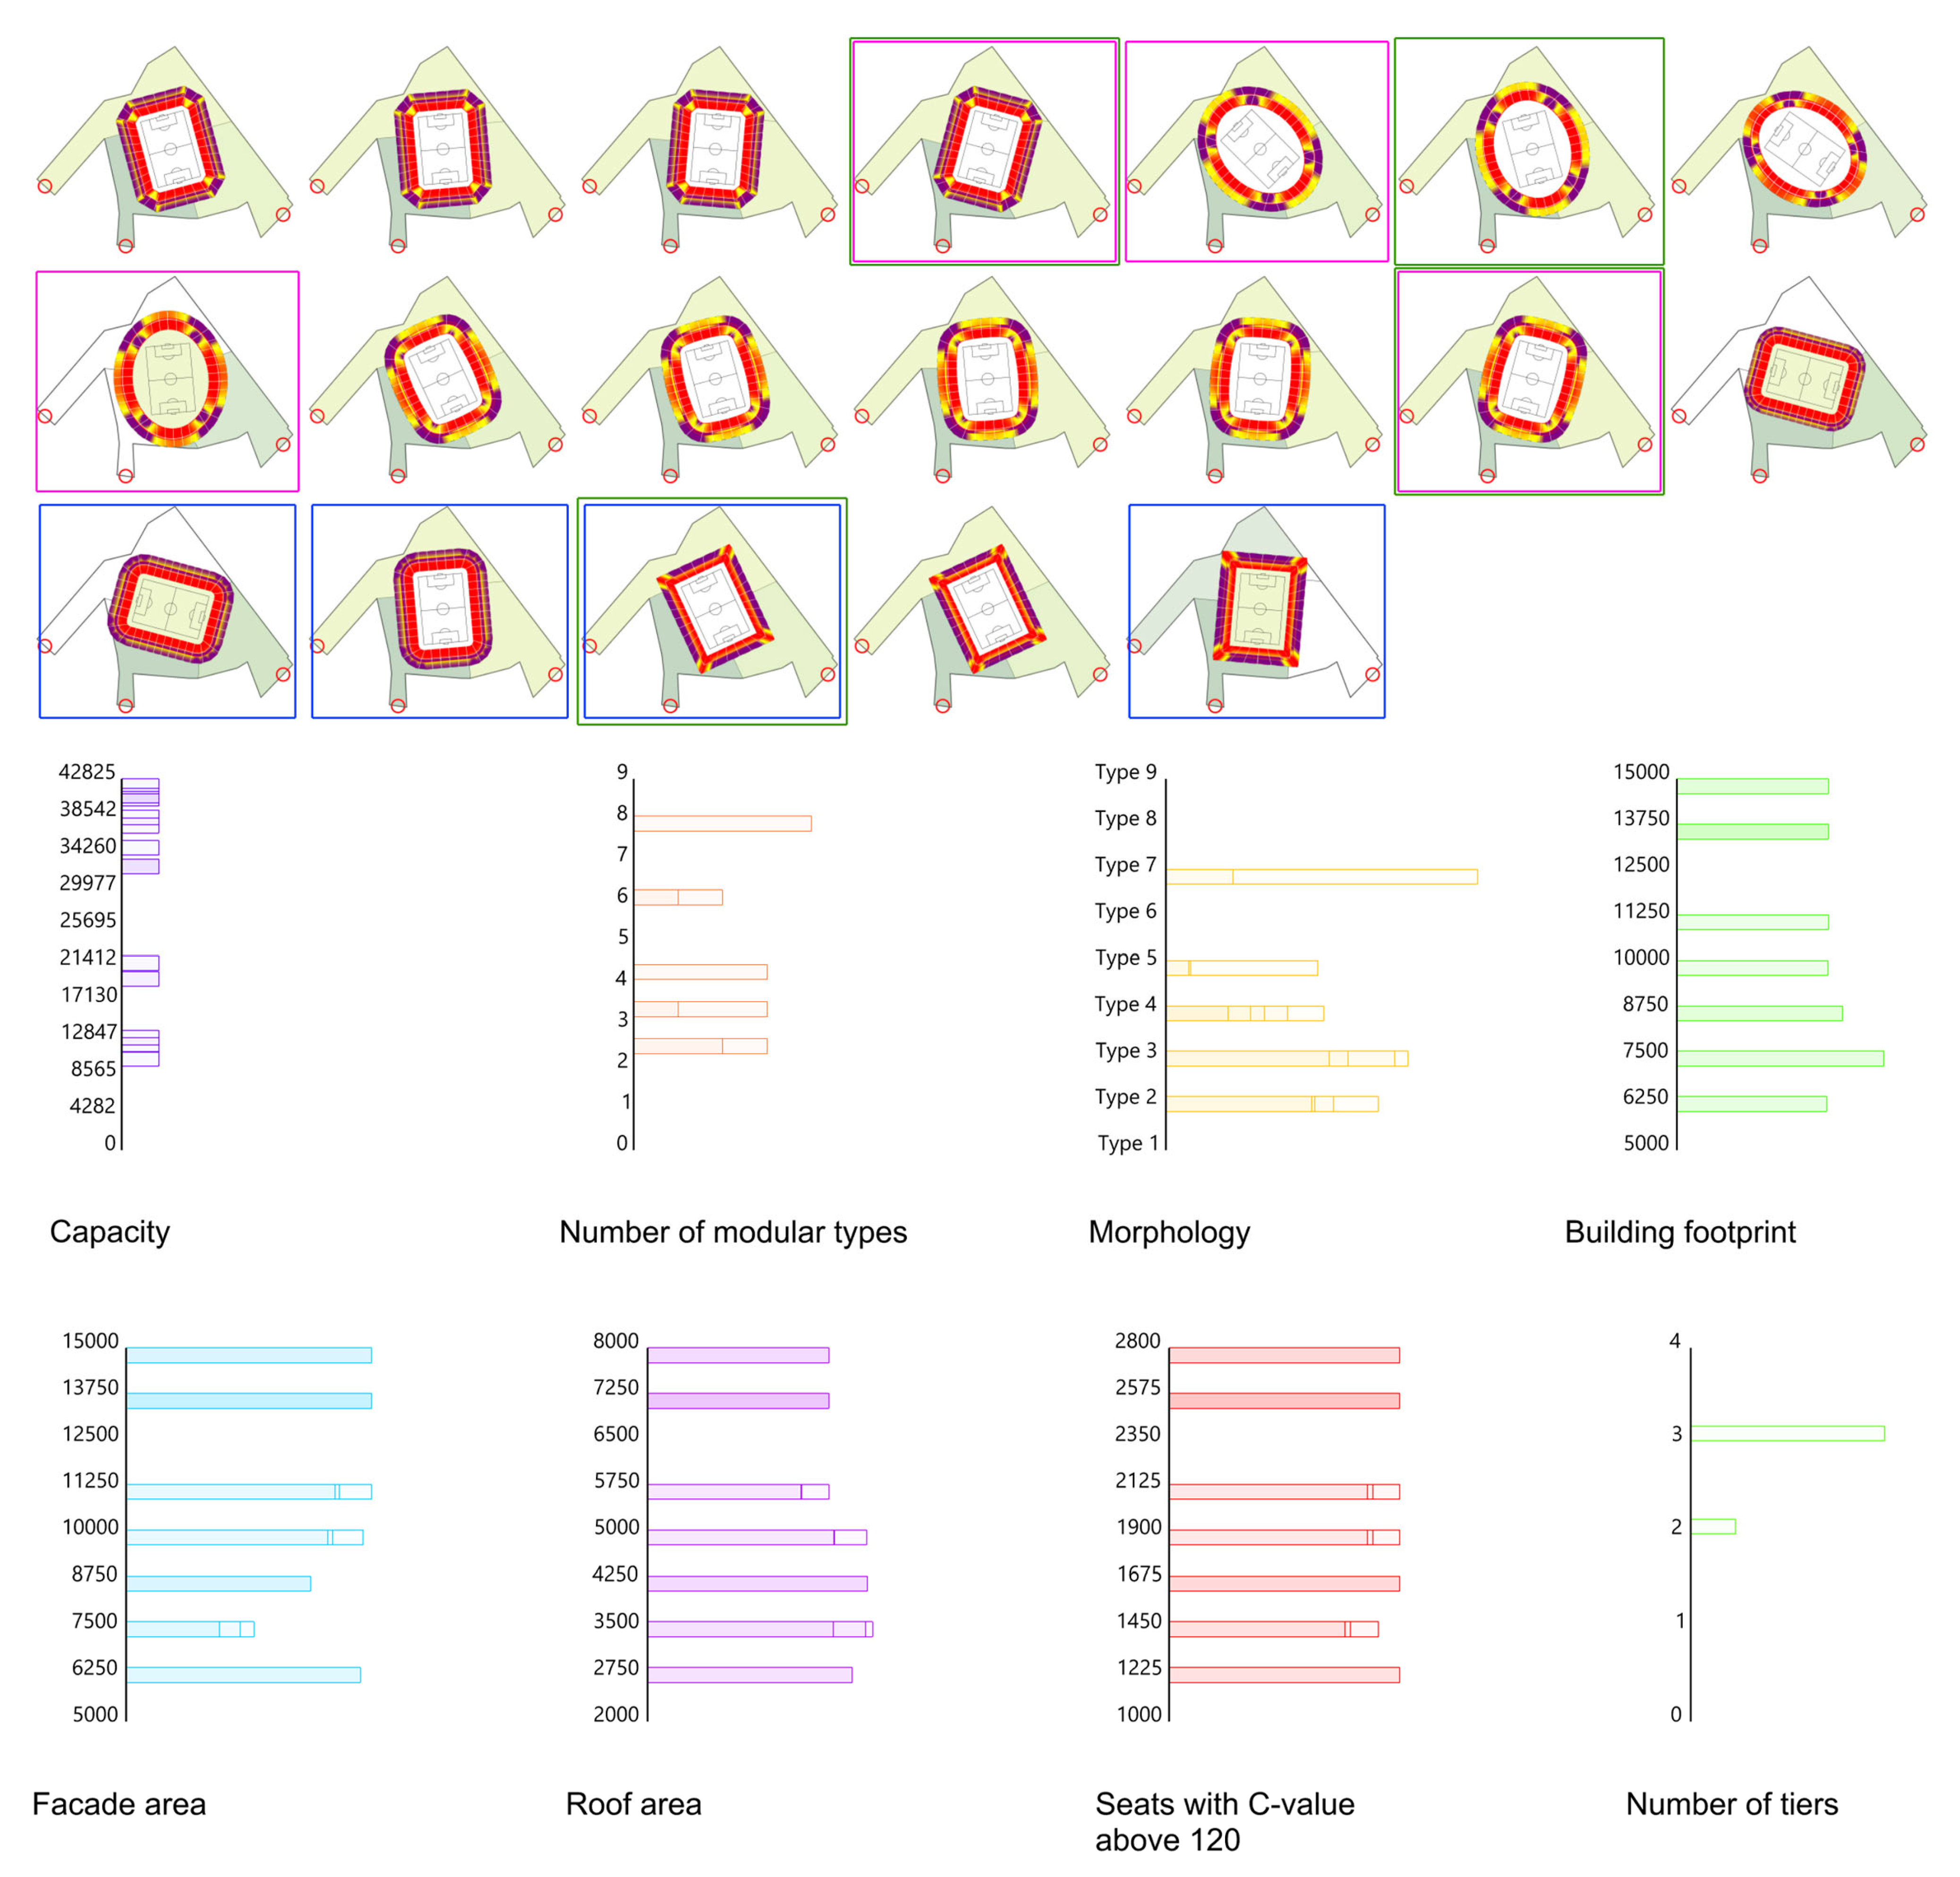
An example of data creation and analysis for Stage 1 is the theoretical redevelopment of the Stamford Bridge stadium in West London (
Figure 4b). The case study was selected because it represents a dense urban redevelopment scenario with strong historic capacity pressures and restrictive surrounding planning conditions. The objective is to demonstrate how the framework narrows multiple capacity, programme, and morphological scenarios into a smaller set of viable development briefs. Based on location, access points, capacity, and seating bowl arrangement data inputs, the model simulates a set of potential design solutions of 35,000 to 45,000 seats in a scenario where the centre of the playing field shifts to the west and the field of play is lowered below ground level to satisfy existing planning conditions.
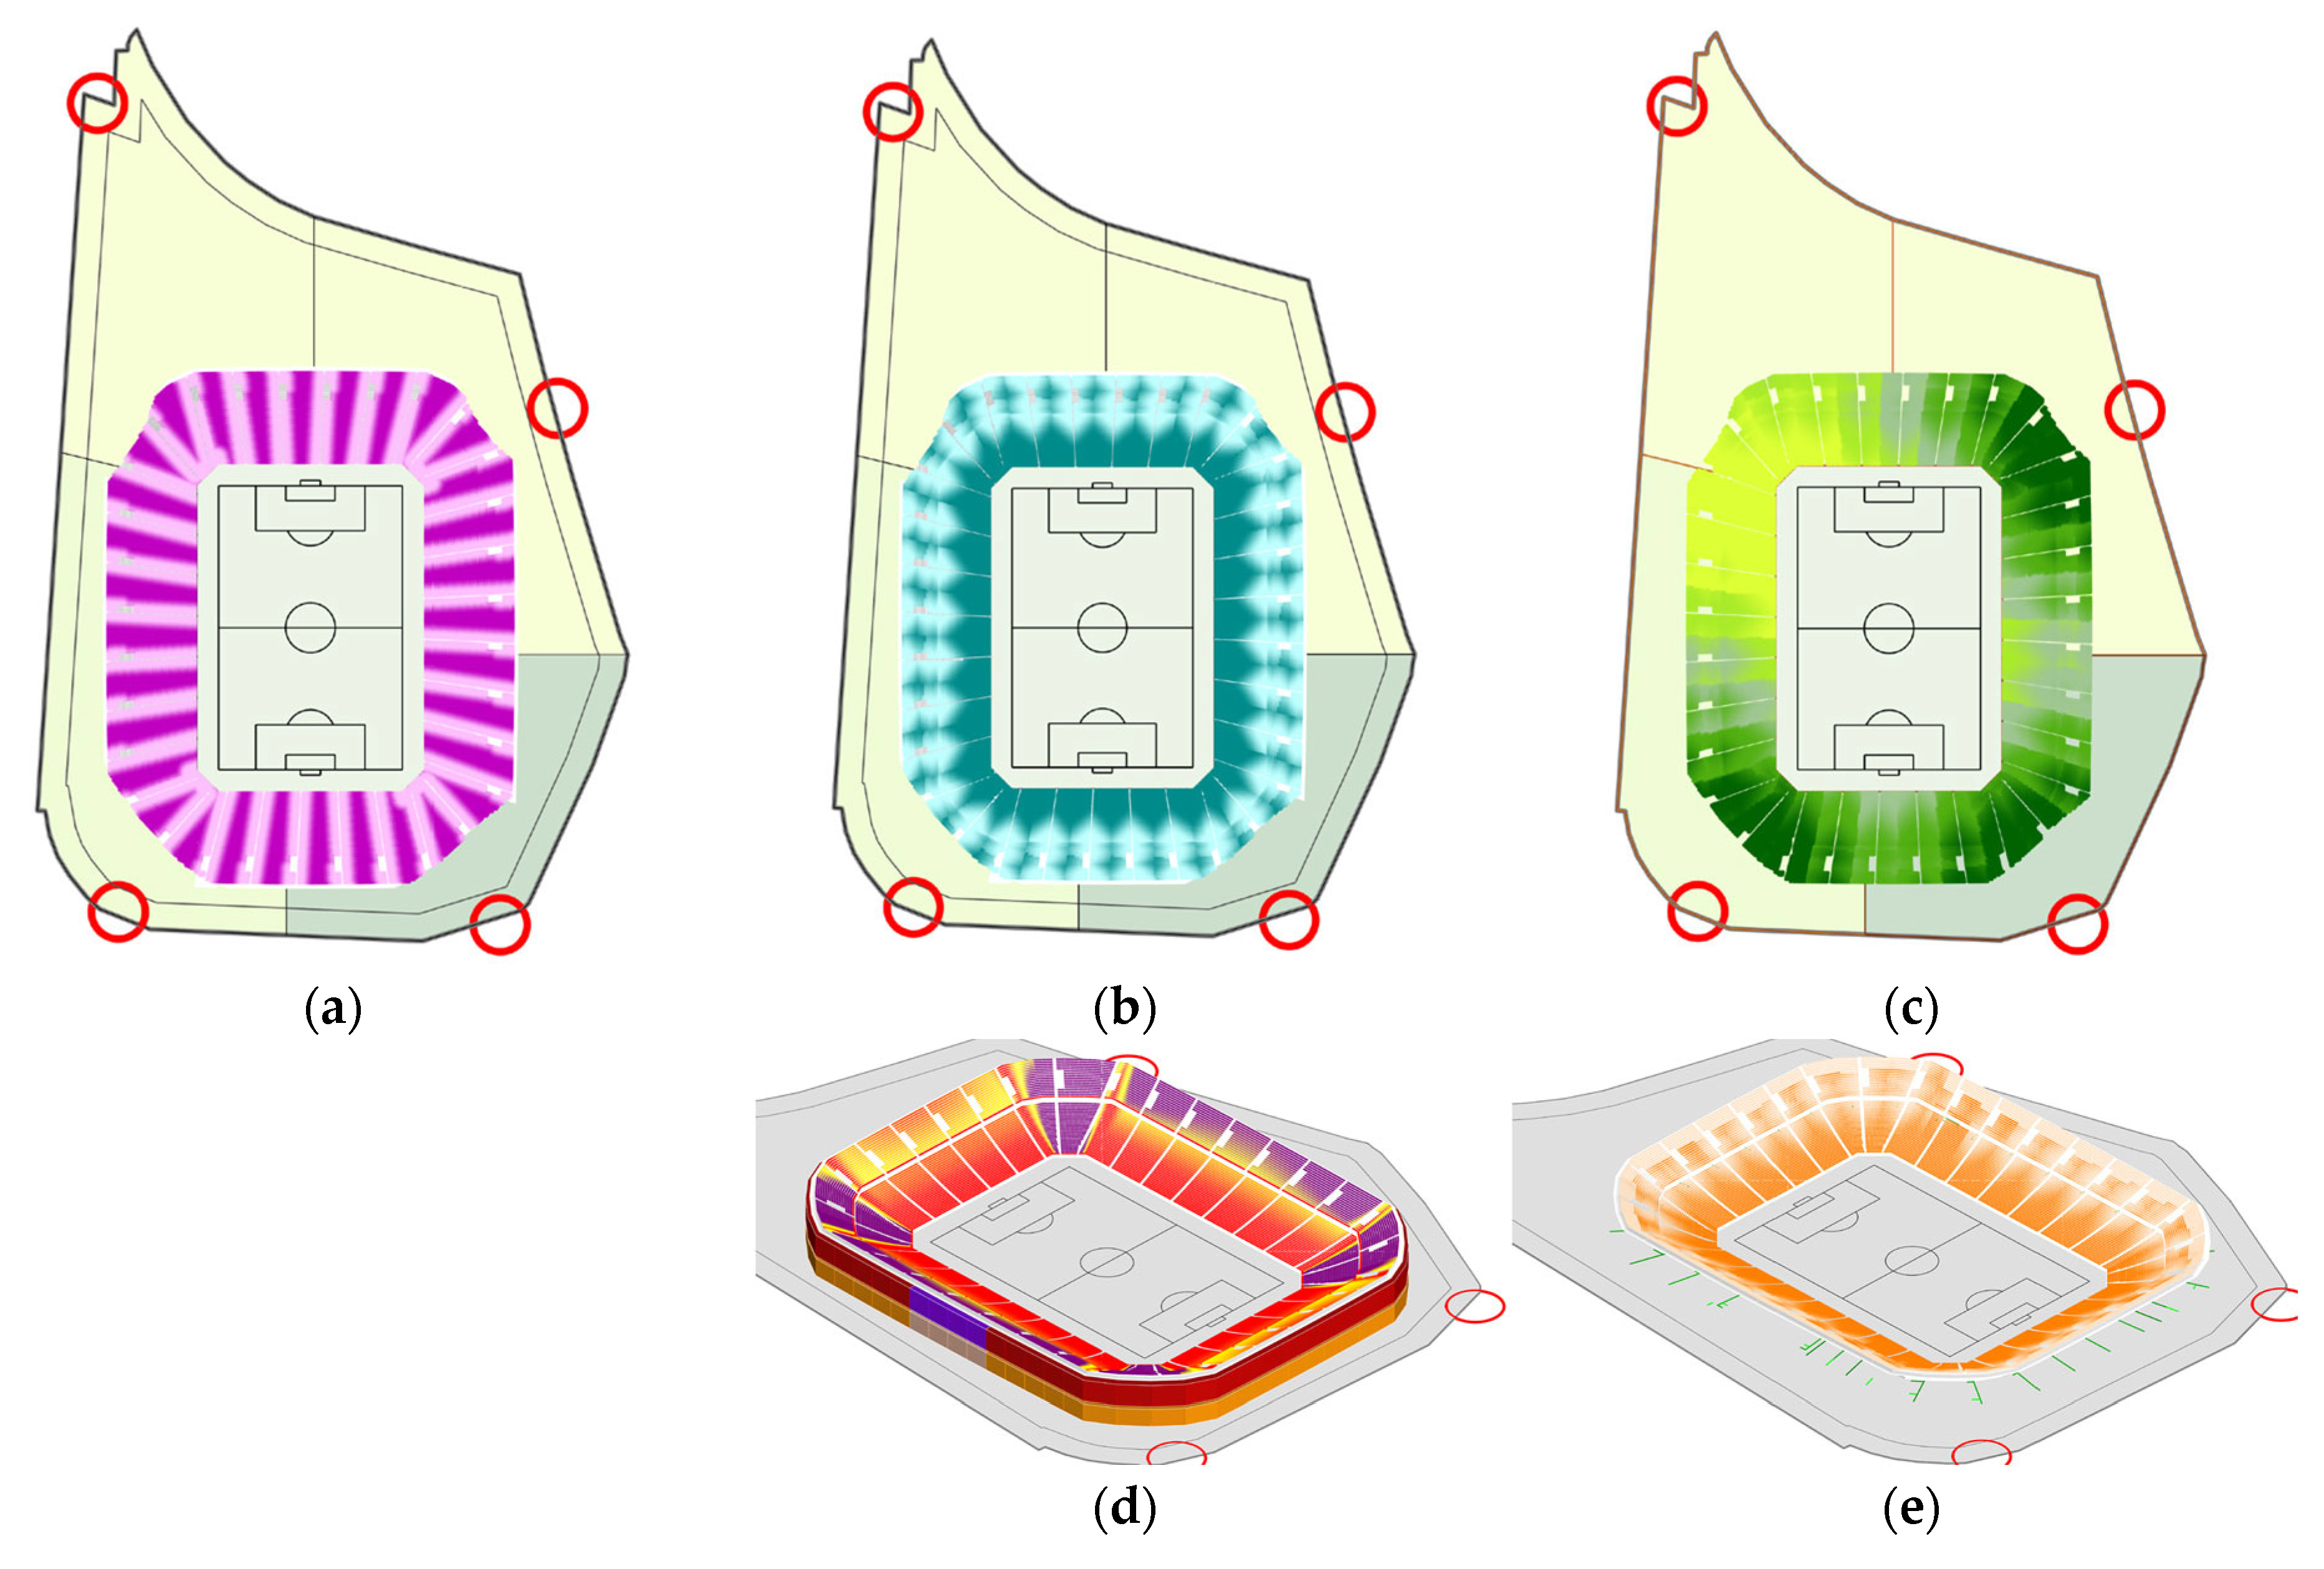
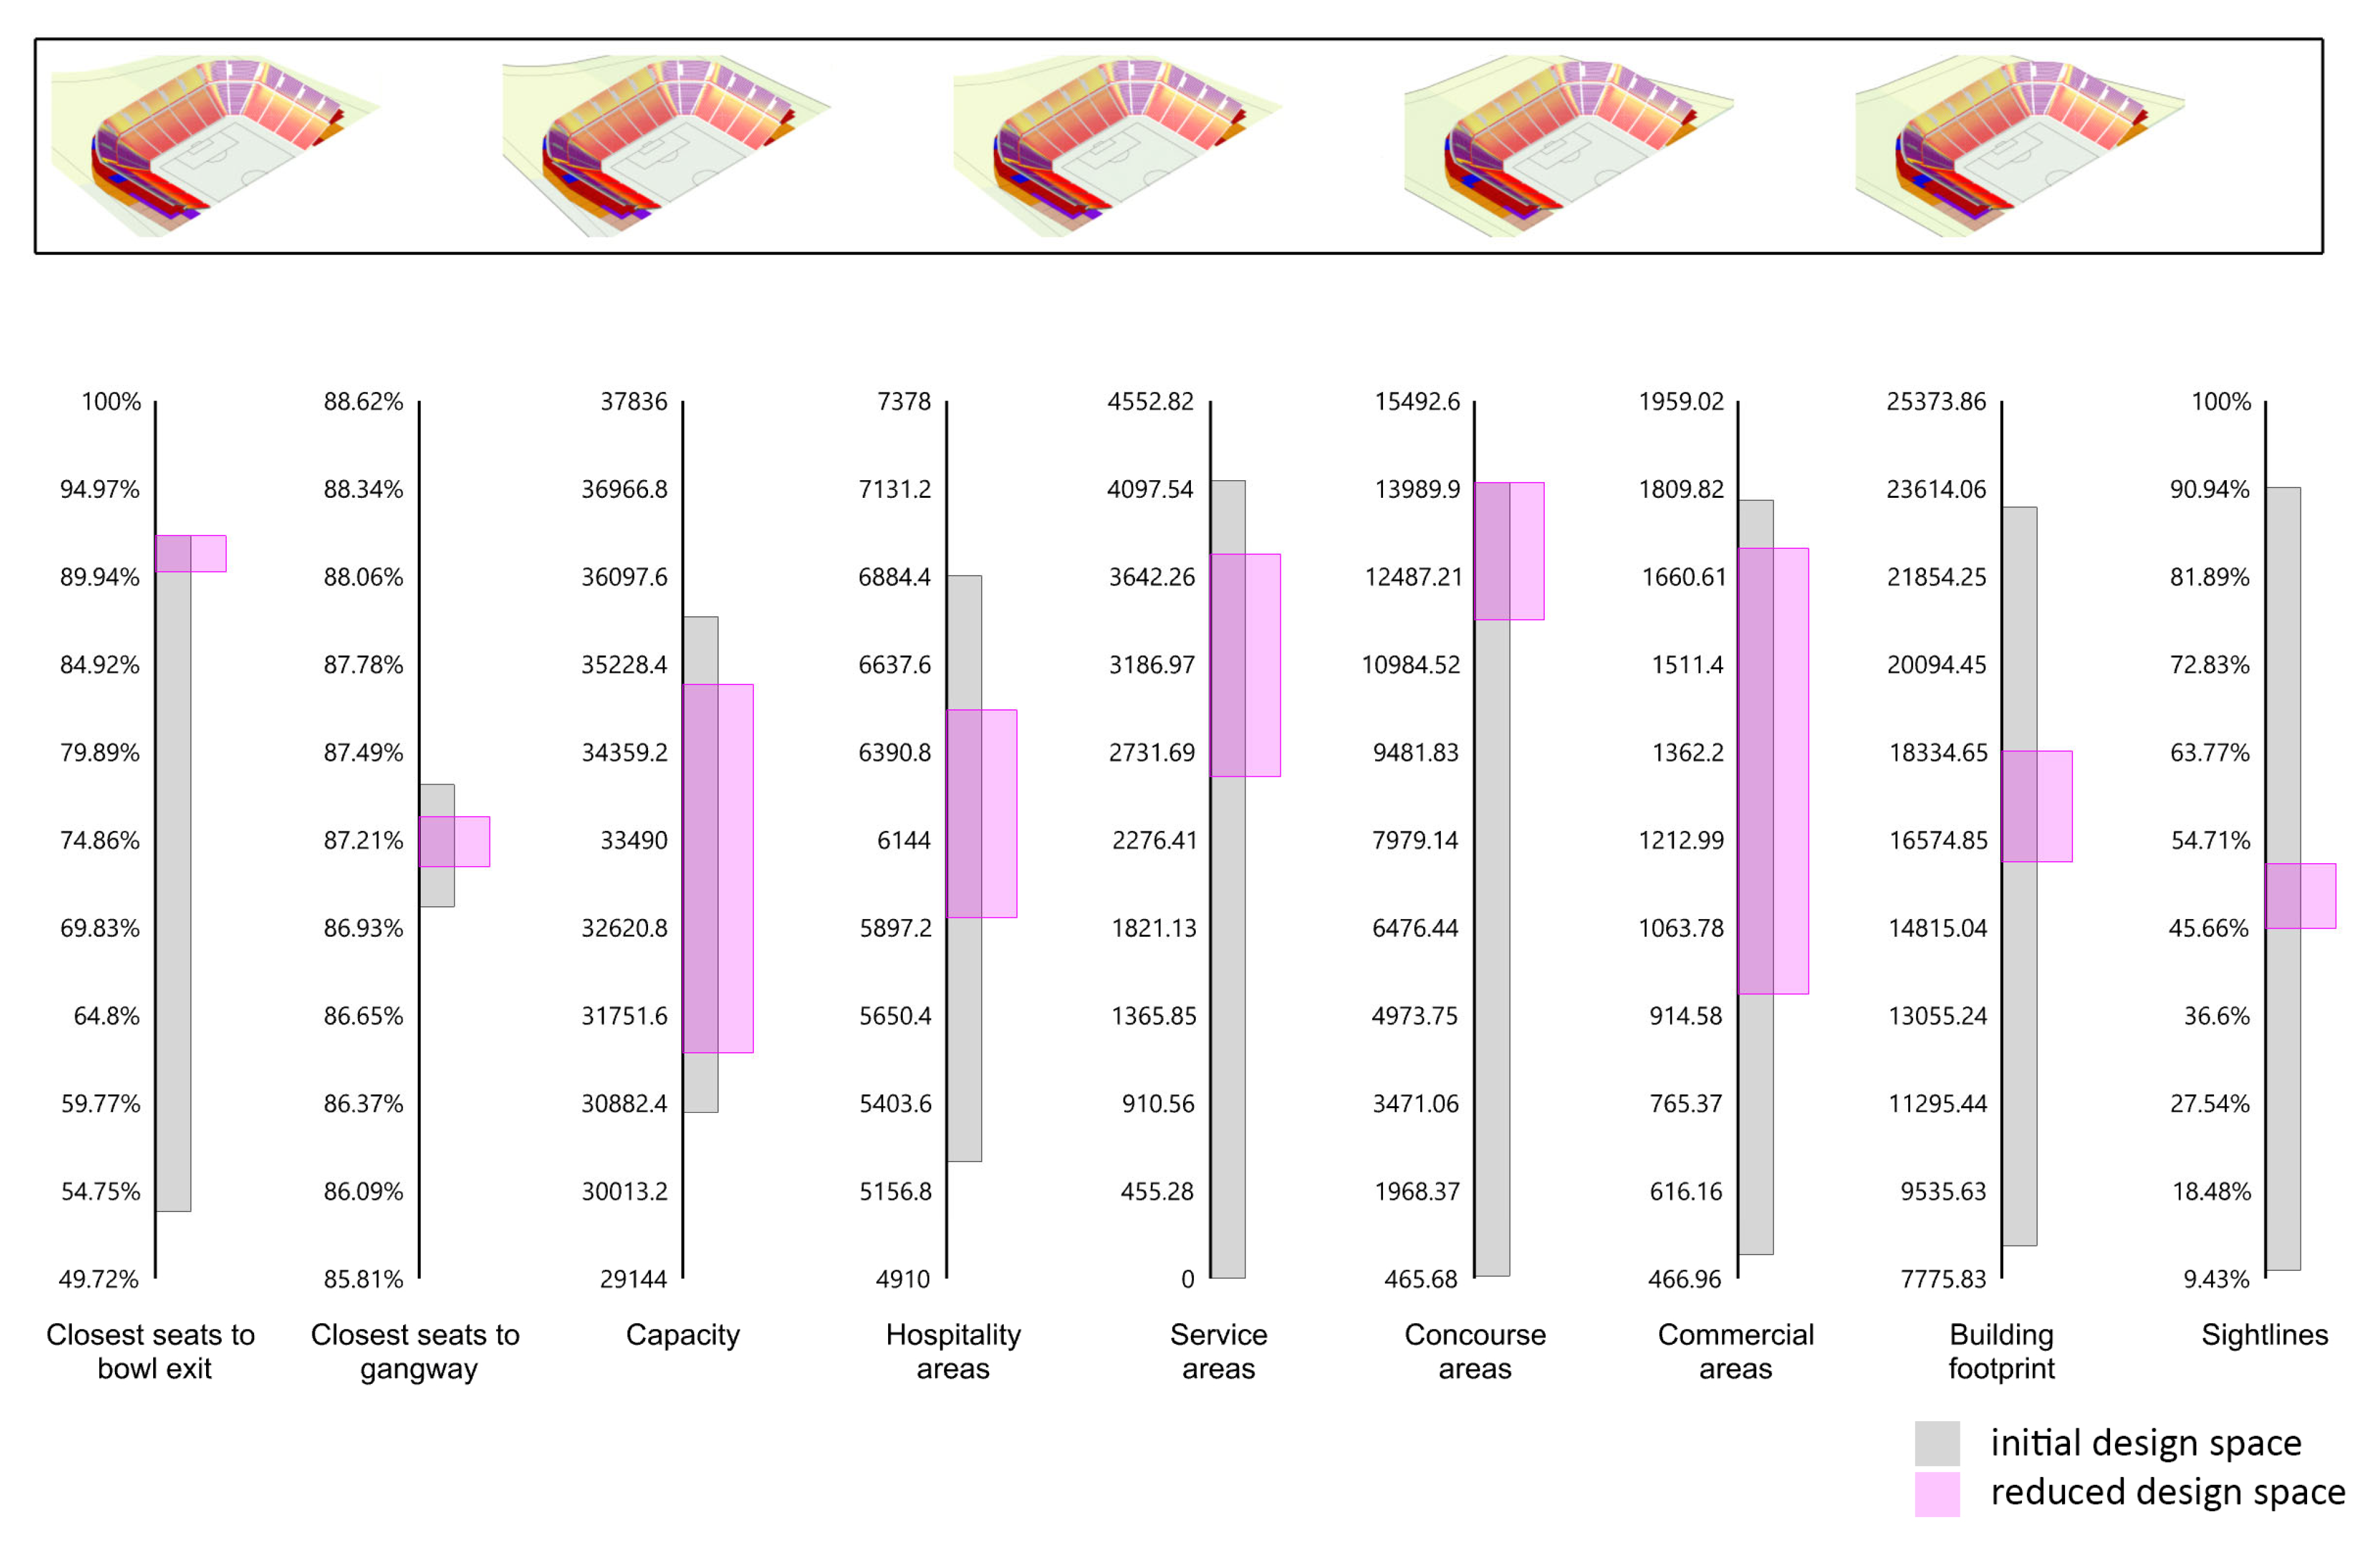
An example of the semi-supervised workflow is the theoretical redevelopment of St Mary’s Stadium in Southampton, currently a 32,384-seat stadium designed by Miller Partnership in the early 2000s. The case study was selected because its clear bowl geometry and medium capacity make it suitable for controlled concept exploration across multiple morphological and organisational variations. The objective is to demonstrate how clustering and designer-guided labelling can reveal alternative concept directions beyond traditional precedent-based optioneering. The site is accessible from the north, and the study explores a new design that opens up access routes at two points through the industrial zone to the south (
Figure 6).
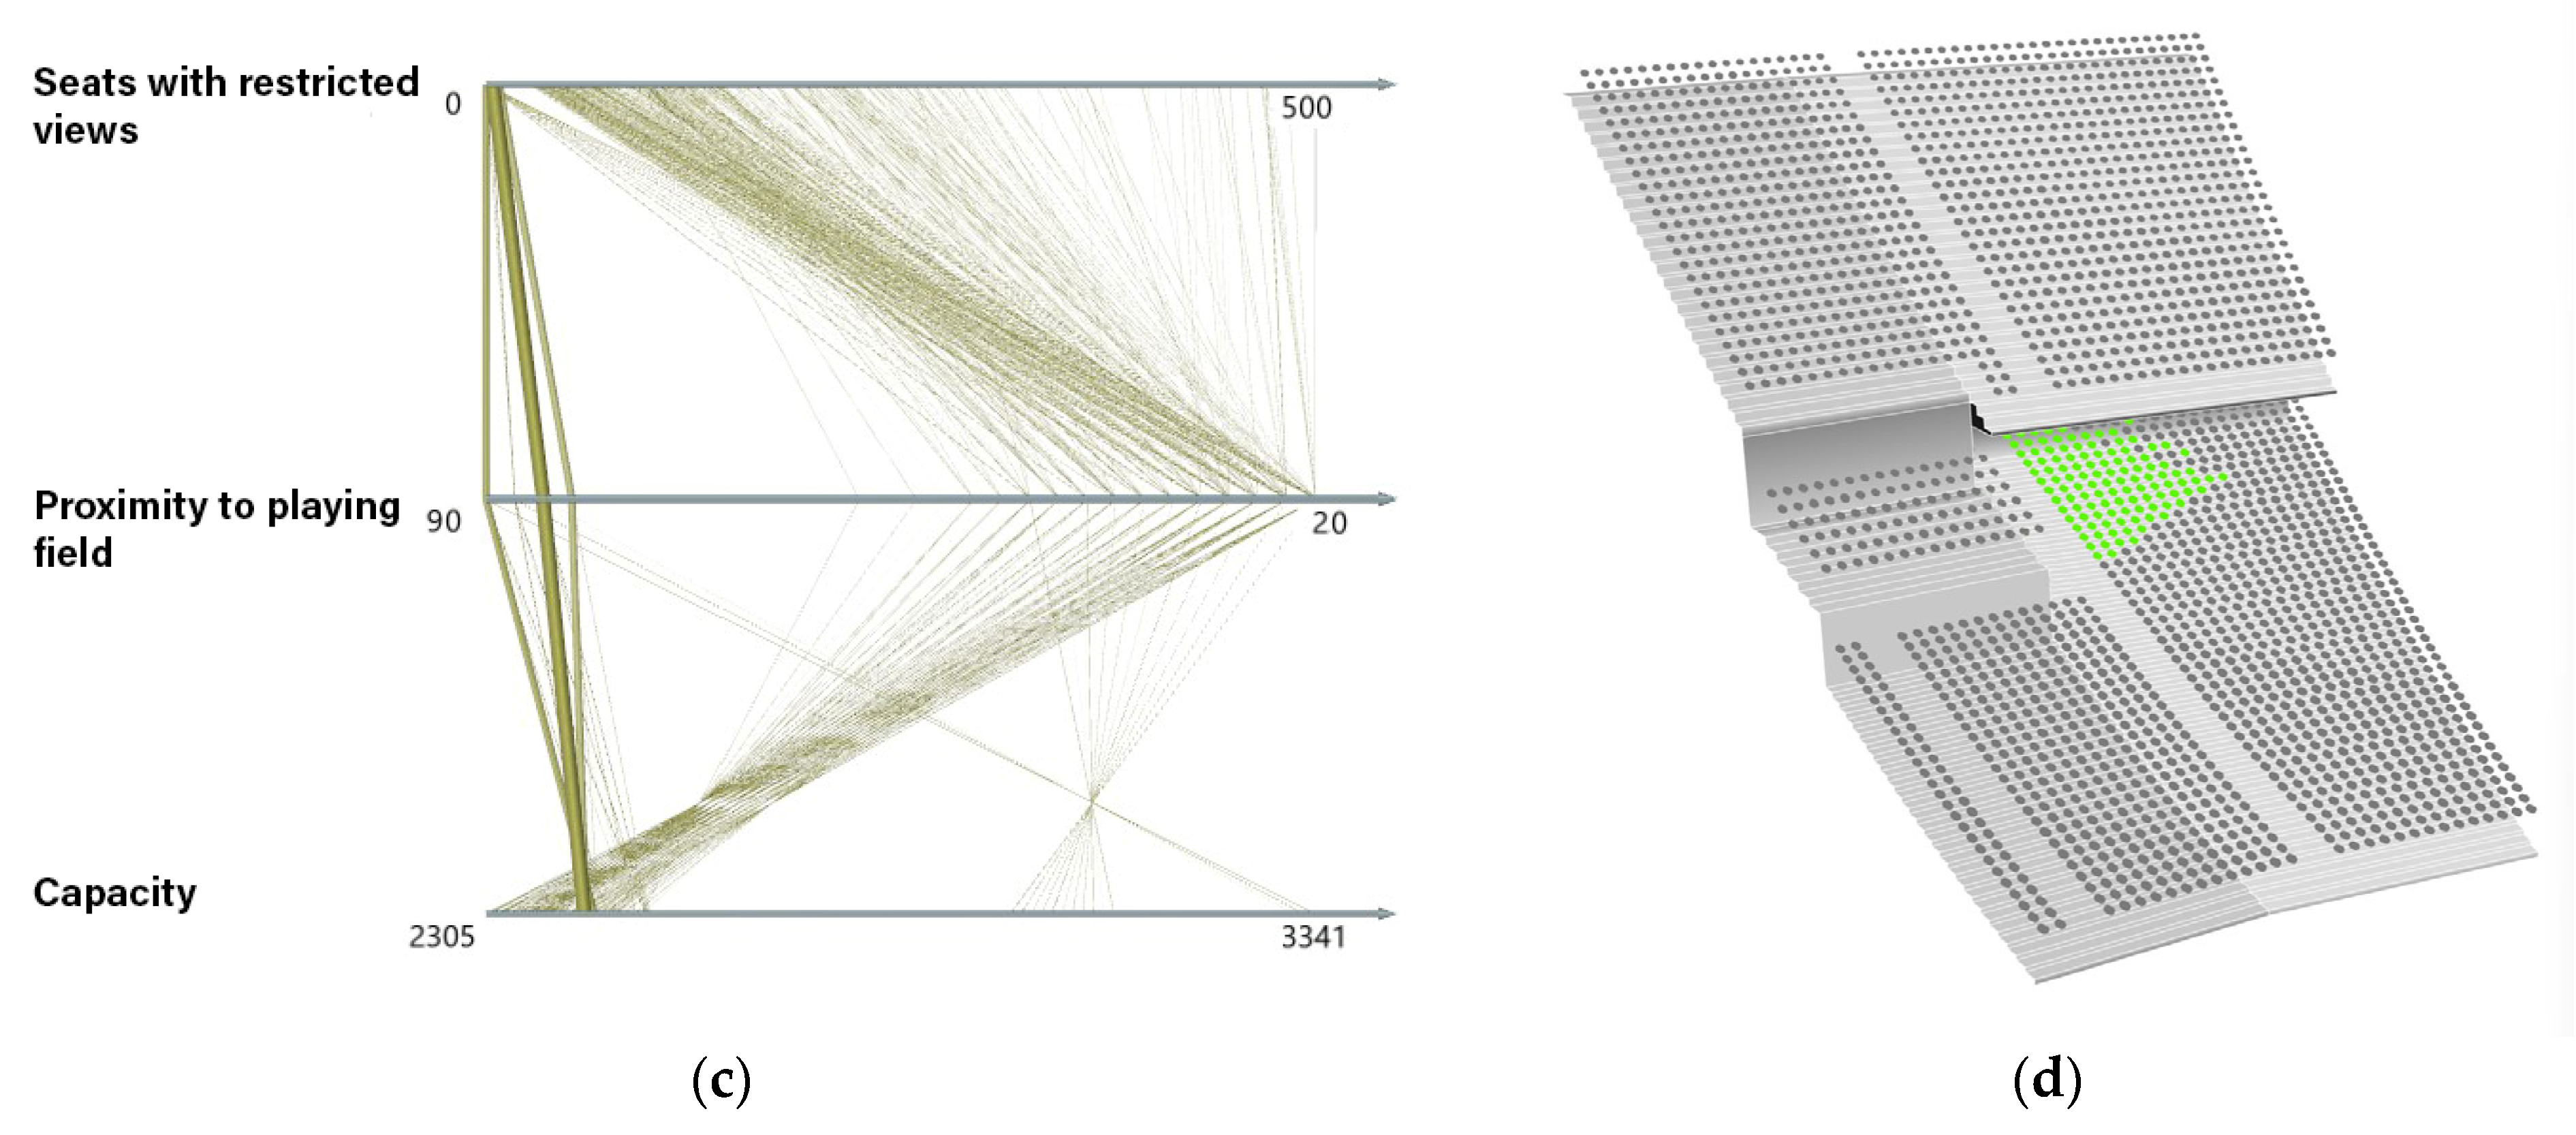
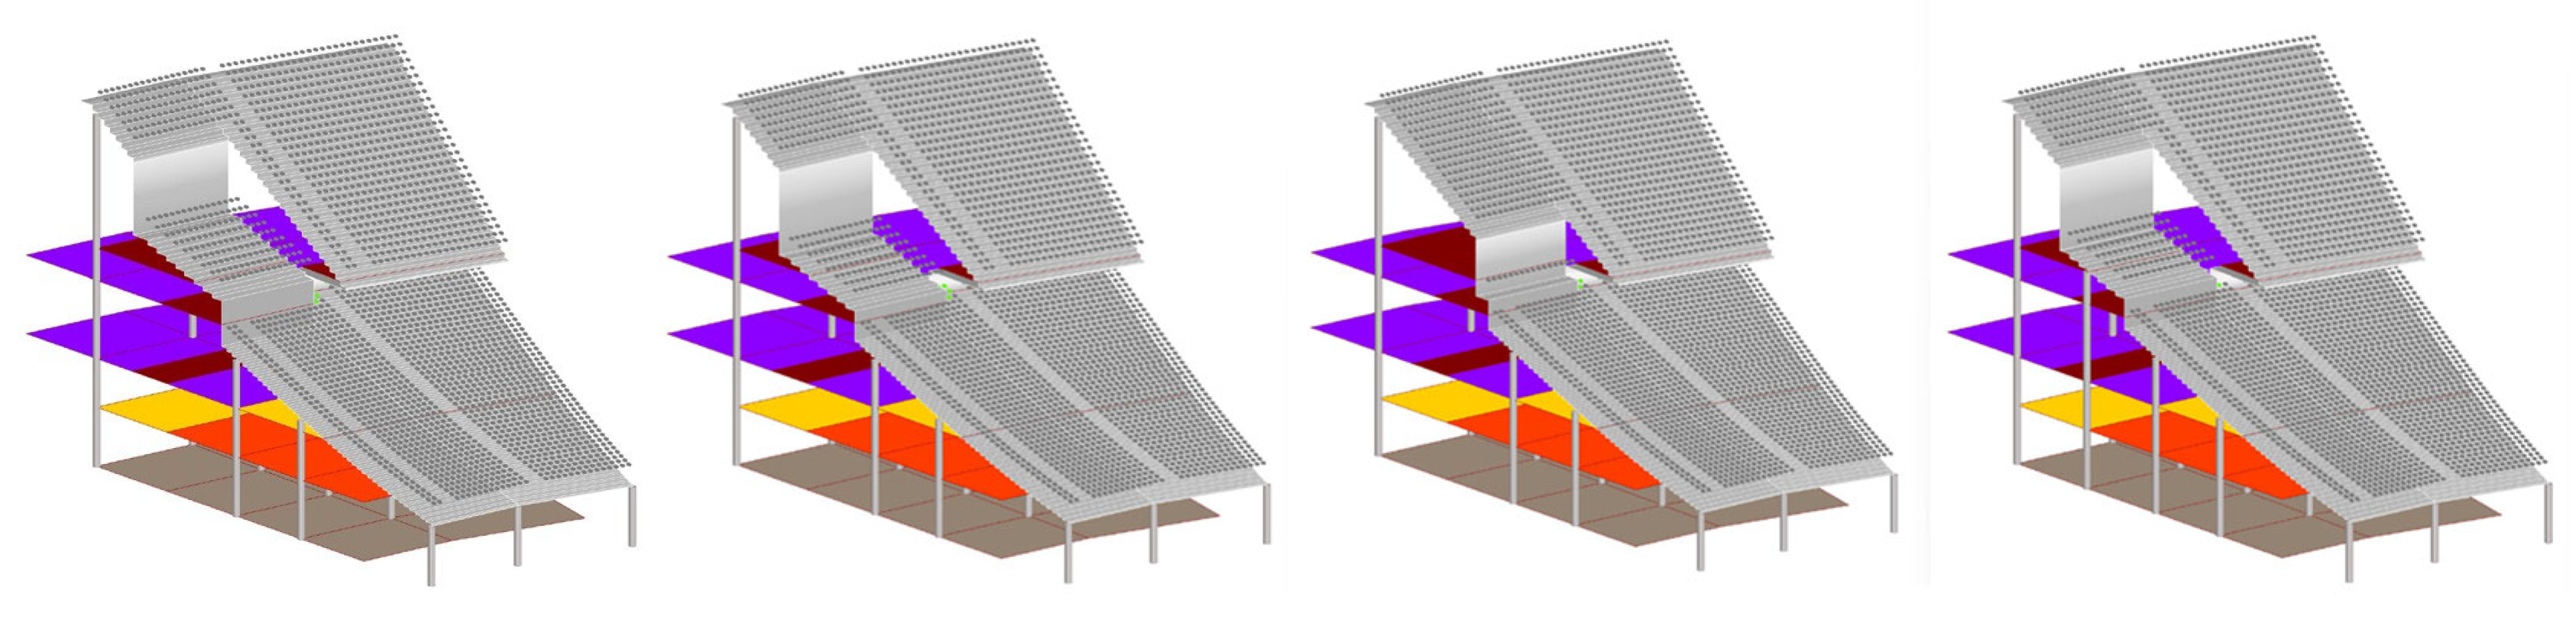
An example of the evolutionary optimisation pipeline is the theoretical revision of the three-tier design for the Kyiv Olympic Stadium after the 2011 refurbishment by gmp (
Figure 7d). The case study was selected because of its complex large-capacity geometry and seats with restricted views due to its layered historical development. The objective is to demonstrate how evolutionary search can refine developed layouts by balancing competing objectives. The design of the main stand includes a hospitality tier, which interrupts the view of 155 seats on each side. The optimisation aims to decrease the number of seats with restricted views by changing the size and location of the hospitality tier (
Table 3) without altering the adjoining stand. Within those constraints, the optimiser has three objectives:
Maximise the proximity of the hospitality tier to the playing field, measured as the row number at which the tier starts.
Objectives 2 and 3 conflict with objective 1 because increasing the capacity of the stand and the proximity of the hospitality tier to the playing field increases the number of seats with restricted views. As a result, the MOO explores the Pareto front of compromise solutions instead of identifying a single optimum solution.
The optimisation process is fully automated using the Octopus tool in Grasshopper. The output of the analysis is a set of solutions and the identification of input ranges for the parametric model. The inputs for this process relate only to the features specific to defining a bay configuration that can later be adapted to the overall sector arrangement.
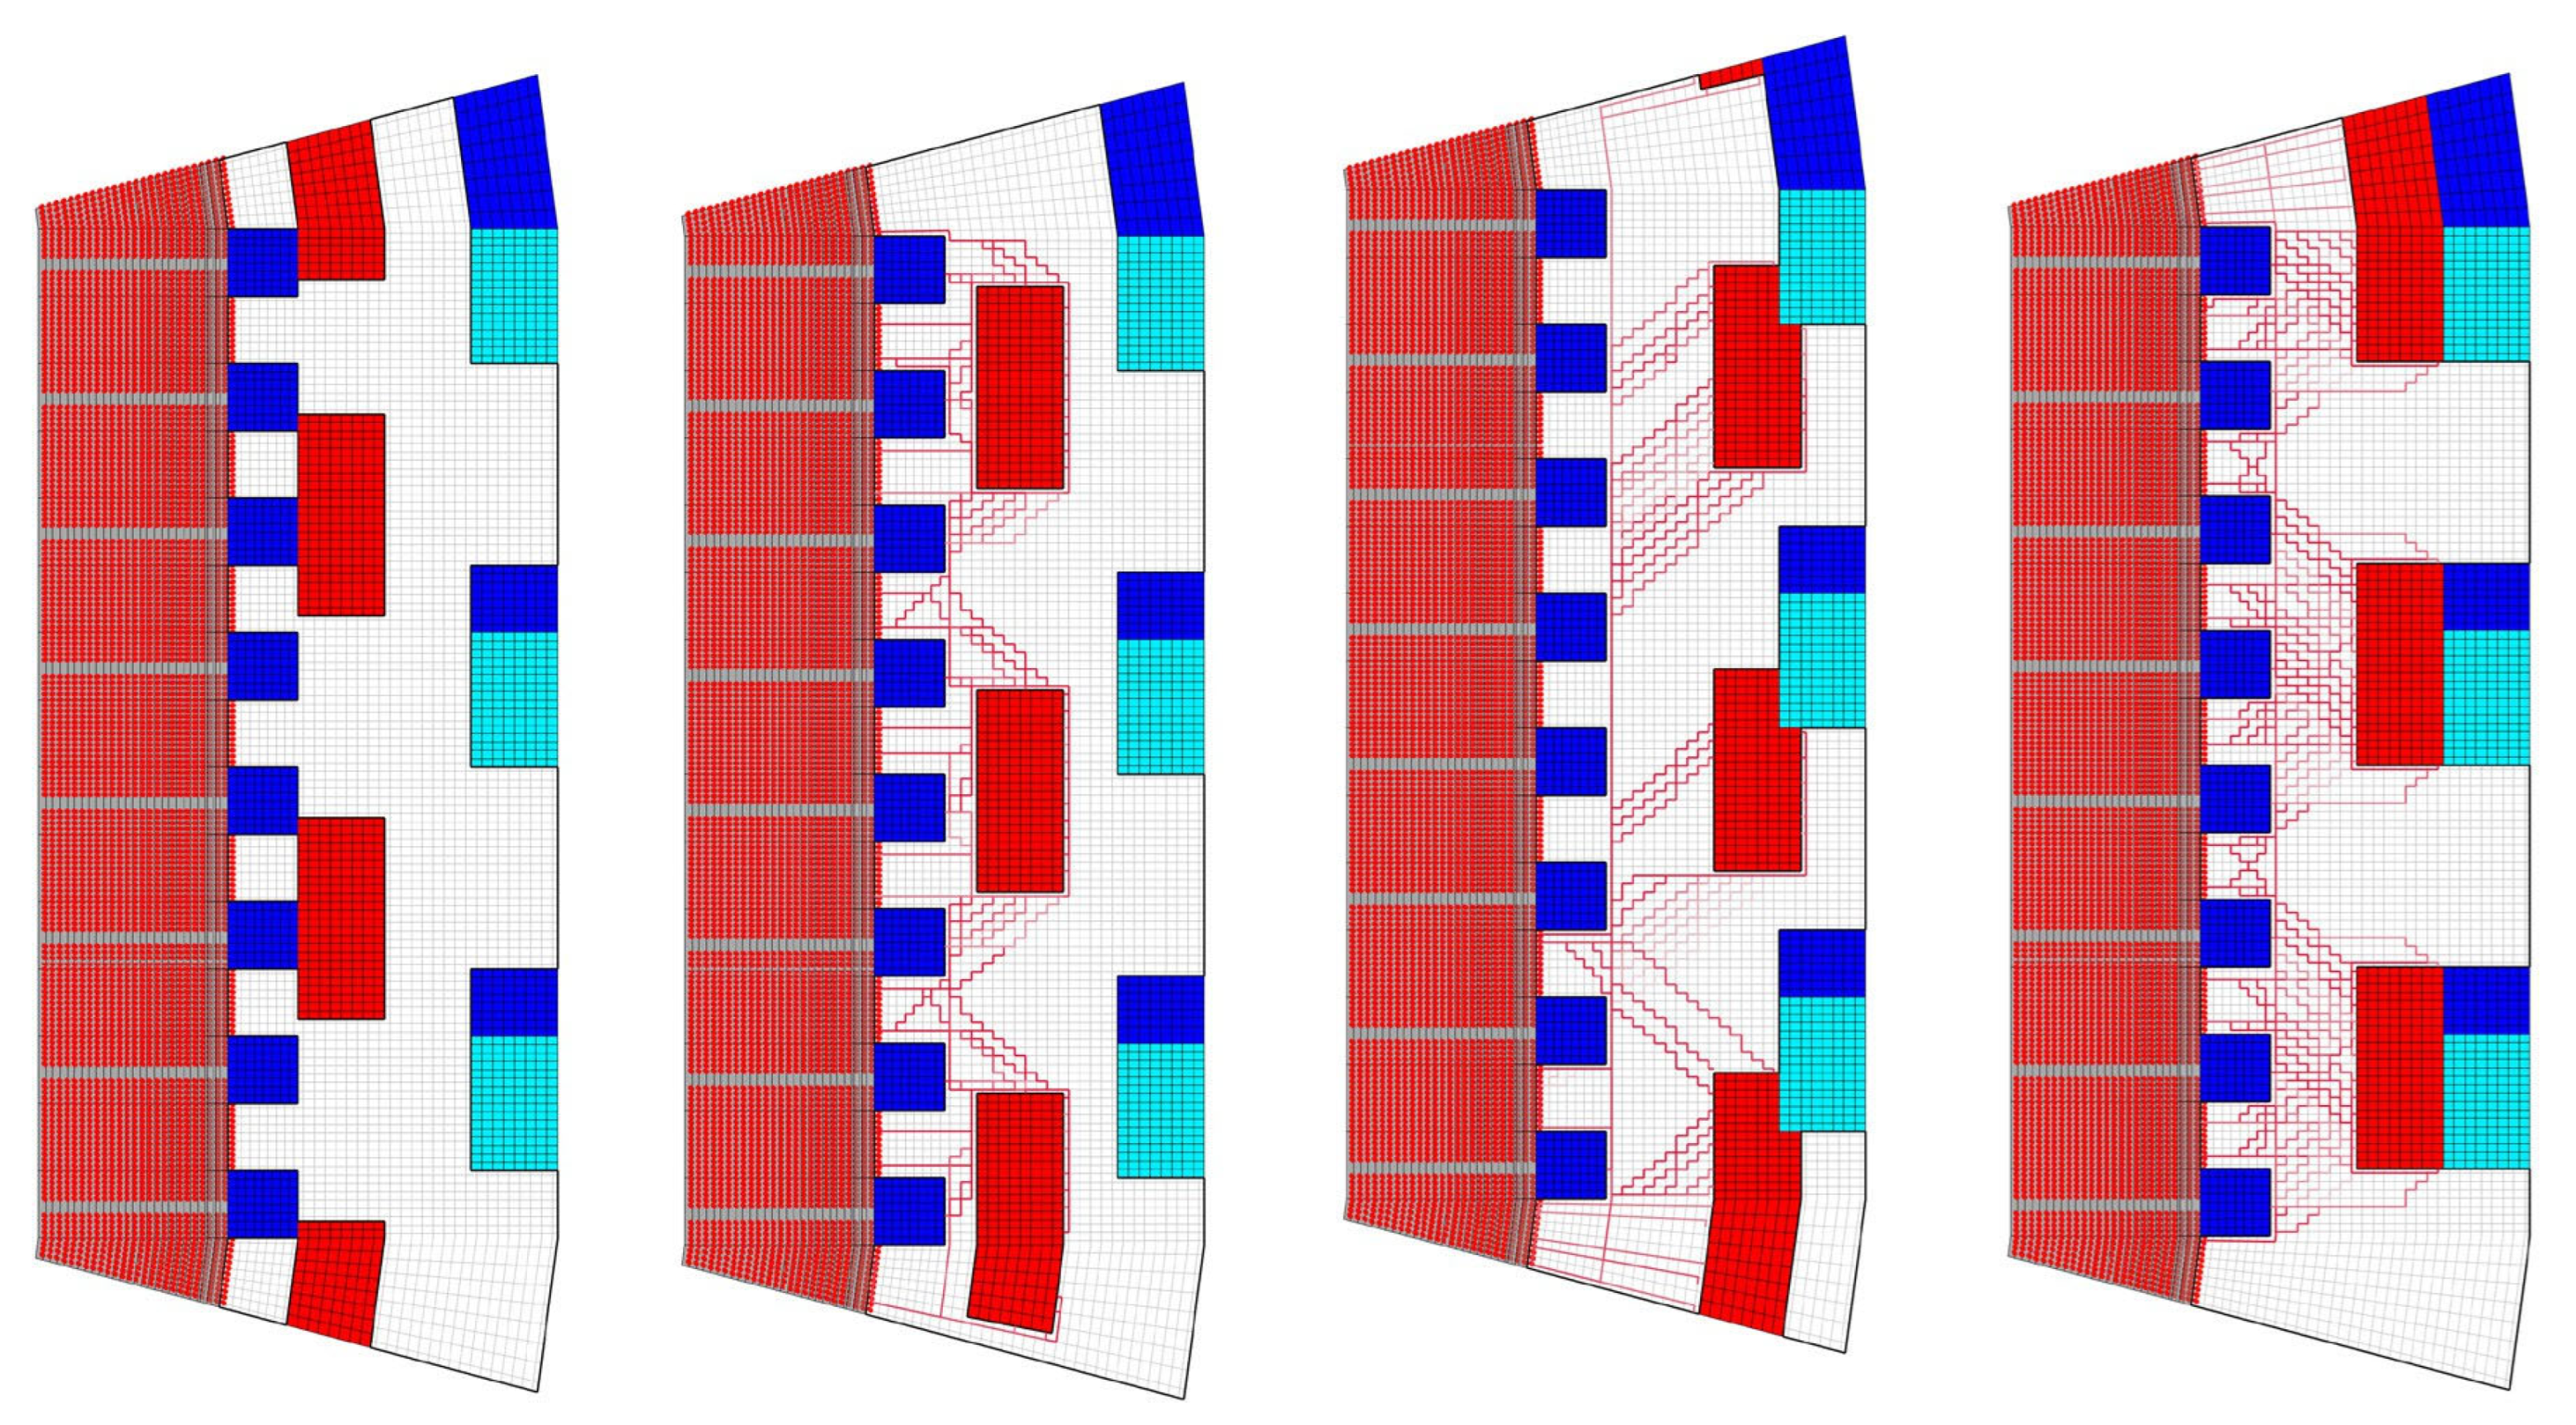
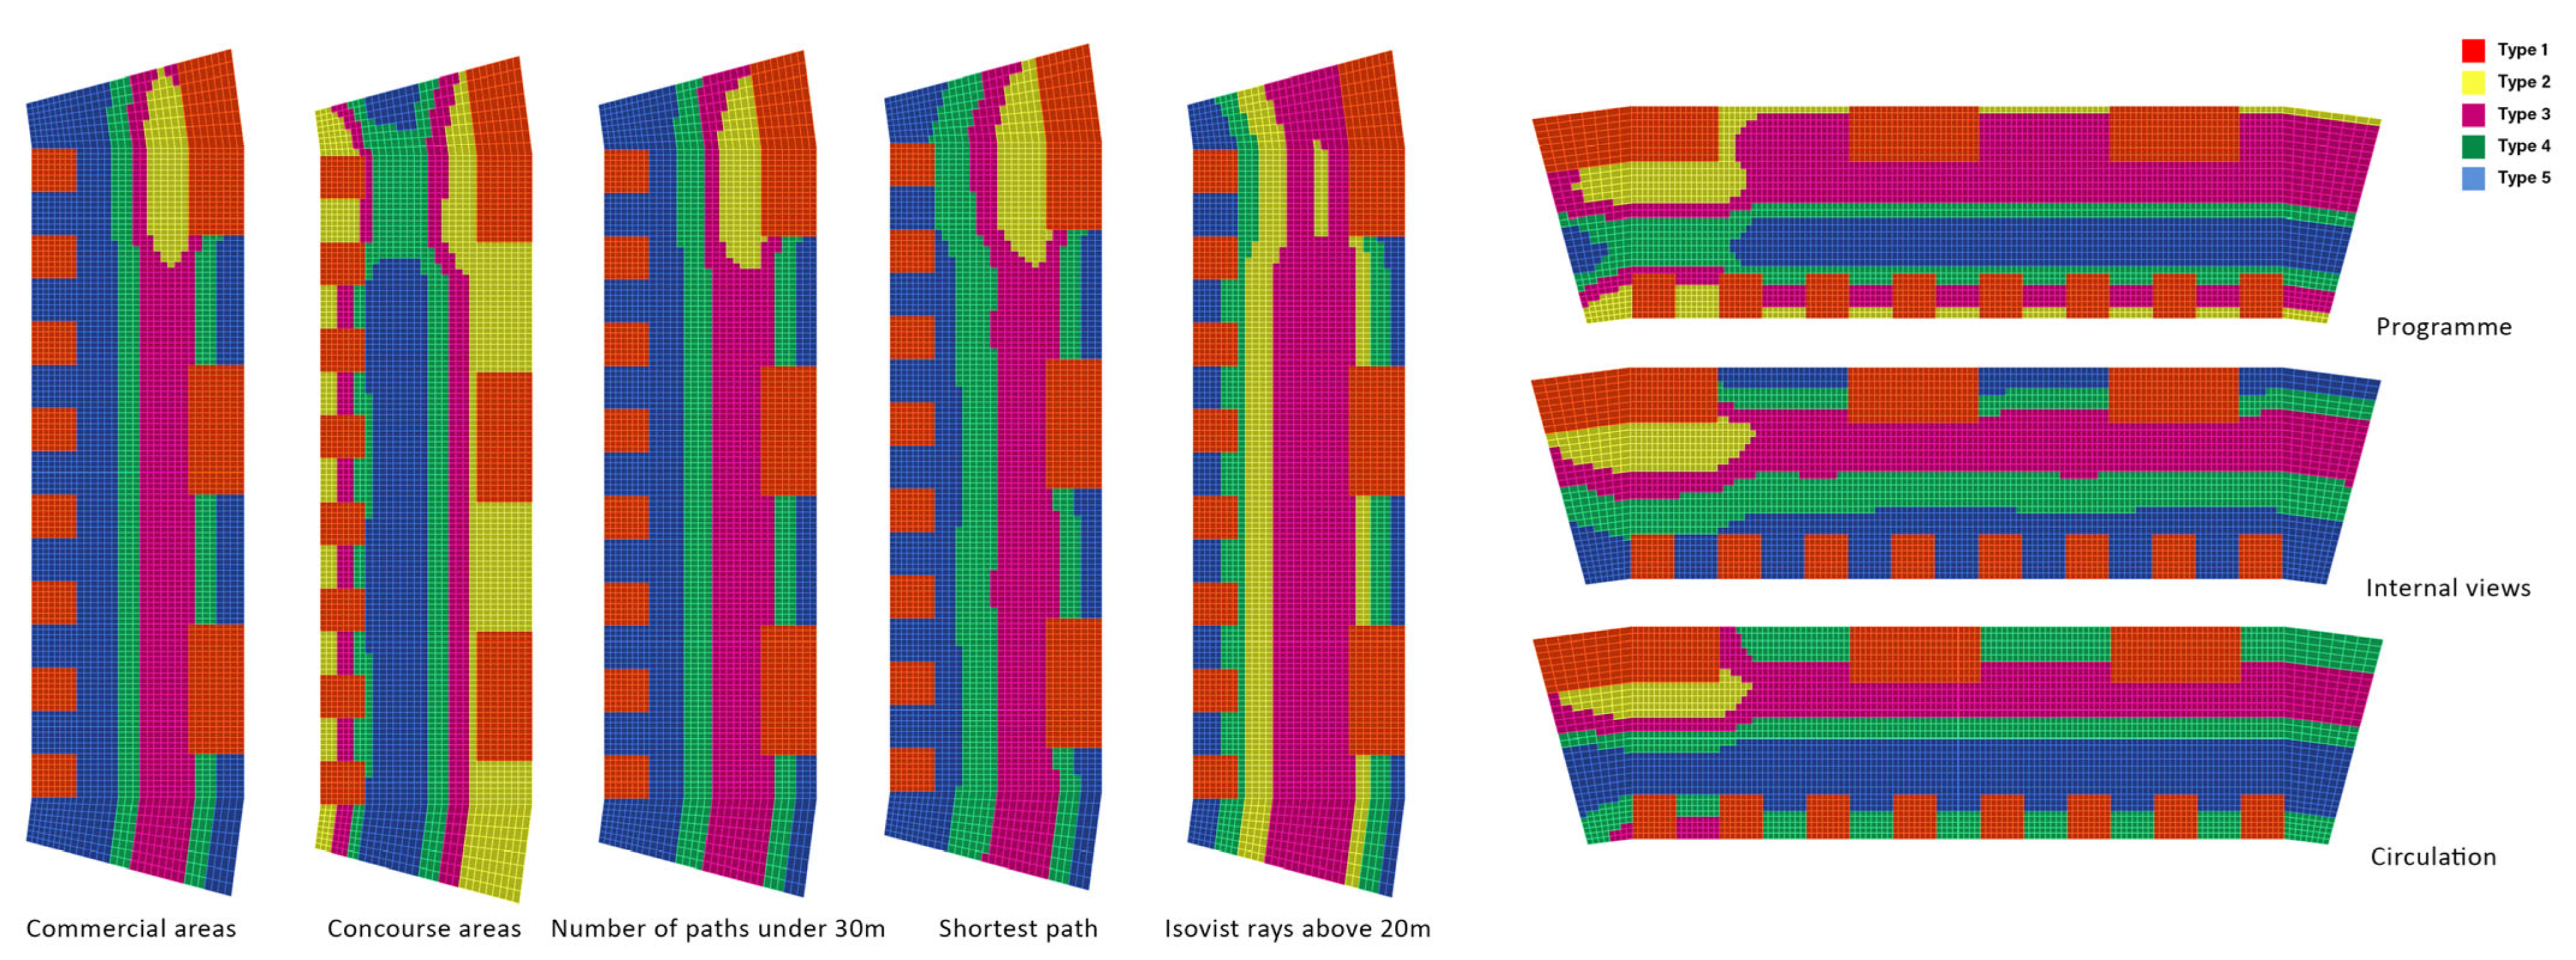
The example used for ML-supplemented Stage 3 layout analysis is the main concourse in the east stand of the Allianz Arena, Munich. This stadium is one of the best examples of early-twenty-first-century designs, but even in this case it is possible to identify zones that could benefit from revision. The analysis starts with the current layout and a set of potential design variations generated by moving the commercial unit distribution pattern across the concourse (
Figure 8). For the performance assessment and optimisation process to begin, the inputs are the location of the concourse, a numerical representation of the internal layout, and ranges for the locations of the vomitories and seating bowl exits.
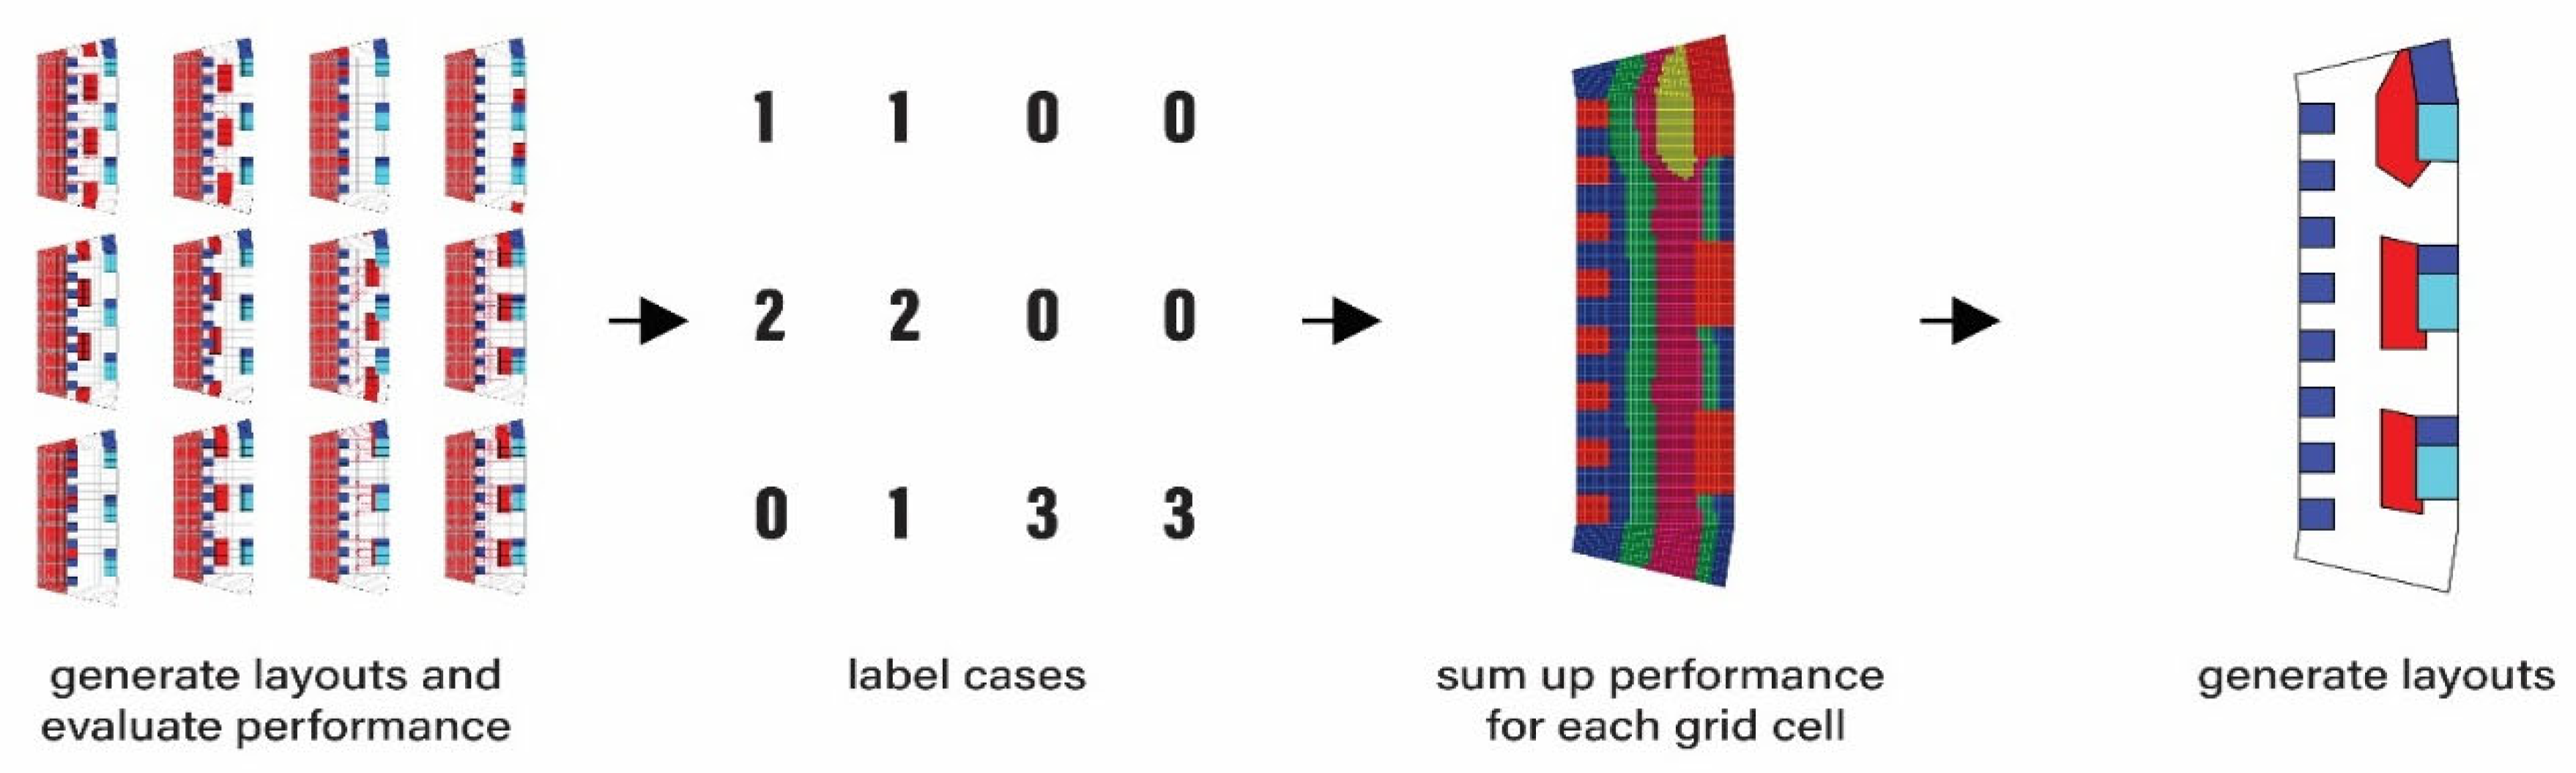
As layout planning is a process that has the potential to create a vast design space, the approach taken was to limit variation through human input by reducing the initial design space. The most applicable workflow in this case is an adaptation of the supervised method, in which case study performance is first labelled against optimisation criteria. Rather than using each case directly as a training sample for the NN, the data is reorganised by grid cell. In the resulting dataset, each grid cell contains the performances recorded for that location across all case studies. Hard voting [
50] is then used to combine these case-specific labels into a single overall label for each cell, representing its general performance across the dataset. A subset of these labels is used to train an NN, which classifies the remaining layout grid cells according to their predicted performance. The model outputs are visualised as heatmaps, indicating the relative performance of each cell, which at a later phase could assist the development of internal layouts (
Figure 9).
3. Results
The PoW Stage 0 case study of London Stadium demonstrates that the supervised workflow can classify viable site and capacity combinations for specific location conditions. The parametric model measured an average seat to Zone 4 entry point distance of 288.19 m. The model also produced a positive result in terms of site-fit for the intended seating capacity and highlighted uneven capacity requirements for the masterplan entry points due to the shape of the site.
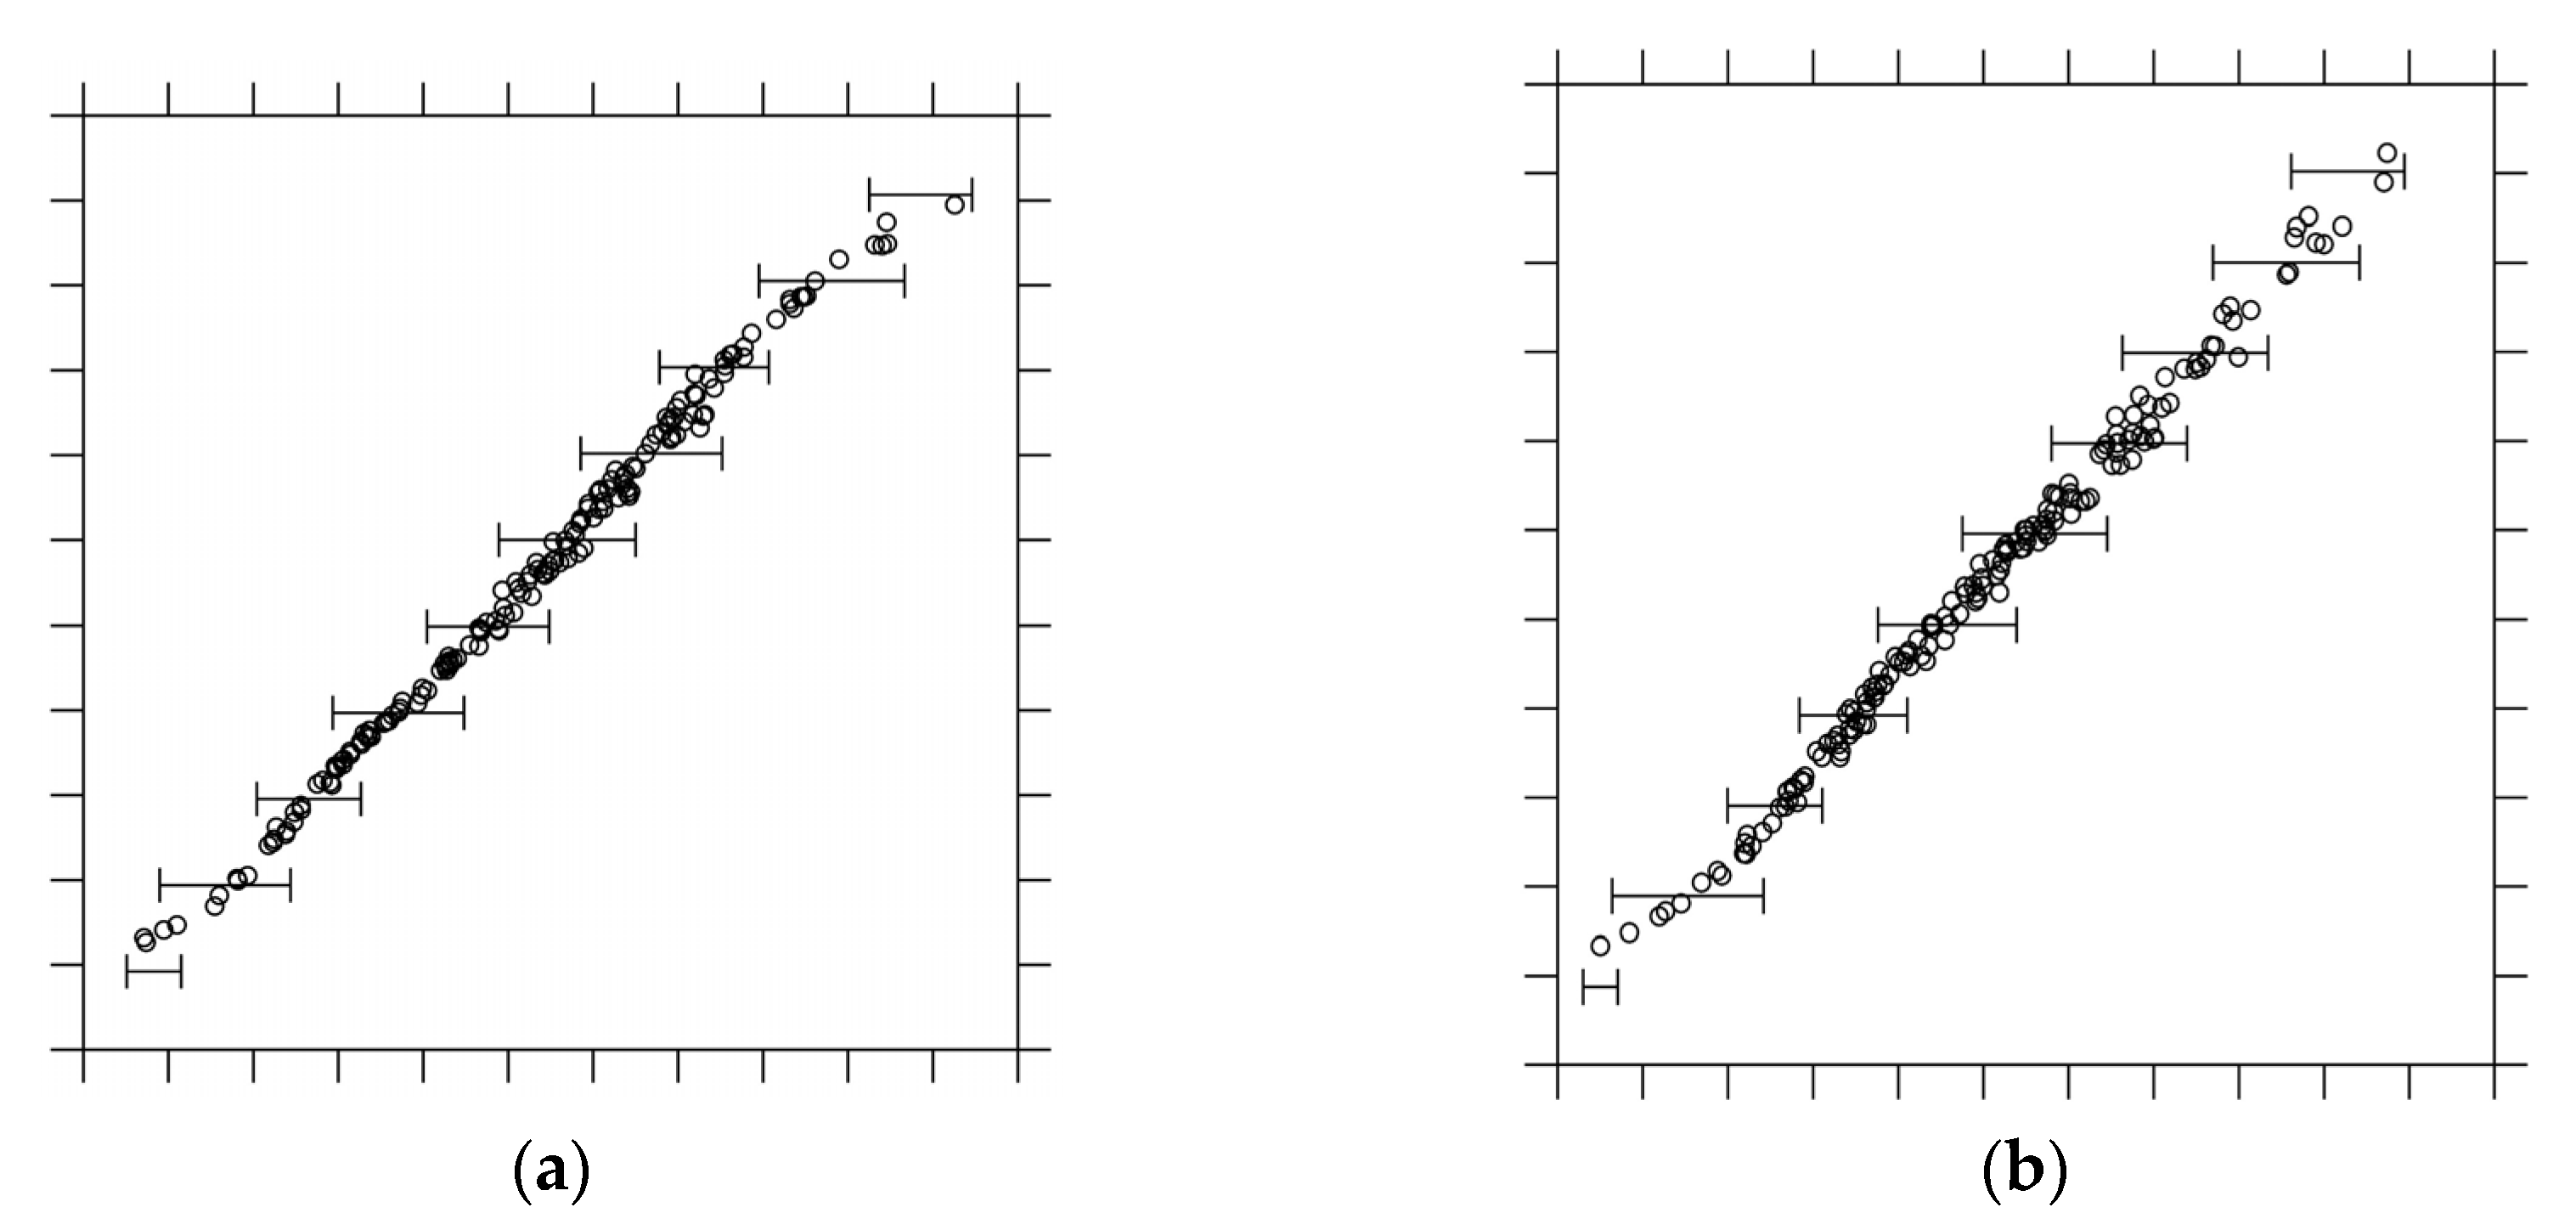
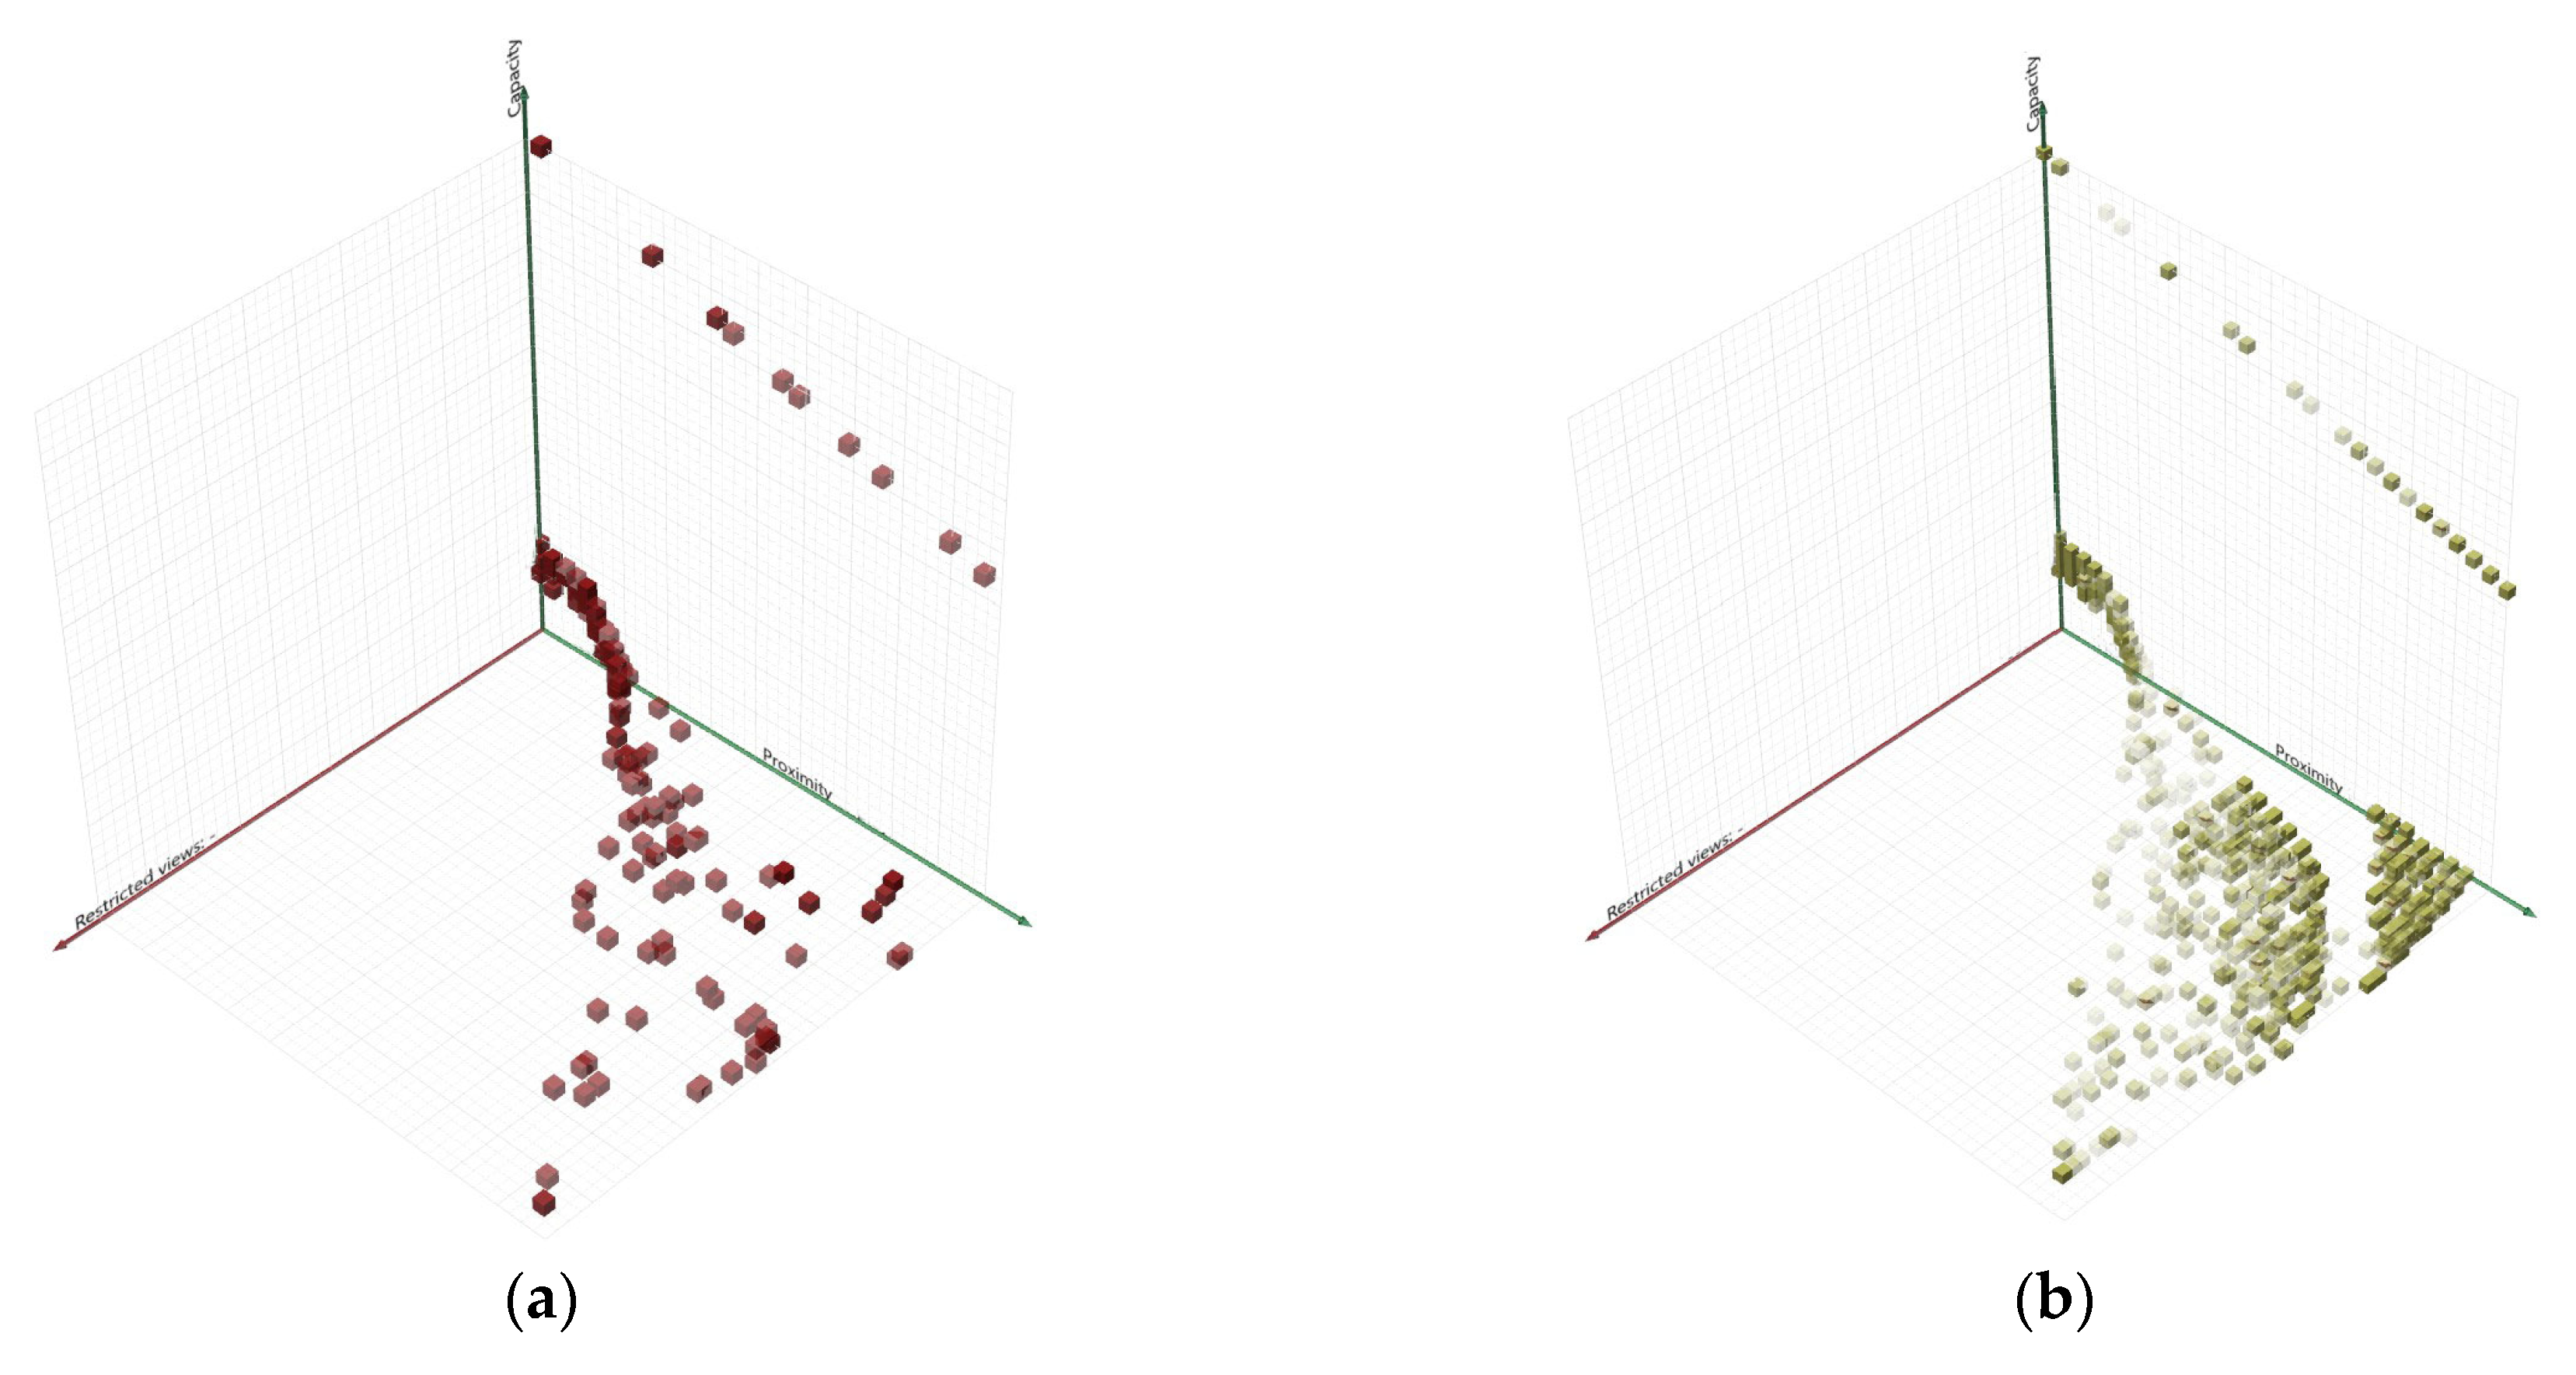
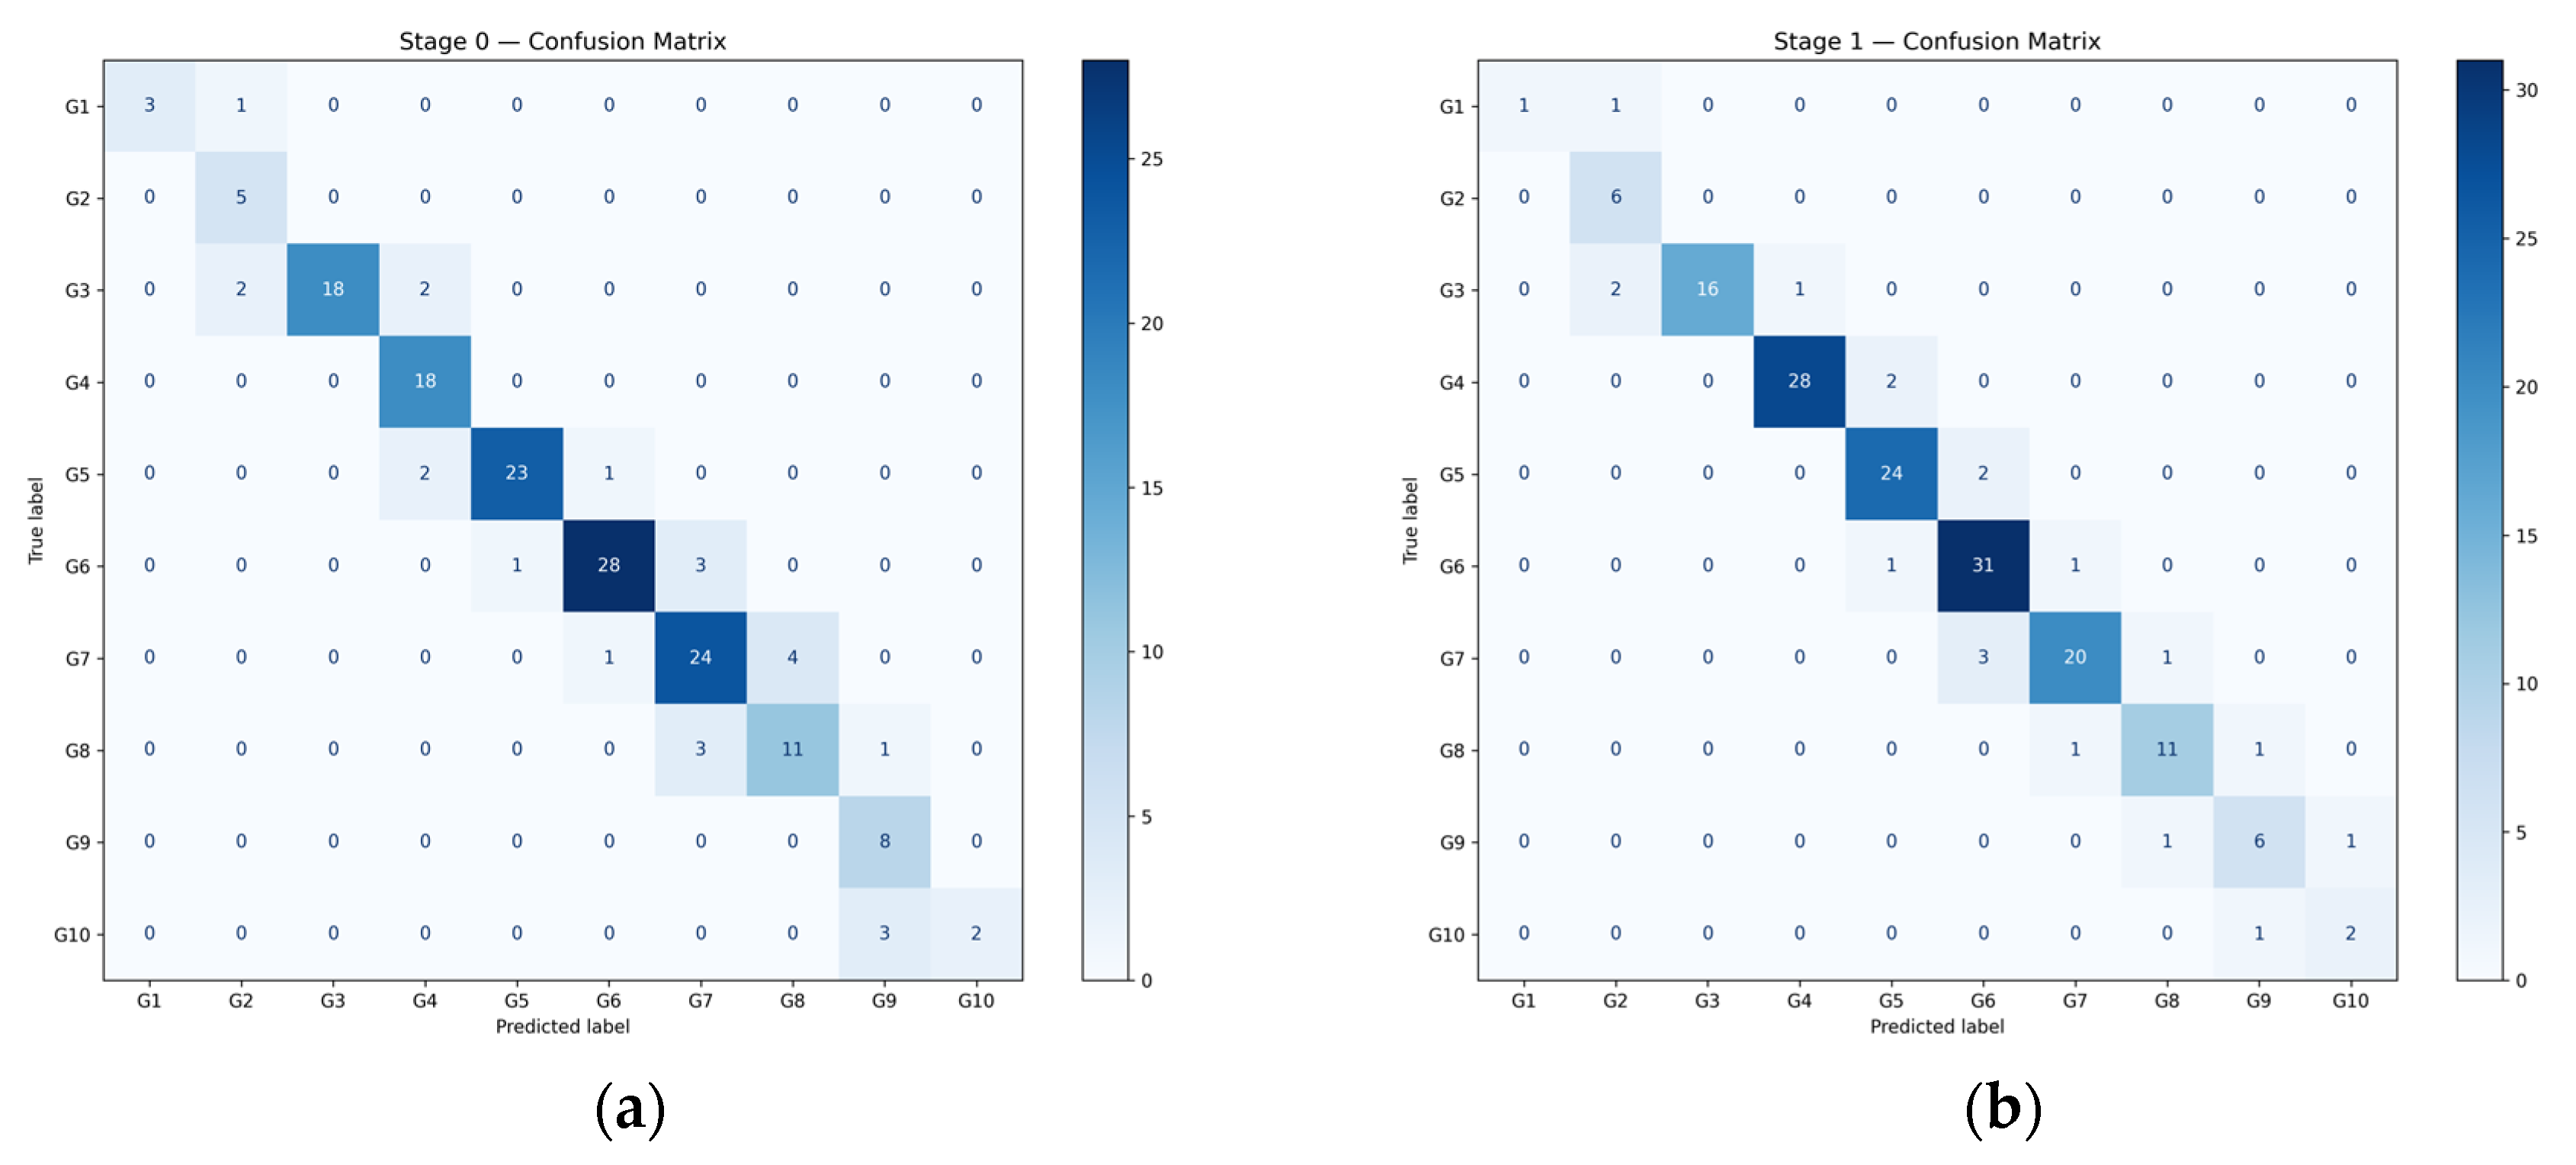
The supervised pipeline achieved an 85.37% ten-performance-group classification accuracy (
Figure 10a and
Figure 11a,
Table 4) against a 19.31% baseline and 49.16% untrained NN accuracy. This indicates that, within the tested and deterministically labelled dataset, the classification method performed substantially above the majority baseline for this specific stage-based design task, demonstrating the potential of the method for application in practice.
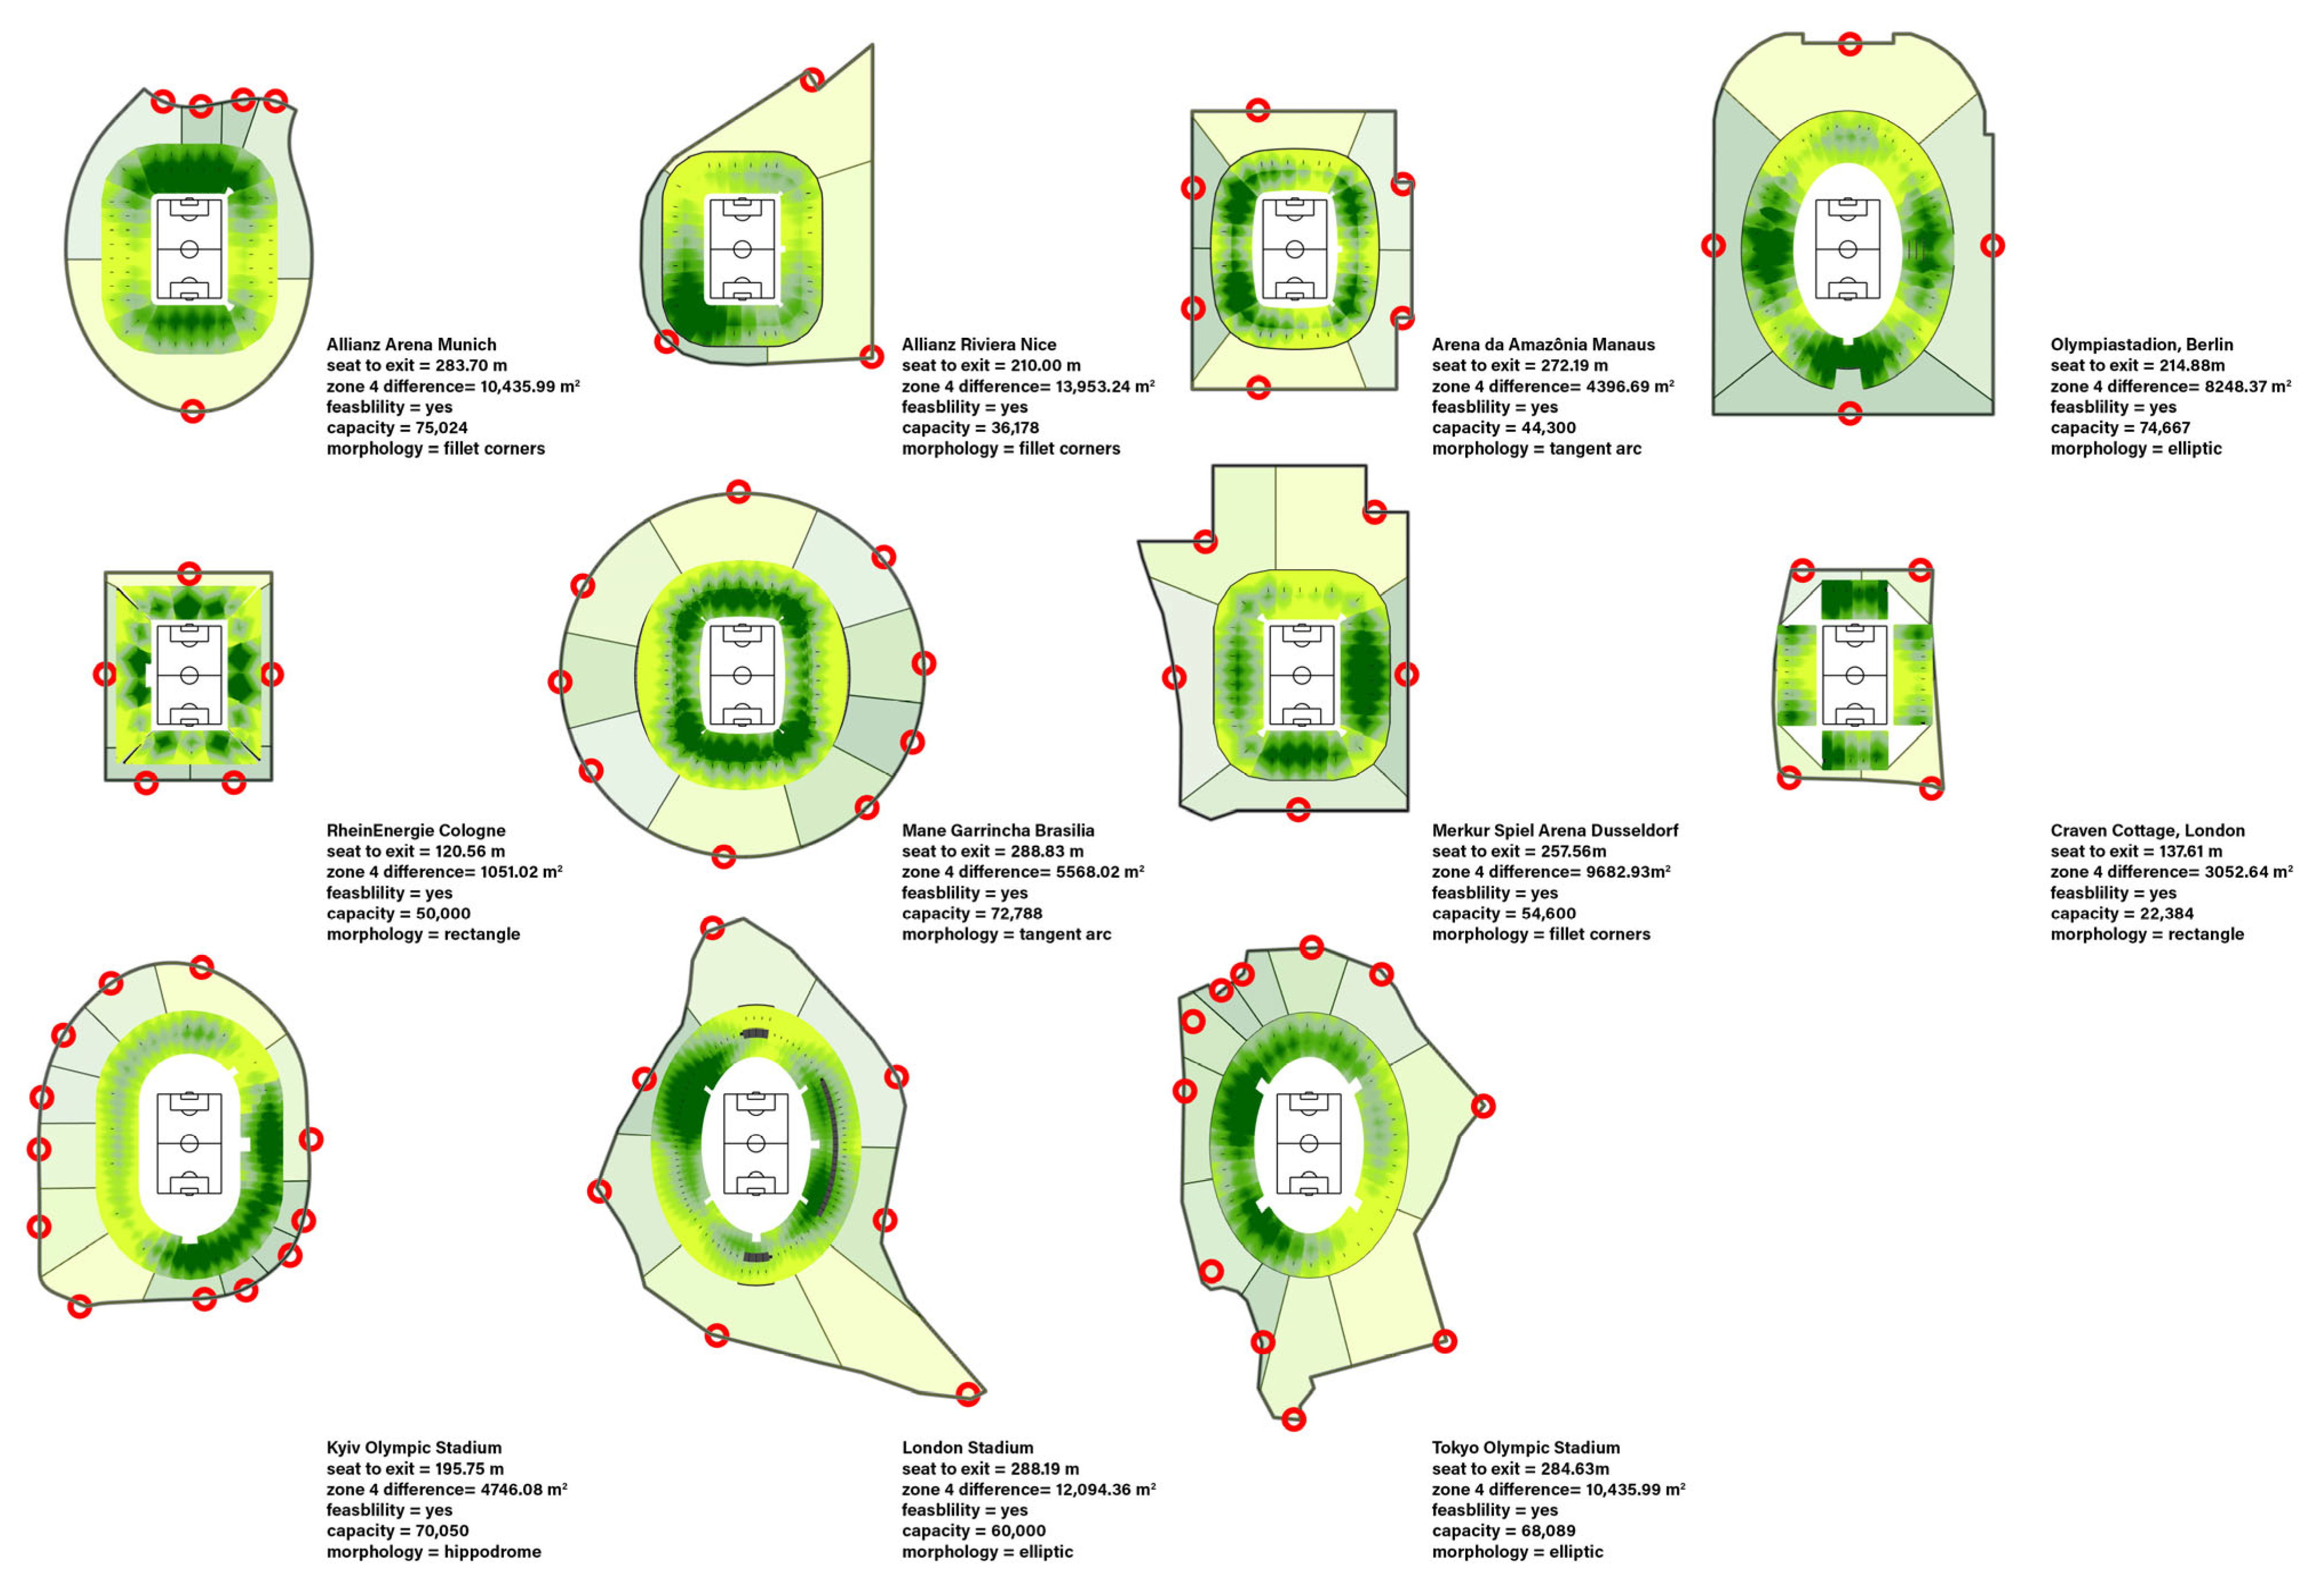
The London Stadium’s circulation metrics (288.19 m) were very close to the performance of similar venues (
Figure 5) like the Tokyo Olympic Stadium (284.63 m) and the Allianz Arena, Munich (283.70 m). The results further highlight the contrast with more compact venues like RheinEnergie Stadion, Köln (120.56 m), and validate the output of the parametric simulation. The model also successfully identified the unfeasible solutions and grouped the possible design solutions based on performance (
Figure 12). Given the morphology of the site and existing successful design, the model also showed that oval solutions were the best-performing morphology for the site-specific constraints.
For the Stage 1 case study of the Stamford Bridge stadium site in West London, the ML-supplemented workflow was aimed at minimising the building footprint while maximising the average sightline quality. The shift in the location of the playing field resulted in an average seat-to-masterplan-entry distance of 216.45 m.
The comparative analysis of the optimal solutions identified by the NN model for capacity-to-footprint ratio highlighted similar performance to modern designs like the Allianz Riviera stadium, Nice. The analysis also identified design solutions that potentially require fewer structural elements than comparable designs.
The NN model achieved 88.41% ten-performance-group classification accuracy against a 20.12% majority-class baseline (43.33% untrained NN) within the supervised pipeline (
Figure 10b and
Figure 11b,
Table 5) and identified clear parameter ranges that can be taken towards the design brief (
Figure 13), thereby narrowing the potential solutions to a smaller set of capacity ranges and tier configurations within the tested scenarios, demonstrating the potential of the approach for further practical testing in real-life design applications.
Table 4.
Stage 0 per-class classification performance (accuracy 85.37%, n = 164).
Table 4.
Stage 0 per-class classification performance (accuracy 85.37%, n = 164).
| Group | Precision | Recall | F1 | Support |
|---|
| Group 1 | 1.000 | 0.750 | 0.857 | 4 |
| Group 2 | 0.625 | 1.000 | 0.769 | 5 |
| Group 3 | 1.000 | 0.818 | 0.900 | 22 |
| Group 4 | 0.818 | 1.000 | 0.900 | 18 |
| Group 5 | 0.958 | 0.885 | 0.920 | 26 |
| Group 6 | 0.933 | 0.875 | 0.903 | 32 |
| Group 7 | 0.800 | 0.828 | 0.814 | 29 |
| Group 8 | 0.733 | 0.733 | 0.733 | 15 |
| Group 9 | 0.667 | 1.000 | 0.800 | 8 |
| Group 10 | 1.000 | 0.400 | 0.571 | 5 |
| Macro avg | 0.853 | 0.829 | 0.817 | 164 |
| Weighted avg | 0.873 | 0.854 | 0.853 | 164 |
Table 5.
Stage 1 per-class classification performance (accuracy 88.41%, n = 164).
Table 5.
Stage 1 per-class classification performance (accuracy 88.41%, n = 164).
| Group | Precision | Recall | F1 | Support |
|---|
| Group 1 | 1.000 | 0.500 | 0.667 | 2 |
| Group 2 | 0.667 | 1.000 | 0.800 | 6 |
| Group 3 | 1.000 | 0.842 | 0.914 | 19 |
| Group 4 | 0.966 | 0.933 | 0.949 | 30 |
| Group 5 | 0.889 | 0.923 | 0.906 | 26 |
| Group 6 | 0.861 | 0.939 | 0.899 | 33 |
| Group 7 | 0.909 | 0.833 | 0.870 | 24 |
| Group 8 | 0.846 | 0.846 | 0.846 | 13 |
| Group 9 | 0.750 | 0.750 | 0.750 | 8 |
| Group 10 | 0.667 | 0.667 | 0.667 | 3 |
| Macro avg | 0.855 | 0.823 | 0.827 | 164 |
| Weighted avg | 0.892 | 0.884 | 0.884 | 164 |
The case study for the PoW Stage 2, St Mary’s Stadium in Southampton, focused on the application of the semi-supervised pipeline yielding a set of possible design solutions with capacities between 30,000 and 40,000 seats. The granular simulation identified design solutions within a narrow range of seats close to an exit, building footprint, programme allocation, and quality of sightlines.
This workflow reduced the design space and identified ranges for best-performing design solutions. This resulted in the selection of designs with more than 45% of seats with high-quality sightlines with a C-value above 120 mm and removed all solutions with seat to stadium exit distances above 60 m (
Figure 14).
For the PoW Stage 3 MOO case study of the Kyiv Olympic Stadium bay configuration, the optimiser went through 2492 generations (
Figure 7), and the selected design solutions showed a reduction in seats with restricted views to as few as eight (
Figure 15) compared to the current stadium configuration. However, there is one major trade-off. The original baseline has a hospitality tier at row 28, six hospitality rows, and 155 restricted-view seats. The baseline sits well within the Pareto front and allows for substantial improvement. Moving the hospitality tier further away from the playing field to rows 42–45 substantially improves the restricted views. This also allows for the introduction of additional hospitality rows, but again at the expense of proximity to the playing field. Thus, the MOO balances restricted view reduction, capacity and the proximity of the hospitality tier to the playing field rather than improving all objectives simultaneously.
The case study chosen for the PoW Stage 3 layout analysis was the Allianz Arena in Munich. The performance of the individual grid cells was successfully mapped by the NN algorithm, thus creating a visual representation of the relationship between commercial space distribution and the spectator circulation paths (
Figure 16). The utilisation of isovist fields allowed for the identification of design solutions that reduced the circulation paths to below 30 m and areas that created blind spots or increased congestion risk.
4. Discussion
The ML-supplemented approaches presented in this paper could contribute to the development and verification of a final stadium design and have the potential for substantial impact within the requirements of each RIBA PoW design stage. The parametric model demonstrated that representing the stadium building type as a set of shared characteristics creates the foundation for meaningful subsequent ML analysis. Because the tasks across the design development stages are different, it is not possible to define a best-performing workflow. Instead, the methods of integrating parametric modelling and ML present a combined framework that can assist the human designer in developing and evaluating design solutions.
The utilisation of NN models in Stages 0 to 1 expands the systematic review of a larger range of possible design solutions than a manual process, allows for an evidence-based reduction in the design space, and allows for the selection of a design direction for the following project development stages. The small training and validation sets lower the computational barrier of the workflows because they do not require powerful computing to train the NNs. However, their use still requires technical understanding of the parametric tools and stadium design, limiting their direct use by all design stakeholders. During RIBA Stage 3, the utilisation of NNs for layout analysis has the potential to provide the basis for a new type of error-checking tool that did not exist previously due to the complexity of the required analysis.
Stage 0 and 1 NN pipelines show strong accuracy results. Nevertheless, the labels are deterministic, and the datasets are relatively small, so strong accuracy values do not necessarily show broad predictive generalisation. They may instead show that the model learned a structured rule set within a constrained design space. The results demonstrate promise within bounded and stage-specific design spaces, rather than general applicability across stadium design as a whole.
The repetition of entries in the smaller classes provides limited information, which is reflected in the per-class metrics (
Table 4 and
Table 5). The models perform strongly in classifying larger classes, while the performance in smaller ones is less reliable. For example, the low-support class Group 10 in Stage 0 achieves a recall of only 0.40, corresponding to two out of five cases. The models’ performance on these classes should be interpreted with caution, consistent with the limited, stage-specific scope of the results.
The semi-supervised method at Stage 2 allows for substantial human input, which increases designer control over the design development while also increasing the possibility of errors due to selection bias. In contrast, the utilisation of evolutionary optimisation in Stage 3 provides a quantified narrowing of the design space, where tightly defined objectives can narrow the search and reduce unexpected outcomes.
The role of the human designer remains critical at each development stage but has to adapt to the specific data preparation and analysis requirements of each task. For an optimal workflow, the designer must have a good understanding of both the traditional design steps and requirements, along with the skills required for data management and data evaluation.
Limitations and Future Work
This study attempted to bring major layers of design constraints and external inputs into a set of workflows that help establish novel performance-based design solutions. It has started to define an alternative application of ML in stadium architecture; however, each step can be elaborated and revised further to increase its relevance to a specific project or increase the level of detail. As the objective of the study is to define a framework, there is still substantial scope to increase the dataset sizes and to revise the data labelling process in order to train more efficient ML models and to produce better contrast between the proposed design solutions.
The RIBA PoW stages discussed in this paper have additional subtasks that were not fully implemented in the research. The study reduced the number of subtasks in order to test the process itself. Once those workflows are put into practice, both the conventional and ML-supplemented workflows will have to be adapted to produce a comprehensive final design. As the study was applied in an academic setting, its practical application will have to be tested to clarify whether there is an actual reduction in the time required to complete each design stage.
In terms of training, there is potential for bias due to manual labelling or labelling where grades are summed to produce a performance label. The potential for preference in the curation of the training datasets is extensively reviewed in the literature across multiple domains [
51,
52]. In practical terms, this is mitigated through the benchmark comparison, reference to existing statutory requirements, and the option for multiple designers to cross-check selections. Future validations should further explore agreement or disagreement between multiple designers assigning labels, sensitivity of label thresholds, repeated-run stability, and ablation testing of input variables.
Another limitation of the research is the selection of benchmarks; those can be expanded substantially to bring more detail to the process of validating the chosen design solution. Furthermore, the focus on stadium design limits direct application to similar building types like indoor arenas and theatres because they can be more easily represented parametrically due to strict spatial requirements defined in legislation. Future work therefore could test the transferability of the framework to other assembly building types.
5. Conclusions
Approaching the stadium design task from a performance-based perspective and working across methods and methodologies from both the architectural and structural engineering fields enabled a typological representation, analysis, and optimisation of stadium design in terms of spectator experience. In this way, the research attempted to address the gap between isolated computational studies and the requirements of early stadium design within the RIBA Plan of Work in a single framework. The ML-supplemented workflows presented in this paper demonstrate the potential of those methods to analyse and reduce large design spaces, thus improving design decision-making across RIBA PoW Stages 0 to 3. Through the application of the framework across a set of case studies, the study shows how ML-supplemented workflows may contribute to practice by reducing repetitive manual review of design variations across multiple dimensions, identifying design solutions at the boundaries of the design space, evaluating and developing designs based on performance data, and comparing benchmarks across existing case studies. The framework still requires an understanding of parameter settings and performance criteria for it to be used by non-specialists without expert support.
The results of this study further show that ML approaches are most effective when matched to common design requirements at each design stage. Supervised learning proved useful for classifying the performance of feasible solutions, while the interactive semi-supervised pipeline enabled structured exploration based on computational clustering and designer-led evaluation. Evolutionary optimisation indicated potential for application to well-defined design problems at the later stages of the design process. All the workflows also highlight that the role of the human designer is essential but must adapt and respond to new design tasks like problem definition, data curation, and critical evaluation of outputs.
The two primary focal points of this study from the field of engineering, parametric modelling and modular design, were deployed along with methods from the architectural field, such as typological studies, and generated meaningful results. This highlights the benefits of a more holistic evaluation of stadium design through computational means. The study also demonstrates that a quantification of layout relationships, circulation simulation, and sightline quality can be utilised to produce a comprehensive design representation that reflects the legislative environment.