1. Introduction
In general office environments, the cooling load of an AC system is mainly composed of heat transfer through the building envelope, heat dissipation from personnel lighting, and equipment [
1]. In office environments with high-performance computing clusters such as research offices, simulation design offices, artificial intelligence laboratories, and new media studios, the cooling load required for equipment heat dissipation accounts for a higher proportion of the AC’s cooling load [
2]. Because of the enormous heat dissipation of the computing clusters, the equipment cooling load as designed in the AC system does not match the actual cooling load of equipment. Consequently, it inevitably results in increased energy consumption of AC, decreased personnel comfort [
3], and insufficient heat dissipation of computer. If the heat dissipation of computer in the office is handled separately, these problems can be effectively solved.
The heat dissipation of computing cluster is usually achieved by forced convection of the indoor air, and then the AC equipment takes on this part of the cooling load. This method has a significant advantage for thermal management of data centers compared to traditional office computers. Data centers used AC for cooling in the early stages [
4]. However, because of their high energy consumption of heat dissipation, the power usage effectiveness (PUE) reached around 1.7, and they were replaced by fresh air systems [
5]. More recently, the combination of liquid-cooling and free-cooling has been validated as an effective strategy for high-temperature data centers [
6,
7,
8].
With the increasing integration level of chips, existing air-cooling systems are no more sufficient to satisfy the cooling demands when dealing with high heat flux. Nowadays, the most widely used cooling method in data centers is a combination of cooling methods of liquid and air, where the former is for chips and the latter is for other electrical components such as hard drives [
9,
10]. Curtis et al. [
10] conducted comprehensive performance comparisons of five major server thermal management technologies in 2023, demonstrating that modern cooling architectures can significantly reduce operational costs while maintaining thermal reliability. Furthermore, Zhou et al. [
9] provided a systematic review of advancements in data center cooling systems in 2024, covering the evolution from traditional refrigeration to high-performance cooling solutions. With the increasing integration density of semiconductor chips, conventional air-cooling systems face significant challenges in satisfying the cooling demands of high heat flux applications while maintaining energy efficiency, particularly when heat flux exceeds 100 W/cm
2 or when energy-efficient operation is required. Consequently, hybrid cooling architectures combining liquid and air cooling have emerged as the predominant solution in modern data centers [
9,
10,
11,
12].
Phase change materials (PCMs) have demonstrated considerable potential as passive cooling sources in recent investigations [
13,
14]. When integrated into heat dissipation systems, PCMs can store thermal energy at a consistent temperature and release it when appropriate conditions are met, thereby reducing overall energy consumption. PCMs have been extensively applied in thermal energy storage [
15,
16] and solar energy harvesting [
17]. Hasan [
18] combined building materials with PCMs to prevent overheating of rooms in hot summers (daytime) and reduce heating demand in winter (nights), which greatly reduced energy consumption of building. Combining PCMs with traditional heat dissipation methods for computers can stabilize chip temperatures and further reduce energy consumption of heat dissipation. Ashraf et al. [
19] conducted experimental research of passive heat dissipation on fins coupled with six PCM. Nada [
20] combined PCMs with fresh air systems, cooling the fresh air through PCMs before sending it into the system. Motevalizadeh et al. [
21] combined PCMs with heat pipes for heat management in portable computers and found that the combination of PCMs and heat pipes had better cooling effect than using PCMs or heat pipes alone.
According to the problems of low thermal conductivity of PCMs, some scholars focus on the control of phase transition temperature as well as the improvement of heat transfer rates. Rehman et al. [
22] conducted an experiment to compare the heat transfer capacity of 97% copper foam-based structures with four PCMs, aiming to observe temperature variations over time during heat absorption and release process. It is possible to observe that PCMs with lower phase transition temperatures are suited to apply to situations that require low heat. Additionally, the PCM/copper composite foam demonstrates improved temperature control when compared to the individual ones. Moreover, Rehman et al. conducted experimental research on different metal foam heat sinks [
23,
24,
25]. It can be found that the stable phase transition temperature decreases as the PCM’s volume fraction increases. Moreover, copper foam with lower porosity exhibited a lower phase transition temperature. In a study conducted by Wang et al. [
26], a groundbreaking material was developed by combining liquid metal with PCM capsules. This innovative material possesses several remarkable characteristics such as scalability and high conduction. Hao et al. [
27] employed a microfluidic approach to encapsulate PCMs with multilayer graphene, significantly improving thermal conductivity while maintaining energy storage capacity with less than 5% degradation. Recent advancements in hybrid cooling designs have further expanded the application potential of PCMs in thermal management systems. Rahmani et al. [
28] systematically reviewed the latest developments in battery thermal management systems from 2023 and 2024, highlighting the synergistic benefits of combining PCMs with active cooling technologies for high-density electronic applications. Additionally, Li et al. [
29] proposed an innovative thermal management technique integrating 3D finned tubes with PCMs in 2024, demonstrating enhanced heat transfer performance through geometric optimization of the heat exchanger structure. Yu et al. [
30] developed a novel flame-retardant composite PCM for lithium-ion battery thermal management in 2023, addressing both thermal regulation and safety concerns in high-density energy systems.
These developments underscore the growing importance of advanced PCM composites in addressing the thermal challenges posed by next-generation computing equipment [
31,
32]. Furthermore, hybrid PCM–liquid cooling systems have emerged as a promising approach for balancing thermal performance and energy efficiency across diverse applications. A recent investigation into battery thermal management reported that a hybrid system integrating phase change material with liquid cooling, optimized through multi-objective entropy-weighted TOPSIS, attained a 79.12% reduction in energy consumption while constraining the maximum temperature difference to 4.42 °C [
33]. Although targeting lithium-ion batteries, this hybrid architecture (passive PCM latent heat storage coupled with active liquid circulation) and its optimization methodology directly inform the present work on office computing clusters, where similar trade-offs between thermal control and energy efficiency are sought.
We take a scientific research office in Suzhou University of Science and Technology as an example. The room is cooled by central AC with top-mounted four-way cassette fan coils. Due to large office desks and PC equipment (250 W each) arranged below the desks, the cold air cannot be directly delivered to the PCs. Consequently, PC surface temperatures frequently exceed 50 °C, and indoor air temperature differences exceed 5 °C, compromising both equipment safety and personnel thermal comfort. This thermal environment motivates the centralized heat dissipation approach proposed in this study.
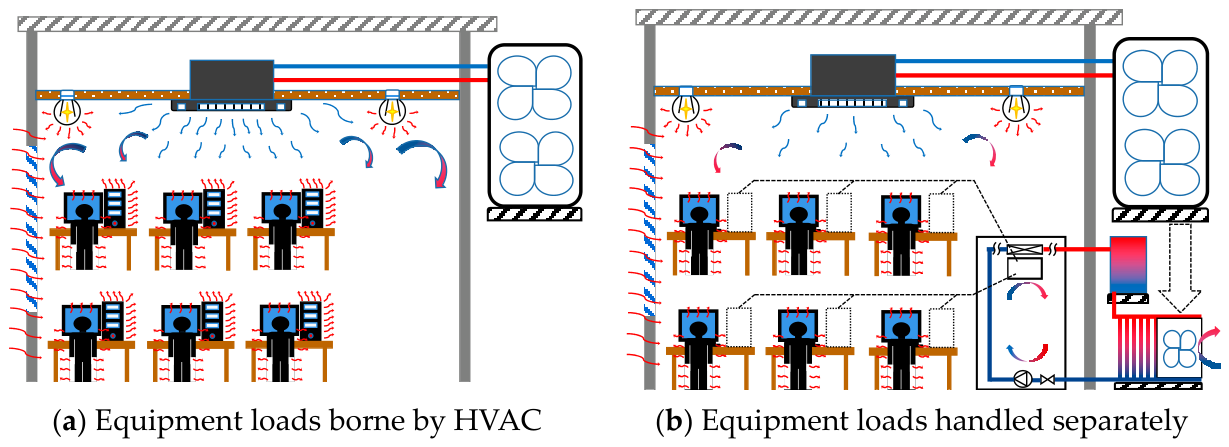
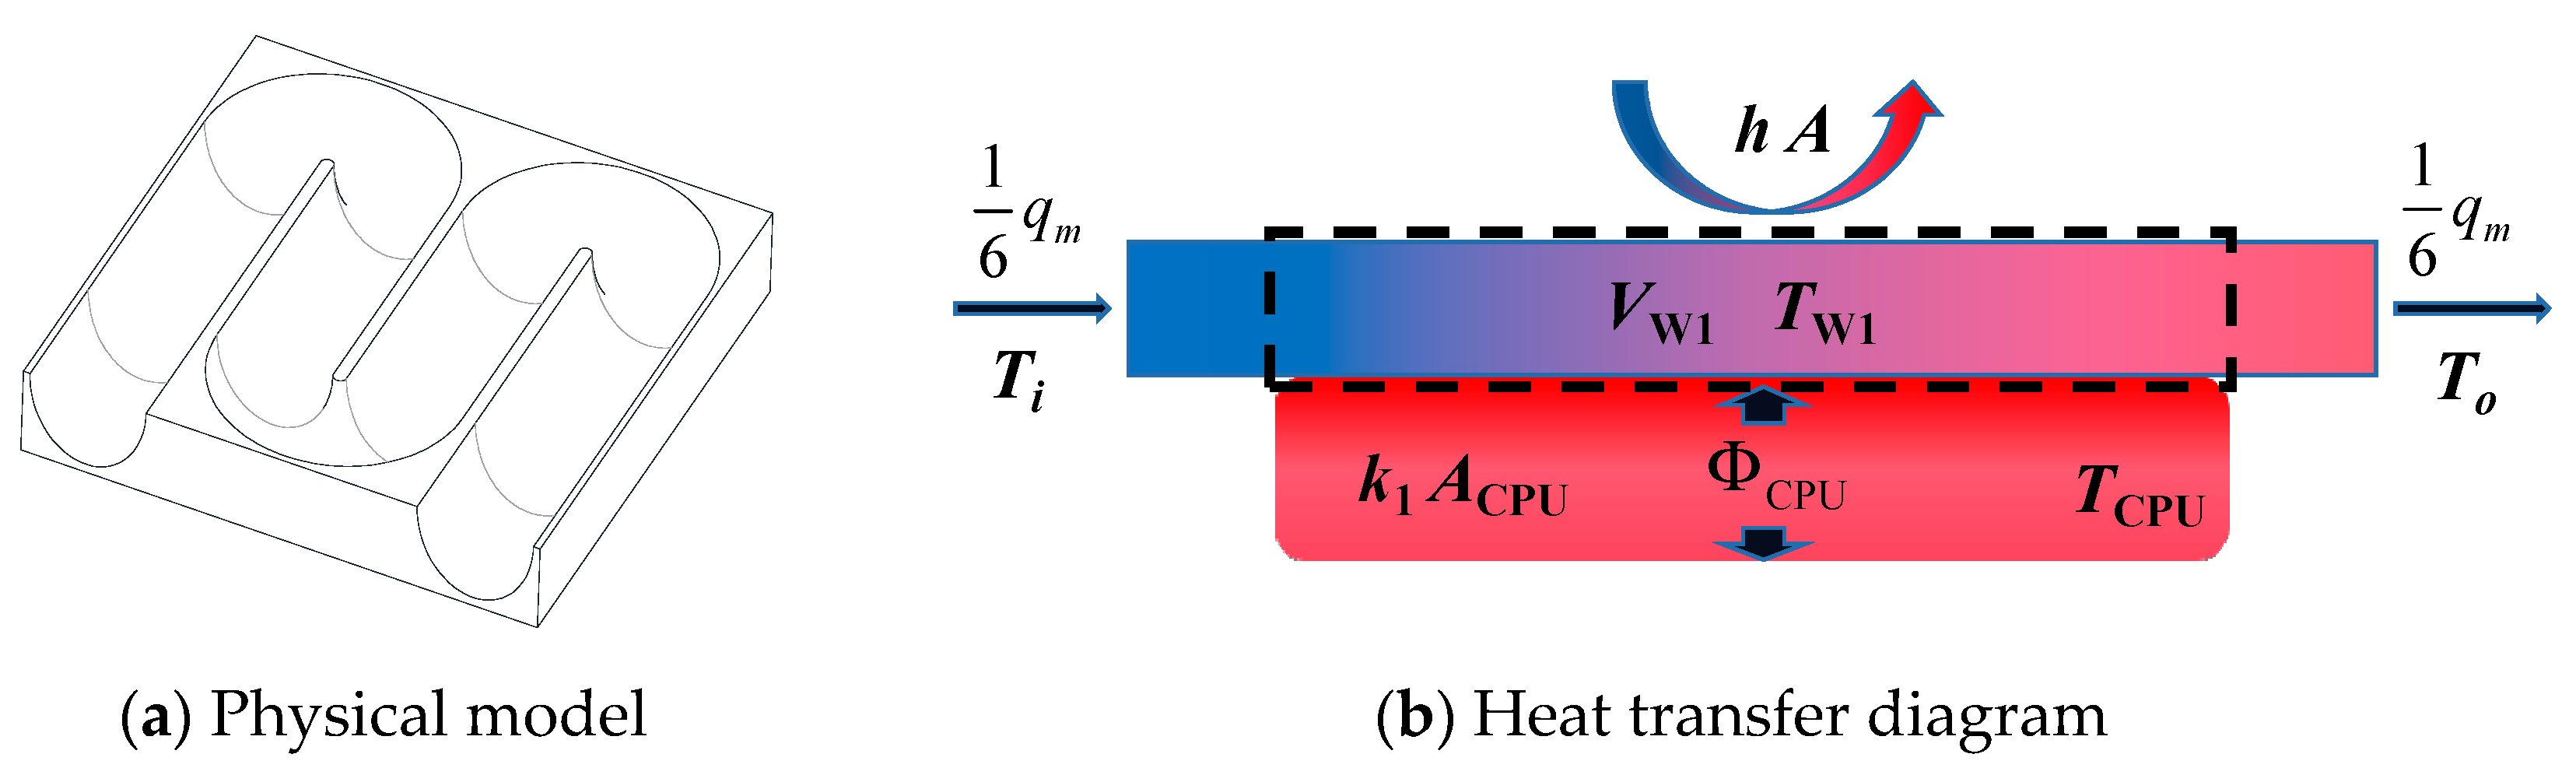
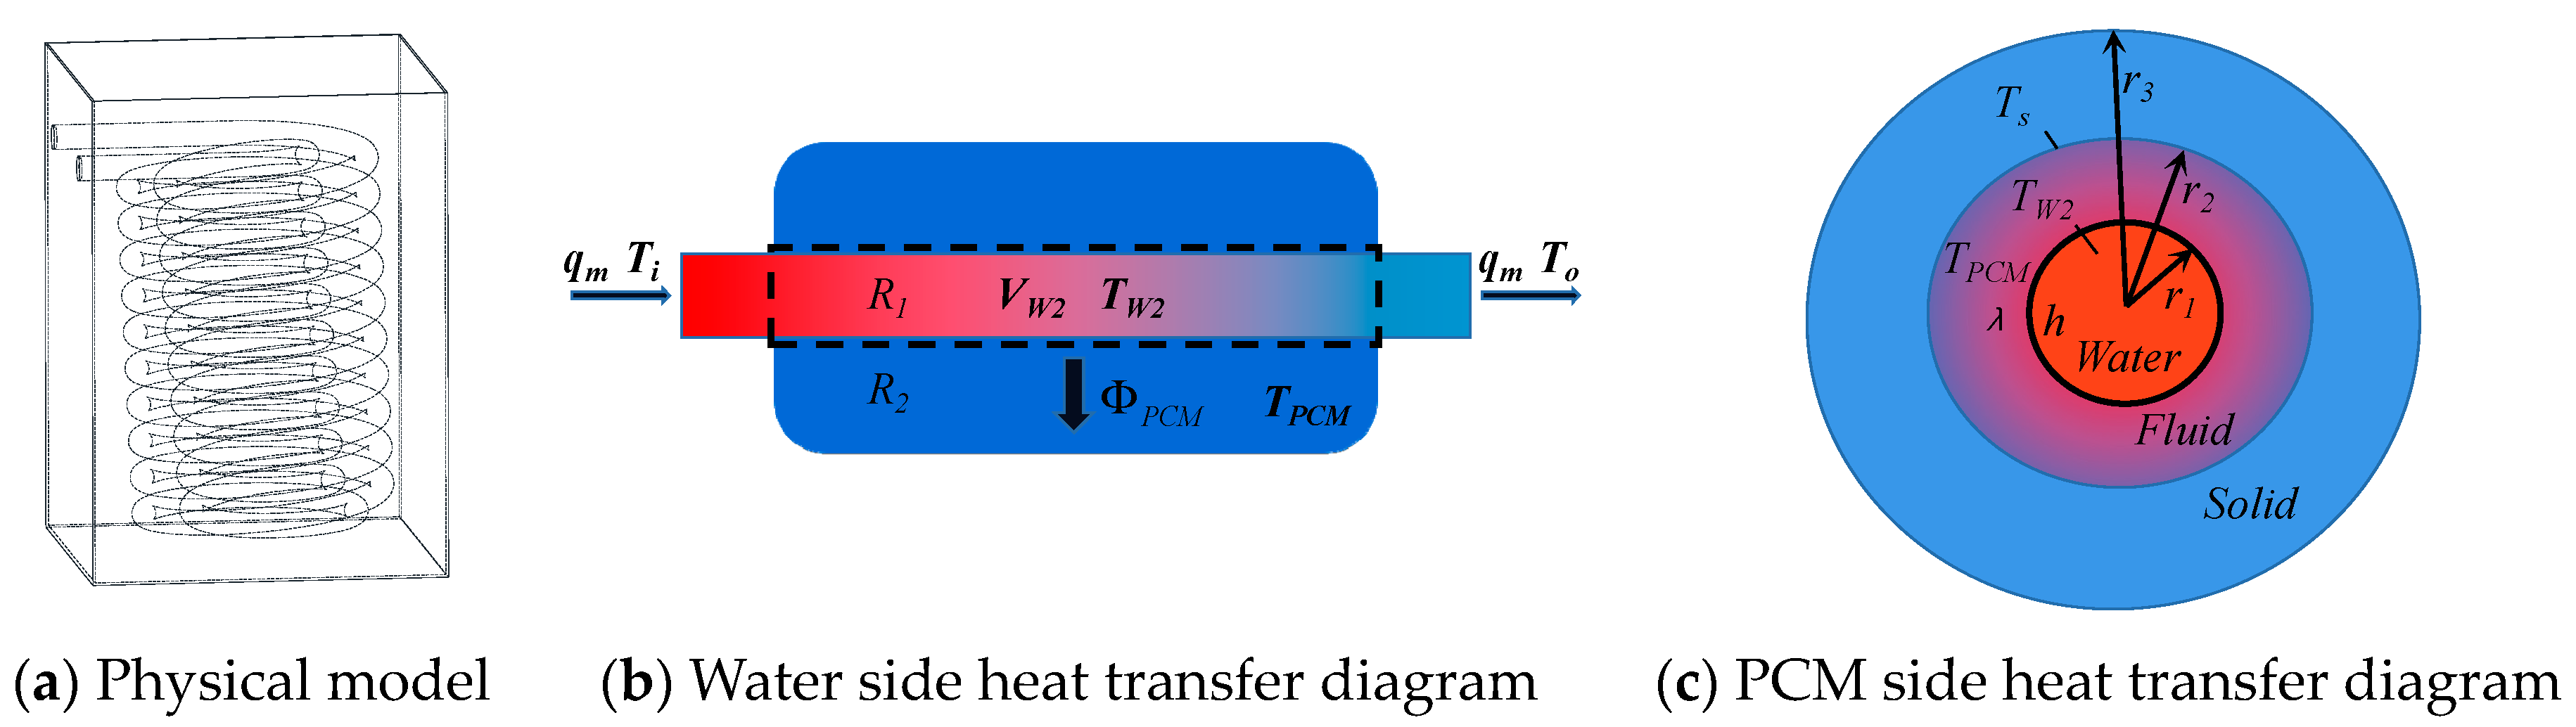
On that account, the computing cluster equipment in this environment is centralized, and the heat dissipation is processed separately here (as shown in
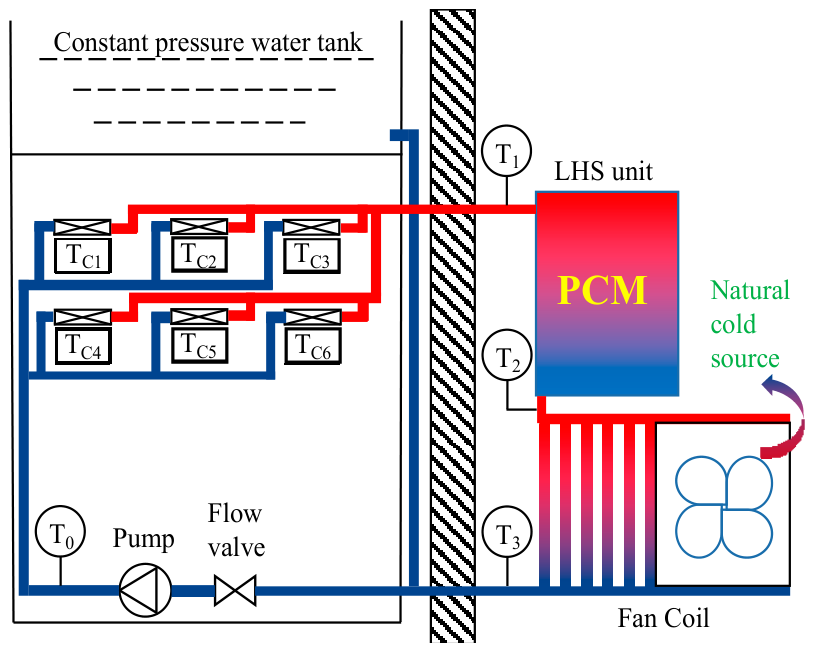
Figure 1). It uses a liquid cooling system coupled with PCM, which means combining active and passive heat dissipation technologies. The waste heat of computers is removed by the liquid cooling system using water, while PCM acts during the melting process to enable passive heat dissipation. In particular, we propose to combine this system with the air pressure provided by the outdoor AC unit to enhance the overall heat transfer capacity. Specifically, when the outdoor unit of the AC in the existing building forcibly exchanges heat with the surroundings, the remaining air pressure improves the heat transfer performance between the coil and the environment in this system. This reduces the startup frequency of the auxiliary fan and further achieves energy-saving effects.
3. Results and Discussions
3.1. Heat Transfer of the Cold Plate
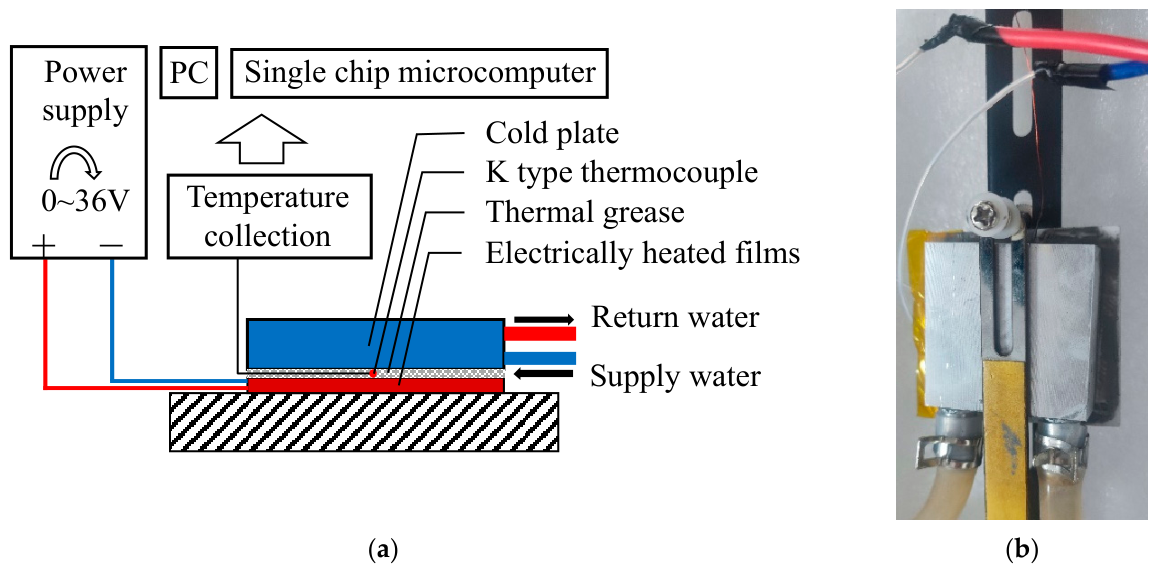
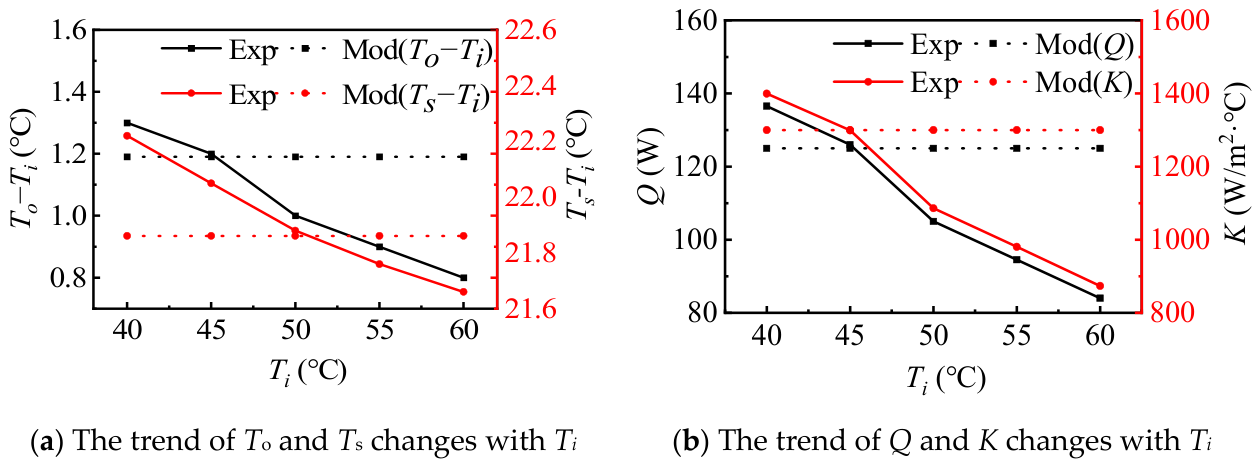
As the critical heat exchange component in liquid cooling systems that directly contacts the heat source, the cold plate’s thermal performance directly impacts chip temperature control effectiveness and system energy efficiency. Based on the experimental results illustrated in
Figure 8, the total mass flow rate of 0.15 kg/s is regulated by a variable-speed gear pump with manual voltage adjustment, and divided equally among six parallel cold plates through a symmetric manifold design. Flow rate stability is verified by 1 min interval logging, showing fluctuations within ±3% (0.024–0.026 kg/s per plate). The reported 0.025 kg/s represents the time-averaged value over the steady-state period.
It can be observed from
Figure 8 that under a constant mass flow rate of 0.025 kg/s, the outlet temperature
T0 of the chip and the chip surface temperature
Ts are measured for various cooling water inlet temperatures
Ti, from which the heat transfer rate
Q of the cold plate and the overall heat transfer coefficient
K are calculated. For instance, at an inlet temperature
Ti of 45 °C, the effective heat transfer temperature difference Δ
t between the chip surface and the cooling water is approximately 20 °C, the heat transfer rate
Q is approximately 125 W, and the corresponding overall heat transfer coefficient
K is 1300 W/m
2·K, yielding a heat gain coefficient
ε of 0.5. It should be noted, however, that as the circulating water temperature increases, the heat gain coefficient
ε gradually decreases, indicating an increase in overall thermal losses within the pipeline network system; nevertheless, this portion of losses is accounted for in
Φair during the numerical analysis process.
3.2. Heat Transfer of the LHS Unit
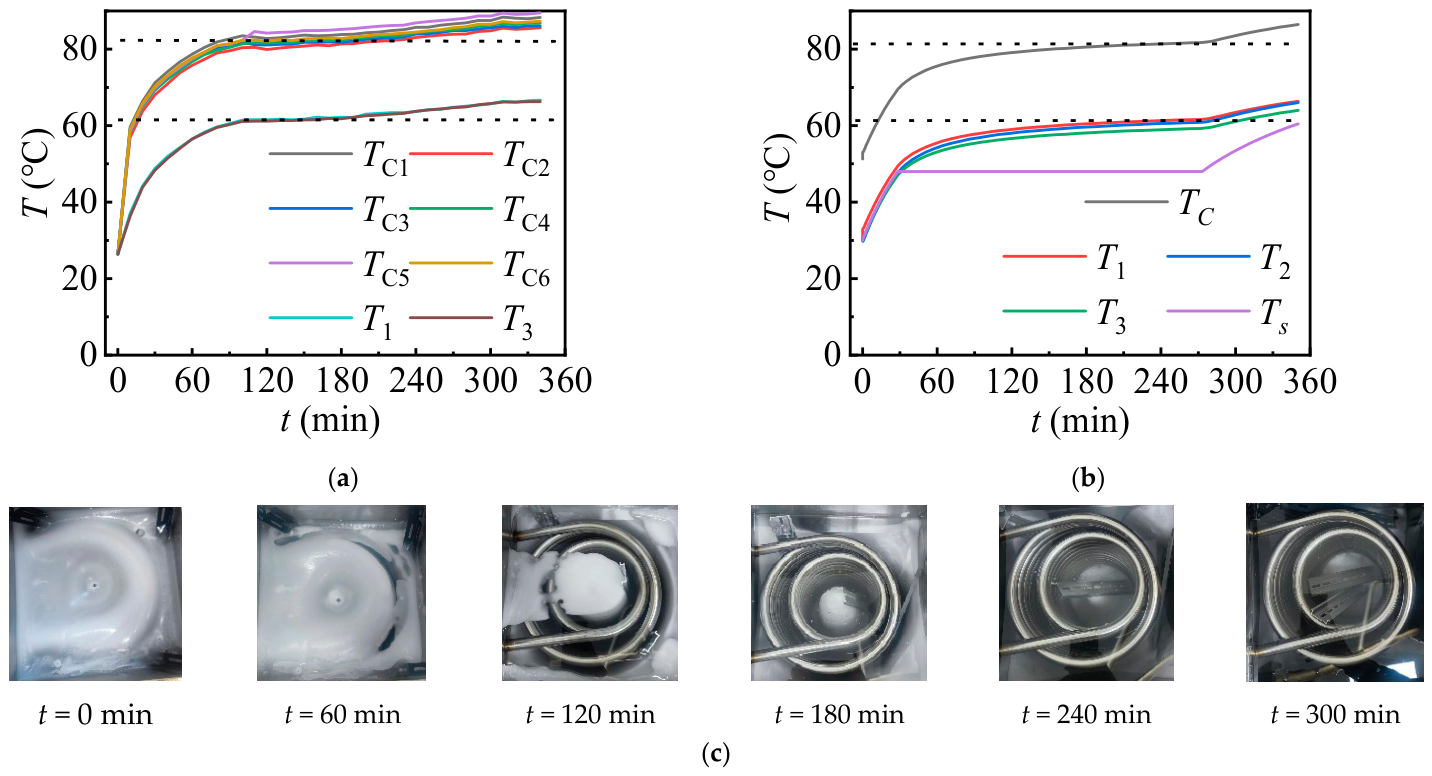
To evaluate the thermal management performance of the liquid cooling latent heat storage system under high heat loads, this section examines the thermal response characteristics and steady-state regulation capability of the liquid cooling LHS system under the six chips fully loaded operating condition. The heating power of the six chips is turned on to a maximum of 250 W. The total heat load reaches 1500 W. Correspondingly, the cooling water flows through six parallel cold plates at a total mass flow rate of 0.15 kg/s and subsequently converges at the inlet of the LHS unit, thereby constituting a complete liquid cooling loop.
The close agreement among T1 (LHS inlet), T2 (LHS center), and T3 (LHS outlet), deviating by less than 1 °C at steady state, is physically consistent because all three points lie on the phase-change plateau at 48–50 °C. During phase change, the PCM maintains nearly isothermal conditions, causing the circulating water temperature to stabilize within a narrow range regardless of position.
Upon analyzing
Figure 9, it becomes evident that after running the system for 100 min, the temperatures of the circulating water and chip surface reach a relatively steady state. Specifically, the temperature of the circulating water stabilizes at 62 °C, indicating a significant deviation of 14 °C from PCM’s phase transition temperature. Furthermore, the chip’s surface temperature remains below 85 °C. This demonstrates that the liquid cooling thermal storage system possesses effective thermal regulation capability under high heat flux conditions, capable of maintaining chip temperatures within reliable operating ranges. It is important to note that the simulation takes into account the thermal conductivity resistance of paraffin, and we set the value of 0.2 W/m·K. A comparison between
Figure 9a,b reveals that the simulated evolution of water temperature and chip surface temperature agrees well with the experimental data, indicating that the present model is capable of effectively predicting the temperature variations within the system.
It should be clarified that 60 °C is the thermal equilibrium result under continuous full-load operation, not an “optimal” design target. Under this condition, the PCM fully melts and operates in sensible heat mode. The PCM’s primary advantage is absorbing transient thermal peaks during load fluctuations (e.g., startup, intermittent operation, Class I-III conditions), which reduces auxiliary fan activation frequency by 40% compared to natural-cooling-only systems. Quantitative validation metrics: RMSE (temperature): 4.1 °C (6.8% of range); MAPE: 8.3—Steady-state deviation: <2 °C; R2 (coefficient of determination): 0.94. Sensitivity analysis: ±10% variation in PCM conductivity: ±5% change in phase-change time; ±10% variation in heat transfer coefficient: ±8% change in steady-state temperature.
3.3. Heat Dissipation of the FAN Coil
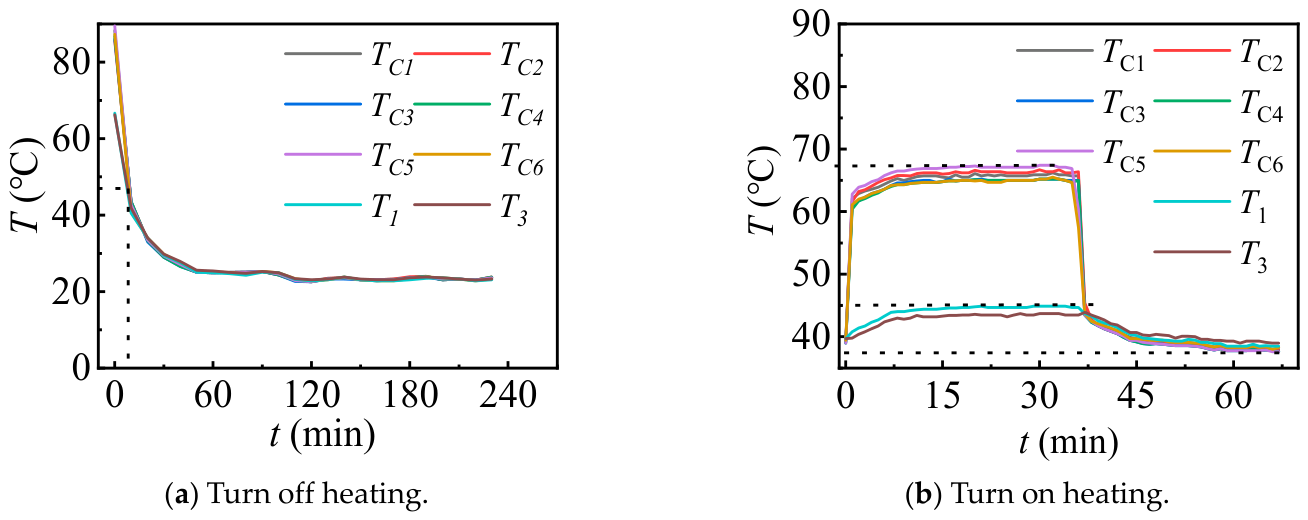
As illustrated in
Figure 10, the system exhibits pronounced differences in thermal response under various operating strategies. When the circulating water is heated to 85 °C, it is recommended to turn off the heating and open the fan. Within a span of less than 10 min, the water temperature decreases from 65 °C to 48 °C (which is below the phase change temperature) and gradually approaches the ambient temperature; under the condition of continuous heating operation with the fan coil unit activated, the circulating water temperature can be effectively suppressed below 45 °C, indicating that active heat dissipation is capable of offsetting the sustained thermal input. Furthermore, once heating ceases, the water temperature decreases rapidly and approaches the ambient temperature regardless of whether the fan is operating. It can be inferred that with the fan coil unit in operation, its heat dissipation rate consistently exceeds the net heat gain acquired by the circulating water, resulting in a net heat output for the overall system and thereby achieving effective regulation and rapid cooling of the circulating water temperature. Based on these observations, it can be inferred that the total heat dissipation after activating the fan coil is greater than the total heat gain of the circulating water at any given time. Consequently, it contributes to the decrease in the circulating water temperature.
3.4. Classification of System Operating Condition
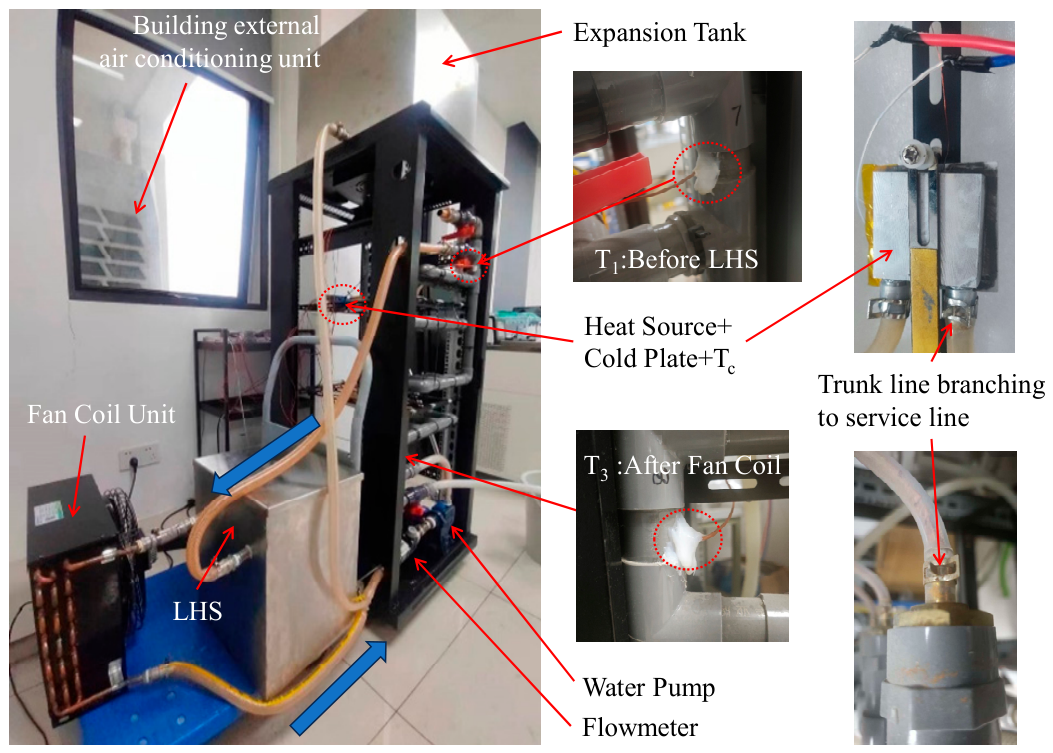
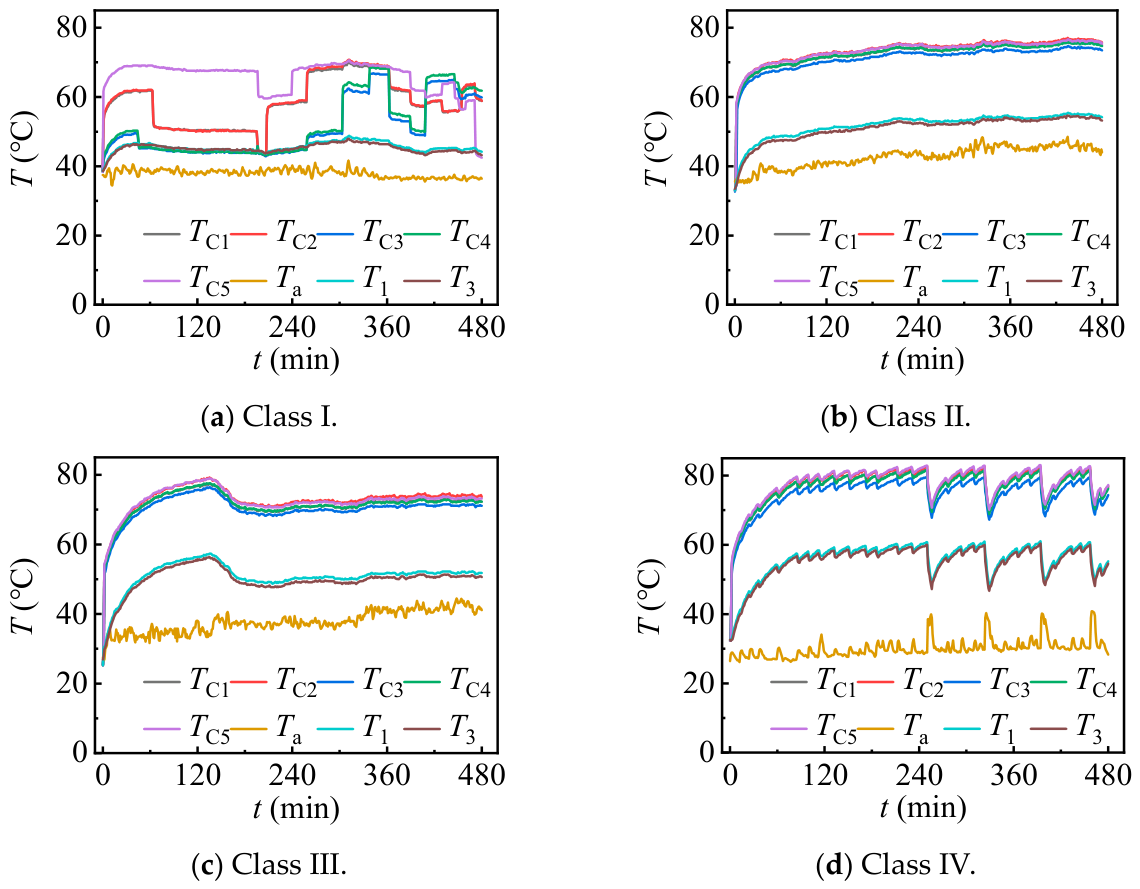
After the experimental system is built, the fan coil and the LHS unit are placed outdoors and the electronically heated film is opened. Due to the existence of an air-conditioning outdoor unit, heat dissipation of the fan coil is affected. When the outdoor unit is running, the residual pressure of it causes its passive rotation of the fan (1.2 m/s), which accelerates the heat dissipation of the pipe network and has a beneficial effect on the system. Based on the aforementioned experimental conditions, multiple experiments were conducted and comprehensive analysis of all experimental data was performed, which can be categorized into the following four operating conditions (
Figure 11):
Class I: The outdoor air-conditioning unit runs randomly, and the chip runs at half power. The water temperature continues to be near the PCM’s phase transition temperature, and the LHS unit charges heat back and forth to stabilize the water temperature.
Class II: The outdoor AC unit runs continuously, and the chip operates at full power. Under this condition, the AC unit runs steadily, causing the water temperature to rise slowly and eventually stabilize at approximately 50 °C. The LHS unit gradually stores heat during this process.
Class III: The outdoor AC unit defers to run and the chip runs at full power. Under this working condition, the AC unit does not run, the temperature of water increases rapidly, while the LHS unit is about to store heat quickly. After a period of time, the AC unit keeps opening, the water temperature drops to about 50 °C, and the LHS unit slowly stores heat.
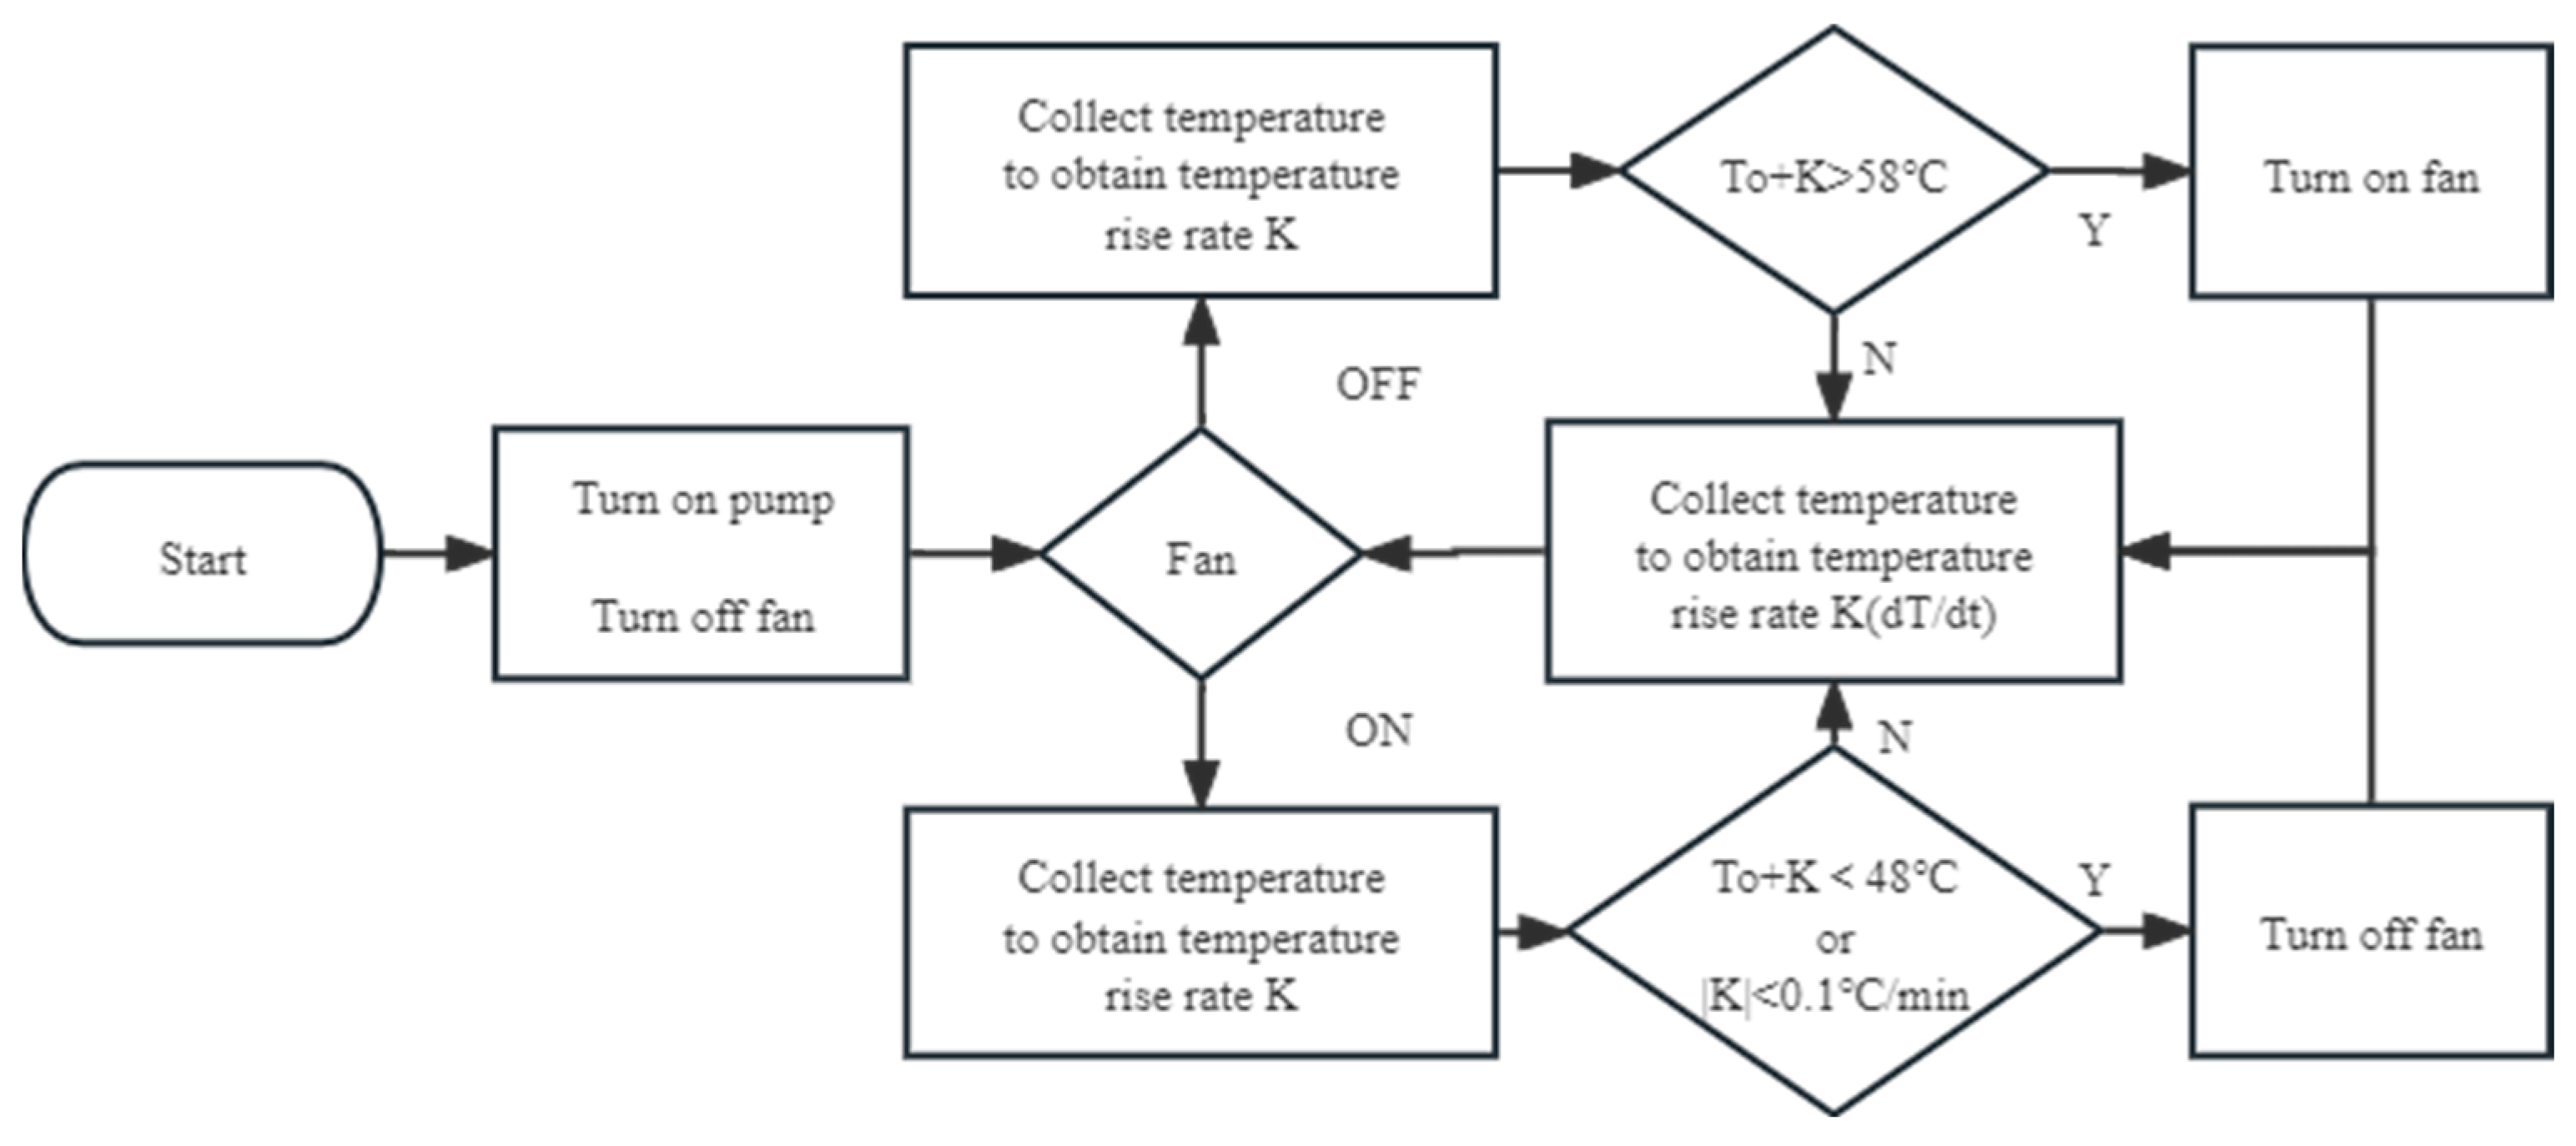
Class IV: The outdoor AC unit runs intermittently and the chip runs at full power. In this case, the temperature of water drops rapidly when the AC unit is running. When it reaches 60 °C, the automatic control system opens the fan, and closes after the water temperature drops to 48 °C. Under full load operation for 8 h, the fan is turned on four times.
These four operating conditions demonstrate that when the outdoor AC unit maintains continuous positive airflow supply, the system only consumes pump power. If the positive pressure supply becomes unstable, the system can still operate continuously for 4 h. After this period, the automatic control system supplements a small amount of fan power to sustain operation. The 15% efficiency improvement is quantified as follows. Under natural convection (Class II with AC off), the coil heat transfer coefficient is h_nat = 15 W/m2·K. When the outdoor AC unit operates, the residual pressure increases face velocity by 1.2 m/s, enhancing h_forced to 22 W/m2·K (calculated from Q = h·A·ΔT using measured heat flux Q = 85 W, area A = 0.12 m2, ΔT = 32 °C). The heat dissipation improvement is (22 − 15)/15 = 47% in h, but due to the thermal resistance network (coil convection accounts for only 35% of total resistance), the overall system efficiency improves by 15%.
3.5. Economy Evaluation
The calculation of cooling load is the main basis of HVAC equipment selection, and the composition of indoor cooling load can be understood according to the calculation. Accuracy, simplicity and high efficiency should be considered in the selection of cooling load calculation method [
39]. The existing calculation method includes total equivalent temperature/time average method, heat capacity method, heat balance method and so on [
40,
41]. Herein, the research object is a university office, and the cooling load coefficient method [
42] is used to calculate its indoor cooling load. The cooling load is calculated by summing up the following items individually: (1) Incoming cooling load
Q1 through the envelope; (2) heat dissipation
Q2 of human body and lighting; (3) heat dissipation
Q3 of equipment and other internal heat sources.
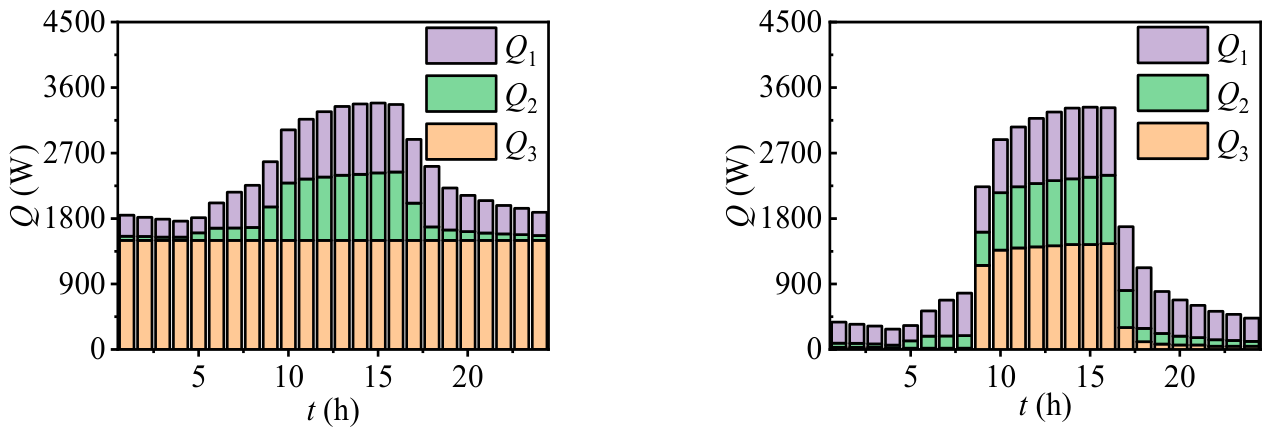
Based on the information presented in
Figure 12, it is evident that the contribution of computer equipment to indoor cooling load is significant. Under the operating condition where equipment runtime is synchronized with personnel working hours, the equipment cooling load
Q3 accounts for over 50% of the total cooling load at 9:00 when work commences; during working hours, the proportion of equipment cooling load
Q3 consistently exceeds 40%; during remaining time periods, the envelope cooling load
Q1 dominates. The data from
Figure 12 show that computer equipment exerts a crucial impact on determining the overall cooling load in indoor environments. In this experiment, it is assumed that the computer equipment operates at maximum capacity throughout the entire working day. This means that the computers are constantly running and consuming electricity. As a result, the building’s AC system is required to work harder for constant comfortable temperature indoors. According to the calculation of the rated refrigeration coefficient of the AC system, it is estimated that at least 500 W of electricity is needed to effectively dissipate 1500 W of heat generated inside the building. This demonstrates the significant energy requirements and thermal management challenges associated with running computer equipment at full load for extended periods of time.
To validate the long-term operational performance of the designed thermal management system under actual working conditions, the system was placed in a real environment for continuous operation over a one-week period.
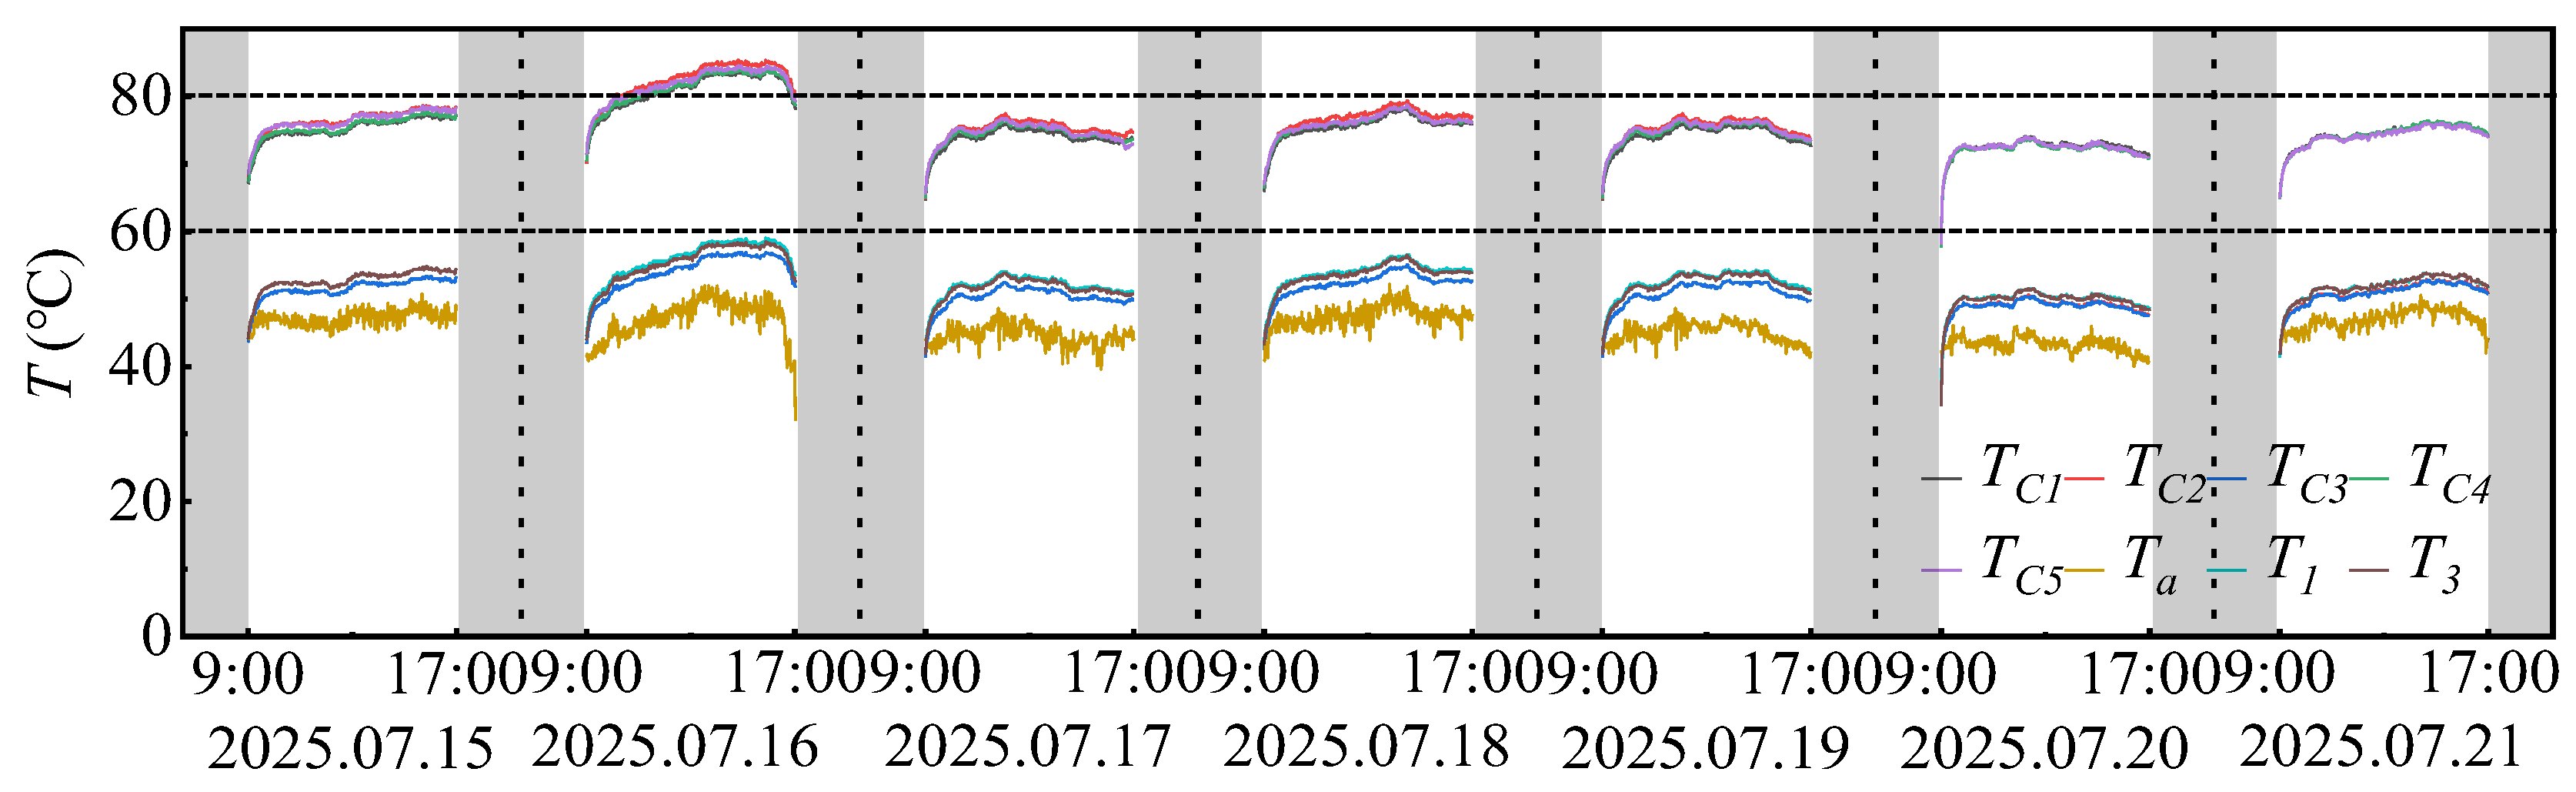
Figure 13 presents the variation curves of circulating water temperature and chip surface temperature during the operation period, The gray areas in the figure represent nighttime hours. It should be noted that the heating plates operated at full power exclusively during working hours (09:00–17:00), while the heating plates and circulating water pump were powered off during remaining periods.
Throughout the testing period, the outdoor air temperature remained continuously above 40 °C, causing the building HVAC system to operate around the clock; consequently, the thermal management system was constantly subjected to Type II operating conditions with the outdoor unit of the air conditioner continuously activated. Under such rigorous conditions, the circulating water temperature was consistently maintained below 60 °C, and the chip surface temperature did not exceed 80 °C, demonstrating that the system possesses favorable thermal stability and environmental adaptability.
While dedicated cyclic testing was not performed, the one-week continuous operation (
Figure 13) provides indirect evidence of cycling stability. The system experienced daily thermal cycles (09:00–17:00 heating, 17:00–09:00 cooling/solidification) for 7 days. Key observations: (1) Daily temperature profiles show consistent phase-change plateau behavior, indicating repeatable melting-solidification. (2) No performance degradation is observed; day 7 peak temperature matches day 1 within 1 °C. (3) This operational stability suggests PCM integrity is maintained over at least 14 complete cycles. We acknowledge that dedicated accelerated cycling tests (>100 cycles) would strengthen long-term reliability claims and identify this as future work.
It is important to clarify the system boundary for energy accounting (
Table 3). The outdoor AC unit is part of the existing building HVAC infrastructure serving the entire office zone, not a component dedicated to our thermal management system. Its compressor power is accounted in the building’s overall HVAC energy, not in our system’s 125 W. The 75% and 40% savings refer specifically to the dedicated thermal management equipment (pumps, fans, LHS units) replacing conventional computer cooling solutions. We acknowledge that under extreme conditions (>40 °C ambient), the building HVAC COP decreases, but this affects baseline HVAC energy equally and does not change the relative savings of our dedicated system.
3.6. Optimization of the LHS Unit
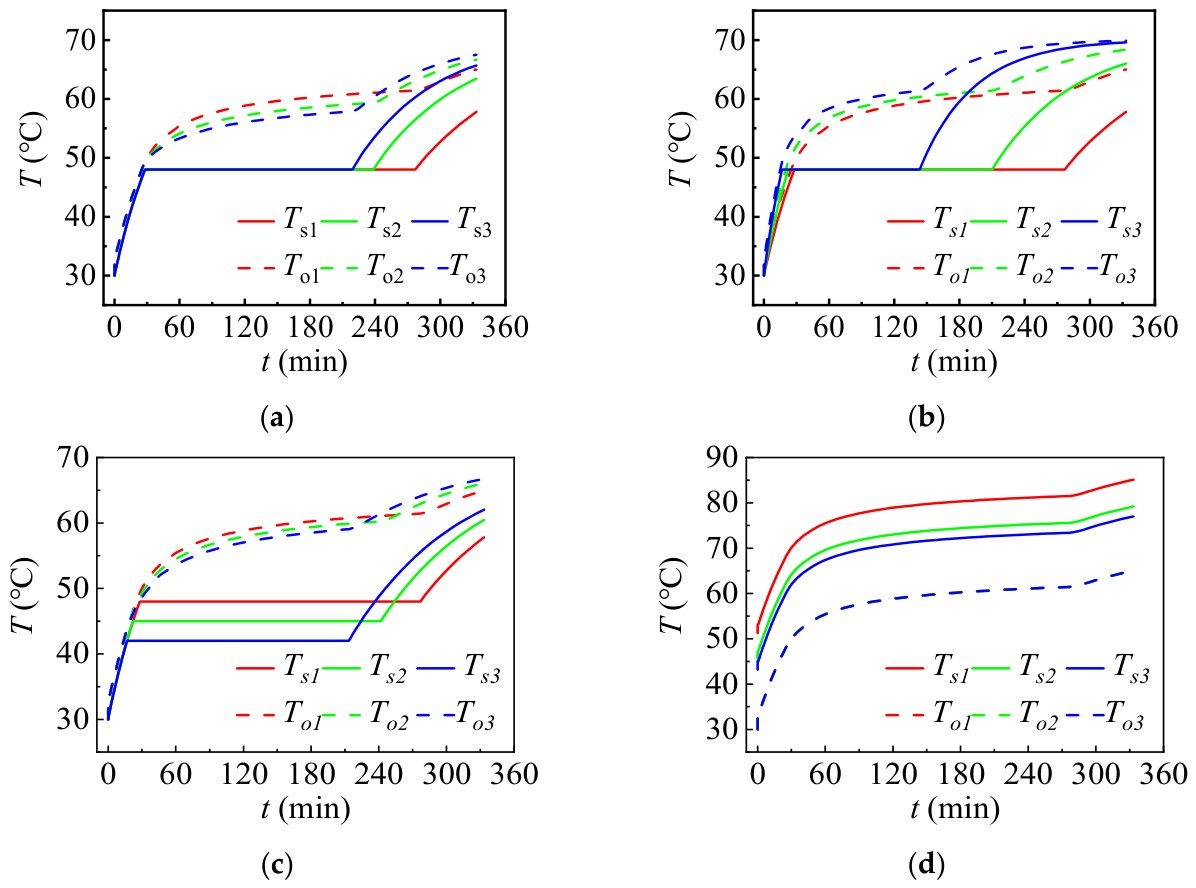
As shown in
Figure 14a, the temporal variations of the LHS unit outlet temperature
To and the solid–liquid interface temperature
Ts are presented under different thermal conductivity conditions (0.2 W/m
2·K in red, 0.3 W/m
2·K in green, and 0.4 W/m
2·K in blue). Owing to the relatively low thermal conductivity of the phase change material (PCM) 0.2 W/m
2·K, the circulating water temperature remains significantly higher than the PCM temperature during heat transfer. As PCM thermal conductivity increases from 0.2 to 0.4 W/m·K, the phase-change completion time decreases from 180 min to 120 min, indicating accelerated heat absorption rates. However, the total latent heat capacity (20 kg × 200 kJ/kg = 4000 kJ) remains unchanged. Therefore, higher conductivity improves the thermal response speed but does not increase total storage capacity. For applications requiring prolonged temperature stabilization, lower conductivity may be preferable as it sustains the phase-change plateau longer.
Additionally, altering the PCM mass within the system also affects the temperature profiles.
Figure 14b demonstrates the temporal evolution of the LHS unit outlet temperature
To and the solid–liquid interface temperature
Ts for PCM filling masses of 20 kg (red), 15 kg (green), and 10 kg (blue). The results indicate that reducing the PCM filling mass from 20 kg to 10 kg shortens the thermal storage time of the system, leading to insufficient long-term control of the circulating water temperature.
Figure 14c illustrates the variations of the LHS unit outlet temperature
To and the solid–liquid interface temperature
Ts at phase change temperatures of 48 °C (red), 45 °C (green), and 42 °C (blue). As the phase change temperature decreases, the circulating water temperature declines correspondingly. However, due to the increased heat transfer temperature difference, the heat absorbed from the circulating water per unit time increases, thereby shortening the constant-temperature thermal storage duration. This suggests that reducing the PCM phase change temperature can also serve as an optimization strategy.
As depicted in
Figure 14d, the temporal variations of the LHS unit outlet temperature
To and the solid–liquid interface temperature
Ts are shown for cold plate heat transfer coefficients of 1300 W/m
2·K (red), 1400 W/m
2·K (green), and 1500 W/m
2·K (blue). The chip surface temperature decreases with increasing cold plate heat transfer coefficient, indicating that enhancing the heat transfer performance of the cold plate can effectively reduce the chip surface temperature. In summary, increasing the PCM thermal conductivity and its filling mass can reduce the temperature difference during heat transfer while maintaining a stable thermal storage duration. Selecting PCMs with lower phase change temperatures contributes to decreasing both the circulating water temperature and the chip surface temperature, although the effect is limited and challenges regarding higher costs remain. Furthermore, increasing the PCM mass and adopting low phase change temperature PCMs may lead to elevated material expenses and could potentially affect the efficiency and stability of the heat release process.
3.7. Validation Strategy
The numerical model is validated through a three-tier hierarchical validation strategy, with quantitative accuracy targets defined a priori to ensure rigorous and objective assessment. At Level 1 (component validation), the cold plate’s heat transfer coefficient
K and coolant outlet temperature
T0 are compared against steady-state experimental data presented in
Section 3.1 and
Figure 8, with a predefined target of RMSE less than 5% of the measured temperature range; the model achieves an RMSE of 3.2 °C (5.3%), satisfying this criterion. At Level 2 (subsystem validation), the transient thermal response of the latent heat storage (LHS) unit, including water temperatures at the inlet (
T1), center (
T2), and outlet (
T3), as well as the PCM temperature, is benchmarked against time-resolved experimental measurements under dynamic operating conditions (
Section 3.2,
Figure 9), targeting an RMSE below 10% of the temperature range; the simulation yields an RMSE of 4.1 °C (6.8%), a MAPE of 8.3%, a coefficient of determination (
R2) of 0.94, and a steady-state deviation of less than 2 °C, thereby meeting all specified metrics. At Level 3 (system-level validation), the model’s predictive capability over extended operation is evaluated by comparing simulated and measured temperature profiles across a continuous one-week field test under real ambient conditions (
Figure 13), with the validation criterion requiring day-to-day steady-state temperature deviations of less than 2 °C; the experimental data exhibit variations of less than 1 °C over seven days, confirming consistent cyclic performance and long-term model fidelity. The validation employs a comprehensive set of error metrics, including RMSE, MAPE,
R2, and steady-state temperature deviation, and is further supported by a detailed error source analysis and sensitivity study in
Section 3.2, which examines the impact of ±10% uncertainties in key parameters such as PCM thermal conductivity and heat transfer coefficient, thereby establishing the model’s robustness and delineating its domain of applicability.
4. Conclusions
This study addressed the centralized thermal management requirements of high-power-density computing clusters in office environments. A hybrid liquid cooling system that integrates latent heat storage with outdoor natural cooling sources was proposed and experimentally validated. The thermal control loop comprising six-chip simulated heat sources, a phase change material storage unit, and a fan coil unit was constructed, incorporating control strategies and utilization of building environmental waste energy to achieve high efficiency and reliability in heat dissipation performance.
(1) The hybrid liquid cooling system integrating latent heat storage (LHS) with outdoor natural cooling sources maintains chip surface temperatures below 80 °C, the industrial safety threshold, while stabilizing the circulating water temperature at approximately 60 °C. This temperature range effectively matches the operating interval of paraffin-based phase change materials with a melting point of 48 °C, thereby fully exploiting their capability for transient thermal peak absorption.
(2) The total power consumption of the system is merely 125 W, achieving a 75% energy saving compared to conventional building-dependent cooling systems that require 500 W to manage equivalent thermal loads. When compared to natural cooling solutions relying solely on outdoor cold air, which consume 210 W, the operational energy consumption can be reduced by 40%. It should be noted that the positive pressure environment generated by the air outdoor units increases the face velocity of the fan coil unit by 1.2 m/s, providing an additional 15% enhancement in heat dissipation efficiency. This demonstrates the effective utilization of residual energy from existing building equipment.
(3) Increasing the thermal conductivity of the phase change material reduces the heat transfer temperature difference but shortens the heat storage duration, whereas increasing the filling mass helps extend the period of constant temperature regulation. This indicates that LHS design requires balancing conductive performance against heat storage capacity according to load characteristics.