Article

Equipment Selection Optimization and Empirical Analysis of Operational Performance for a Commercial Building Refrigeration Plant


1
School of Ocean Engineering, Guangzhou Maritime University, Guangzhou 510725, China
2
R&D Department, Guangzhou Shijie Energy-Saving Technology Co., Ltd., Guangzhou 510440, China
3
Engineering Design Business Department, Nanjing Fiberglass Research & Design Institute Co., Ltd., Nanjing 210012, China
4
School of Low-Altitude Equipment and Intelligent Control, Guangzhou Maritime University, Guangzhou 510725, China
5
School of Future Transportation, Guangzhou Maritime University, Guangzhou 510725, China
*
Authors to whom correspondence should be addressed.
Buildings 2026, 16(11), 2067; https://doi.org/10.3390/buildings16112067
Submission received: 8 April 2026 / Revised: 9 May 2026 / Accepted: 20 May 2026 / Published: 22 May 2026
(This article belongs to the Special Issue Development of Indoor Environment Comfort)

Abstract

Climate change necessitates a global transition toward green and low-carbon development, underscoring the critical importance of energy efficiency. Buildings account for a substantial portion of urban energy consumption and carbon emissions, with central air-conditioning systems representing the largest energy-consuming component. This study focuses on optimizing equipment selection—including chillers, pumps, and cooling towers—for the refrigeration plant of a commercial complex in Xiamen. Following theoretical optimization, the operational performance of the implemented system was empirically analyzed using long-term monitoring data from 2024 to 2025. The results demonstrate an energy efficiency ratio (EER) of 5.44 in 2024 and 5.28 in 2025, surpassing the Grade I efficiency threshold (5.2) stipulated by the Chinese standard T/CRAAS 1039-2023. Monthly EER values consistently remained above 5.06 throughout the cooling season. Detailed performance analysis of individual equipment further confirmed that actual operational performance of chillers, pumps, and cooling towers closely matched or even exceeded rated performance metrics, with chiller efficiency deviations controlled within 5%. This study integrates optimized equipment selection at the design stage with empirical performance analysis based on actual operation, providing a validated approach for improving the energy efficiency of refrigeration plants in commercial buildings and offering valuable references for the revision of relevant energy efficiency standards.

1. Introduction

Climate change has driven a global shift toward green and low-carbon development. Within this context, China has established the “dual carbon” strategic goals of achieving carbon peak before 2030 and carbon neutrality before 2060. Among the pathways to these objectives, the efficient utilization of energy stands out as a core technological approach, making its advancement and innovation particularly critical and urgent. Buildings are responsible for about 70% of urban primary energy consumption, 36% of global energy demand and 37% of energy-related CO2 emissions, making improvements in their energy efficiency crucial for advancing socially sustainable development [1,2,3]. Within modern buildings, central air-conditioning systems constitute the largest energy-consuming component, accounting for over half of total building energy use [4]. Furthermore, refrigeration plants represent the primary energy consumers in central air-conditioning systems, responsible for more than half of their total energy demand. Consequently, optimizing equipment selection in refrigeration plants emerges as a key approach for achieving building energy conservation.
Previous research has primarily focused on two pathways for enhancing refrigeration plant efficiency: design optimization and operational optimization. Design optimization focuses on improving energy efficiency through optimizing the design schemes of refrigeration plants [5,6,7,8,9,10,11]. Studies highlight the critical impact of system configuration on energy performance. Research shows that energy consumption can vary by as much as 69% depending on the number and size of chillers deployed [5]. Chen [6] presents a thermal resistance-based method to optimize central chiller systems by directly solving optimal exchanger areas and pump/fan speeds via Lagrange multipliers. ASHRAE Learning Institute provides the fundamental principles and practical methods for the design and control of central chilled water plants, covering equipment selection, system configuration, operation optimization, and energy-efficient control strategies [7]. Peterson [8] provides practical guidelines for optimizing large central chilled water systems through proper coil and valve selection and recommends non-decoupled direct building connections to improve efficiency and stability. Ho [9] optimizes campus chilled water building connections, reducing central distribution pump energy consumption by using low-pressure distribution and building-side booster pumps. Other work has employed detailed simulations of multiple configurations and control strategies to identify optimal system designs [10]. Furthermore, comprehensive multi-criteria evaluation frameworks have been developed and applied to select suitable central air-conditioning schemes, balancing energy efficiency, cost, and environmental impact [11]. Operational optimization employs methods such as genetic algorithms [12,13], particle swarm optimization [14,15], reinforcement learning [16,17] or model predictive control (MPC) [18,19] to determine the optimal combinations of equipment start–stop operations and operational parameters for improving the energy efficiency of refrigeration plants. In summary, most previous studies conducted system design optimization based on theoretical calculations and simulation models. Such studies fail to conduct real-condition validation supported by long-term measured data and rarely address the optimization and field-measurement validation of chillers, water pumps and cooling towers.
To address this research gap, this study focuses on a commercial complex in Xiamen and optimizes the equipment selection for its refrigeration plant design, including chillers, chilled water pumps, cooling water pumps, and cooling towers. Combined with hourly operational monitoring data from 2024 to 2025, the actual operational performance of the refrigeration plant is analyzed on a monthly basis and during the hottest week. By evaluating the real-world performance of key equipment, this research integrates design-stage equipment selection optimization with operational-stage performance assessment, providing a basis for enhancing system energy efficiency through optimized equipment selection in high-efficiency plants. Furthermore, it offers data support for the future revision of China’s Energy Efficiency Standard for High-Efficiency Air-Conditioning and Refrigeration Plant Systems.

2. Building Cooling Load Characteristics

This study focuses on a commercial complex in Xiamen, consisting of a commercial podium and a terminal building. This Xiamen commercial complex was selected because it is located in the Hot Summer and Warm Winter Zone—a major energy-intensive region for commercial buildings in southern China—while also offering the rare availability of complete two-year continuous operational monitoring data (2024–2025) essential for empirical validation. The total floor area of the project is 264,000 m2, with an air-conditioned area of 67,039 m2 in the commercial section. The commercial building has a height of 35 m, comprising two basement levels and six above-ground floors.
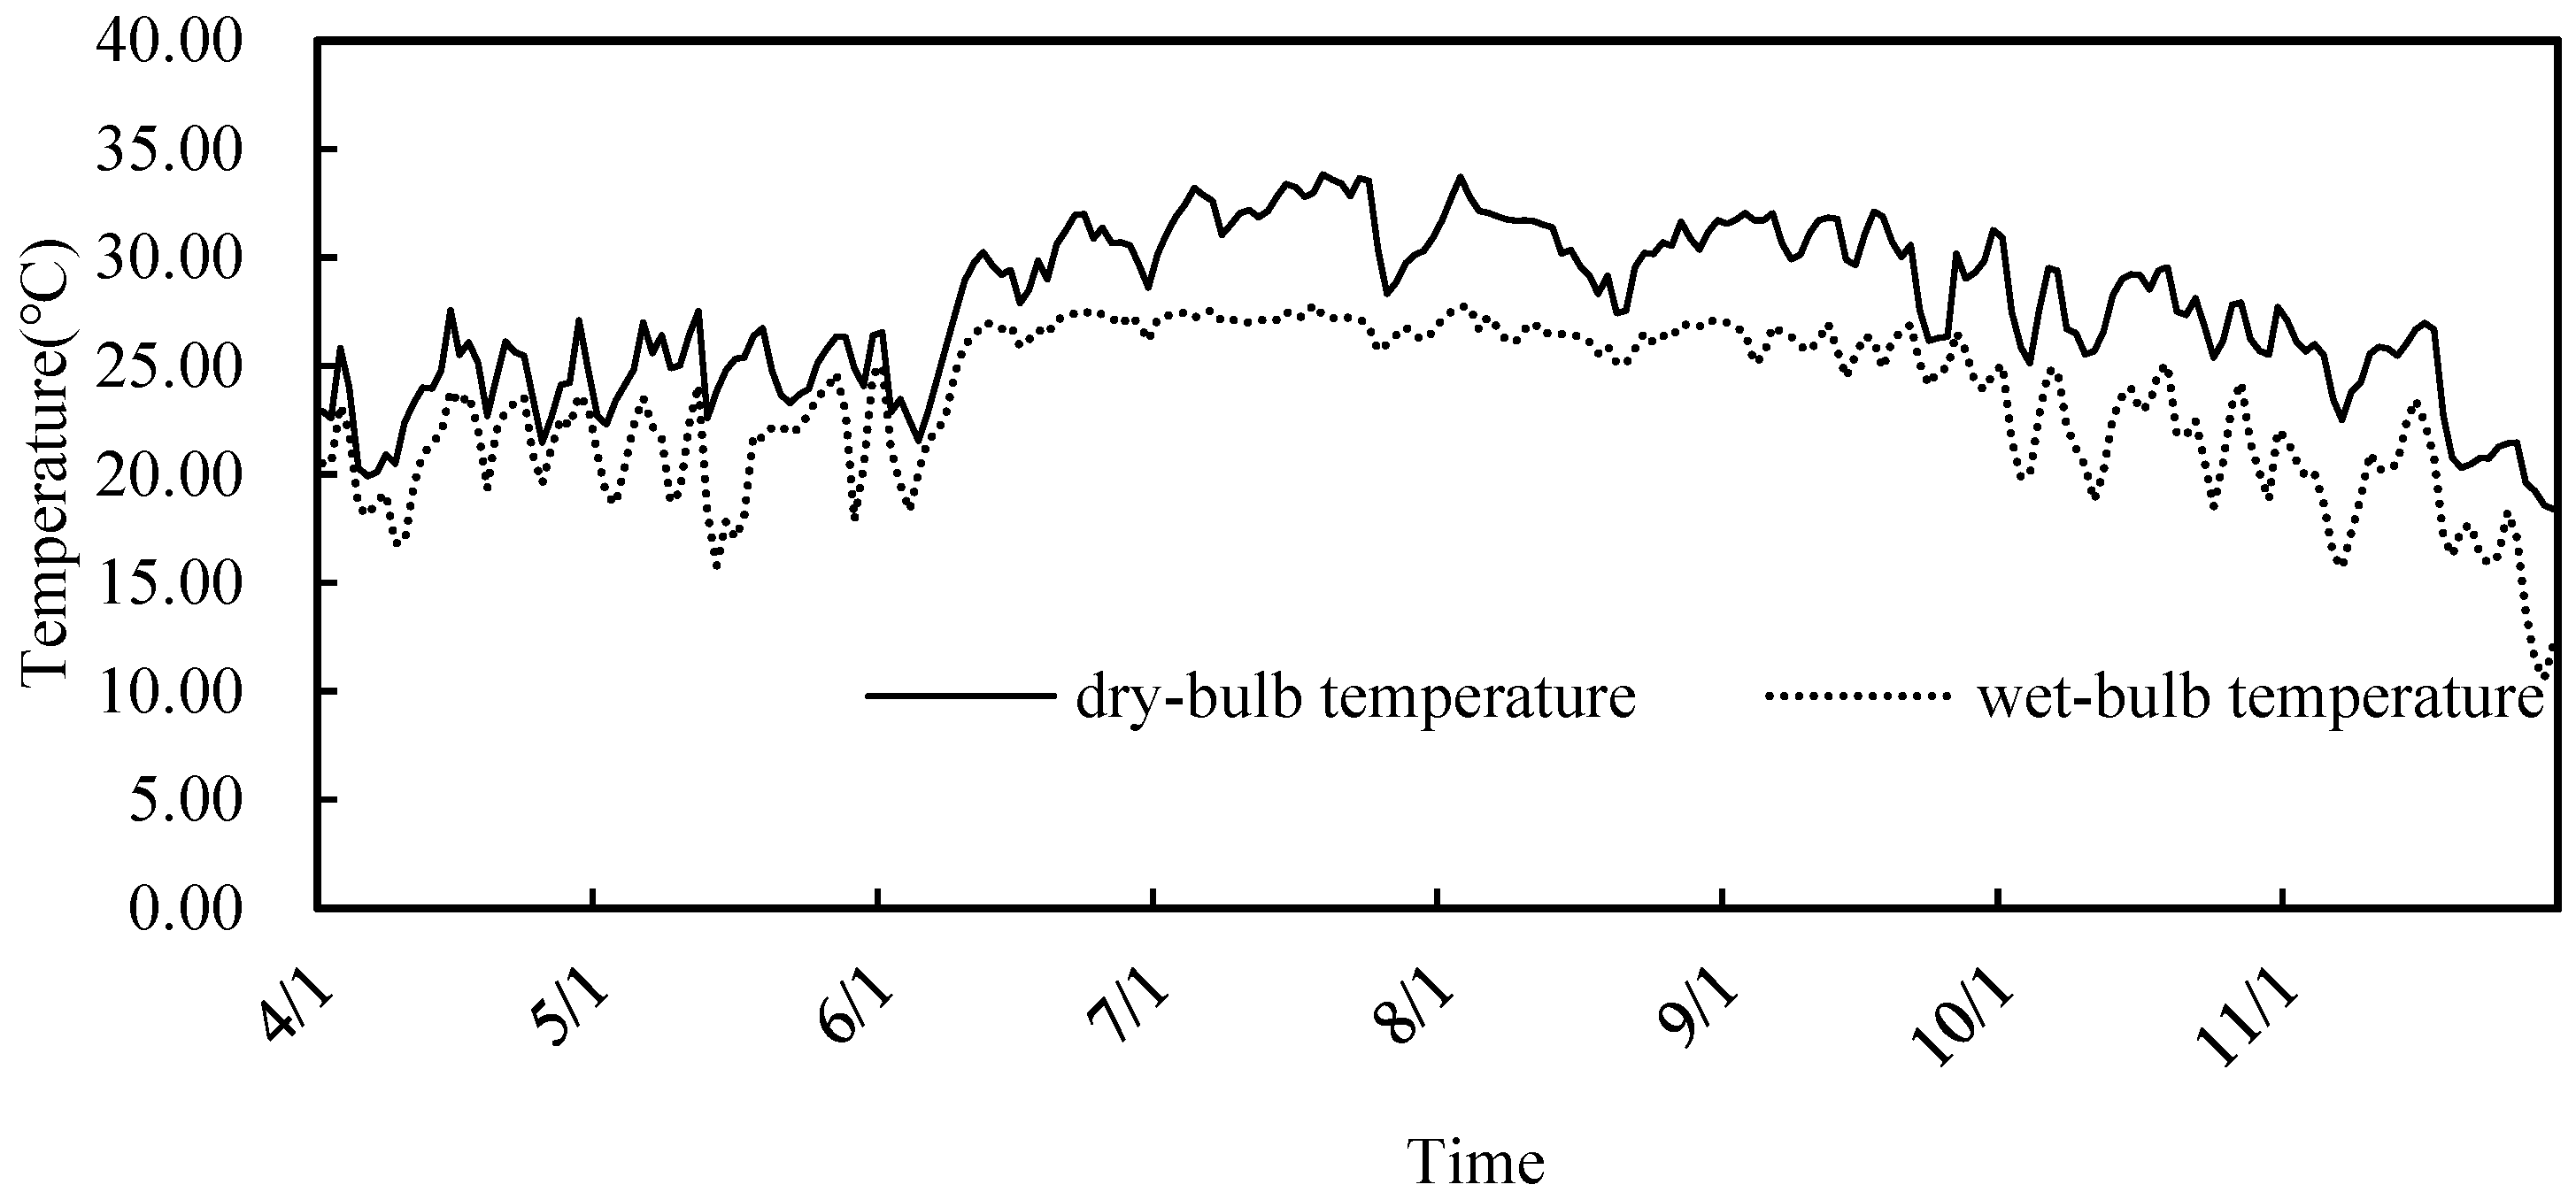
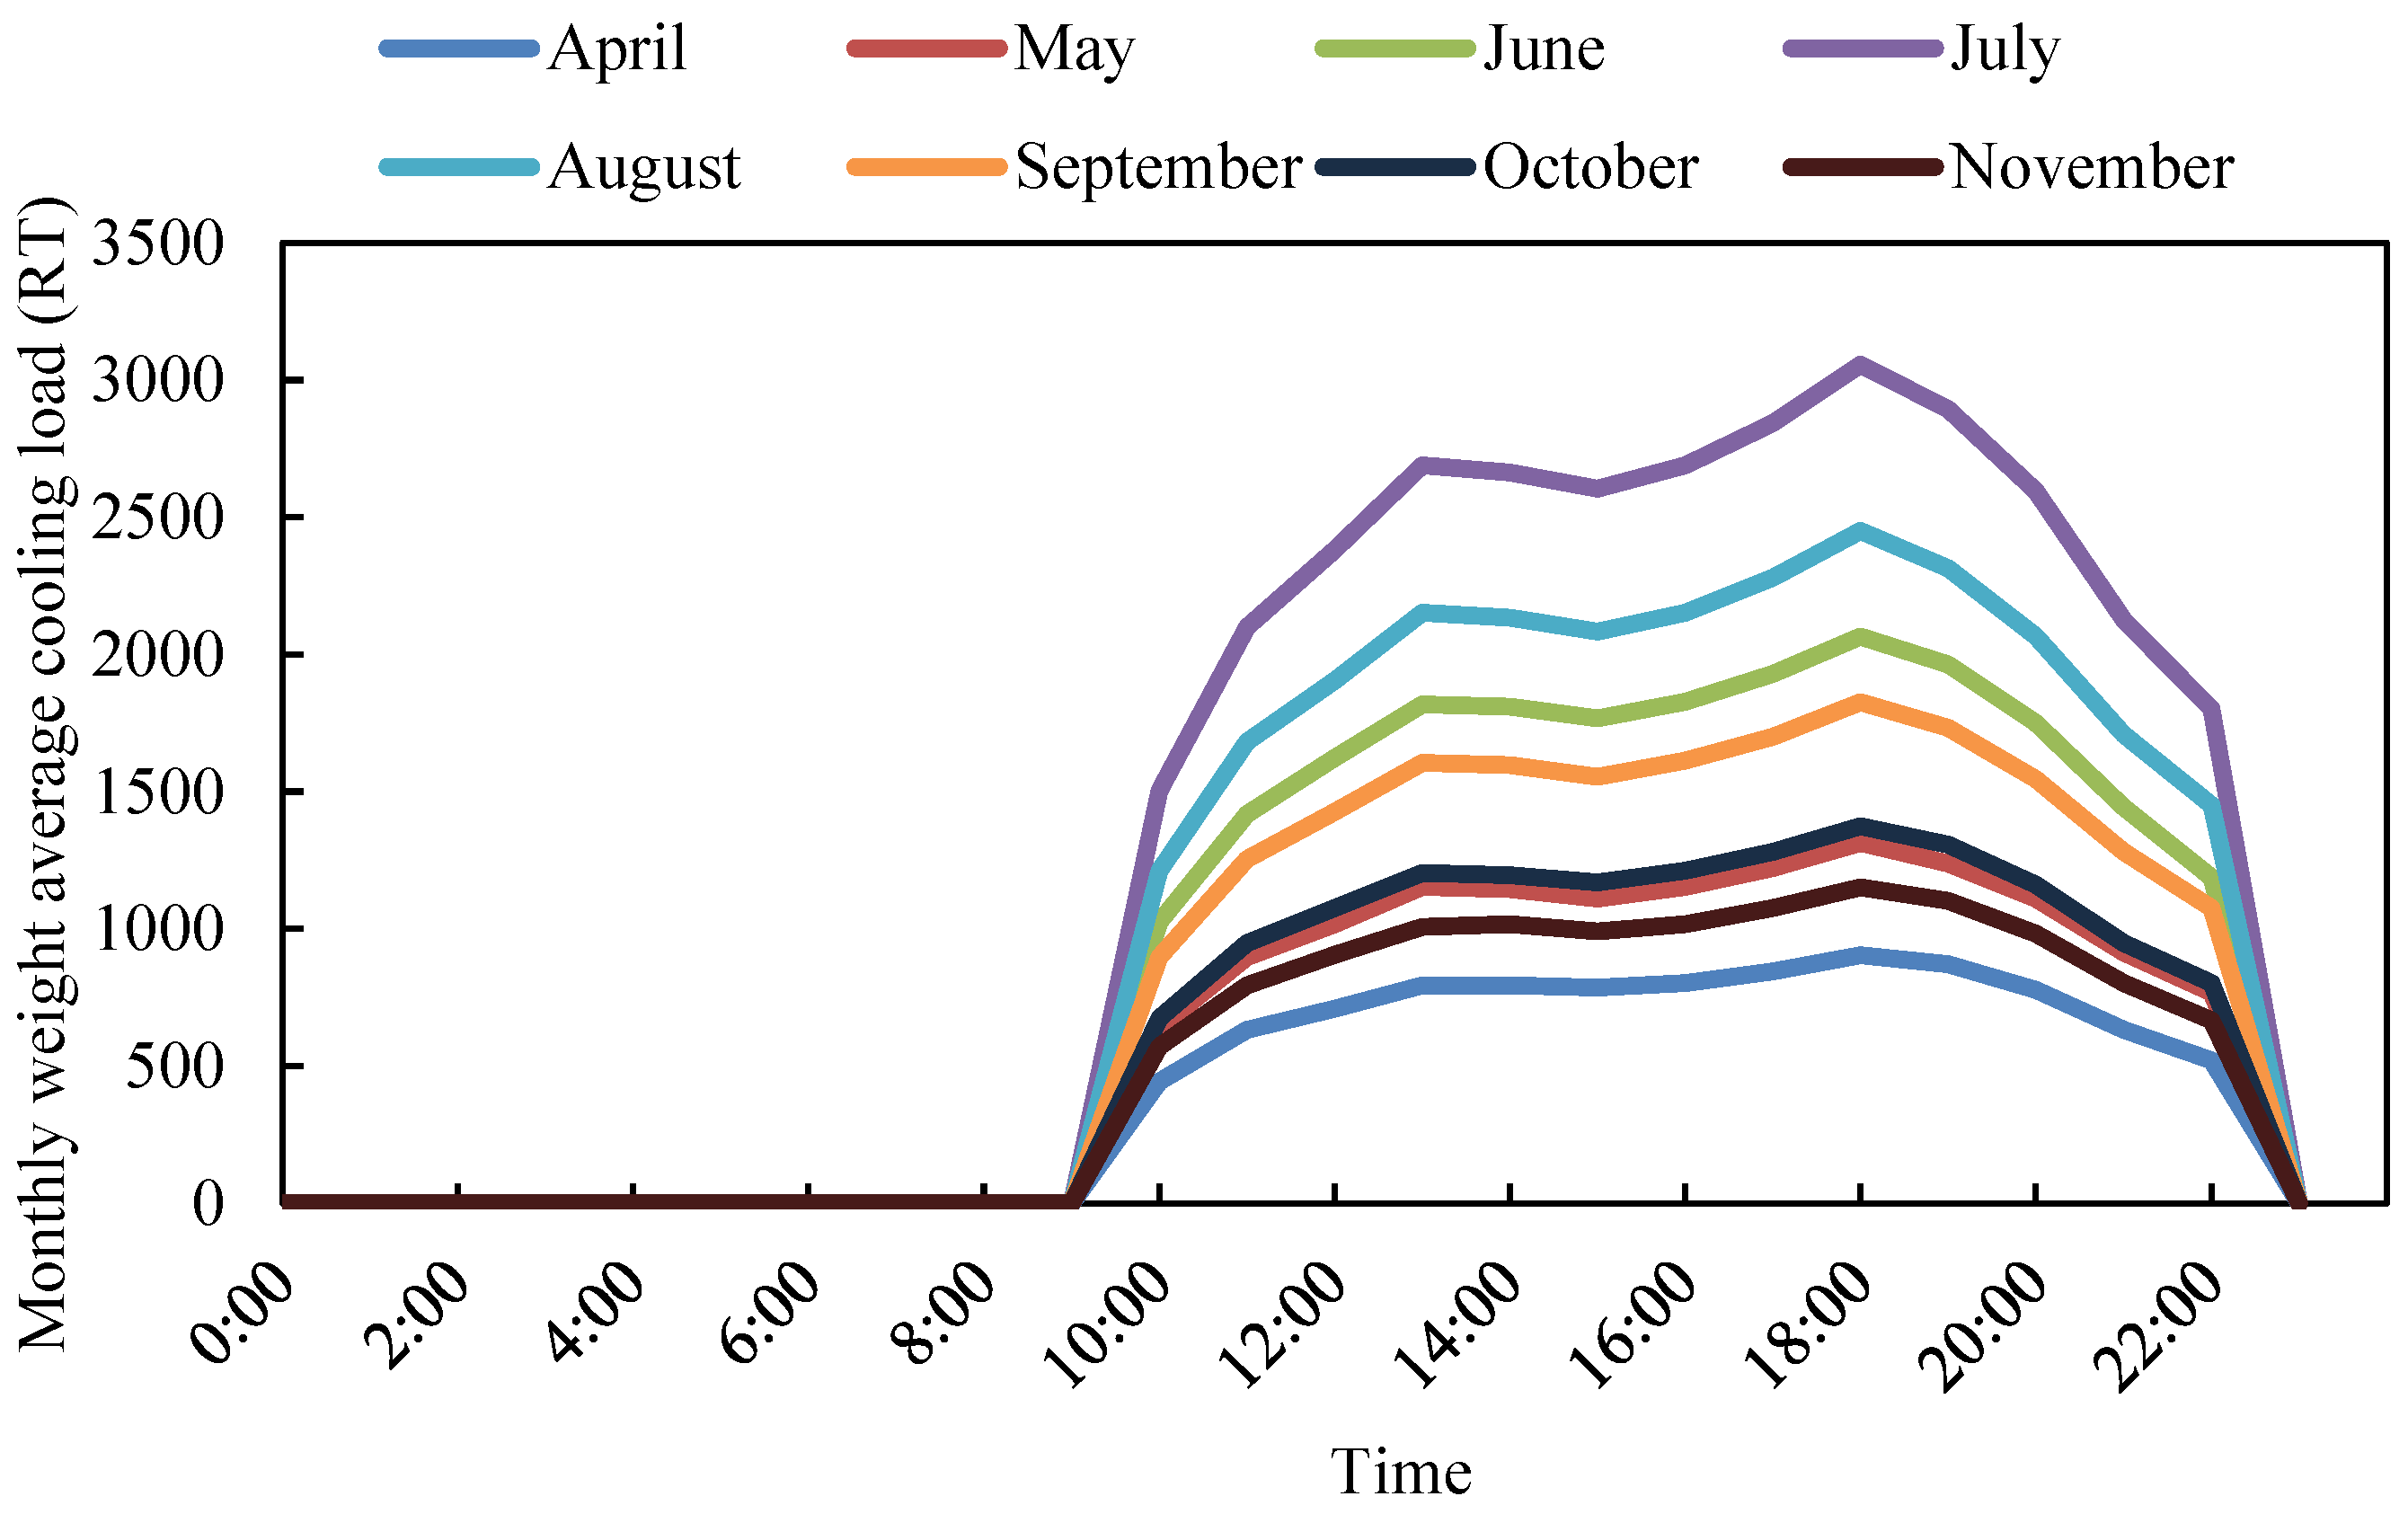
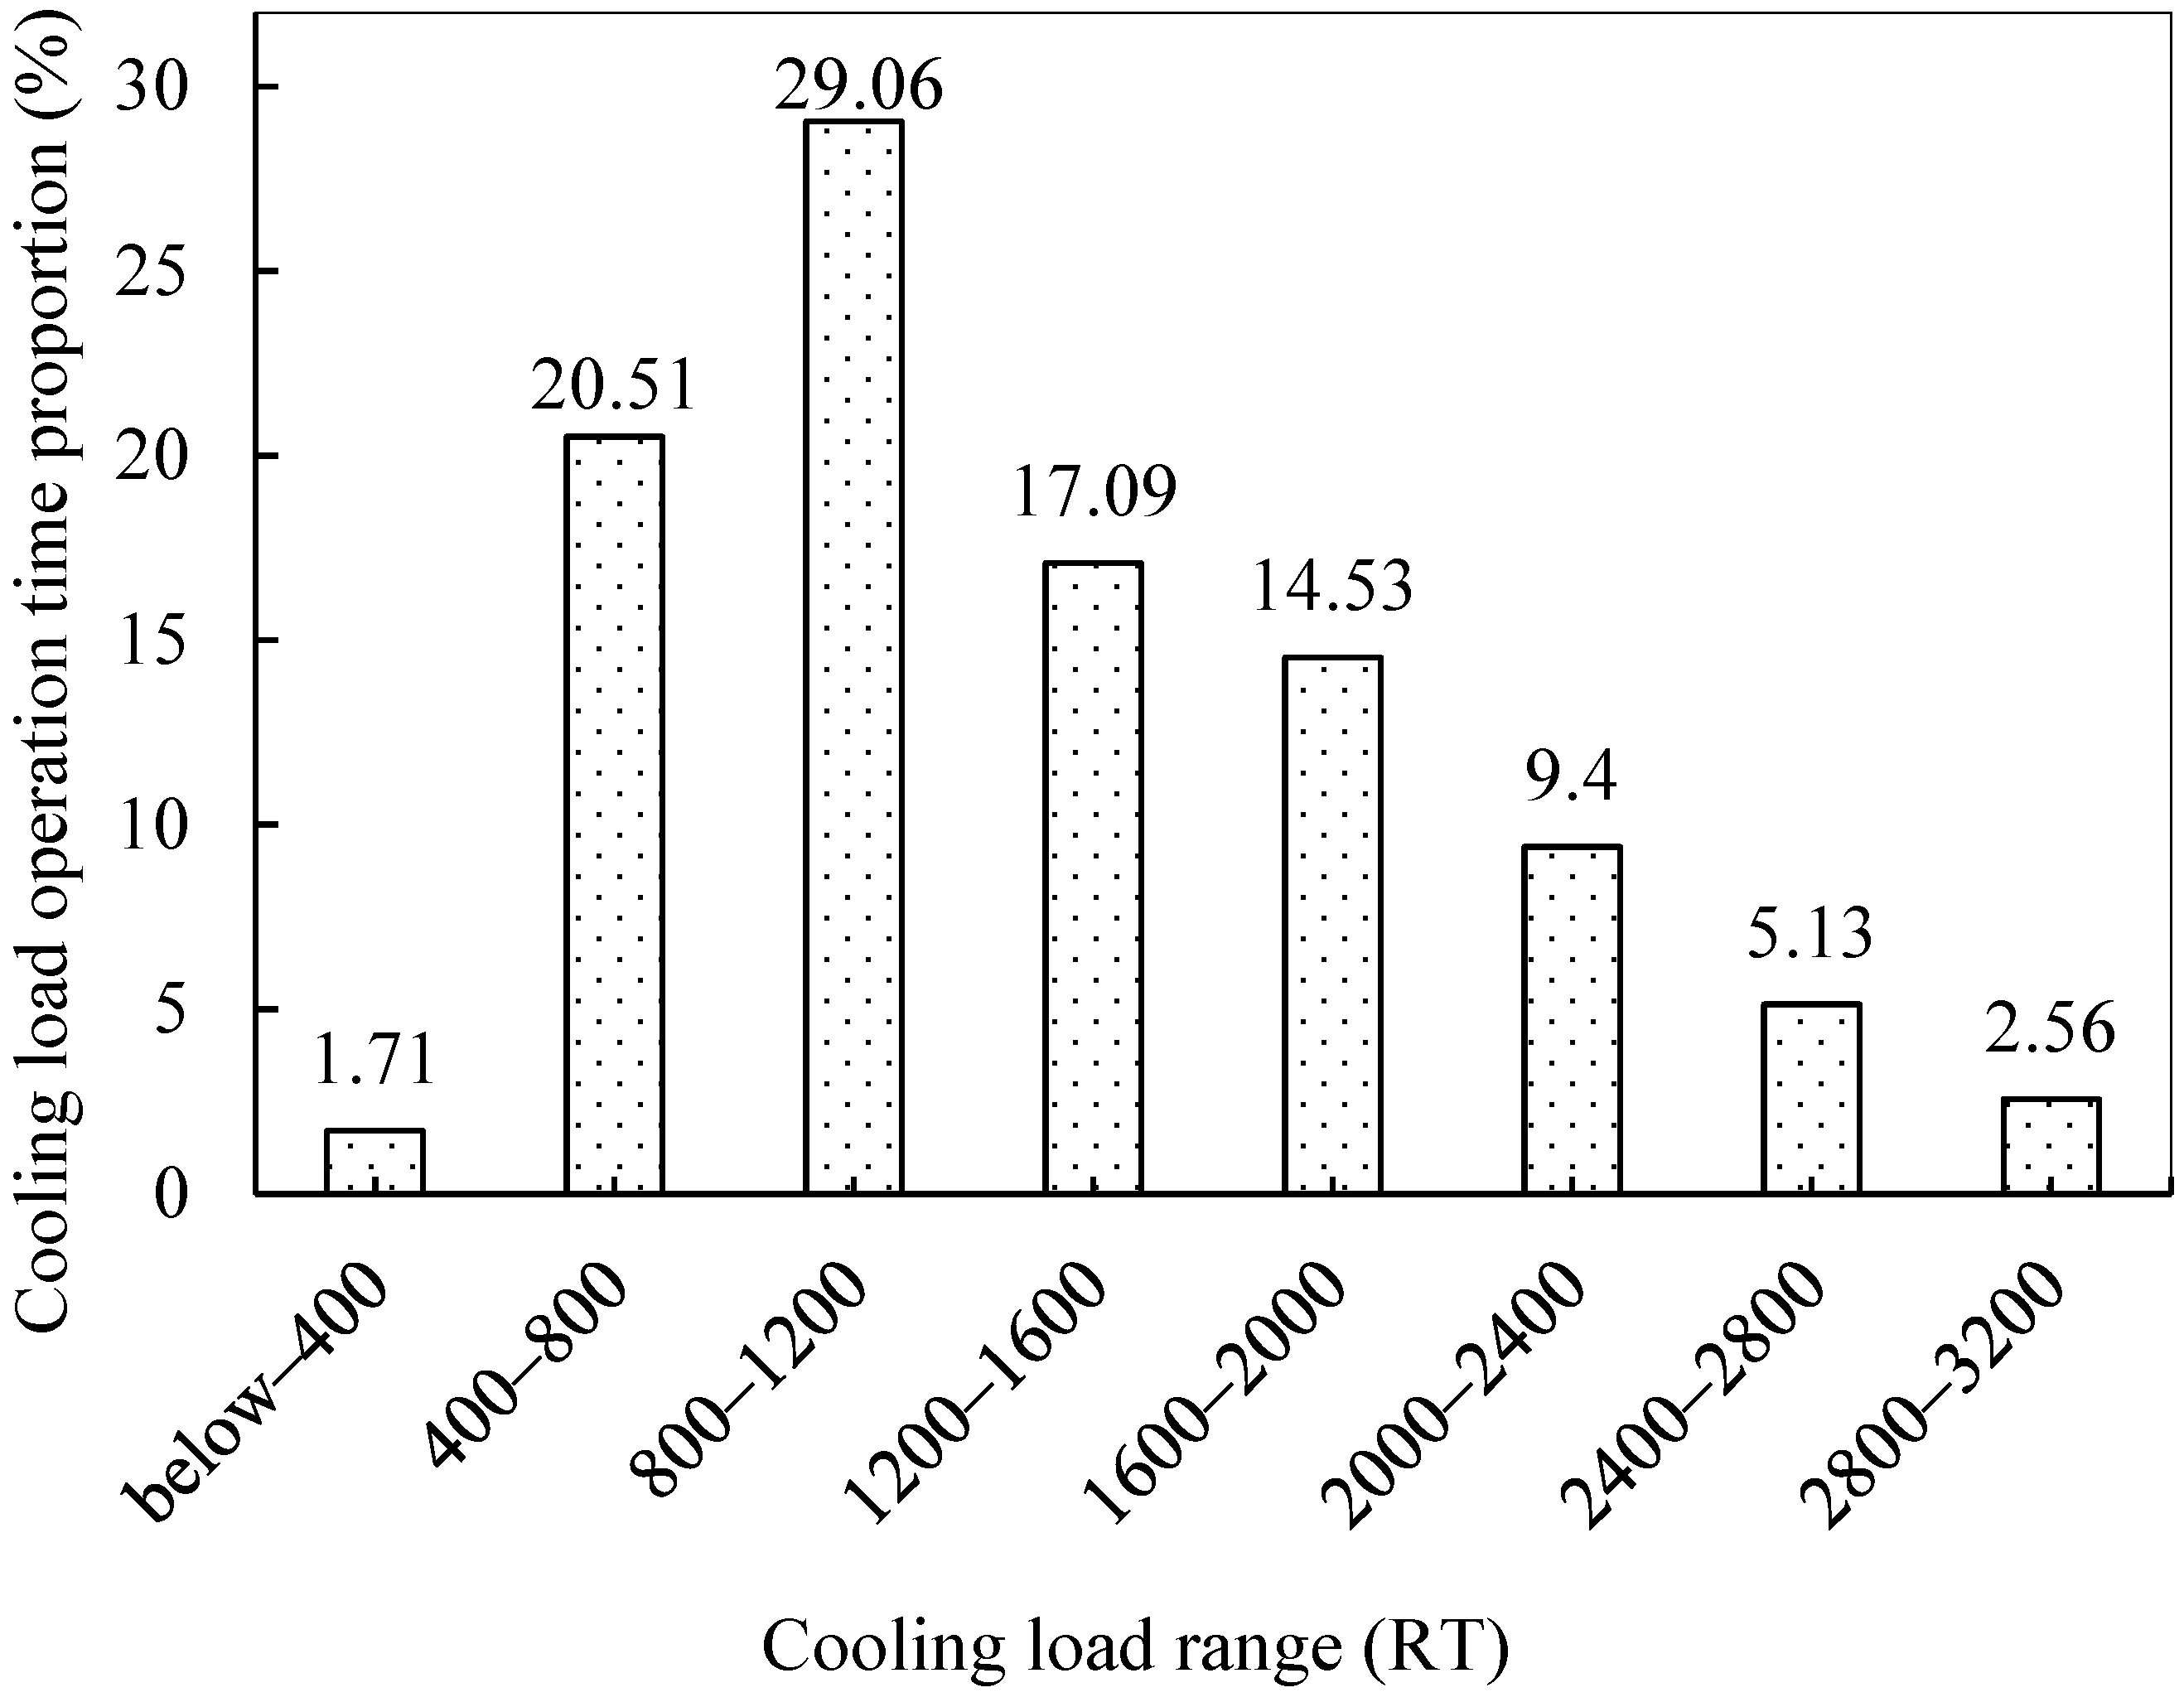
The outdoor dry-bulb and wet-bulb temperature distribution for Xiamen is presented in Figure 1, with design values of 33.5 °C and 27.5 °C, respectively. Using the cooling load coefficient method based on monthly weighted daily dry-bulb and wet-bulb temperatures, monthly weighted cooling load characteristics for each month were calculated. Parameter settings, including the thermophysical properties of building envelopes, internal heat loads, and indoor air temperature and humidity, comply with the national energy efficiency design code GB 50189-2015 [20] for public buildings. Building cooling load calculation results are illustrated in Figure 2. The results show that the total cooling load peaks in July and reaches its minimum in April. Analysis of the annual load profile (Figure 2) enabled the determination of operational duration proportions across different cooling load ranges, as summarized in Figure 3. Operational time for loads below 400 RT accounts for only 1.71% of the total annual runtime, while the range of 2800–3200 RT represents merely 2.56%. The load range of 800–1200 RT accounts for the largest proportion of annual operational time, at 29.06%. The above annual load profile and distribution of operating time across various cooling load intervals inform the chiller configuration strategy to ensure high efficiency across typical operating conditions.
Given the extended cooling season in Xiamen—lasting approximately 200 days from mid-to-late April to early November—the potential for energy savings through optimized system design is considerable.

3. System Form and Equipment Selection Optimization

3.1. System Form

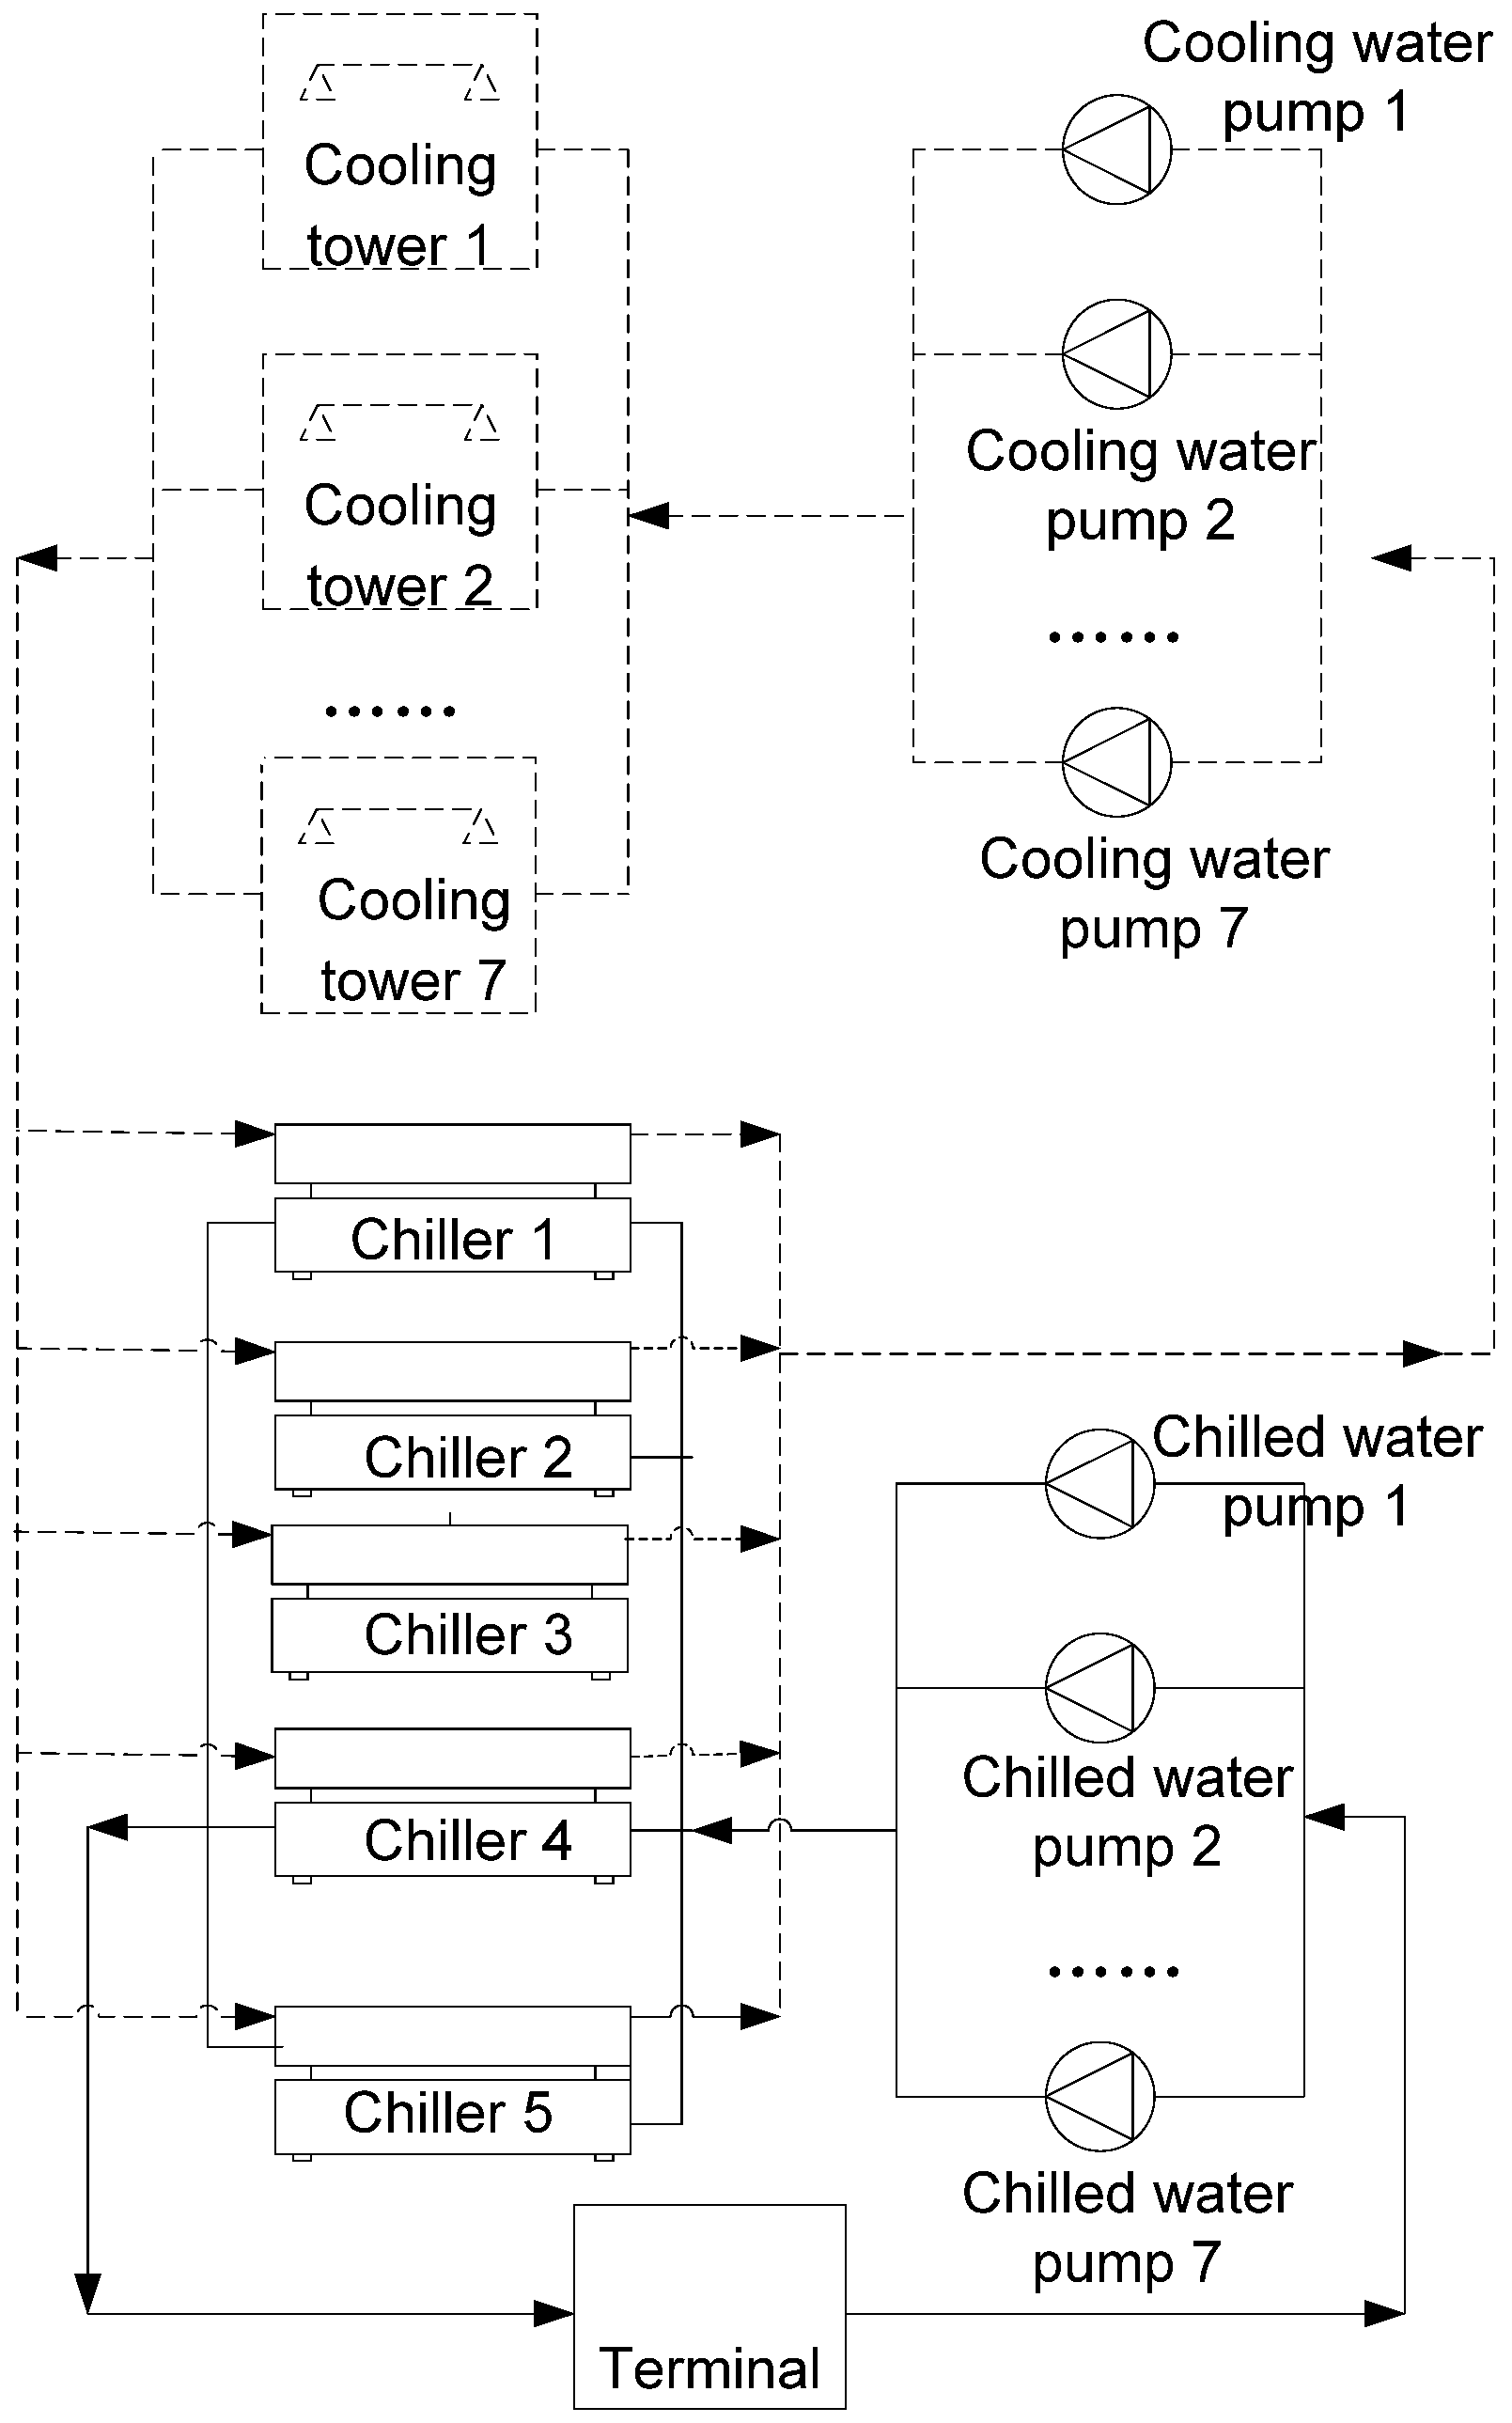
The detailed design of the refrigeration plant energy system is illustrated in Figure 4. The system consists of five chillers, seven chilled water pumps, seven cooling water pumps, and seven cooling towers. In terms of control strategy, both the chilled water system and the cooling water system employ a constant temperature difference control method to ensure stable operation and optimize energy efficiency under varying load conditions. Specifically, the temperature difference between the supply and return chilled water is maintained at 6 °C, while that for the cooling water is set at 5 °C. Meanwhile, to enhance cooling efficiency and energy savings, the fan frequency of the cooling towers is regulated using a constant approach temperature control strategy. This approach maintains a fixed temperature difference between the cooling tower outlet water and the wet-bulb temperature, enabling precise adjustment of cooling tower operation and reducing energy consumption.

3.2. Equipment Energy Consumption Models

The total energy consumption of a refrigeration plant system comprises the electrical demand of chillers, water pumps, and cooling towers, as modeled in Equation (1).
E C t o t a l = E C c h i l l e r + E C p u m p + E C t o w e r
where ECchiller is the energy consumption of chillers [kWh].
ECpump is the energy consumption of pumps [kWh].
ECtower is the energy consumption of cooling towers [kWh].
The energy consumption models of chillers, pumps, and cooling towers are described as follows:
(1)
Chiller Energy Consumption Model.
By applying the MP model [21] and performing multiple linear regression on the sample parameters, the following energy consumption model for the water-cooled chiller is derived as Equation (2).
E C c h i l l e r = E C c h i l l e r , r × f ( P L R ) × f ( T e o , T c i )               = E C c h i l l e r , r × ( a 1 + a 2 P L R + a 3 P L R 2 ) × ( a 4 + a 5 T e o + a 6 T e o 2 + a 7 T c i + a 8 T c i 2 + a 9 T e o T c i )
where PLR is the chiller’s part load ratio, which is calculated as the ratio of the actual cooling capacity to the rated cooling capacity of the chiller.
Teo is the evaporator outlet temperature, K.
Tci is the condenser inlet temperature, K.
a1 to a9 are regression coefficients.
(2)
Pump Energy Consumption Model.
Analysis of the variable-frequency pump sample parameters reveals a quadratic polynomial relationship between its energy consumption and flow rate [22], leading to the following energy consumption model:
E C p u m p = E C p u m p , r × f ( ν ) = E C p u m p , r × ( b 1 + b 2 ν + b 3 ν 2 )
where ECpump,r is the rated energy consumption of the pump, [kWh].
v is the water flow, m3/h.
b1 to b3 are regression coefficients obtained by using the multiple linear regression tool based on pump sample parameters.
(3)
Cooling Tower Energy Consumption Model.
Cooling tower fan energy consumption is often calculated using the semi-empirical Braun model [23]. While it can predict thermal performance, it fails to capture the coupled relationship between the cooling tower approach temperature, chiller energy use, and overall system efficiency. Consequently, it cannot assess the impact of approach temperature variations on system optimization under identical cooling loads.
To address this limitation, this study utilizes 21,369 validated datasets provided by the Cooling Technology Institute’s standardized performance tables. A Gradient Boosting Regressor model was developed with 200 trees, a 0.1 learning rate, and a maximum depth of 4. The model achieves high predictive accuracy: based on our prior studies, the test results show that the coefficient of determination R2 reaches 0.9977, the root mean square error (RMSE) is 0.1034, the mean absolute error (MAE) is 0.0485, and the mean absolute percentage error (MAPE) is only 4.65% [24]. Crucially, the model accurately quantifies the impact of the approach degree on system efficiency, thereby overcoming a key shortcoming of the traditional Braun model.
Cooling tower energy consumption is calculated as follows [23]:
E C t o w e r = C × E C r a t e d × η η 0 × Q a c t u a l Q r a t e d
where C is a dimensionless conversion factor employed to standardize the units between the performance coefficient and power parameters, C = 0.871.
ECrated is the rated energy consumption of the cooling tower.
η is the performance coefficient under current operating conditions.
η0 is the performance coefficient under base operating conditions.
Qactual is the actual water flow of the cooling tower, m3/h.
Qrated is the rated water flow of the cooling tower, m3/h.

3.3. Equipment Selection Optimization

(1)
Chiller.
The analysis of the building cooling load characteristics (Figure 2) and load operation time distribution (Figure 3) indicates that for 80% of the year, the cooling load falls within the range of 400–2400 RT. To ensure high energy efficiency ratios (EERs) across various load segments, a chiller configuration of four 900 RT units plus one 600 RT unit is selected. Under low-load conditions, the 600 RT unit can operate efficiently. Therefore, the original design, designated as the baseline scheme, consists of four 900 RT constant-speed drive (CSD) chillers and one 600 RT variable-speed drive (VSD) chiller, with a total chiller pressure drop of 8 mH2O. Based on this configuration, two optimized schemes—optimization scheme 1 and optimization scheme 2—are proposed by separately optimizing the chiller’s fixed/variable-frequency configuration and the pressure drop. Relevant parameters are presented in Table 1.
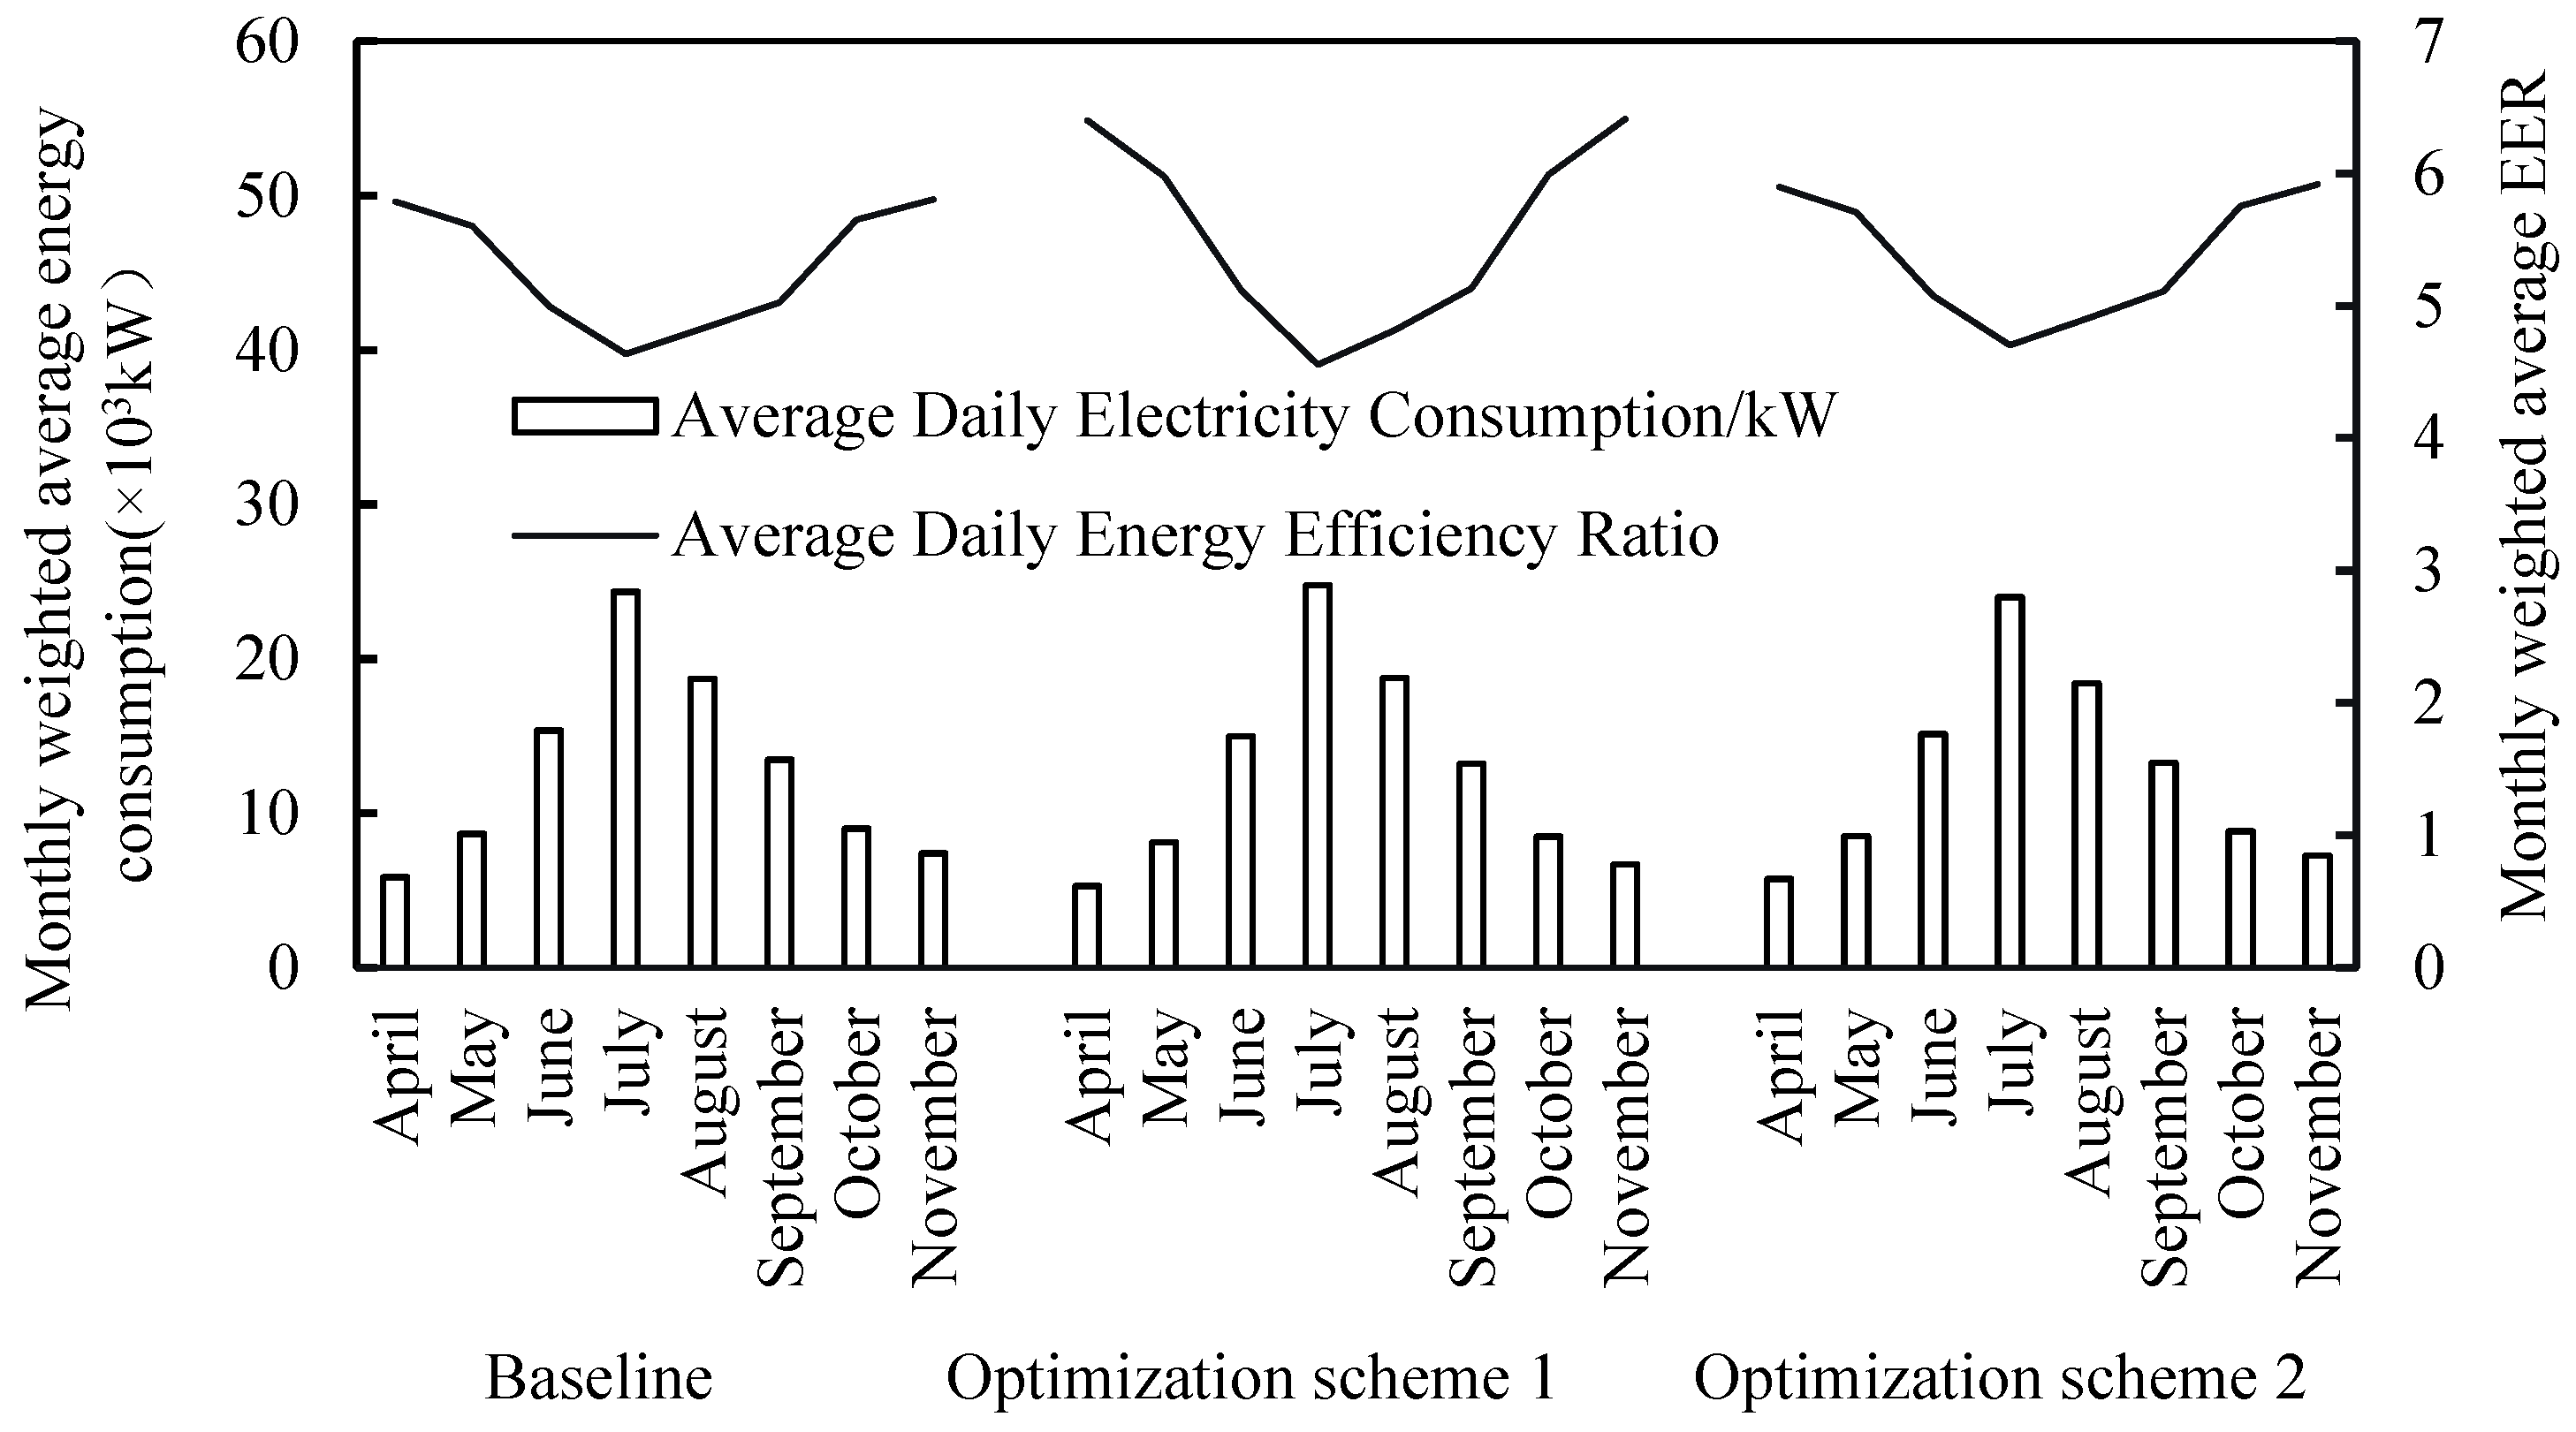
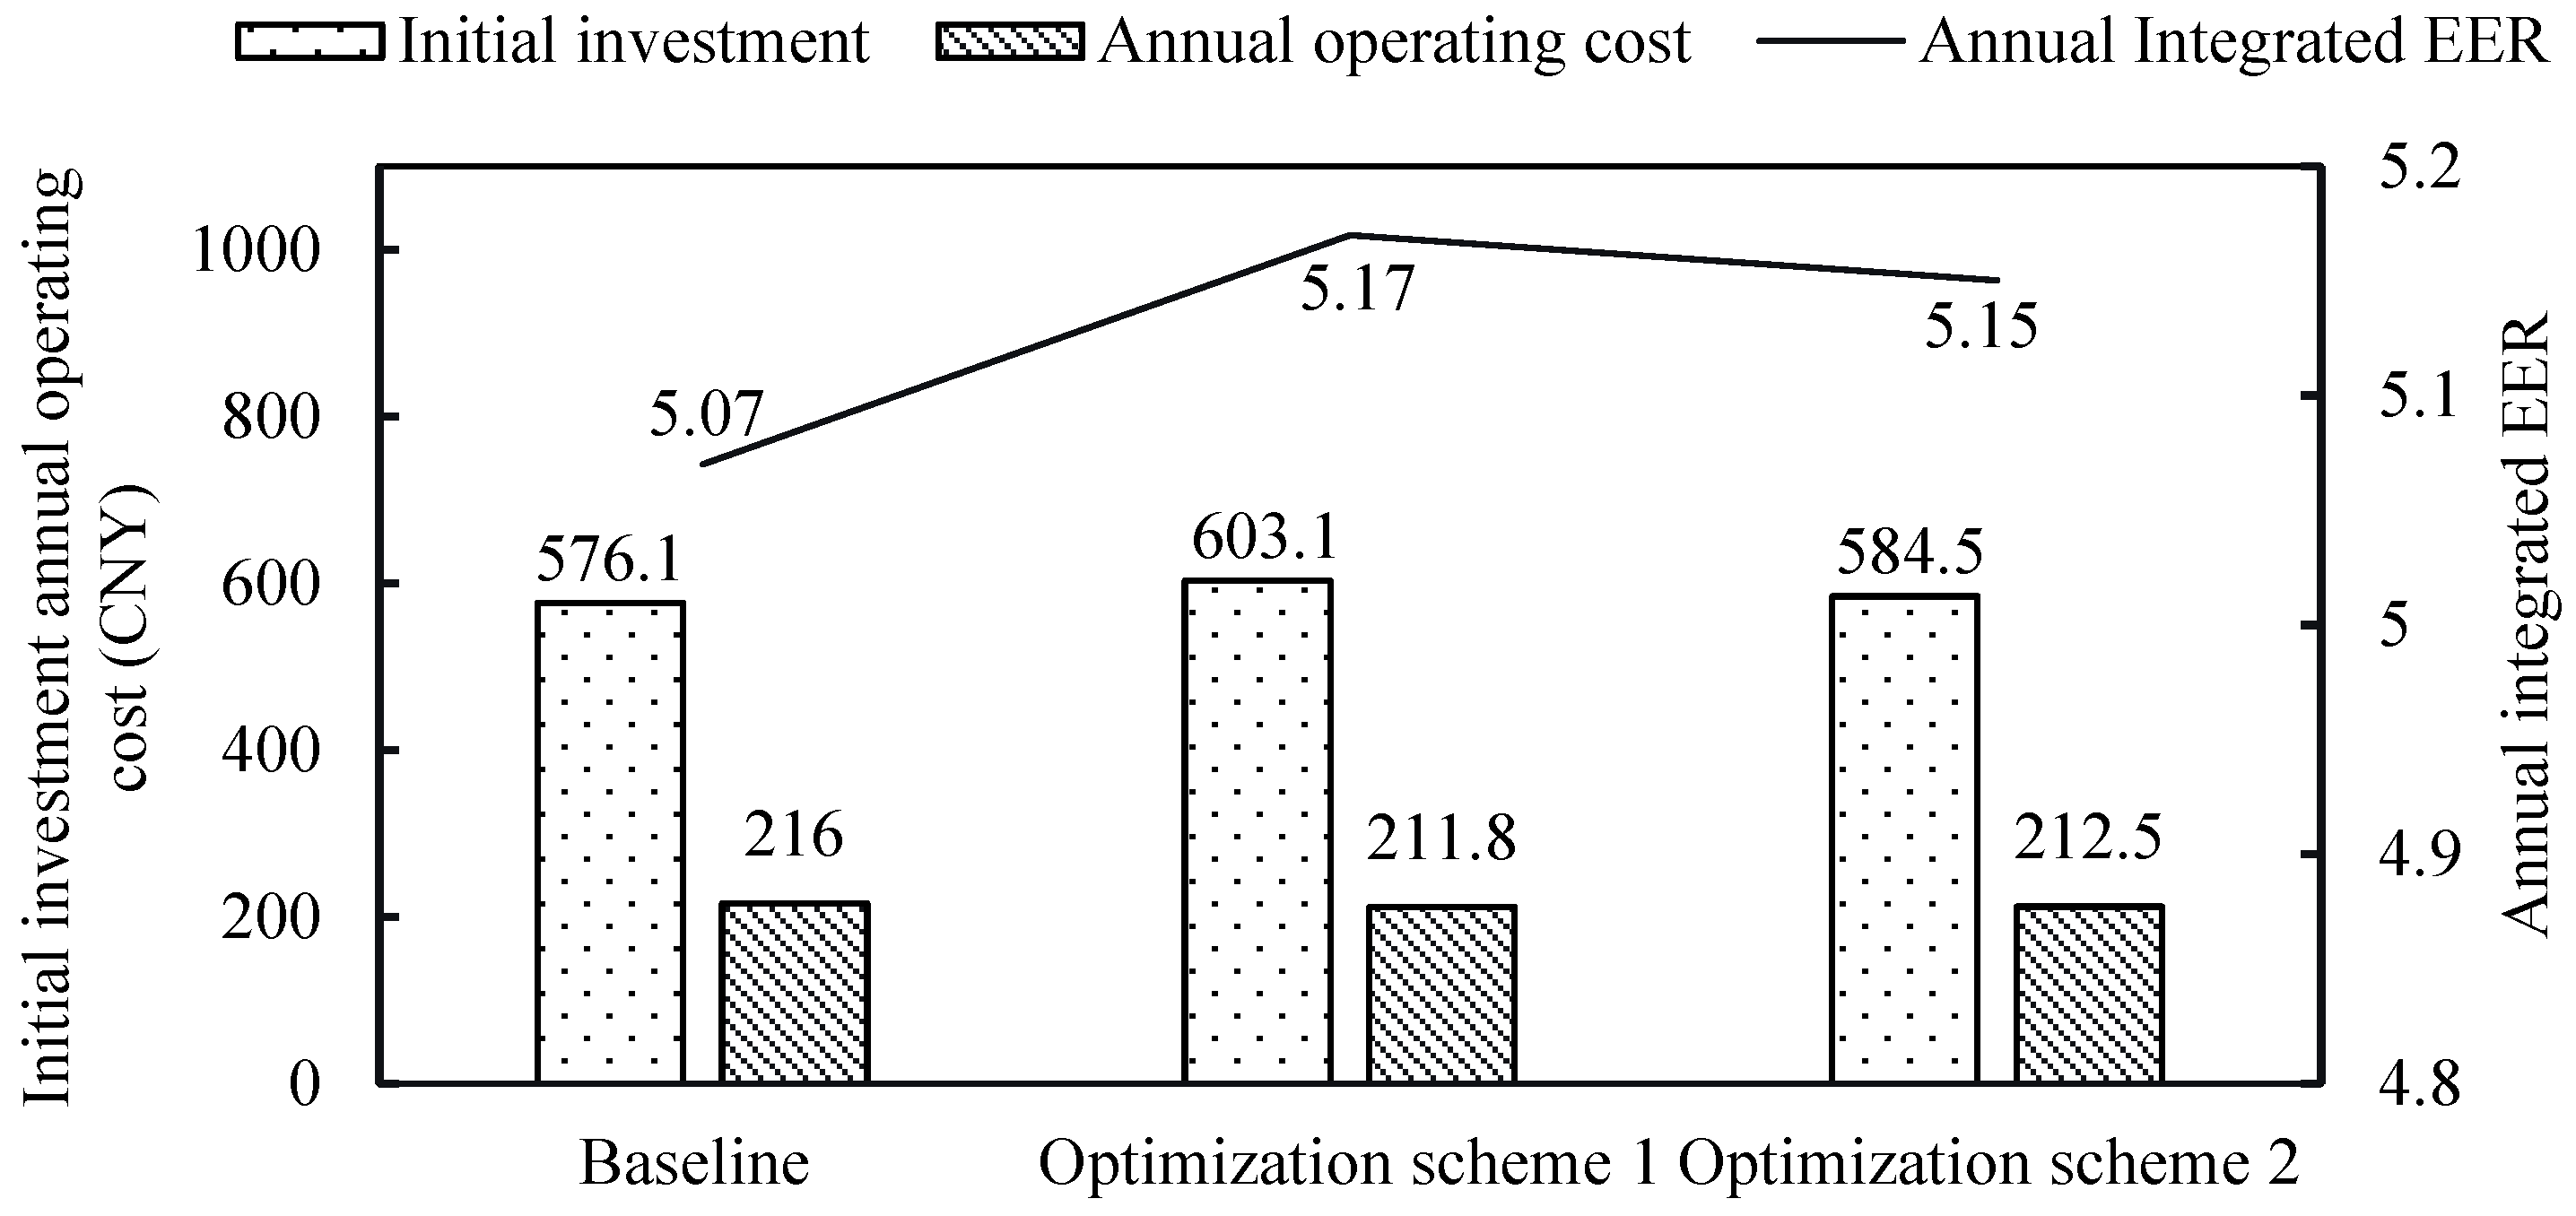
Based on the building load characteristics and the energy consumption models of individual equipment, the monthly weighted average energy consumption and annual energy consumption are calculated. Subsequently, by dividing the cooling load by the energy consumption, the monthly weighted average EER and the annual comprehensive EER can be derived. The calculated comparative results of the three schemes are shown in Figure 5 and Figure 6. Compared with the baseline scheme, optimization scheme 1 requires an additional initial investment of 270,000 CNY, with annual cost savings of approximately 42,000 CNY, resulting in a payback period of 6.43 years. In contrast, optimization scheme 2 involves an additional initial investment of 84,000 CNY, achieves annual cost savings of about 35,000 CNY, and has a payback period of only 2.4 years. Although optimization scheme 1 exhibits a slightly higher annual comprehensive energy efficiency ratio (5.17), optimization scheme 2 demonstrates a significant improvement in energy efficiency (5.15) while achieving a substantial reduction in initial investment. Moreover, with a payback period of only 2.4 years, it presents superior techno-economic feasibility.
(2)
Pump.
The pump selection primarily adheres to the following principles: the rated flow rate of the chilled/cooling water pump is set 5% higher than the chiller flow rate to provide a safety margin; the pump head is determined based on hydraulic calculations, with an additional 10% allowance. The total efficiency of the selected pump under rated operating conditions must be ≥80% to comply with the energy efficiency evaluation criteria specified in GB 30254-2020. Thus, the original design, i.e., the baseline scheme, employs five variable-frequency chilled water pumps with a capacity of 460 m3/h and two variable-frequency chilled water pumps with a capacity of 310 m3/h, along with five fixed-frequency cooling water pumps with a capacity of 650 m3/h and two fixed-frequency cooling water pumps with a capacity of 460 m3/h.
To optimize system performance, the cooling water pumps are uniformly upgraded from the original fixed-speed configuration to variable-frequency drive (VFD) control. For the chilled water pumps, a “large + small” combination (326 m3·h−1 + 155 m3·h−1) is adopted. This configuration can concurrently serve the 900 RT and 600 RT chillers and enables precise distribution and efficient operation during low-load periods by utilizing the 155 m3·h−1 pump. Based on these principles, the relevant parameters of the proposed optimization scheme are presented in Table 2. This scheme employs four 483 m3/h, two 326 m3/h, and one 155 m3/h variable-frequency chilled water pumps, as well as five 674 m3/h and two 477 m3/h variable-frequency cooling water pumps. As shown in Table 2, calculations indicate that compared to the baseline scheme, the optimization scheme reduces initial investment by 58.7 thousand CNY. Specifically, the rated power of the 155 m3/h variable-frequency pump in the optimization scheme is only 18.5 kW, significantly lowering the energy consumption of chilled water pumps under extremely low-load conditions. Furthermore, the efficiency of the pumps in the optimization scheme is slightly higher than that in the baseline scheme. Therefore, the optimization scheme is superior.
(3)
Cooling tower.
The comparative analysis of the optimized cooling tower selection schemes is presented in Table 3. The original design, i.e., the baseline scheme, employs eight cooling towers with a flow rate of 360 m3/h each, supplemented by an additional cooling tower with a flow rate of 500 m3/h, resulting in a total system flow of 3380 m3/h. The design conditions are as follows: a wet-bulb temperature of 28 °C and cooling water supply/return temperatures of 32/37 °C, corresponding to an approach temperature of 4 K. Under this scheme, the total fan power of the cooling towers is 138.5 kW, and the calculated EER of the chiller unit is 4.85.
The optimized scheme utilizes eight cooling towers, each with a flow rate of 420 m3/h, yielding a total flow of 3360 m3/h. Under the same wet-bulb temperature condition (28 °C), the cooling water inlet/outlet temperatures are adjusted to 31/36 °C, reducing the approach temperature to 3 K. The total fan power of the cooling towers in this scheme is 148 kW, and the calculated EER of the chiller unit increases to 5.07. By lowering the cooling water temperatures and improving the overall system energy efficiency, the optimized scheme achieves an annual reduction in operating costs of 98,000 RMB. Although the initial investment increases by 150,000 RMB, the payback period is only 1.53 years, demonstrating favorable economic and energy-saving benefits.
This optimized selection scheme ensures the required flow rate while significantly enhancing system efficiency through adjustments in cooling tower configuration and operational parameters. The short payback period further underscores its practical value in engineering applications.

4. Empirical Results and Discussion

Although computational analyses have confirmed the energy-saving benefits of optimized chiller, pump, and cooling tower selection schemes, the long-term operational performance of such optimized systems still lacks empirical validation. Therefore, the following section will analyze and evaluate the actual operational performance of a refrigeration plant implementing chiller optimization scheme 2, pump optimization scheme and cooling tower optimization scheme based on operational data collected between 2024 and 2025.

4.1. Refrigeration Plant Monthly Operational Performance Analysis

The operational monitoring system employs high-precision sensors with certified accuracy grades: electromagnetic flow meters (±0.5%) for chilled/cooling water flow, PT1000 temperature sensors (±0.1 °C) for supply/return water temperatures, and three-phase multifunction power meters (±0.5%) for equipment power consumption. All selected sensors and instruments adopt mainstream high-precision industrial-grade configurations, meeting the accuracy requirements for building energy consumption measurement and operational monitoring in this industry. According to the error propagation principle of the energy efficiency ratio (EER) mathematical model, the relative uncertainties in the flow rate, temperature difference and electric power are synthesized by the root-sum-square (RSS) method, and the combined relative uncertainty in the EER is calculated to be approximately 2.92%.
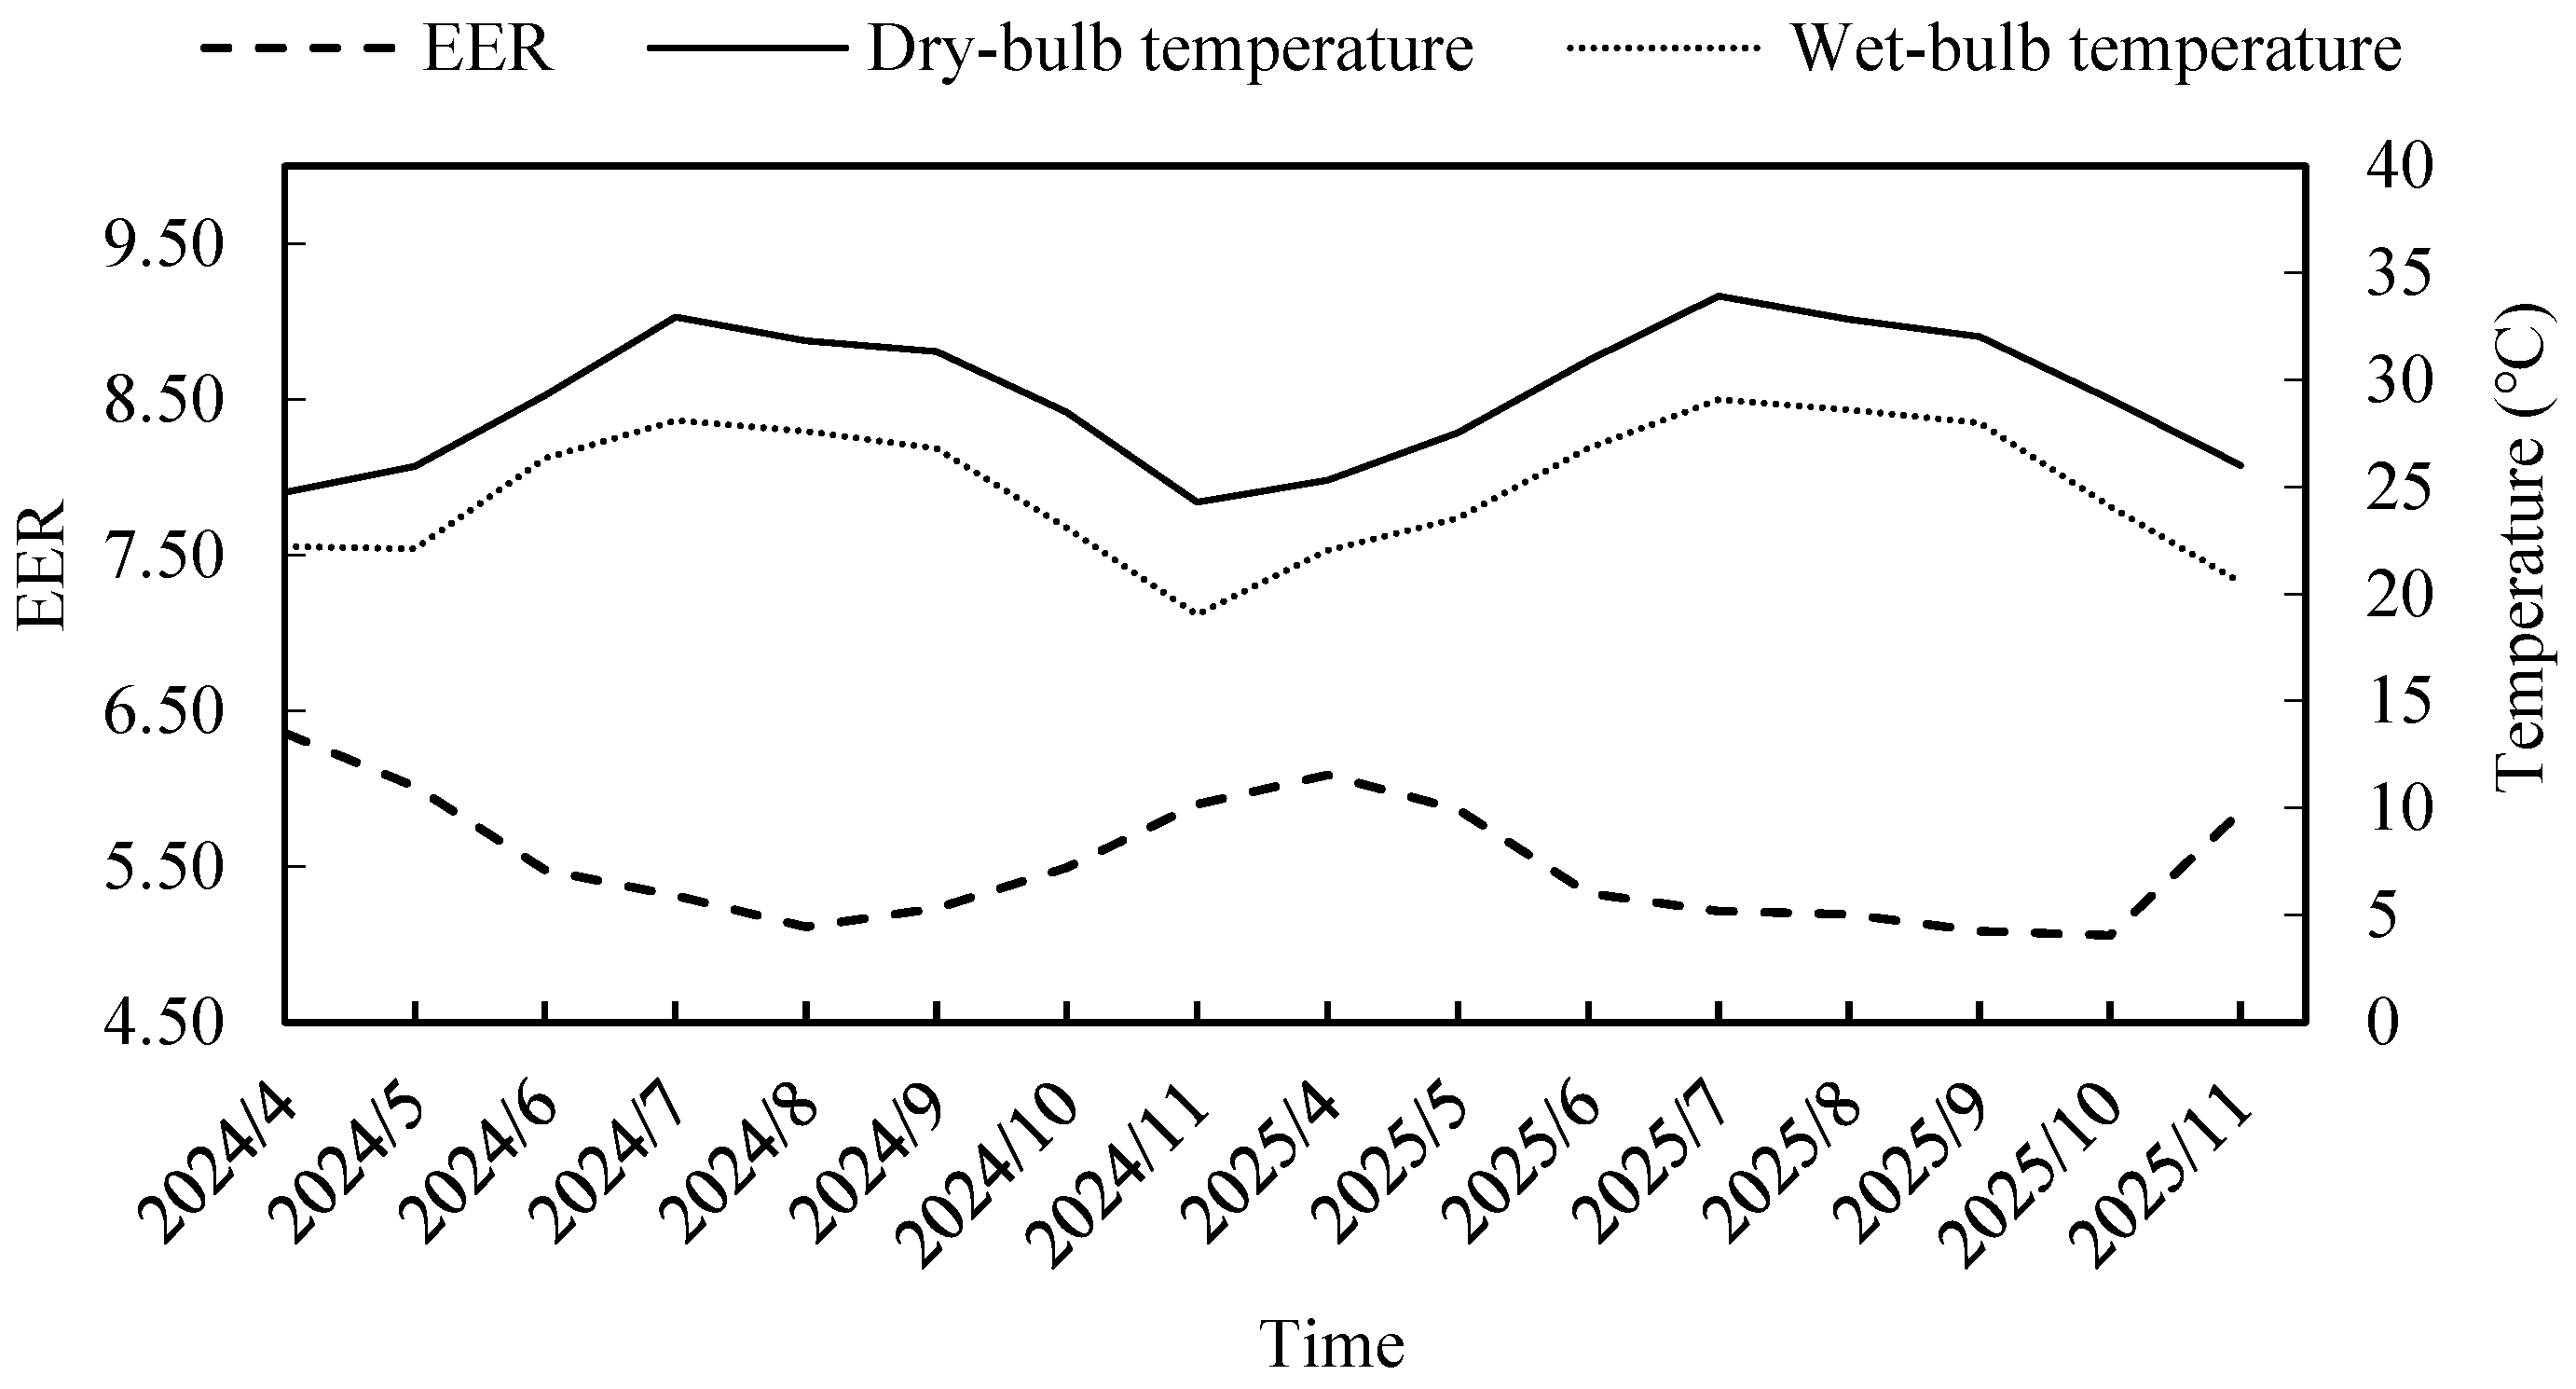
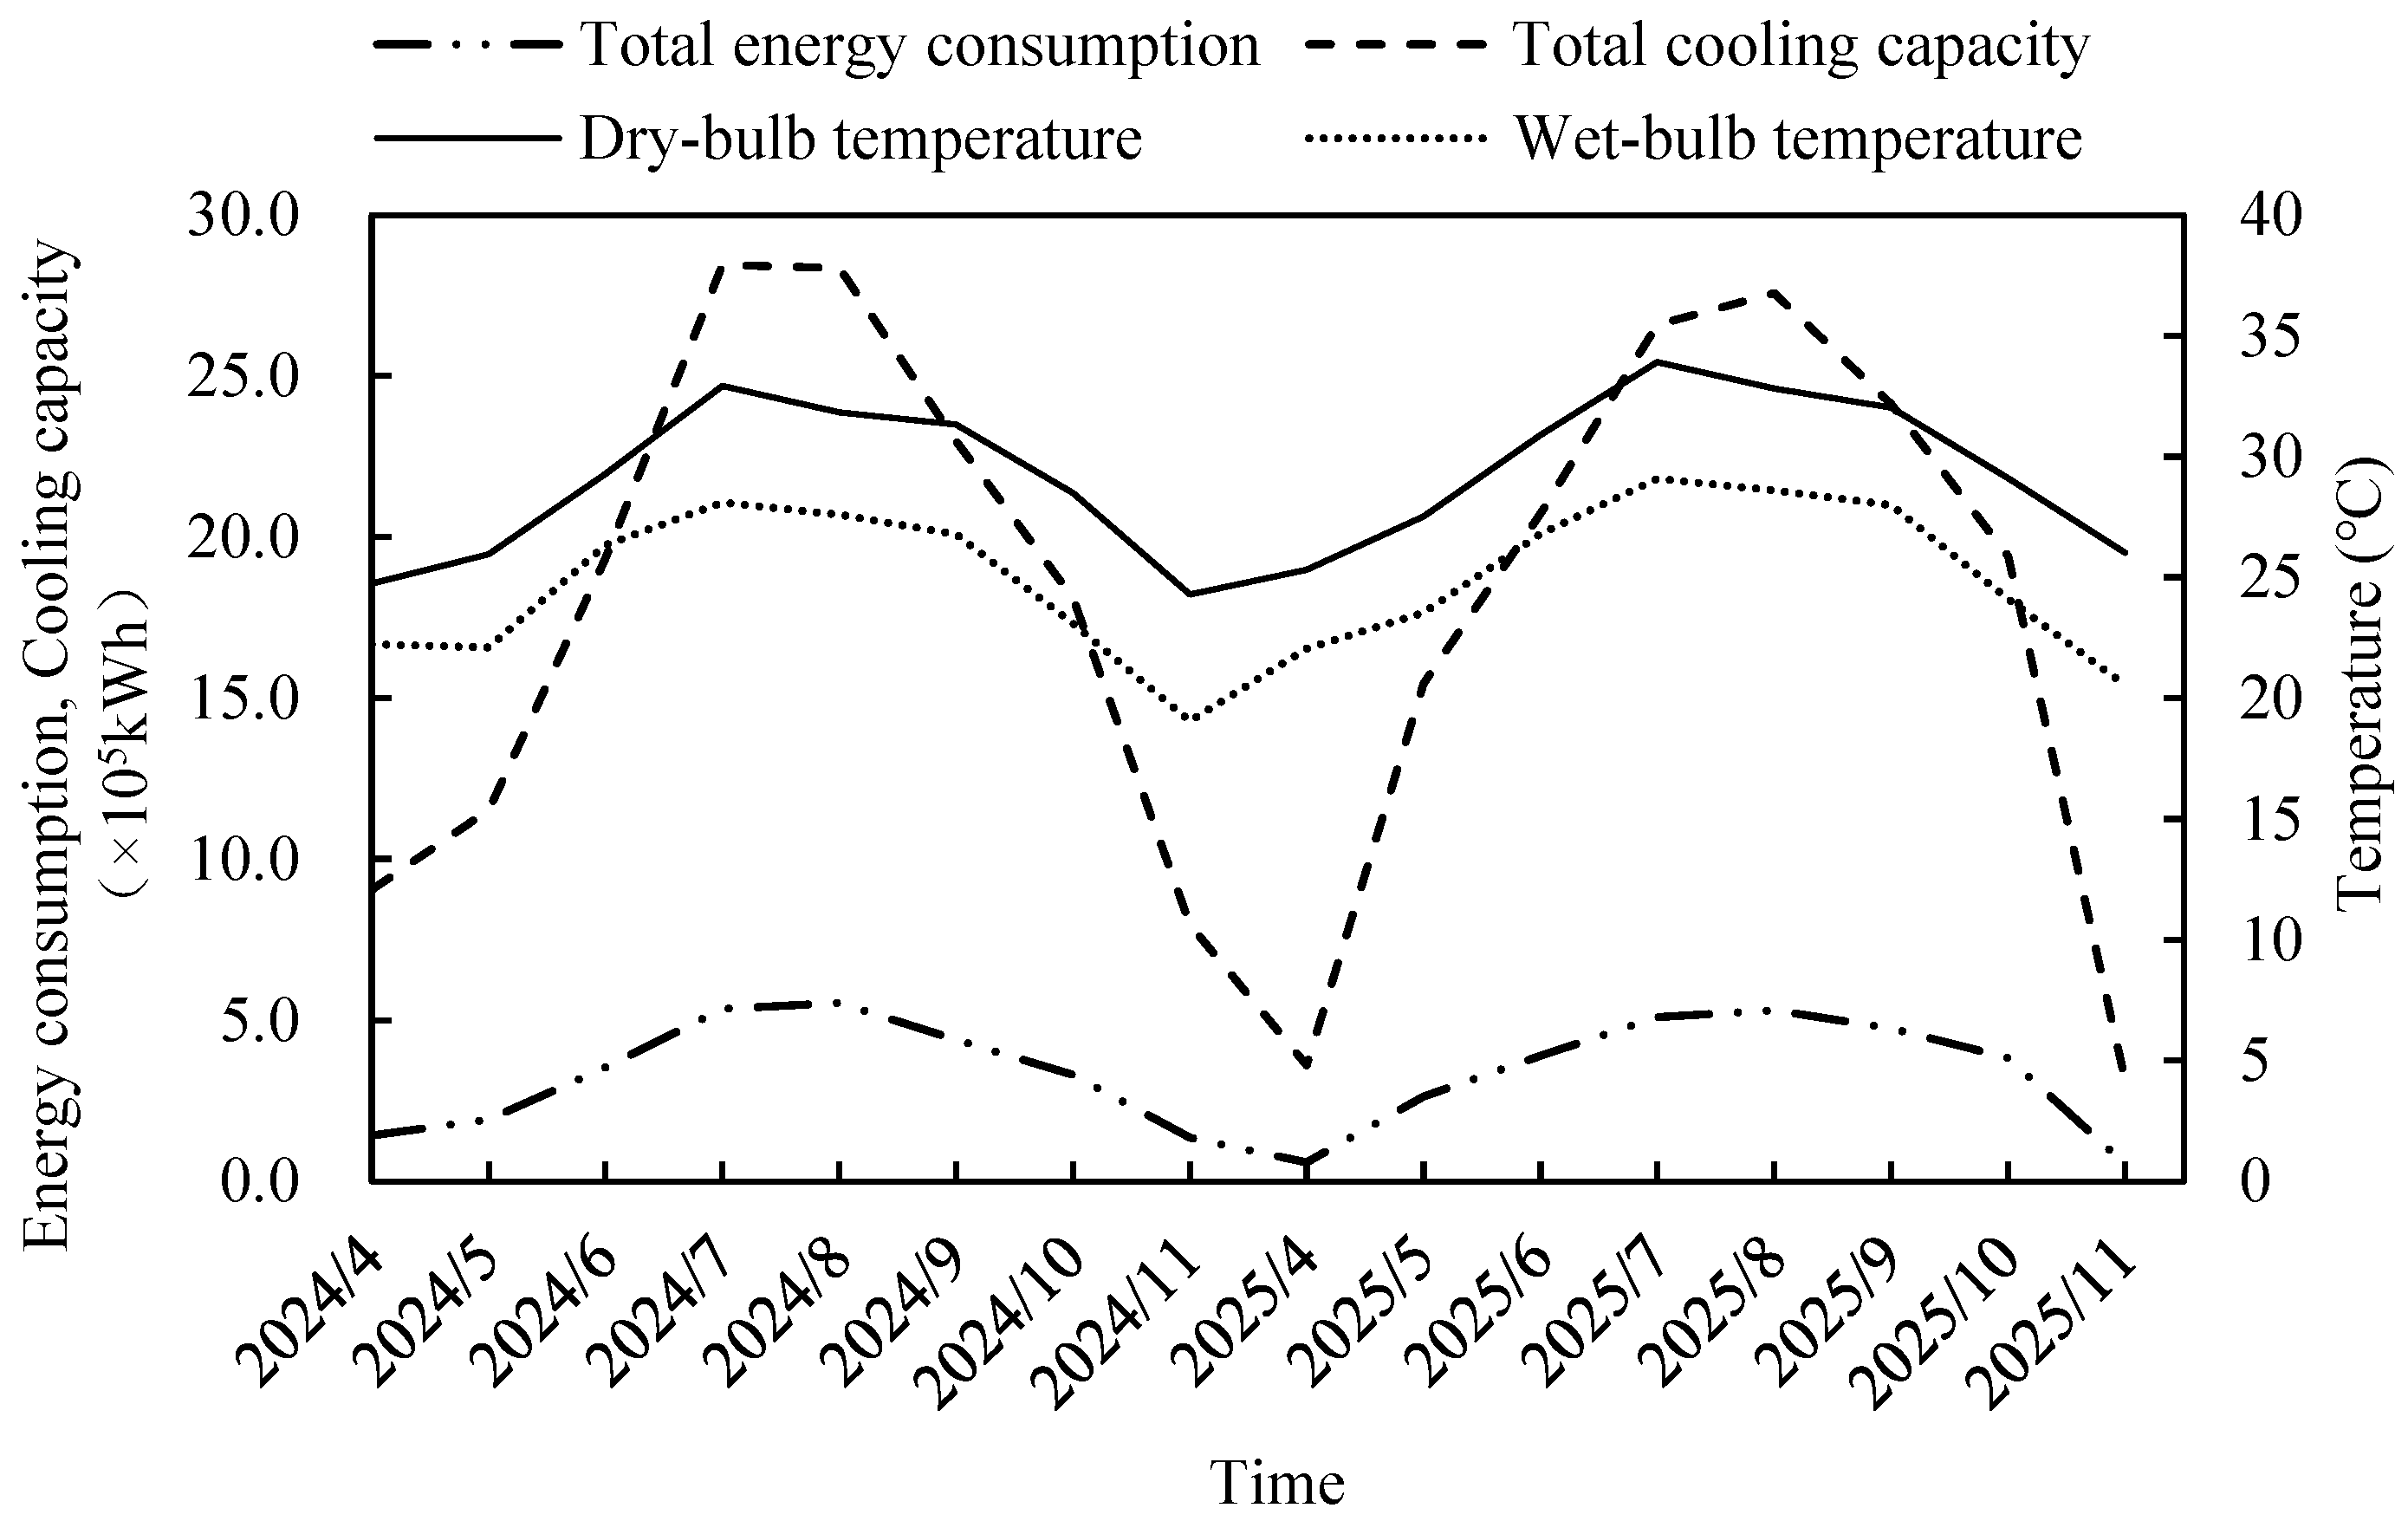
The monthly energy consumption, cooling capacity, and EER distribution of the commercial building’s refrigeration plant during the 2024 and 2025 cooling seasons (20 April to 10 November) are shown in Figure 7 and Figure 8. The data indicate that both energy consumption and cooling capacity were significantly higher from July to September compared to the other months. This is primarily attributed to the higher outdoor temperatures and the corresponding greater cooling load during this period. Throughout the cooling season, the monthly EER for both 2024 and 2025 remained above 5.06, with annual comprehensive EER values of 5.44 and 5.28, respectively. According to the efficiency classification limits specified for high-efficiency air-conditioning refrigeration plant systems (with cooling capacity exceeding 1758 kW) in Hot Summer and Warm Winter Zone II (Xiamen) by the standard T/CRAAS 1039-2023 “Energy Efficiency Monitoring and Classification Standard for High-Efficiency Air-Conditioning Refrigeration Plant Systems” [25], the annual energy efficiency level of this commercial building’s refrigeration plant has reached Grade I (the classification efficiency limit is 5.2).

4.2. Refrigeration Plant Operational Performance Analysis During the Hottest Week

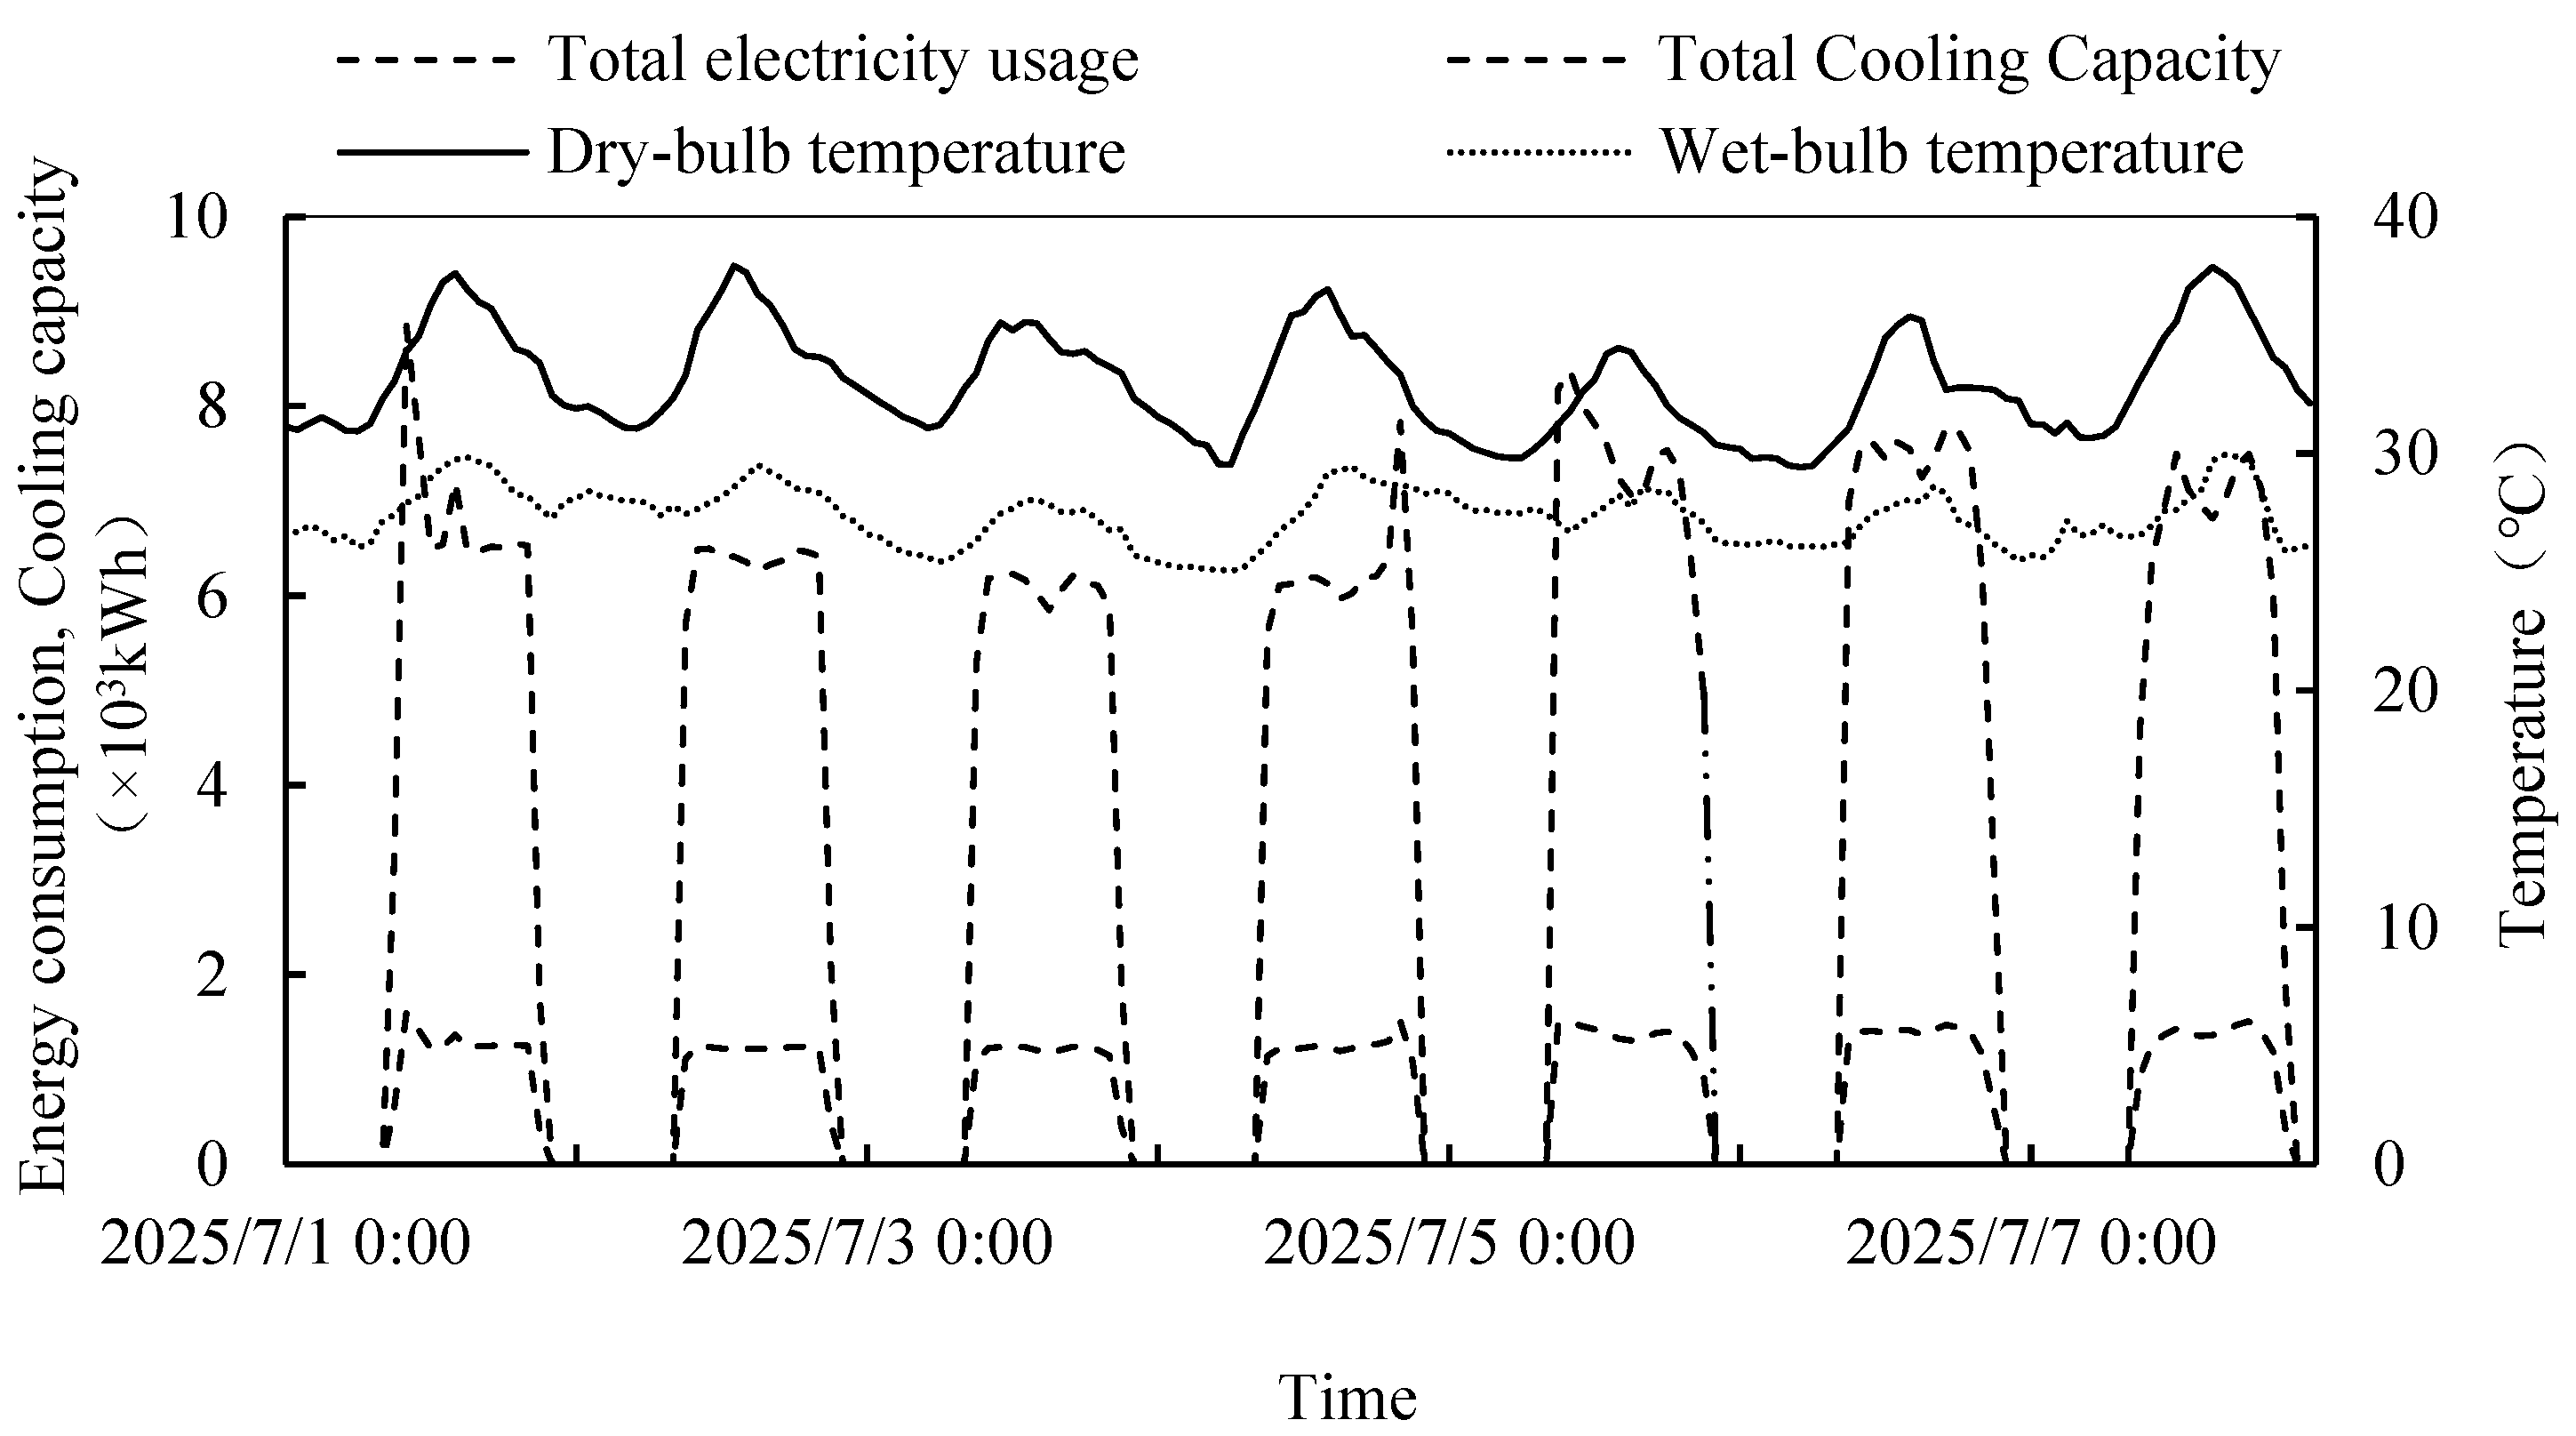
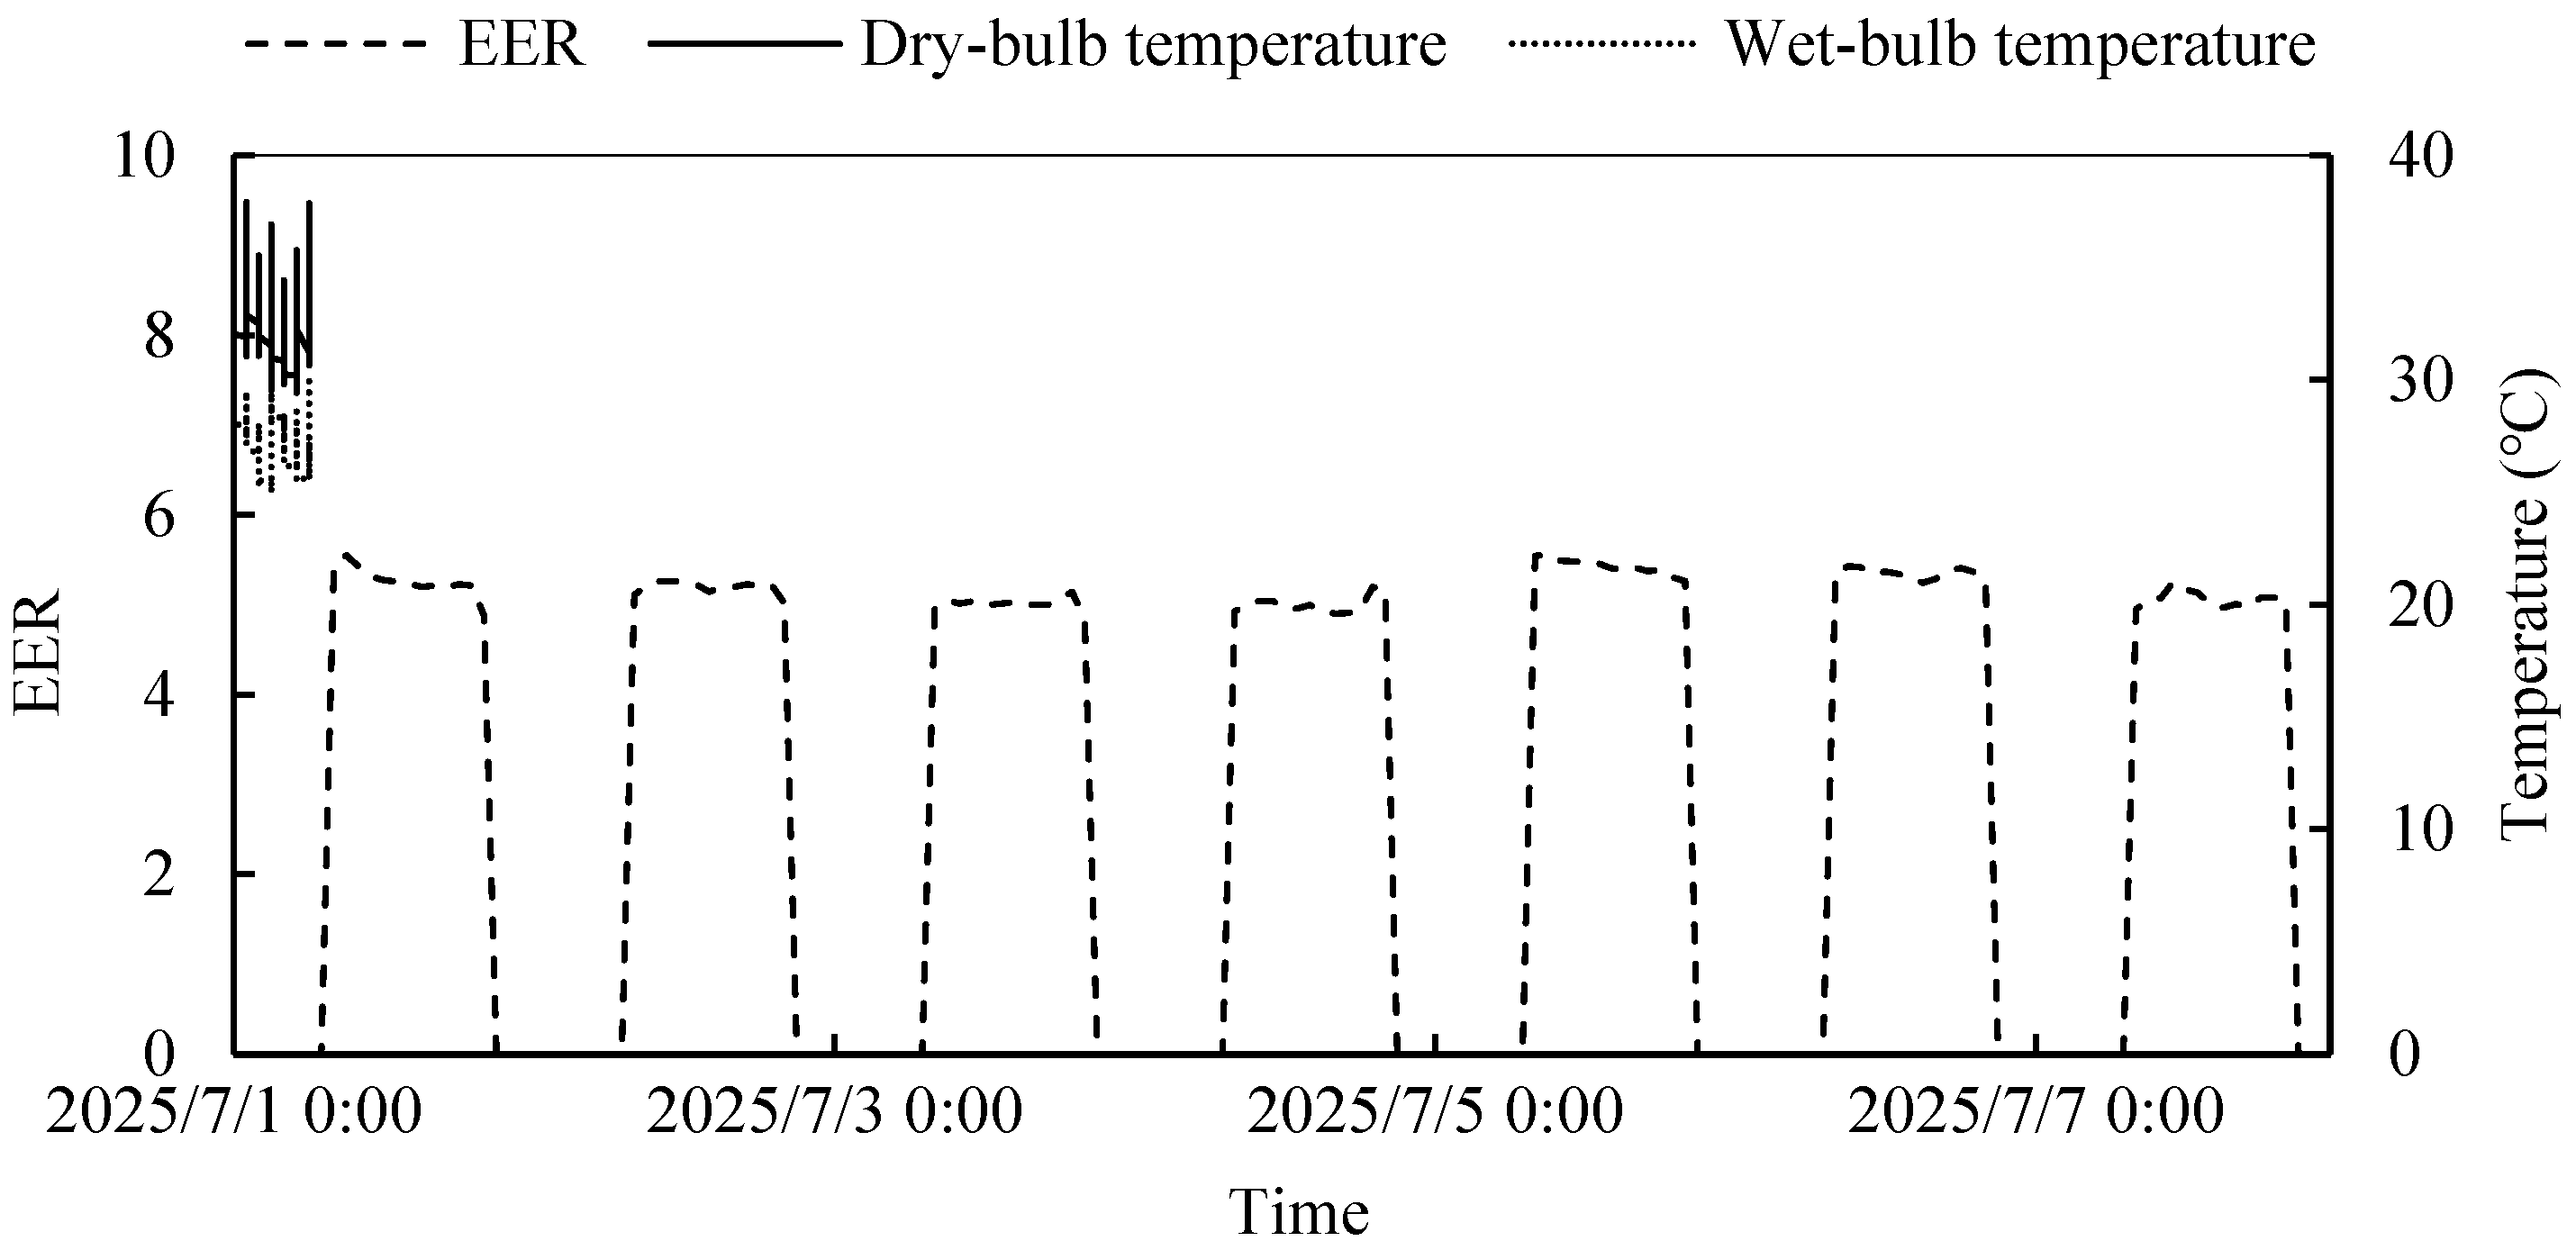
An analysis of the hourly energy consumption, cooling capacity, and EER of the refrigeration plant during the hottest week (1–7 July 2025) is presented in Figure 9 and Figure 10. As shown in Figure 9, the peak cooling load of the commercial building in 2025 occurred at 10:00 on 1 July, reaching 8847.46 kW, which is mainly attributed to the higher cooling capacity during the equipment start-up phase.
Figure 10 indicates that during the hottest week, the maximum system EER was 5.56, recorded at 10:00 on 5 July, while the minimum system EER was 4.84, observed at 21:00 on 3 July. The operating statuses of the chillers, pumps, and fans are provided in Table 4. The analysis reveals that at 10:00 on 5 July, three chillers were operating efficiently, and five pumps, along with six cooling towers, were running at high frequencies, resulting in a relatively high overall EER for the refrigeration plant. In contrast, at 21:00 on 3 July, only two chillers were operating at lower efficiency, and four pumps, along with two cooling towers, were running at partial frequencies, leading to a relatively low overall EER for the refrigeration plant.

4.3. Equipment Operational Performance Analysis

(1)
Chiller.
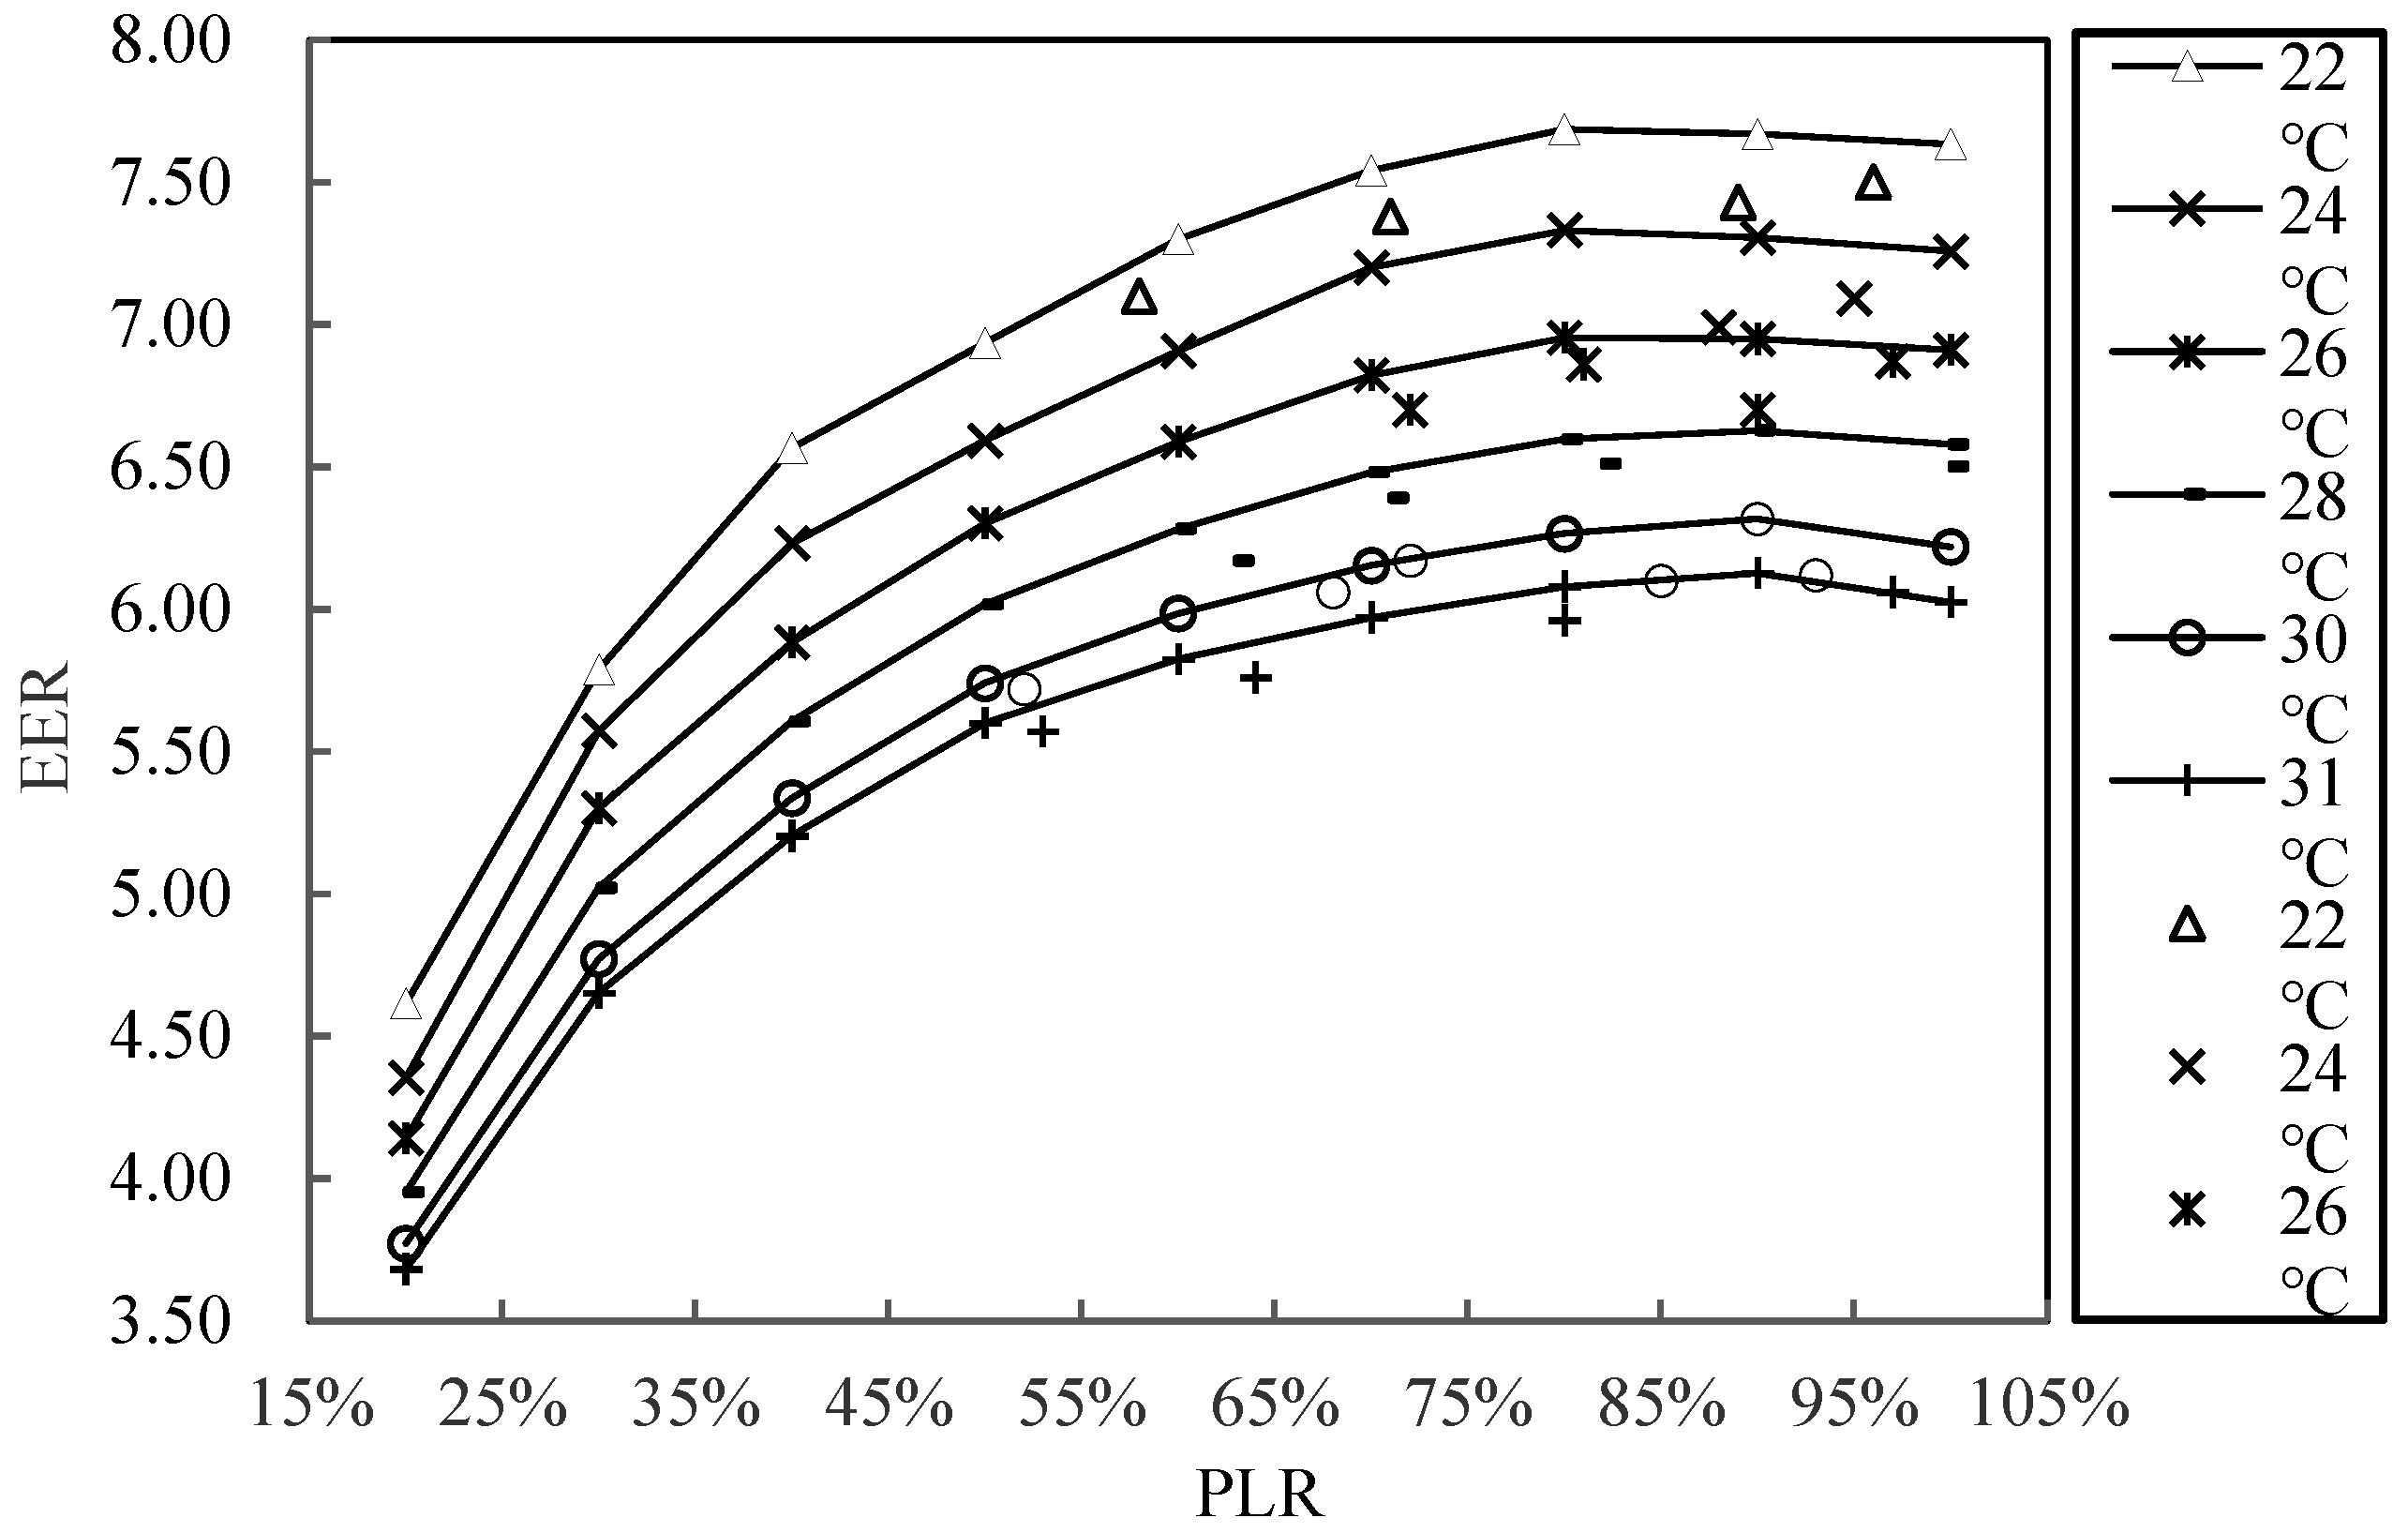
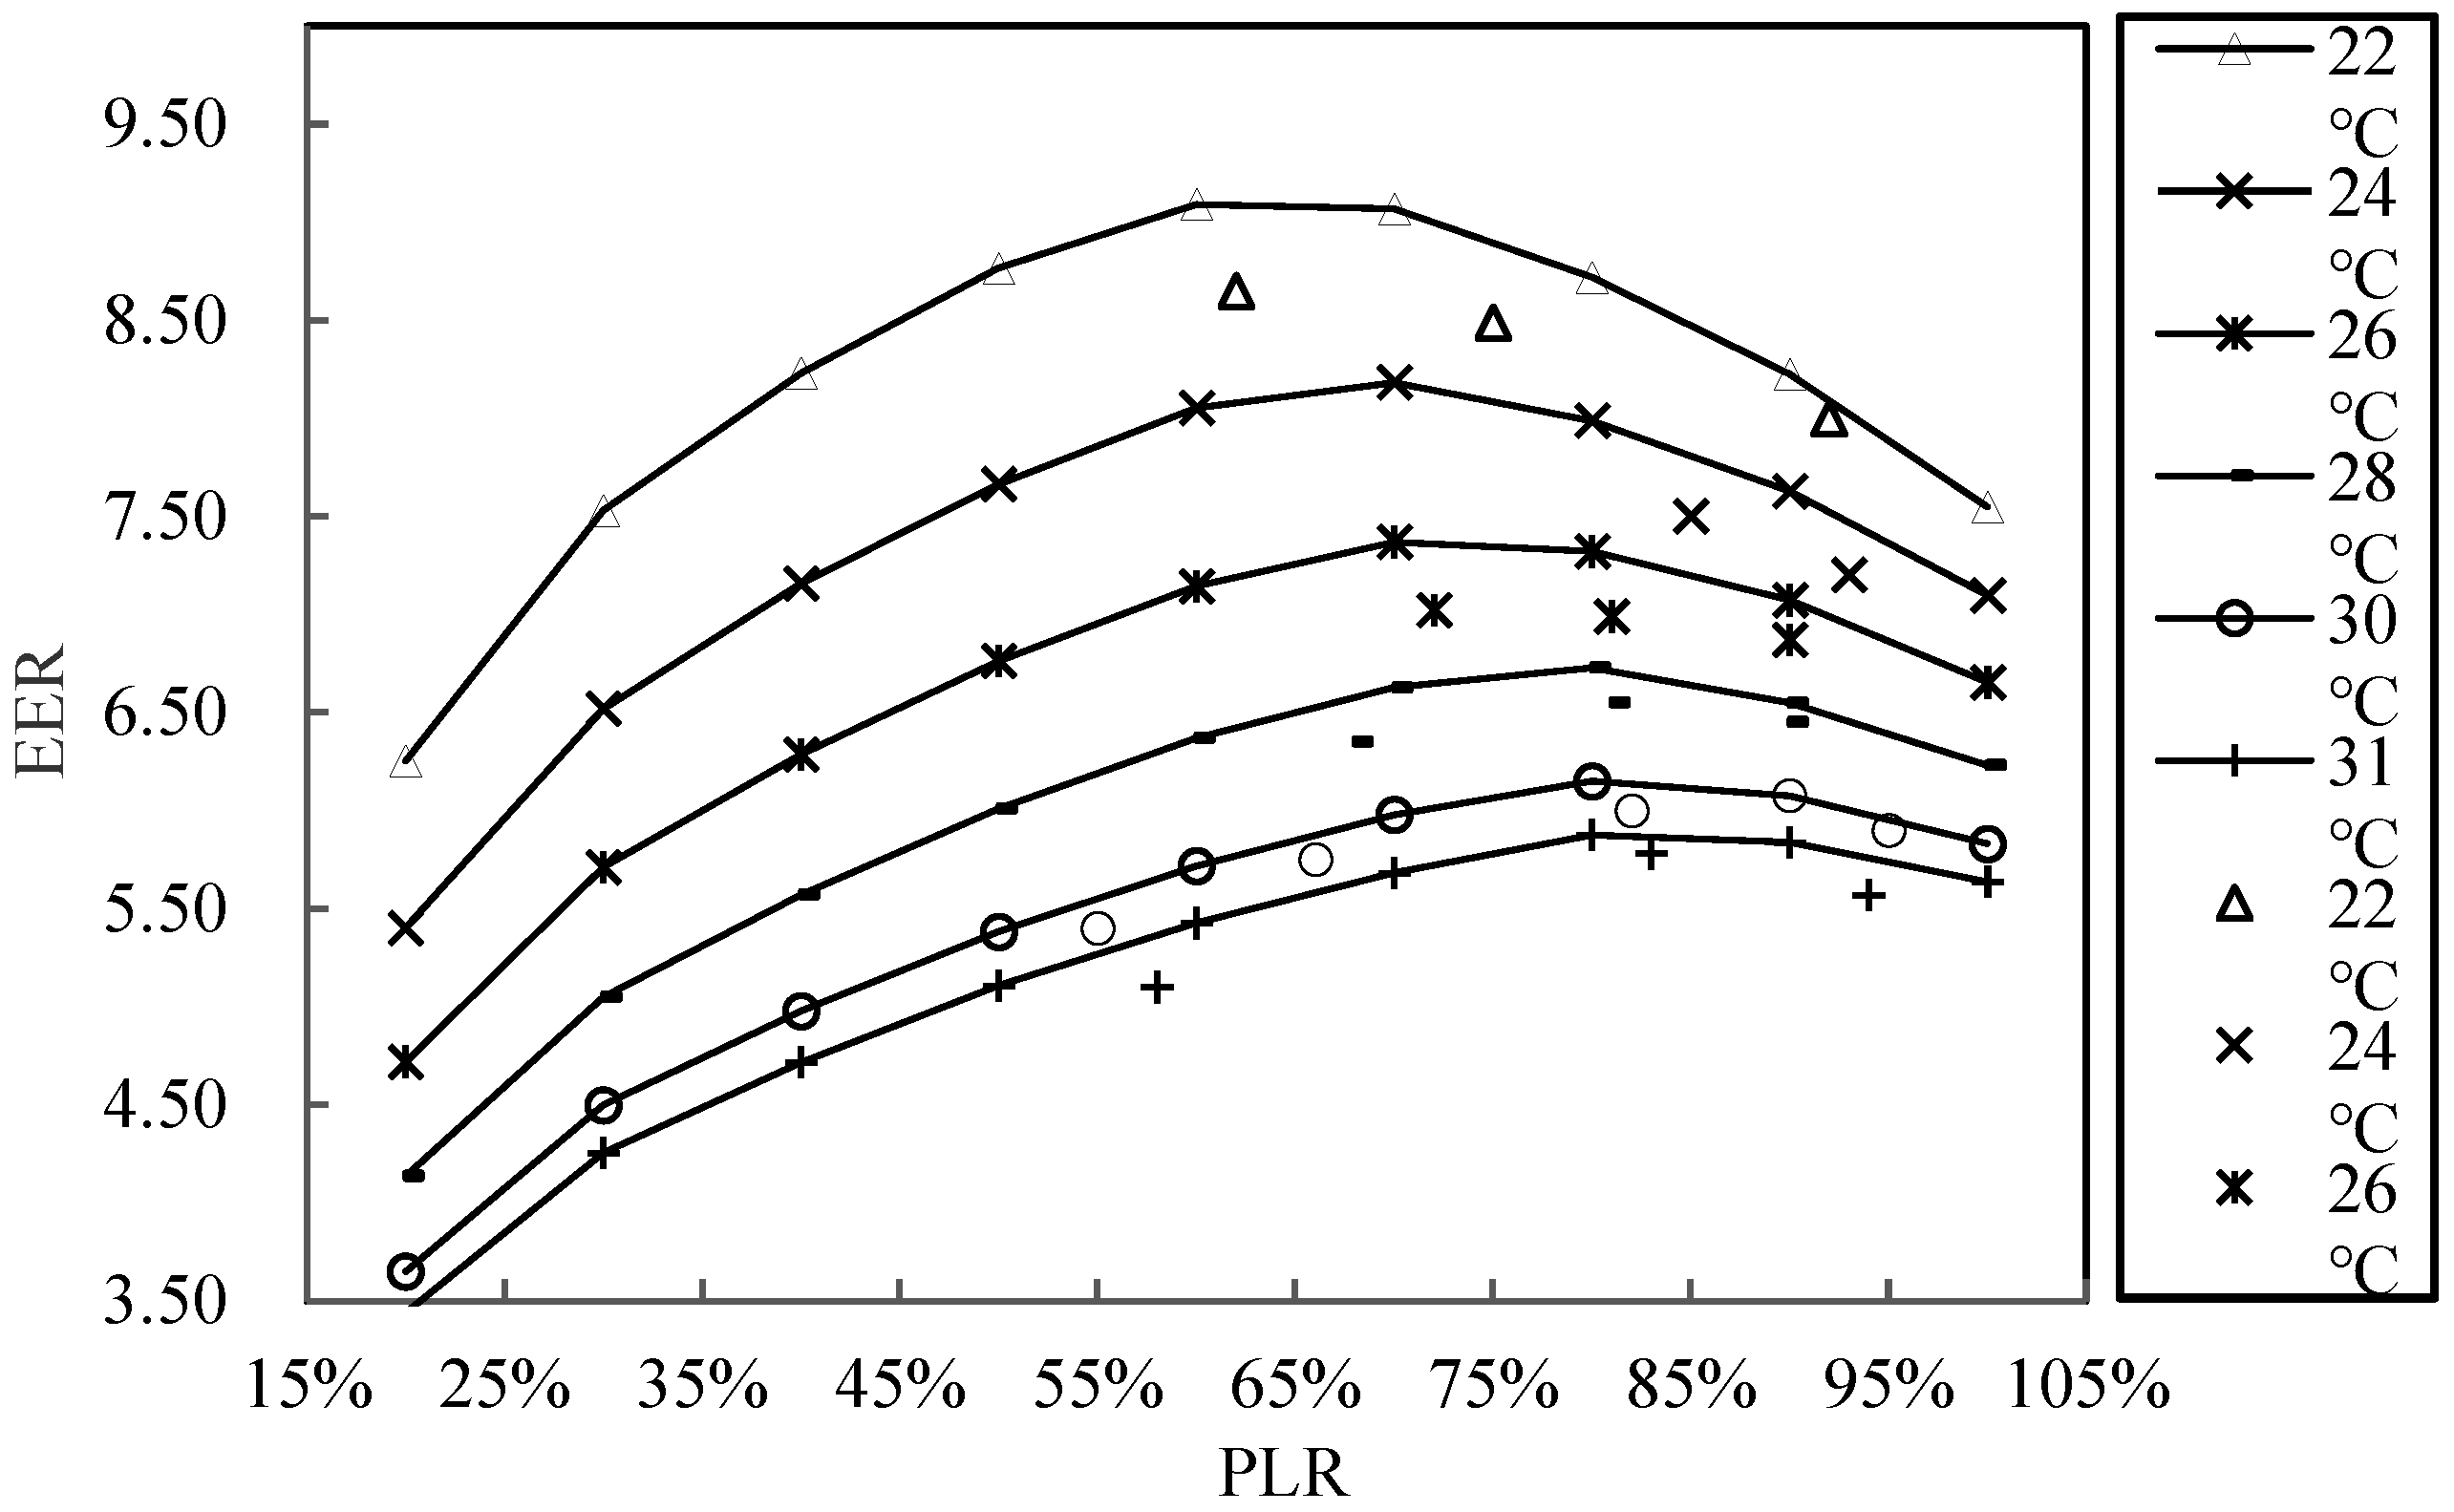
Figure 11 and Figure 12 illustrate a comparison between the actual operating performance and the rated performance of each chiller under different partial load ratios and cooling tower inlet water temperatures. Calculation results show that the energy efficiency ratio of most actual operating condition points is lower than that of the rated condition points, with deviations generally controlled within 5%. A few operating condition points even achieve the rated energy efficiency ratio level. According to the guidelines for efficient operation of chillers provided in ASHRAE Guideline 36-2021 [26], the deviation between the actual energy efficiency ratio and the rated value should typically be maintained within a range of 5% to 15%, with deviations below 10% considered relatively good performance. Thus, it can be concluded that the operational performance of the chiller in this commercial building is superior to that of most similar units, indicating excellent overall operating conditions.
In addition, Figure 11 and Figure 12 illustrate the impact of cooling water inlet temperature and part-load ratio on the EER. The results indicate that a 1 °C decrease in cooling water temperature can improve the EER by approximately 3–12%, highlighting the importance of cooling tower performance optimization.
(2)
Pump.
The chilled water pump transport factor μch and the cooling water pump transport factor μc are used to characterize the operational performance of the chilled water system and the cooling water system, respectively. A larger value indicates better performance. They are calculated using Equations (5) and (6), respectively.
μ c h = Q W c h w p
μ c = Q c W c w p
where Q is the refrigeration capacity of the refrigeration plant, (kW);
Wchwp is the chilled water pump power (kW);
Qc is the heat rejection of the cooling water system (kW);
Wcwp is the cooling water pump power (kW).
Operational parameters with high occurrence frequency during the 2024–2025 operational period were selected for the calculation of pump transport coefficients. The calculation results are presented in Table 5. Since both the chilled water pumps and cooling water pumps utilize variable frequency drives, the transport coefficients for the chilled water pumps all exceed 30, and those for the cooling water pumps all exceed 45, indicating excellent operational performance.
(3)
Cooling tower.
The cooling tower approach degree and cooling tower efficiency are key indicators for evaluating cooling tower performance and are calculated using Equations (7) and (8), respectively.
A p p r o a c h = T o u t T s
η = T i n T o u t T i n T s
where Tout is the cooling tower outlet water temperature (°C);
Ts is outdoor wet-bulb temperature (°C);
Tin is the cooling tower inlet water temperature (°C).
Based on the annual operational data of the cooling tower, operating conditions close to its rated inlet and outlet water temperatures were selected to compare the actual performance with the rated performance. The results are presented in Table 6. It can be observed that both in terms of approach and cooling tower efficiency, the actual performance of the cooling tower is close to or even better than its rated performance. The reason for this lies in the fact that Xiamen has a maritime climate, with an average annual temperature of approximately 21 °C and an average relative humidity of 77%. The mild winters, where temperatures rarely drop below 5 °C, eliminate the risk of freezing throughout the year. Additionally, the sea breeze during summer enhances evaporative cooling efficiency, thereby improving the actual operational performance of the cooling tower. This indicates that during equipment selection, fully considering local climatic characteristics and choosing operational parameters—such as a lower approach temperature—that are well-suited to the climate can fully unlock the energy-saving potential of the equipment, thereby achieving synergy between design optimization and operational optimization.

5. Conclusions

This paper studies the equipment selection optimization of a commercial building refrigeration plant and provides measured data for 2024–2025, empirically validating the actual energy efficiency of the optimized design scheme and filling the gap in long-term performance verification data in this field.
(1)
A comprehensive optimization of the refrigeration plant equipment selection for a commercial building in Xiamen was conducted, encompassing chillers, chilled/cooling water pumps, and cooling towers. Theoretical calculations indicated that the optimized schemes (particularly for chillers and cooling towers) would offer significant energy-saving potential and favorable economic returns.
(2)
Empirical analysis based on long-term operational data from 2024 to 2025 confirmed the high efficiency of the optimized refrigeration plant. The system achieved annual comprehensive EER values of 5.44 (2024) and 5.28 (2025), with monthly EER consistently above 5.06. This performance meets the stringent Grade I efficiency classification according to the standard T/CRAAS 1039-2023.
(3)
Equipment-level performance evaluation revealed excellent real-world operation. Chiller efficiency deviations from rated values were generally controlled within 5%. Pump transport factors, benefiting from variable frequency drives, are excellent (≥30 for chilled water pumps, ≥45 for cooling water pumps). Cooling tower actual performance, favored by Xiamen’s maritime climate, was close to or better than its rated performance.
This study integrates optimized equipment selection at the design stage with empirical performance analysis based on actual operation. It provides a practical and data-supported framework for achieving high energy efficiency in commercial building refrigeration plants, contributing valuable findings for engineering practice and future relevant energy efficiency standard development.
The proposed framework—integrating design-stage equipment selection with operational-stage empirical validation—is inherently transferable across climates and building types, although critical parameters (e.g., outdoor dry-bulb and wet-bulb temperatures, load profiles, etc.) require adjustment for local conditions. Future work will extend this methodology to diverse climate zones and building typologies to establish a comprehensive performance benchmark database and quantify the climatic sensitivity of optimal configurations through cross-regional comparative studies.

Author Contributions

Supervision, J.Y. and Y.Z.; methodology, D.Z. and J.Y.; formal analysis, D.Z., A.X. and W.Z.; investigation, D.Z., L.G., A.X. and W.Z.; resources, L.G.; writing—original draft preparation, D.Z.; writing—review and editing, W.Z., J.Y. and Y.Z.; project administration, J.Y., L.G. and A.X.; funding acquisition, D.Z. and J.Y. All authors have read and agreed to the published version of the manuscript.

Funding

This research was supported by Guangzhou Maritime University Research Fund (Grant No. K42024047) and Guangdong University Key Fields Special Project (Grant No. 2025ZDZX1026).

Data Availability Statement

The data presented in this study are available on request from the corresponding author.

Conflicts of Interest

The authors declare no conflicts of interest.

Abbreviations

The following abbreviations are used in this manuscript:
EEREnergy efficiency ratio
MPCModel predictive control
PLRPart load ratio
CSDConstant-speed drive
VSDVariable-speed drive
VFDVariable-frequency drive
RMSERoot mean square error
MAEMean absolute error
MAPEMean absolute percentage error

References

  1. Chen, Y.; Hong, T.; Luo, X.; Hooper, B. Development of City Buildings Dataset for Urban Building Energy Modeling. Energy Build. 2019, 183, 252–265. [Google Scholar] [CrossRef]
  2. Hong, T.; Chen, Y.; Luo, X.; Luo, N.; Lee, S.H. Ten Questions on Urban Building Energy Modeling. Build. Environ. 2020, 168, 106508. [Google Scholar] [CrossRef]
  3. International Energy Agency. Global Status Report for Buildings and Construction: Towards a Zero-Emission, Efficient and Resilient Buildings and Construction Sector; United Nations Environment Programme: Nairobi, Kenya, 2021. [Google Scholar]
  4. González-Torres, M.; Pérez-Lombard, L.; Coronel, J.F.; Maestre, I.R.; Yan, D. A Review on Buildings Energy Information: Trends, End-Uses, Fuels and Drivers. Energy Rep. 2022, 8, 626–637. [Google Scholar] [CrossRef]
  5. Gang, W.; Wang, S.; Xiao, F.; Gao, D. Robust Optimal Design of Building Cooling Systems Considering Cooling Load Uncertainty and Equipment Reliability. Appl. Energy 2015, 159, 265–275. [Google Scholar] [CrossRef]
  6. Chen, Q.; Wang, Y.F.; Xu, Y.C. A Thermal Resistance-Based Method for the Optimal Design of Central Variable Water/Air Volume Chiller Systems. Appl. Energy 2015, 139, 119–130. [Google Scholar] [CrossRef]
  7. Taylor, S.T. Fundamentals of Design and Control of Central Chilled-Water Plants; ASHRAE Learning Institute: Atlanta, GA, USA, 2017. [Google Scholar]
  8. Peterson, K.W. Improving Performance of Large Chilled Water Plants. ASHRAE J. 2017, 59, 74–78. [Google Scholar]
  9. Ho, N. Optimizing Campus Chilled Water Connections. ASHRAE J. 2020, 62, 68. [Google Scholar]
  10. Chen, Y.; Yang, C.; Pan, X.; Yan, D. Design and Operation Optimization of Multi-Chiller Plants Based on Energy Performance Simulation. Energy Build. 2020, 222, 110100. [Google Scholar] [CrossRef]
  11. Xu, X.; Liu, Z.; Li, W.; Zhu, Z.; Yan, M.; Li, P. Comprehensive and Quantitative Evaluation for Selecting a Suitable Scheme of Central Air-Conditioning during the Design Phase. J. Build. Eng. 2024, 82, 108245. [Google Scholar] [CrossRef]
  12. Peixer, G.F.; Nakashima, A.T.D.; Lozano, J.A.; Barbosa, J.R., Jr. System-Level Multi-Objective Optimization of a Magnetic Air Conditioner through Coupling of Artificial Neural Networks and Genetic Algorithms. Appl. Therm. Eng. 2023, 227, 120368. [Google Scholar] [CrossRef]
  13. Huang, X.; Yan, J.; Zhou, X.; Yang, Z.; Huang, X. Energy-Efficient Optimization Method for Air Conditioning Terminal Systems in IDC Based on Genetic Algorithm. Energy 2025, 333, 137502. [Google Scholar] [CrossRef]
  14. Karami, M.; Wang, L. Particle Swarm Optimization for Control Operation of an All-Variable Speed Water-Cooled Chiller Plant. Appl. Therm. Eng. 2018, 130, 962–978. [Google Scholar] [CrossRef]
  15. Gao, Z.; Yu, J.; Zhao, A.; Hu, Q.; Yang, S. Optimal Chiller Loading by Improved Parallel Particle Swarm Optimization Algorithm for Reducing Energy Consumption. Int. J. Refrig. 2022, 136, 61–70. [Google Scholar] [CrossRef]
  16. Kumkam, S.; Trinuruk, P.; Chaiwiwatworakul, P.; Saito, K. A Comparative Analysis of Reinforcement Learning and Model Predictive Control for HVAC System Optimization. J. Build. Eng. 2025, 112, 113776. [Google Scholar] [CrossRef]
  17. Liao, C.; Miyata, S.; Qu, M.; Akashi, Y. Year-Round Operational Optimization of HVAC Systems Using Hierarchical Deep Reinforcement Learning for Enhancing Indoor Air Quality and Reducing Energy Consumption. Appl. Energy 2025, 390, 125816. [Google Scholar] [CrossRef]
  18. Zhao, J.; Liu, D.; Yuan, X.; Wang, P. Model Predictive Control for the Ice-Storage Air-Conditioning System Coupled with Multi-Objective Optimization. Appl. Therm. Eng. 2024, 243, 122595. [Google Scholar] [CrossRef]
  19. Sha, X.; Ma, Z.; Sethuvenkatraman, S.; Li, W. Online Learning-Enhanced Data-Driven Model Predictive Control for Optimizing HVAC Energy Consumption, Indoor Air Quality and Thermal Comfort. Appl. Energy 2025, 383, 125341. [Google Scholar] [CrossRef]
  20. GB 50189-2015; Design Standard for Energy Efficiency of Public Buildings. China Architecture and Building Press: Beijing, China, 2015.
  21. Reddy, T.A.; Andersen, K.K. An Evaluation of Classical Steady-State Offline Linear Parameter Estimation Methods Applied to Chiller Performance Data. HVACR Res. 2002, 8, 101–124. [Google Scholar] [CrossRef]
  22. Luan, Z.J.; Zhang, G.M.; Tian, M.C.; Fan, M.X. Flow Resistance and Heat Transfer Characteristics of a New-Type Plate Heat Exchanger. J. Hydrodyn. 2008, 20, 524–529. [Google Scholar] [CrossRef]
  23. Braun, J.E. Methodologies for the Design and Control of Central Cooling Plants. Ph.D. Thesis, University of Wisconsin-Madison, Madison, WI, USA, 1988. Available online: https://minds.wisconsin.edu/bitstream/handle/1793/46694/Braun1988.pdf (accessed on 22 December 2025).
  24. Yang, J.; Xu, A.; Guan, L.; Zhang, D. Optimization of Multi-Parameter Collaborative Operation for Central Air-Conditioning Cold Source System in Super High-Rise Buildings. Buildings 2025, 15, 4363. [Google Scholar] [CrossRef]
  25. T/CRAAS 1039-2023; Energy Efficiency Monitoring and Grading Standard for High-efficiency Air Conditioning and Refrigeration Station Systems. China Refrigeration and Air-Conditioning Industry Association: Beijing, China, 2023.
  26. ASHRAE Guideline 36-2021; High-Performance Sequences of Operation for HVAC Systems. ASHRAE: Atlanta, GA, USA, 2021.
Figure 1. Distribution of outdoor air dry- and wet-bulb temperatures.
Buildings 16 02067 g001
Figure 2. Building monthly weighted average cooling load characteristic.
Buildings 16 02067 g002
Figure 3. Proportion of cooling load operation time.
Buildings 16 02067 g003
Figure 4. Schematic diagram of the refrigeration plant system.
Buildings 16 02067 g004
Figure 5. Monthly weighted average energy consumption and EER comparison.
Buildings 16 02067 g005
Figure 6. Initial investment, annual operating cost and annual integrated EER comparison.
Buildings 16 02067 g006
Figure 7. Refrigeration plant monthly energy consumption and cooling capacity.
Buildings 16 02067 g007
Figure 8. Refrigeration plant monthly EER.
Buildings 16 02067 g008
Figure 9. Refrigeration plant energy consumption and cooling capacity during the hottest week.
Buildings 16 02067 g009
Figure 10. Refrigeration plant EER during the hottest week.
Buildings 16 02067 g010
Figure 11. Comparison of actual vs. rated performance for chillers #1–#4.
Buildings 16 02067 g011
Figure 12. Comparison of actual vs. rated performance for chiller #5.
Buildings 16 02067 g012
Table 1. Chiller configuration scheme.
ParametersBaseline SchemeOptimization Scheme 1Optimization Scheme 2
chiller configuration900 RT × 4 CSD +
600 RT × 1 VSD
900 RT × 2 CSD +
900 RT × 2 VSD +
600 RT × 1 VSD
900 RT × 4 CSD +
600 RT × 1 VSD
chiller pressure drop8 mH2O8 mH2O6 mH2O
chilled water supply and return temperature6/12 °C
Table 2. Pump configuration scheme comparison.
PumpSchemeFlow Rate (m3/h)Head (m)Power (kw)EfficiencyPump NumberInitial Investment (CNY)
Chilled water pumpBaseline scheme460417581%5332,064
310415577%2
Optimization scheme483315584%4254,520
326314579%2
1553118.582%1
Cooling water pumpBaseline scheme650359083%5291,187
460357582%2
Optimization scheme674317581%5309,992
477315584%2
Table 3. Cooling tower configuration scheme comparison.
SchemeCooling Water Supply/Return TemperatureOutdoor Air Wet-Bulb TemperatureFlow Rate (m3/h)EEROperation Cost (×104 CNY)Initial Investment (×104 CNY)
Baseline scheme32/37 °C28 °C33804.85225.8143
Optimization scheme31/36 °C28 °C33605.07216.0158
Table 4. Operating status and frequency of chillers, pumps, and cooling towers.
TimeChiller Operation Status and EERPump Operation Status and
Frequency
Cooling Tower
Operation Status and Frequency
10:00, 5 JulyChillers #2, #4, #5 in operation, EER: 6.69, 6.59, 8.20Chilled water pumps #2, #5 in operation, Frequency: 40 Hz; Cooling water pumps #1, #4, #5 in operation, Frequency: 40 HzSix cooling tower fans in operation; Fan frequency: 50 Hz
21:00, 3 JulyChillers #1, #3 in operation, EER: 5.06, 5.17Chilled water pumps #1, #3 in operation, Frequency: 32 Hz; Cooling water pumps #1, #3 in operation, Frequency: 15 HzTwo cooling tower fans in operation; Fan frequency: 18 Hz
Table 5. Water pump transport factor calculation results.
Item1#2#3#4#5#
Chilled water pump transport factor36.7~86.537.0~116.835.0~105.233.8~102.233.0~79.7
Cooling water pump transport factor50.8~143.851.2~128.350.3~136.850.2~137.548.0~124.2
Table 6. Comparison of actual vs. rated performance for cooling towers.
ItemRated ConditionOperating Time
Time/14 June 2024 12:3029 June 2024 20:0022 June 2024 11:3030 June 2024 19:30
Cooling tower outlet water temperature (°C)3131.2631.2931.3331.12
Cooling tower inlet water temperature (°C)3636.0735.9435.9836.03
Outdoor wet-bulb temperature (°C)2828.5727.7728.1928.24
Approach degree (°C)32.693.523.142.88
Cooling tower efficiency62.50%64.13%56.92%60%63%
Disclaimer/Publisher’s Note: The statements, opinions and data contained in all publications are solely those of the individual author(s) and contributor(s) and not of MDPI and/or the editor(s). MDPI and/or the editor(s) disclaim responsibility for any injury to people or property resulting from any ideas, methods, instructions or products referred to in the content.