1. Introduction
With the increasing global focus on sustainability and carbon neutrality, building energy consumption has become a significant area of concern. Buildings account for approximately 30–40% of global energy use, making them one of the largest contributors to greenhouse gas emissions [
1,
2,
3]. As urbanization intensifies and populations grow, improving the energy efficiency of buildings is essential to mitigating environmental impacts and achieving global climate goals.
Ways to reduce building heating and cooling energy consumption can be divided into active and passive energy saving technologies; active energy saving technologies focus on controlling building heating and cooling energy consumption through equipment energy efficiency improvement and system optimization, while passive energy saving technologies achieve energy saving goals through the inherent characteristics of the building itself and the use of natural resources [
4]. Passive energy efficiency technologies mainly include two paths: design optimization of three parameters, including building orientation, window-to-wall ratio, and building shape; and building envelope thermal insulation improvement. Building envelope insulation improvement can be realized by adding insulation or replacing windows with better insulation after the building is constructed. However, it is difficult to change the orientation, window-to-wall ratio (WWR), and shape of the building once they have been solidified, and even if a lot of money is spent on upgrading the building envelope insulation at a later stage, it is still difficult to reduce the energy consumption and carbon emissions of the building. Therefore, it is important to optimize the design of the three parameters of building orientation, building window-to-wall ratio, and building shape in the early design stage of a building [
5,
6,
7].
Building orientation plays a critical role in determining the intensity and duration of solar radiation received by a building, and proper orientation enables the maximization of solar energy utilization [
8,
9]. Jadhav and Minde investigated the influences of building and window orientations on energy consumption in the Maharashtra region, finding that orientations between 0° and 90° under specific conditions significantly reduced energy demand. Similarly, the WWR, defined as the proportion of the window area in the building’s external wall, is another critical factor influencing building energy performance [
10]. Troup et al. analyzed energy use in commercial buildings and reported that larger WWRs resulted in higher cooling loads [
11]. Foroughi et al. extended this analysis to various climatic zones using thermal performance simulations of standard office units and further evaluated the effects of WWR changes on heating, cooling, and lighting energy demands [
12]. Their findings indicated that the sensitivity of energy consumption to WWR varies with the thermal standards of the building envelope, with optimal WWRs reducing total energy use by 2% to 15% in extreme climates. Premrov et al. proposed a facade system combining glass and wood, showing that a south-facing WWR of 35% minimized heating and annual energy demands [
13]. Furthermore, building shape significantly influences the exterior surface area and the solar radiation-exposed facade, thus affecting both energy gains and losses [
14]. The building shape coefficient (
S) is defined as the ratio between the external surface area and the internal volume of a building. It represents the external envelope area corresponding to a unit building volume and can be calculated by the following equation [
15].
where
F is the ratio of the external surface area in direct contact with outdoor air to the volume enclosed by the building, though the external surface area excludes the ground floor and the internal walls of unheated stairwells, m
2; and
V is the volume enclosed by the building envelope, m
3. According to the relevant national standard [
15], variations in building form in severe cold and cold regions directly affect building heating energy consumption. A larger building shape coefficient indicates a greater external surface area per unit of building area, resulting in higher heat loss and increased heating energy demand.
Even though building shape coefficient has been extensively adopted to characterize the correlation between building shape and building energy consumption, it still exhibits limitations and inaccuracies under different climatic conditions. Depecker et al. demonstrated that in cold regions such as Paris, building energy consumption was indeed correlated with the shape coefficient [
16]. However, in warmer southern regions, this correlation became less significant. They pointed out that in mild climates and solar-rich regions, the relationship between building energy consumption and shape coefficient is no longer relevant, but their study did not propose corresponding measures to address this problem. Additionally, Albatici et al. introduced a new indicator named the South Exposure Coefficient to highlight the significant role of solar radiation in building energy consumption, and they emphasized the importance of considering solar energy for building design in solar-rich regions [
17]. Shi et al. analyzed the inadequacy of the relationship between shape coefficient and energy consumption in solar-rich regions and proposed the concept of the equivalent shape coefficient
S′ [
18]. Their results revealed that the correlation between
S′ and energy consumption was significantly better than that between the traditional shape coefficient and energy consumption.
The primary cause of these discrepancies lies in the fact that the traditional shape coefficient does not differentiate between transparent and non-transparent building envelopes, thus reducing its accuracy in capturing the energy performance of buildings especially in regions with rich solar resources. Given the unique optical and thermal properties of glass materials, the heat transfer mechanisms of transparent and non-transparent enclosures are quite different. Transparent building envelopes allow shortwave solar radiation to penetrate into indoor spaces, which plays a dominant role in daylighting design and solar heat gain [
19,
20,
21]. However, thermal energy could not be effectively stored due to their material limitations. In contrast, non-transparent building envelopes can store and release heat through thermal capacity. In addition, the thermal performance of transparent and opaque structures differs significantly. Transparent envelopes generally have lower thermal resistance, resulting in much higher heat transfer coefficients compared to non-transparent structures [
22]. Research indicates that 30–50% of heat gain through building envelopes can be attributed to transparent components [
23].
However, the traditional shape coefficient considers only geometric characteristics and neglects the differences in thermal performance between transparent and opaque building envelopes. As a result, it cannot accurately reflect building air conditioning energy consumption. To overcome this limitation, more comprehensive indicators that integrate key design parameters and climatic factors are required. In this study, a new indicator, termed the (E), is proposed based on the conventional shape coefficient. This indicator accounts for the thermal performance differences between transparent and opaque envelopes, while also incorporating the effects of building orientation, window-to-wall ratio, and climate on heating and cooling loads. Consequently, it exhibits a stronger correlation with building air conditioning energy consumption and provides more effective guidance for building form, orientation, and facade design. This study first introduces the definition and calculation methods of the E value and Ci. Then, numerical simulations are conducted to investigate the effects of climate, orientation, and window-to-wall ratio on the Ci value. Finally, the correlation between the E value and building air conditioning energy consumption is verified.
3. Results and Discussion
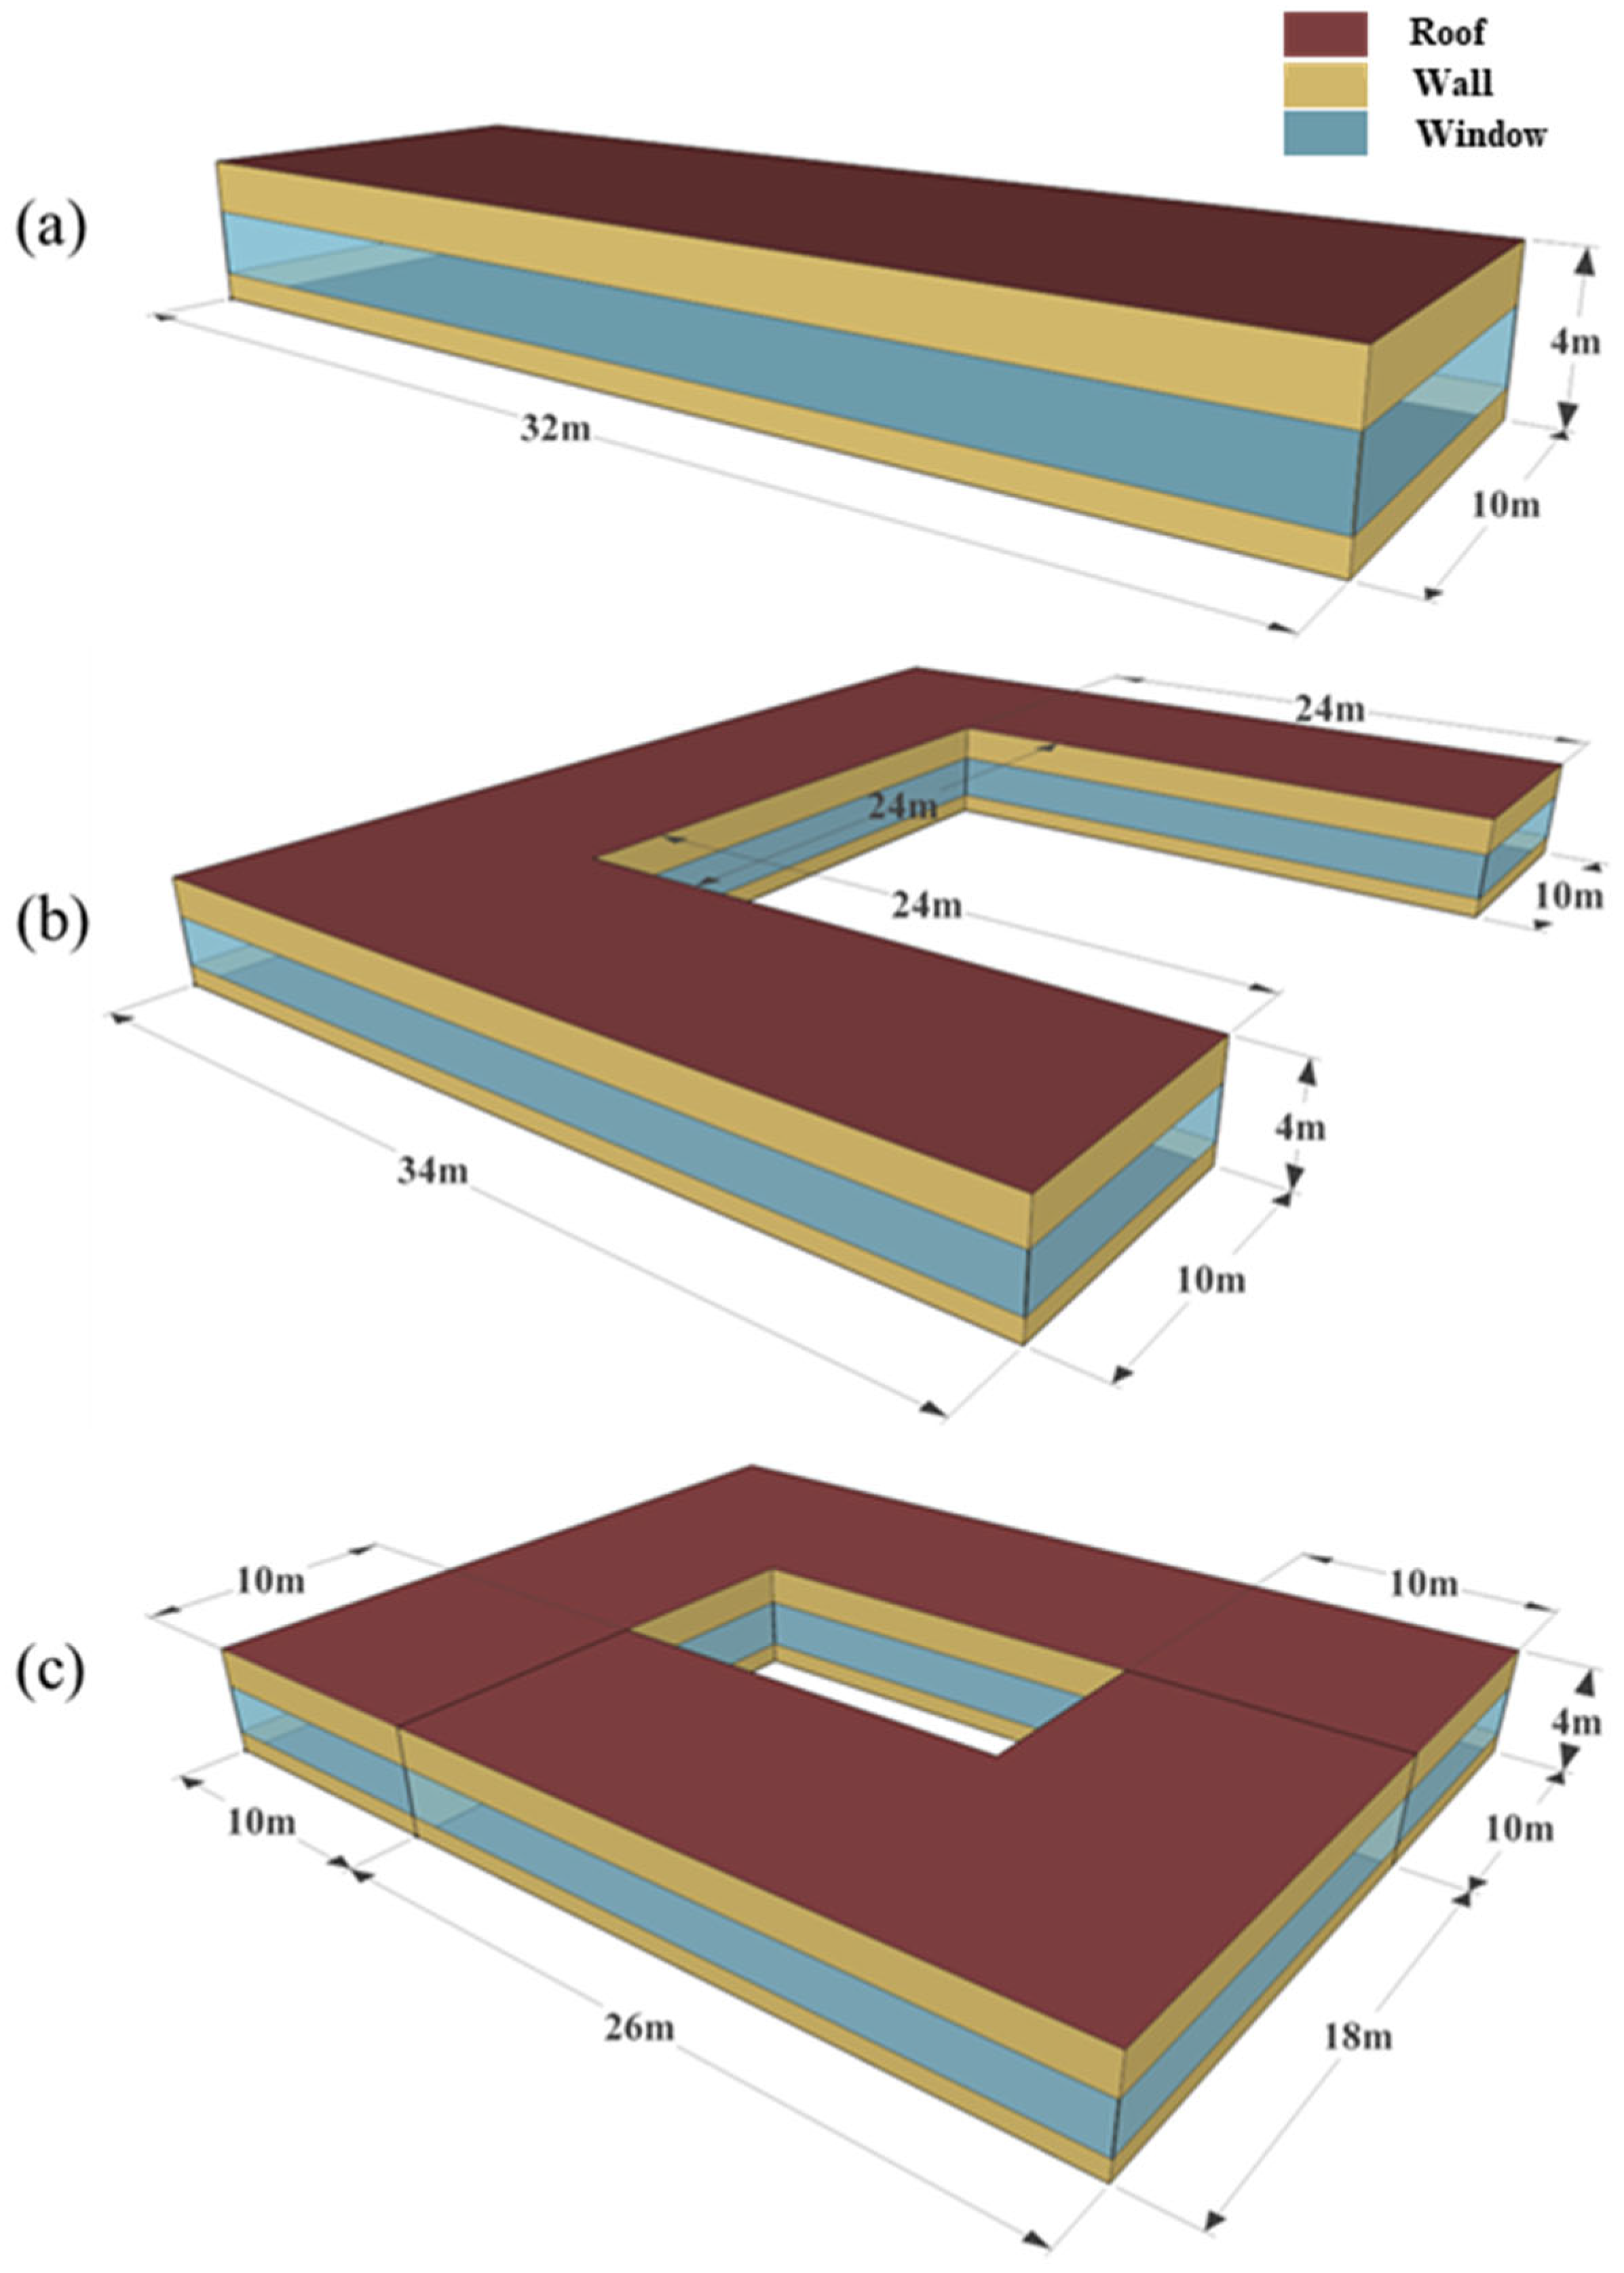
The control variable method is adopted in the present study to investigate the influence of various factors on the equivalent coefficient of the transparent envelope Ci. Calculations are carried out for linear-shaped, U-shaped, and courtyard-shaped buildings in the studied cities under different orientation and window-to-wall ratio conditions. Furthermore, sensitivity analysis is also conducted.
3.1. Influence of Climate Conditions on Ci
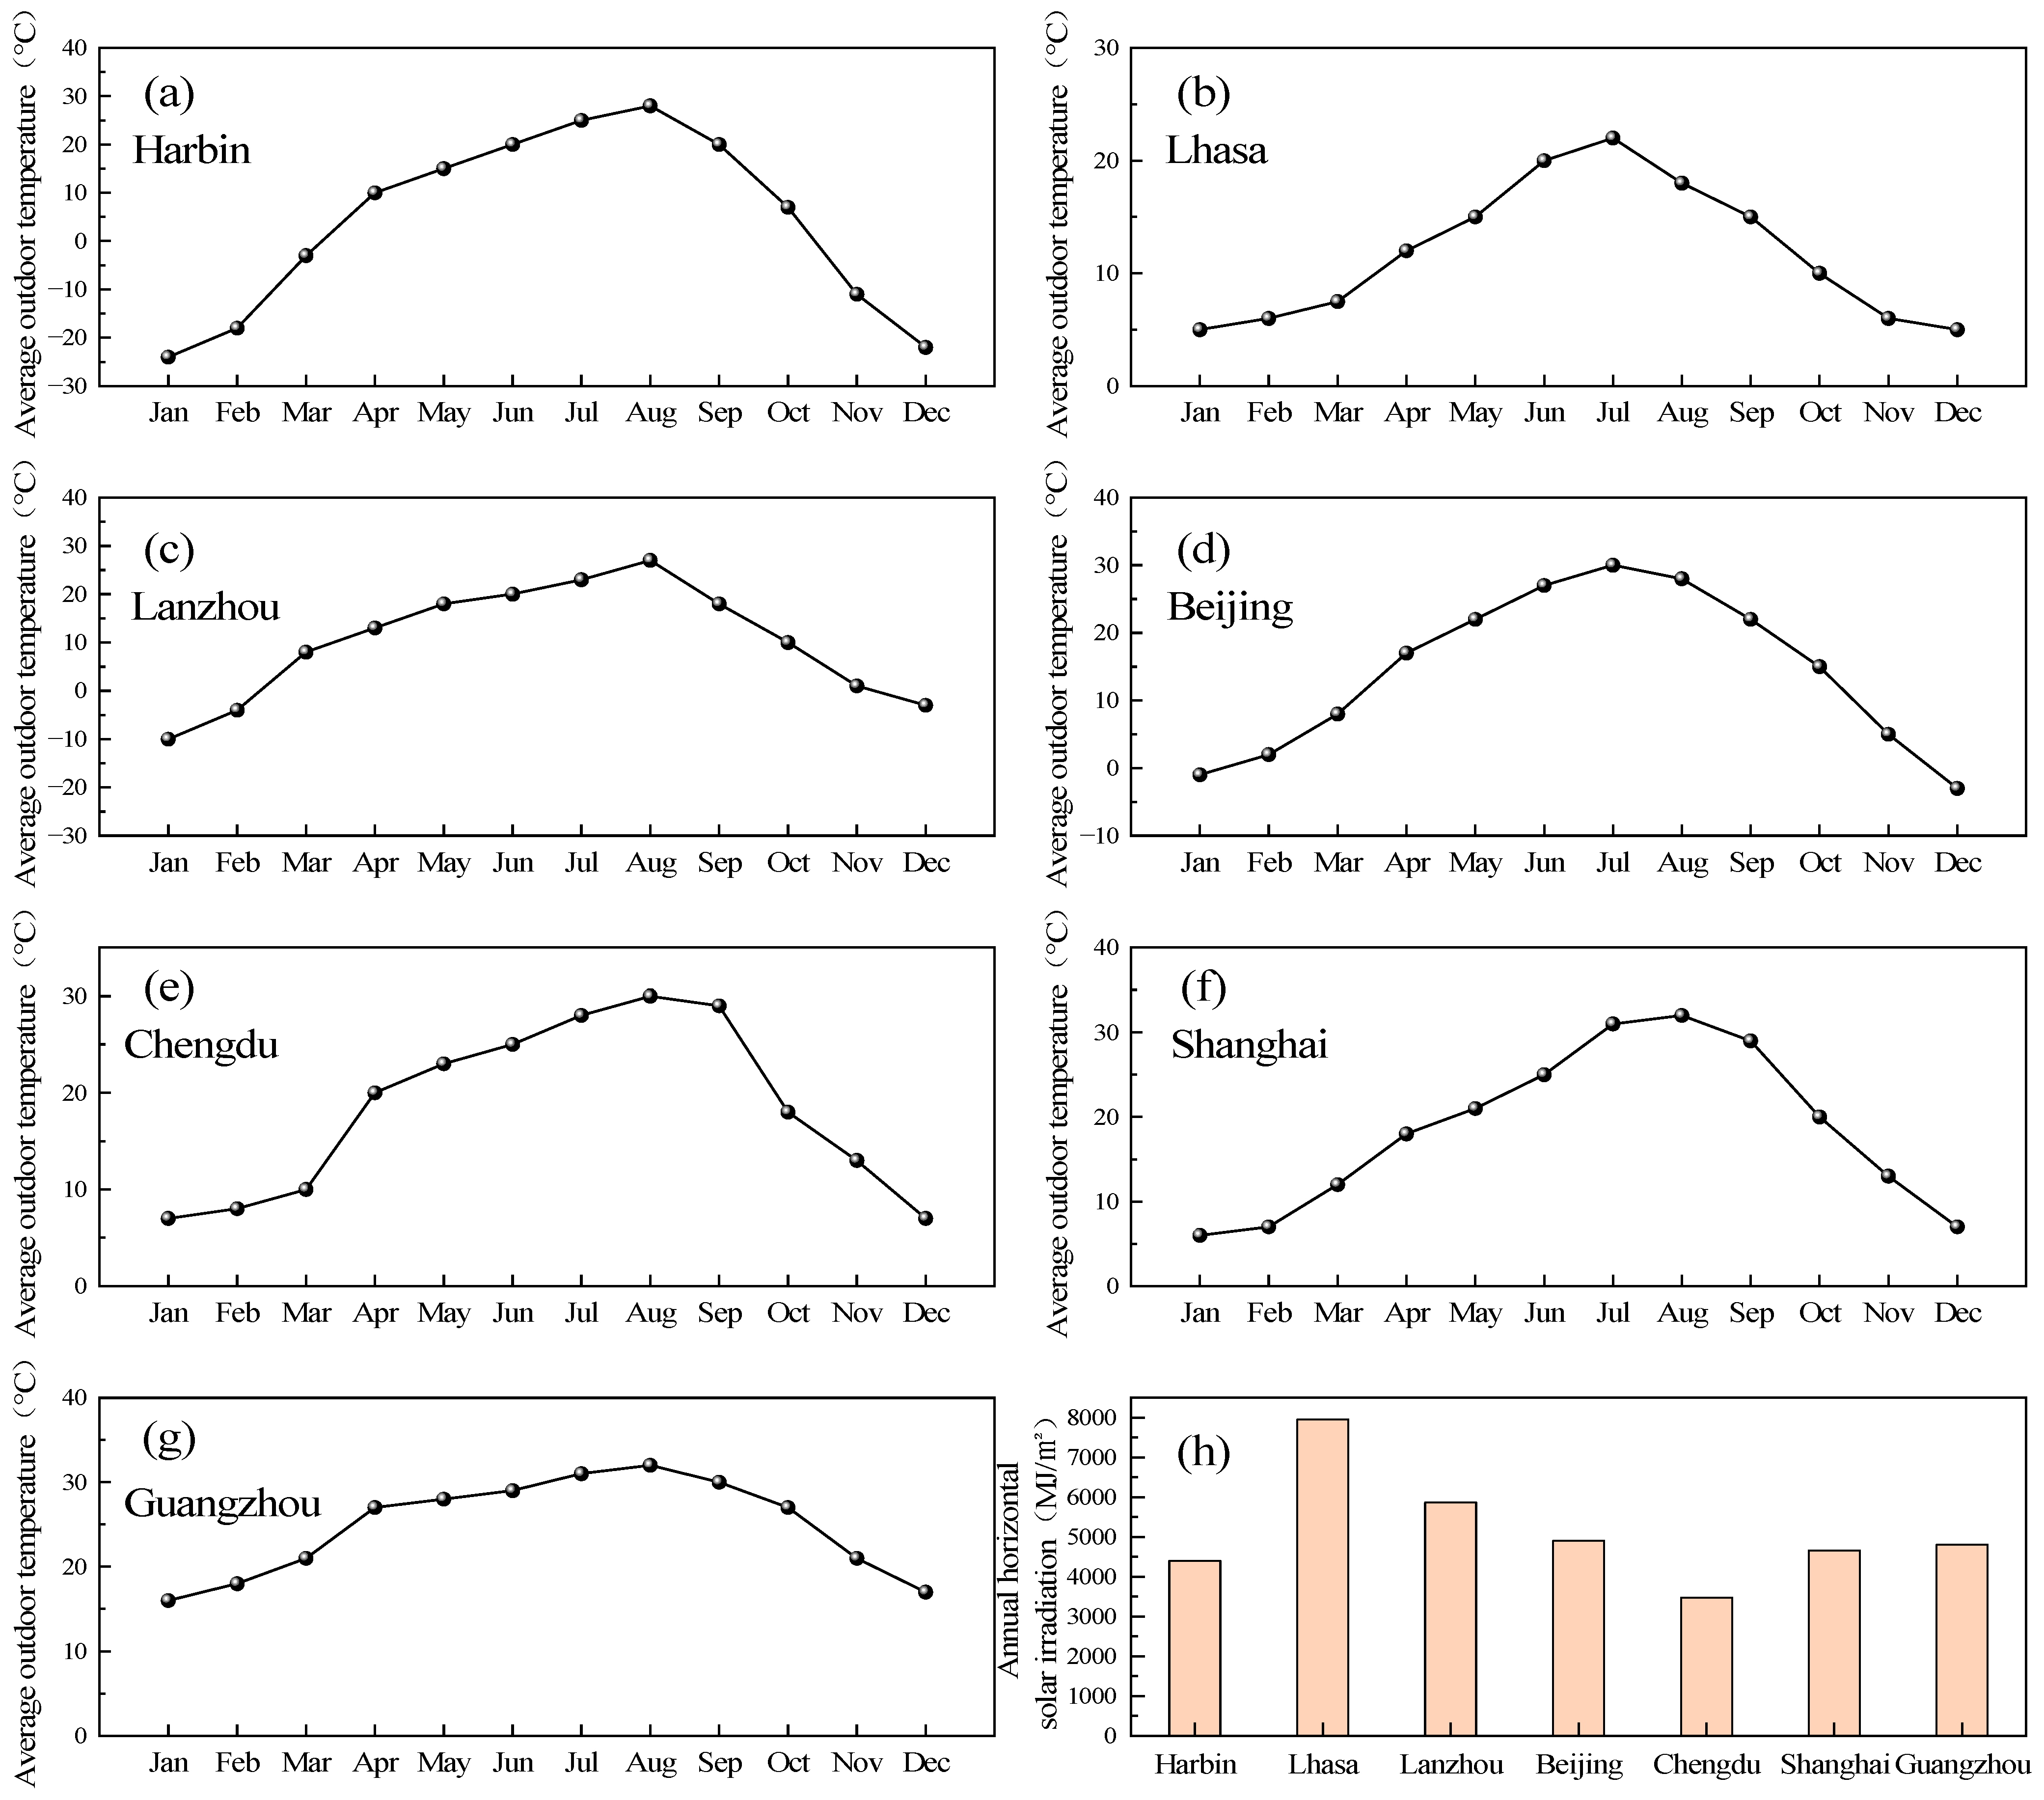
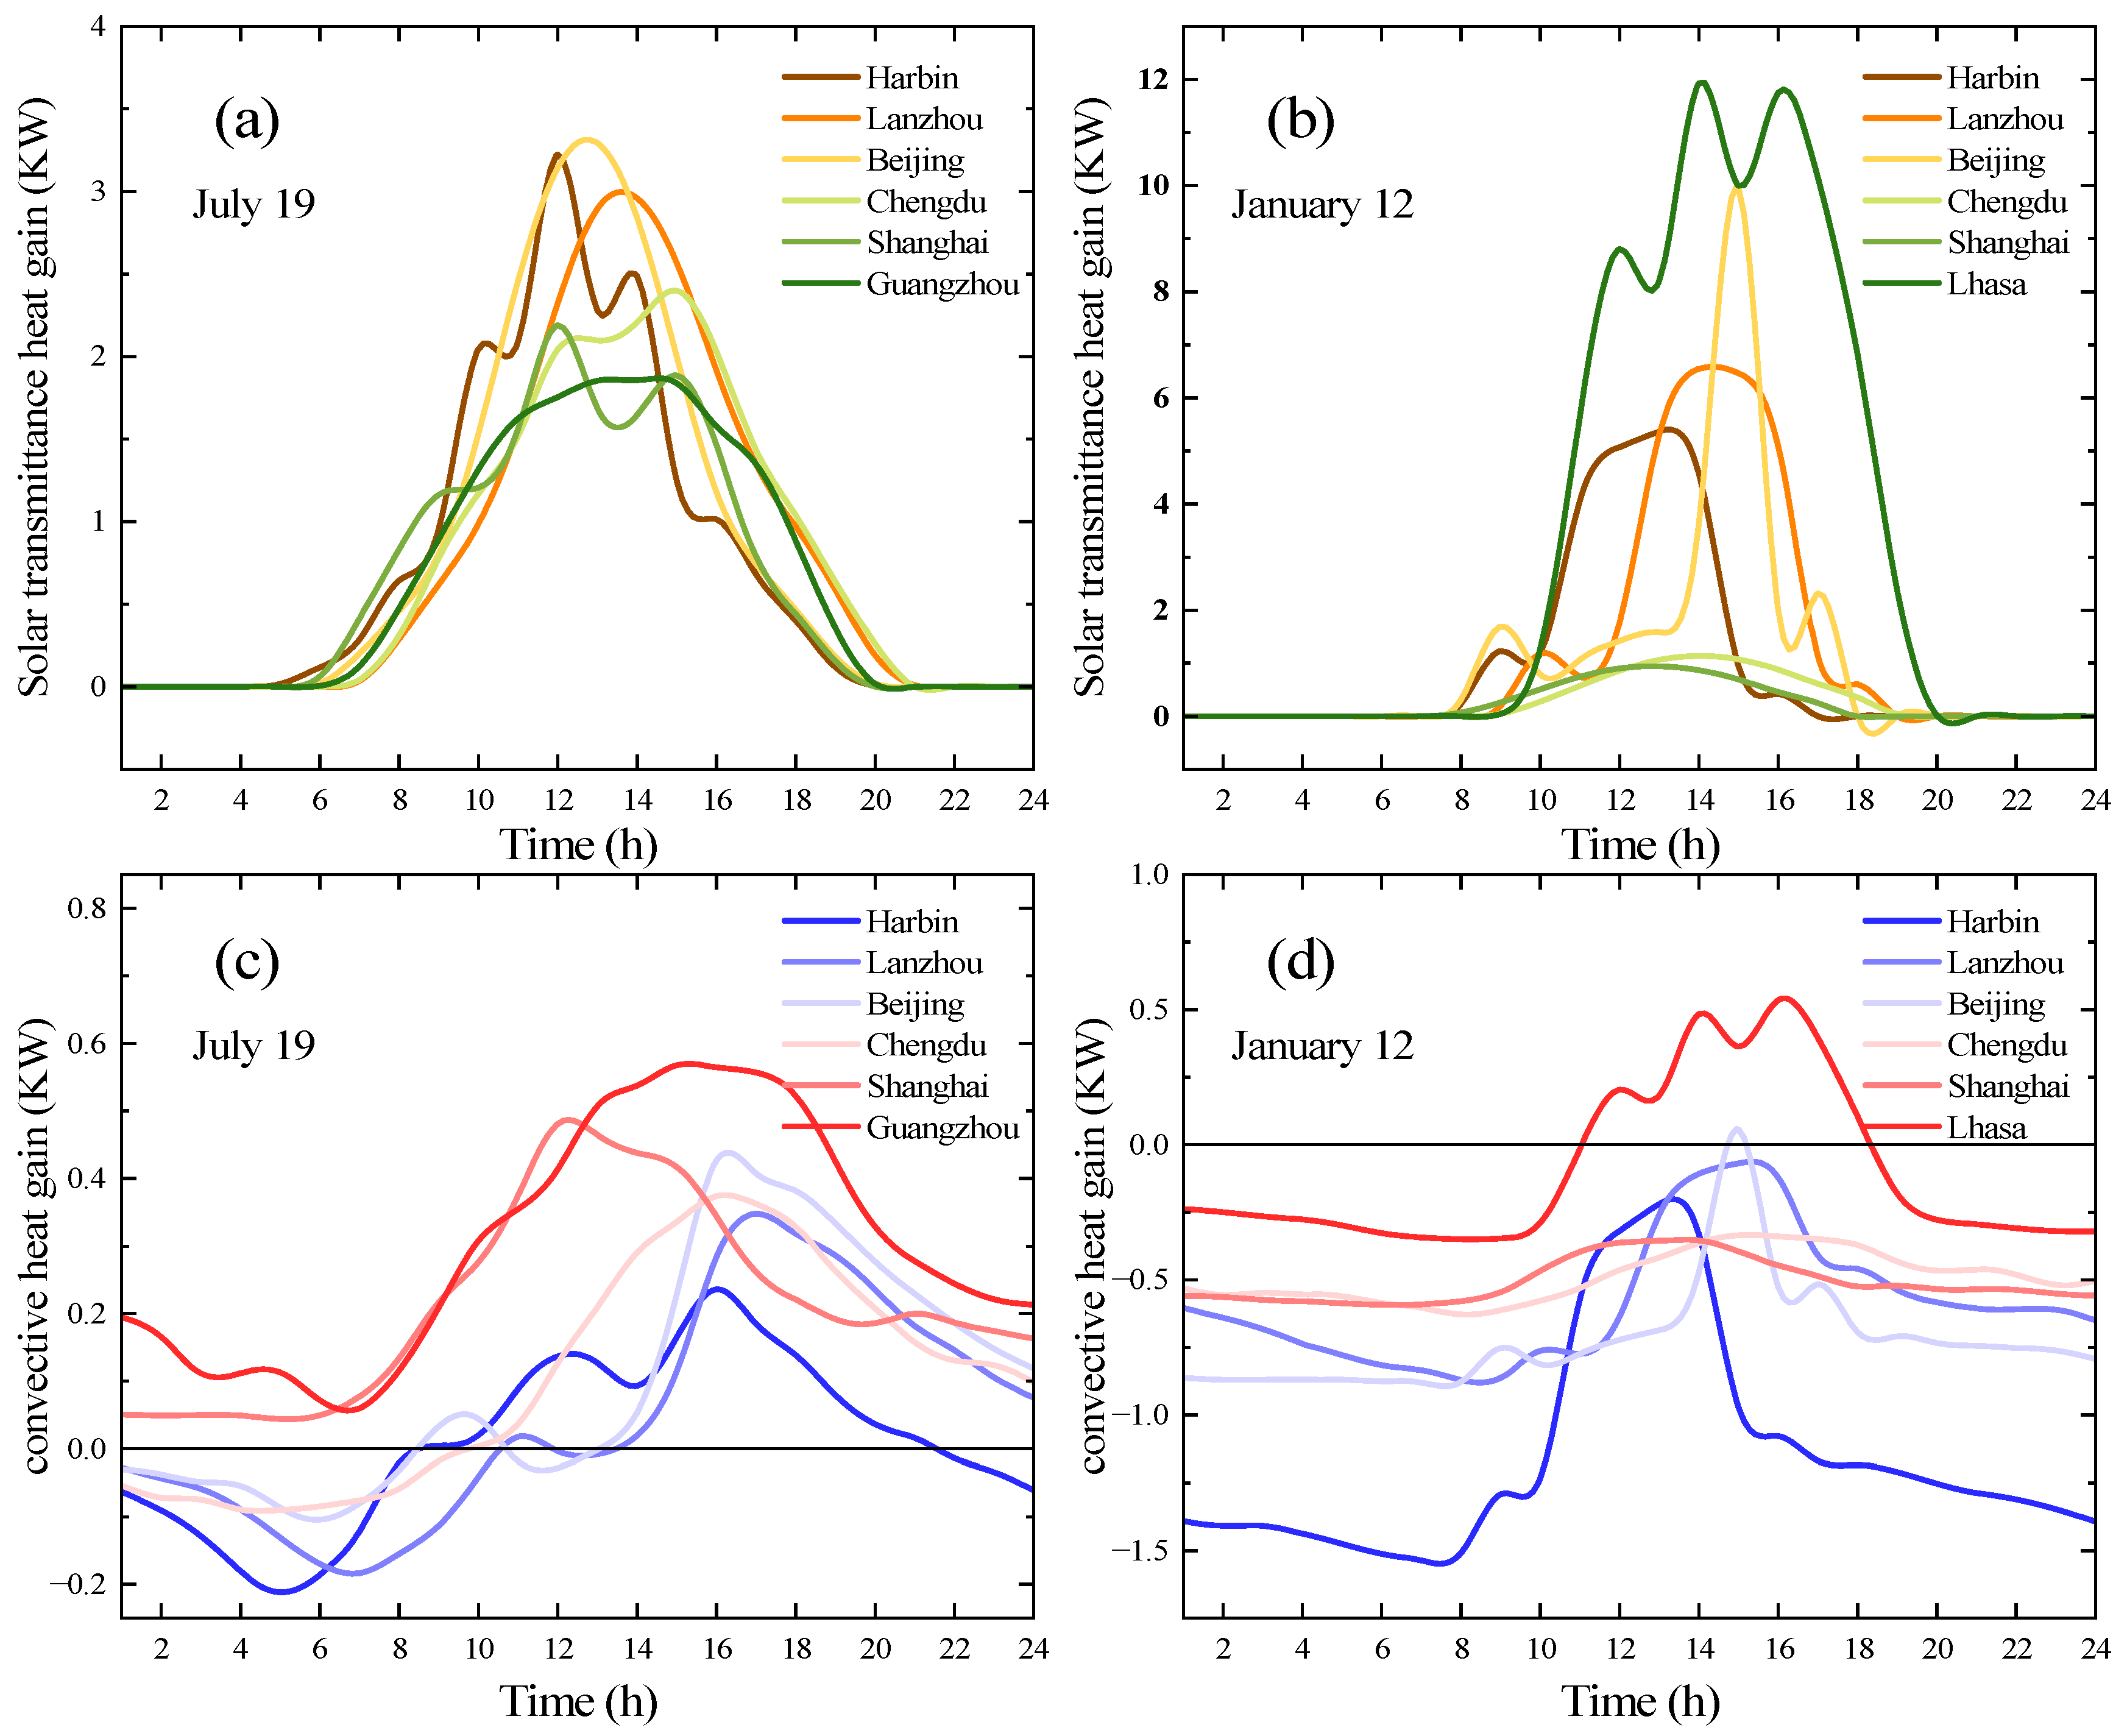
Figure 3a,b illustrate the hourly solar transmittance heat gains through the south-facing transparent envelope of a linear building with a window-to-wall ratio of 0.45 in different cities on a typical summer day and a typical winter day. On a typical summer day like July 19, the duration of solar radiation received is approximately the same across studied cities. However, due to variations in solar altitude angles, the amount of solar radiation received differs among cities. Cities at higher latitudes, such as Harbin, Lanzhou, and Beijing, receive more solar transmittance radiation compared to lower-latitude cities like Chengdu, Shanghai, and Guangzhou. On a typical winter day like January 12, this difference becomes even more distinct. Lhasa, located on the Qinghai–Tibet Plateau with solar-rich resources, receives significantly more solar radiation than other cities and has longer sunshine durations peaking at 12 kW at 14:00. In contrast, Chengdu, situated in the Sichuan Basin with the lowest annual solar irradiation, receives its maximum of only 1 kW on the same day.
Figure 3c,d present the hourly convective heat gains through the south-facing transparent envelope of a linear building with a window-to-wall ratio of 0.45 in different cities on a typical summer day and a typical winter day. Due to variations in outdoor temperatures among cities, the heat transfer through windows varies significantly. In Harbin, Lanzhou, Beijing, and Chengdu, heat loss through windows occurs during the nighttime even in summer. In Guangzhou, the room remains in a heat-gain state throughout the entire day. On a typical winter day, Lhasa’s unique geographic location allows sufficient solar radiation to be absorbed by the windows from 12:00 to 18:00. Therefore, the surface temperature of the windows is higher than the indoor temperature, resulting in a heat-gain state. In other cities on the same day, heat loss occurs throughout the entire 24 h period. Harbin, located in the severe cold region, experiences the highest heat loss, reaching a maximum of 1.5 kW at midnight.
The air conditioning demand varies across different cities, which can be categorized into three scenarios: cooling only demand, heating only demand, and both cooling and heating demands.
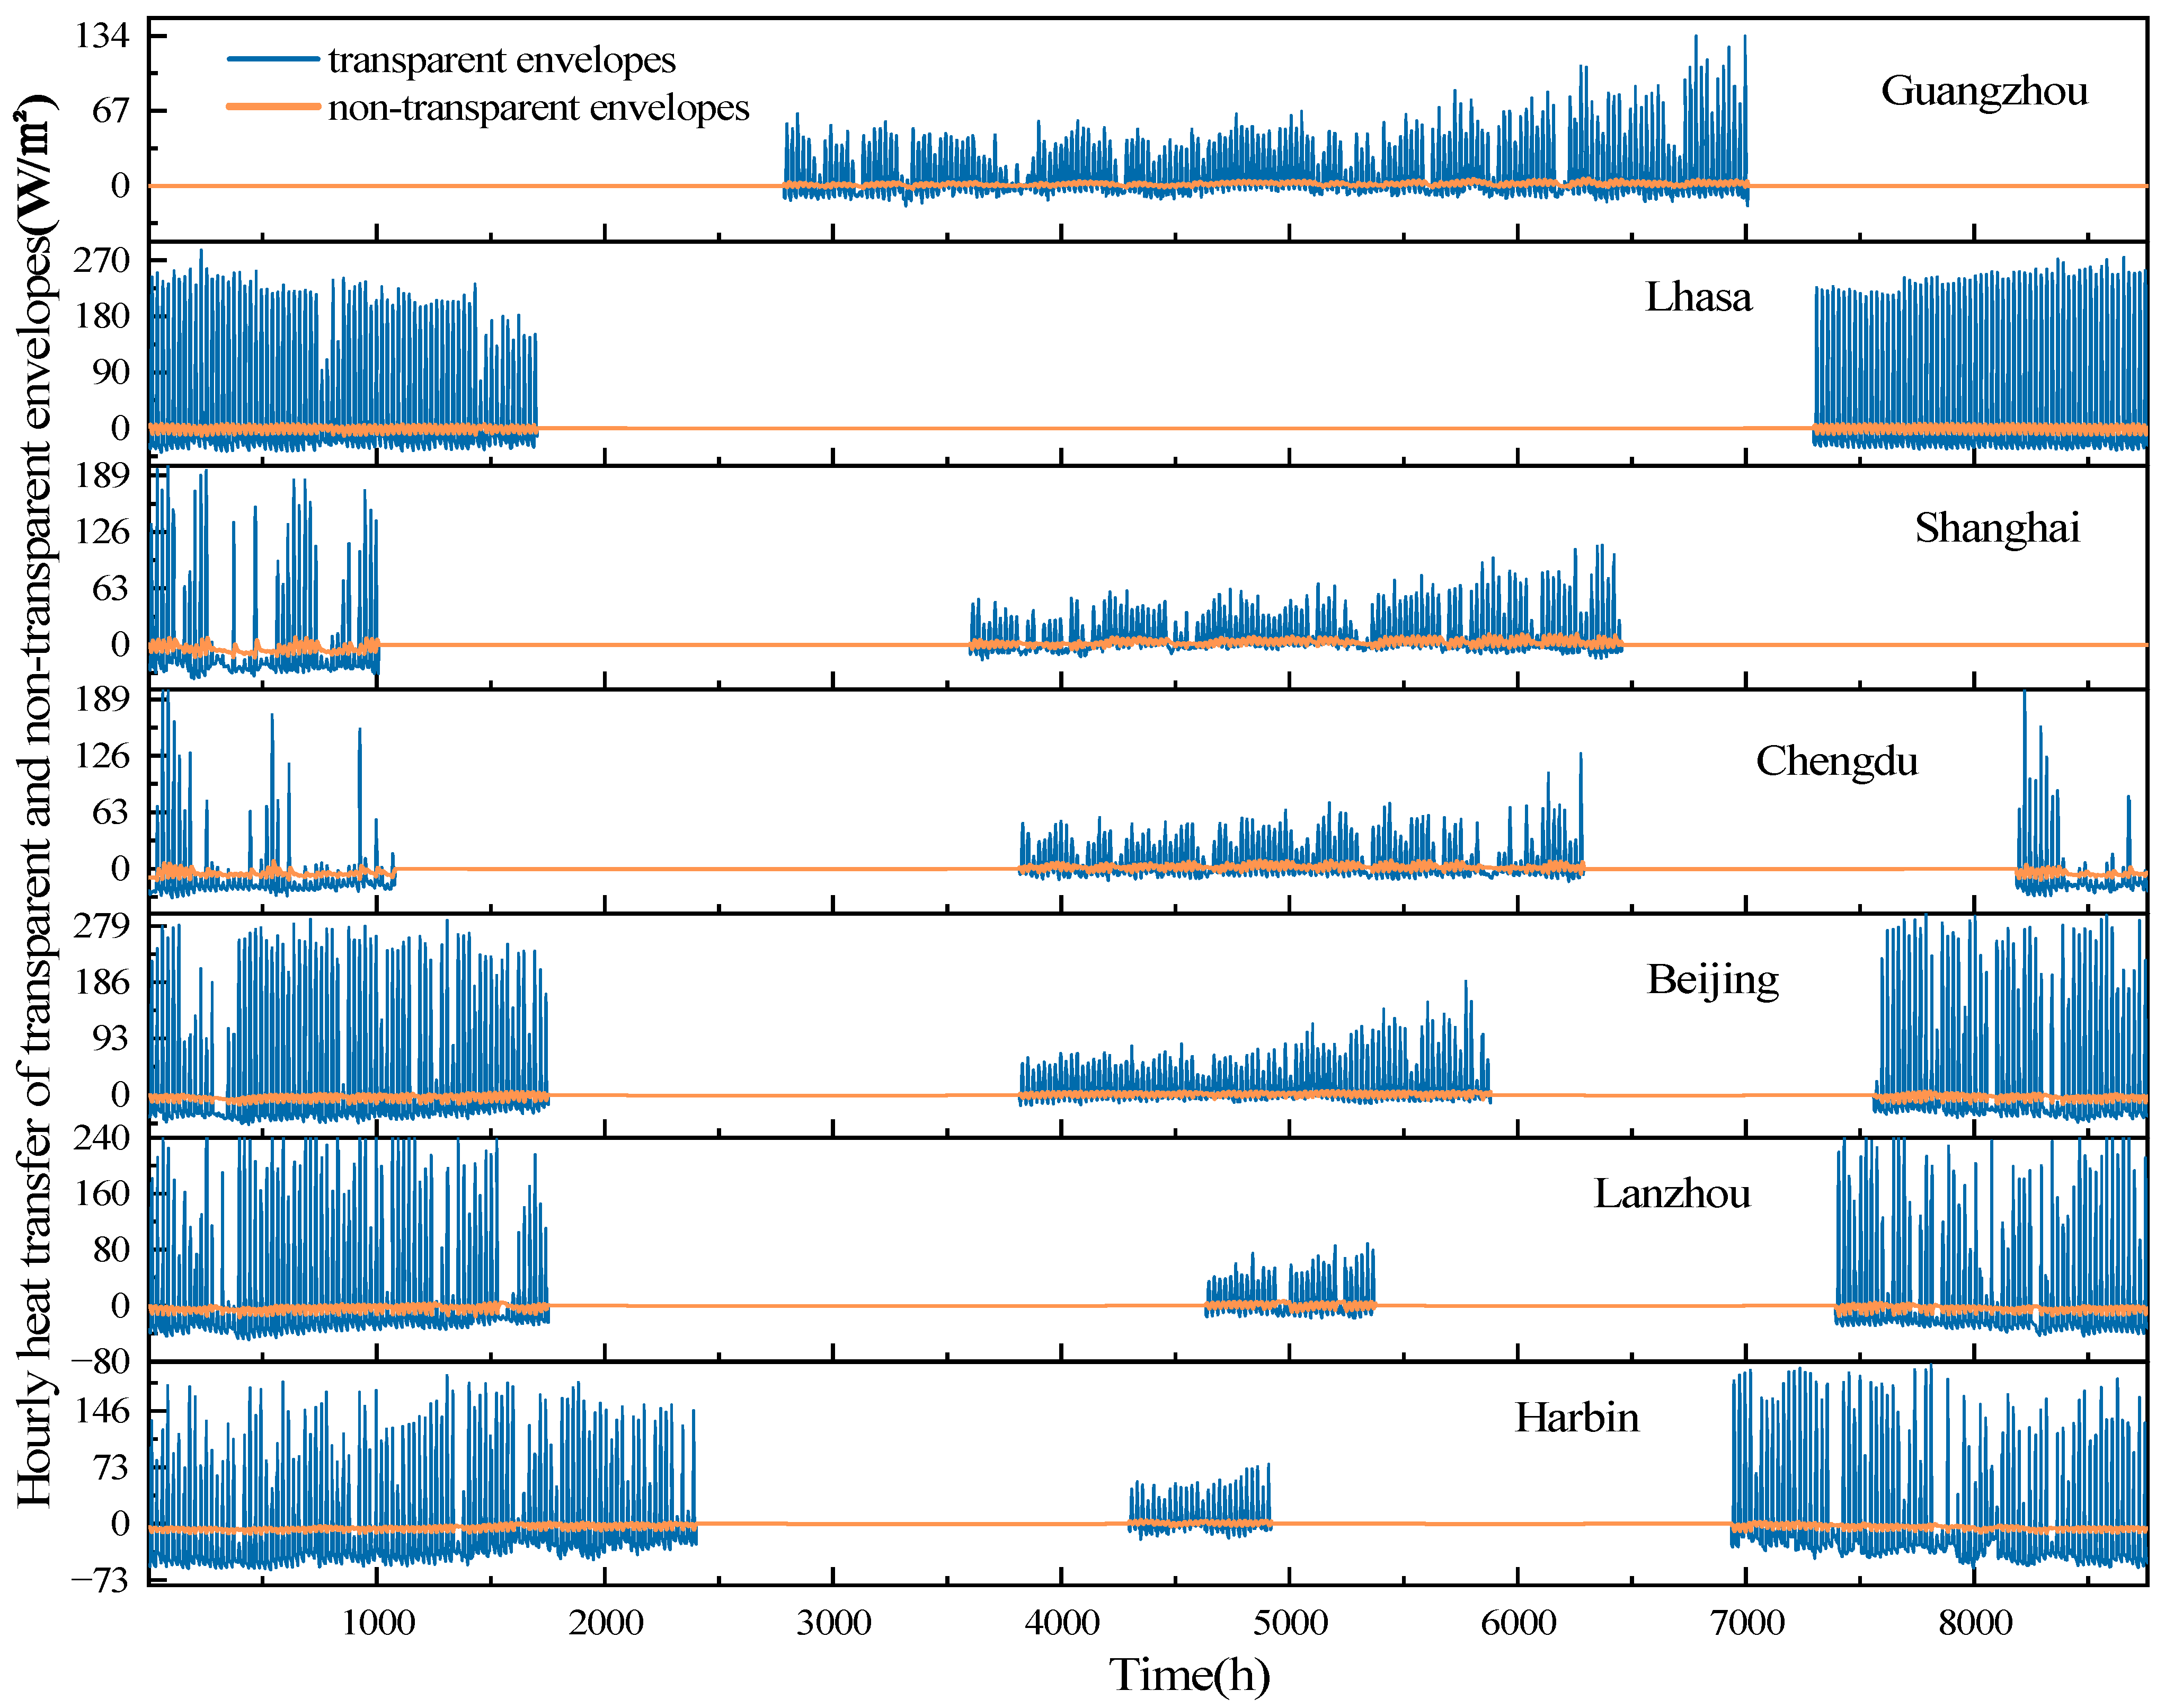
Figure 4 illustrates the hourly heat transfer of transparent and non-transparent envelopes during cooling and heating periods in studied cities. It can be observed that the durations of cooling and heating periods vary among cities. Guangzhou requires cooling only, while Lhasa requires heating only. In other cities, cooling dominates in Shanghai and Chengdu, whereas heating is predominant in Beijing, Lanzhou, and Harbin. Additionally, heat transfer through windows is significantly higher than that through walls, indicating that windows are the primary source of indoor heat gain in buildings across these cities.
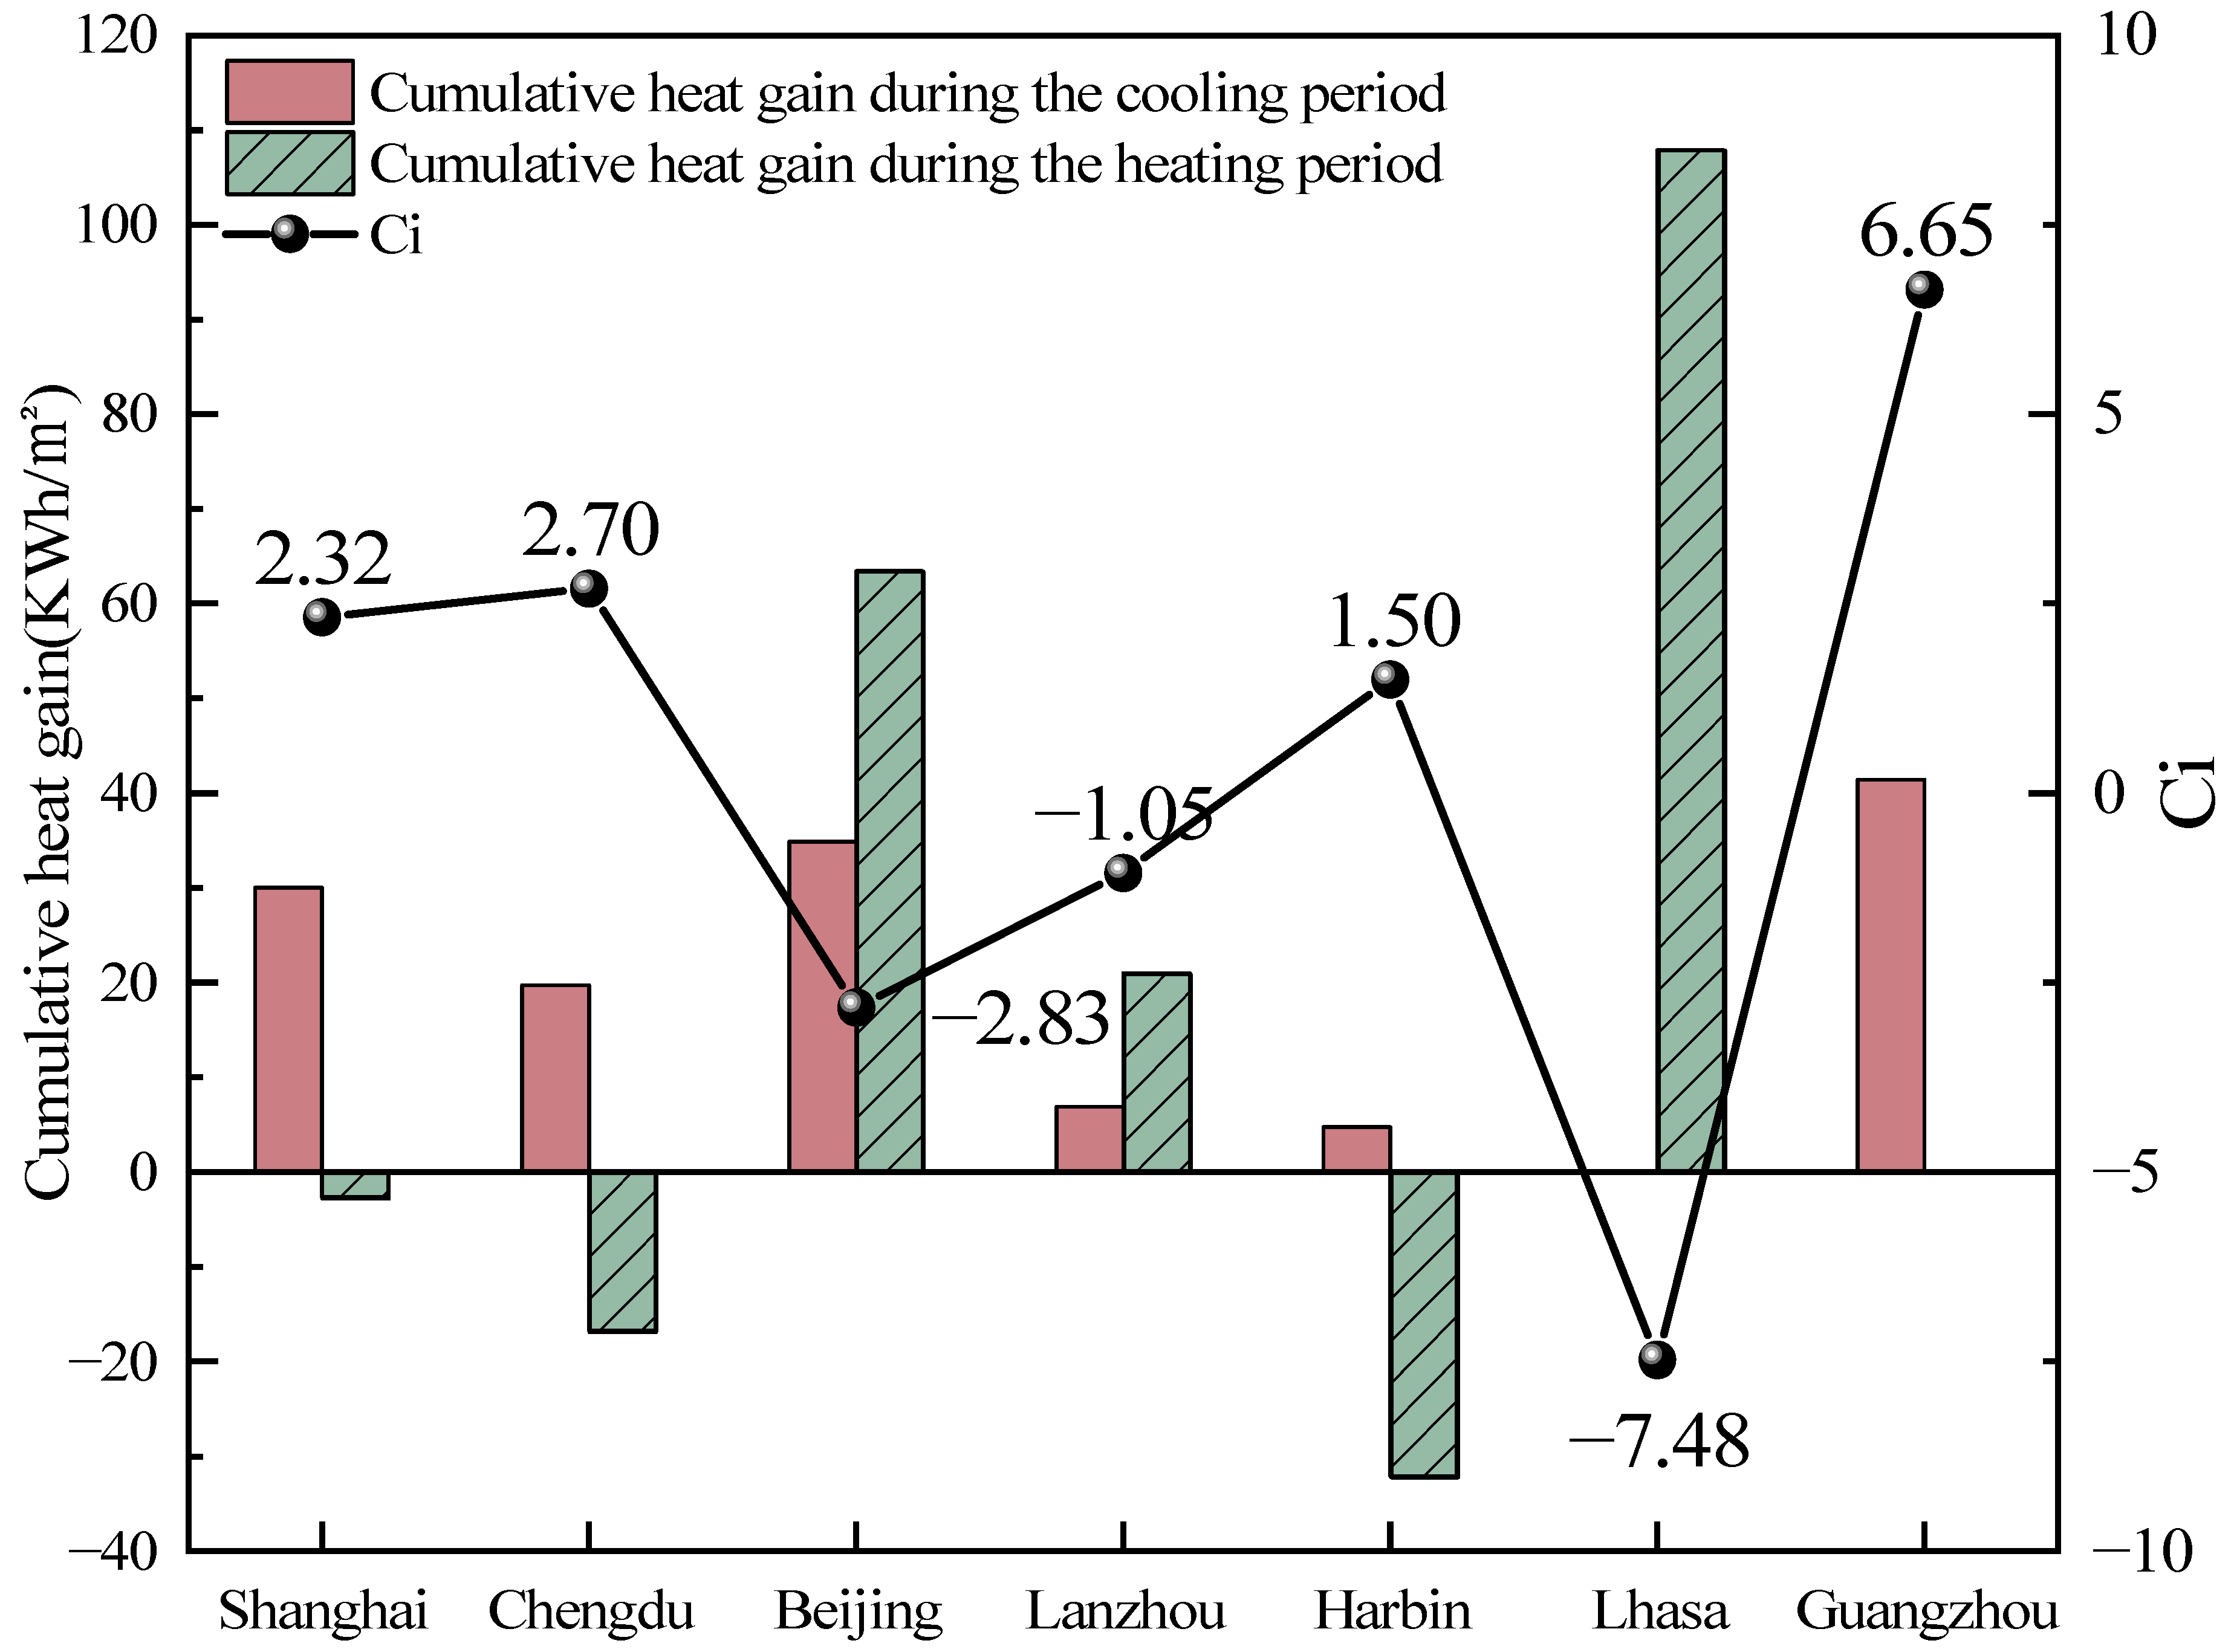
Figure 5 illustrates the cumulative heat gain through the south-facing windows of a linear building during the cooling and heating periods, as well as the corresponding
Ci values for the building’s south-facing facade in different cities. During the summer cooling period, the transparent envelope on the south-facing facade generally exhibits a heat gain, with Guangzhou experiencing a cumulative heat gain of up to 40 kWh/m
2 due to its high-temperature climate. In winter, Harbin, with its extremely low outdoor temperatures, shows a heat loss through the south-facing windows of up to 30 kWh/m
2. In contrast to Harbin, regions such as Beijing, Lanzhou, and Lhasa have positive cumulative heat gains through south-facing windows during the winter heating period. Notably, Lhasa achieves a significant heat gain of 115 kWh/m
2.
The equivalent coefficient of transparent envelope
Ci reflects the annual comprehensive energy performance of facade windows. In cases of
Ci > 0, the transparent envelope gains heat in summer and loses heat in winter, indicating that it is an energy-consuming component. Conversely, in cases of
Ci < 0, the transparent envelope contributes to energy savings and helps reduce air conditioning energy consumption. As shown in
Figure 5, the equivalent coefficients of south-facing windows in Lhasa, Beijing, and Lanzhou are −7.48, −2.83, and −1.05, respectively.
Ci is always positive in other cities. The difference in
Ci values can be attributed to variations in the heat transfer and thermal characteristics of building envelopes due to different geographical environments and climatic conditions. Therefore, in regions like Lhasa, Beijing, and Lanzhou, solar energy should be effectively utilized during the winter to maximize the passive energy-saving potential of buildings.
3.2. Influence of Building Orientations on Ci
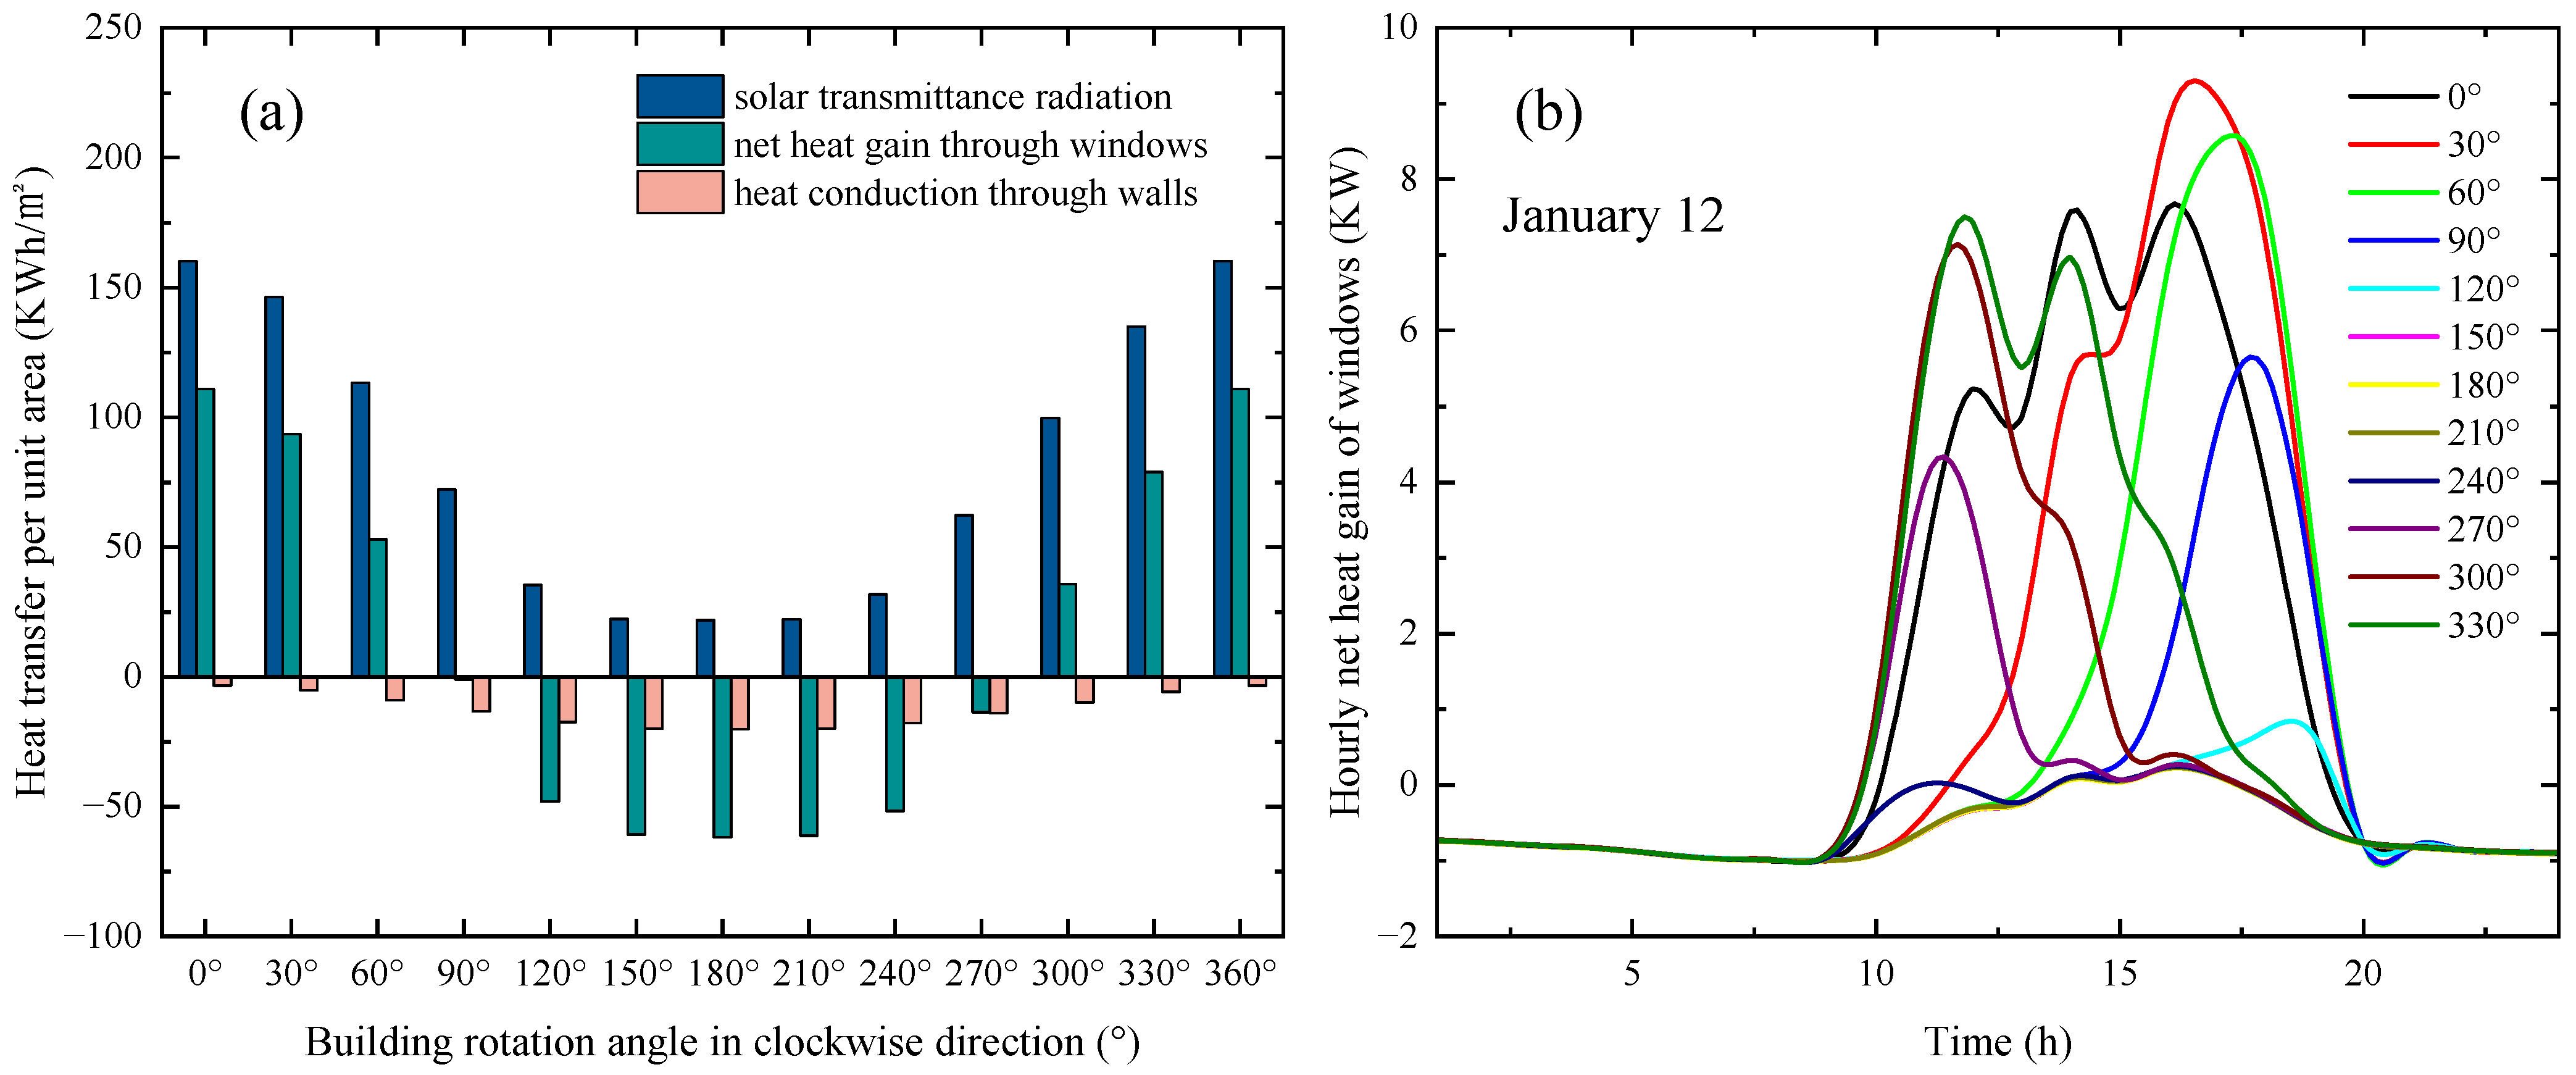
Figure 6a illustrates the variation trends of cumulative solar transmittance radiation through south-facing windows, cumulative net heat gain through south-facing windows, and cumulative heat conduction through walls per unit area during the heating period. A linear building, with a window-to-wall ratio of 0.45 located in Lhasa under different orientations, is selected as the study case. It can be observed from
Figure 6a that, as the building orientation rotates, the solar radiation received by the windows exhibits a trend of initially decreasing and then increasing, which achieves its maximum value at 160 kWh/m
2 when the building is oriented directly south. When the building rotates to face directly north (180°), the solar radiation received by the windows drops to its lowest value, only 21.7 kWh/m
2. Regarding the net heat gain of the windows, the windows exhibit significant heat loss when the building orientation lies within the range of 120° to 270°. This is primarily due to the reduced solar radiation received when the building faces north. In contrast, the heat conduction through walls is significantly lower than that through windows and remains in a heat-loss state across all orientations. The maximum heat loss through walls occurs when the building faces directly north, reaching 20 kWh/m
2.
Figure 6b shows the hourly net heat gain of windows under different orientations on the typical winter day of January 12. The result reveals that, when the building is rotated 30° westward, the cumulative net heat gain of the windows reaches its maximum value of 9 kW. Furthermore, the time-dependent nature of hourly net heat gain is evident, with midday hours showing the highest heat gains due to direct solar incidence.
To more clearly illustrate the impact of orientation changes on the equivalent coefficient
Ci of transparent enclosures, we further calculated the mean and standard deviation of
Ci for windows on each facade of the linear building at three angles.
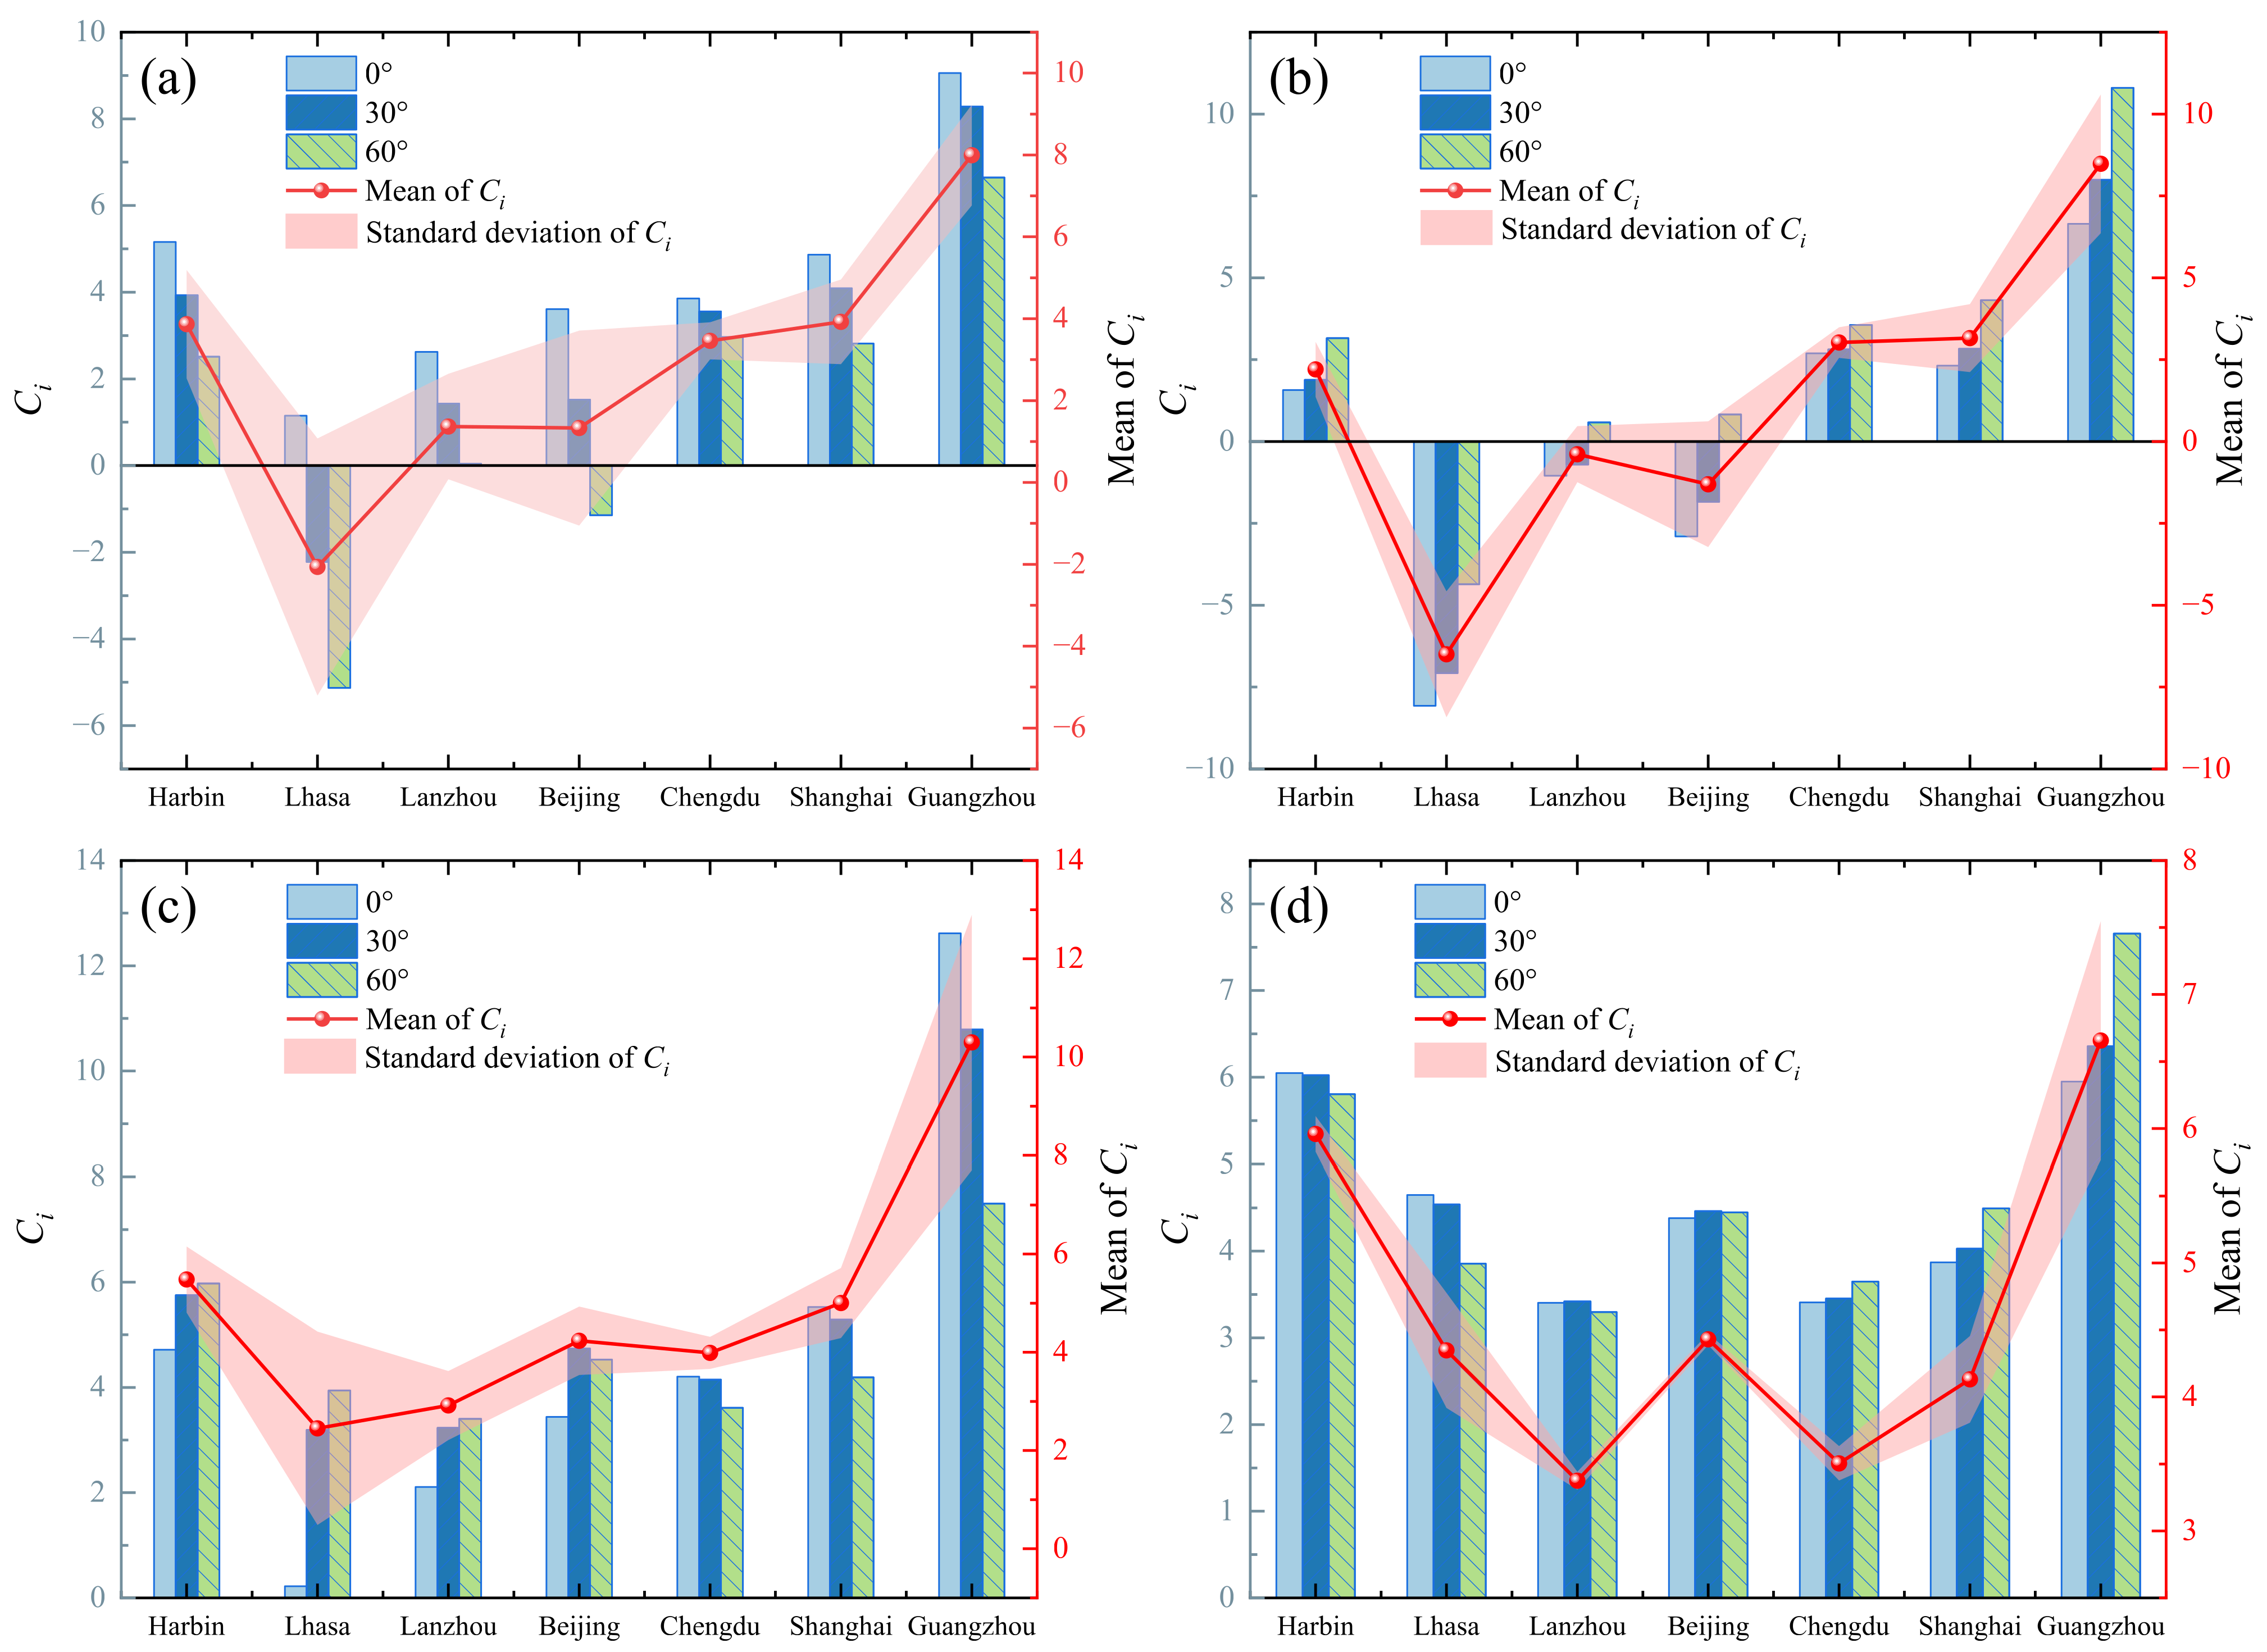
Figure 7 displays the
Ci values, along with their means and standard deviations, for windows at different angles in the single-line building model across various cities. As illustrated, the
Ci values for transparent envelope equivalent coefficients vary across windows when buildings are located in different regions. When the building orientation shifts from 0° to 60°, the changes in
Ci for each window also exhibit distinct differences. Detailed analysis follows below.
Figure 7 shows the variation in the
Ci for windows on different facades of a linear building at various rotation angles in different cities. In cities dominated by cooling demand, such as Chengdu, Shanghai, and Guangzhou, during the rotational adjustment process of the building, the equivalent coefficients of east- and west-facing windows gradually decrease by 24–42%, while the values for south- and north-facing windows increase by 16–62.5%.
In heating-dominated regions such as Harbin, Lhasa, and Lanzhou, the equivalent coefficients of south- and west-facing windows increase as the building rotates. Among these, the west-facing windows in Lhasa exhibit the largest increase, rising from 0.22 to 3.94. In contrast, the Ci values for east- and north-facing windows decrease, with reductions generally exceeding 17%. Notably, the east-facing windows in Lhasa show the most significant decline, with the equivalent coefficient dropping from 1.15 to −2.22.
3.3. Influence of Window-to-Wall Ratios on Ci
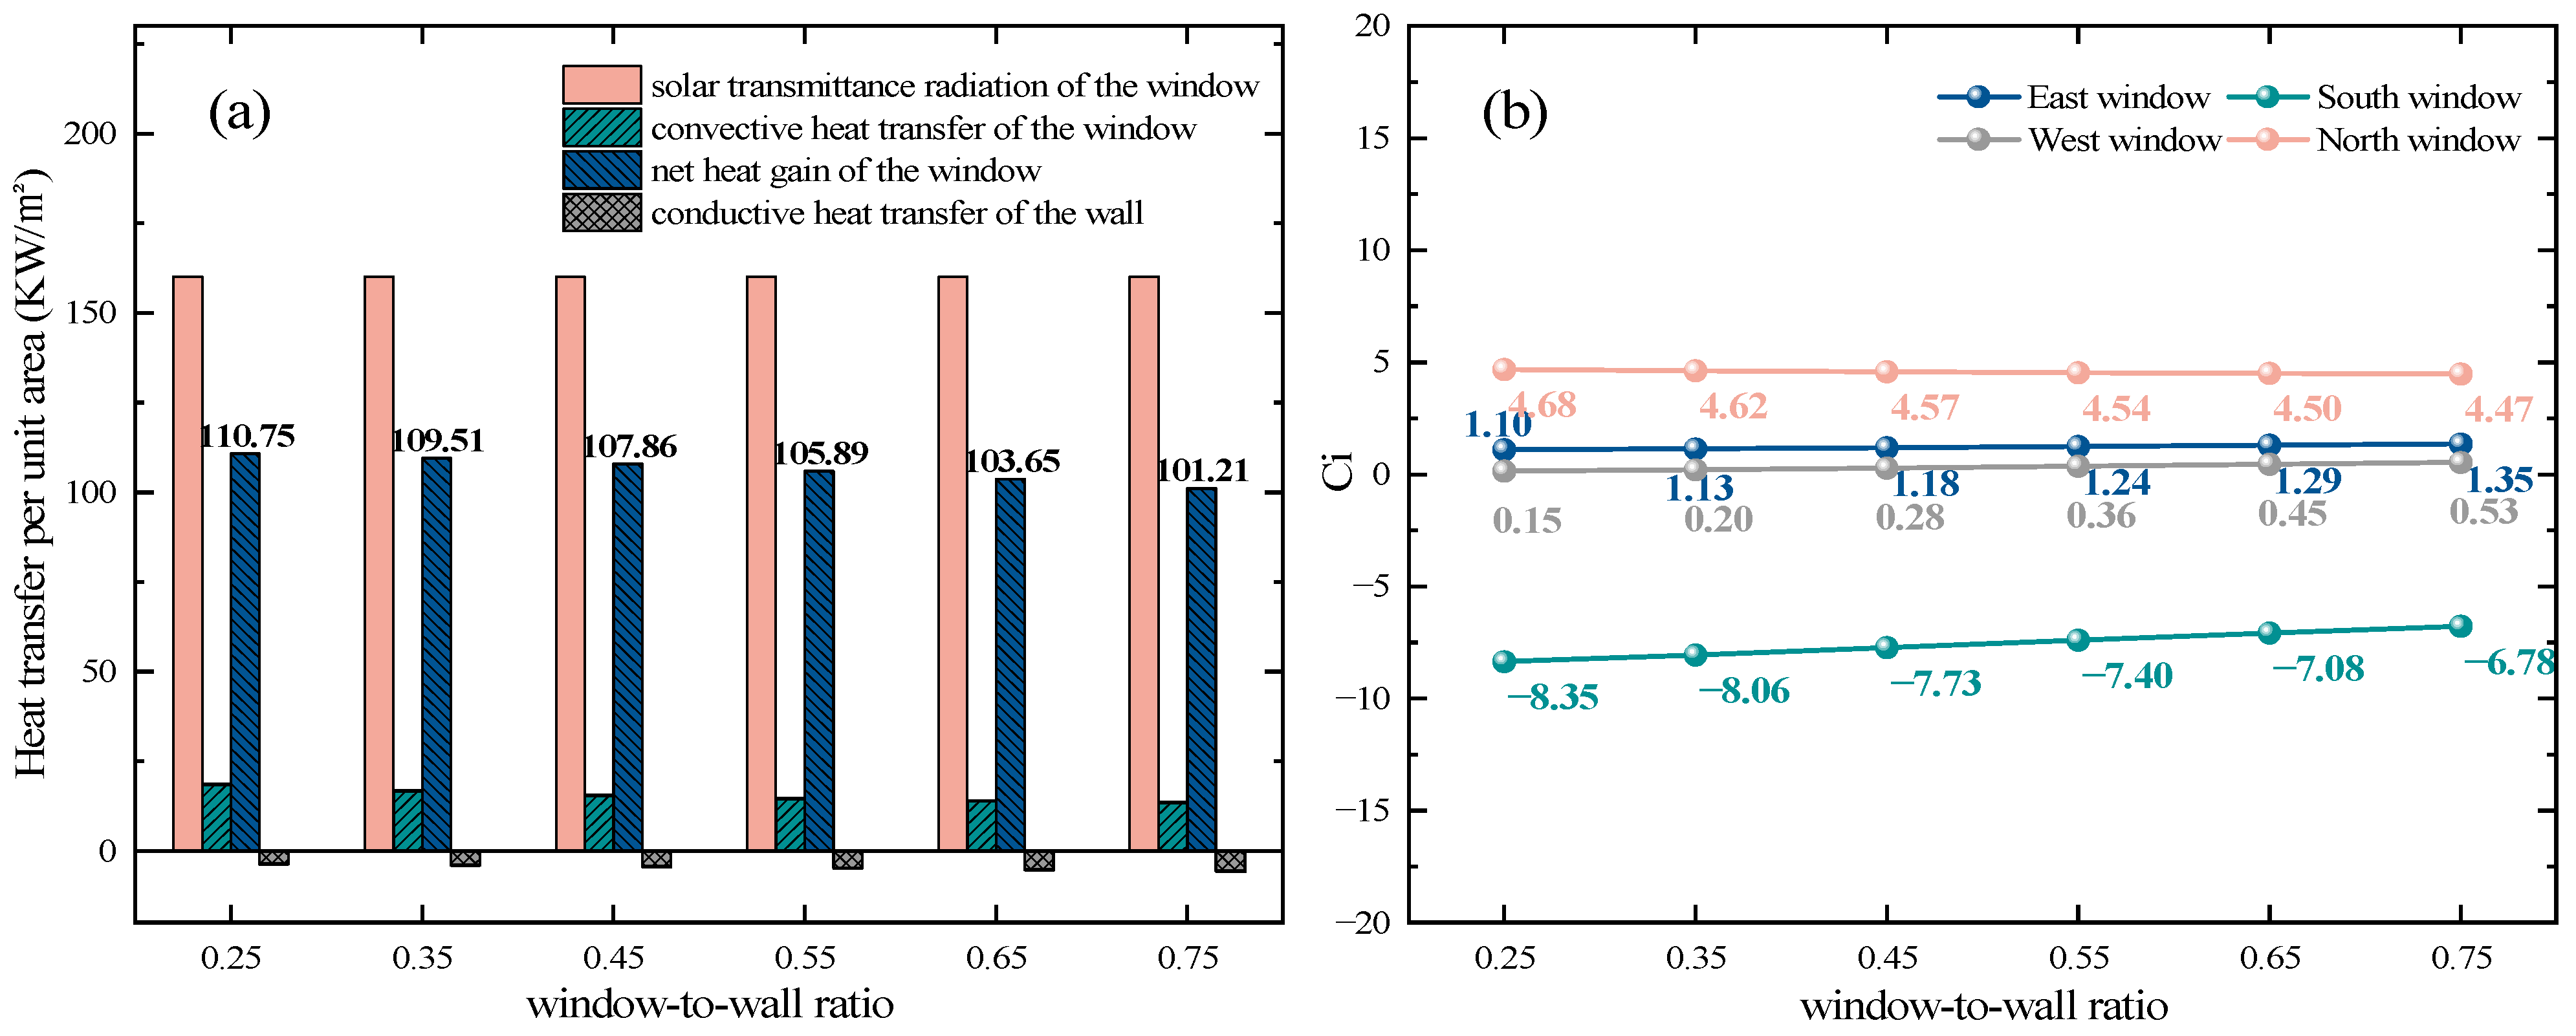
A north–south oriented linear building located in Lhasa under different window-to-wall ratios is selected as the study case.
Figure 8a illustrates the variations in solar transmittance radiation, convective heat transfer, net heat gain per unit area of the south-facing windows, and conductive heat transfer per unit area of the walls under different window-to-wall ratios. It can be obviously observed that, as the window-to-wall ratio increases, the solar transmittance heat gain per unit area of the windows remains relatively stable, while the convective heat transfer between the windows and indoor air decreases. This leads to an 8.61% reduction in the net heat transfer through the windows into the indoor space.
Furthermore, the equivalent coefficients
Ci for windows on each facade are calculated, with the results shown in
Figure 8b. The results indicate that as the window-to-wall ratio increases from 0.25 to 0.75, the
Ci value for the east-, south-, west-, and north-facing windows increase by 0.25, 1.57, 0.38, and 0.21, respectively.
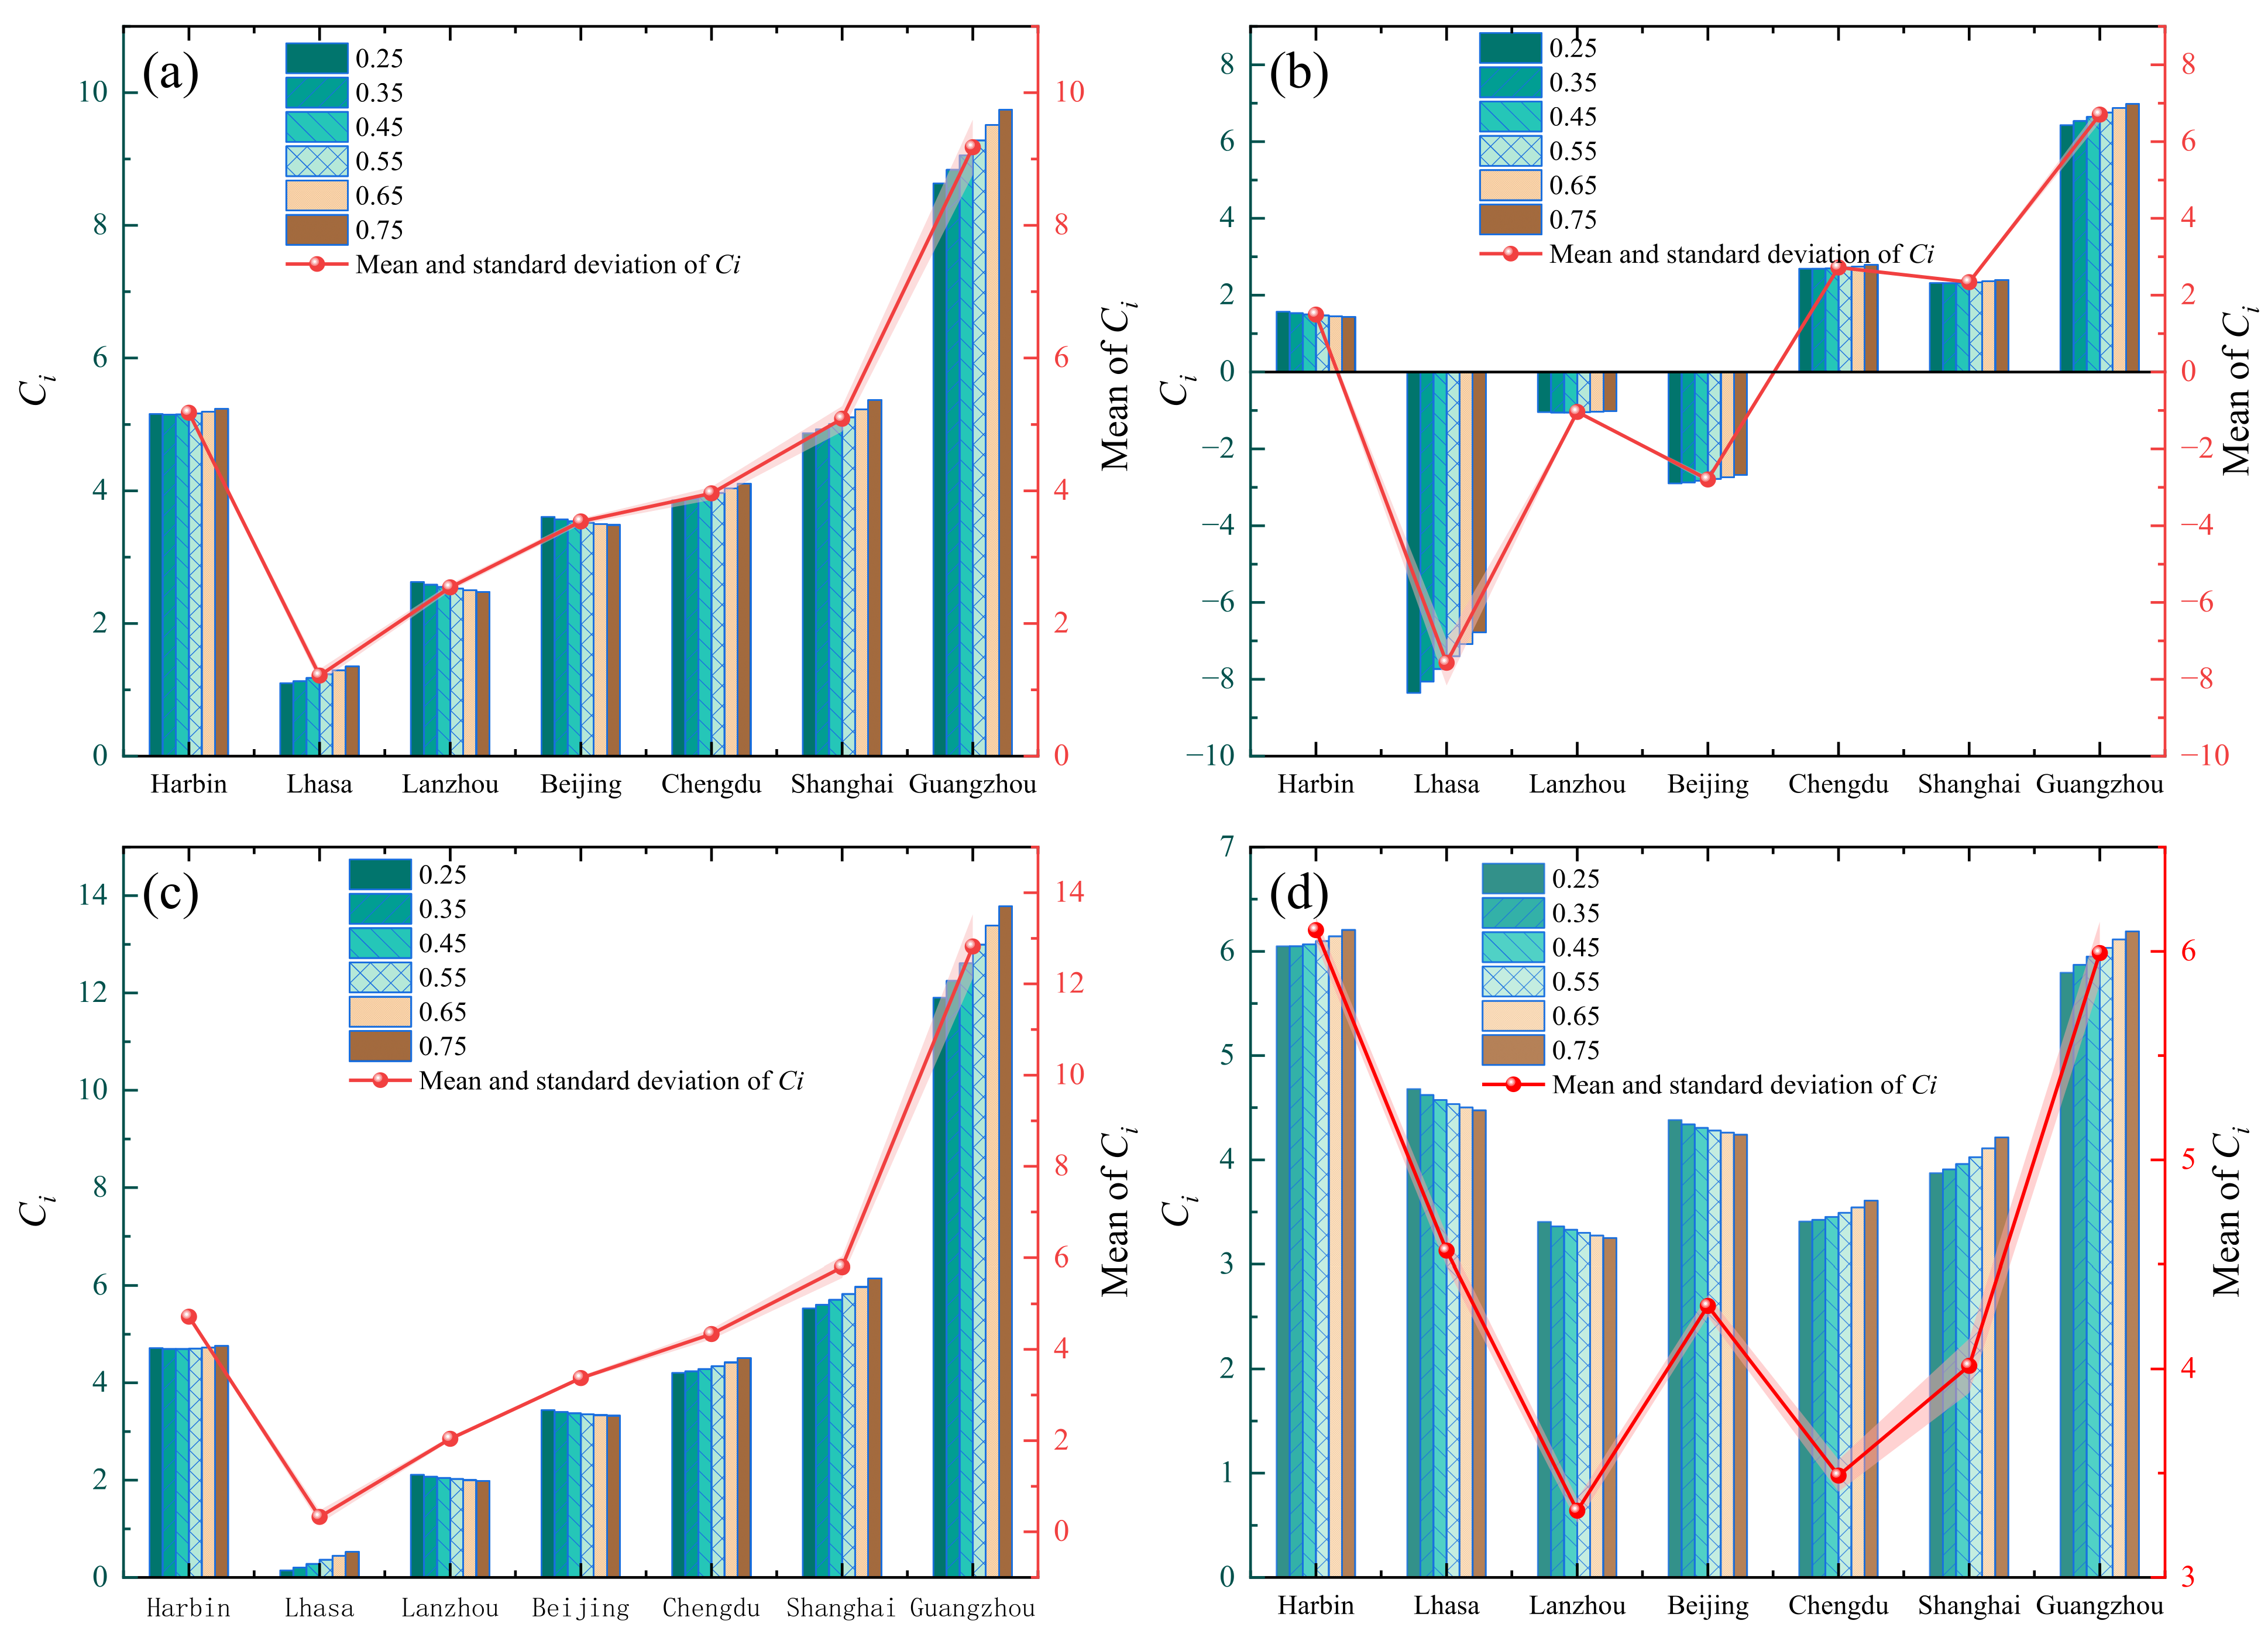
Similarly, based on the analysis of the above typical cases, we simulated and calculated the heat loss of the envelope structure and the air conditioning electricity consumption for the linear building in different typical cities at window-to-wall ratios of 0.25, 0.35, 0.45, 0.55, 0.65, and 0.75 for each facade.
Figure 9 shows the variation in the equivalent coefficient of transparent envelopes on different facades of the linear building under various window-to-wall ratios across different cities. It can be observed that, as the window-to-wall ratio increases from 0.25 to 0.75, the
Ci value of the transparent envelope exhibits relatively small overall variation. Among these, the south-facing transparent envelope in Lhasa shows the largest increase in
Ci, reaching 18.8%. However, in most cases, the variation in
Ci remains below 10%.
3.4. Influence of Building Shapes on Ci
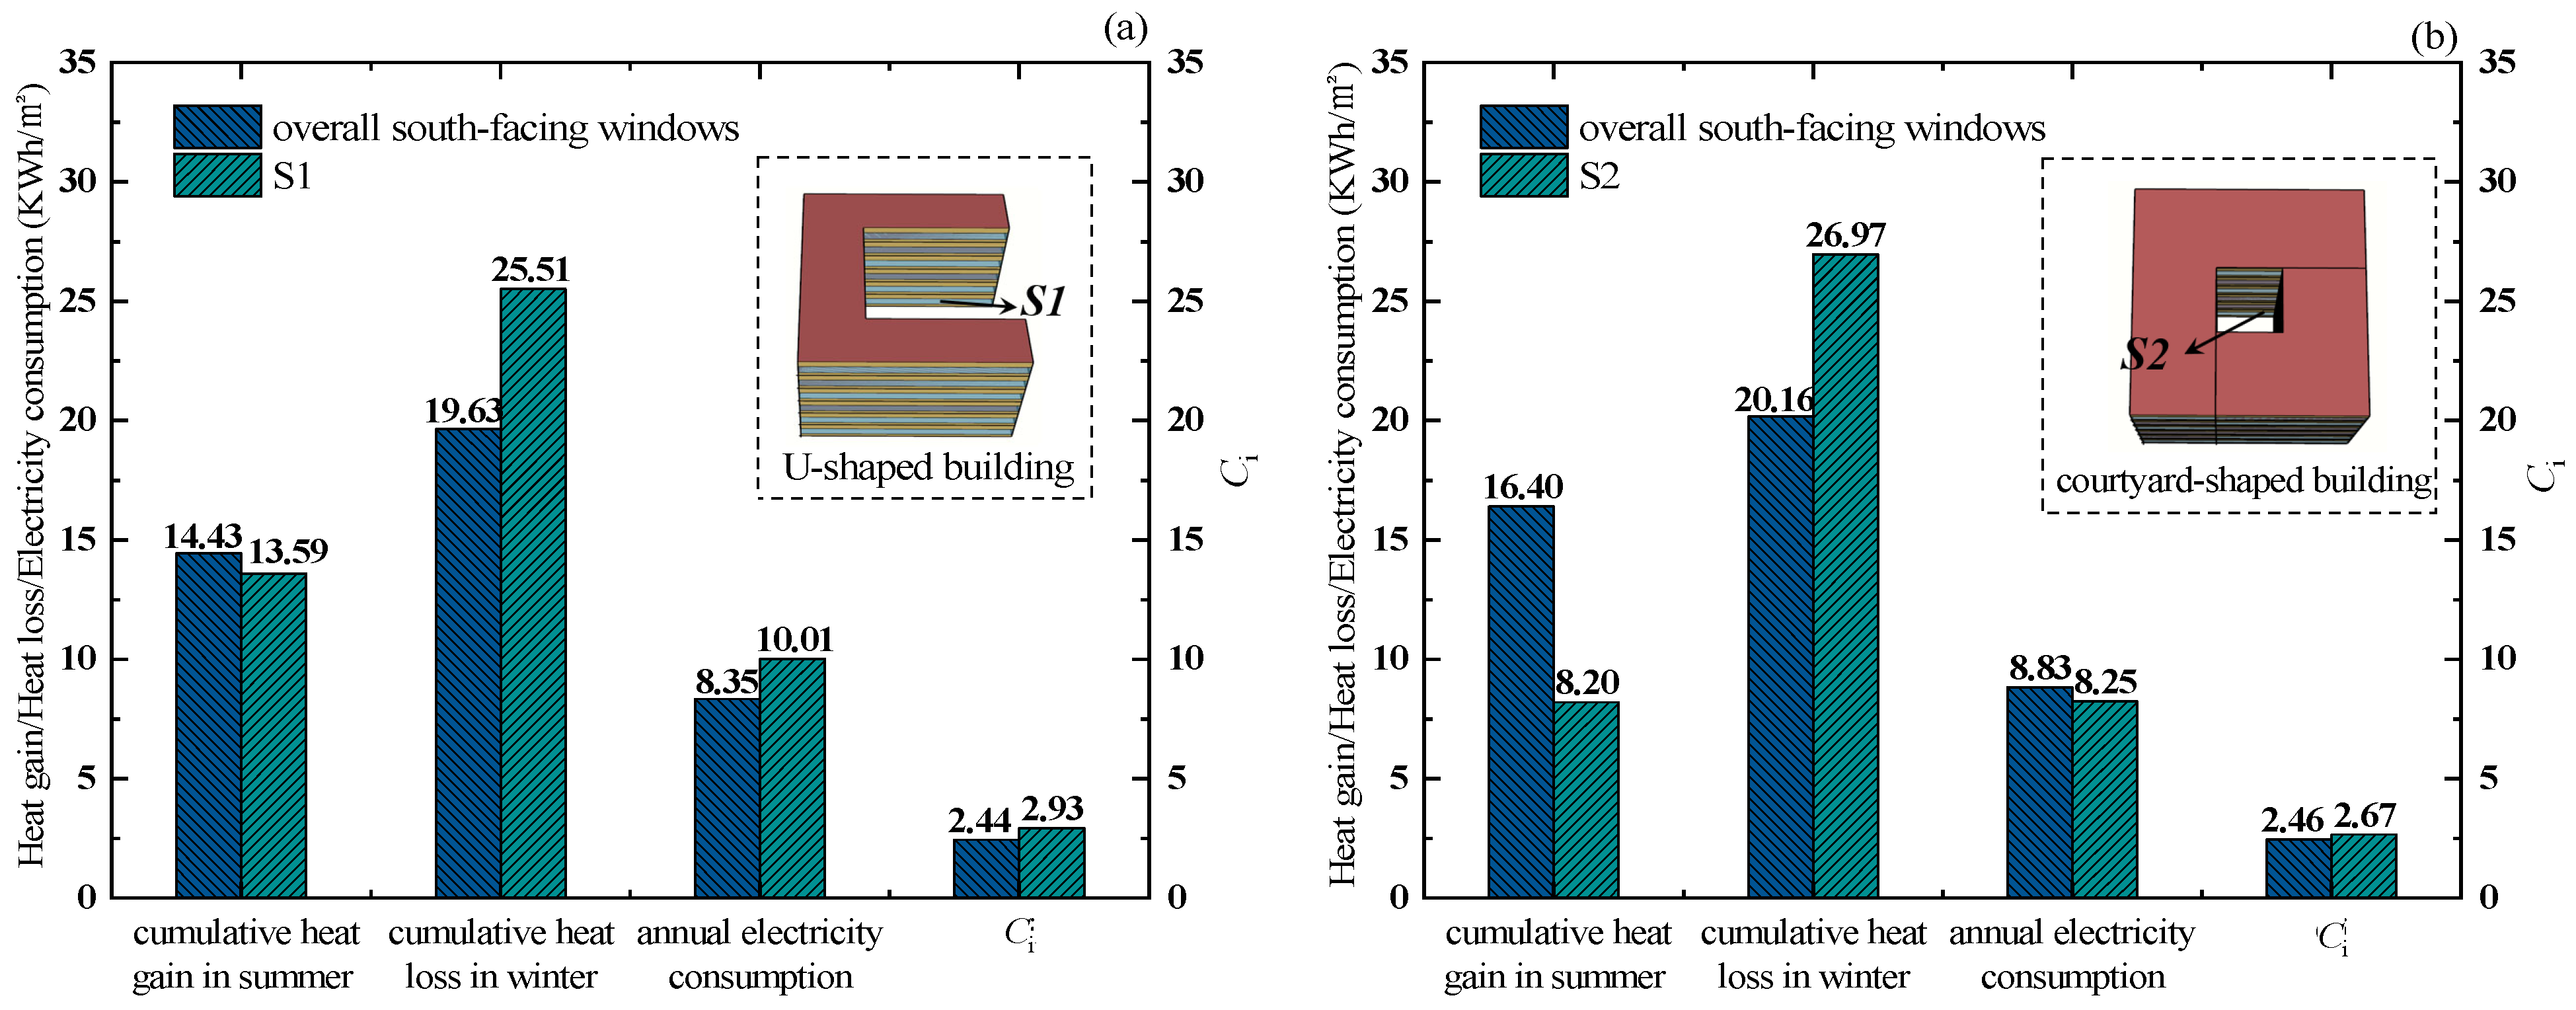
To investigate the influence of self-shading on the equivalent coefficient of transparent envelopes for buildings with different shapes, a U-shaped building and a courtyard-shaped building in Chengdu are selected as study cases. These two building both have six floors, a window-to-wall ratio of 0.45, and are oriented north–south. Regarding the U-shaped building and courtyard-shaped building, the most shaded south-facing window is referred to as Surface 1 (S1) and Surface 2 (S2), respectively. Obviously, S2 experiences more shading in comparison to S1.
Figure 10a compares the cumulative heat gain in summer, cumulative heat loss in winter, annual electricity consumption, and
Ci per unit area between S1 and overall south-facing windows of the U-shaped building. The results show that the cumulative summer heat gain for S1 is 0.84 kWh/m
2 lower than that of the overall south-facing windows of the building. However, the cumulative winter heat loss for S1 is 5.88 kWh/m
2 higher, leading to an increase of 1.66 kWh/m
2 in annual electricity consumption. This is due to the shading effect of the walls in front of S1 which reduce the amount of sunlight received on this surface. Moreover, the
Ci value for the overall south-facing windows and S1 of the building is 2.44 and 2.93, respectively, showing a difference of 0.49.
Figure 10b presents a comparison of various values between S2 and the overall south-facing windows of the courtyard-shaped building. It can be obviously found that the heat gain in summer for S2 is 50% less than that of the overall south-facing windows. In winter, the shading effect results in 33.78% more heat loss for S2 compared to the overall south-facing windows. However, the difference in annual electricity consumption and
Ci between S2 and the overall south-facing windows is only 6.56% and 7.86%, respectively.
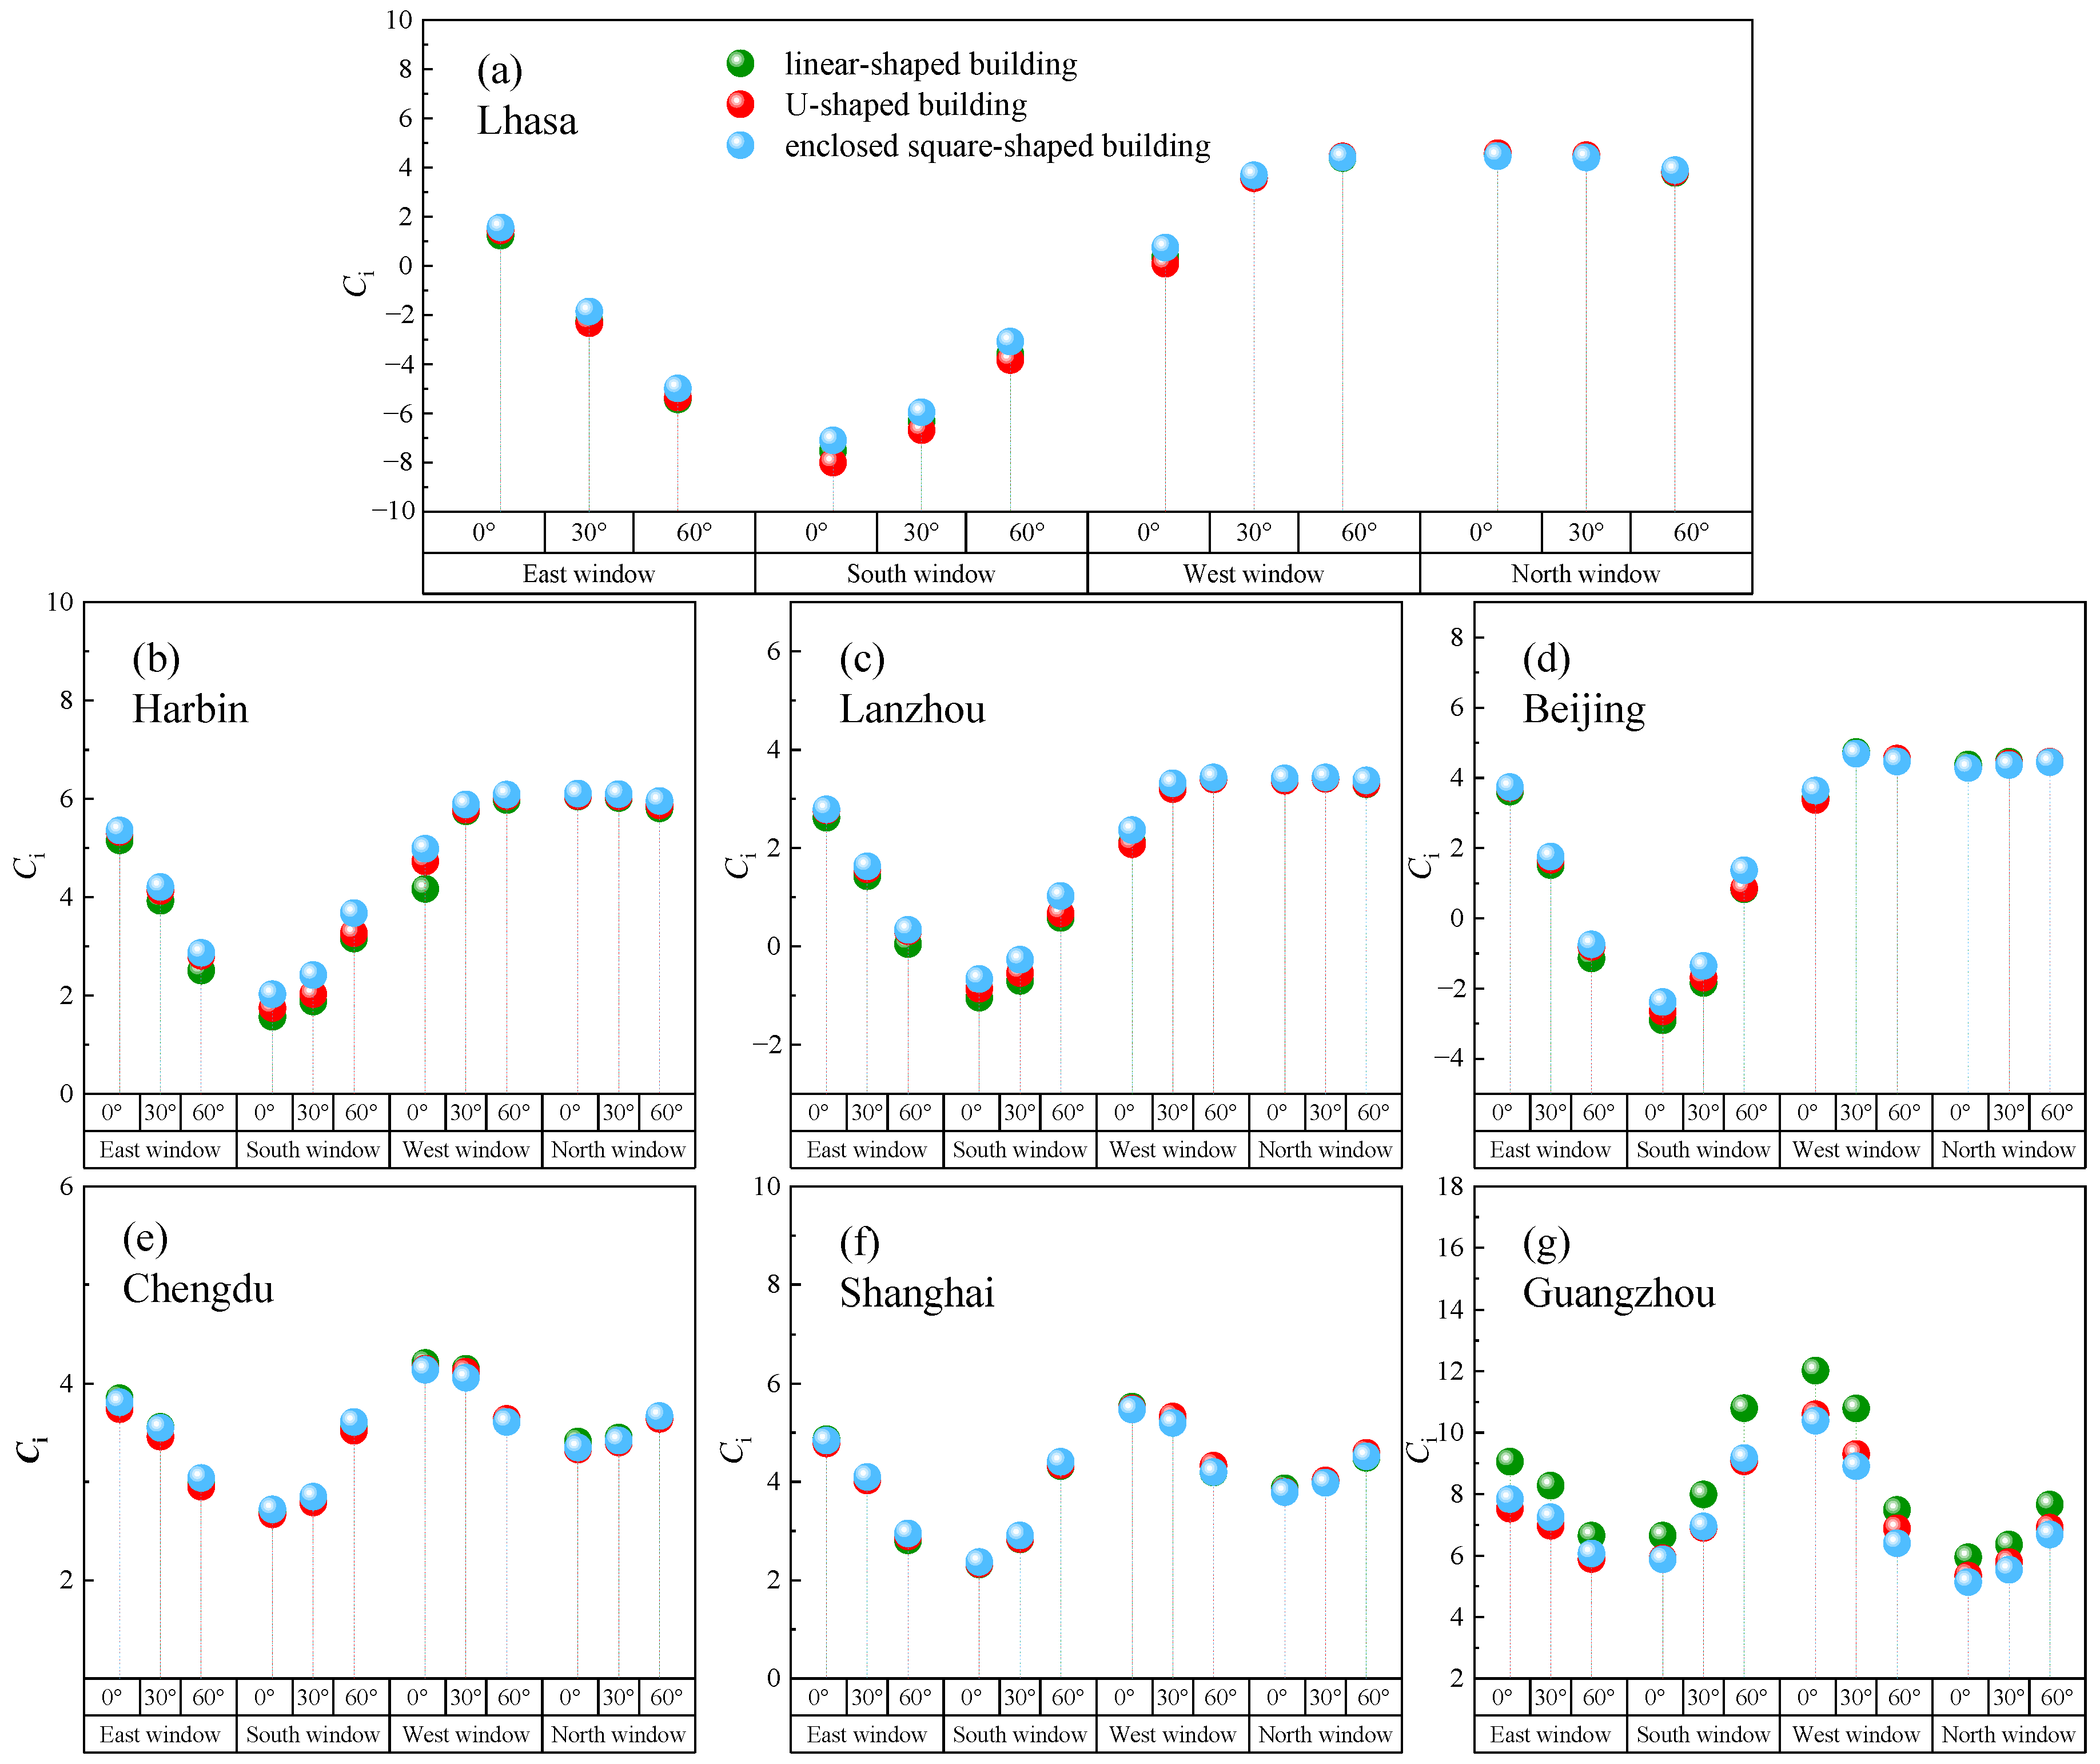
Figure 11 shows the variation in the equivalent coefficient of transparent envelopes on different facades for the three six-story building types under rotation angles of 0°, 30°, and 60° across various cities. Due to differences in geographical and climatic conditions, the
Ci values for the windows on various facades of linear-shaped, U-shaped, and courtyard-shaped buildings exhibit the same tendency with minimal differences during the rotation.
3.5. Quick Reference of Ci Values
Based on the above analysis above, it can be concluded that climatic conditions and building orientations are the primary factors leading to differences in the equivalent coefficient of transparent envelopes. To facilitate the effective application of these parameters in design, the
Ci values of are summarized in
Table 4 for typical linear-shaped buildings.
3.6. Verification of the Accuracy of E
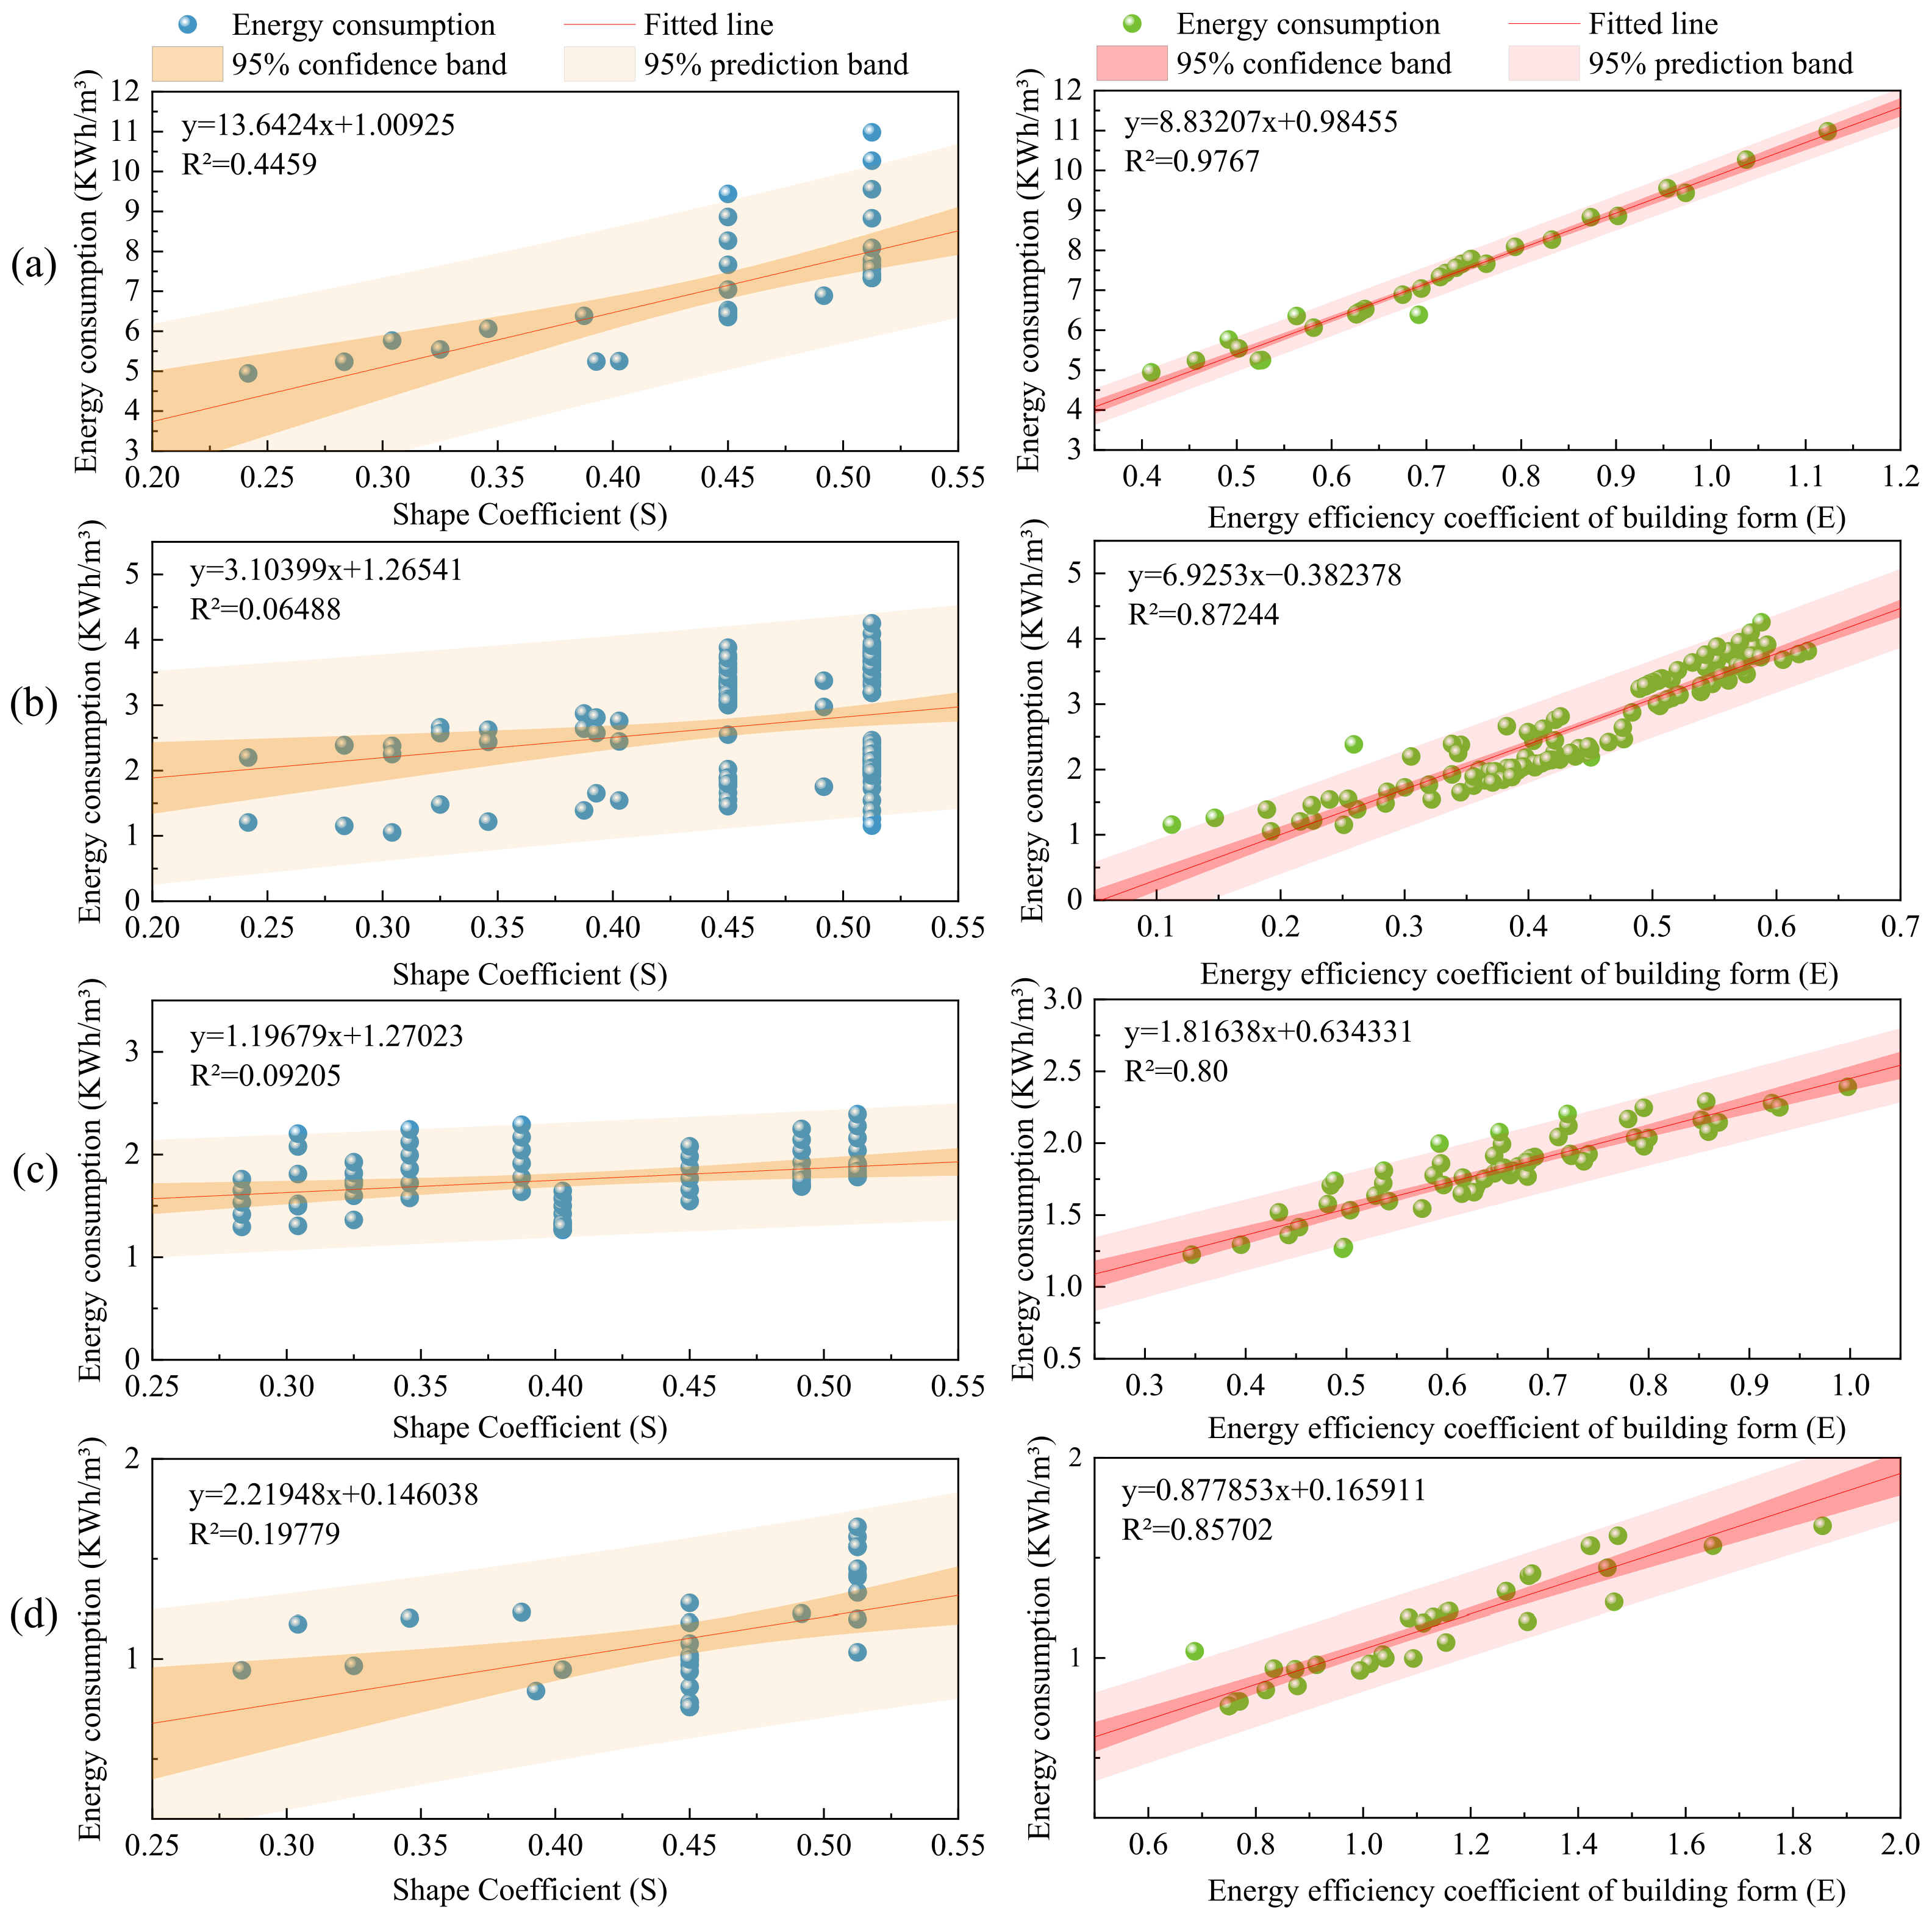
For the studied cases, energy consumption data of each building model is obtained based on 756 numerical simulations using the EnergyPlus 8.9.0 software. In addition, the S and E for each building model are calculated. To validate the correlation between S and building energy consumption, as well as the correlation between E and building energy consumption in different cities, fitting analyses of these two coefficients against the energy consumption data of the building models for each city are further carried out, denoted by coefficient of determination (R2).
Figure 12 presents the correlation between
S and building energy consumption, as well as the correlation between
E and building energy consumption in different cities. It results show that in all the studied cities, the correlation between
E and energy consumption is consistently stronger than that of
S and energy consumption. In Harbin, which is located in a severe cold zone, the coefficient of determination
R2 between
S and energy consumption is 0.4459, while
R2 between
E and energy consumption is 0.9767. In cold zones, such as Lhasa, Lanzhou, and Beijing, the value of
R2 between
S and energy consumption is 0.0649, while
R2 between
E and energy consumption is up to 0.8724. In Chengdu, Shanghai and Guangzhou,
R2 between
E and energy consumption is always higher than 0.8. These findings demonstrate that the
E is a more accurate indicator than the
S for evaluating building energy consumption. Moreover, the applicability of the building shape energy-saving coefficient across the different studied cities is validated.
3.7. E-Based Building Design Optimization
To demonstrate the practical applicability of the
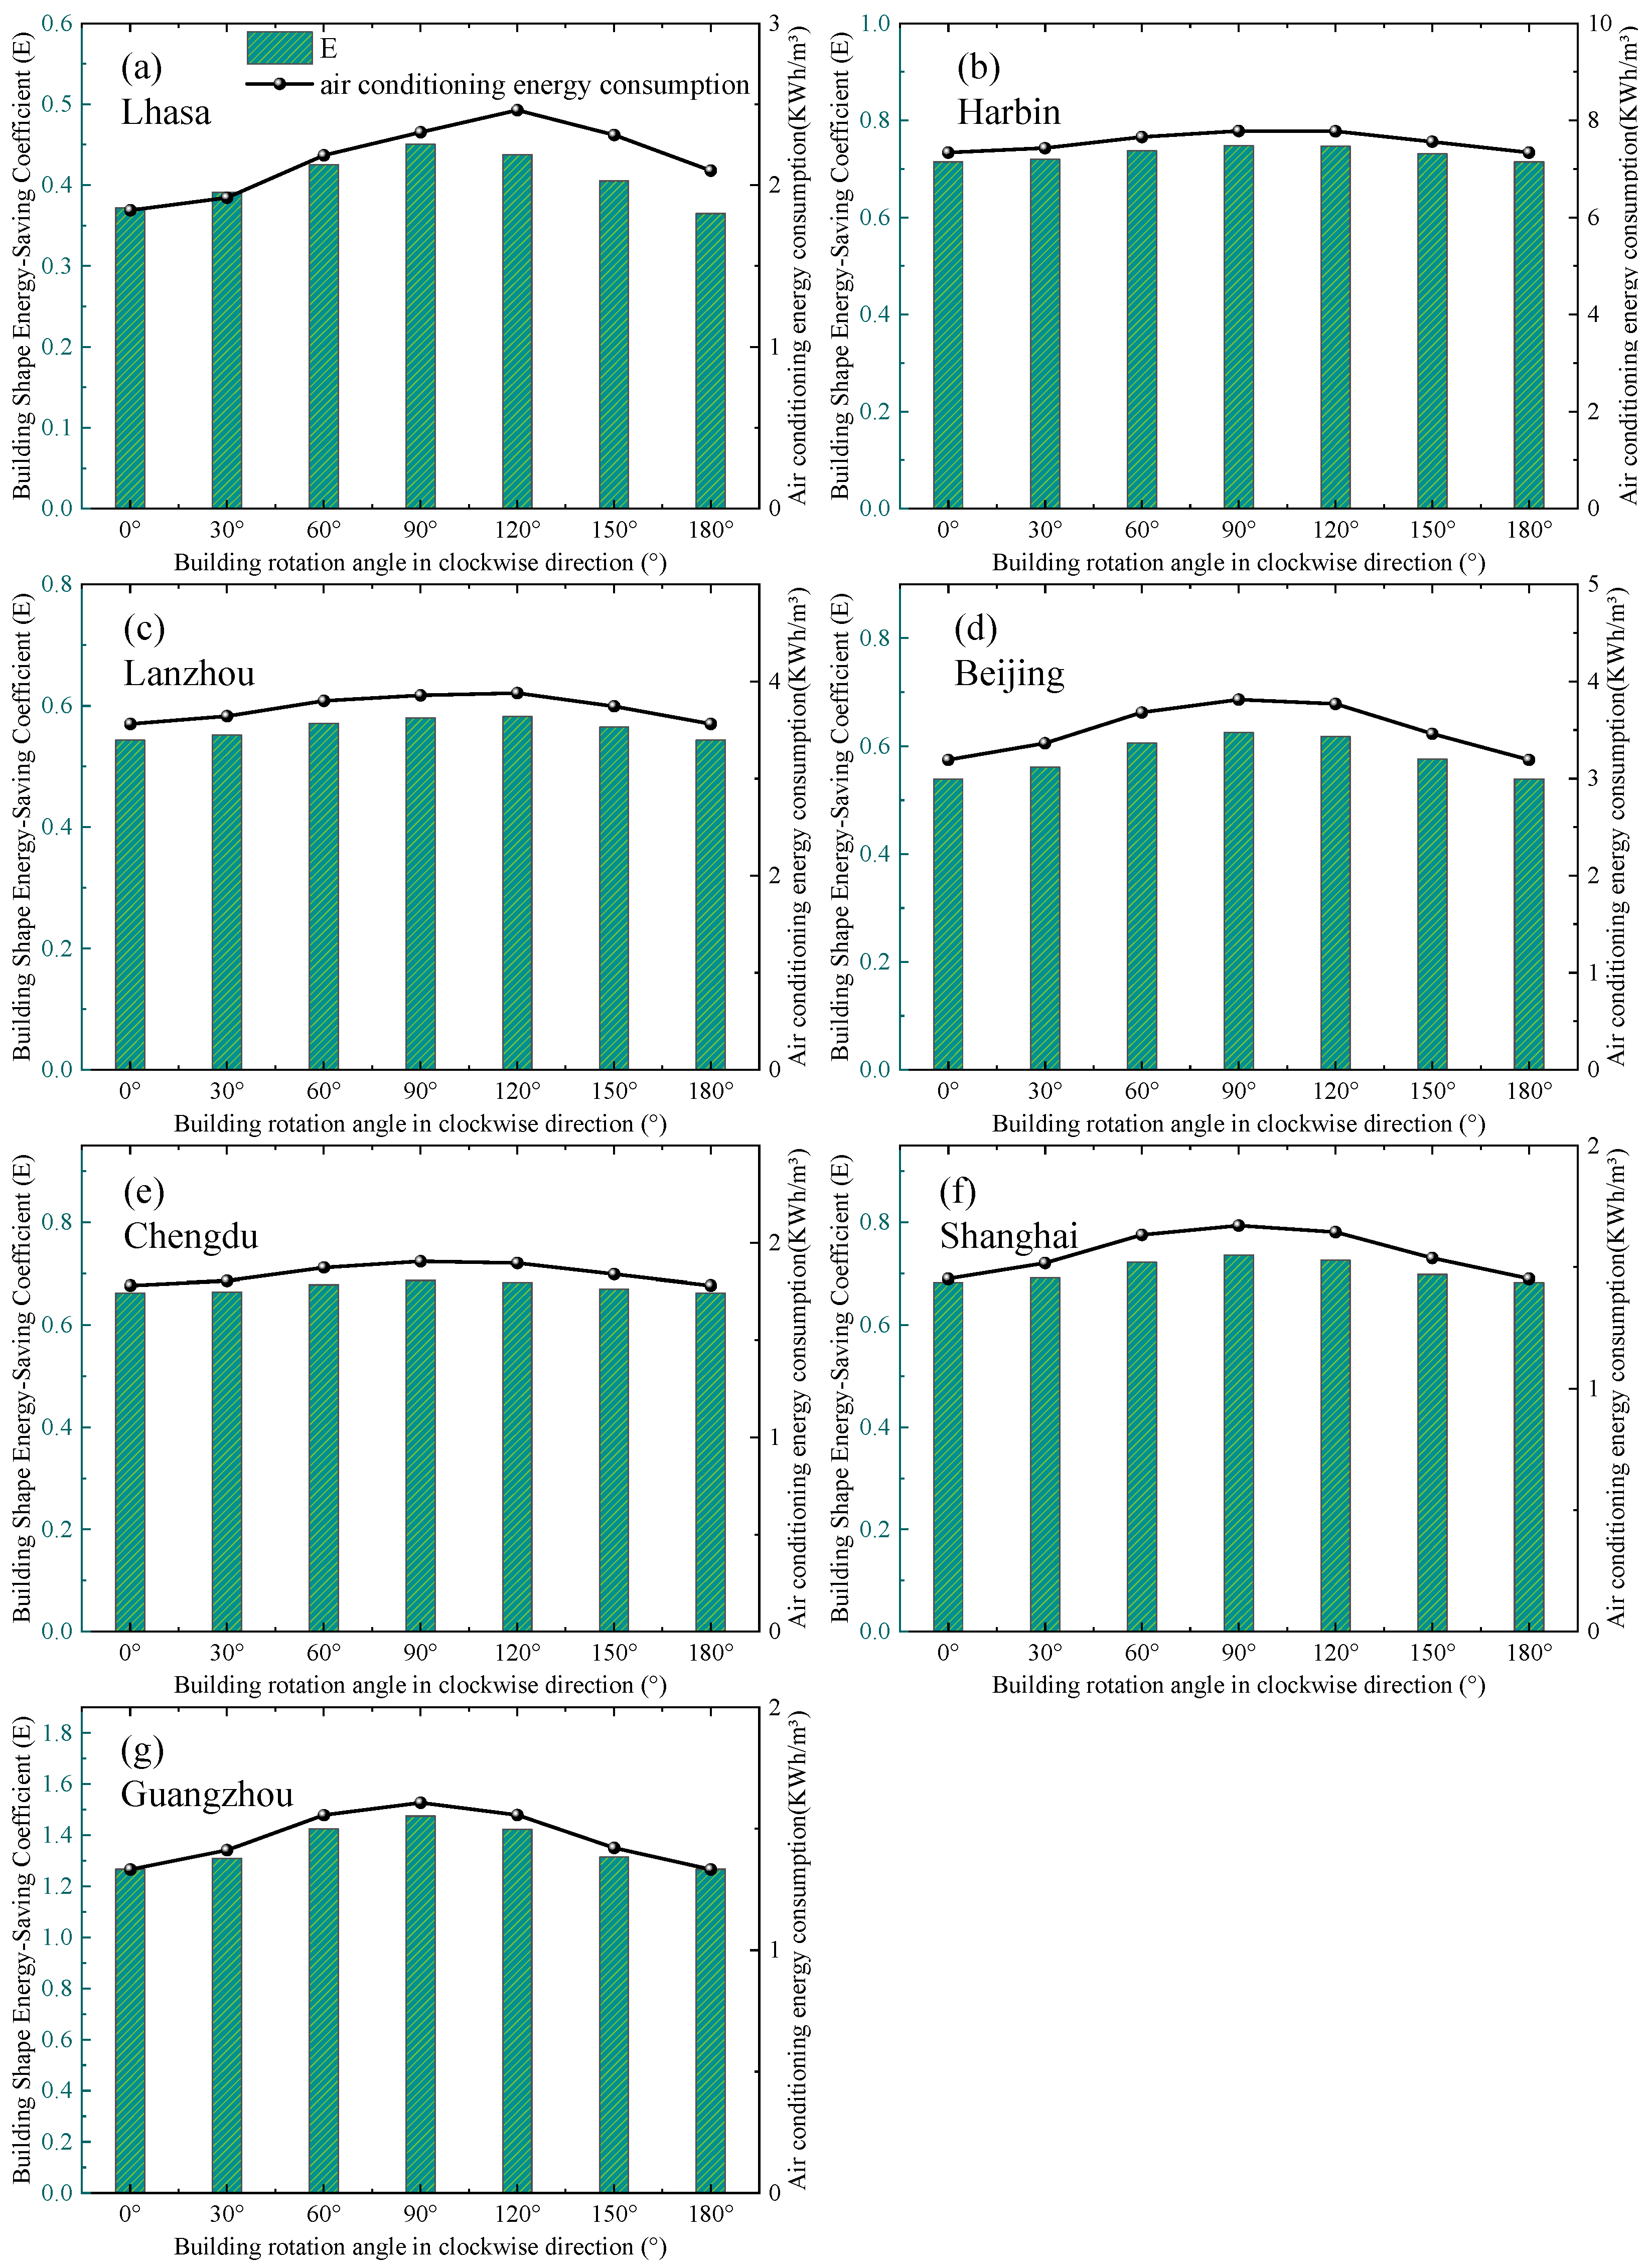
E value in building design, this study takes building orientation optimization as an example for analysis. A linear building with a south-facing window-to-wall ratio of 0.35 and WWR of 0.25 on the other three facades was simulated under different orientations, and the results are shown in
Figure 13. As the building orientation rotates from due south (0°) to due north (180°), both the
E value and the annual building air conditioning energy consumption first increase and then decrease. When the building is oriented due south (0°), both the
E value and the annual cooling and heating energy consumption reach their minimum values, indicating that a south-facing orientation is preferable in building design to maximize the utilization of solar energy resources.
In
Figure 13, the building shape coefficient remains constant across the 49 simulation cases, whereas the annual air conditioning energy consumption varies consistently with changes in the building shape energy-saving coefficient. The two exhibit highly similar trends, further confirming that the
E value has a stronger correlation with building air conditioning energy consumption than the traditional shape coefficient.
3.8. Discussion
3.8.1. Limitations of the Study
This study investigates the influence of climate, orientation, and window-to-wall ratio on the Ci coefficient using numerical simulation and provides Ci values for different orientations in typical cities, offering reference for optimized building form design. However, due to certain constraints, several limitations remain and should be addressed in future work:
This study considers only three typical building configurations, namely linear, U-shaped, and enclosed courtyard forms, without including circular or other irregular and more complex geometries. In addition, only one set of envelope parameter combinations was used for each city, and the influence of variations in envelope parameters on the Ci value was not systematically examined. Therefore, the findings have certain limitations in general applicability, and future research should expand both building types and parameter ranges to improve the robustness and universality of the conclusions.
The simulation models adopted in this study assume a single-zone internal space and do not account for internal space subdivision, functional differences, or orientation-dependent variations among zones. Moreover, the seasonal performance coefficient of the air conditioning system was represented by a single overall value without zoning-based differentiation. These simplifications may introduce deviations in the simulation results.
Different building functions typically have different HVAC operating schedules; for example, office buildings usually operate during daytime hours only, whereas hotels require continuous 24 h operation. In this study, all simulation cases assume a uniform 24 h HVAC operation schedule, without considering alternative operating patterns. Future work will further investigate the impact of different HVAC operation schedules on the results.
3.8.2. Influence of E on Building Cost
Under the condition that the building location is fixed, the proposed E indicator primarily influences construction cost through two factors: building shape and window-to-wall ratio. When building volume, Ci, and WWR remain constant, a larger external surface area in direct contact with outdoor air leads to a higher E value. In this case, the total envelope area increases accordingly, resulting in higher construction costs. When the total envelope area is fixed, the impact of WWR on construction cost is mainly reflected in two aspects. On the one hand, the unit cost of transparent envelope components is generally higher than that of opaque ones; therefore, a higher WWR increases the overall cost of the building envelope. On the other hand, an increased WWR leads to higher solar heat gains during daytime in the cooling season and greater heat losses at night during the heating season, which in turn increases the required capacity of the heating and cooling systems, thereby raising initial investment costs.



 ,
,