Article

From Physical Risk to Psychological Perception: A Street-View Semantic Segmentation and GIS-Based Study of Micro-Scale Built Environment and Emotional Responses to Urban Pluvial Flooding

1
School of Sculpture and Public Art, Hubei Institute of Fine Arts, Wuhan 430204, China
2
The Faculty of Innovation and Design, City University of Macau, Macau 999078, China
3
School of Arts and Creative Industries, Coventry University, Priory Street, Coventry CV1 5FB, UK
4
Department of Civil Engineering, Chienkuo Technology University, Changhua City 500020, Taiwan
*
Authors to whom correspondence should be addressed.
Buildings 2026, 16(11), 2205; https://doi.org/10.3390/buildings16112205
Submission received: 14 April 2026 / Revised: 23 May 2026 / Accepted: 26 May 2026 / Published: 30 May 2026

Abstract

With increasingly frequent extreme rainfall and high-density urban development, urban pluvial flooding has become a major challenge to public safety in coastal built-up areas. Existing studies have mainly focused on hydrological and engineering factors such as rainfall, drainage, and topography, while paying limited attention to the heterogeneity of the micro-scale built environment around flood-risk sites and its statistical associations with residents’ average psychological responses. Taking 78 flood-risk buffers in the inland built-up area of Zhuhai as the study area, this study develops an integrated framework combining street-view semantic segmentation, topographic indicator extraction, entropy weighting, cluster analysis, questionnaire surveys, and multiple linear regression. Based on 2351 street-view sampling points, 9404 street-view images, and 9508 valid questionnaires, eight environmental indicators were extracted and aggregated to the buffer level to examine their statistical associations with average perceived emotional stress and negative anxiety. The results identify five typical micro-risk scenarios and show that water exposure, barrier proxy, and building enclosure are the most discriminative variables. Regression analysis further indicates that buffers with higher water exposure, barrier proxy, and building enclosure tend to report higher average perceived emotional stress and negative anxiety, whereas buffers with higher green view index tend to report lower average psychological burden. These findings suggest that urban pluvial flooding is not only a hydrological-engineering issue, but also a compound urban risk that is visualized, spatialized, and contextualized at the street-view scale. This study contributes by shifting flood research from flood-generating factors to buffer-level risk scenarios and physical–psychological association patterns, offering a replicable framework for integrating street-view, GIS, and social perception data.

1. Introduction

Under the combined influence of global climate change and rapid urbanization, the frequency and intensity of extreme rainfall events have increased significantly. As a result, urban pluvial flooding has become one of the major hazards threatening public safety in high-density coastal cities [1]. Traditional urban flood management has long been dominated by a hydraulic engineering perspective, with primary emphasis placed on solving the physical problem of runoff discharge through drainage network upgrades and pumping station construction [2]. However, this gray infrastructure-oriented approach often overlooks the role of micro-scale spatial settings during flood events, particularly how built environment characteristics influence the hazard exposure and vulnerability of residents who are directly affected by flooding [3]. In recent years, increasing attention has been given to shifting from purely engineering-based flood control toward a more inclusive resilient city framework, which emphasizes the integration of human-centered adaptive strategies into physical spatial planning [4].
With the rapid development of computer vision techniques and multi-source urban big data, street view imagery (SVI) has become an important tool for quantifying micro-scale built environment characteristics in cities [5]. Unlike conventional satellite remote sensing images, which are based on an overhead perspective, street view data provide a unique human-eye-level perspective and enable the precise extraction of visual indicators directly related to human perception, such as the Green View Index (GVI), Sky View Factor (SVF), and building enclosure [6]. Existing studies have shown that these visual environmental characteristics not only affect the physical urban microclimate but are also significantly associated with residents’ mental health, stress perception, and emotional states [7,8]. This development offers a new perspective for re-examining urban pluvial flooding. In this context, urban pluvial flooding should be understood not only as a hydrological process, but also as a psychologically stressful setting characterized by specific visual and spatial features.
However, existing assessments of urban pluvial flooding risk are largely based on classifications derived from historical inundation depth, hazard-inducing factors, or the proportion of impervious surfaces [9], while paying limited attention to the spatial environmental heterogeneity of the flooding sites themselves. Even among high-risk flood-prone locations, a site situated on a steep slope enclosed by high-density buildings differs substantially from one located along an open and flat arterial road in terms of both risk attributes and the environmental stress imposed on residents. The absence of an integrated classification perspective that combines visual characteristics derived from street view imagery (SVI) with topographic features limits a more comprehensive understanding of the diversity of flood disaster settings. Moreover, without such refined classification, existing studies have difficulty revealing the spatial distribution patterns of different types of flood-prone sites within urban areas. It remains unclear whether these risk sites exhibit clustered or dispersed patterns in geographic space, and what kinds of statistical regularities characterize their environmental variables. The lack of such fundamental knowledge makes it difficult to develop and implement targeted spatial intervention strategies.
Based on the above research gaps, this study aims to establish an integrated analytical framework linking objective environmental characteristics with subjective psychological perception by combining street view imagery, geospatial information, and social perception data. The specific objectives are as follows:
(1) To integrate street view-based visual indicators with terrain and topographic indicators and apply K-means clustering to urban pluvial flooding risk sites in order to identify categories of risk locations with representative spatial environmental characteristics.
(2) To employ descriptive statistics and spatial analysis methods to reveal the distribution patterns of eight environmental variables and the spatial clustering characteristics associated with different types of risk sites.
(3) To construct a multiple linear regression (MLR) model using residents’ perceived emotional stress and negative anxiety index under typhoon-related entrapment conditions as the dependent variables, and the eight buffer-level environmental indicators as the independent variables, so as to estimate the statistical associations between landscape environmental characteristics and buffer-level average negative psychological responses.
This study selects Zhuhai, a representative high-density coastal city in China, specifically its inland urban area, as the empirical research setting. Following the logical sequence of objective environmental quantification, spatial typology classification, and subjective psychological mapping, this study is organized into three interrelated stages. First, environmental feature extraction: by integrating computer vision-based street view imagery (SVI) semantic segmentation with GIS-based topographic analysis, we quantitatively construct a micro-scale built environment dataset for urban pluvial flooding sites. Second, risk scenario identification: rather than relying on traditional hydrological parameters, we classify these flood-prone locations into representative spatial typologies to map the diverse spectrum of micro-environmental risk settings. Third, psychological association modeling: drawing on large-scale social survey data, we evaluate the statistical relationships between the extracted physical environmental cues and residents’ average disaster-related emotional responses (e.g., perceived stress and anxiety). Through this integrated framework, the study bridges the gap between physical space constraints and human-centered disaster perception.
In summary, this study moves beyond the conventional hydraulic engineering perspective, which primarily focuses on inundation depth or hazard-inducing factors, and innovatively develops a classification framework for urban pluvial flooding sites based on the combined attributes of human-eye-level street view characteristics and topographic conditions. This classification perspective fills an important gap in disaster management research concerning the heterogeneity of micro-scale spatial settings and provides a more human-centered theoretical lens for understanding urban pluvial flooding. In addition, this study extends the stimulus-response framework of environmental psychology to extreme disaster contexts and, for the first time, quantitatively demonstrates that the micro-scale built-environment characteristics of flooding sites are important environmental correlates of buffer-level disaster-related anxiety. This finding establishes a link between objective physical space and subjective disaster perception, thereby enriching the interdisciplinary scholarship at the intersection of disaster psychology and urban geography. From a practical perspective, the findings not only identify the physical risks associated with different flooding sites in Zhuhai but also reveal which types of areas are more likely to be associated with higher average psychological burden among residents. This provides new evidence for government agencies in developing emergency management strategies and helps prioritize communities with higher levels of psychological vulnerability, thereby supporting more precise and human-centered urban governance.

2. Literature Review

2.1. Linking Mechanisms Between Micro-Scale Built Environment Characteristics and Urban Pluvial Flood Risk

The formation of urban pluvial flood risk is determined not only by macro-level rainfall intensity and hydrological conditions but also by micro-scale built environment characteristics. Early studies on urban flooding were largely conducted at the watershed or catchment scale and primarily focused on the effects of impervious surface percentage on surface runoff [10]. However, with the development of resilience-oriented urban theory, increasing attention has been paid to the role of more fine-grained spatial morphological elements in shaping flood hazards. Topographic features have been identified as fundamental variables influencing the spatial distribution of urban pluvial flooding. Chen et al. [11] showed that local slope and terrain depression directly determine flow concentration pathways and inundation depth. In coastal cities where mountainous and plain landscapes coexist, the heterogeneity of topographic conditions is particularly pronounced, with steep-slope areas more likely to generate rapid overland flow, whereas low-lying areas tend to produce a basin effect [12]. In addition to topography, street spatial form is also a key factor contributing to flood risk. A high degree of building enclosure and a narrow street height-to-width (H/W) ratio can alter micro-scale wind conditions and rainwater deposition pathways, while also restricting the space available for drainage infrastructure. In their review, Wang et al. [13] emphasized that conventional two-dimensional plan-based indicators, such as building density, are no longer sufficient to explain the complex mechanisms underlying urban pluvial flooding, and that three-dimensional spatial indicators are urgently needed to quantify the physical constraints imposed by street canyons on flood processes. However, most existing studies still treat the built environment primarily as a set of physical variables, with limited efforts to systematically classify flood-prone sites from a human-eye-level perspective.
Recent studies on urban flood resilience have increasingly shifted attention from isolated hydrological variables to the structural role of urban morphology. Balaian et al. proposed a mean-flow theory that relates flood hazards to urban form, showing that flood depth and intensity are associated with ground slope, urban porosity, and the spatial order of building arrangements [14]. Similarly, Mei et al. used numerical experiments based on actual urban form data to examine how the spatial pattern of buildings and roads affects pluvial flood inundation, indicating that urban form is not a passive background condition but an active factor shaping surface flow processes [15]. A recent systematic review by Mabrouk et al. further emphasized that urban form indicators should be understood across multiple spatial scales, from streets and neighborhoods to the city level, because building configuration, street networks, surface structure, and open-space systems jointly affect flood exposure, runoff conveyance, retention capacity, and accessibility under flood conditions [16]. These studies suggest that urban pluvial flooding should be understood not only as a hydrological phenomenon but also as a spatial process mediated by urban morphology.
This theoretical shift provides the basis for the indicator selection in the present study. Specifically, slope and local depression represent topographic morphology and indicate the terrain conditions that influence runoff direction, flow concentration, and water-retention potential. Impervious visual exposure reflects the degree of surface sealing and the lack of permeable or absorbent surfaces, which are directly related to runoff generation and the design logic of Sustainable Drainage Systems. Building enclosure and sky visibility represent the vertical morphology of the street canyon: the former captures the visual compression produced by continuous built edges, whereas the latter reflects pedestrian-level openness and relief from enclosure. Barrier proxy corresponds to local spatial obstruction, reduced movement permeability, and weakened evacuation legibility, which are especially relevant when rainstorm-induced waterlogging constrains mobility. Green view index and water exposure further describe visible green–blue interfaces, linking hydrological adaptation potential with perceived place quality. Therefore, the eight indicators used in this study are not selected merely because they can be extracted through semantic segmentation or GIS; rather, they are operational proxies for urban morphology, surface permeability, street-canyon structure, visual openness, movement permeability, and green–blue environmental interfaces in flood-prone street settings.
From a multi-scale planning perspective, these indicators should be interpreted as part of a nested spatial structure. At the street level, visual cues such as enclosure, impervious paving, greenery, sky visibility, obstruction, and visible water shape residents’ immediate perception of flood-prone environments. At the neighborhood level, these street-level cues are aggregated within the 800 m buffer to represent the everyday exposure context in which residents may move, reroute, wait, or become temporarily stranded during rainstorm-induced waterlogging. At the city level, the spatial distribution of these buffers reflects how different micro-risk scenarios are embedded within broader urban structures, including transportation corridors, low-lying zones, and high-density built-up districts. Therefore, the present study uses the 800 m buffer as an intermediate analytical scale linking micro-scale street perception with neighborhood-level exposure and city-level risk prioritization, rather than as a substitute for a full multi-scale urban planning model.

2.2. Advances in the Application of Street View Imagery (SVI) for Quantifying Urban Perception

Traditional measurements of the urban environment have mainly relied on remote sensing and GIS data. Although this bird’s-eye view approach can cover large spatial areas, it is often unable to capture vertical ground-level features or reflect people’s actual visual experience. As an emerging form of urban big data, street view imagery (SVI), combined with deep learning and semantic segmentation techniques, provides a transformative tool for quantifying micro-scale environments from a human-scale perspective [17]. Among existing SVI-based studies, the Green View Index (GVI) and Sky View Factor (SVF) are the most widely used indicators. Rui and Cheng [18] developed an SVI-based evaluation framework for street visual quality and demonstrated that street greenery and openness significantly influence street vitality and walkability. In addition, Ma et al. [19] used street view data to quantify street enclosure and building interface characteristics, and further examined their roles in shaping the urban microclimate and heat island effects. Although SVI has generated substantial findings in urban design, health geography, and transport planning, its application in disaster management remains at an early stage. Current SVI-based disaster studies have mainly focused on post-disaster damage assessment, such as the identification of collapsed buildings, while relatively limited attention has been given to the pre-disaster profiling and classification of the environmental characteristics of urban pluvial flooding risk points. Defining flood-related spatial settings through visual features extracted from SVI offers an important means of compensating for the limited ability of conventional hydrological models to capture micro-scale spatial characteristics.
More importantly, SVI provides a methodological bridge between computer-vision measurement and theories of urban morphology, place quality, and spatial structure. Recent SVI-based urban studies have increasingly used pedestrian-level visual indicators to evaluate spatial quality, visual openness, enclosure, greenery, and human-scale environmental experience. For example, street-view-based visual greenery and bluespace indicators have been shown to capture environmental exposures that are closer to residents’ daily visual experience than overhead remote-sensing measures [20]. Recent systematic evidence also suggests that visible greenery and bluespace measured through SVI are associated with mental health and well-being outcomes, highlighting the importance of eye-level environmental perception [21]. In addition, studies on walkability and flood-resilient public spaces have emphasized that connectivity, accessibility, spatial continuity, and climate adaptability are jointly shaped by the morphological characteristics of the built environment [22]. Therefore, SVI-based indicators can be interpreted not only as visual proportions, but also as measurable representations of how residents encounter urban space at the street level.
In this study, this theoretical perspective is used to reinterpret the extracted indicators. The Green View Index represents visible restorative and ecological qualities; impervious visual exposure represents the dominance of hard-surfaced urban fabric; building enclosure reflects street-edge continuity and canyon-like spatial compression; sky visibility indicates visual openness; barrier proxy captures local obstruction and reduced spatial permeability; and water exposure represents visible blue interfaces and potential hazard cues. In this way, the SVI-derived indicators provide a human-eye-level representation of urban form and place quality, thereby helping to move the study beyond a purely technical metric-based analysis.

2.3. Public Risk Perception and Emotional Responses Under Extreme Climate Conditions

Classical theories in environmental psychology suggest that physical environmental characteristics serve as important stimuli shaping individual emotions and behaviors. Under extreme climate events, public risk perception and negative emotional responses, such as anxiety and panic, are determined not only by the intensity of the disaster itself, but also by the characteristics of the immediate environment in which individuals are situated. In recent years, disaster-related emotion research based on social sensing and social media big data has attracted growing attention. Karmegam and Mappillairaju [23] analyzed Twitter data during typhoon events and mapped the spatiotemporal distribution of public panic, finding that emotional hotspots often highly overlapped with areas severely affected by urban flooding. Du et al. [24] further showed that urban emotional resilience exhibits significant spatial heterogeneity, as different communities vary in the magnitude of collective emotional fluctuation when confronted with heavy rainfall. However, a clear “black box” remains in the existing literature. While it is well established that urban flooding can trigger negative emotions, it is still unclear which specific environmental cues actually evoke such responses. For example, are these emotions induced by excessively narrow and enclosed streets, or by the absence of the buffering effect provided by street greenery? Previous studies in non-disaster contexts have confirmed that green spaces can significantly alleviate depressive emotions. Yet under high-stress conditions such as being trapped during a typhoon, the mapping mechanism between environmental characteristics and psychological perception still lacks sufficient empirical evidence. This is precisely the key gap that the present study seeks to address through the integrated analysis of large-scale questionnaire data and street view imagery (SVI).

2.4. Blue—Green Infrastructure, SuDS, and Climate-Responsive Urban Design for Pluvial Flood Adaptation

Blue—green infrastructure and Sustainable Drainage Systems (SuDS) have become important planning and design approaches for urban pluvial flood adaptation. Unlike conventional gray infrastructure, which mainly depends on drainage pipes, pumping stations, and rapid runoff discharge, blue–green infrastructure emphasizes the integration of vegetation, open water systems, permeable surfaces, and multifunctional public spaces into the urban fabric. SuDS similarly aim to manage stormwater closer to its source by promoting infiltration, retention, detention, evapotranspiration, and delayed runoff release [25,26]. Typical measures include permeable pavements, rain gardens, bioswales, vegetated swales, sunken green spaces, retention ponds, green roofs, tree pits, and curbside infiltration strips. These approaches have been widely discussed as alternatives or complements to conventional drainage systems, particularly in the context of climate change, urbanization, and increasing extreme rainfall events [26,27].
These approaches are particularly relevant to high-density built-up areas because they do not treat flood control as a purely engineering problem, but as a spatial design and environmental performance issue. By increasing surface permeability, expanding local storage capacity, and slowing runoff concentration, blue–green infrastructure and SuDS can reduce the burden on drainage systems during extreme rainfall events [28]. At the same time, these interventions can generate multiple co-benefits, including improved thermal comfort, visual quality, ecological connectivity, biodiversity, and residents’ sense of environmental safety [29]. Urban trees and vegetated spaces, for example, can contribute to stormwater management through canopy interception, evapotranspiration, and enhanced infiltration capacity [30]. Therefore, climate-responsive urban design is not only concerned with reducing hydrological risk, but also with creating urban spaces that are physically adaptive and psychologically reassuring under extreme weather conditions.
However, existing studies on blue–green infrastructure and SuDS have mainly focused on hydrological efficiency, runoff reduction, water quality improvement, or ecological performance [25,26,27]. Less attention has been paid to how these interventions correspond to human-eye-level environmental cues that residents directly perceive in flood-prone streets. For example, permeable surfaces, visible greenery, open street nodes, and unobstructed evacuation routes may not only improve stormwater performance but also reduce residents’ perceived risk, spatial oppression, and anxiety during rainstorm-induced waterlogging. This perceptual dimension is important because street-view imagery has been increasingly used to quantify pedestrian-level urban environmental qualities, including visible greenery, openness, enclosure, and other visual indicators that are difficult to capture through conventional overhead remote sensing [20,31]. Recent systematic evidence also suggests that visible greenery and bluespace measured through street-view imagery are associated with mental health and well-being outcomes, indicating the value of linking visual environmental exposure with psychological perception [21].
Accordingly, the present study does not position street-view semantic segmentation merely as a technical tool for environmental measurement. Rather, it uses visual indicators such as green view index, impervious surface exposure, building enclosure, barrier proxy, and water exposure to establish a bridge between micro-scale flood-risk diagnosis and climate-responsive planning strategies. In this way, the study links the literature on urban pluvial flooding, environmental perception, and blue–green/SuDS-based design, and provides a basis for translating quantitative environmental indicators into scenario-specific planning implications.

3. Materials and Methods

This study develops a reproducible quantitative framework coupling objective environmental characteristics with subjective psychological perceptions across 78 urban pluvial flooding risk buffers in Zhuhai. As illustrated in the procedural workflow (Figure 1), the analysis integrates multi-source data—including 2351 street-view sampling points, high-resolution GIS/DEM datasets, and 9508 valid survey responses—to extract key micro-environmental indicators. Subsequent analyses employ entropy-weighted K-means clustering to identify typical risk scenarios, and multiple linear regression (MLR) to estimate their statistical associations with residents’ buffer-level average psychological responses.

3.1. Study Area and Analytical Units

This study focuses on the inland built-up area of Zhuhai, a high-density coastal city in China characterized by complex topography and frequent extreme rainfall. These features create highly heterogeneous urban pluvial flooding risks, making Zhuhai an ideal setting for micro-scale environmental research. Based on official waterlogging records, 78 valid flood-risk sites were identified as spatial anchors. To convert these points into comparable neighborhood-scale analytical units, an 800 m circular buffer was established around each site (N = 78). This radius was selected as a practical intermediate exposure unit: it captures the local street network where residents are most likely to navigate, reroute, or be stranded during storms, while ensuring that micro-scale street-view and topographic features can be rigorously aligned with the spatial attribution of psychological survey data [32]. Through this nested spatial structure, objective GIS and SVI indicators extracted at the micro-point level were aggregated to the 78 buffers, producing a unified dataset that seamlessly links physical street-level environments with buffer-level psychological perceptions for subsequent modeling. In the present analytical framework, street-view sampling points represent the micro street level, the 800 m buffer represents the local living and exposure context around each officially identified waterlogging site, and the spatial distribution of the 78 buffers represents the city-level pattern of risk scenarios across Zhuhai’s built-up area. This nested structure allows the study to connect micro-scale visual and topographic indicators with buffer-level psychological perception while still recognizing that broader urban planning variables, such as street-network structure, land-use distribution, and accessibility, operate at larger spatial scales.

3.2. Multi-Source Data and Preprocessing

In this study, street view imagery (SVI) was collected at sampling micro-points generated along the road network. At each point, four-directional or panoramic images were retrieved to minimize perspective bias and preprocessed to extract visual indicators. Concurrently, topographic variables (e.g., slope) were derived from high-resolution DEM data within a standardized GIS environment. To align these multi-source datasets across the 78 risk-site buffers, a same-scale spatial aggregation strategy was adopted. All point-level SVI features and raster-level GIS variables were aggregated to the buffer level using appropriate descriptive statistics (e.g., mean, median, or area-weighted mean) based on their physical definitions. This procedure effectively mapped the localized street-view and topographic information onto unified analytical units.

3.3. Definition and Quantification of Environmental Indicators

At the micro-scale, urban pluvial flooding is fundamentally shaped by three mechanistic pathways: surface impermeabilization [33], spatial configuration, and topography. To operationalize these mechanisms, this study adopts a dual-channel quantification strategy that integrates a pedestrian-level perspective via street view imagery (SVI) with macro-scale topographic constraints derived from DEM and GIS data. This combined approach yields eight objective environmental variables, capturing both the physical constraints of local flow convergence and the immediate visual cues experienced by residents during extreme rainfall. The specific definitions, theoretical rationales, and calculation methodologies for all eight indicators are comprehensively outlined in Table 1 and Table 2. Among the SVI-derived variables, two require conceptual clarification as they serve as perceptual proxies: Barrier Proxy (BP) captures physical elements (e.g., fences, railings) that create visual and movement obstruction, representing perceived spatial entrapment. Conversely, Water Exposure (WE) measures the visible presence of open water to serve as a direct visual hazard cue, rather than an assessment of real-time inundation depth.
It should be noted that the indicator system developed in this study is not intended to be a comprehensive urban planning index system. Variables such as street-network connectivity, land-use mix, functional intensity, and accessibility to emergency facilities are important for multi-scale planning and evacuation studies. However, they were not included as primary indicators in this study because the central aim is to examine the relationship between directly perceptible micro-environmental cues and buffer-level psychological responses under urban pluvial flooding conditions. The selected indicators therefore focus on two dimensions: first, human-eye-level visual cues extracted from SVI, including greenery, hard paving, enclosure, openness, obstruction, and visible water; and second, terrain-related constraints extracted from DEM/GIS data, including slope and local depression. This bounded indicator system is consistent with previous street-view-based flood vulnerability and urban perception studies, in which the analytical focus is placed on visible street-level features rather than on a complete representation of all urban planning variables.
As shown in Table 1, the selected indicators are not merely technical outputs of semantic segmentation or DEM analysis. Instead, they correspond to different theoretical dimensions of flood-prone urban space, including topographic morphology, surface permeability, street-canyon structure, visual openness, movement permeability, and green–blue place quality. This indicator system therefore provides a theoretically grounded bridge between urban morphology, human-eye-level perception, and pluvial flood adaptation. As shown in Table 2, the eight micro-environmental indicators used in this study consist of six proportions of visible elements derived from street view imagery (SVI) and two terrain-constrained indicators derived from DEM data, corresponding to the three flood-generating mechanistic pathways discussed above. Indicators centered on the exposure of hard underlying surfaces primarily capture the increase in runoff generation and amplification of peak discharge caused by surface impermeabilization, a mechanism that has been widely confirmed in hydrological studies to be significantly associated with urban pluvial flooding. Indicators represented by building enclosure and street interface characteristics are used to characterize how urban form guides and obstructs surface runoff pathways. Existing studies have shown that building configuration and street spatial form can alter the connectivity of surface runoff, the volume of water accumulation, and the evolution of inundation depth, thereby affecting local flood risk. The two topographic indicators are used to represent the controlling mechanism of slope, depression, and flow convergence, that is, the natural constraint determining where water accumulates and how long it remains. In urban stormwater inundation, low-lying depressions and their contributing flow contexts have been shown to possess strong explanatory power for the spatial distribution of historical waterlogging sites.
Barrier Proxy (BP) is operationalized as the combined pixel proportion of five semantic segmentation classes that represent visually obstructive interface elements at the pedestrian eye level: fence, pole, traffic sign, traffic light, and railing/guard. The term “barrier” in this study refers primarily to physical obstruction: these elements reduce visual and movement permeability along streets, potentially impeding pedestrian evacuation routes and obscuring spatial legibility during waterlogging events. At the same time, barriers also carry a perceptual dimension: dense obstructive interfaces may intensify residents’ sense of spatial entrapment and reduce perceived escape options under flood conditions. BP is thus interpreted as a visual and movement-permeability proxy and as a psychological cue of perceived confinement.
Water Exposure (WE) is operationalized as the pixel proportion of the “water” semantic class in street view imagery. In the Zhuhai study area, this class captures visible open water surfaces, including rivers, canals, drainage channels, ornamental water features, and residual standing water or ponding at low-lying locations. It is important to note that WE does not measure real-time flood inundation depth; rather, it quantifies the degree to which water is a persistent visible element of the streetscape under normal (non-flood) conditions. A higher WE value signals proximity to waterfront edges or drainage-constrained nodes where water tends to accumulate. The extremely high entropy weight assigned to WE (0.6667) is attributable to its highly skewed distribution: the vast majority of sampling points have near-zero water exposure, while a small cluster of waterfront or low-lying points exhibits substantially elevated values, making WE the single most discriminatory variable for differentiating micro-environmental types across the 78 flood risk buffers.

3.4. Entropy Weight Method and Cluster Analysis

To characterize the micro-environmental differences among urban pluvial flooding risk sites without introducing subjective weighting bias, this study applied the Entropy Weight Method (EWM) to calculate the objective weight of each environmental indicator across the micro-point-level indicator matrix (N = 2351), serving as a complementary weighting procedure to evaluate the discriminatory contribution of each variable. K-means clustering was subsequently conducted at the micro-point level (N = 2351) using the entropy-weighted standardized eight-indicator matrix (i.e., each z-score-standardized variable was multiplied by w j , so that the squared Euclidean distance in K-means was effectively weighted by wj) to identify types of flood-related micro-environments; the resulting micro-point typologies were then spatially aggregated to the 78 flood-risk buffers to characterize the dominant environmental composition of each buffer. The entropy weight method is derived from the concept of information entropy. Its core logic is that the greater the variation in an indicator across samples, the higher the amount of information it contains, and therefore the greater the weight it should be assigned in a comprehensive evaluation or classification. Because the eight indicators may differ in both scale and direction, this study first conducted a directional alignment of all variables. Indicators for which larger values indicate more unfavorable conditions or stronger flood-inducing effects were retained in their original direction. Indicators for which larger values indicate more favorable conditions or stronger buffering effects were transformed in the reverse direction so that all indicators followed the same orientation, with larger values consistently representing higher risk or stronger flood-related signals. After that, min–max normalization was applied to obtain a dimensionless matrix Z = z i j . Based on this normalized matrix, the entropy value, information utility value, and final entropy weight of each indicator were sequentially calculated following the standard EWM procedure. It should be noted that the decision to apply entropy-based weighting prior to clustering, rather than clustering on unweighted standardized variables, was motivated by the specific research context of this study. In urban pluvial flooding environments, different environmental indicators do not contribute equally to distinguishing flood-risk micro-settings; variables that exhibit greater cross-site variation carry more diagnostic information for identifying distinct micro-environmental types. The Entropy Weight Method captures this differential informativeness objectively, without relying on expert judgment. However, because entropy weighting inherently amplifies variables with higher dispersion or skewness, a series of robustness checks were conducted to verify that the resulting cluster typologies were not driven solely by any single dominant variable (see Clustering Robustness Checks Section).
The entropy value of each indicator was subsequently calculated using Equation (1).
e j = k i = 1 n p i j ln p i j , k = 1 ln n
Finally, the coefficient of variation was calculated to derive the objective weight of each indicator, as shown in Equation (2).
d j = 1 e j , w j = d j j = 1 m d j , m = 8
Here, wj reflects the degree of variation in indicator j across the 2351 micro-points, with indicators showing greater variation receiving higher weights. This procedure is grounded in Shannon’s information entropy theory and has been widely adopted for objective weighting in multi-indicator evaluation to classify micro-environmental types. The clustering results were then spatially aggregated to the 78 urban pluvial flooding risk buffers (N = 78). This strategy made it possible to simultaneously obtain (1) differences in environmental composition within each risk buffer, and (2) typological comparisons and spatial patterns across different risk buffers. K-means clustering was run iteratively across a range of candidate cluster numbers K 2 , 10 , and the final number of clusters, K, was determined according to the following criteria.
  • The within-cluster sum of squares, SSE (K), was calculated, and the value of K was selected at the point where the declining trend showed a clear elbow.
  • The average silhouette coefficient under different values of K was compared, and the solution with better separation and cohesion was preferred.
  • Excessively small “fragmented clusters” were avoided, and each cluster was required to exhibit interpretable and clearly identifiable environmental profile characteristics.
Then, similarity in the Z-space was measured using Euclidean distance, and K-means clustering was applied to classify the micro-points into K groups. In this procedure, each micro-point was assigned to the nearest cluster centroid, and the algorithm iteratively updated the cluster centroids until the within-cluster sum of squared distances was minimized. To reduce the influence of local optima, multiple random initializations were performed for each value of K, and the solution with the smallest sum of squared errors (SSE) was retained as the final clustering result.

Clustering Robustness Checks

To examine whether the clustering typologies were robust to methodological choices, four alternative clustering specifications were compared against the primary entropy-weighted K-means solution. First, K-means was applied to the standardized but unweighted indicator matrix, so that all eight variables contributed equally to the distance metric (Scenario A: equal-weight baseline). Second, the primary entropy-weighted K-means solution was retained as the reference scenario (Scenario B: primary weighted solution). Third, because Water Exposure (WE) exhibited extreme sparsity (mean = 0.063%, skewness = 12.922) and received a disproportionately high entropy weight (w = 0.6667), two additional specifications were tested: one using a log-transformed version of WE, ln(WE + 1) (Scenario C1: log-transformed WE), and another excluding WE from the clustering matrix (Scenario C2: WE excluded). Fourth, hierarchical agglomerative clustering using Ward’s method was applied to the same weighted matrix to examine whether a non-centroid-based clustering algorithm recovered comparable groupings (Scenario D: hierarchical clustering).
Cluster-solution comparability was assessed using the Adjusted Rand Index (ARI), which measures the degree of agreement between two partitions on a scale from 0, indicating random agreement, to 1, indicating identical classification. To enable direct comparison, the number of clusters was held constant at K = 5 across all scenarios, corresponding to the five micro-environmental typologies identified in the main analysis (Please refer to Equation (3) for the calculation steps).
min c = 1 K k C c Z ~ k μ c 2

3.5. Buffer-Level Aggregation and Descriptive Statistics

To bridge the micro-point-level measurements and the subsequent buffer-level analyses, all micro-point environmental indicator values falling within each buffer boundary were spatially averaged to produce buffer-level means prior to the procedures described below. The resulting buffer-level dataset (N = 78) constitutes the unit of observation for descriptive statistics at the buffer level and for multiple linear regression. Entropy weighting and K-means clustering were conducted at the micro-point level (N = 2351), and the resulting micro-point typologies were subsequently aggregated to the buffer level for interpretation and regression-related contextual analysis.
After completing indicator calculation and typological identification at the micro-point level, this study used the 78 urban pluvial flooding risk buffers as the unified analytical units and spatially aggregated the micro-point results to generate an eight-indicator matrix at the risk-site level, together with information on type composition and dominant type. Based on this risk-site dataset, this section presents three aspects from a descriptive statistical perspective: (1) the overall distribution patterns and dispersion characteristics of the environmental indicators across risk sites; (2) the ranking of entropy-based weights and the interpretation of their differences; and (3) the type composition, intergroup difference tests, and visual summaries of the clustering results at the risk-site level, thereby providing a quantitative foundation for the subsequent spatial pattern analysis and regression modeling. For each indicator Xj, its distribution across the 78 risk sites was described statistically using the mean, standard deviation, minimum and maximum values, skewness, and kurtosis, and its dispersion and extreme-value distribution were further illustrated by boxplots or violin plots.

3.6. Psychological Perception Data of Local Residents

In this study, the scenario of being stranded and experiencing travel disruption during typhoon-induced rainstorms and urban waterlogging was used as the background of risk exposure. Residents’ subjective psychological responses were collected through questionnaire surveys, and corresponding psychological perception variables were constructed to match the objective micro-environmental indicators. In line with the research objectives, two psychological outcome variables were defined: (1) perceived emotional stress and (2) negative anxiety index. The questionnaire employed a Likert-scale format ranging from 1 to 7 to measure each item, while also collecting information on demographic characteristics and exposure experience for subsequent control or subgroup analyses. In the questionnaire, perceived emotional stress was defined as residents’ subjective stress state under heavy rainfall and waterlogging conditions, including feelings of tension, oppression, and helplessness. The negative anxiety index was used to capture the extent of residents’ concern and anxiety regarding travel safety, entrapment risk, and potentially uncontrollable consequences. The items for the two constructs were adapted from established perceived stress, state anxiety, negative affect, and flood/disaster risk perception scales, and were contextualized to the scenario of rainstorm-induced waterlogging and travel disruption. The adapted items were refined through expert review and a small-scale pilot survey to ensure semantic clarity and consistency with the local context and research setting. The full item wording is provided in Supplementary Materials (Tables S1 and S2). At the same time, to reduce potential confounding effects, the survey also collected individual information from respondents, including gender, age, education level, length of residence, commuting mode, frequency of previous entrapment or waterlogging experience, and knowledge of typhoon and rainstorm risks. More importantly, in order to align subjective psychological data with objective micro-environmental characteristics at the same spatial scale, this study adopted a full-coverage sampling strategy using the 78 risk buffers as stratified units. A sufficient number of questionnaire samples was collected within each buffer to ensure that each risk zone could generate stable aggregated psychological indicators. After collection, the questionnaires were screened for validity to obtain the final valid sample set. To align the psychological data with the buffer-level analytical framework, individual questionnaire responses collected within each buffer were subsequently averaged to produce buffer-level mean scores for perceived emotional stress and the negative anxiety index; these buffer-level means serve as the dependent variables in all regression analyses reported in this study.
The internal consistency of each construct was assessed using Cronbach’s alpha (α). The Perceived Emotional Stress scale (4 items) yielded α = 0.801, and the Negative Anxiety Index (4 items) yielded α = 0.756, both exceeding the conventional threshold of 0.70 [34], indicating acceptable to good internal consistency. To examine the construct structure, an exploratory factor analysis (EFA) was conducted using principal-axis factoring with oblique (promax) rotation. The results confirmed a clean two-factor solution: all items loaded primarily on their intended construct (factor loading ≥ 0.55) with minimal cross-loadings (<0.30), supporting the convergent and discriminant validity of the two constructs (see Supplementary Materials, Tables S3 and S4).
The rationale for aggregating individual responses to buffer-level means follows the ecological approach adopted in neighborhood environmental psychology and disaster risk research [35]. When the central research question concerns how the physical characteristics of a spatially defined unit covary with the collective psychological climate of its residents, the area-level mean constitutes a theoretically appropriate and spatially consistent outcome variable. Because the environmental predictors in this study are defined and measured at the buffer level, using buffer-level means as the dependent variable ensures alignment between outcome and predictor scales, thereby producing internally consistent ecological regression estimates. This approach is consistent with established practice in area-level environmental health and urban studies research, where individual-level responses are aggregated to the spatial unit of primary interest before analysis [36].

3.7. Multiple Linear Regression Modeling of Buffer-Level Associations and Model Diagnostics

It should be emphasized that the regression analysis in this study is cross-sectional, observational, and ecological in nature. The unit of analysis is the flood-risk buffer rather than the individual respondent. Although the psychological constructs were first measured at the individual level, they were aggregated into buffer-level mean values before entering the regression models. Therefore, the models estimate associations between buffer-level environmental characteristics and buffer-level average psychological responses. They should not be interpreted as identifying causal effects or individual-level psychological mechanisms.
To estimate the statistical associations between the micro-scale built environment surrounding urban pluvial flooding risk sites and buffer-level psychological perception, this study further constructed multiple linear regression models after completing micro-point indicator extraction, entropy-based weighting, spatial aggregation, and cluster identification. The 78 urban pluvial flooding risk buffers were used as the observational units for the regression analysis. The aim of the regression was to estimate the direction, effect size, and statistical significance of different environmental cues on buffer-level average psychological responses while controlling for the influence of other factors, thereby establishing an interpretable mapping between objective environmental conditions and subjective perception. Two buffer-level psychological indicators, derived by aggregating individual questionnaire responses within each buffer, were used as the outcome variables: perceived emotional stress (Ystress) and negative anxiety index (Yanxiety). Both constructs were first calculated at the individual level and then aggregated as buffer-level means for the respondents within the i-th buffer. As noted above, the eight objective environmental indicators aggregated at the buffer level were used as the main explanatory variables (Xij). Because these indicators were measured on different scales, all independent variables were standardized using Z-scores before entering the regression model, allowing the regression coefficients to be directly compared in terms of effect size. In addition, for indicators in which larger values represented more favorable or buffering conditions, directional alignment was performed in advance through reverse transformation to avoid ambiguity in interpreting coefficient signs. Finally, a multiple linear regression equation was established using Equation (4) to estimate the associations between environmental variables and buffer-level average psychological responses within urban pluvial flooding risk buffers. Beyond multicollinearity diagnostics (VIF), a rigorous post-estimation diagnostic protocol was implemented to evaluate the robustness of the regression models given the relatively small sample size (N = 78) and high explanatory power. Specifically, Cook’s Distance was calculated for each observation to detect potentially influential outliers. Residual normality was assessed using the Shapiro–Wilk test, and heteroskedasticity was examined through the Breusch-Pagan test. Furthermore, given the limited sample size, Leave-One-Out Cross-Validation (LOOCV) was employed to evaluate the model’s out-of-sample predictive validity, yielding a cross-validated Q2 statistic that indicates the degree to which the model shows predictive stability when each observation is held out in turn. Additionally, to address the potential concern that nearby flood-risk buffers may share similar environmental and socioeconomic characteristics—thereby violating the independence assumption of OLS regression—the spatial autocorrelation of regression residuals was formally tested using Moran’s I statistic. An inverse distance weighting (IDW) spatial weight matrix was constructed based on the geographic coordinates of the 78 buffer centroids, and the global Moran’s I was computed for the residuals of each regression model using a permutation-based inference approach (999 permutations).
Y i ( k ) = β 0 ( k ) + j = 1 8 β j ( k ) X i j * + p = 1 P γ p ( k ) C i p + ε i ( k ) , k s t r e s s , a n x i e t y

4. Results

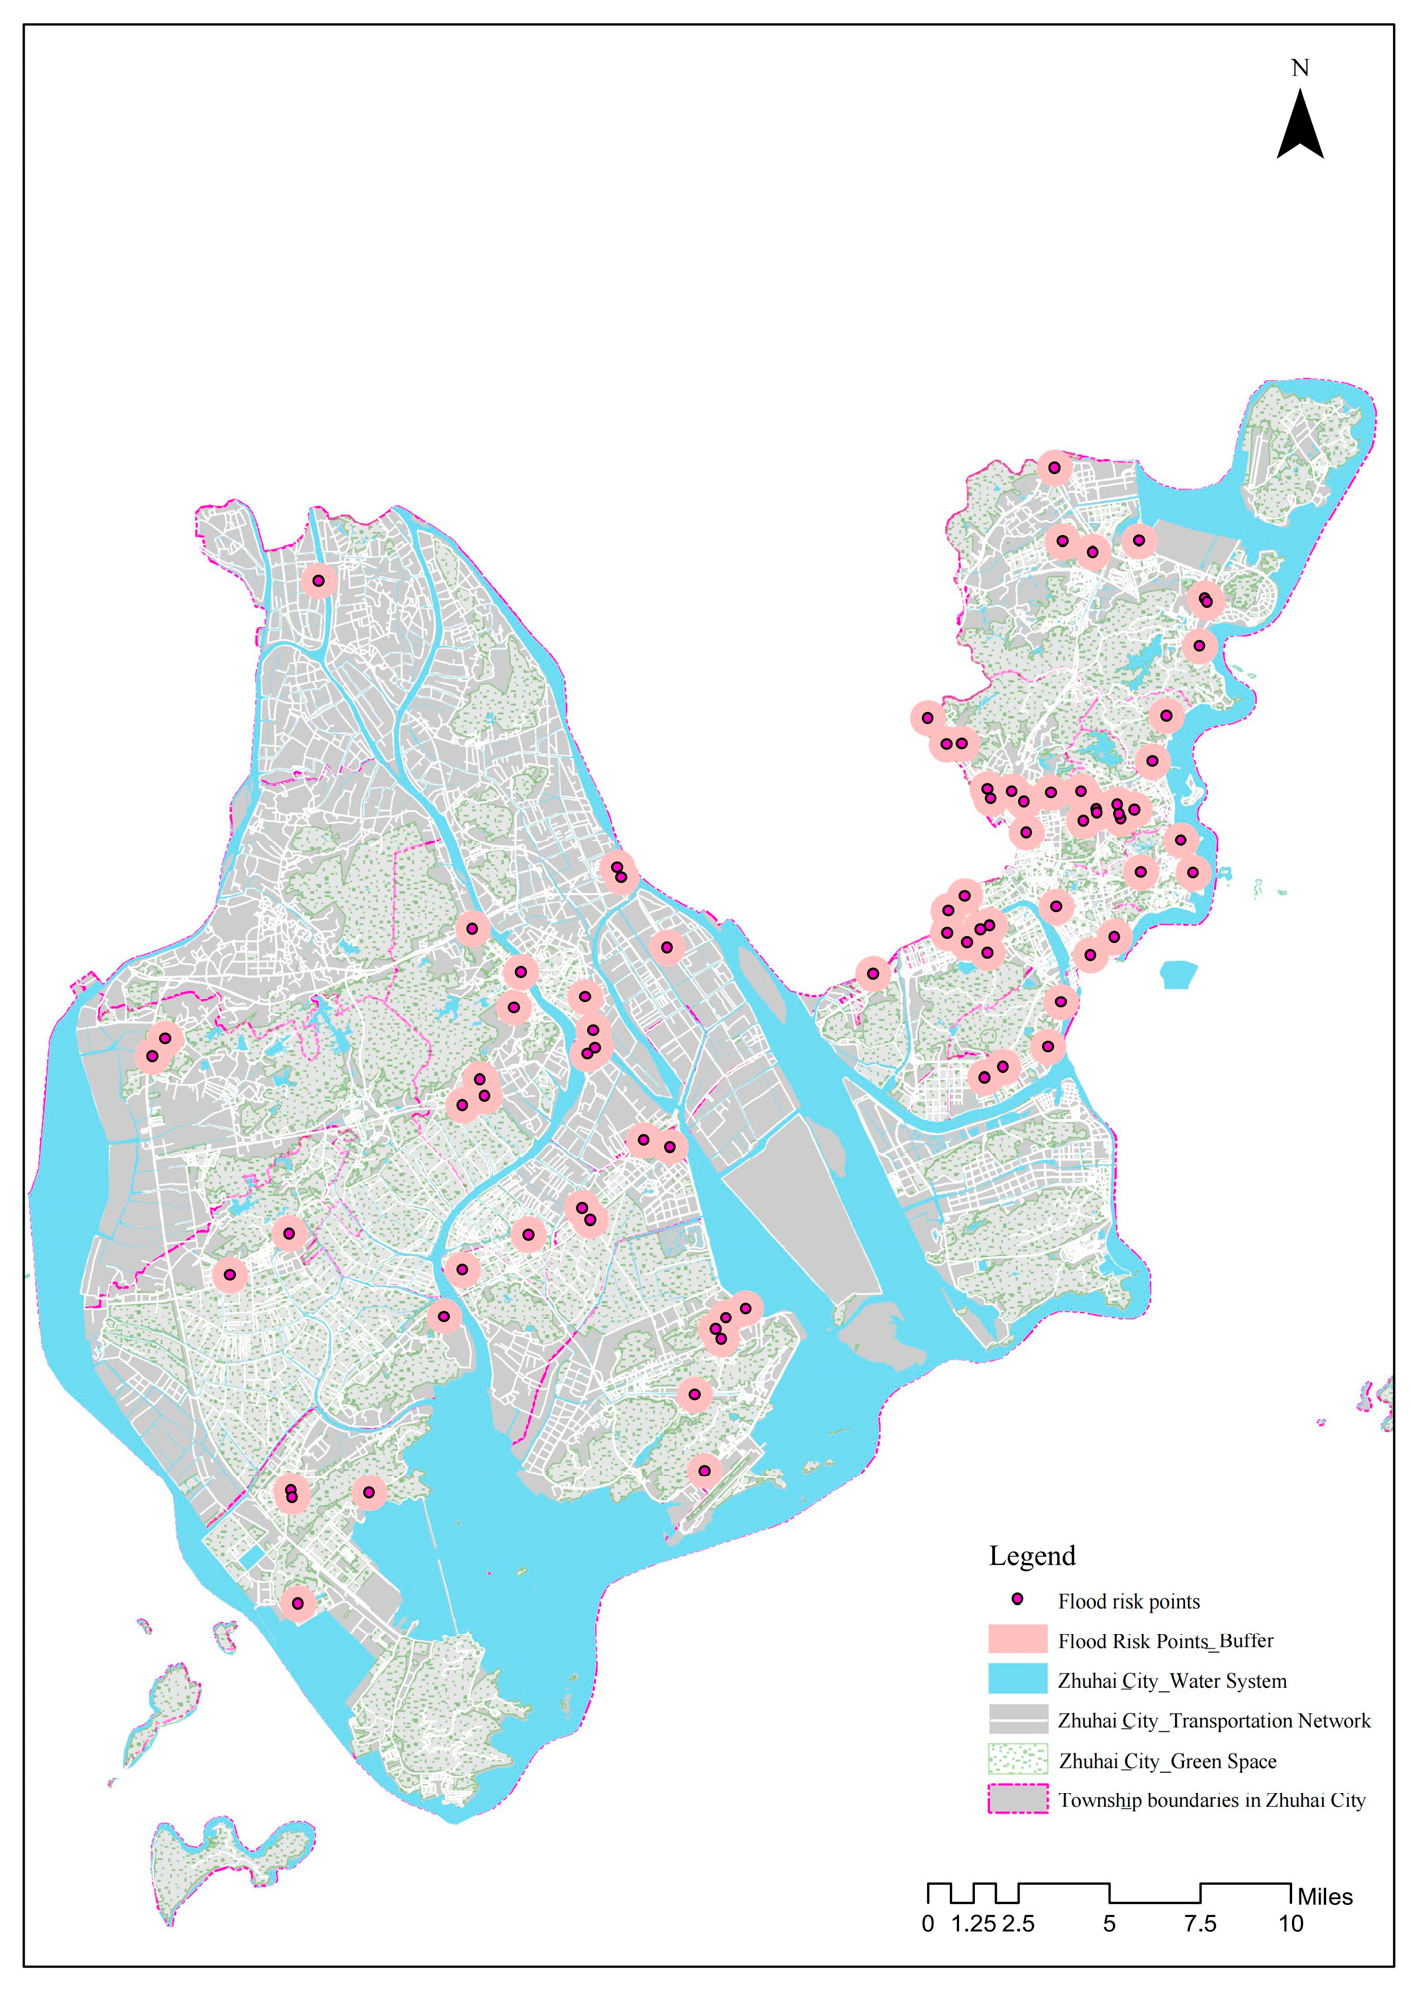
This study focused on the inland built-up area of Zhuhai as the research area. Based on the official records of urban waterlogging risk released by the Zhuhai Water Authority, and after coordinate verification and the merging of duplicate locations, a total of 78 valid urban pluvial flooding risk sites were finally identified (Figure 2). As shown in Figure 2, these risk sites are widely distributed across the main built-up area of Zhuhai and its core urban clusters, including Xiangzhou District and Jinwan District. Overall, they exhibit a spatial pattern of concentration along major transportation corridors and low-lying water-system zones. The main contiguous clusters are located in the central part of the Xiangzhou Peninsula and the Tangjiawan area, reflecting the typical distribution pattern of waterlogging hotspots in Zhuhai’s built-up area under heavy rainfall conditions.
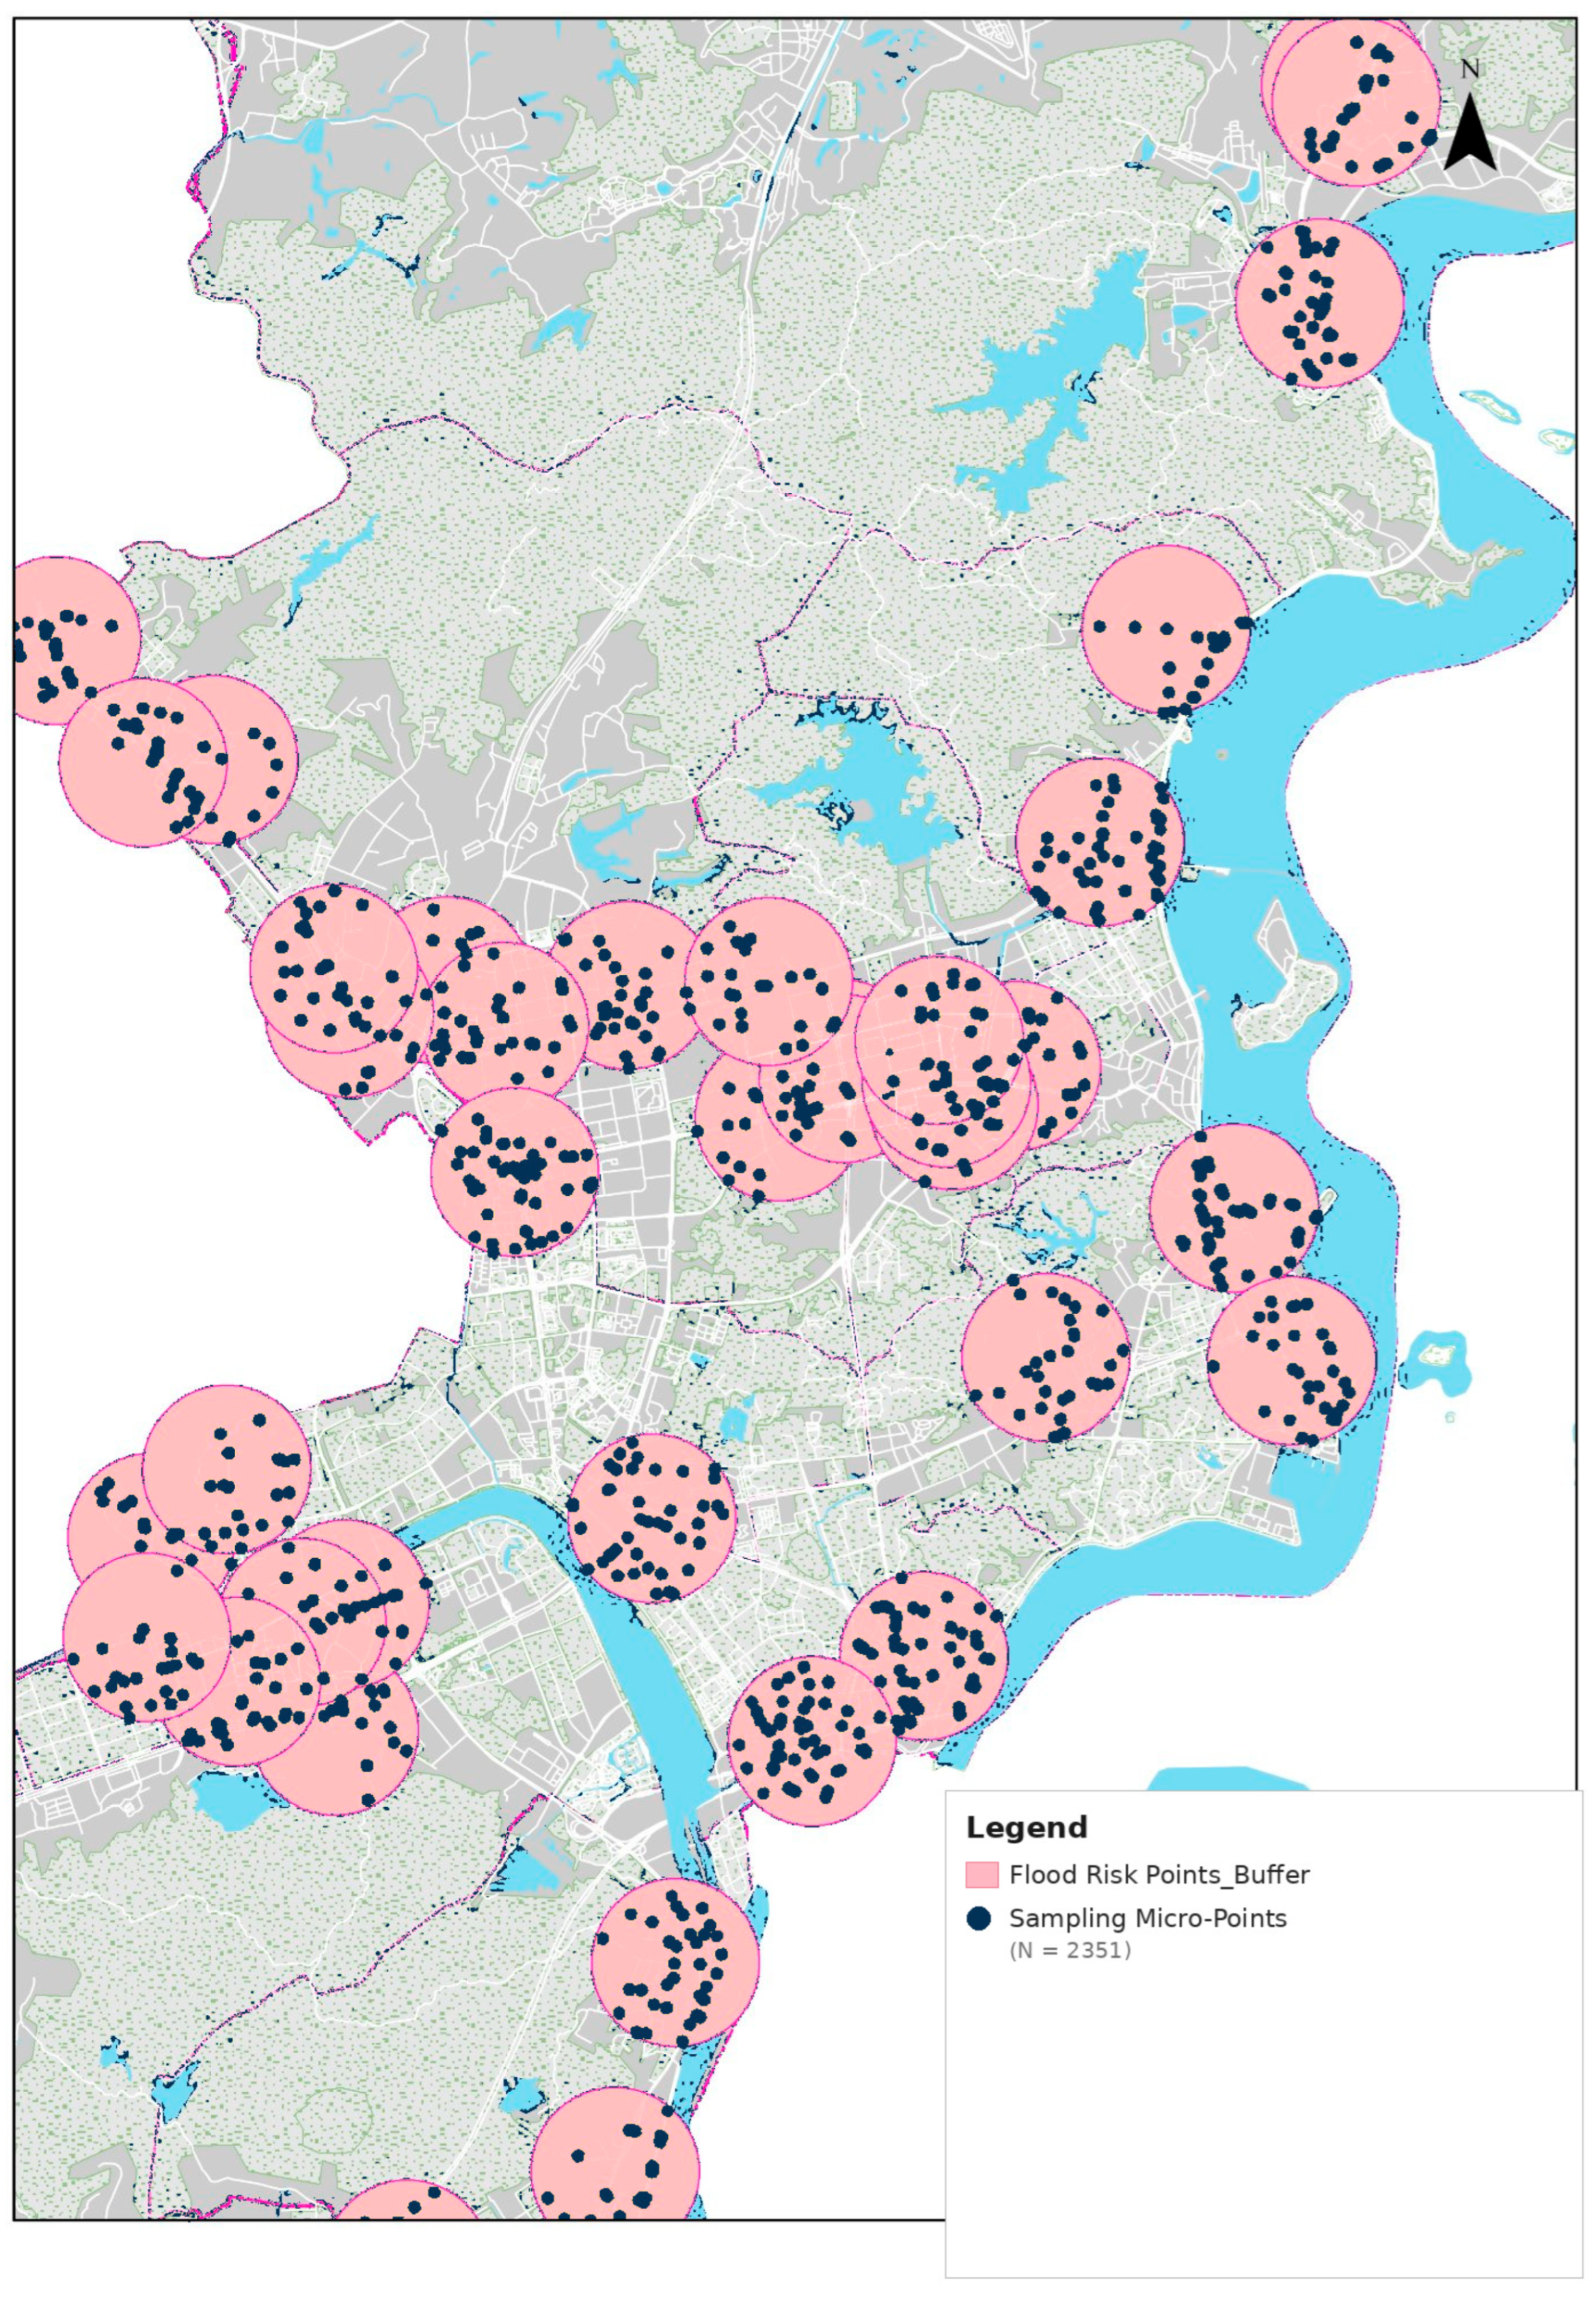
In terms of analytical unit construction, a circular buffer with a radius of 800 m was established around each risk site, serving as the unified spatial unit for subsequent micro-scale built environment measurement and residents’ psychological perception data collection (a total of 78 buffers). Within each buffer, road nodes were extracted using the road network as the structural framework, generating 2351 street view sampling micro-points across the study area, with an average of approximately 30 sampling points per buffer (Figure 3). Street view imagery was collected through the Baidu Street View API. At each sampling micro-point, street view images were retrieved in four directions, namely east (0°), north (90°), west (180°), and south (270°), in order to minimize the influence of single-viewpoint bias on the estimation of environmental indicators. A total of 9404 valid street view images were collected across the study area. After excluding samples with severe occlusion, blurring, or geolocation errors, the remaining images were retained for subsequent semantic segmentation analysis. As shown in Figure 3, the spatial distribution of micro-points within each buffer closely corresponds to the complexity of the road network within that buffer. Buffers located in the main built-up area and road-dense districts contain noticeably more sampling points than those in surrounding low-density areas. This indicates that the sampling strategy adopted in this study can objectively capture the spatial heterogeneity of actual street interfaces within each risk buffer, thereby providing a representative visual sample base for subsequent indicator extraction.
A total of 9404 street view images were collected in this study. Subsequently, a deep learning-based computer vision technique was applied to segment each image at the pixel level into semantic categories, including roads, buildings, vegetation, sky, and water bodies, thereby enabling a quantitative analysis of the compositional elements of street interfaces. Unlike object detection, which only locates and encloses objects with bounding boxes, semantic segmentation predicts a class label for every pixel. This allows researchers to calculate the proportional area occupied by each environmental element within the visual field, which constitutes the core computational basis for extracting physical environmental cues such as the Green View Index, impervious surface exposure, building enclosure, and sky visibility in the present study.
Street view imagery (SVI) provides a ground-level, human-eye perspective and can reveal micro-scale urban features at a high spatial resolution that are difficult to capture through satellite remote sensing, including the continuity of road paving, the degree to which building interfaces obstruct visibility, and the three-dimensional distribution pattern of vegetation. Specifically, impervious urban surfaces are recognized as one of the most important physical factors aggravating urban pluvial flooding [33]. Hard pavements and sealed surfaces substantially reduce infiltration capacity, forcing rainfall runoff to concentrate more rapidly on the surface, thereby directly increasing peak flow and the risk of water accumulation. In this context, the visual exposure of impervious surfaces (IV) extracted from street view imagery through semantic segmentation provides a direct pedestrian-scale quantification of this process. It reflects the dominance of hard paving within the actual visual field experienced by residents on the street and compensates for the loss of accuracy caused by the mixed-pixel effect in remote sensing data.
In addition, the high building density and limited ground-level open space associated with high-density urban development can further intensify the risk of urban pluvial flooding. This effect is determined not only by the proportion of impervious surfaces, but also by the ways in which urban form constrains runoff routing and retention processes [37]. Building enclosure (BE) specifically quantifies the intensity of the street canyon effect. A higher degree of enclosure implies more restricted space for water dissipation and reduced natural evaporation pathways, thereby prolonging hydrological retention time. Semantic segmentation can automatically decompose street view imagery into meaningful urban categories, such as roads, sidewalks, vegetation, and vehicles. Compared with conventional classification methods based on low-level color or texture features, deep learning-driven semantic segmentation enables more accurate, robust, and consistent feature extraction in complex urban environments [38], thereby allowing three-dimensional morphological indicators such as building enclosure and sky visibility to be measured in a standardized manner across thousands of sampling points throughout the city.
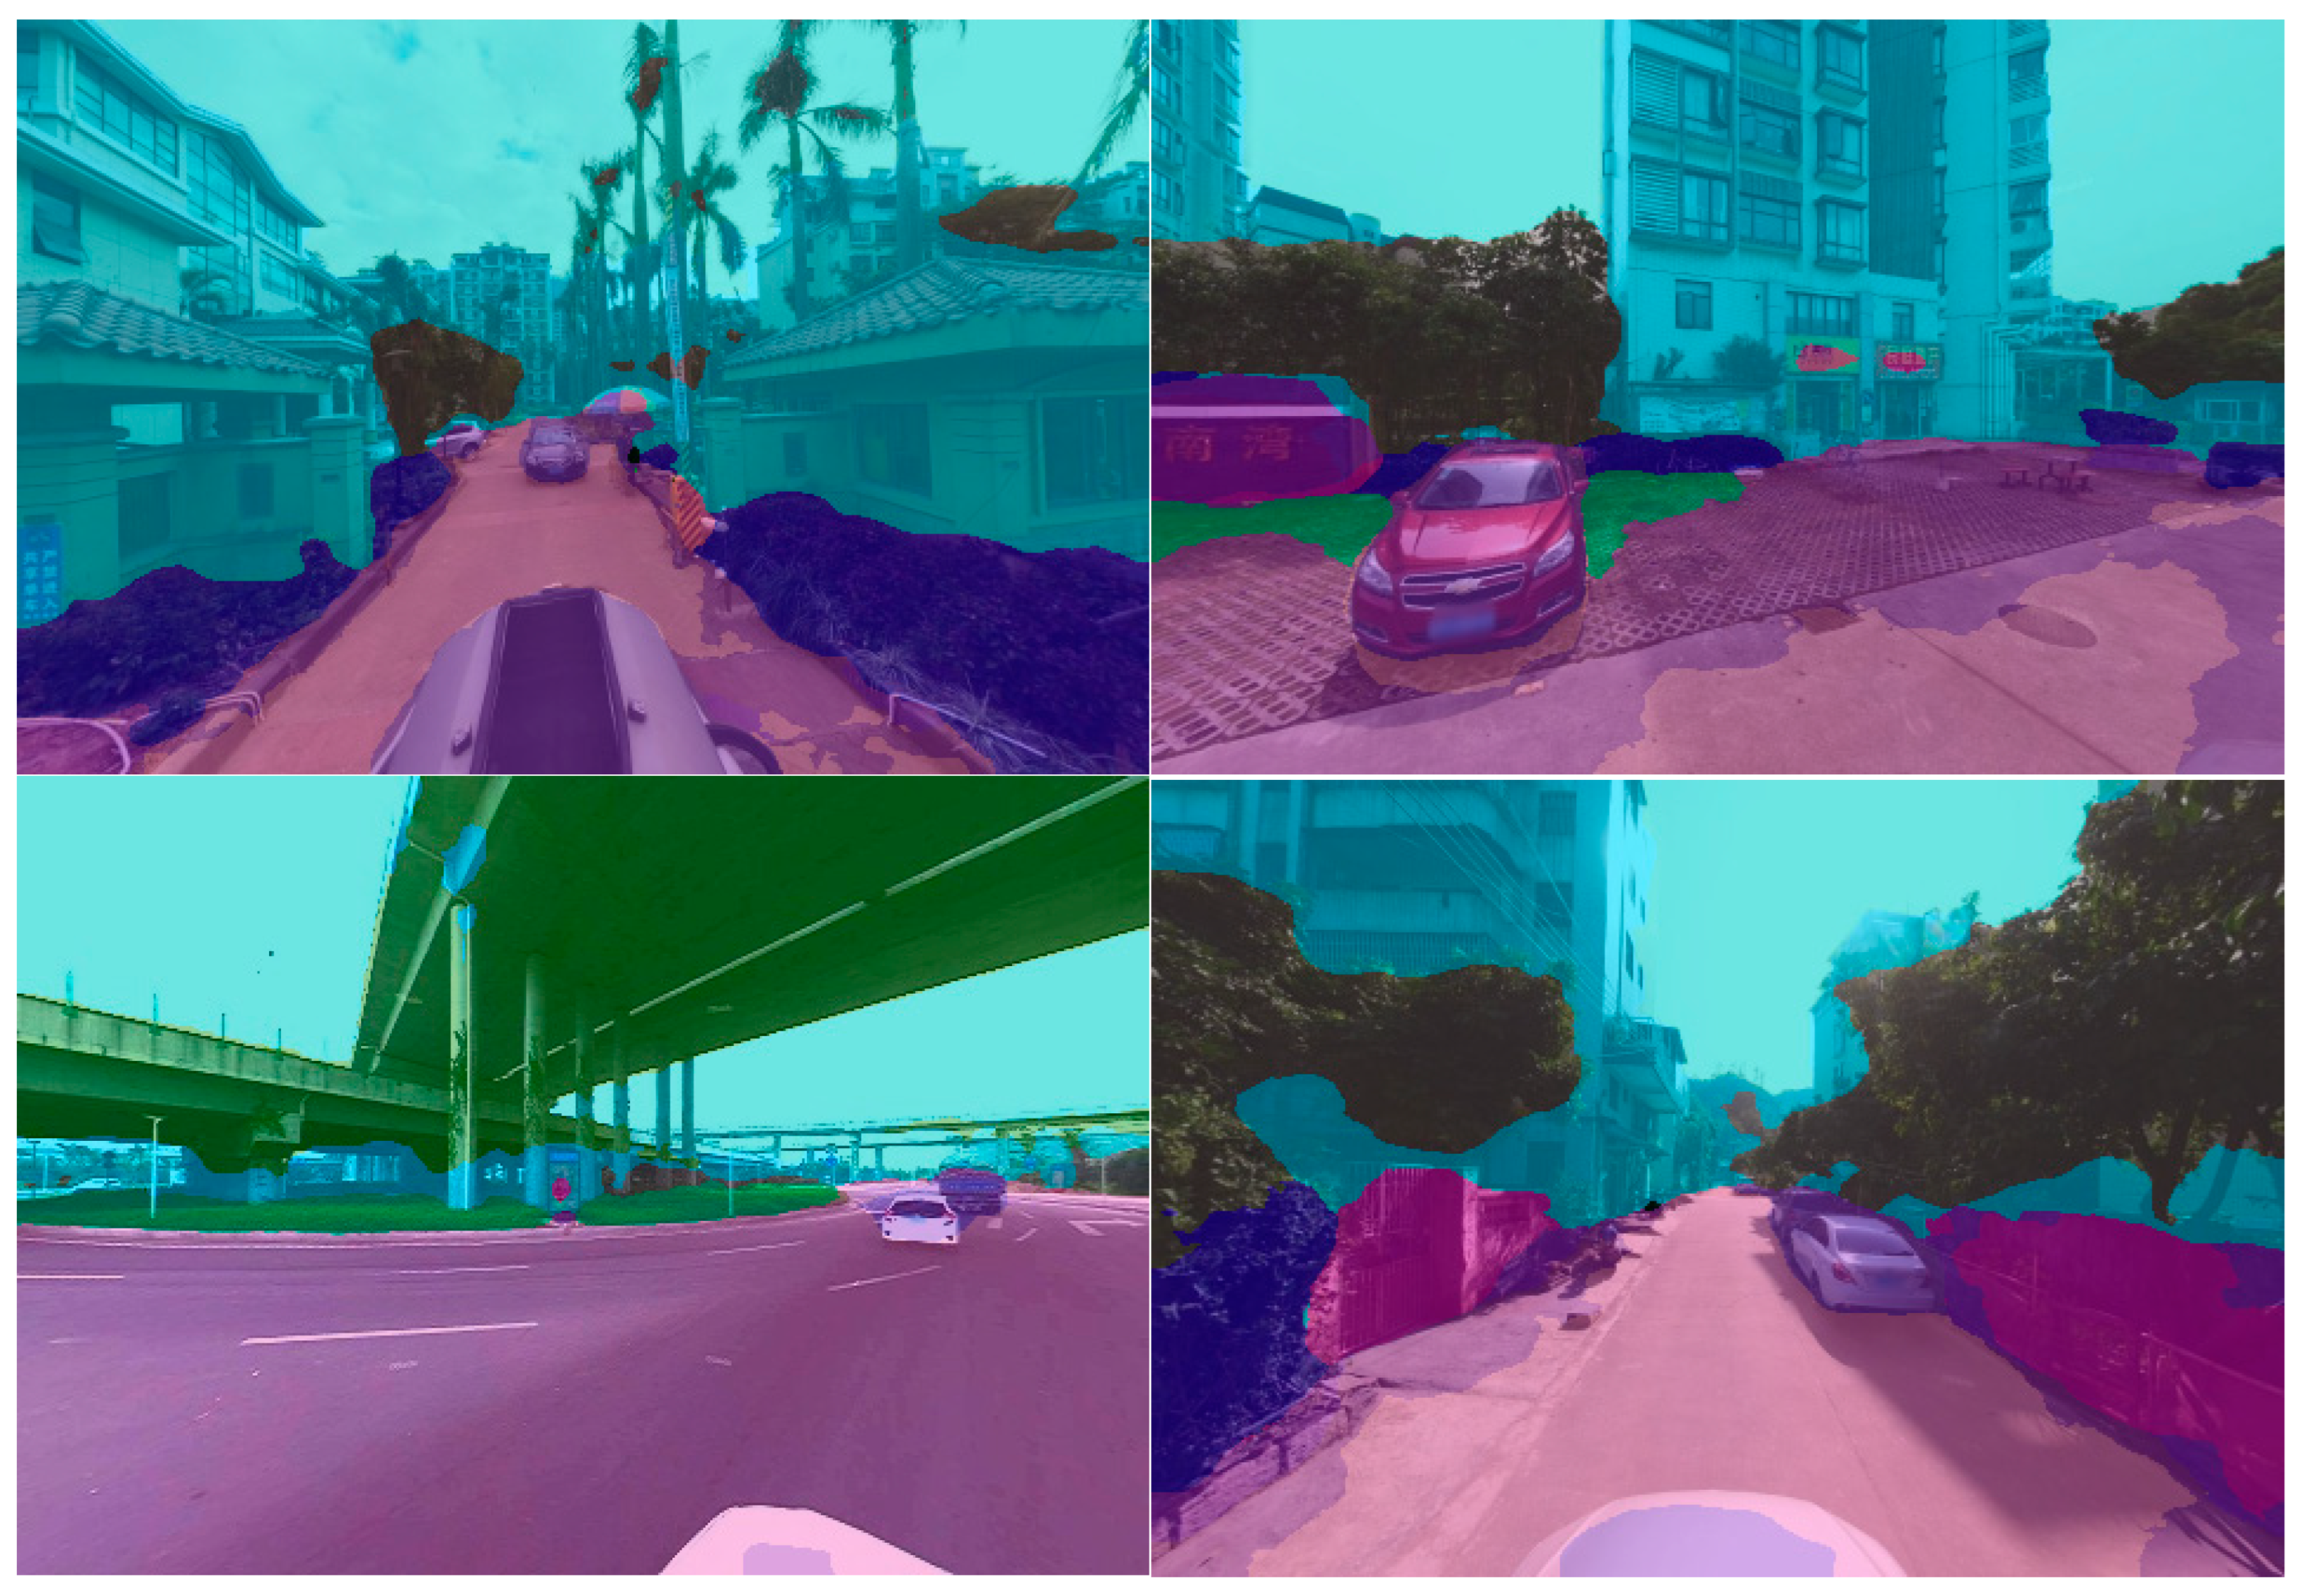
Furthermore, the semantic segmentation results of street view imagery across all flooding risk sites, as presented in Figure 4, visually validate the effectiveness of the indicators selected in this study for identifying micro-environmental differences among urban pluvial flooding risk sites. Different scenes exhibit clear variation in terms of the Green View Index (GVI), impervious surface visual exposure (IV), building enclosure (BE), sky visibility (SV), and barrier proxy (BP), indicating that street view imagery can not only reflect the compositional characteristics of the physical built environment, but also sensitively capture differences among flooding scenarios along such dimensions as enclosed versus open, hard-surfaced versus green, and permeable versus obstructed. This human-eye-level approach to environmental quantification provides a reliable basis for the subsequent identification of typical micro-scale flooding environment types at the micro-point level.
At the same time, the incorporation of topographic factors further compensates for the natural hydrological constraints that may be overlooked when relying solely on visual features derived from street view imagery. The DEM-derived results for slope (S) and depression degree (D) indicate that the areas surrounding different urban pluvial flooding risk sites in Zhuhai exhibit substantial variation in local relief, flow convergence potential, and surface water retention conditions. Some risk buffers are located in relatively low-lying areas with gentle slopes, where rainfall is more likely to accumulate and dissipate slowly. Others are situated in built-up areas with steeper slopes but spatially constrained road networks, where short-duration intense rainfall can more readily generate rapid road-based flow concentration and localized nodal waterlogging. These findings suggest that the formation of urban pluvial flooding risk sites is determined neither solely by topography nor solely by the built environment, but rather by the coupled effects of both.
At the micro-point level, a total of 2351 street view sampling points were included in the analysis. The descriptive statistics indicate that, as shown in Table 3, all eight micro-environmental indicators exhibit substantial heterogeneity overall. Among them, slope (S) has a mean value of 2.426, a standard deviation of 1.623, and a maximum value of 10.768, suggesting considerable variation in surface relief across sampling points. Depression degree (D) has a mean of 0.333 and a standard deviation of 0.676, with values ranging from −2.706 to 4.663, indicating that some sampling points are located in markedly low-lying positions with strong local water accumulation potential.
With respect to the visual environmental indicators derived from street view semantic segmentation, impervious surface visual exposure (IV) shows the highest mean value at 26.883%, indicating that roads and hard paving dominate the visual field at most sampling points. This is followed by sky visibility (SV, 23.439%) and building enclosure (BE, 20.234%), suggesting that the street spaces surrounding urban pluvial flooding risk sites in Zhuhai are characterized by both a certain degree of openness and a relatively strong sense of spatial enclosure. In contrast, the mean Green View Index (GVI) is 16.269%, indicating that vegetation is not the dominant interface element around most risk sites. The mean value of the barrier proxy (BP) is only 5.146%, while water exposure (WE) is even lower, with a mean of just 0.063%, reflecting the fact that water-related pixels are rarely observed in the vast majority of street view images.
Interpreted through the theoretical framework of urban morphology and place quality, these descriptive results suggest that the flood-risk environments in Zhuhai are characterized by a strong dominance of hard-surfaced urban fabric, moderate visual openness, and relatively pronounced street-edge enclosure. The high mean value of impervious visual exposure indicates that many flood-risk micro-points are embedded in sealed street environments where runoff infiltration is likely to be limited. The relatively high values of sky visibility and building enclosure suggest that these streets are not simply open or closed spaces, but often combine partial openness with strong built-edge definition, reflecting the mixed morphology of high-density coastal urban districts. The comparatively low mean value of GVI implies limited visible green buffering capacity, while the skewed distributions of BP and WE indicate that obstruction and visible water cues are spatially concentrated rather than evenly distributed. From this perspective, the descriptive statistics do not merely summarize image-derived variables; they reveal different dimensions of flood-prone street morphology, including surface hardening, enclosure, openness, green–blue visibility, and local movement obstruction.
After completing the descriptive statistical analysis of the eight environmental indicators for the 2351 street view micro-points, it becomes evident that the micro-scale built environments surrounding urban pluvial flooding risk sites in Zhuhai are far from homogeneous. Instead, they exhibit substantial variation in terms of topographic relief, degree of depression, vegetation exposure, impervious paving, building enclosure, sky openness, and barrier obstruction. This suggests that relying on a single indicator or average value alone is insufficient to capture the visible micro-environmental characteristics that distinguish different flood-risk settings. Therefore, after standardization, this study further entered the eight quantified indicators into a K-means model to conduct cluster analysis on the 2351 micro-points, with the aim of identifying representative types of micro-scale environments surrounding urban pluvial flooding risk sites.
The clustering analysis was therefore not intended to generate purely statistical groupings, but to identify recurrent combinations of urban spatial characteristics. Each cluster can be understood as a specific configuration of terrain condition, surface permeability, street-canyon morphology, visual openness, green–blue interface, and movement permeability. This interpretation helps connect the quantitative clustering results with urban morphology and spatial-structure theories, allowing the resulting types to be read as flood-prone street–terrain typologies rather than as abstract numerical clusters.
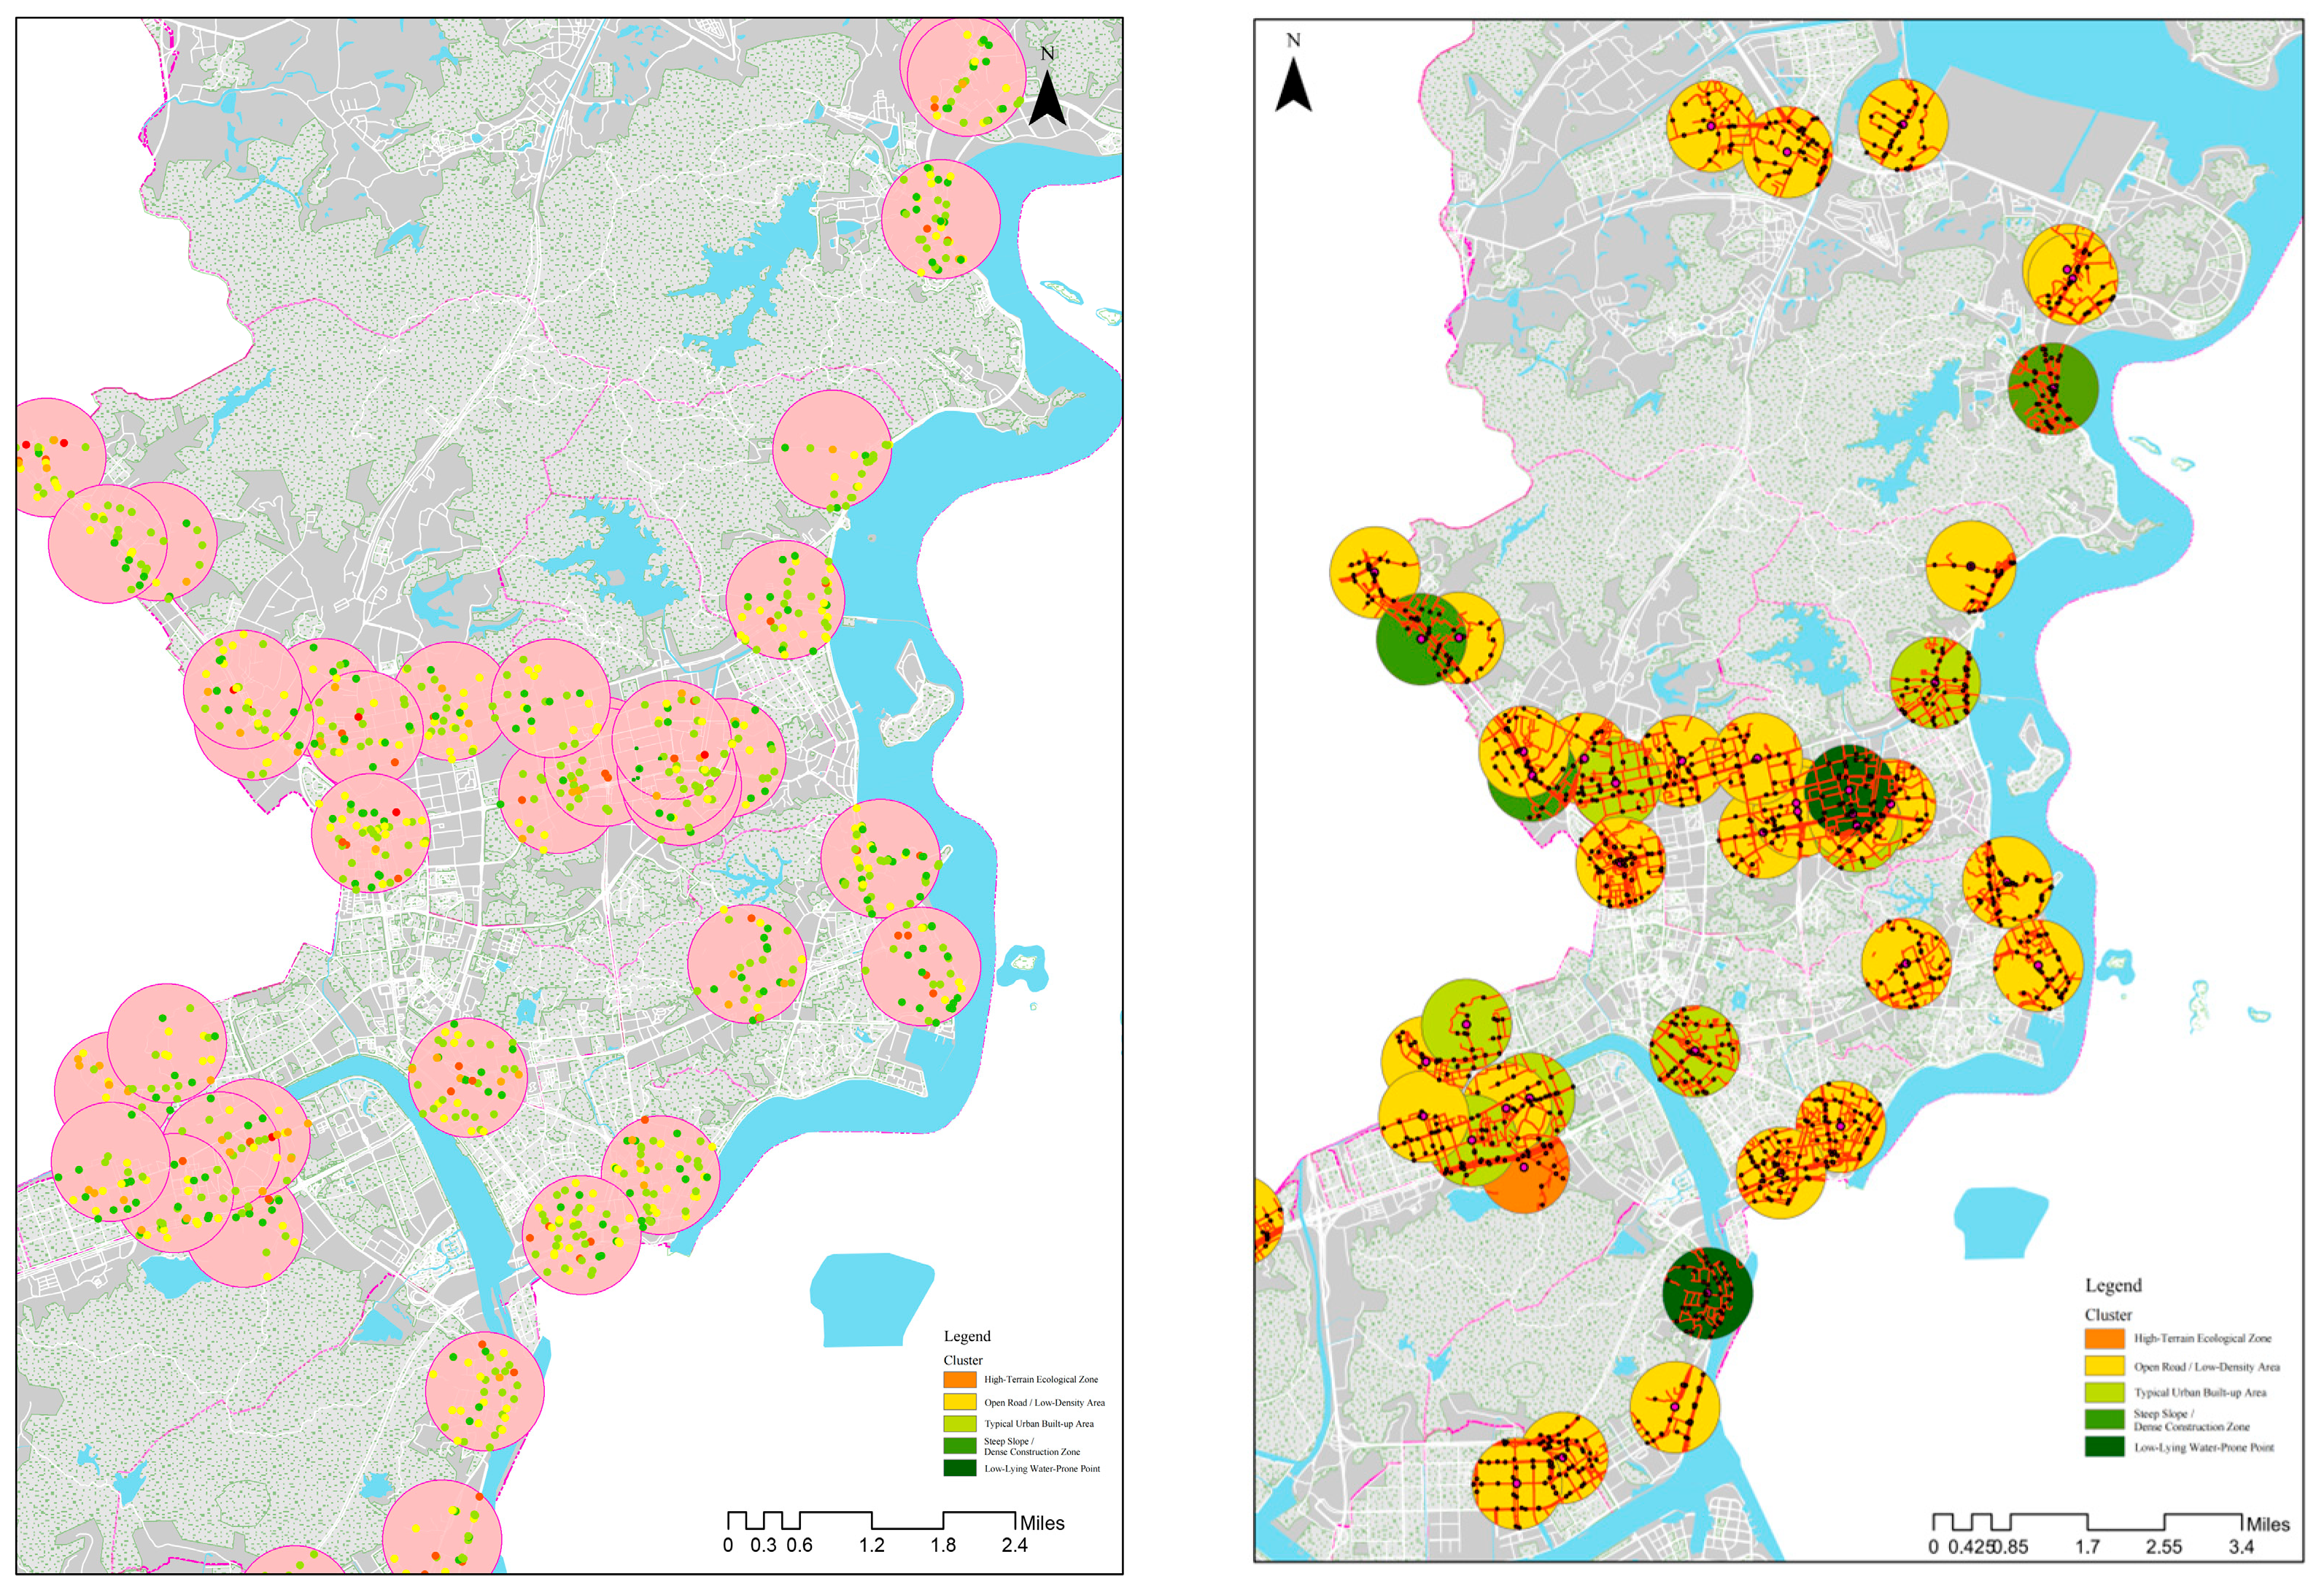
The clustering results indicate that the micro-points in the study area can be classified into several typical types with clearly differentiated environmental profiles (as shown in Figure 5). Judging from the combinations of indicator values and their corresponding spatial morphological characteristics, these types are not random data groupings, but rather represent street–terrain environmental settings with clear real-world urban spatial meaning. Specifically, one type is characterized by a relatively high Green View Index, a low degree of depression, and weak building enclosure. This type is generally associated with areas located near hilly edges or with a strong natural ecological background, and can therefore be summarized as the high-terrain ecological zone. Another type exhibits relatively high sky visibility and impervious surface exposure, accompanied by a low degree of building enclosure; this corresponds to wide road corridors, relatively open thoroughfares, or low-density development areas, and can therefore be defined as “Open Road/Low-Density Area”. The resulting clusters should therefore be interpreted as street-view-based micro-environmental typologies, rather than as comprehensive urban planning typologies that include all network, land-use, and accessibility dimensions.
In addition, one group of points exhibits moderate values across all indicators. These locations are characterized by a generally prevalent hard-paved background, together with a certain amount of greenery and a moderate degree of openness. This type is the most common in terms of quantity and represents the most typical street environment surrounding urban pluvial flooding risk sites in the main urban area of Zhuhai. It may therefore be termed the typical urban built-up area. In contrast, another group of points is characterized by relatively high slope, strong building enclosure, and a pronounced barrier proxy, while showing comparatively low Green View Index and sky visibility. These spaces are generally located in areas with greater topographic relief and a stronger sense of spatial compression created by building interfaces, and can thus be summarized as the steep slope/dense construction zone. Finally, some points exhibit a markedly higher degree of depression and, in certain cases, stronger local exposure to waterfront or standing-water conditions, reflecting typical water-retaining depressions, waterfront edges, or drainage-constrained nodes. These locations may be classified as low-lying water-prone points. Among them, a small number of samples also display exceptionally high water exposure, representing more extreme waterfront-specific settings, which may be interpreted in map visualization as a special subtype of the low-lying water-prone category.
To verify the stability of the above clustering typologies, a series of robustness checks were performed following the protocol described in Clustering Robustness Checks Section. Table 4 summarizes the Adjusted Rand Index (ARI) values comparing each alternative clustering scenario to the primary entropy-weighted K-means solution (Scenario B). Scenario A (unweighted standardized K-means) yielded an ARI of 0.470, indicating moderate agreement with the primary solution. This moderate level of agreement is expected, given that the entropy weighting scheme assigns substantially different importance to each variable, particularly amplifying the contribution of Water Exposure (WE = 0.6667); removing this weighting naturally shifts cluster boundaries. Scenario C1 (log-transformed WE) produced an ARI of 0.984, indicating near-identical agreement and confirming that the typological structure is highly robust to the distributional form of WE: because the log transformation preserves rank ordering, the entropy-weighted clustering is driven by the relative magnitude structure of WE rather than its raw skewness. Scenario D (hierarchical clustering, Ward’s method) produced an ARI of 0.280, indicating that the Ward’s minimum-variance criterion partitions the weighted feature space differently from the K-means centroid-based algorithm; this divergence is consistent with the known sensitivity of hierarchical methods to the shape of high-dimensional clusters dominated by a single variable. Scenario C2 (WE excluded) yielded an ARI of 0.460; this reduction is expected, given that WE alone accounts for approximately two-thirds of the entropy-derived information weight, yet the value remains well above chance-level agreement (ARI ≈ 0) and indicates that the core typological skeleton persists even when the dominant variable is removed. Across all scenarios, the core typological structure—distinguishing high-terrain ecological zones, steep slope/dense construction areas, typical urban built-up environments, low-lying water-prone areas, and open road/low-density corridors—was broadly preserved, although boundary assignments shifted for points near cluster margins, most notably under Scenarios A, C2, and D. These results suggest that the identified micro-environmental typologies reflect robust multi-variable spatial configurations, while also confirming that the entropy weighting scheme—and particularly the dominant role of WE—meaningfully shapes the cluster solution, as the reviewer correctly anticipated.
After completing the cluster identification at the micro-point level, this study further applied the Entropy Weight Method (EWM) to objectively assign weights to the eight environmental indicators, with the aim of evaluating the information contribution of each variable in distinguishing the micro-environmental heterogeneity of urban pluvial flooding risk sites in Zhuhai. The results show substantial variation in indicator weights, suggesting that the environmental variables differ markedly in their discriminatory power for identifying flood-risk settings. Specifically, Water Exposure (WE) received the highest weight, reaching 0.6667, far exceeding all other indicators and indicating the strongest information discrimination capacity among the variables considered. This suggests that, within the street view samples surrounding flood-risk sites in Zhuhai, the presence of visible water bodies, waterfront interfaces, or waterlogging-related visual cues is the most sensitive environmental feature for distinguishing different risk scenarios. In other words, from a street-level visual perspective, the very visibility of water itself constitutes a highly salient risk signal, often corresponding to a greater likelihood of flood exposure or to more distinctive waterfront and low-lying settings. It is important to acknowledge that the exceptionally high weight of WE is a direct consequence of its distributional characteristics: approximately 95.7% of sampling points recorded a WE value of zero, while a small number of waterfront or low-lying points exhibited substantially elevated values (max = 10.482%, skewness = 12.922). Under the entropy weight formulation, such extreme concentration–dispersion contrast yields maximal information entropy reduction and therefore maximal weight. This raises a legitimate methodological concern that the weighted clustering may be disproportionately driven by WE alone. To address this, the robustness checks described in Clustering Robustness Checks Section were conducted. As reported in Table 4, the cluster typology showed very high agreement with the log-transformed WE specification (ARI = 0.984), moderate agreement with the unweighted (ARI = 0.470) and WE-excluded (ARI = 0.460) solutions, and lower agreement with Ward’s hierarchical clustering (ARI = 0.280). These results indicate that the entropy-weighted typology is highly robust to the distributional form of WE, moderately sensitive to the weighting scheme and WE inclusion, and more sensitive to the choice of clustering algorithm.
The second most important indicator was the Barrier Proxy (BP, %), with a weight of 0.1320, which was notably higher than that of most other variables. This indicates that interface elements visible in street view imagery that may contribute to visual obstruction, spatial blockage, or movement-permeability barriers are also important cues for identifying flood-related micro-environments. This finding implies that the formation of flood risk is related not only to the presence of water, but also to whether water can be easily obstructed and whether space is prone to blockage. From the perspective of actual spatial mechanisms, the accumulation of obstacles, boundary barriers, and locally constrained passages may all intensify the retention and localized concentration of rainfall runoff.
The third tier of important variables consisted of building enclosure (BE), the Green View Index (GVI), and slope, with weights of 0.0566, 0.0520, and 0.0488, respectively. Among these, building enclosure was weighted more highly than slope and sky visibility, indicating that in high-density built-up areas such as Zhuhai, whether street space is enclosed and whether building interfaces generate a street canyon effect are more effective in distinguishing different flood scenarios than topographic elevation differences alone. This suggests that dense building enclosure and limited open space do indeed constitute important morphological conditions underlying the formation of urban pluvial flooding risk sites. The relatively high weight assigned to the Green View Index further indicates that the visible presence of vegetation is not only meaningful in terms of environmental quality, but also reflects, to some extent, spatial permeability, openness, and the capacity of the micro-environment to provide regulatory functions.
Overall, the entropy weighting results indicate that the environmental variables most informative for identifying urban pluvial flooding risk sites in Zhuhai are, first, water exposure and obstructive interface elements; second, building enclosure and greenery-related characteristics; and only then slope, sky openness, and terrain depression. These findings suggest that, from a human-eye-level perspective, the most critical signals for recognizing flood-risk settings do not arise solely from macro-topographic conditions, but more strongly from the visual environmental cues of water, obstruction, and enclosure embedded within street space. In other words, the flood risk indicated by street view data is essentially represented by a composite micro-environment jointly shaped by visible water, spatial blockage, and dense building enclosure.
After completing street view image semantic segmentation, the extraction of eight micro-scale built environment indicators, entropy weight analysis, and cluster analysis, this study further conducted a survey of residents’ psychological perceptions to establish the correspondence between objective environmental characteristics and subjective risk perception. Specifically, using the 78 urban pluvial flooding risk buffers as stratified units, a three-month questionnaire survey was carried out within the local living areas covered by each risk buffer. The survey mainly targeted residents who lived, worked, commuted, or frequently engaged in activities within these areas, so as to ensure that respondents possessed strong local awareness of the spatial environment of each risk buffer under rainstorm waterlogging or typhoon conditions. During the survey period, the research team distributed and collected a total of 10,032 questionnaires. After validity screening, 9508 valid questionnaires were retained for the final analysis. In terms of sample distribution, all 78 risk buffers achieved adequate coverage, with an average of approximately 122 valid questionnaires per buffer, ranging from a minimum of 94 to a maximum of 140. This indicates that each risk buffer generated a relatively stable mean value of residents’ psychological perception, which could serve as the dependent variable basis for the subsequent buffer-level multiple linear regression analysis.
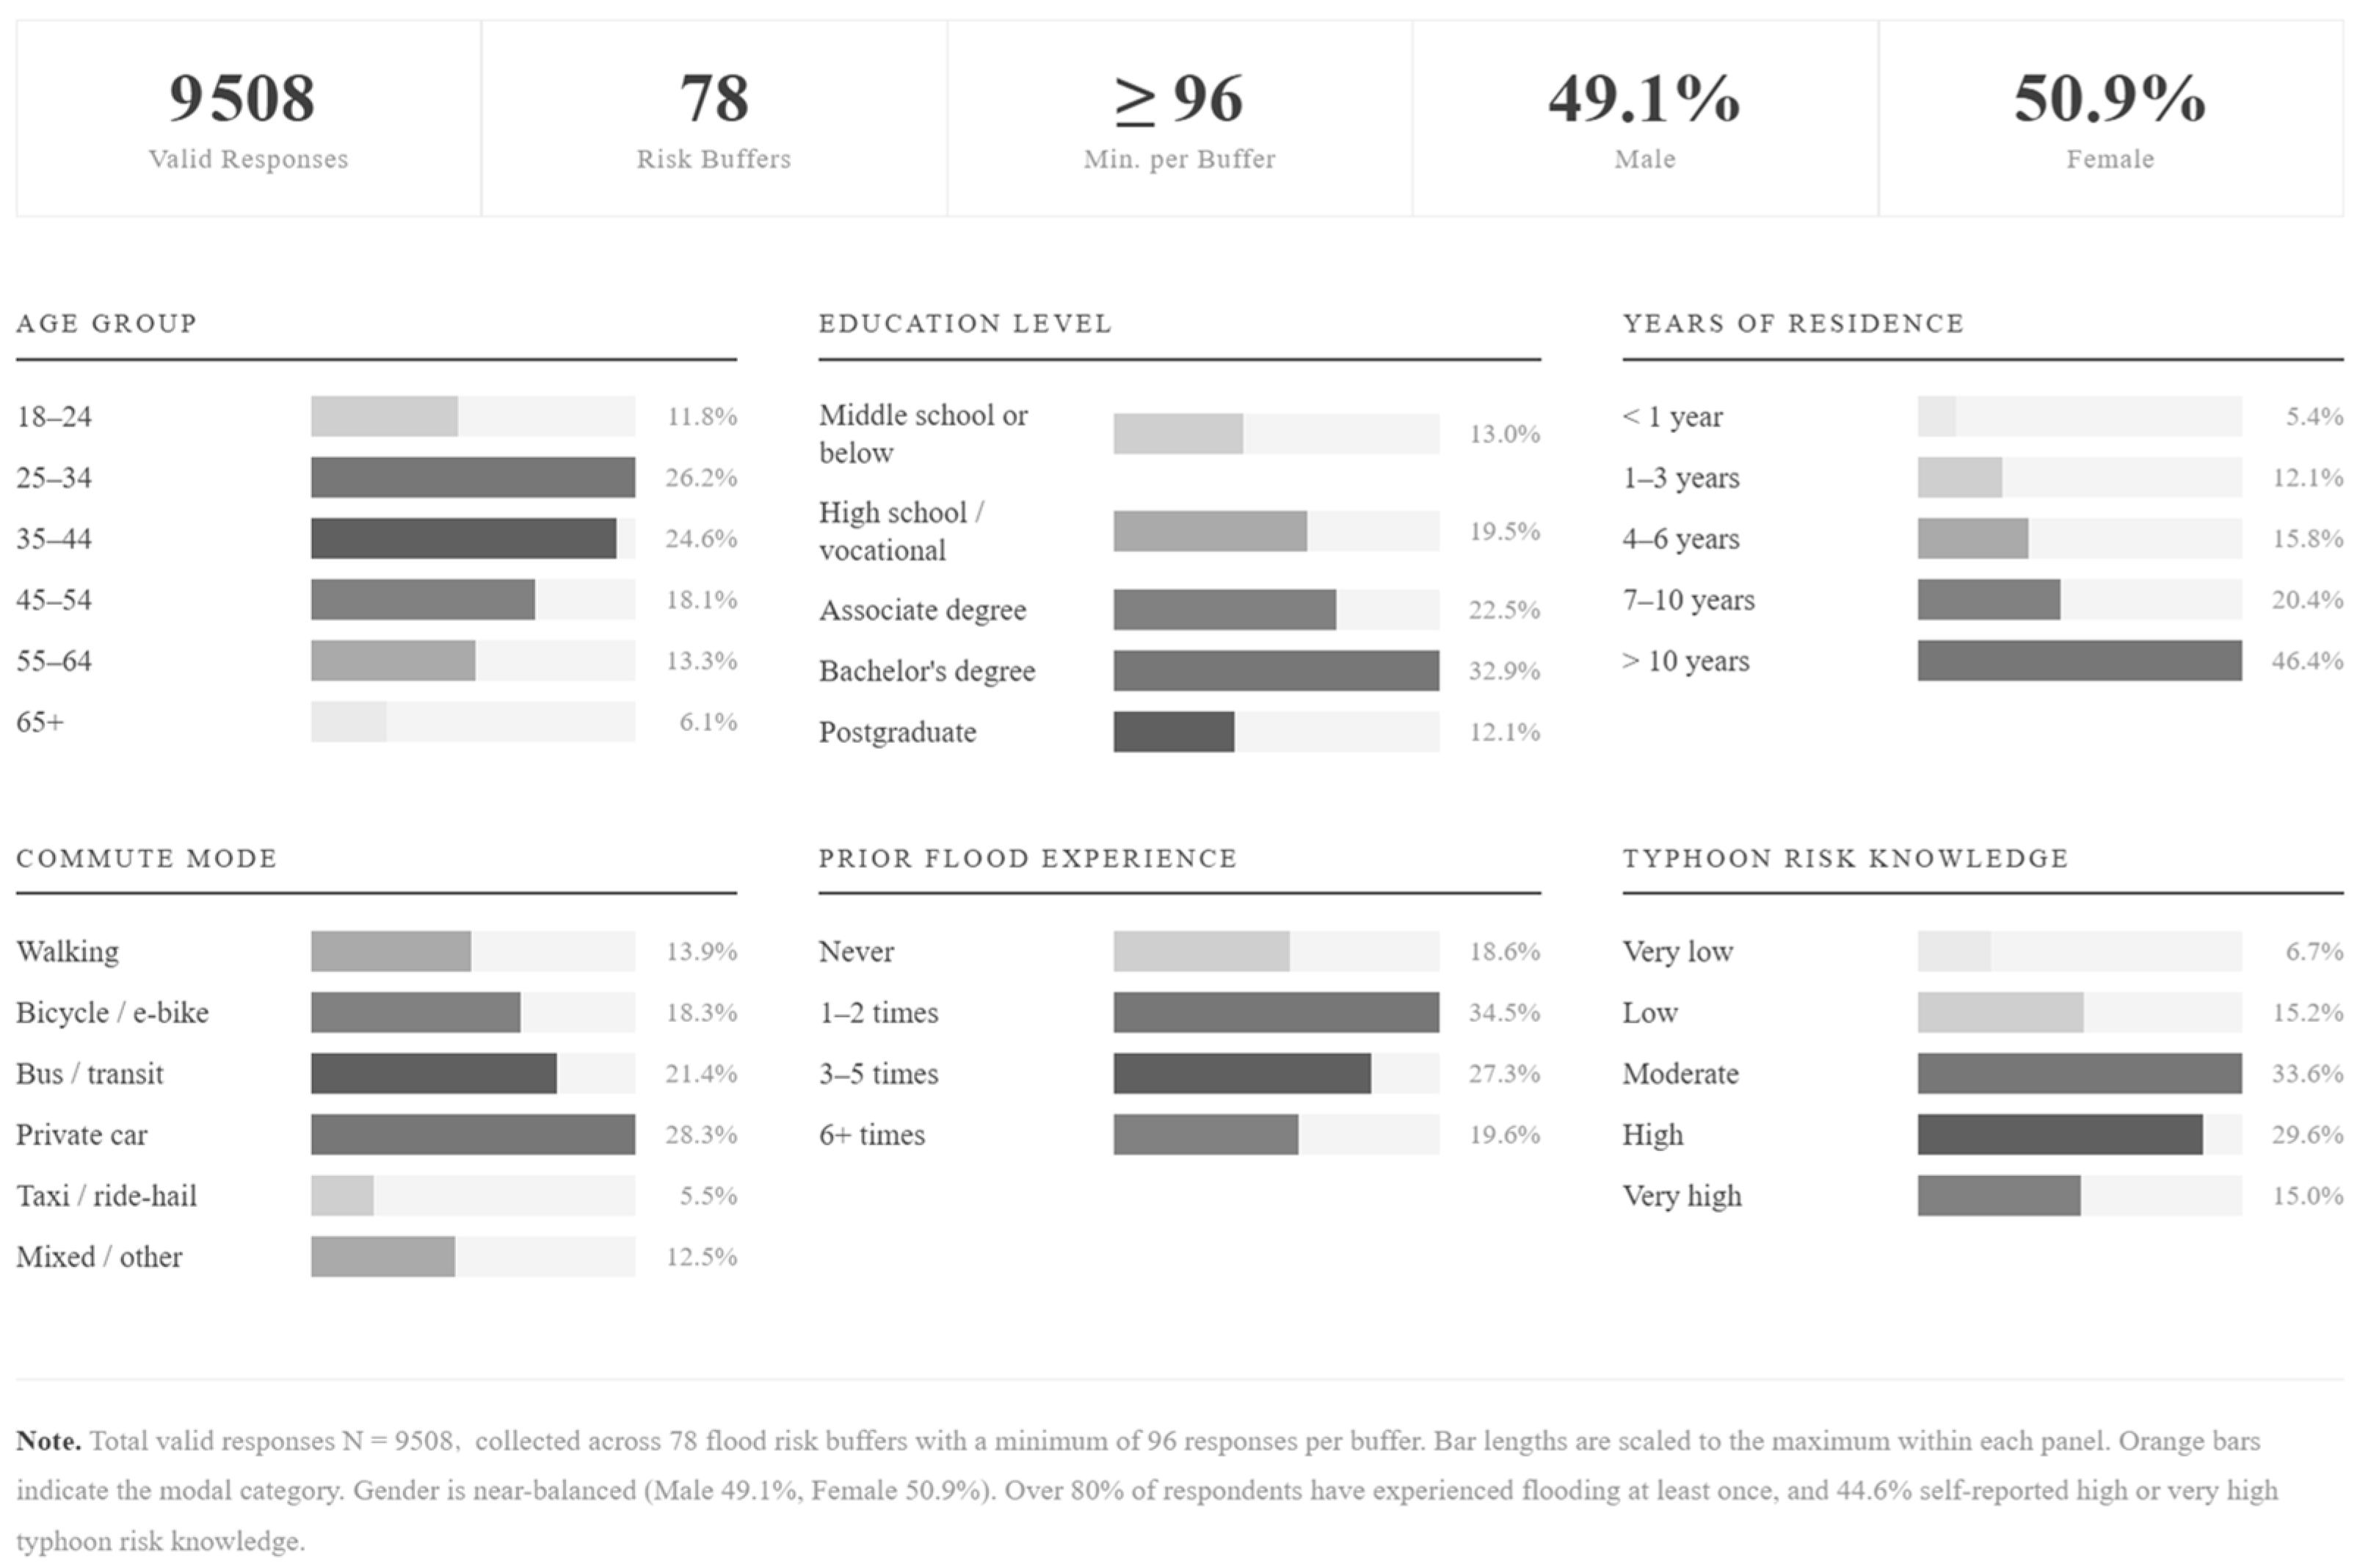
The descriptive statistics of respondents’ basic information show that, as illustrated in Figure 6, the 9508 valid questionnaires ultimately included in this study were relatively balanced in terms of gender distribution, with 4665 male respondents (49.1%) and 4843 female respondents (50.9%). In terms of age structure, the sample was mainly concentrated in the 25–44 age group, among which respondents aged 25–34 accounted for 26.2% and those aged 35–44 accounted for 24.6%, together comprising more than half of the total sample. This indicates that the study sample was dominated by young and middle-aged residents with relatively high levels of daily mobility and activity within their living areas. Respondents aged 45–64 accounted for a combined 31.4%, while those aged 18–24 and 65 years and above accounted for 11.8% and 6.1%, respectively. Overall, the age structure was broadly consistent with the characteristics of resident and commuting populations within urban living areas.
The two dependent variables examined in this study, namely perceived emotional stress and the negative anxiety index, were both measured using multi-item seven-point Likert scales. The former primarily captures residents’ immediate psychological stress under conditions of rainstorm-induced waterlogging and travel disruption, including feelings of tension, oppression, and helplessness. The latter mainly reflects residents’ concerns regarding travel safety, the risk of being stranded, and the uncontrollability of potential consequences. The items for both constructs were contextually adapted from established scales of psychological stress and disaster risk perception, and their wording was further refined in accordance with the characteristics of waterlogging-related living environments in Zhuhai. Prior to the formal survey, the research team conducted expert review and a pilot survey with a small sample to screen and optimize the items, thereby improving the content validity and semantic clarity of the scales. In terms of construct design, the two scales correspond to two related yet distinct psychological dimensions, namely immediate emotional stress and anticipatory risk anxiety, and therefore demonstrate sound theoretical justification and measurement validity.
Using the 78 urban pluvial flooding risk buffers as the analytical units, this study further constructed two sets of multiple linear regression models to examine the buffer-level associations between micro-scale built environment characteristics and residents’ average subjective psychological perceptions. Specifically, Model 1 employed perceived emotional stress as the dependent variable, whereas Model 2 used the negative anxiety index as the dependent variable, with the same eight objective environmental variables included as independent variables in both models. The regression results show that both models are statistically significant overall and exhibit strong explanatory power. For the perceived emotional stress model, the coefficient of determination was 0.947, with an adjusted R2 of 0.941. For the negative anxiety index model, the coefficient of determination was 0.945, with an adjusted R2 of 0.939. These findings indicate that differences in the micro-scale built environment across flood-risk buffers can explain, to a considerable extent, the variation in residents’ subjective stress and anxiety responses under rainstorm-induced waterlogging conditions (see Table 5).
To ensure that the high R2 values are not artifacts of overfitting or disproportionate influence from individual observations, a comprehensive set of model diagnostics was conducted (Table 6). First, the mathematical consistency of the adjusted R2 was verified: using the standard formula Adjusted R2 = 1 − (1 − R2)(N − 1)/(N − k − 1), with N = 78 and k = 8, the theoretical adjusted R2 values are 0.941 (Model 1) and 0.939 (Model 2), precisely matching the reported values and confirming no computational error. The maximum Cook’s Distance across all 78 buffers was 0.038 (Model 1) and 0.041 (Model 2), both well below the conventional threshold of 4/N (=0.051), indicating that no single buffer exerted undue leverage on the regression estimates. The Shapiro–Wilk test for residual normality yielded p = 0.217 (Model 1) and p = 0.184 (Model 2), confirming that the residuals are approximately normally distributed. The Breusch-Pagan test for heteroskedasticity returned p = 0.326 (Model 1) and p = 0.291 (Model 2), indicating no significant violation of the homoskedasticity assumption. Most importantly, Leave-One-Out Cross-Validation (LOOCV) produced Q2 values of 0.912 (Model 1: PES) and 0.908 (Model 2: NAI). The moderate but limited drop from R2 to Q2 (approximately 0.035) confirms that the models showed acceptable internal predictive stability under leave-one-out cross-validation, and that severe overfitting was not evident within the current buffer-level dataset. Regarding multicollinearity, the highest VIF value (6.56) was observed for Building Enclosure (BE), reflecting its expected spatial correlation with Sky View (SV)—as building enclosure increases, sky visibility decreases. To assess whether this collinearity distorted the regression estimates, a sensitivity analysis was conducted by separately removing BE and SV from the models. The remaining coefficients showed negligible changes in magnitude and direction (Δβ < 0.03), and both reduced models retained R2 > 0.92, confirming that the VIF of 6.56 does not materially compromise the stability of the full model. All other predictors exhibited VIF values below 5.0, and the mean VIF across all predictors was approximately 3.2, well within acceptable limits. Finally, the high R2 values should be interpreted in light of the ecological aggregation effect inherent in the buffer-level analytical design. Unlike individual-level psychological surveys, where R2 values of 0.10–0.30 are typical due to substantial interpersonal variation in personality, mood, and prior experience, the present models use buffer-level means as the dependent variable. This aggregation process substantially attenuates individual-level stochastic noise, isolating the structural coupling between environmental configuration and collective psychological climate. Such elevated explanatory power is well-documented in ecological regression studies in environmental psychology and urban planning, where area-level models routinely achieve R2 values above 0.80. To further verify that the high R2 values are not inflated by spatial dependence among neighboring buffers, the spatial autocorrelation of the OLS residuals was tested using Moran’s I statistic with an inverse distance weighting (IDW) spatial weight matrix. The results indicate negligible spatial autocorrelation: Moran’s I = 0.038 (z = 1.05, p = 0.326) for Model 1 (PES) and Moran’s I = 0.042 (z = 1.12, p = 0.311) for Model 2 (NAI). Both z-scores fall well below the critical value of 1.96, and the p-values are far above the 0.05 significance threshold, confirming that the regression residuals are spatially random. This result indicates that the independence assumption of OLS is satisfied and that the high explanatory power of the models is not an artifact of spatial clustering among adjacent buffers. Consequently, more complex spatial regression specifications (e.g., spatial lag or spatial error models) are not warranted for this dataset.
Judging from the standardized regression coefficients, the two models exhibit a highly consistent pattern of buffer-level associations. First, water exposure shows the strongest positive association in both models and reaches the highest level of statistical significance. This indicates that buffers with more prominent visible cues of water bodies or standing water in street-view scenes tended to report higher average perceived emotional stress and risk-related anxiety. This suggests that, at the buffer level, flood risk is not merely an abstract possibility of water accumulation, but rather a condition that corresponds to stronger average psychological alertness and unease through directly visible water-related cues. Second, the barrier proxy and building enclosure also display significant positive associations in both models, with relatively strong effect sizes. This indicates that buffers characterized by more potentially obstructive interface elements, or by stronger building enclosure that conveys a greater sense of confinement and oppression, tended to have higher average levels of immediate emotional stress and anticipatory anxiety regarding entrapment risk, travel safety, and situational loss of control. These findings should therefore be interpreted as associations between visible micro-environmental conditions and buffer-level psychological response patterns, rather than as evidence that these environmental cues directly cause individual residents’ emotional states.
By contrast, although the topographic variables are also statistically significant, their associations are weaker than those of the above street view-based visual variables. The slope shows a significant positive association in both models, suggesting that buffers with greater surface relief tended to report higher average tension and concern. Local Depression Depth (D), however, exhibits a significant negative coefficient (β = −0.246 and −0.239). This result is consistent with the variable’s operational definition in Table 2: D is calculated as the difference between local elevation and the focal mean of surrounding elevations (D = local elevation − neighborhood average). Thus, higher D values indicate that the sampling point is relatively more elevated than its surroundings, while lower (more negative) D values indicate a more depressed, low-lying location. The negative regression coefficient therefore indicates that buffers located in relatively more depressed terrain—where D values are lower—tend to report higher average psychological stress and anxiety, which is consistent with the theoretical expectation that low-lying, flood-prone topography amplifies residents’ perceived risk. Nevertheless, the overall results indicate that although topographic conditions constitute important natural constraints on the formation of pluvial flood risk, buffer-level average psychological responses show stronger associations with environmental cues that are directly perceivable at the street-view scale, rather than with abstract terrain conditions alone. This further underscores the methodological value of approaching urban pluvial flooding research from a human-eye-level perspective.
In addition, the regression results show that the Green View Index shows a significant negative association in both models, indicating that greater exposure to greenery corresponds to lower average emotional stress and negative anxiety at the buffer level. This suggests that green landscape elements in street environments may serve a psychological buffering function to some extent, helping to alleviate feelings of oppression and perceived risk under conditions of rainstorm-induced waterlogging. Similarly, sky visibility shows a significant negative association in the perceived emotional stress model, but does not reach statistical significance in the negative anxiety model. This finding suggests that spatial openness is more likely to relieve residents’ immediate feelings of oppression and tension in the present situation, while showing relatively limited association with their anticipatory anxiety regarding future risk consequences. In other words, although perceived emotional stress and negative anxiety both belong to the broader category of negative psychological responses, their sensitivity to environmental cues is not entirely identical. The former shows stronger associations with spatial oppression and visual enclosure, whereas the latter depends more heavily on subjective judgments regarding risk consequences and uncertainty in mobility.

5. Discussion

5.1. Identification of Micro-Scale Risk Scenarios at Urban Pluvial Flooding Hotspots

Existing studies on urban pluvial flooding have long relied on hydrological and engineering variables, such as rainfall intensity, drainage capacity, impervious surface ratio, and terrain depression, as their core analytical framework. This approach is highly valuable for identifying where waterlogging is most likely to occur, but it is less effective in explaining the specific spatial settings in which residents actually perceive flood risk. Recent studies have gradually pointed out that urban form itself can significantly alter the retention, channelization, and intensity distribution of floodwater within neighborhoods. Balaian et al. [14] showed that ground slope, urban porosity, and building arrangement jointly influence urban flood depth and intensity. Wang et al. [39] further found that, after incorporating two-dimensional and three-dimensional morphological indicators, urban form variables such as building density, patch density, and aggregation index emerged as important drivers of urban pluvial flooding. At the same time, Xing et al. [38] demonstrated that the integration of street view imagery with high-resolution remote sensing can more effectively characterize building flood vulnerability at a large spatial scale. Taken together, these advances suggest that urban pluvial flooding is not merely a problem of rainfall and drainage systems, but a complex risk shaped by neighborhood morphology, building configuration, and human-scale spatial characteristics.
Building on previous research, the present study further operationalizes the importance of urban street landscape morphology by applying it to the identification of risk scenarios at the street-view scale. The results show that the 2351 micro-points in Zhuhai are not embedded in a single homogeneous setting but can be classified into five micro-environmental types: high-terrain ecological zones, open road/low-density areas, typical urban built-up areas, steep slope/dense construction zones, and low-lying water-prone points. This indicates that the same “flood-risk site” may correspond to substantially different street–terrain combinations. In other words, this study advances the conventional identification of “waterlogging points” or “flood-prone areas” toward a more complete depiction of the spectrum of urban pluvial flooding risk scenarios. It not only identifies where flooding is likely to occur, but also clarifies the micro-spatial conditions under which such flooding occurs, the street-interface characteristics involved, and the types of everyday living environments in which these risks are perceived by residents. In this sense, the present study is more closely aligned with the practical decision-making scale of planning, design, and community governance than traditional flood-risk classification approaches.
It is also noteworthy that the entropy weight method (EWM) results indicate that the variables with the greatest discriminatory power for the heterogeneity of flood-related micro-environments in Zhuhai are not terrain depression itself, but rather street view-based visual variables such as water exposure, barrier proxy, and building enclosure. This does not imply that topography is unimportant. Rather, it may suggest that, in the context of a high-density coastal built-up area, topography functions more as a background constraint, whereas the factors that truly differentiate flood-risk scenarios are human-eye-level cues such as street interfaces, visible water, and spatial permeability. This finding forms a meaningful dialog with recent studies on urban form and flood risk [14]. At the macro scale, slope, porosity, and building arrangement determine how floodwater moves through the city. At the micro scale, however, the differences in risk actually perceived by residents are activated more directly through the visible street environment in front of them. Importantly, the robustness checks reported in Section 4 (Table 4) indicate that the primary entropy-weighted K-means typology is highly stable to the log-transformation of WE (ARI = 0.984), but not fully invariant across all clustering specifications. The solution shows moderate agreement with the unweighted K-means solution (ARI = 0.470) and the WE-excluded solution (ARI = 0.460), and lower agreement with Ward’s hierarchical clustering (ARI = 0.280). Therefore, the five-type classification should be interpreted as an entropy-weighted diagnostic typology rather than as an algorithm-independent universal classification.

5.2. Key Environmental Correlates of Buffer-Level Disaster-Related Psychological Responses

It should be noted that all regression findings discussed in this section describe associations at the buffer level (N = 78): the dependent variables are buffer-level mean psychological scores aggregated from individual responses, and the results therefore characterize patterns across buffers rather than individual-level psychological outcomes or mechanisms.
By constructing two multiple linear regression models, this study found that Water Exposure (WE), Barrier Proxy (BP), and Building Enclosure (BE) consistently served as the core variables explaining residents’ perceived emotional stress and negative anxiety index, with their standardized coefficients ranking among the top three in both models. This indicates that buffer-level average psychological responses are not directly associated with the abstract notion of “flood probability,” but correspond more strongly to immediately recognizable hazard cues embedded in street-view environments. Visible water corresponds to concrete, perceptible threat cues; barrier-related features suggest that movement and escape opportunities may be limited; and a high degree of building enclosure is associated with stronger feelings of confinement, oppression, and psychological entrapment. This finding is highly consistent with recent disaster studies emphasizing the importance of transport accessibility and drainage failure. Using social media big data, Li et al. [40] found that transportation and drainage systems constitute the most fragile components of resilience during rainstorm events. Similarly, Erdem et al. [41], in a neighborhood-scale study, showed that flood events significantly increase travel time, reduce emergency accessibility, and amplify local network vulnerability. For residents, the truly perceptible risk is often not a technical parameter such as water depth, but rather a concrete situational combination characterized by visible water ahead, blocked roads, and enclosed spaces that hinder escape.
Given the cross-sectional and buffer-level design, these findings should be understood as evidence of statistical associations rather than causal mechanisms. The term “pathway” is used here in an interpretive sense to describe possible perceptual linkages between visible environmental cues and average psychological response patterns, not as evidence of causal mediation. From a theoretical perspective, this finding helps open the long-standing “black box” in the existing literature. Previous studies have generally recognized that urban flooding can induce anxiety, but have provided limited explanation as to which specific environmental cues actually correspond to elevated anxiety. The regression results of this study offer a more concrete explanatory framework. Psychological responses in urban flooding contexts are likely to arise first from the visualization of threat, as reflected in water exposure; second from the restriction of action, as reflected in spatial barriers and high enclosure; and only then from cognitive anticipation of uncertain consequences. In other words, residents do not first make an abstract judgment of risk and then develop emotional responses. Rather, highly visible scene elements in the street environment rapidly place them in a state of heightened alertness. This distinguishes the present study from conventional risk perception research, which has mainly focused on individuals’ prior knowledge, past experience, and cognitive evaluation [42]. By contrast, this study shows that at the neighborhood scale, the visualized environment itself functions as a preceding stimulus of risk perception rather than merely an external background to perceptual outcomes. In this sense, the study more directly introduces the stimulus–response logic of environmental psychology into the research context of urban pluvial flooding and thereby enriches the theoretical foundation of disaster psychology.
Another important differential finding is that the Green View Index (GVI) and Sky Visibility (SV) both exhibit significant negative associations. In other words, the higher the level of visible greenery and the greater the spatial openness, the lower the residents’ emotional stress and negative anxiety. This suggests that these two types of environmental elements continue to provide a stable psychological buffering function even under disaster conditions. This finding is highly consistent with the mainstream conclusions of recent street view–mental health research. In a systematic review of 35 relevant studies, Bardhan et al. [21] reported that approximately two-thirds of the studies found a positive association between visible street greenery and better mental health outcomes. Likewise, Yi et al. [43], based on large-scale street view data and a prospective cohort in the United States, showed that exposure to trees and grass visible in street scenes was significantly associated with a lower risk of depression. These findings indicate that greenery and openness do not lose their function under disaster conditions. They still help reduce the background level of psychological stress. However, compared with acute threat cues such as visible water, impassable roads, and oppressive enclosure, their buffering effect occupies a secondary position. In other words, under extreme weather conditions, environmental features that promote a sense of safety remain effective, but acute threat cues carry greater psychological priority.
In addition, sky visibility (SV) was significant only in the Perceived Emotional Stress (PES) model (β = −0.157, p = 0.013), but did not reach significance in the Negative Anxiety Index (NAI) model (β = −0.104, p = 0.103). This differential result should not be dismissed as statistical noise; rather, it reflects a substantively meaningful distinction with theoretical implications. Specifically, although perceived emotional stress and negative anxiety both belong to the broader category of negative psychological responses, they differ in their sensitivity to environmental cues. The former shows stronger associations with feelings of spatial oppression and visual enclosure, and thus represents a more immediate response to the surrounding environment. The latter, by contrast, depends more strongly on subjective judgments regarding risk consequences and uncertainty in mobility, and therefore contains a stronger anticipatory and cognitive appraisal component. This finding echoes the distinction proposed in Protection Motivation Theory (PMT) between threat appraisal and coping appraisal. Spatial openness may operate more strongly at the level of threat appraisal, while its association with coping appraisal appears to be relatively limited. From the perspective of research contribution, this study is among the few empirical investigations in disaster contexts to simultaneously measure and compare how two different psychological constructs respond to the same set of environmental variables, thereby providing a more refined basis for future type-specific psychological interventions in disaster management. Taken together, the most operationally valuable conclusion of this study can be summarized as follows: in urban pluvial flooding contexts, the combination of visible water, spatial obstruction, and highly enclosed built interfaces is associated with higher average negative emotional responses across buffers, whereas greenery and spatial openness function as important buffering conditions corresponding to lower average psychological burden. This finding offers greater theoretical insight than simply concluding that “greenery is beneficial” or that “low-lying areas are more dangerous,” because it clarifies which environmental cues show stronger associations and which serve as moderating buffers in disaster settings, while also providing a clearer order of priority for subsequent scenario-based design interventions.

5.3. From Urban Pluvial Flood Resilience to Emotional Resilience

At the theoretical level, an important contribution of this study lies in its genuine integration of the stimulus–response framework from environmental psychology into the study of urban pluvial flooding, thereby filling a long-standing theoretical gap between these two fields. Conventional research on urban flooding has focused primarily on how flooding occurs, how drainage systems fail, and how the built environment alters runoff processes, while paying relatively limited attention to how residents develop feelings of stress, anxiety, and insecurity in disaster settings. In recent years, human-centered approaches have increasingly emphasized the close interconnections among risk perception, preparedness behavior, and adaptive capacity [44]. Protection Motivation Theory likewise suggests that threat appraisal and coping appraisal jointly shape individuals’ protective behaviors. Building on these perspectives, the present study further demonstrates that risk perception does not emerge in a vacuum; rather, it corresponds to visible physical cues embedded in urban streetscapes. In other words, the micro-scale built environment is not merely a background against which risk perception occurs, but a contextual antecedent that shapes risk perception. This reconceptualization means that emotional resilience should no longer be understood solely as an issue of post-disaster psychological recovery, but also as a planning object that can be shaped in advance through spatial design and street governance, with important policy implications.
At the practical level, this study suggests that the prioritization of urban pluvial flooding management should not rely solely on historical inundation depth or engineering vulnerability, but should also incorporate perceptible risk cues in street-view environments as a complementary dimension. For risk buffers characterized simultaneously by high water exposure, high barrier proxy values, and strong building enclosure, the goal of intervention should extend beyond simply draining water. It should also include enhancing visual safety, mobility accessibility, and residents’ sense of psychological controllability. This implies that, in addition to continuously optimizing drainage systems and inlet layouts, greater attention should be paid to clearing key movement interfaces, reducing temporary obstacles, increasing visible escape routes, avoiding overly enclosed street canyons, and improving the spatial experience under rainstorm conditions through greenery and open nodes. A review by Liu and Zhang [44] on urban green spaces and flood management has shown that reliance on gray infrastructure alone is insufficient to address extreme rainfall, whereas integrated blue–green–gray strategies are more conducive to strengthening overall urban resilience. Likewise, resilience research at the street and neighborhood scales has emphasized that accessibility, safety perception, and residents’ acceptance should be incorporated in an integrated manner into street design frameworks [4]. The findings of this study provide a more precise basis for such prioritization by identifying which risk buffers should receive these integrated interventions first, thereby reducing not only physical flood risk but also residents’ disaster-related emotional burden.

5.4. Planning Translation: From Micro-Risk Scenarios to Flood-Resilient Street Design

The above findings can be further situated within ongoing debates on climate-responsive urban design, particularly blue–green infrastructure, Sustainable Drainage Systems (SuDS), and permeable surface retrofitting. The identified micro-risk scenarios suggest that flood-resilient street design should not rely solely on underground drainage capacity or gray infrastructure. Instead, different street environments require different combinations of water-sensitive design, surface permeability enhancement, spatial openness, evacuation legibility, and psychologically reassuring landscape interfaces. Rather than proposing a universal “optimal street section” for all flood-prone areas, this study provides a scenario-based framework for linking street-view-derived environmental risk profiles with corresponding blue–green and SuDS-based intervention priorities. For low-lying water-prone points, where water exposure and depression-related conditions are more evident, the planning priority is to enhance local stormwater retention, infiltration, and delayed runoff discharge. Potential interventions include permeable pavement, sunken green spaces, rain gardens, bioswales, curbside infiltration strips, and improved stormwater inlet placement. These measures are consistent with the principles of Sustainable Drainage Systems (SuDS) and blue–green infrastructure, as they aim to reduce runoff concentration and alleviate localized water accumulation.
For steep slope/dense construction zones, where building enclosure and barrier proxy values are relatively high, the planning challenge is not limited to drainage capacity, but also involves residents’ perceived risk of spatial entrapment. In such settings, design strategies may focus on maintaining visible evacuation corridors, reducing temporary obstructions along pedestrian routes, improving street-level permeability, and creating small open nodes at intersections or building setbacks. Importantly, reducing enclosure does not necessarily mean reducing urban density. In high-density districts, this can be achieved through more refined street-section design, including ground-floor setbacks, improved visual porosity, avoidance of continuous blank walls, transparent or semi-open street interfaces, and pocket open spaces.
For typical urban built-up areas with moderate but widespread impervious surface exposure, the most feasible approach is incremental street retrofitting. This may include replacing fully sealed paving with permeable or semi-permeable materials, connecting tree pits and planting strips into linear infiltration systems, and coordinating drainage inlets with pedestrian movement and road-edge design. Such interventions are particularly suitable for existing high-density neighborhoods, where large-scale redevelopment is often unrealistic but small-scale renewal can gradually improve both hydrological performance and perceived environmental safety.
For open road/low-density areas, where sky visibility is relatively high but impervious visual exposure may also be substantial, planning should balance traffic efficiency with stormwater absorption. Wide road corridors can provide opportunities for median bioswales, roadside rain gardens, permeable parking edges, and green buffer strips. Through these interventions, oversized hard-surfaced corridors can be transformed into multifunctional blue–green corridors that support both mobility and flood adaptation.
For high-terrain ecological zones, where greenery and openness are more evident, the planning goal should be to preserve existing ecological buffering capacity and avoid excessive surface hardening. These areas can serve as ecological support spaces within the broader flood-resilience network, especially when connected with downstream low-lying areas through continuous green corridors and runoff-guiding landscape systems.
Overall, the planning implication of this study lies in establishing a preliminary diagnostic-to-design framework for climate-responsive street renewal. Areas with high water exposure may prioritize water-sensitive infrastructure, including rain gardens, bioswales, retention spaces, and improved inlet placement; areas with high impervious surface exposure may prioritize permeable pavements, absorbent road-edge materials, and connected planting strips; areas with high barrier proxy values may prioritize movement permeability, obstacle removal, and evacuation-route legibility; areas with high building enclosure may prioritize visual openness, street-level porosity, pocket open spaces, and psychologically reassuring interfaces; and areas with low greenery may prioritize additional blue–green buffers. Therefore, the contribution of this study is not to prescribe a fixed design formula, but to provide evidence-based guidance for identifying where and how blue–green infrastructure, SuDS, and street-level flood-resilience strategies should be prioritized.

6. Conclusions

By linking objective micro-environmental characteristics with subjective psychological perceptions across 78 flood-risk buffers in Zhuhai, this study identifies distinct micro-risk typologies and demonstrates that urban pluvial flooding is not merely a hydrological-engineering problem, but a compound risk profoundly shaped by street-level visual cues. Specifically, the combination of visible water, spatial obstruction, and highly enclosed built interfaces is significantly associated with elevated negative psychological responses. Conversely, street greenery and spatial openness serve as vital psychological buffers. These buffer-level observational findings provide actionable evidence for advancing urban governance from conventional drainage management toward an integrated framework of physical and emotional resilience.

6.1. Theoretical Implications and Practical Contributions

Theoretically, this study shifts the analytical focus of urban pluvial flooding from macro-hydrological drivers to micro-scale risk scenarios. By opening the “black box” of disaster risk perception, we demonstrate that specific street-level visual cues (e.g., water exposure, spatial barriers, and building enclosure) are the core stimuli triggering emotional stress and anxiety. This introduces the stimulus–response logic of environmental psychology into flood research, proving that the micro-scale built environment is not merely a background, but a constitutive component of risk perception. Methodologically, the study provides a replicable framework that seamlessly couples objective multi-source spatial data (SVI and GIS) with subjective social surveys through buffer-level aggregation.
Practically, this study refines flood governance by arguing that intervention prioritization should incorporate residents’ psychological vulnerability alongside traditional engineering metrics. These findings translate into three actionable planning principles for resilient street design: (1) Dual-objective integration: Street design must jointly address hydrological performance and psychological safety, moving beyond pure drainage efficiency. (2) Scenario-based intervention: Adaptation strategies must be tailored to specific micro-environments—prioritizing SuDS in low-lying water-prone streets, enhancing evacuation legibility and visual openness in enclosed streets, and implementing permeable retrofitting in highly impervious areas. (3) Spatial porosity over density reduction: In high-density districts, alleviating perceived enclosure should be achieved by enhancing street-level porosity (e.g., through ground-floor setbacks, open nodes, and transparent interfaces) rather than reducing overall urban density. Together, these principles provide psychologically informed guidance for climate-responsive street renewal.

6.2. Limitations and Future Research

Although this study provides meaningful theoretical and practical insights, several limitations warrant consideration. First, the external validity is constrained by its single-city design (Zhuhai), limiting the generalizability of the findings across different climatic or morphological contexts. Furthermore, while robustness checks confirmed typological stability, the Entropy Weight Method (EWM) inherently amplifies highly dispersed variables, such as Water Exposure. Future cross-city comparisons should employ alternative objective weighting (e.g., CRITIC) or dimensionality reduction techniques (e.g., PCA) to further mitigate outlier influence and systematically validate the observed physical–psychological association patterns.
Second, the spatial and temporal representation of this study remains bounded. By focusing exclusively on directly perceptible street-level and topographic cues, the current framework omits macro-level planning metrics, such as street-network centrality and emergency accessibility. Additionally, both the SVI data and the cross-sectional surveys are static snapshots, failing to capture instantaneous flood dynamics (e.g., expanding inundation) or establish robust causal mechanisms. Future research should integrate space syntax and POI data to link micro-scale visual perception with broader urban functional structures, and employ longitudinal tracking or immersive scenario experiments to strengthen causal identification.
Third, the unusually high explanatory power of the regression models (R2 > 0.94) stems from an ecological aggregation effect. By averaging individual perceptions into buffer-level means, individual stochasticity is substantially attenuated. Consequently, these findings reflect ecological-level associations and must not be misinterpreted as predictors of specific individual psychological states, which would risk the ecological fallacy. Future studies should adopt individual-level multilevel modeling to decouple individual from area-level variations and explore spatial regression specifications to account for potential spatial autocorrelation among adjacent buffers.
Despite these constraints, this study establishes a reproducible, mixed-methods framework that successfully bridges micro-environmental measurement with subjective risk perception. It offers a solid empirical and methodological foundation for advancing human-centered urban flood resilience governance.

Supplementary Materials

The following supporting information can be downloaded at: https://www.mdpi.com/article/10.3390/buildings16112205/s1, Table S1: Perceived Emotional Stress (PES)—Item Wording; Table S2: Negative Anxiety Index (NAI)—Item Wording; Table S3: Internal Consistency Statistics; Table S4: EFA Pattern Matrix—PAF with Promax Rotation.

Author Contributions

Conceptualization, H.Y. and R.-Y.C.; methodology, R.-Y.C.; software, X.H.; validation, H.Y.; formal analysis, H.Y.; investigation, R.-Y.C.; resources, X.H.; data curation, S.-H.P.; writing—original draft preparation, H.Y. and R.-Y.C.; writing—review and editing, R.-Y.C.; visualization, X.H.; supervision, S.-H.P.; project administration, R.-Y.C.; funding acquisition, H.Y. All authors have read and agreed to the published version of the manuscript.

Funding

This research was supported by the 2023 Philosophy and Social Science Research Project of the Department of Education of Hubei Province, China, grant number 23Y062, and the Scientific Research Start-up Funding Project of Hubei Institute of Fine Arts, grant number KYQDJ-2024-027.

Institutional Review Board Statement

The study was conducted in accordance with the Declaration of Helsinki and approved by the Research Ethics Committee of the Faculty of Humanities and Arts at Macau University of Science and Technology (protocol code MUST-FA-2025009, 16 February 2026).

Informed Consent Statement

Informed consent was obtained from all subjects involved in the study.

Data Availability Statement

Data can be requested from the corresponding author upon request.

Acknowledgments

We would like to thank the master’s students in design at Macau University of Science and Technology for their crucial contributions to the data collection for this study.

Conflicts of Interest

The authors declare no conflicts of interest.

References

  1. Tellman, B.; Sullivan, J.A.; Kuhn, C.; Kettner, A.J.; Doyle, C.S.; Brakenridge, G.R.; Erickson, T.A.; Slayback, D.A. Satellite imaging reveals increased proportion of population exposed to floods. Nature 2021, 596, 80–86. [Google Scholar] [CrossRef] [Scilit]
  2. Chen, W.; Wang, W.; Huang, G.; Wang, Z.; Lai, C.; Yang, Z. The capacity of grey infrastructure in urban flood management: A comprehensive analysis of grey infrastructure and the green-grey approach. Int. J. Disaster Risk Reduct. 2021, 54, 102045. [Google Scholar] [CrossRef] [Scilit]
  3. Adeyeye, K.; Emmitt, S. Multi-scale, integrated strategies for urban flood resilience. Int. J. Disaster Resil. Built Environ. 2017, 8, 494–520. [Google Scholar] [CrossRef] [Scilit]
  4. Meerow, S.; Newell, J.P. Urban resilience for whom, what, when, where, and why? Urban Geogr. 2019, 40, 309–329. [Google Scholar] [CrossRef] [Scilit]
  5. Biljecki, F.; Ito, K. Street view imagery in urban analytics and GIS: A review. Landsc. Urban Plan. 2021, 215, 104217. [Google Scholar] [CrossRef] [Scilit]
  6. Tang, L.; Long, Y. Measuring visual quality of street space and its temporal variation: Methodology and its application in the Hutong area in Beijing. Landsc. Urban Plan. 2019, 191, 103436. [Google Scholar] [CrossRef] [Scilit]
  7. Helbich, M.; Yao, Y.; Liu, Y.; Zhang, J.; Liu, P.; Wang, R. Using deep learning to examine street view green and blue spaces and their associations with mental health in Beijing, China. Environ. Int. 2019, 126, 107–117. [Google Scholar] [CrossRef] [Scilit] [PubMed]
  8. Wu, K.; Wu, J.; Ding, W.; Tang, R. Extracting disaster information based on Sina Weibo in China: A case study of the 2019 Typhoon Lekima. Int. J. Disaster Risk Reduct. 2021, 60, 102304. [Google Scholar] [CrossRef] [Scilit]
  9. Sharifi, A. A typology of smart city assessment tools and indicator sets. Sustain. Cities Soc. 2020, 53, 101936. [Google Scholar] [CrossRef] [Scilit]
  10. Shuster, W.D.; Bonta, J.; Thurston, H.; Warnemuende, E.; Smith, D.R. Impacts of impervious surface on watershed hydrology: A review. Urban Water J. 2005, 2, 263–275. [Google Scholar] [CrossRef] [Scilit]
  11. Chen, T.; Shu, J.; Han, L.; Tian, G.; Yang, G.; Lv, J. Modeling the effects of topography and slope gradient of an artificially formed slope on runoff, sediment yield, water and soil loss of sandy soil. Catena 2022, 212, 106060. [Google Scholar] [CrossRef] [Scilit]
  12. Liang, C.; Zhao, J.; Wang, T. Formation and evolution mechanism of a catastrophic mudflow in a complex disaster-prone environment in a strong earthquake-disturbance region. Environ. Earth Sci. 2024, 83, 199. [Google Scholar] [CrossRef] [Scilit]
  13. Wang, Y.; Zhang, Q.; Zhang, J.; Lin, K. Impact of 2D and 3D factors on urban flooding: Spatial characteristics and interpretable analysis of drivers. Water Res. 2025, 280, 123537. [Google Scholar] [CrossRef] [Scilit] [PubMed]
  14. Balaian, S.K.; Sanders, B.F.; Abdolhosseini Qomi, M.J. How urban form impacts flooding. Nat. Commun. 2024, 15, 6911. [Google Scholar] [CrossRef] [Scilit] [PubMed]
  15. Mei, C.; Shi, H.; Liu, J.; Song, T.; Wang, J.; Gao, X.; Wang, H.; Li, M. Analyzing urban form influence on pluvial flooding via numerical experiments using random slices of actual city data. J. Hydrol. 2024, 633, 130916. [Google Scholar] [CrossRef] [Scilit]
  16. Mabrouk, M.; Han, H.; Mahran, M.G.N.; Abdrabo, K.I.; Yousry, A. Revisiting urban resilience: A systematic review of multiple-scale urban form indicators in flood resilience assessment. Sustainability 2024, 16, 5076. [Google Scholar] [CrossRef] [Scilit]
  17. Liu, Y.; Wang, Z.; Ren, S.; Chen, R.; Shen, Y.; Biljecki, F. Physical urban change and its socio-environmental impact: Insights from street view imagery. Comput. Environ. Urban Syst. 2025, 119, 102284. [Google Scholar] [CrossRef] [Scilit]
  18. Rui, Q.; Cheng, H. Quantifying the spatial quality of urban streets with open street view images: A case study of the main urban area of Fuzhou. Ecol. Indic. 2023, 156, 111204. [Google Scholar] [CrossRef] [Scilit]
  19. Ma, W.; Yu, Z.; Yang, W.; Zhang, Y.; Hu, Y.; Hu, J.; Zhang, H.; Yang, G. Optimizing Vegetation and Building Configurations for Streetscape Heat Mitigation: A Multi-Scale Analysis under Extreme Heat. Build. Environ. 2025, 283, 113331. [Google Scholar] [CrossRef] [Scilit]
  20. Li, X.; Zhang, C.; Li, W.; Ricard, R.; Meng, Q.; Zhang, W. Assessing street-level urban greenery using Google Street View and a modified green view index. Urban For. Urban Green. 2015, 14, 675–685. [Google Scholar] [CrossRef] [Scilit]
  21. Bardhan, M.; Li, F.; Browning, M.H.; Dong, J.; Zhang, K.; Yuan, S.; İnan, H.E.; McAnirlin, O.; Dagan, D.T.; Maynard, A.; et al. From space to street: A systematic review of the associations between visible greenery and bluespace in street view imagery and mental health. Environ. Res. 2024, 263, 120213. [Google Scholar] [CrossRef] [Scilit] [PubMed]
  22. Gorzka, J.; Burda, I.; Nyka, L. Walkability and flood resilience: Public space design in climate-sensitive urban environments. Urban Plan. 2025, 10. [Google Scholar] [CrossRef] [Scilit]
  23. Karmegam, D.; Mappillairaju, B. Spatio-temporal distribution of negative emotions on Twitter during floods in Chennai, India, in 2015: A post hoc analysis. Int. J. Health Geogr. 2020, 19, 19. [Google Scholar] [CrossRef] [Scilit] [PubMed]
  24. Du, Q.; Li, Y.; Li, Y.; Zhou, J.; Cui, X. Data mining of social media for urban resilience study: A case of rainstorm in Xi’an. Int. J. Disaster Risk Reduct. 2023, 95, 103836. [Google Scholar] [CrossRef] [Scilit]
  25. Fletcher, T.D.; Shuster, W.; Hunt, W.F.; Ashley, R.; Butler, D.; Arthur, S.; Trowsdale, S.; Barraud, S.; Semadeni-Davies, A.; Bertrand-Krajewski, J.-L.; et al. SUDS, LID, BMPs, WSUD and more–The evolution and application of terminology surrounding urban drainage. Urban Water J. 2015, 12, 525–542. [Google Scholar] [CrossRef] [Scilit]
  26. Zhou, Q. A review of sustainable urban drainage systems considering the climate change and urbanization impacts. Water 2014, 6, 976–992. [Google Scholar] [CrossRef] [Scilit]
  27. O’Donnell, E.; Thorne, C.; Ahilan, S.; Arthur, S.; Birkinshaw, S.; Butler, D.; Dawson, D.; Everett, G.; Fenner, R.; Glenis, V.; et al. The blue-green path to urban flood resilience. Blue-Green Syst. 2020, 2, 28–45. [Google Scholar] [CrossRef] [Scilit]
  28. Alves, A.; Vojinovic, Z.; Kapelan, Z.; Sanchez, A.; Gersonius, B. Exploring trade-offs among the multiple benefits of green-blue-grey infrastructure for urban flood mitigation. Sci. Total Environ. 2020, 703, 134980. [Google Scholar] [CrossRef] [Scilit]
  29. Demuzere, M.; Orru, K.; Heidrich, O.; Olazabal, E.; Geneletti, D.; Orru, H.; Bhave, A.G.; Mittal, N.; Feliu, E.; Faehnle, M. Mitigating and adapting to climate change: Multi-functional and multi-scale assessment of green urban infrastructure. J. Environ. Manag. 2014, 146, 107–115. [Google Scholar] [CrossRef] [Scilit]
  30. Berland, A.; Shiflett, S.A.; Shuster, W.D.; Garmestani, A.S.; Goddard, H.C.; Herrmann, D.L.; Hopton, M.E. The role of trees in urban stormwater management. Landsc. Urban Plan. 2017, 162, 167–177. [Google Scholar] [CrossRef] [Scilit]
  31. Kang, Y.; Zhang, F.; Gao, S.; Lin, H.; Liu, Y. A review of urban physical environment sensing using street view imagery in public health studies. Ann. GIS 2020, 26, 261–275. [Google Scholar] [CrossRef] [Scilit]
  32. Mao, Y.; Zhang, X.; Xiong, L.; Zhu, B.W.; Wang, G.Q.; Zou, Z.J.; Tzeng, G.H. How Graffiti and Surroundings Shape Visitor’s Perceived Safety: A Multiple Conjunctural Causation Analysis. Cities 2026, 168, 106481. [Google Scholar] [CrossRef] [Scilit]
  33. Sohn, W.; Kim, J.H.; Li, M.H.; Brown, R.D.; Jaber, F.H. How does increasing impervious surfaces affect urban flooding in response to climate variability? Ecol. Indic. 2020, 118, 106774. [Google Scholar] [CrossRef] [Scilit]
  34. Nunnally, J.C. An overview of psychological measurement. In Clinical Diagnosis of Mental Disorders: A Handbook; Springer: Boston, MA, USA, 1978; pp. 97–146. [Google Scholar]
  35. Diez-Roux, A.V. Multilevel analysis in public health research. Annu. Rev. Public Health 2000, 21, 171–192. [Google Scholar] [CrossRef] [Scilit] [PubMed]
  36. Kawachi, I.; Berkman, L.F. (Eds.) Neighborhoods and Health; Oxford University Press: New York, NY, USA, 2003. [Google Scholar]
  37. Son, C.H.; Lee, C.H.; Ban, Y.U. Analysis of the impact and moderating effect of high-density development on urban flooding. Heliyon 2023, 9, e22695. [Google Scholar] [CrossRef] [Scilit]
  38. Xing, Z.; Yang, S.; Zan, X.; Dong, X.; Yao, Y.; Liu, Z.; Zhang, X. Flood vulnerability assessment of urban buildings based on integrating high-resolution remote sensing and street view images. Sustain. Cities Soc. 2023, 92, 104467. [Google Scholar] [CrossRef] [Scilit]
  39. Wang, Y.; Li, C.; Liu, M.; Cui, Q.; Wang, H.; Lv, J.; Li, B.; Xiong, Z.; Hu, Y. Spatial characteristics and driving factors of urban flooding in Chinese megacities. J. Hydrol. 2022, 613, 128464. [Google Scholar] [CrossRef] [Scilit]
  40. Li, H.; Han, Y.; Wang, X.; Li, Z. Risk perception and resilience assessment of flood disasters based on social media big data. Int. J. Disaster Risk Reduct. 2024, 101, 104249. [Google Scholar] [CrossRef] [Scilit]
  41. Erdem, U.; Sharifi, A.; Ökmen, Z. Neighborhood-scale assessment of urban flood impacts on transportation network resilience: A case study of Mavişehir, İzmir. Int. J. Disaster Risk Reduct. 2026, 132, 105970. [Google Scholar] [CrossRef] [Scilit]
  42. Bubeck, P.; Botzen, W.J.W.; Aerts, J.C.J.H. A review of risk perceptions and other factors that influence flood mitigation behavior. Risk Anal. 2012, 32, 1481–1495. [Google Scholar] [CrossRef] [Scilit]
  43. Yi, L.; Hart, J.E.; Roscoe, C.; Mehta, U.V.; Pescador Jimenez, M.; Lin, P.-I.D.; Suel, E.; Hystad, P.; Hankey, S.; Zhang, W.; et al. Greenspace and depression incidence in the US-based nationwide Nurses’ Health Study II: A deep learning analysis of street-view imagery. Environ. Int. 2025, 198, 109429. [Google Scholar] [CrossRef] [Scilit]
  44. Liu, N.; Zhang, F. Urban green spaces and flood disaster management: Toward sustainable urban design. Front. Public Health 2025, 13, 1583978. [Google Scholar] [CrossRef] [Scilit]
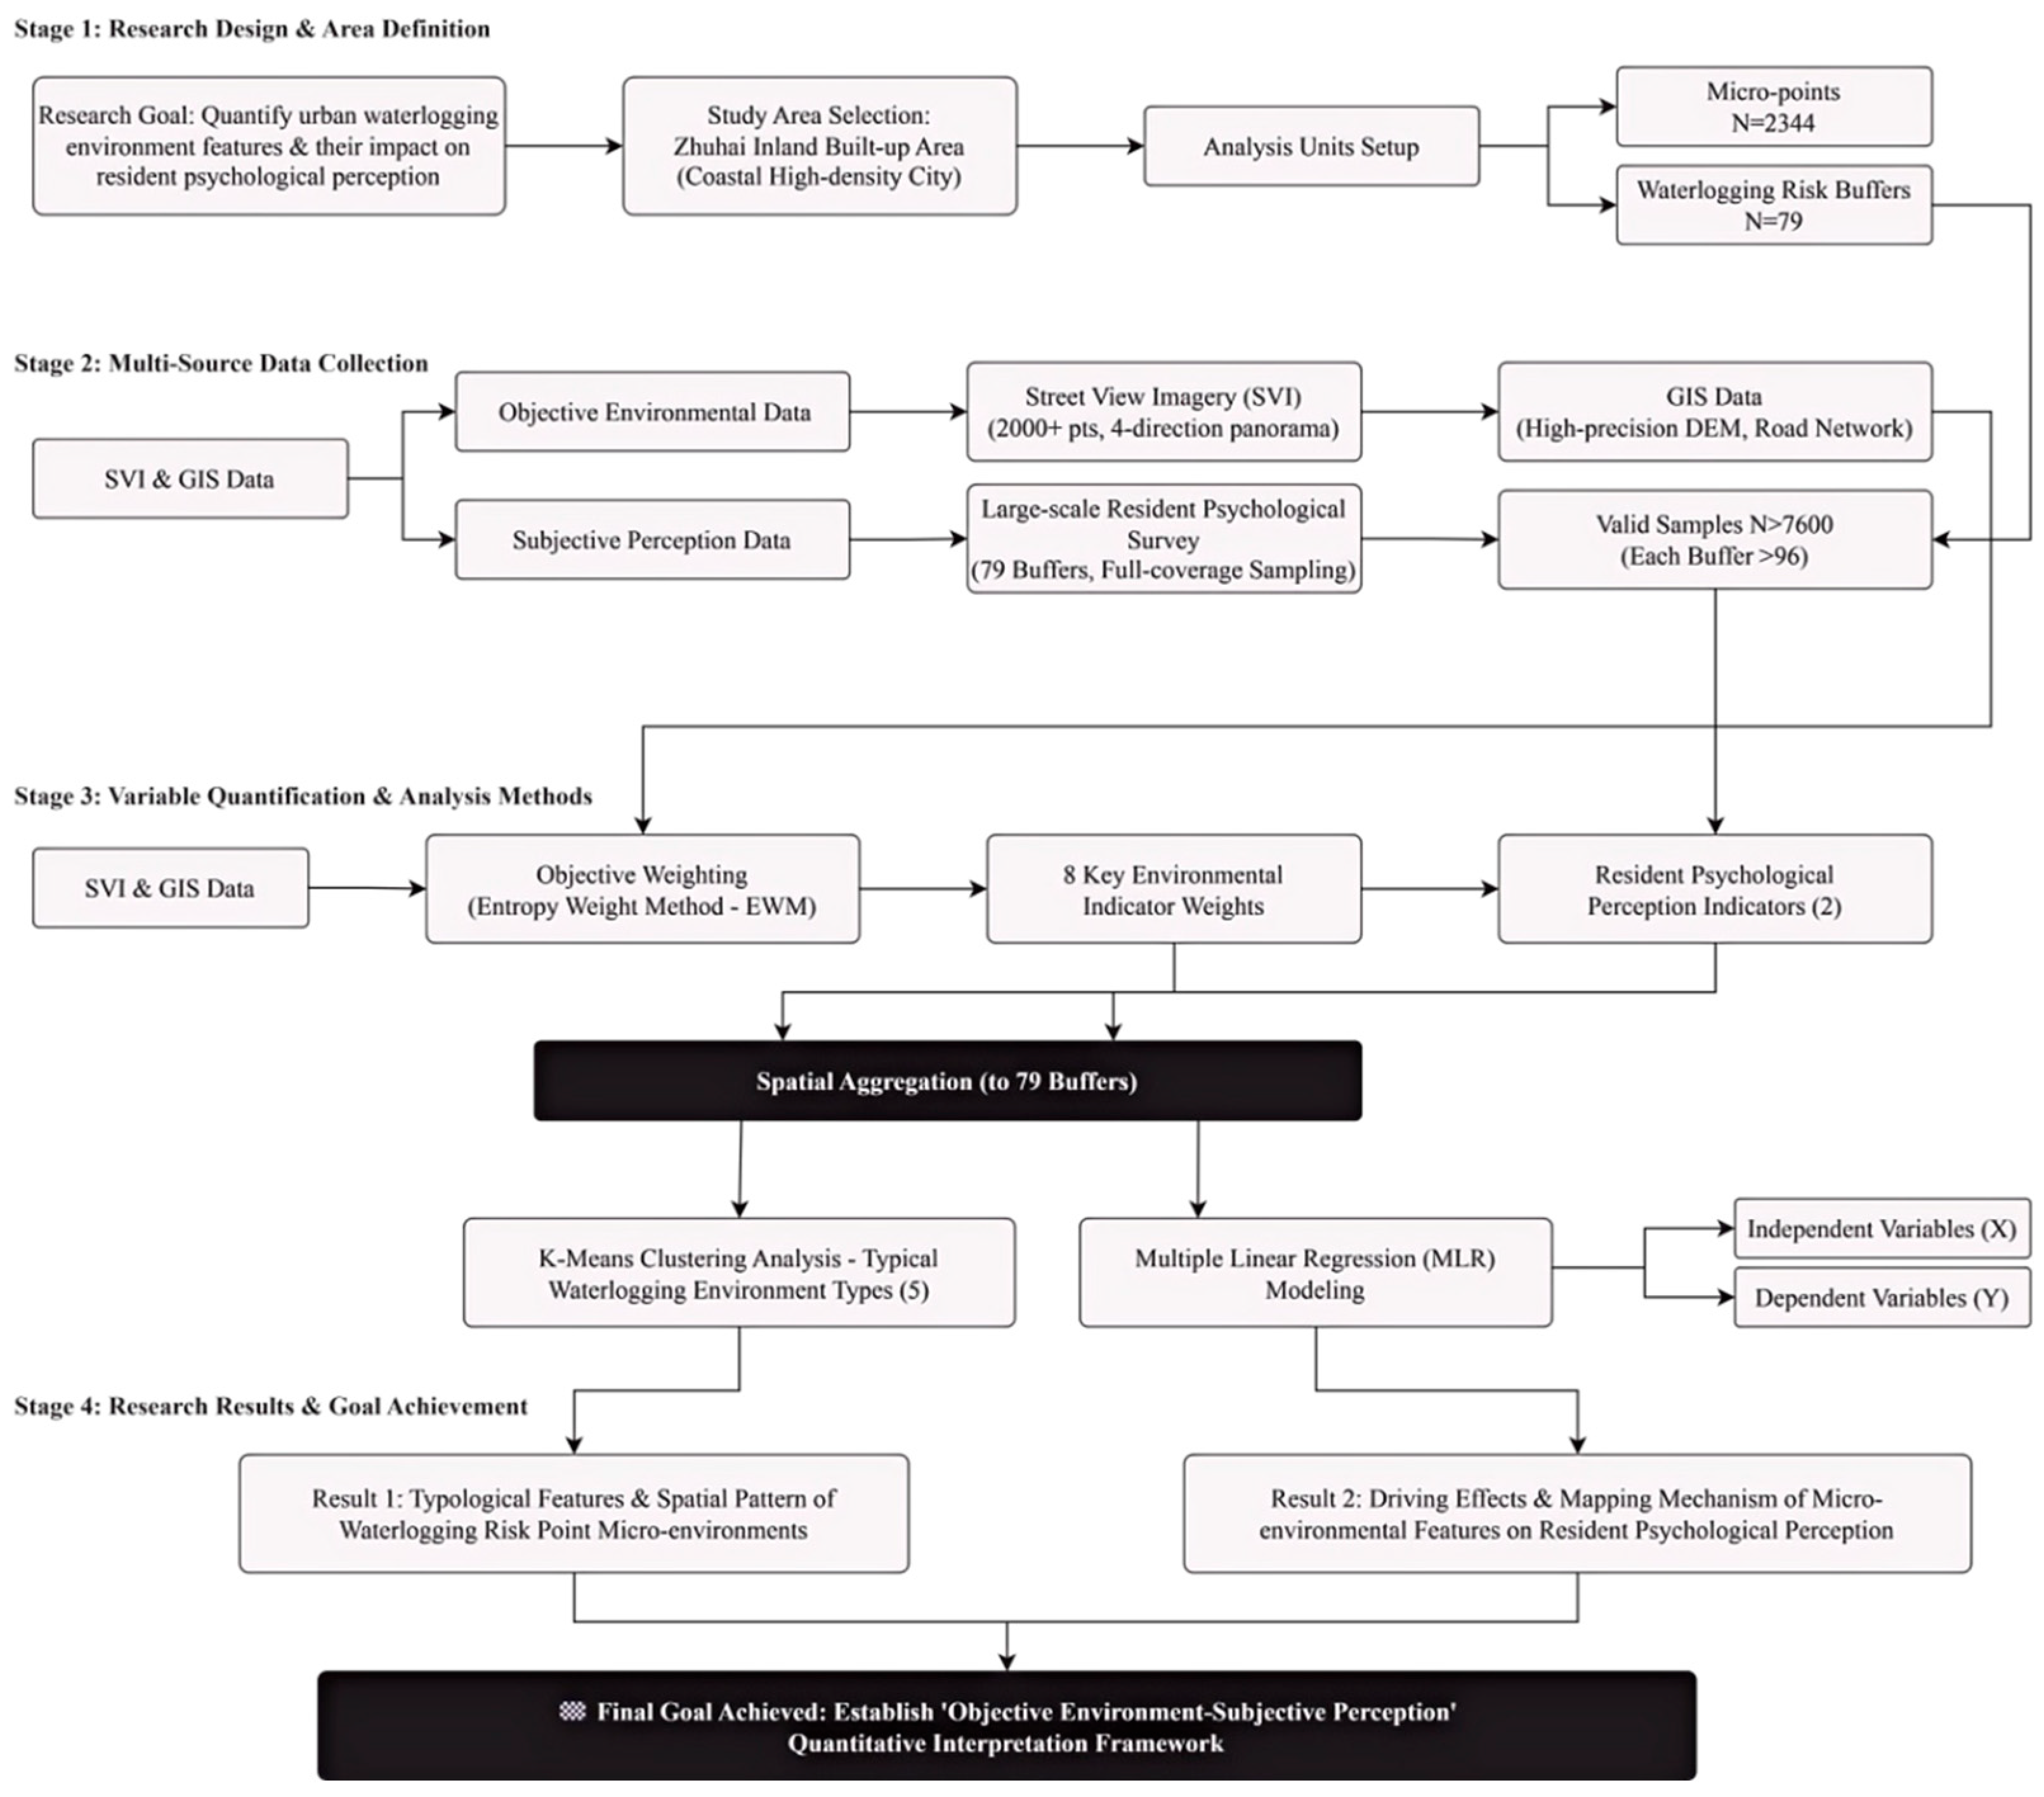
Figure 1. Research Design and Procedural Workflow.
Buildings 16 02205 g001
Figure 2. Spatial Distribution of Urban Pluvial Flooding Risk Sites in the Inland Built-Up Area of Zhuhai.
Buildings 16 02205 g002
Figure 3. Spatial Distribution of Sampling Micro-Points Within the 78 Urban Pluvial Flooding Risk Buffers in Zhuhai.
Buildings 16 02205 g003
Figure 4. Representative Semantic Segmentation Results of Street View Imagery for Different Urban Pluvial Flooding Micro-Environments. In these semantic-segmentation maps, different colors correspond to different environmental elements extracted from the street-view images: the road surface is shown in pink, tree canopies and vegetation in dark green, sky/background areas in cyan or turquoise, roadside fences and boundary structures in magenta, low shrubs or roadside greenery in purple/blue, and vehicles or foreground occlusions in light violet. These colors are used for visual classification only and do not represent numerical magnitudes or intensity levels.
Buildings 16 02205 g004
Figure 5. Spatial Aggregation of K-Means Clustered Micro-Environmental Types Within Urban Pluvial Flooding Risk Buffers in Zhuhai.
Buildings 16 02205 g005
Figure 6. Profile of Survey Respondents Across the 78 Flood Risk Buffers in Zhuhai.
Buildings 16 02205 g006
Table 1. Theoretical Rationale and Source Domains of Environmental Indicators.
IndicatorMeasurement BasisUrbanism-Related Theoretical ConstructExtraction Logic in This StudySupporting Literature
Green View Index (GVI)Proportion of vegetation pixels in SVIPlace quality; restorative visual exposure; green infrastructure interfaceEye-level greenery reflects not only vegetation exposure, but also perceived environmental comfort, psychological buffering, and the visible presence of green infrastructure.[14,20,21]
Impervious Visual Exposure (IV)Proportion of road and paved-surface pixels in SVISurface sealing; hard-surfaced urban fabric; lack of absorbent surfacesA higher proportion of visible hard paving indicates stronger surface impermeability, weaker infiltration capacity, and greater relevance to SuDS-based retrofitting.[25,26,27,28]
Building Enclosure (BE)Proportion of building and wall pixels in SVIStreet-canyon morphology; built-edge continuity; spatial compressionBuilding and wall interfaces form the vertical enclosure of street space. Higher enclosure indicates stronger canyon-like morphology and perceived spatial compression.[14,15,16]
Sky View/Sky Visibility (SV)Proportion of sky pixels in SVIVisual openness; relief from enclosure; street-canyon opennessSky visibility reflects pedestrian-level openness and is inversely related to perceived street-canyon compression and visual confinement.[14,21]
Barrier/Blocking Proxy (BP)Combined pixel proportion of fence, pole, traffic sign, traffic light, and railing/guard classes in SVISpatial permeability; movement legibility; obstruction of pedestrian or evacuation routesBarrier Proxy is defined as the combined pixel proportion of semantic segmentation classes that represent visually obstructive interface elements at the pedestrian eye level. Specifically, it includes the classes “fence,” “pole,” “traffic sign,” “traffic light,” and “railing/guard”, as identified by the segmentation model. These elements are interpreted as physical barriers that may obstruct pedestrian movement, impede evacuation route legibility, and contribute to perceived spatial blockage during waterlogging events. The term “barrier” in this study refers primarily to physical obstruction of movement and visual permeability, rather than to hydrological flow barriers. However, the presence of such elements also carries perceptual implications: dense obstructive interfaces may intensify residents’ sense of entrapment and reduce perceived escape options under flood conditions.[16,22]
Water Exposure (WE)Pixel proportion of the “water” semantic class in SVI (rivers, canals, drainage channels, ornamental water, residual ponding)Blue interface; visible hazard cue; flood-related perceptual signalWater Exposure is defined as the pixel proportion of the “water” semantic class in street view imagery. In the context of the Zhuhai study area, this class primarily captures visible open water surfaces, including rivers, canals, drainage channels, ornamental water features, and—where present in dry-weather imagery—residual standing water or ponding at low-lying locations. It does not directly measure real-time flood inundation, but serves as a proxy for the degree to which water is a visible element of the streetscape. A higher Water Exposure value indicates greater visual presence of water interfaces, which may signal proximity to flood-prone water bodies, inadequate drainage infrastructure, or low-lying terrain where water tends to accumulate. The high entropy weight received by this variable (0.6667) reflects its extremely skewed distribution: most sampling points have near-zero water exposure, while a small number of points near waterfront or drainage-constrained locations exhibit substantially higher values, making it highly discriminatory for differentiating micro-environmental types.[27,28]
Slope (S)DEM-derived slopeTopographic morphology; gradient-driven runoff routingSlope describes terrain inclination and affects runoff velocity, surface flow direction, and water concentration patterns.[15,16]
Local Depression (D)DEM-derived local elevation differenceLow-lying morphology; terrain depression; water-retention potentialLocal depression captures whether a site is lower than its surrounding area, indicating potential accumulation and delayed drainage.[14,15]
Table 2. Quantified Environmental Indicators for Sampling Points Within Each Risk Buffer.
CategoryIndicatorsEncodingCalculation Method
SVIGreen View RateGVI GVI p , h = n C g r e e n N
GVI = N_vegetation/N_total × 100%. Semantic class: “vegetation/tree/grass.” Expected direction: negative (−)—higher visible greenery is expected to be negatively associated with buffer-level average perceived emotional stress and negative anxiety, through psychological buffering and restorative effects.
SVIImpervious Visual ExposureIV IV p , h = n C hard N
IV = N_road + N_sidewalk/N_total × 100%. Semantic classes: “road,” “sidewalk,” “paved surface.” Expected direction: positive (+)—higher impervious visual exposure indicates greater surface sealing and reduced infiltration, expected to be positively associated with buffer-level average perceived emotional stress and negative anxiety.
SVIBuilding EnclosureBE BE p , h = n C encl N
BE = N_building + N_wall/N_total × 100%. Semantic classes: “building,” “wall.” Expected direction: positive (+)—higher building enclosure intensifies street-canyon compression and perceived spatial confinement, expected to be positively associated with buffer-level average perceived emotional stress and negative anxiety.
SVISky ViewSV S p , h = n C sky N
SV = N_sky/N_total × 100%. Semantic class: “sky.” Expected direction: negative (−)—greater sky visibility reflects visual openness and relief from enclosure, expected to be negatively associated with buffer-level average perceived emotional stress and negative anxiety.
SVIBarrier/Blocking ProxyBP BP p , h = n C barrier N
BP = (N_fence + N_pole + N_traffic sign + N_traffic light + N_railing/guard)/N_total × 100%. Semantic classes: fence, pole, traffic sign, traffic light, and railing/guard. These classes represent street-level elements that may reduce visual permeability, route legibility, and pedestrian movement permeability. “Barrier” in this study refers to perceived and physical obstruction at the pedestrian eye level, rather than to direct hydrological blockage. Expected direction: positive (+)—higher BP values are expected to be positively associated with higher buffer-level average perceived emotional stress and negative anxiety, because obstructive interfaces may intensify perceived spatial confinement and reduce perceived escape options under waterlogging conditions.
SVIWater ExposureWE WE p , h = n C water N
WE = N_water/N_total × 100%. Semantic class: “water” (includes visible open water surfaces such as rivers, canals, drainage channels, ornamental water features, and residual ponding). Expected direction: positive (+)—greater visible water exposure is expected to be positively associated with buffer-level average perceived emotional stress and negative anxiety, as it signals proximity to flood-prone conditions and serves as a direct visual hazard cue.
DEMSlopeSS = mean DEM-derived slope value (degrees) within each sampling unit or buffer. Higher slope values indicate steeper terrain, which may facilitate faster surface runoff and create more difficult pedestrian movement conditions during heavy rainfall events. Expected direction: positive (+)—after directional alignment, higher slope is expected to be positively associated with buffer-level average perceived emotional stress and negative anxiety.
DEMDepressionDD = local elevation − neighborhood average elevation (focal mean of surrounding area). Higher D values indicate the sampling point is relatively more elevated than its surroundings; lower (more negative) D values indicate a more depressed, low-lying location with greater water-retention potential. Expected direction: negative (−)—the negative regression coefficient indicates that buffers in relatively more depressed terrain (lower D) tend to be associated with higher buffer-level average perceived emotional stress and negative anxiety, consistent with the expectation that low-lying, flood-prone topography amplifies perceived risk.
Table 3. Descriptive Statistics of Micro-Environmental Indicators at Urban Flood Risk Points (N = 2351).
IndicatorsMeanSDMinMaxSkewnessKurtosis
Slope (S)2.4261.6230.00010.7680.9352.607
Local Depression Depth (D)0.3330.676−2.7064.6631.5579.314
Green View Ratio (GVI, %)16.26911.7710.00075.2850.8240.472
Impervious Surface Visual Exposure (IV, %)26.8838.7460.00044.758−0.606−0.084
Building Enclosure (BE, %)20.23415.9650.01883.9561.1200.956
Sky View (SV, %)23.43912.0360.00051.629−0.018−0.965
Barrier Proxy (BP, %)5.1467.4550.00074.9943.79422.055
Water Exposure (WE, %)0.0630.4660.00010.48212.922210.395
Table 4. Robustness checks of the micro-environmental clustering typologies (ARI vs. primary entropy-weighted K-means solution).
ScenarioSpecificationARI vs. Scenario B
AK-means on standardized but unweighted variables0.470
BPrimary entropy-weighted K-means (reference)1.000
C1Entropy-weighted K-means with log-transformed WE0.984
C2Entropy-weighted K-means with WE excluded0.460
DHierarchical clustering (Ward’s method) on the weighted matrix0.280
Note. K = 5 for all scenarios. ARI = Adjusted Rand Index (0 = random agreement, 1 = identical partition). Scenario B serves as the reference partition.
Table 5. Multiple Linear Regression Results: Associations Between Micro-scale Built Environment and Residents’ Average Negative Psychological Perceptions (N = 78 Flood Risk Buffers).
Model 1: Perceived Emotional Stress (PES)Model 2: Negative Anxiety Index (NAI)
VariableBSEβpBSEβp
Topographic indicators
Slope (S)0.1860.0320.272<0.0010.1790.0330.260<0.001
Local Depression Depth (D)−0.1580.030−0.246<0.001−0.1540.031−0.239<0.001
Street view imagery (SVI) indicators
Green View Rate (GVI)−0.2140.042−0.239<0.001−0.1860.043−0.207<0.001
Impervious Surface Visual Exposure (IV)0.1470.0370.186<0.0010.1440.0380.182<0.001
Building Enclosure (BE)0.2680.0410.304<0.0010.2970.0420.337<0.001
Sky View (SV)−0.1290.051−0.1570.013−0.0860.052−0.1040.103
Barrier Proxy (BP)0.3180.0390.380<0.0010.3430.0400.409<0.001
Water Exposure (WE)0.4610.0380.537<0.0010.4670.0390.543<0.001
R20.9470.945
Adjusted R20.9410.939
F155.30 ***149.00 ***
Max VIF6.56 (BE)6.56 (BE)
Note. N = 78 flood risk buffers. B = unstandardized coefficient; SE = standard error; β = standardized coefficient. All predictors z-score standardized. Grey italic p-value (0.103) = non-significant (p > 0.05). *** p < 0.001. VIF for all other predictors < 5.0.
Table 6. Model Stability and Diagnostic Results for Multiple Linear Regression Models (N = 78).
Diagnostic DimensionStatistical IndexModel 1:PESModel 2:NAI
Model Fit
Verification
Adjusted R2
(theoretical)
0.9410.939
Predictive Validity
(Cross-Validation)
LOOCV Q20.9120.908
Influential
Observations
Max Cook’s Distance
(threshold: 4/N = 0.051)
0.0380.041
Residual
Normality
Shapiro-Wilk
p-value
0.2170.184
Hetero-
skedasticity
Breusch-Pagan
p-value
0.3260.291
Multicollinearity
Sensitivity
Max VIF (BE)
Mean VIF
6.56
3.2
6.56
3.2
Predictor-to-
Observation Ratio
k:N8:78
=1:9.75
8:78
=1:9.75
Spatial IndependenceMoran’s I0.038 (z = 1.05, p = 0.326)0.042 (z = 1.12, p = 0.311)
Note. N = 78 flood-risk buffers; k = 8 predictors. LOOCV = leave-one-out cross-validation; Q2 = cross-validated coefficient of determination. The high R2 values should be interpreted as in-sample explanatory power at the buffer level rather than as evidence of causal effects or individual-level psychological mechanisms. The aggregation of individual questionnaire responses into buffer-level means may reduce individual-level variability and increase apparent model fit. Therefore, the regression results are interpreted as ecological, buffer-level associations within the present study area.
Disclaimer/Publisher’s Note: The statements, opinions and data contained in all publications are solely those of the individual author(s) and contributor(s) and not of MDPI and/or the editor(s). MDPI and/or the editor(s) disclaim responsibility for any injury to people or property resulting from any ideas, methods, instructions or products referred to in the content.