Article

The One-Dimensional Moisture Transport Model for Concrete Under Dry–Wet Cycles

1
Department of Materials and Chemistry (MACH), Vrije Universiteit Brussel, 1050 Etterbeek, Belgium
2
Department of Architecture and Civil Engineering, Chalmers University of Technology, 41296 Gothenburg, Sweden
3
School of Materials Science and Engineering, Southeast University, Nanjing 211189, China
4
College of Materials Science and Engineering, Chongqing University, Chongqing 400045, China
5
Department of Water Management, Delft University of Technology, 2628CN Delft, The Netherlands
*
Author to whom correspondence should be addressed.
Buildings 2026, 16(11), 2204; https://doi.org/10.3390/buildings16112204 (registering DOI)
Submission received: 21 April 2026 / Revised: 26 May 2026 / Accepted: 27 May 2026 / Published: 30 May 2026
(This article belongs to the Section Building Materials, and Repair & Renovation)

Abstract

This study proposes a novel analytical model to predict one-dimensional moisture transport in concrete under cyclic drying and wetting conditions. The framework distinguishes between two physical mechanisms: diffusion-driven evaporation during drying and capillary-driven suction during wetting. Governing equations for weight loss and gain are derived for each respective phase. During the drying phase, weight loss follows a linear relationship with the square root of time, allowing the diffusion coefficient to be determined via evaporation tests. For the wetting phase, a modified sorptivity approach is employed, incorporating an error-function baseline to account for residual moisture. A calibration coefficient of ε is utilized to correct for varying conditions between standard water suction tests and environmental wetting, particularly for air-entrained concrete characterized by larger capillary volumes and complex tortuosity. Experimental validation was conducted on concrete with varying water-to-cement ratios. The model demonstrated excellent agreement with experimental data, maintaining relative errors below 10% for standard mixes. While higher-porosity samples exhibited greater scatter due to “water traps” and complex pore structures, the model effectively captured cumulative moisture trends over multiple cycles. This framework provides a robust tool for assessing the durability of concrete structures in unsheltered environments.

1. Introduction

Durability remains a cornerstone of concrete infrastructure performance. Concrete durability factors, such as permeability, freeze–thaw damage, cracking, and chemical ingress, are strongly governed by porosity. These factors influence concrete strength mainly through porosity: higher and more connected pore structures accelerate the penetration of harmful agents, promote deterioration mechanisms, and ultimately reduce long-term mechanical performance. Because cement-based materials are inherently porous, their lifespan mainly depends on their ability to block aggressive agents. Water is the central driver of most degradation mechanisms; it acts both as a direct cause of damage (such as in freeze–thaw cycles and calcium leaching) and as a vehicle for harmful ions like sulfates and chlorides, which trigger sulfate attack and reinforcement corrosion. Furthermore, internal moisture levels are a decisive factor in drying shrinkage and subsequent cracking [1,2]. Recent studies have highlighted the significant role of microcracking induced by shrinkage on moisture transport in cement-based materials. For instance, Anomalous water absorption in cement-based materials caused by drying shrinkage induced microcracks demonstrated that drying shrinkage induced microcracks can lead to anomalous increases in water absorption, deviating from classical capillary-based predictions [3]. Similarly, the effect of autogenous shrinkage on microcracking and mass transport properties of concrete containing supplementary cementitious materials showed that autogenous shrinkage contributes to microcrack formation, which in turn significantly alters mass transport properties in concrete, particularly in systems incorporating supplementary cementitious materials [4]. Research consistently indicates that the extent of shrinkage strain is directly proportional to the volume of moisture lost [5,6,7,8].
In this context, marine dry–wet cycles accelerate concrete deterioration through a “pumping effect.” During wetting, moisture and aggressive salts are driven into the pores; upon drying, the moisture evaporates while the salt remains trapped. This mechanism facilitates both chloride-induced corrosion and drying shrinkage, leading to severe structural damage. Consequently, accurately modeling moisture transport under these cyclic conditions is a critical prerequisite for predicting the service life of reinforced concrete in tidal and splash zones.

1.1. Theoretical Review of Moisture Transport Models

Moisture transport in porous building materials is generally governed by three physical concepts: moisture diffusivity, permeability, and sorptivity [9].

1.1.1. Diffusivity Concept

The diffusivity approach combines various transport mechanisms into a single moisture-dependent function [10]. While this requires determining only one material characteristic, the experimental derivation of diffusivity from moisture profiles is time-consuming and technically complex. Furthermore, the highly nonlinear relationship between the diffusivity and moisture content profile compounded by hysteresis during absorption and desorption (or moisture redistribution), making physical parameter identification difficult, particularly in heterogeneous or composite materials where interface discontinuities occur.

1.1.2. Permeability Concept

This approach requires two parameters: the permeability function and moisture storage capacity. The primary challenge lies in determining moisture permeability, which is a function of moisture content and cannot be measured directly, which associates the moisture flow with the gradient of capillary pressure, although it could be obtained from the derivative of the moisture–pressure curve or sorption isotherm. Recent work has also emphasized the importance of sorption behavior in governing moisture transport in cementitious materials, both at room temperature and at elevated temperatures [11]. The high nonlinearity and hysteretic behavior of these curves complicate experimental validation. Additionally, measuring universal adsorption–desorption isotherms for various cement-based binders remains a laborious process.

1.1.3. Sorptivity Concept

The sorptivity concept defines the relationship between the cumulative volume of water absorbed per unit area (i) and the square root of elapsed time (t). This empirical law has been validated by numerous studies [12,13,14], and is expressed as:
i = S · t
where S represents sorptivity, a fundamental material characteristic. While S is typically treated as a constant, this assumes a uniform cross-sectional flow area. In practice, however, moisture distribution within the material is often non-homogeneous, leading to an inconsistent internal flow area that can challenge the validity of a constant sorptivity coefficient.

1.2. Previous Models for Dry–Wet Cycles

Various models have been developed to describe moisture transport in cementitious materials under periodic dry–wet exposure. These are generally categorized into three methodological approaches [15].

1.2.1. Independent Diffusion Coefficients

This approach models drying and wetting as separate processes without relying on sorption isotherms [16]. Following the mechanisms proposed by Hall [17], drying is driven by a combination of evaporation, diffusion, and convection, whereas wetting is dominated by capillary forces. In these one-dimensional models, moisture content is typically the driving potential, utilizing diffusion coefficients during drying derived from Bažant and Najjar [18], while diffusion coefficient during wetting is expressed as D w θ taken from Hall [19]. However, the coefficients are highly dependent on experimental calibration, which must be repeated if cycle parameters change. Additionally, this method disregards the hysteresis effect.

1.2.2. Non-Hysteresis Modeling

These models use a single sorption isotherm (usually the main desorption curve) to define the one-to-one relationship between moisture content and either capillary pressure Pc or relative humidity RH ( p v / p v s ). Key models include:
(1) Two-variable potential driving models: Driven by moisture and temperature gradients. These often assume sinusoidal boundary conditions [20], which limits their applicability to specific environmental scenarios. (2) Kirchhoff’s potential related models: Simplifies nonlinear transport by introducing Kirchhoff’s potential [21,22], where the moisture flow coefficient is normalized to 1. This method is computationally efficient and less sensitive to mesh refinement. (3) Effective moisture penetration depth (EMPD) model: these studies assume moisture exchange occurs within a thin, fictitious surface layer [23,24,25]. Thus, moisture content is a function of RH and x E M P D (the thickness of the thin fictitious layer). The EMPD model is derived from periodic moisture variation, requiring an accurate estimation of the effective moisture penetration depth of x E M P D . Utilizing the material’s known sorption isotherm, Cunningham [20] provided a method for determining this depth. While the model simplifies the process by neglecting latent heat effects and nonlinear transport properties, it has demonstrated reliable results within a relative humidity (RH) range of 40% to 80% [26].

1.2.3. Hysteresis Modeling

Hysteresis models couple transport equations with a hysteresis framework to account for diverging wetting and drying paths. Zhang [15] provided a comprehensive review and proposed a five-point fitting method to construct main isotherms with minimal experimental data.
Applications include the DuCOM model and the work of Derluyn et al. [27], which coupled heat and moisture transport to simulate concrete responses to varying RH and temperature.
Johannesson et al. [28,29] developed two-phase moisture transport model to address hysteresis in porous materials. This approach utilizes separate mass balance equations for liquid and vapor phase based on volume fractions and coupled by mass exchange terms that represent evaporation and condensation. Eventually, the total mixture balance is achieved by relating these equations through their coupled terms. To navigate between wetting and drying states, third-degree polynomials are used to define the scanning curves. Despite these advancements, a major limitation remains: current models cannot derive one main isotherm from another, leaving them heavily dependent on extensive experimental validation.

1.3. Research Gap and Novelty

A review of the existing literature reveals that moisture transport models for cementitious materials have primarily focused on describing internal moisture behavior within continuum media. While these models effectively simulate how moisture moves deep inside a structure in response to external humidity, a significant research gap remains: there are a lack of practical, flux-oriented models that prioritize the quantity of moisture entering and existing the exposure surface. Understanding this surface exchange is critical, as it directly dictates the accumulation of aggressive agents like chlorides and sulfates.
To address this gap, this paper introduces a novel model that shifts perspective from internal transport profiles to surface flux dynamics. By treating the internal moisture state as a dynamic boundary condition, the model aims to accurately quantify the net water gain and loss throughout repeated cycles.
The research objectives are structured to solve three fundamental challenges:
  • Mechanistic Differentiation: to accurately characterize the system, the distinct physical mechanisms governing the drying and wetting stages were analyzed independently. It is well established that transport parameters, such as moisture diffusion and sorptivity coefficients, depend heavily on moisture content and pore structure, a relationship thoroughly demonstrated by Ksit et al. (2025) [30]. However, for the short-term evaluations conducted in this study (within a 3-month timeframe), these transport parameters were treated as constant. This assumption is justified as the coefficients were derived from reliable water suction tests, ensuring the validity and accuracy of the constant-coefficient approach for this specific scope.
  • Boundary Evolution: Tracking the redistribution of moisture at the exposure surface at the conclusion of each cyclic stage.
This study develops a physics-based, macro-scale modeling framework that focuses on a one-dimensional moisture transport analysis. This approach isolates fundamental transport mechanisms and provides clear analytical insights, establishing a necessary baseline for future multi-dimensional engineering applications. The proposed framework offers three distinct advantages over existing methods:
First, the model maintains high physical interpretability while significantly reducing parameter uncertainty. The framework presented herein maintains a physics-based foundation, distinguishing it from purely data-driven digital twin approaches [31]. Rather than being classified as a strictly theoretical physical model based on microstructural pore characterization, it utilizes a semi-empirical approach. Specifically, the essential transport parameters and calibration coefficients are determined independently through macroscopic water suction tests and dry-saturation experiments. Namely, this model relies on direct, reliable laboratory measurements to determine macro-scale physical parameters, bypassing the need for complex microstructural formulations and their associated assumptions. While correlations between transport properties and microstructural characteristics (such as pore size distribution or tortuosity) are of scientific interest, deriving macroscopic transport properties solely from microstructural geometry introduces considerable uncertainty, as no universal physical relationship currently bridges the micro- and macro-scales. The proposed approach effectively circumvents these scaling inaccuracies while maintaining strong predictive capability. For example, the model utilizes two accessible material constants: sorptivity during wetting, obtainable via standardized tests such as NT BUILD 368 [32], and the diffusion coefficient during drying, which can be derived from the linear relationship between moisture loss and the square root of time [33,34].
Second, the model dynamically captures the evolution of moisture states within the concrete. Rather than generating a static profile, the moisture distribution is expressed as a continuous, time- and depth-dependent function. Although the governing formulation adopts an analytical error-function representation, the moisture profile is dynamically updated at each time step throughout the drying process. Consequently, progressive changes in internal moisture conditions are inherently embedded within the evolving profile itself. Notably, although sorption hysteresis heavily influences cyclic drying and wetting behaviors as documented in previous literature [35], the proposed modeling approach effectively captures the cumulative effects of these moisture fluctuations without requiring a separate, standalone capillary-pore hysteresis module. This omission significantly reduces computational complexity while maintaining high accuracy, making the framework both mathematically efficient and practical for engineering applications.

2. Theoretical Framework for Moisture Transport

2.1. Transport Assumptions and Governing Equations

2.1.1. Drying Stage

When a moist porous sample, such as concrete, is exposed to air in the laboratory condition (e.g., 20 °C, 50% RH), evaporation occurs at the exposed surface. This creates an instantaneous moisture gradient, causing moisture to flow from the interior of the sample toward the surface. This transport process, driven by concentration gradients as evaporation proceeds, is a characteristic diffusion phenomenon. Consequently, the process can be modeled using the concept of “diffusivity” and described mathematically by Fick’s second law. In this study, the moisture concentration c x , t (g/cm3) is used to express the water content within the sample. Fick’s second law can be expressed as:
c x , t t = x D c x , t x
where x denotes the distance from the exposed surface. For one-dimensional semi-infinite case, the initial and boundary conditions are defined as c 0 , t = c s and c , t = c i , respectively. The error function solution to Fick’s second law under the drying potential is:
c x , t c 0 , t c , t c 0 , t = e r f x 2 D t
This can be rewritten as:
c x , t = c 0 , t + c , t c 0 , t × e r f x 2 D t
The surface and initial internal moisture contents are c s and c i , respectively. During the drying stage, the moisture distribution c x , t is governed by:
c x , t = c s + c i c s × e r f x 2 D t
where D   ( c m 2 / s ) is the diffusion coefficient and t   (s) is the duration of evaporation.
The weight change per unit cross-sectional area, Δ W d ( g / c m 2 ), for a sample during a drying duration t d   can be derived by assuming the diffusion coefficient D remains constant:
W d = 0 t d J | x = 0 d t = D 0 t d c x , t x | x = 0 d t
Differentiating Equation (4) with respect to x at the surface of X = 0 yields:
c x , t x x = 0 = c s c i π · 1 t
By substituting Equation (6) into Equation (5), and integrating, we obtain the governing equation for weight change per unit cross-sectional area during drying:
W d = 2 c s c i π D · t d
Equation (7) demonstrates that moisture loss is linearly dependent on the square root of time, provided the diffusion coefficient is constant. We will subsequently demonstrate through drying experiments that the moisture diffusion coefficient indeed remains constant during this stage.

2.1.2. Wetting Stage

Because dry–wet cycles involve multiple transport mechanisms, the boundary and initial conditions change over time. It should be emphasized that the wetting stage proceeds immediately after the drying stage. In this stage, capillary sorptivity (suction) driven by surface tension within the capillary pores is significantly greater than the diffusivity driven by moisture gradients. Consequently, the diffusion driven by moisture gradients can be ignored, and the wetting process can be modeled based on the sorptivity concept.
However, the capillary sorptivity coefficient k ( c m / s ) depends on the fraction of pores in concrete that are accessible for fluid suction when exposed to a water source. Therefore, a calibration coefficient ε is needed to correct k when the fraction of fluid accessible pores varies.
During the wetting stage, the surface moisture content c 0 , t is changed into c m a x   ( g / c m 3 ), which represents the maximum moisture content in the sample. Following the evaporation period (at the end of drying stage t d ), the moisture distribution is:
c x , t d = c s + c i c s   e r f x 2 D t d
The function c(x, td) represents the initial water content for the wetting stage. It is assumed that the final volumetric water content reaches cmax. Under this assumption, the error function distribution of moisture remains constant during the rapid wetting process, the weight change per unit cross-sectional area after the wetting stage, ΔWw, can be derived as:
W w = c m a x c x ,     t d 0 i d x
Since the capillary suction process is defined by:
x = k t
Substituting Equation (10) into Equation (9) and rearranging yields Equation (11), which is the governing equation during the wetting stage:
W w = ε · c m a x c s · k · 0 t w 1 c i c s c m a x c s e r f k t 2 D t d d t
where ε is a coefficient for correcting the difference in testing conditions between the standard water suction test and the specific drying–wetting environment. It should be noted that the weight change in every new stage is cumulative; the initial condition (initial water content) is dynamic and directly associated with the preceding stage, whether drying or wetting.

2.1.3. Description of the Model

In a standard water suction test (as discussed in Section 2.2.2), specimens are typically dried to a degree where the remaining moisture, primarily interlayer water, can be assumed to be homogeneously distributed. In reality, however, moisture within concrete exposed to an unsheltered outdoor environment is rarely homogeneous, as the duration of drying is often limited relative to the thickness of the structure.
As established in the evaporation analysis, the drying process in a dry–wet cycle under natural conditions (e.g., 20 °C and 50% RH) follows Fick’s second law, resulting in an error-function moisture distribution. Due to this non-uniform distribution, the effective area available for water absorption during the subsequent wetting process is reduced according to this error-function profile.
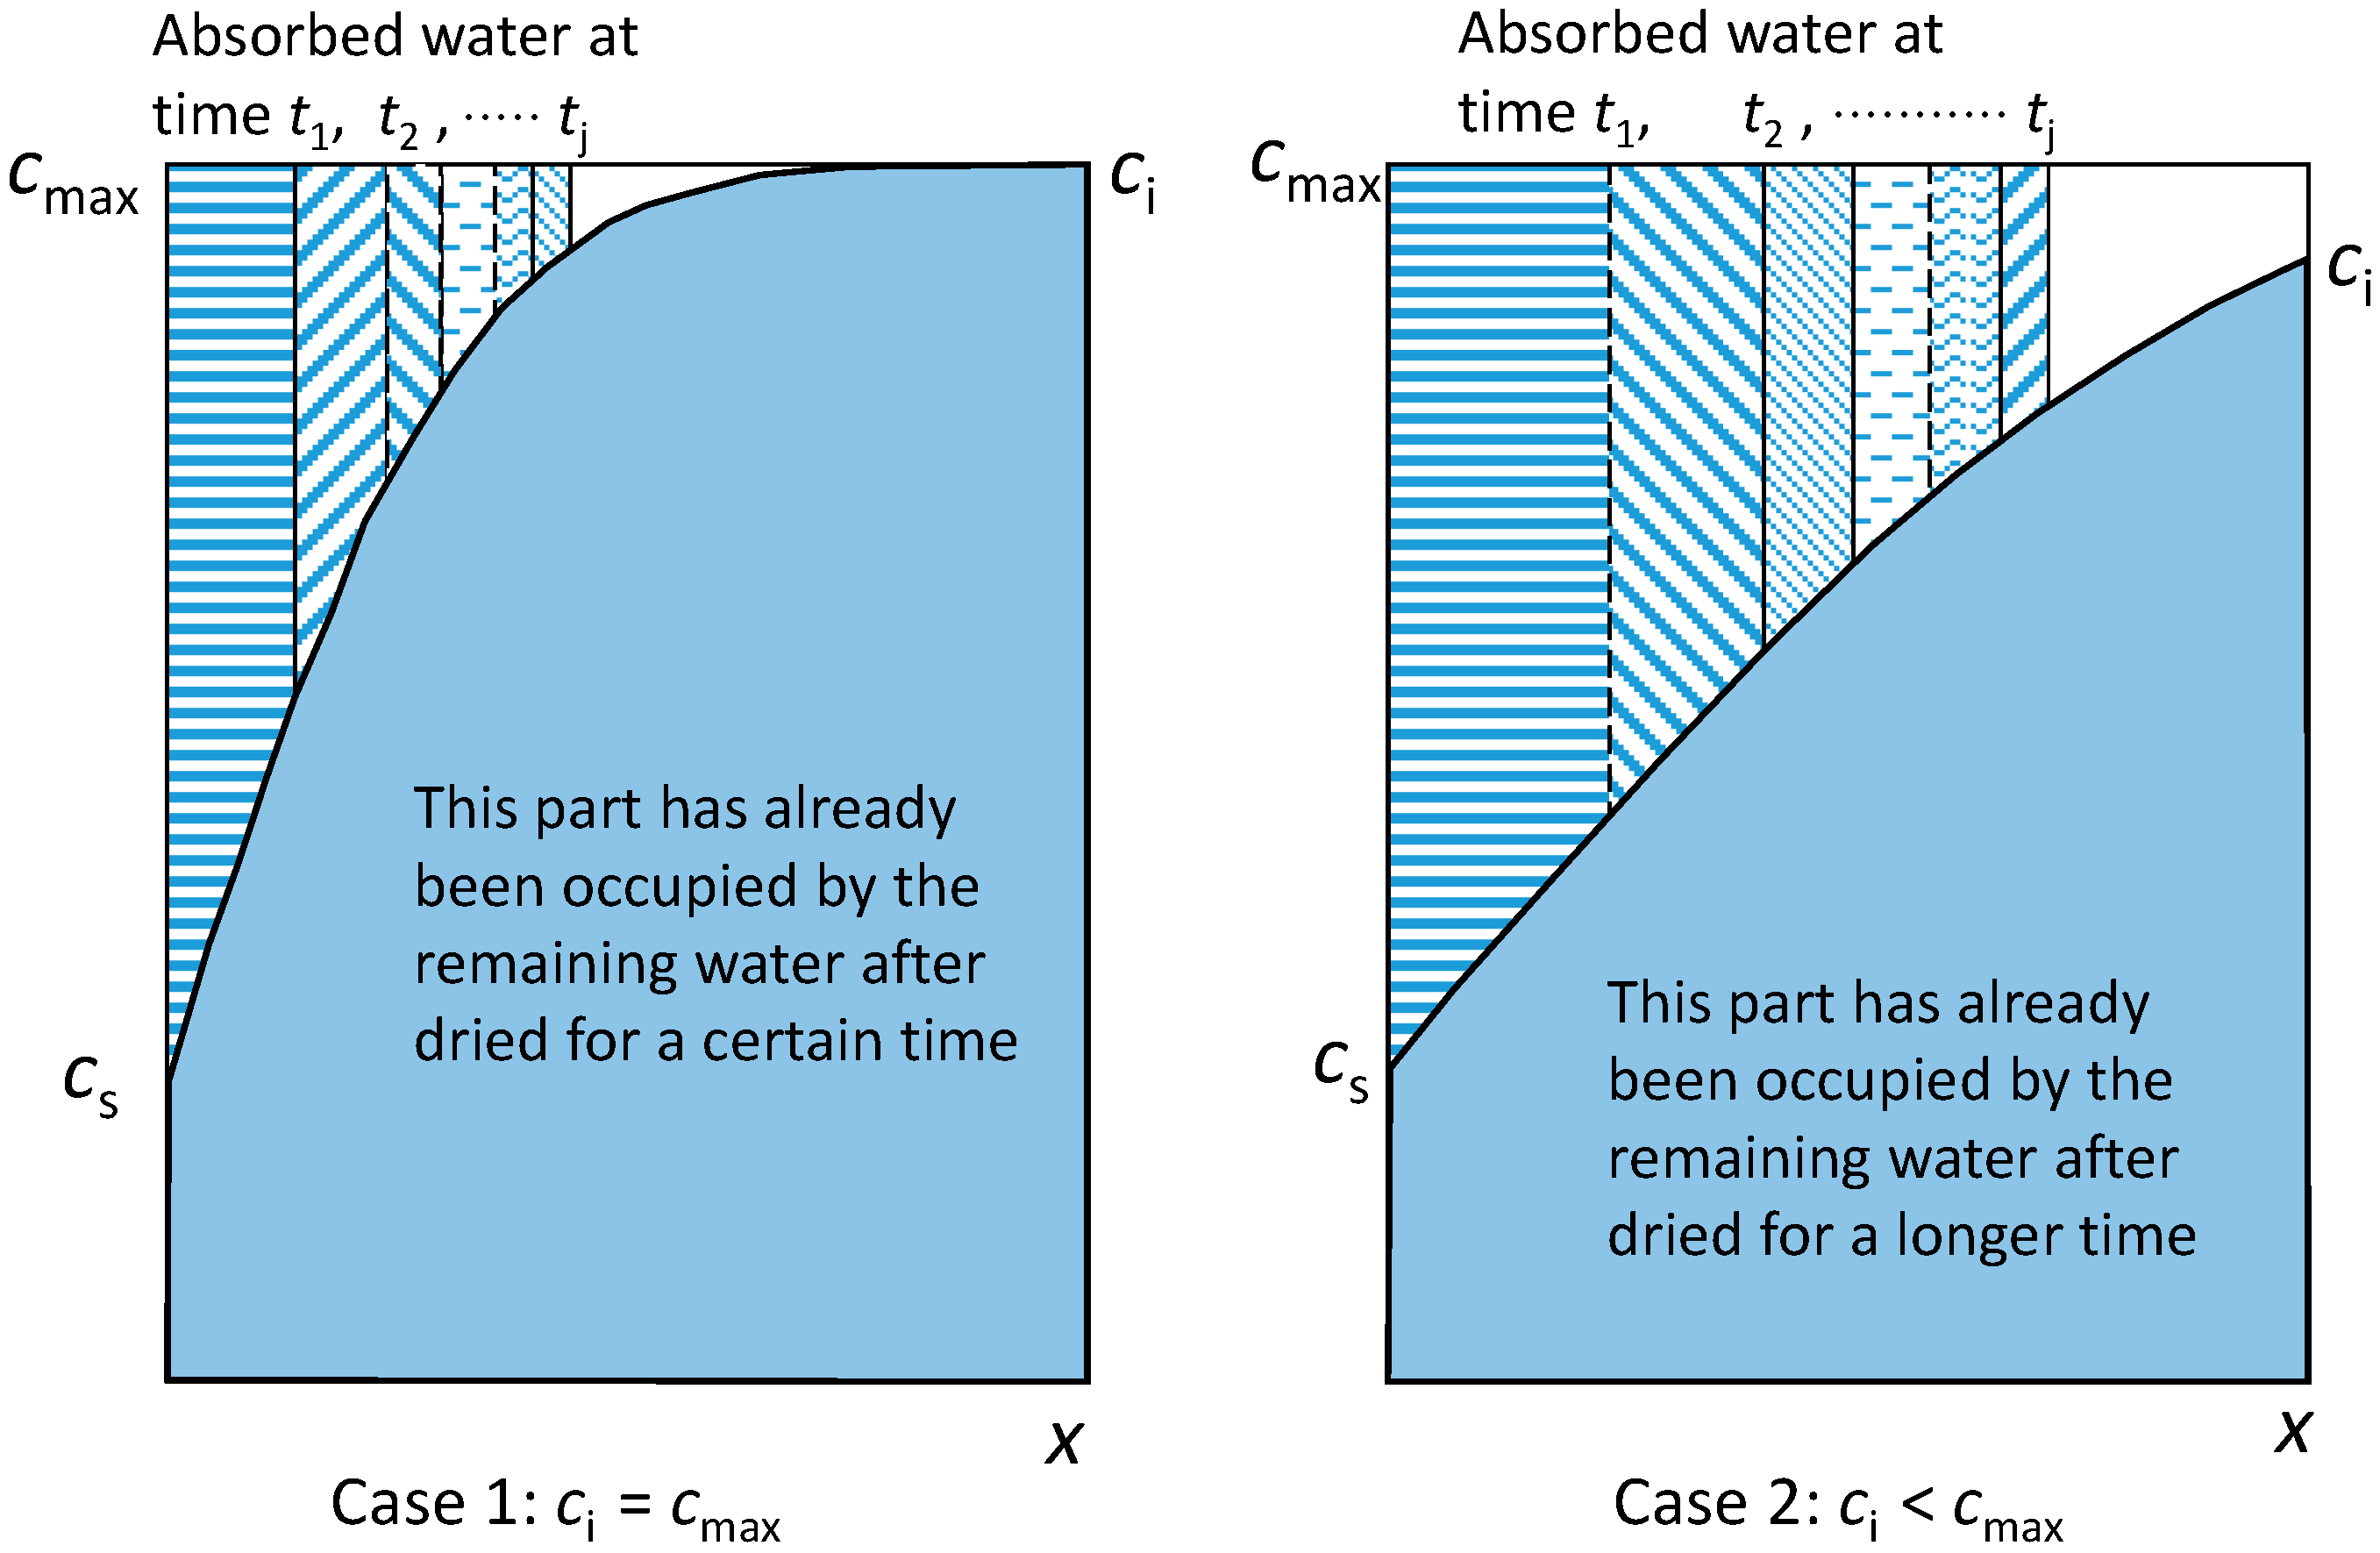
Given that water absorption (capillary suction) occurs significantly faster than evaporation, it is reasonable to assume that the moisture distribution profile remains constant at the onset of the wetting process. Consequently, the weight change during wetting can still be expressed by Equation (11). It is important to emphasize that this initial drying stage begins only after the concrete specimens have reached full water saturation. Figure 1 illustrates two distinct scenarios (Case 1 and Case 2) for the internal moisture profile (water distribution) resulting from the drying phase that precedes the wetting process: (1) Case 1: The specimens are sufficiently thick, or the drying duration is short enough, such that the concrete does not dry out completely. This results in the partially dried moisture profile shown in Figure 1 of Case 1; (2) Case 2: Conversely, if the specimens undergo complete drying throughout their entire thickness, the resulting uniform moisture profile matches Figure 1 of Case 2. In this research, our moisture transport analysis is strictly restricted to Scenario 1. Because the wetting duration in our experimental program is limited to one week, the waterfront does not penetrate the full 80 mm thickness of the specimen.
Regarding this model, two key aspects should be emphasized. First, the dynamic moisture profile c(x, t) is iteratively updated at each time step, enabling the model to inherently capture the continuous evolution of the material’s moisture state without requiring a separate capillary hysteresis formulation. Second, it is acknowledged that moisture diffusivity in cementitious materials is intrinsically non-linear and strongly dependent on both moisture content and pore structure. Although this non-linearity is considered negligible within the short-term timeframe investigated in the present study, it is expected to become increasingly significant in long-term assessments or under varying environmental conditions.

2.2. Experimental Program

2.2.1. Materials and Samples Preparation

The cement used in this study has a Blaine fineness of 380 m2/kg, indicating a relatively fine particle size with a moderate to high specific surface area, which can contribute to enhanced hydration and strength development. Its density is 3130 kg/m3, representing the typical true density of cement and serving as an essential parameter in mix design and related calculations. Natural sand and granitic gravel were used as aggregates. The nature sand had a fineness modulus of 2.6, classifying it as medium sand according to standard gradation requirements. Its apparent density (specific gravity) was 2610 kg/m3, with a water absorption value of 1.0%. the granite gravel (8–16 mm) exhibited an apparent density of 2730 kg/m3, a bulk density of 1580 kg/m3, and a water absorption of 0.8%.
The mixture proportions for the concrete used in this study are listed in Table 1. Three types of air-entrained concrete were employed, utilizing a low-alkali, moderate-heat, and sulfate-resistant cement. Natural sand and granitic gravel were used as aggregates.
Concrete slabs with dimensions of 1000 mm × 700 mm × 100 mm were cast in the laboratory. Prism specimens measuring 500 mm × 100 mm × 100 mm were then cut from the central portion of these slabs after a 14-day moist curing period. These prisms were subsequently stored under wet burlap in the laboratory for over 180 days to ensure maturity.
Finally, two series of test samples were cut from the prisms: (1) Capillary absorption test samples: 100 mm × 100 mm × 20 mm; (2) Drying–wetting test samples: 100 mm × 100 mm × 80 mm.

2.2.2. Water Suction Test and Determination of Capillary Sorptivity Coefficient

The water suction test, as described by the Nordtest method (NT BUILD 368), was used to determine the water sorptivity coefficient of the concrete. Specimens with dimensions of 100 mm × 100 mm × 20 mm were pre-dried in an oven at 40 °C for approximately one week until the weight became constant (defined as a weight change < 0.5% over 24 h). Subsequently, the samples were removed from the oven and cooled to room temperature (approximately 20 °C).
After being weighed to determine their initial mass, the samples were placed on a grating in a water vessel. One 100 mm × 100 mm surface was exposed to water, with the water level maintained at approximately 1 mm above the grating. Weight gains were recorded at specific intervals (typically 15 min, 30 min, 1 h, 2 h, 4 h, 8 h, 24 h, 72 h, and 168 h) until a constant weight was achieved.
The capillary sorptivity coefficient k is obtained from the initial slope of the relationship between moisture gain and the square root of time. The water flow through the exposure area is expressed as:
W w · a = ρ w · a · x
where a is the exposure surface area. By substituting Equation (10) into Equation (12) and rearranging, the following equation is obtained:
k = W w ρ w   ·   t
In this expression, W w is the moisture gain and ρ w is the density of water. Once the samples reached saturation (indicated by moisture appearing on the top surface and the weight stabilizing), they were dried at 105 °C to a constant weight. The moisture contents before and after the water suction test were then determined and denoted as c 40   ° C and c m a x , respectively.

2.2.3. Drying–Wetting Experiment and the Determination of Moisture Diffusion Coefficient

To ensure one-dimensional moisture transport, all surfaces except for one 100 mm × 100 mm face of each 100 mm × 100 mm × 80 mm sample were coated with epoxy resin. Once the epoxy had hardened, the samples were saturated under atmospheric pressure by submerging the uncoated exposure surface in water for one week until the weight stabilized (defined as a weight change < 0.5% over 24 h).
Subsequently, excess water was removed from each sample using a moist towel. The samples were then transferred to a climate chamber maintained at a constant temperature and humidity (20 ± 2 °C, 50 ± 5% RH) for the evaporation test. The weight loss of each sample was recorded at specific intervals, typically 15 min, 30 min, 1 h, 2 h, 4 h, 8 h, 24 h, 72 h, and 168 h until a constant weight was achieved.
Additionally, control samples (100 mm × 100 mm × 20 mm), similar to those used in the water suction test, were stored in the climate chamber for an extended period (exceeding six months) to determine the equilibrium moisture content at 20 °C and 50% RH, denoted as cs.
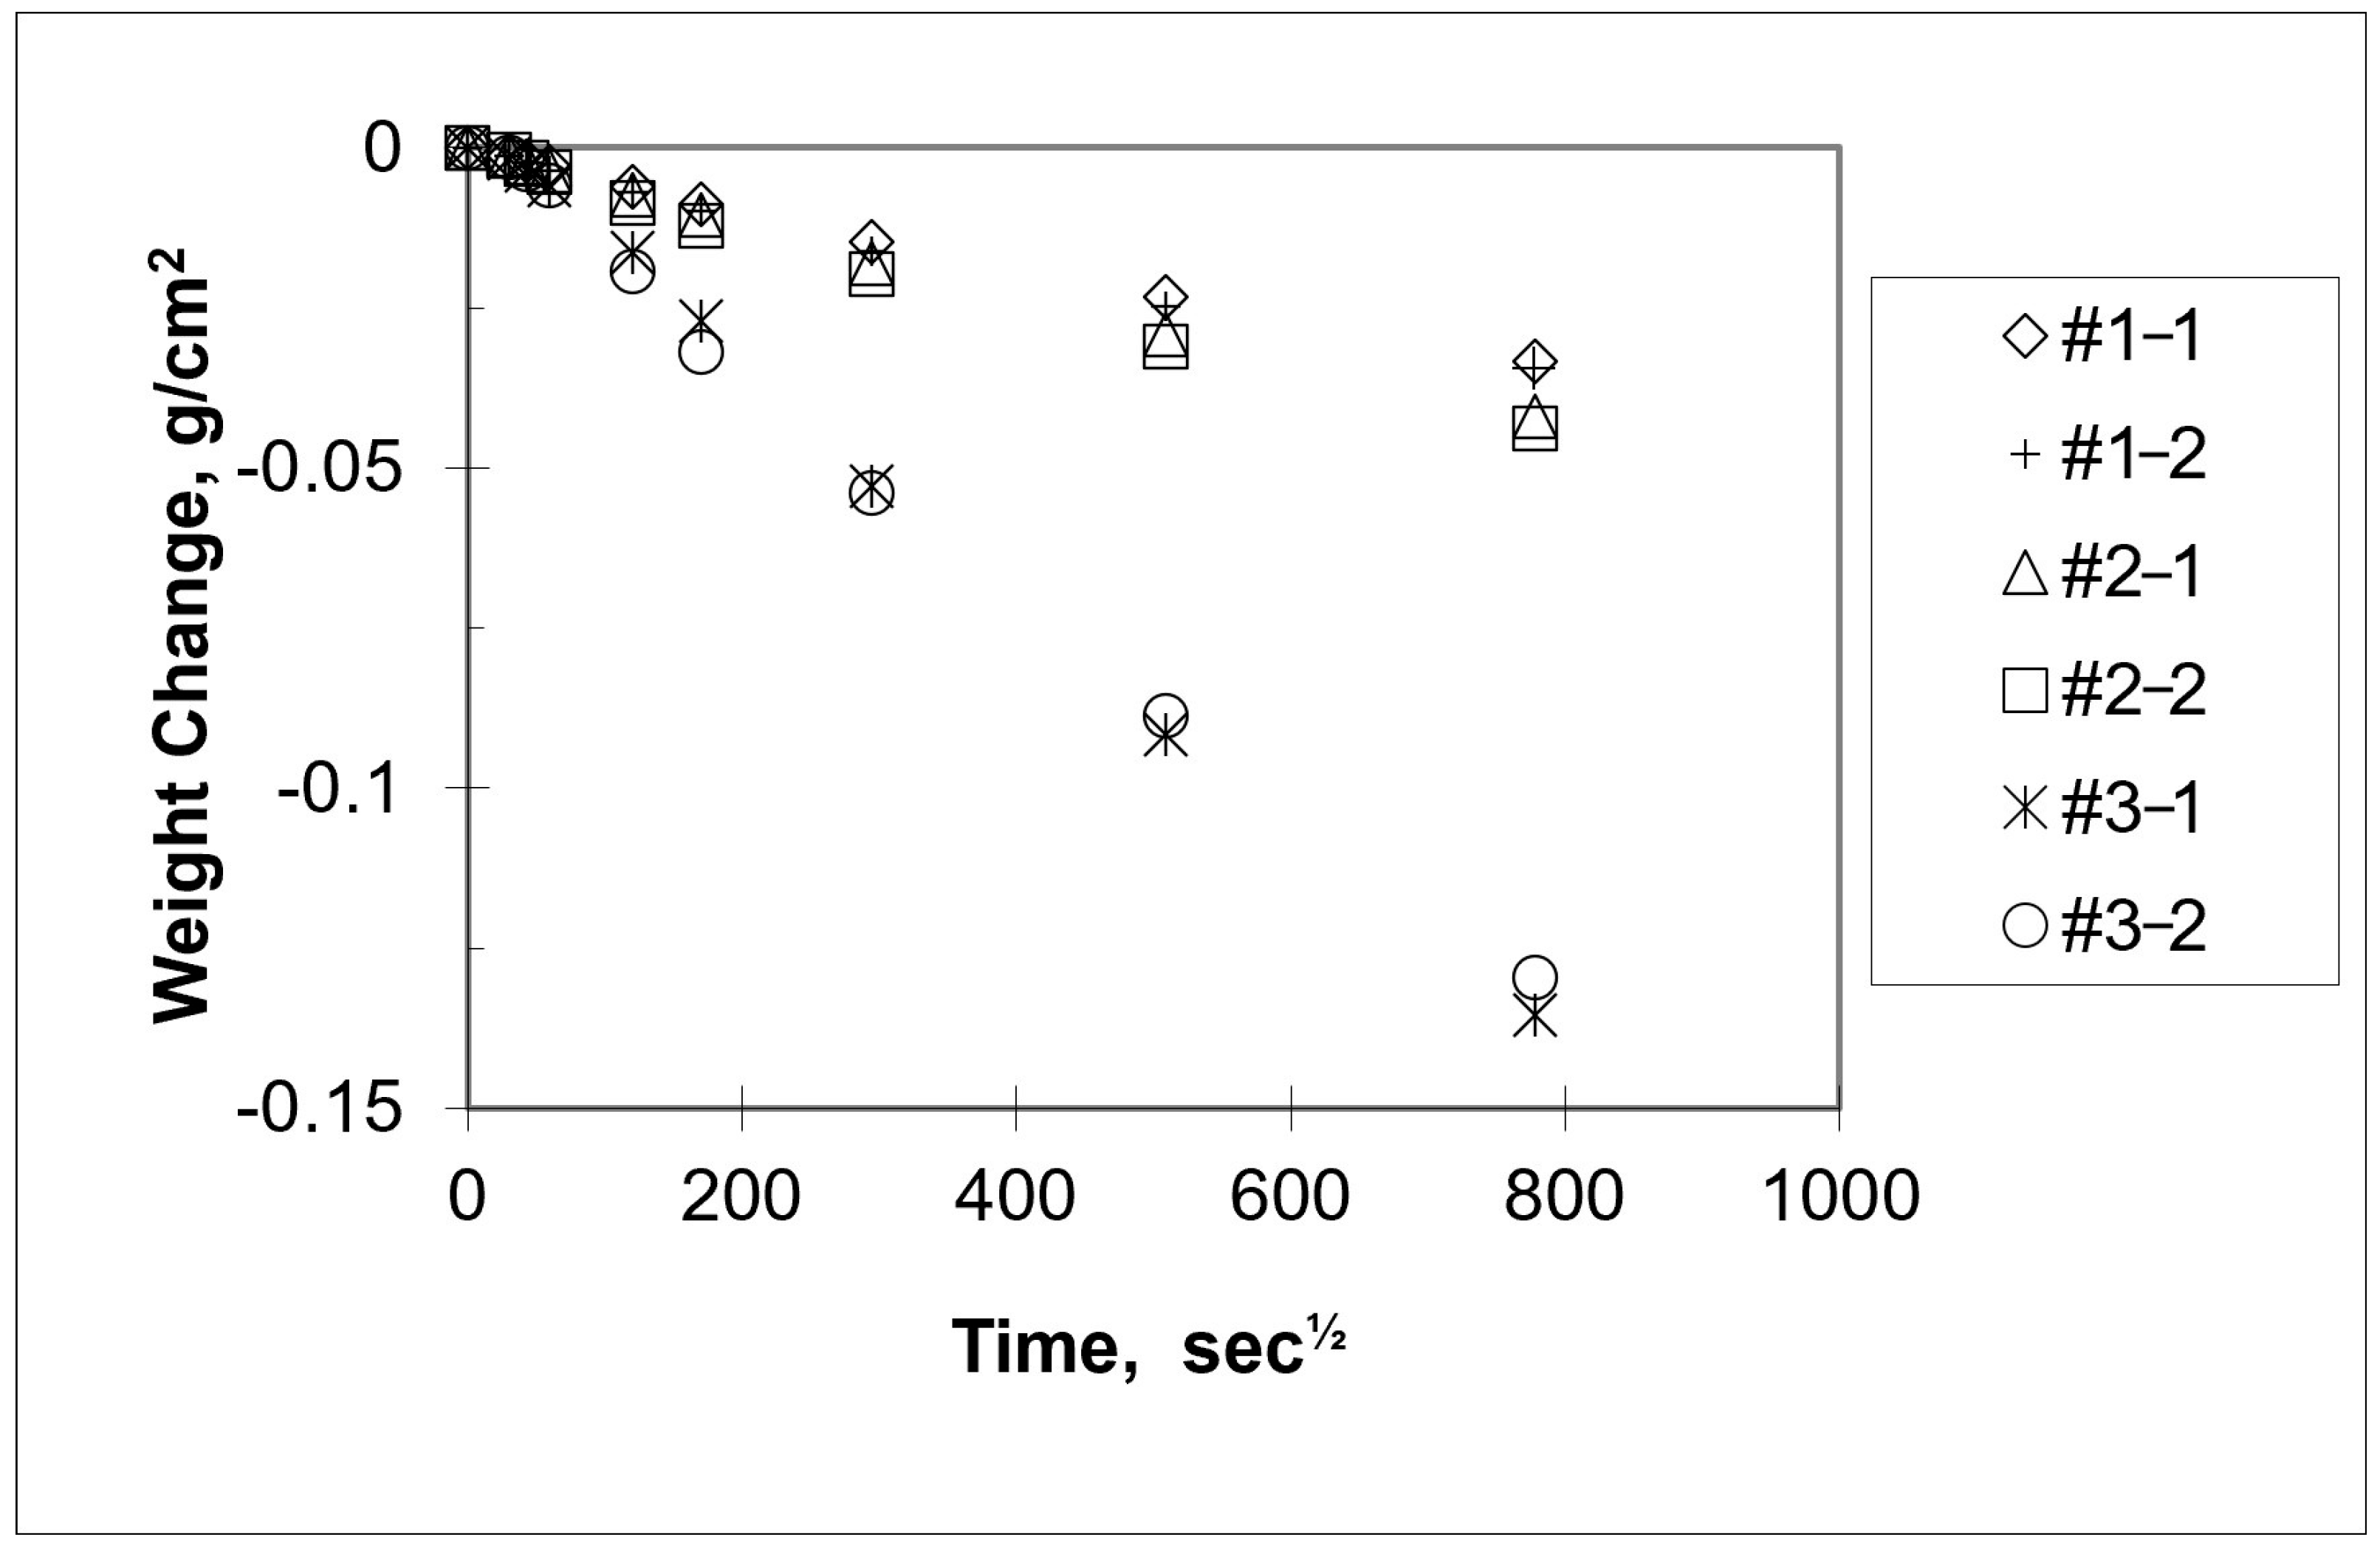
As shown in Figure 2, the experimental results regarding moisture loss reveal a highly linear dependency on the square root of time.
The moisture diffusion coefficient D can be determined from the slopes obtained in Figure 2 according to governing Equation (7). The calculation is performed using the following expression:
D = π 4 W d t d 2 · 1 c s + c i 2
It should be noted that while this expression for the moisture diffusion coefficient appears similar to the Dw term proposed by Krus and Künzel [36], the underlying physical assumptions differ significantly. Our equation is derived from the diffusion governing equation, where the driving force is the moisture gradient. In contrast, Krus and Künzel’s equation is derived from the capillary suction process, where the driving force is capillary pressure. These represent two fundamentally different transport mechanisms.
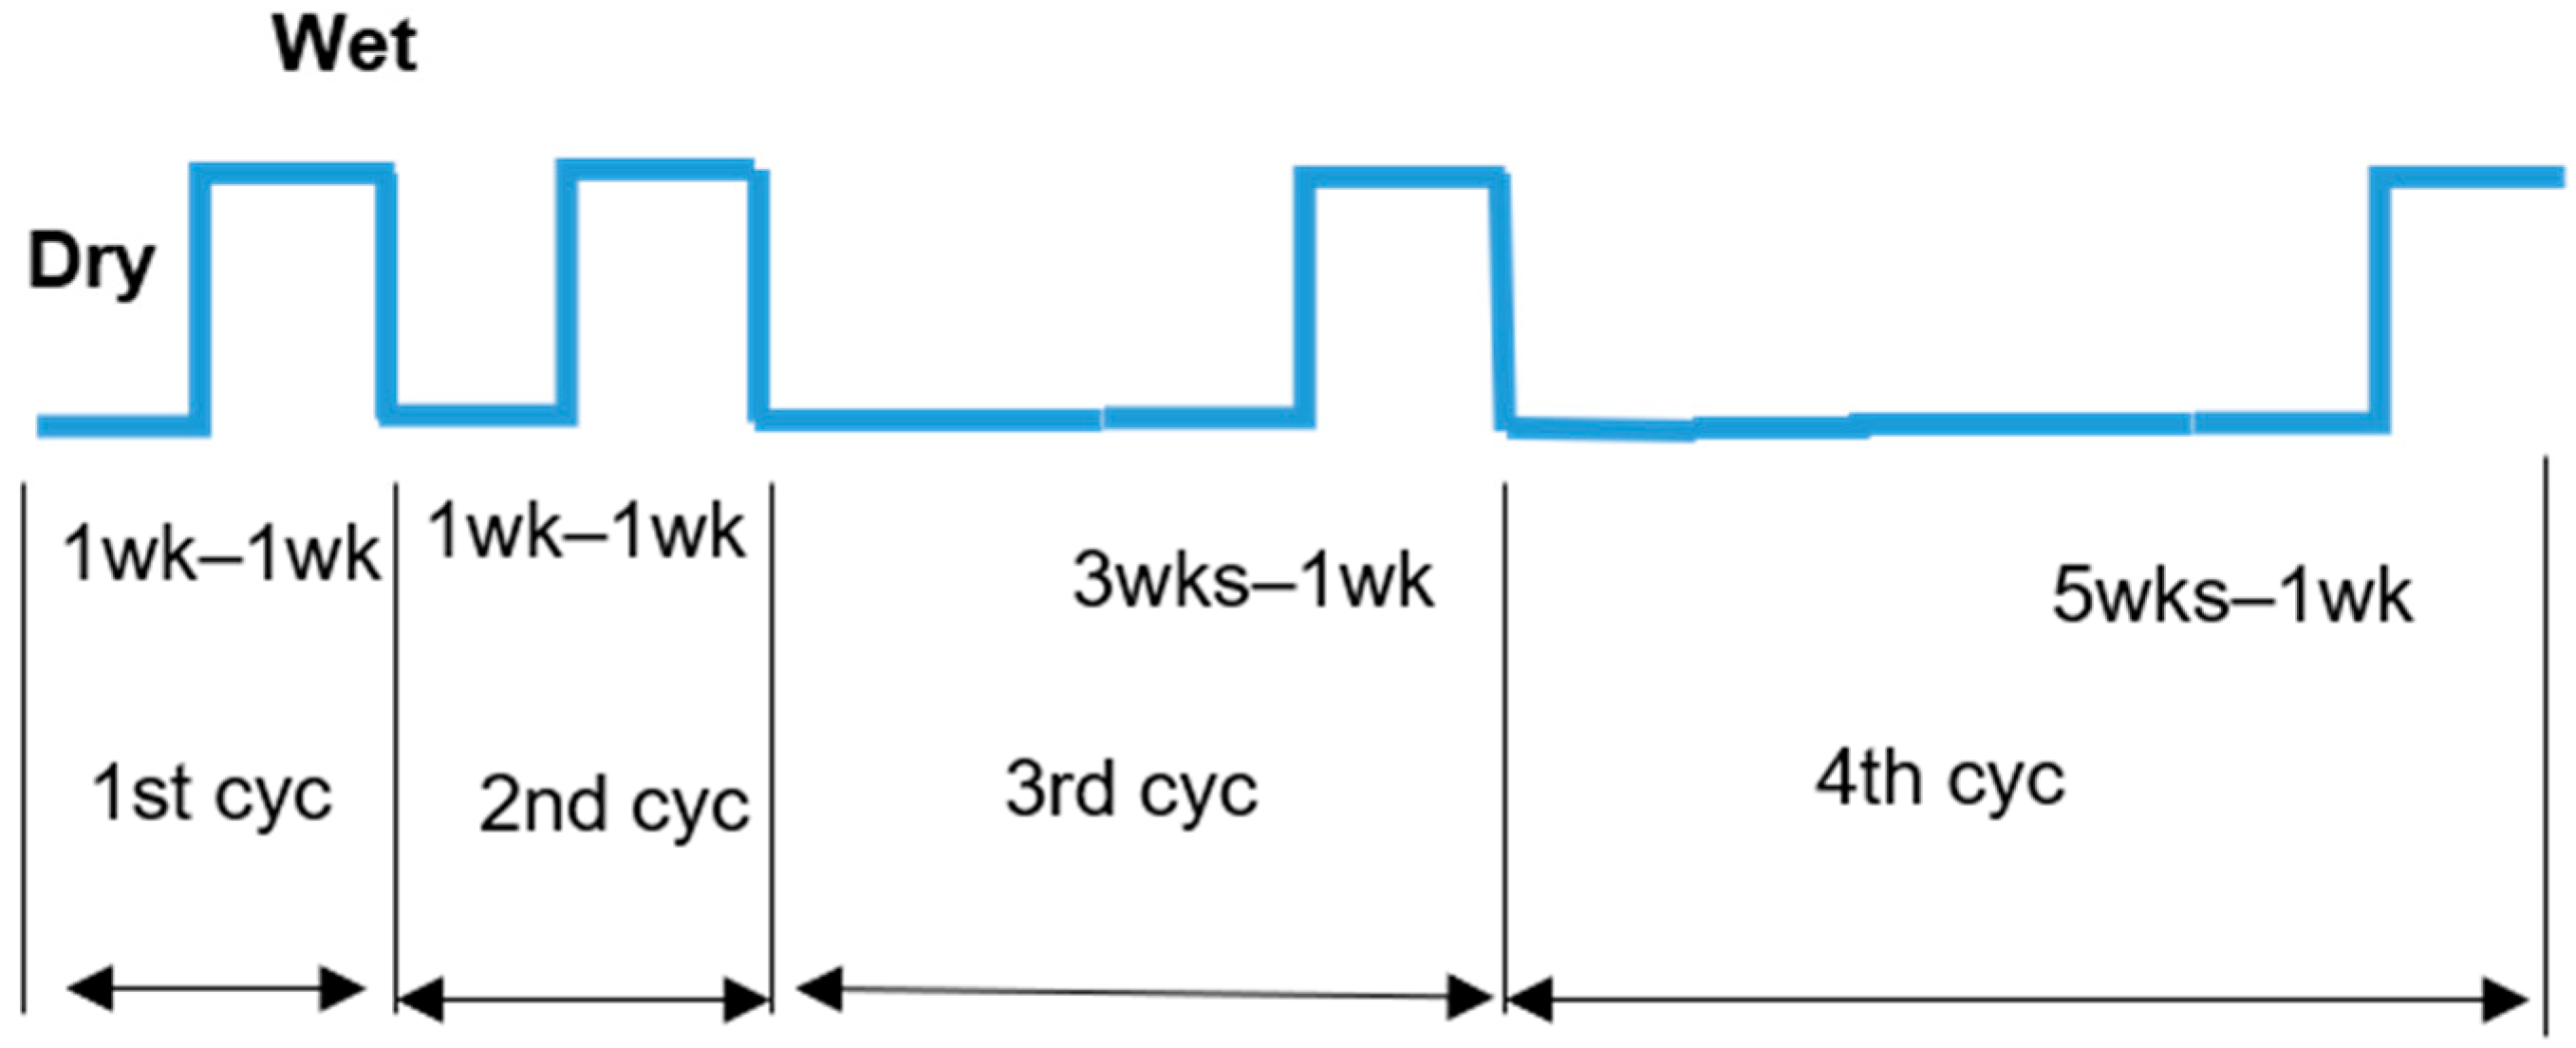
After the evaporation test, the samples were subjected to drying–wetting cycles according to the regime illustrated in Figure 3.

2.2.4. Description of Calibration Coefficient ε

The capillary sorptivity coefficient k was obtained from the water suction test under a pre-drying condition of 40 °C, which is significantly drier than the environment of the drying–wetting experiment (20 °C and 50% RH). Consequently, the volume of open pores available for water suction on the exposure surface during the wetting phase of the dry–wet cycles is lower than that in the standard Nordtest method.
Furthermore, due to the higher internal moisture content (approaching saturation) in the concrete, air trapped between the exposure surface and the saturation front becomes compressed upon contact with water. This compressed air creates a “blocking effect” that hinders water suction. Therefore, a calibration factor ε (ε ≤ 1) is introduced to correct these differences in test conditions. The value of ε may be influenced by the following factors:
ε c m a x c 20 ° , 50 % c m a x c 40 ° · f r , s
where f(r, s) is a function of pore size r and space factor s between air pores/voids. The space factor is a critical parameter for evaluating the quality of air-entrained concrete, as it relates to the material’s ability to resist freeze–thaw damage. In Northern Europe, air-entrained concrete is widely used to mitigate the effects of environmental freeze–thaw cycles.
Quantifying this function remains a challenge and requires further characterization of the pore systems in concrete (especially on air-entrained concrete). Consequently, this study treats ε as an empirical parameter refined to fit the experimental data. While microstructural characterization offers insights into material geometry, directly measuring ε via dry-saturation experiments avoids the scaling inaccuracies often introduced by theoretical pore-structure formulations.
This calibration is necessary because of differing environmental conditions: the sorptivity coefficient k is obtained via a standard suction test after pre-drying at 40 °C, whereas the drying phase occurs at 20 °C for drying–wetting cycles. In practice, the sorptivity coefficients obtained under these distinct drying conditions vary significantly, and ε serves to reconcile these differences.

3. Model Verification and Discussion

3.1. Model Verification

Table 2 summarizes the property parameters required for modeling the three types of concrete. These values were derived from the experimental results and estimations described previously, assuming ci = cmax. This assumption is based on the observation that the drying period was not sufficiently long to reduce the initial moisture content (ci) in the deep interior of the sample below its original saturation value (cmax). Notably, the cmax value for Sample No. 1 is higher than that of Sample No. 2, which may be attributed to a higher cement content or potentially less effective compaction in Sample No. 1.
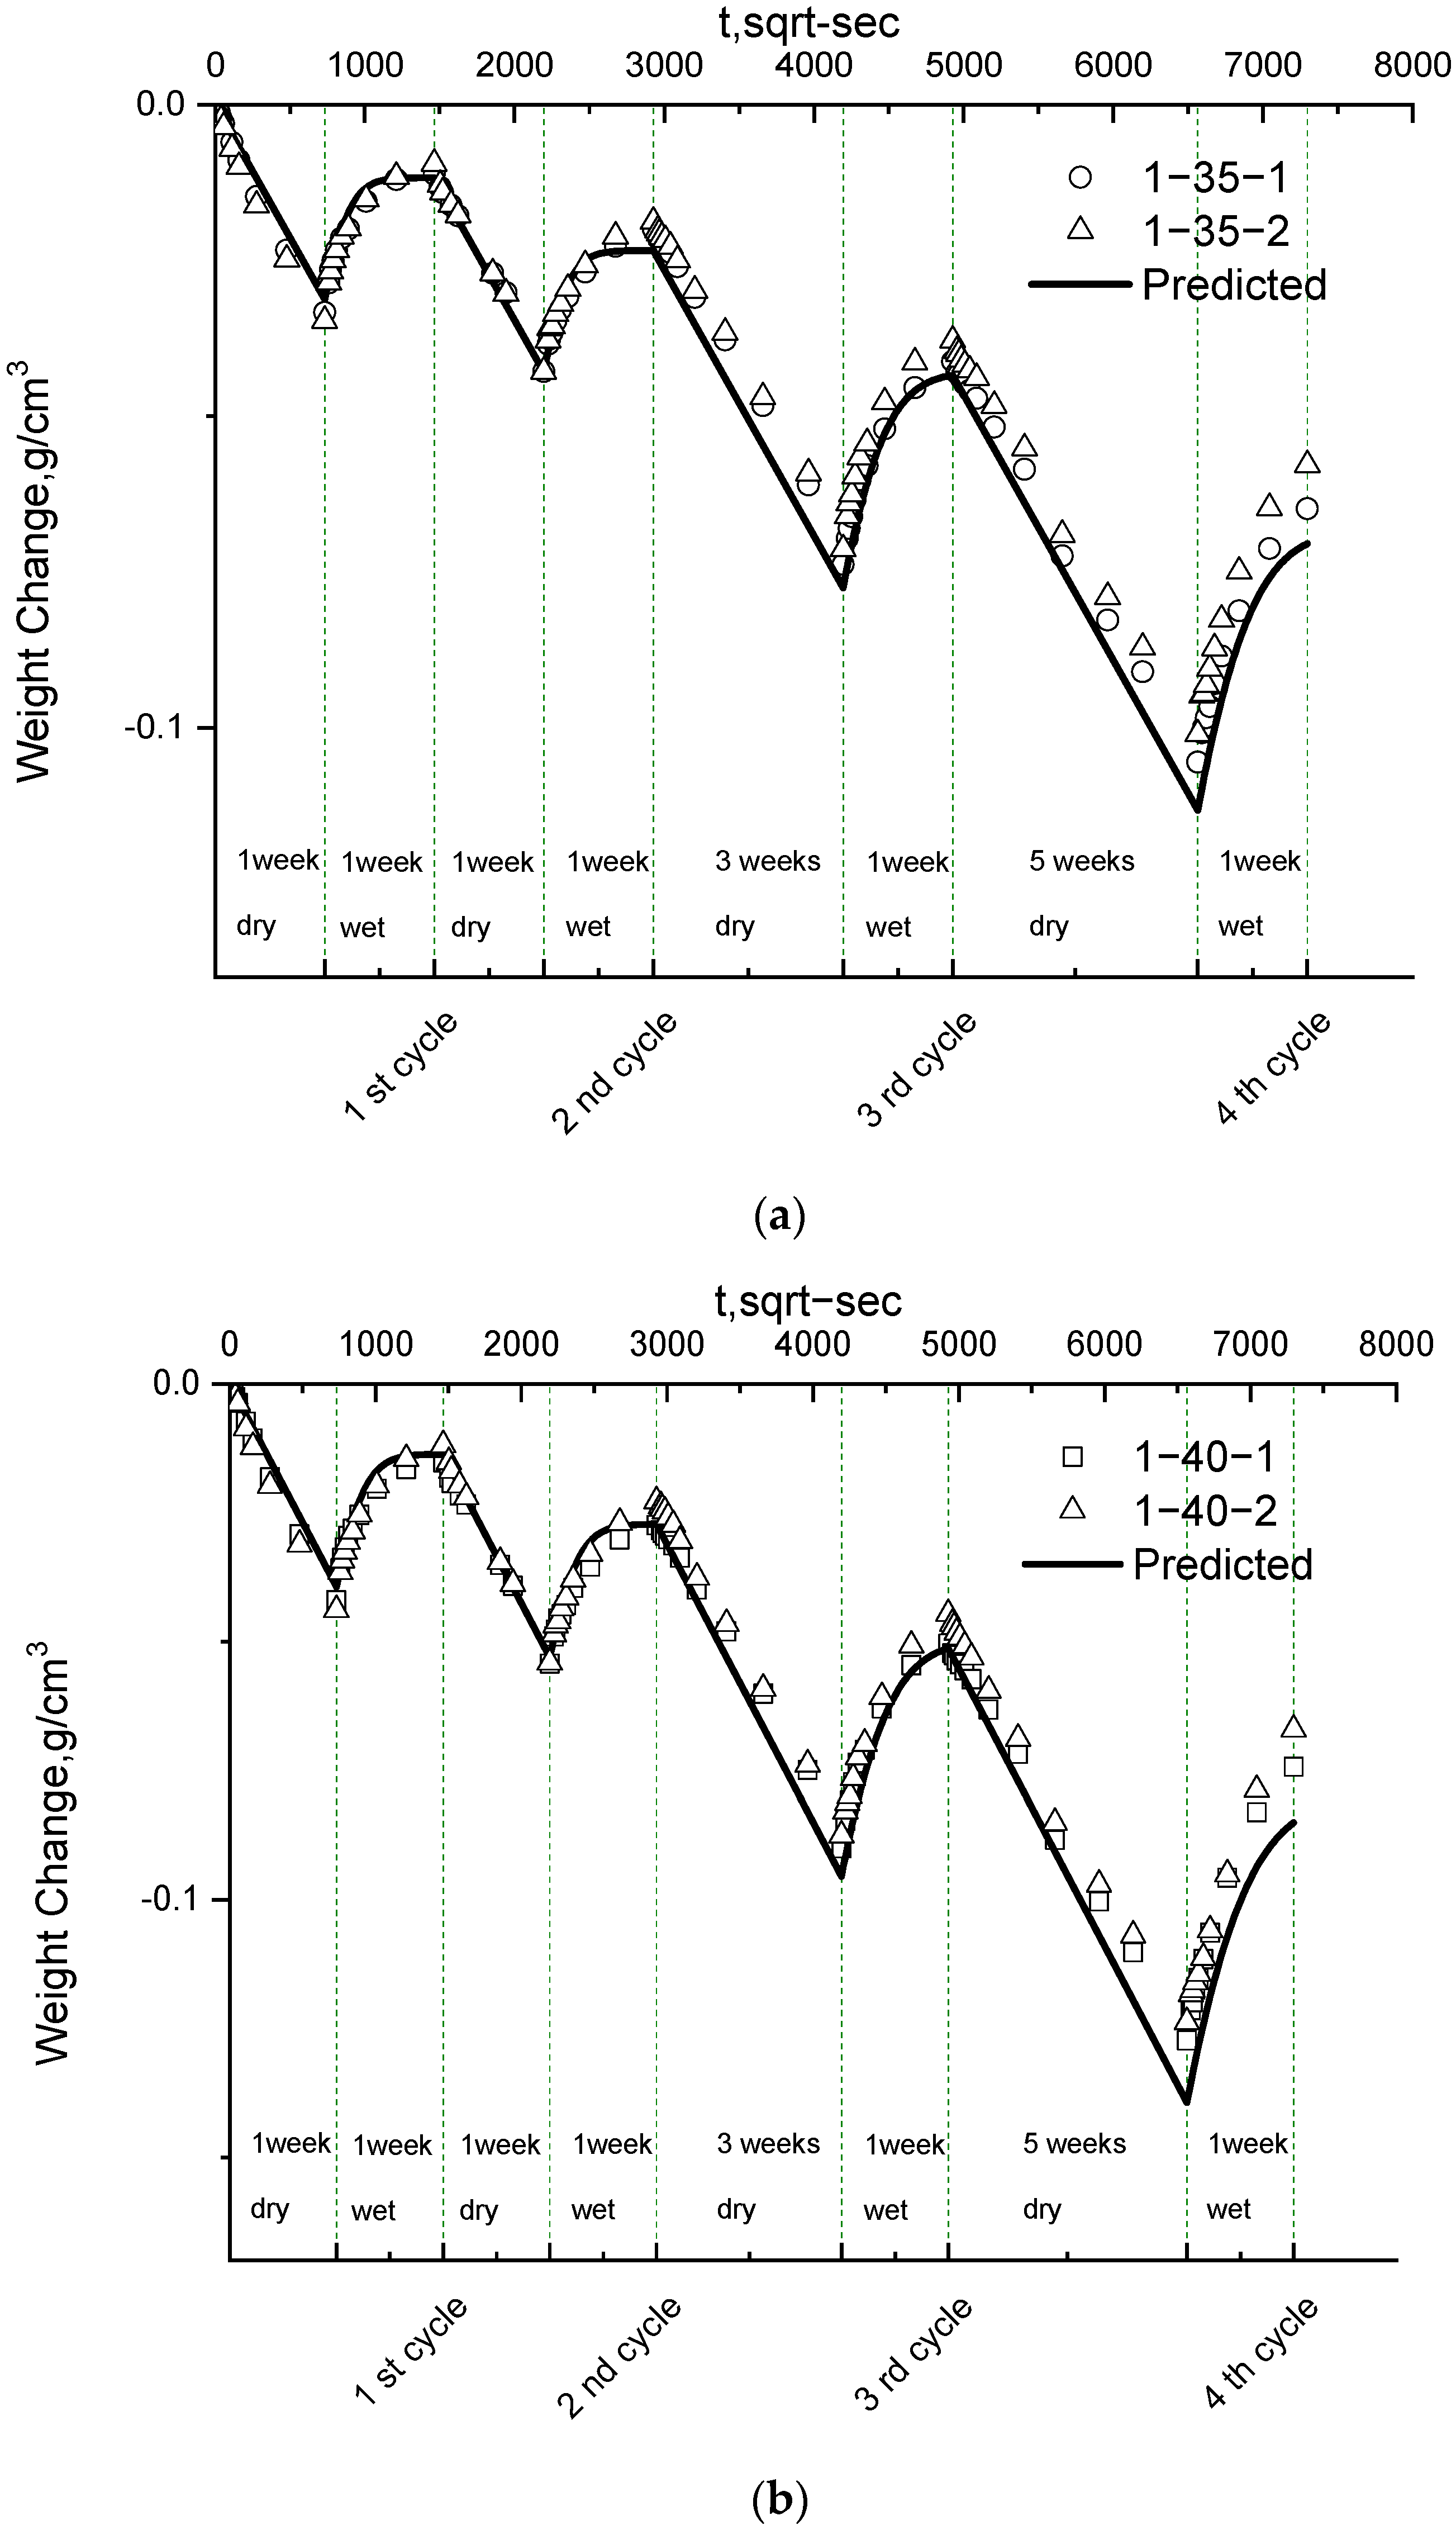
To evaluate the repeatability and reproducibility of the experimental results, a systematic replication strategy was implemented across the concrete mixtures. For Concrete Mixes No. 1 and No. 2, two parallel experimental groups were established (for instance, designated as “1-40-1” and “1-40-2” for Mix No. 1). Within each parallel group, 3 to 5 individual specimens were tested, aligning with standard practice for moisture transport characterization. Conversely, initial testing of Concrete Mix No. 3 revealed a higher discrepancy between the empirical observations and the numerical modeling predictions than was observed for Mixes No. 1 and No. 2. To thoroughly evaluate and minimize the experimental uncertainty associated with this specific highly porous mixture, two additional parallel groups were prepared and tested, expanding the baseline dataset for validation. The moisture content for samples subjected to drying–wetting cycles was simulated and solved using Mathcad software ((Version 14.0, PTC, Needham, MA, USA)), based on the analytical model developed in this study.
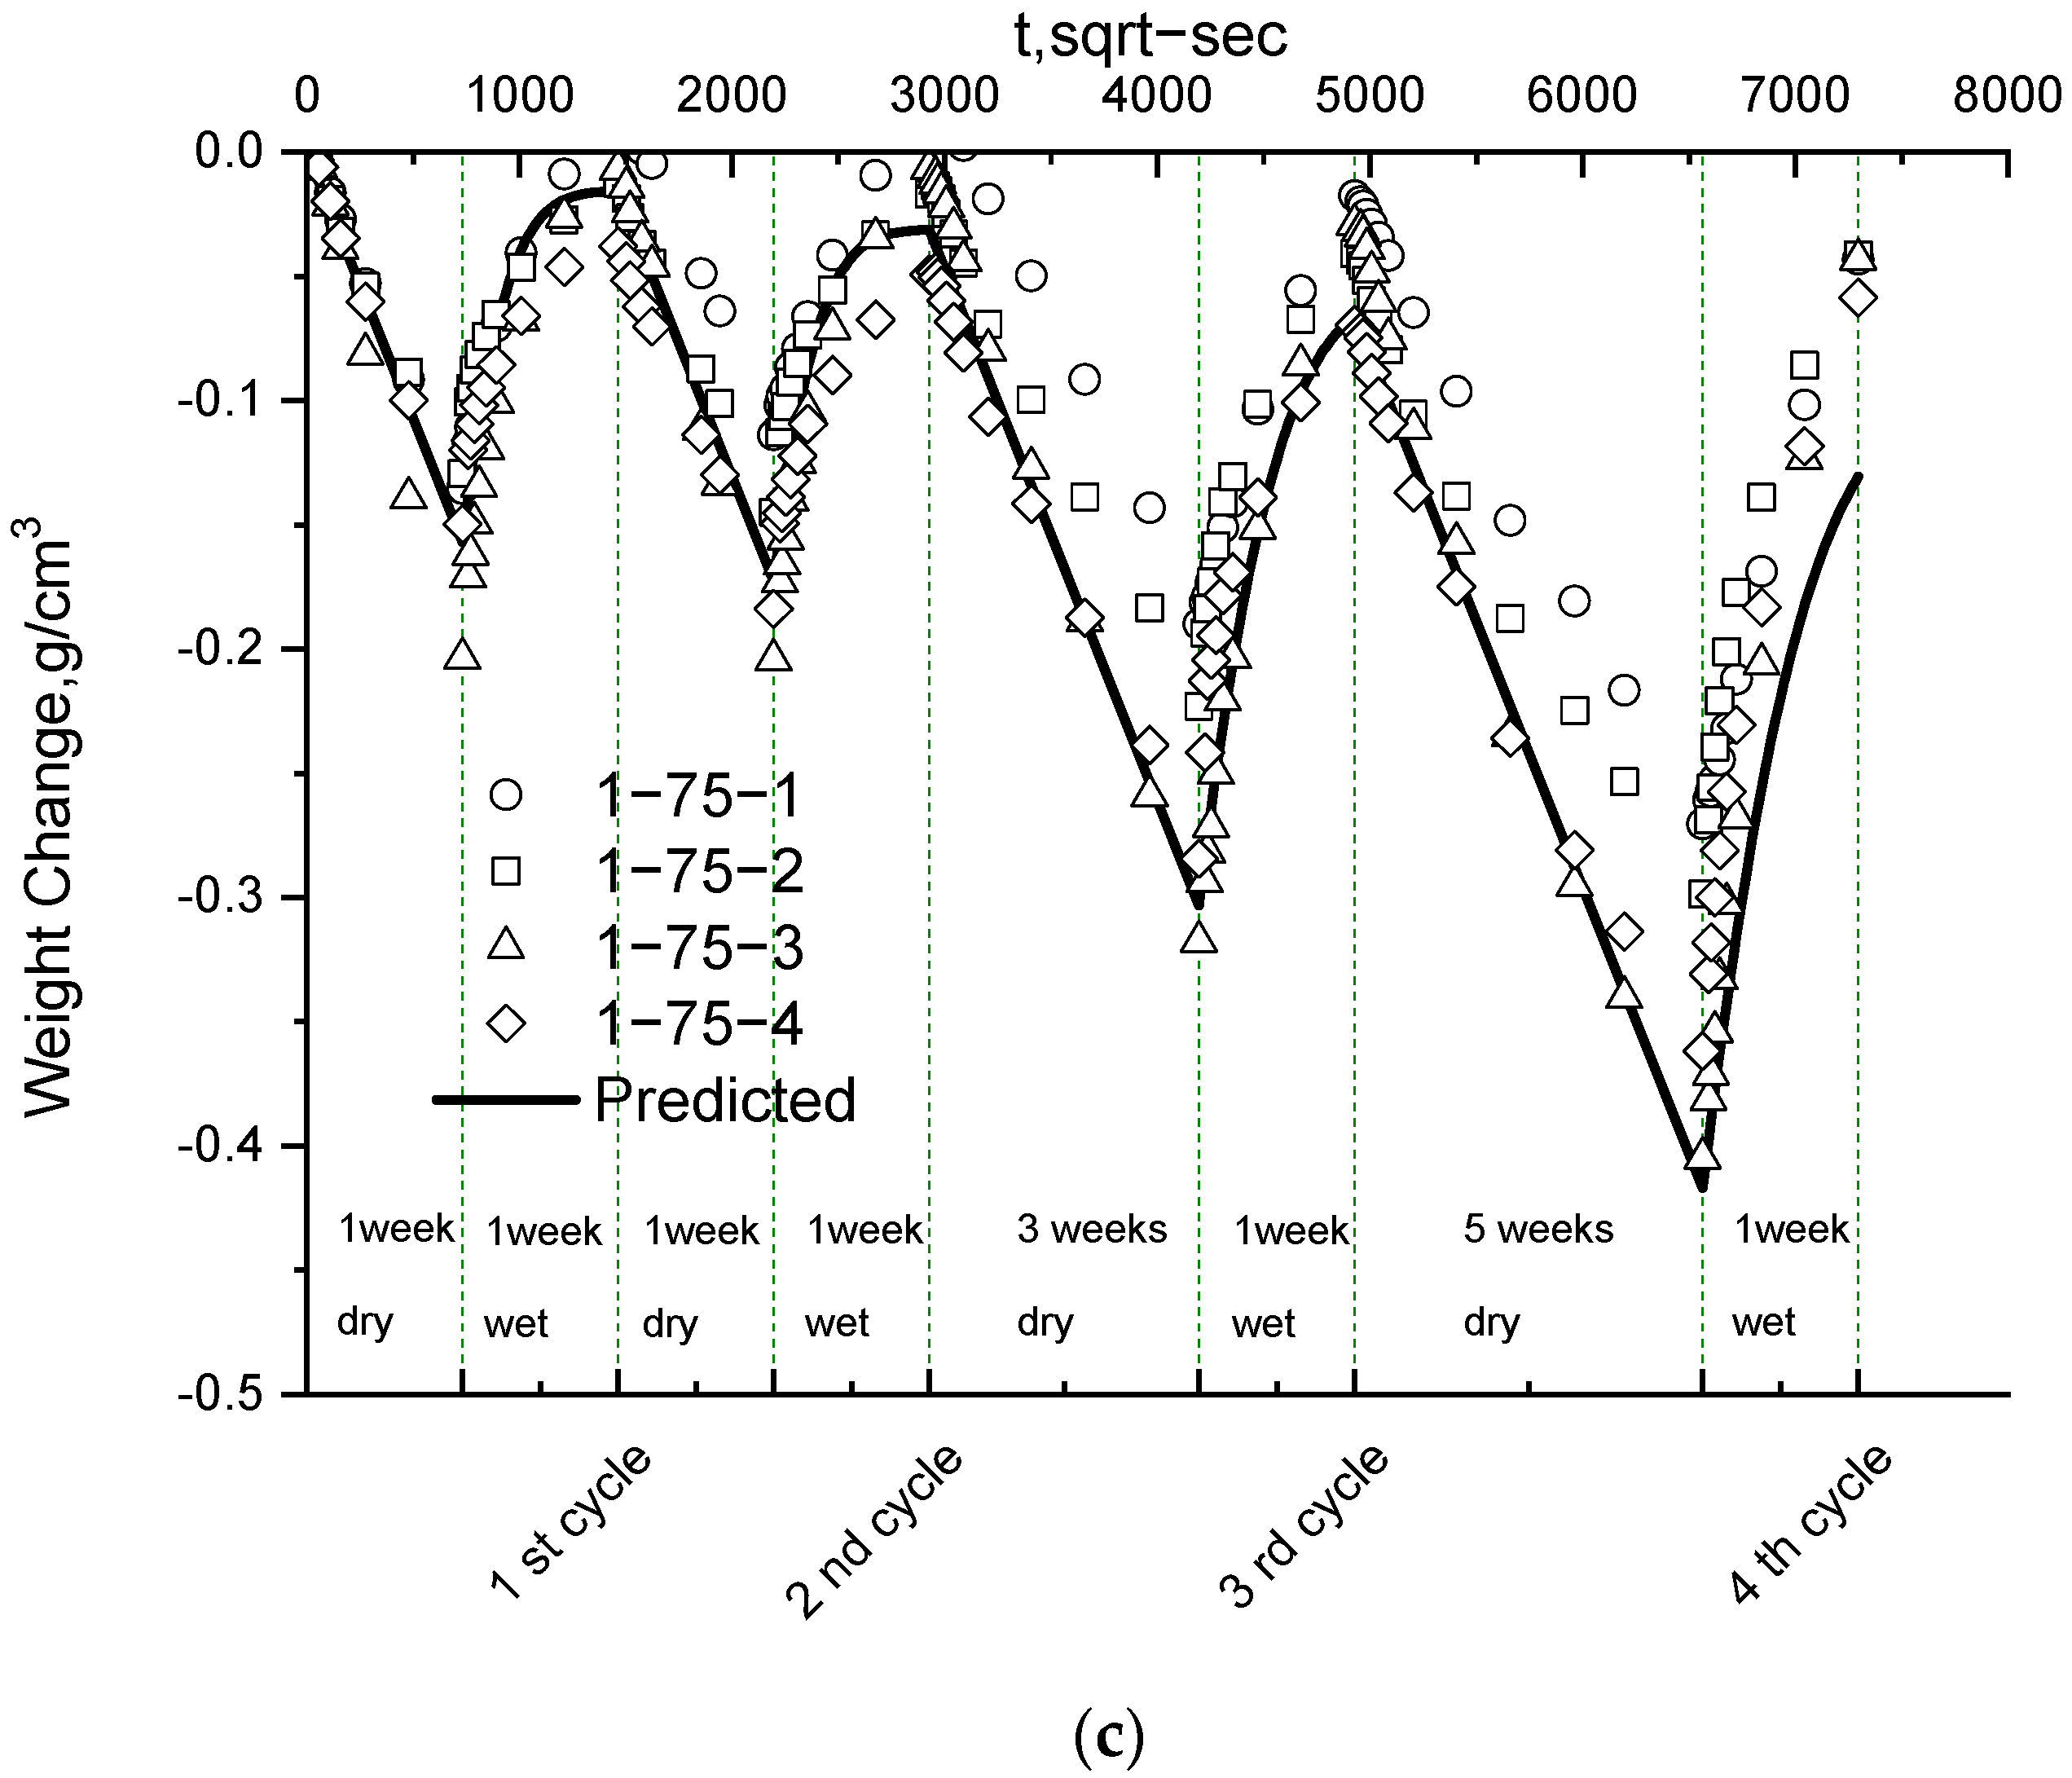
A comparison between the simulated results and experimental data is presented in Figure 4. The simulated results demonstrate excellent agreement with the experimental data; for Samples No. 1 and No. 2, the relative error remained below 5% during the first three drying–wetting cycles and below 10% during the fourth cycle. For Sample No. 3, the simulated results showed good agreement with a relative error below 15%, which is considered acceptable for such porous media.
However, the experimental data for Concrete No. 3 exhibited greater scatter than those for Samples No. 1 and No. 2. This is likely because Sample No. 3 (with w/c 0.75) possesses a larger volume of coarse capillary pores. These pores facilitate moisture transport into the entrained and entrapped air voids, which effectively act as “water traps.” This trapping mechanism introduces pronounced hysteresis behavior, thereby increasing the uncertainty and complexity of the moisture transport dynamics in this specific concrete type. Furthermore, No. 3 has a higher water-to-cement ratio than No. 1 and No. 2, indicating a higher porosity, larger open pore volume, and reduced moisture hysteresis compared with the other samples. Consequently, the value of ε for No. 3 is much closer to 1 than those of No. 1 and No. 2, meaning that the transport coefficients for No. 3 require less calibration. This also suggests that the function f(r, s) for highly porous concrete requires more precise determination in future research.

3.2. Analysis of Moisture Trends and Model Deviations

It is interesting to observe that the moisture content in the concrete generally decreased after each drying–wetting cycle. Although the rate of suction (k) is higher than the rate of diffusion ( D ), the total amount of water diffused out of the sample was larger than the amount sucked in during cycles of equal duration. This occurs because diffusion (drying) takes place across the entire exposure surface, whereas suction (wetting) occurs across a reduced effective surface area. This effective area is further diminished with depth due to the residual moisture trapped within the concrete. This residual moisture, which follows the error-function distribution expressed in Equation (11), has been integrated into the model developed in this study. Consequently, the simulated moisture profiles show a strong fit with the experimental data.
After the third drying–wetting cycle, the simulated moisture profiles began to fall below the experimental values. One possible explanation is that after five weeks of drying, the internal moisture content (ci) dropped below the initial saturation value (cmax). Since our simulation maintained the assumption that ci = cmax, this led to an underestimation of the potential water suction capacity.
Another contributing factor could be the development of micro-cracks resulting from prolonged drying, which has been shown to increase the capillary sorptivity coefficient k [37]. Moisture flow and associated drying can induce shrinkage strains and stresses significant enough to cause cracking. As shrinkage triggers deformations and volume changes, eigen-stresses may accumulate and eventually manifest as micro-cracks [38]. It is highly probable that the shrinkage induced by moisture transport altered the fundamental transport properties of the concrete over time.

4. Conclusions

This study proposed a novel analytical model for moisture transport in concrete under cyclic drying and wetting conditions. Key material parameters, specifically the capillary sorptivity coefficient (k) and the moisture diffusion coefficient (D), were determined through standardized water suction and evaporation tests. The methodologies established here are adaptable to various concrete types and different saturation standards.
A comparison between the analytical results and experimental data showed excellent agreement, validating the distinct transport mechanisms assumed for the drying and wetting phases. Consequently, the proposed model is recommended for predicting moisture transport in concrete structures subjected to natural dry–wet cycles.
Specifically, the following conclusions were drawn:
  • Drying Stage: Moisture transport in initially saturated concrete is governed by diffusion driven by concentration gradients. The moisture distribution follows an error-function solution to Fick’s second law, as reflected in the derived governing Equation (7). The strong linear relationship between moisture loss and the square root of time provides a reliable basis for determining the diffusion coefficient using Equation (14).
  • Wetting Stage: Transport is dominated by capillary suction driven by capillary pressure. The moisture gain is described by Equation (11), which combines the sorptivity function with the pre-existing error-function moisture profile from the drying stage as an initial condition. The sorptivity coefficient is effectively determined from Equation (10) via the Nordtest method (NT BUILD 368).

5. Limitations and Future Outlook

The calibration factor ε was utilized as an empirical parameter to reconcile discrepancies in sorptivity coefficients caused by differing environmental conditions. This factor is inherently linked to the pore size (r) and the space factor (s) between air voids. For highly porous concrete with complex tortuosity, the function f(r, s) requires more precise characterization. Future research should focus on quantifying this relationship through advanced pore-system modeling to transition ε from an empirical to a deterministic parameter.
Moreover, it should be emphasized that the focus of this study is restricted to validating the foundational physics of the model under controlled laboratory conditions. While real-world service conditions and a broader range of material mixes represent vital areas for practical engineering, they fall outside the scope of this work and will be addressed in subsequent investigations.

Author Contributions

Conceptualization, Y.C. and L.T.; methodology, Y.C.; software, G.W.; validation, S.W., J.G. and J.G.; formal analysis, Y.C.; investigation, G.W.; resources, L.T.; data curation, S.W.; writing—original draft preparation, Y.C.; writing—review and editing, S.W.; visualization, Y.C.; supervision, L.T.; project administration, G.W.; funding acquisition, G.W. All authors have read and agreed to the published version of the manuscript.

Funding

This research received no external funding.

Data Availability Statement

The data underpinning the findings of this study are available from the corresponding author upon reasonable request. Interested readers or researchers may contact Yanjuan Chen at yanjuan1105@gmail.com to inquire about access. Please note that data sharing may be subject to the author’s approval and governed by applicable data sharing agreements, depending on the nature and sensitivity of the requested information.

Acknowledgments

This work was supported by the Postdoc Project Program 915518 in Aalto University (postdoc/T214), National Nature Science Foundation of China (51578141), Technology innovation Research Project (JSGG: 20160429111117023). The author also gratefully acknowledges the support of the European Union’s Horizon 2020 research and innovation programme under the MSCA COFUND grant agreement No. 101034352, with additional co-funding from the VUB Industrial Research Fund.

Conflicts of Interest

The authors declare no competing interests.

Nomenclature

cssurface moisture content [g/cm3]
ciinternal moisture content [g/cm3]
cmaxmaximum moisture content [g/cm3]
ΔWdweight change per unit cross-sectional area after drying [g/cm2]
ΔWwweight change per unit cross-sectional area after wetting [g/cm2]
k capillary   sorptivity   coefficient   during   wetting   [ c m / s ]
Dmoisture diffusion coefficient during drying [cm2/s]
εcalibration coefficient, ε ≤ 1.

References

  1. Jun, Z.; Hou, D.; Haoyu, C. Experimental and Theoretical Studies on Autogenous Shrinkage of Concrete at Early Ages. J. Mater. Civ. Eng. 2011, 23, 312–320. [Google Scholar] [CrossRef]
  2. Zhang, J.; Gao, Y.; Han, Y. Interior humidity of concrete under dry-wet cycles. J. Mater. Civ. Eng. 2012, 24, 289–298. [Google Scholar] [CrossRef]
  3. Wu, Z.; Wong, H.S.; Chen, C.; Buenfeld, N.R. Anomalous water absorption in cement-based materials caused by drying shrinkage induced microcracks. Cem. Concr. Res. 2019, 115, 90–104. [Google Scholar] [CrossRef]
  4. Yio, M.H.N.; Mac, M.J.; Yeow, Y.X.; Wong, H.S.; Buenfeld, N.R. Effect of autogenous shrinkage on microcracking and mass transport properties of concrete containing supplementary cementitious materials. Cem. Concr. Res. 2021, 150, 106611. [Google Scholar] [CrossRef]
  5. Baroghel-Bouny, V.; Mainguy, M.; Lassabatere, T.; Coussy, O. Characterization and identification of equilibrium and transfer moisture properties for ordinary and high-performance cementitious materials. Cem. Concr. Res. 1999, 29, 1225–1238. [Google Scholar] [CrossRef]
  6. Bissonnette, B.; Pierre, P.; Pigeon, M. Influence of key parameters on drying shrinkage of cementitious materials. Cem. Concr. Res. 1999, 29, 1655–1662. [Google Scholar] [CrossRef]
  7. Ayano, T.; Wittmann, F.H. Drying, moisture distribution, and shrinkage of cement-based materials. Mater. Struct. 2002, 35, 134–140. [Google Scholar] [CrossRef]
  8. Hedegaard, B.D.; Clement, T.J.; Hubler, M.H. Coupled Pore Relative Humidity Model for Concrete Shrinkage and Creep. ACI Mater. J. 2023, 120. [Google Scholar] [CrossRef]
  9. Korecký, T.; Keppert, M.; Maděra, J.; Černý, R. Water transport parameters of autoclaved aerated concrete: Experimental assessment of different modeling approaches. J. Build. Phys. 2015, 39, 170–188. [Google Scholar] [CrossRef]
  10. Carmeliet, J.; Roels, S. Determination of the isothermal moisture transport properties of porous building materials. J. Therm. Envel. Build. Sci. 2001, 24, 183–210. [Google Scholar] [CrossRef]
  11. Wang, J.; Yio, M.H.; Zhou, T.; Wong, H.S.; Davie, C.T.; Masoero, E. Water sorption isotherms and hysteresis of cement paste at moderately high temperature, up to 80 C. Cem. Concr. Res. 2023, 165, 107076. [Google Scholar] [CrossRef]
  12. Mills, E.O. The permeability to air and to water of some building bricks. Trans. Ceram. Soc. 1933, 33, 200–212. [Google Scholar]
  13. Philip, J.R. The theory of infiltration: 4. Sorptivity and algebraic infiltration equations. Soil. Sci. 1957, 84, 257–264. [Google Scholar] [CrossRef]
  14. Watkins, C.M.; Butterworth, B. The absorption of water by clay building bricks and some related properties. Trans. Ceram. Soc. 1933, 33, 444–478. [Google Scholar]
  15. Zhang, Z. Modelling of Sorption Hysteresis and Its Effect on Moisture Transport Within Cementitious Materials. Ph.D. Thesis, Université Paris-Est, Creteil, France, 2014. [Google Scholar]
  16. Li, K.; Li, C.; Chen, Z. Influential depth of moisture transport in concrete subject to drying–wetting cycles. Cem. Concr. Compos. 2009, 31, 693–698. [Google Scholar] [CrossRef]
  17. Hall, C.; Yau, M.R. Water movement in porous building materials—IX. The water absorption and sorptivity of concretes. Build. Environ. 1987, 22, 77–82. [Google Scholar] [CrossRef]
  18. Bažant, Z.P.; Najjar, L.J. Nonlinear water diffusion in nonsaturated concrete. Matériaux Et Constr. 1972, 5, 3–20. [Google Scholar] [CrossRef]
  19. Hall, C. Water sorptivity of mortars and concretes: A review. Mag. Concr. Res. 1989, 41, 51–61. [Google Scholar] [CrossRef]
  20. Cunningham, M.J. Effective penetration depth and effective resistance in moisture transfer. Build. Environ. 1992, 27, 379–386. [Google Scholar] [CrossRef]
  21. Arfvidsson, J. A new algorithm to calculate the isothermal moisture penetration for periodically varying relative humidity at the boundary. Nord. J. Build. Phys. 1999, 2. Available online: https://d1wqtxts1xzle7.cloudfront.net/117935319/art_0299-libre.pdf?1725403143=&response-content-disposition=inline%3B+filename%3DA_New_Algorithm_to_Calculate_the_Isother.pdf&Expires=1780065410&Signature=ctMjrHaalwbAGmcsxkbTfuKVkPEMcDRmdA93Fgsoj6pveXLFKAlqFTIA29usoXreDTdzapmb8ZDbwAhzkeq9fkgBVL~DBBfXopz3twhjnpV1vL7cQTP17ribfEO6KPAvrsXO7K~9xEhYrLD2ukGBVDFBRYFQkZ-dYsV~ejNlhZu0ocxS63zwqrKkB81bQTWpKtc3RGz8nWPCT2esoo5~eBnGas~fWpob9F26Ab541C69LqV3PmaCr~2kmrrCEU9fhHX0W1NQjInpOl3irBexOGTsH-BkNi4JKyNIZQgpFkm3Q89xbz6b~v5dLPo7ho6MNOox1oB3nGLQ69svt3gp0w__&Key-Pair-Id=APKAJLOHF5GGSLRBV4ZA (accessed on 26 May 2026).
  22. Arfvidsson, J.; Claesson, J. Isothermal moisture flow in building materials: Modelling, measurements and calculations based on Kirchhoff’s potential. Build. Environ. 2000, 35, 519–536. [Google Scholar] [CrossRef]
  23. Kerestecioglu, A.; Kamel, A. Theoretical and Computational Investigation of Simultaneous Heat and Moisture Transfer in Buildings: “Effective Penetration Depth” Theory. 1989. Available online: https://www.aivc.org/sites/default/files/airbase_3522.pdf (accessed on 1 April 2024).
  24. Cunningham, M.J. The moisture performance of framed structures—A mathematical model. Build. Environ. 1988, 23, 123–135. [Google Scholar] [CrossRef]
  25. Woods, J.; Winkler, J.; Christensen, D. Evaluation of the Effective Moisture Penetration Depth Model for Estimating Moisture Buffering in Buildings. 2013. Available online: https://www.osti.gov/servlets/purl/1219896 (accessed on 26 May 2026).[Green Version]
  26. Steeman, H.J.; Janssens, A.; Carmeliet, J.; De Paepe, M. Modelling indoor air and hygrothermal wall interaction in building simulation: Comparison between CFD and a well-mixed zonal model. Build. Environ. 2009, 44, 572–583. [Google Scholar] [CrossRef]
  27. Derluyn, H.; Derome, D.; Carmeliet, J.; Stora, E.; Barbarulo, R. Hysteretic moisture behavior of concrete: Modeling and analysis. Cem. Concr. Res. 2012, 42, 1379–1388. [Google Scholar] [CrossRef]
  28. Johannesson, B.; Janz, M. A two-phase moisture transport model accounting for sorption hysteresis in layered porous building constructions. Build. Environ. 2009, 44, 1285–1294. [Google Scholar] [CrossRef]
  29. Johannesson, B.; Nyman, U. A numerical approach for non-linear moisture flow in porous materials with account to sorption hysteresis. Transp. Porous Media 2010, 84, 735–754. Available online: https://link.springer.com/article/10.1007/s11242-010-9538-3 (accessed on 10 April 2024). [CrossRef]
  30. Ksit, B.; Szymczak-Graczyk, A.; Orlik-Kożdoń, B.; Garbowski, T. Numerical and surrogate modeling of drying processes in building envelopes under variable climatic conditions. Energy 2025, 339, 139014. [Google Scholar] [CrossRef]
  31. Szymczak-Graczyk, A.; Korentz, J.; Garbowski, T. Digital Twin Model for Predicting Hygrothermal Performance of Building Materials from Moisture Permeability Tests. Materials 2025, 18, 4360. [Google Scholar] [CrossRef]
  32. NT BUILD 368; Concrete, Repair Materials: Capillary Aabsorption. NORDTEST: Espoo, Finland, 1991. Available online: https://www.nordtest.info/wp/1991/02/22/concrete-repair-materials-capillary-absorption-nt-build-368/ (accessed on 1 February 2022).
  33. Descamps, F. Continuum and Discrete Modelling of Isothermal Water and Air Flow in Porous Media. Ph.D. Thesis, Vrije Universiteit Brussel, Ixelles, Belgium, 1997. [Google Scholar]
  34. Brocken, H.J.P. Moisture Transport in Brick Masonry: The Grey Area Between Bricks. Ph.D. Thesis, Technische Universiteit Eindhoven, Eindhoven, The Netherlands, 2001. [Google Scholar]
  35. Ksit, B.; Szymczak-Graczyk, A.; Pilch, R. Numerical Simulation of the Impact of Water Vapour and Moisture Blockers in Energy Diagnostics of Ventilated Partitions. Materials 2022, 15, 8257. [Google Scholar] [CrossRef]
  36. Krus, M.; Künzel, H.M. Determination of Dw from A-Value; IEA Annex XXIV Report T3-D-93/02; IEA: Paris, France, 1993. [Google Scholar]
  37. Zhou, C.; Li, K. Transport properties of concrete altered by crack-induced damage. J. Mater. Civ. Eng. 2015, 27, A4014001. [Google Scholar] [CrossRef]
  38. Martinola, G. Application of fracture mechanics to optimize repair mortar system. In Fracture Mechanics of Concrete Structures; Aedificatio Publishers: Freiburg, Germany, 1995; pp. 1481–1492. [Google Scholar]
Figure 1. Schematic of wetting process after the natural drying process.
Buildings 16 02204 g001
Figure 2. Linear relationship between weight change and the square root of time on concrete samples during the drying process((e.g., #1−1 and #1−2 denote the first and second parallel tests for sample type 1))
Buildings 16 02204 g002
Figure 3. Schematic of dry–wet cycles.
Buildings 16 02204 g003
Figure 4. Comparison of the simulation results with the experimental data. (a) Sample No. 1 (1–35), (b) Sample No. 2 (1–40), (c) Sample No. 3 (1–75).
Buildings 16 02204 g004aBuildings 16 02204 g004b
Table 1. Mixture proportions of concrete, kg/m3.
No.CementWaterSand
(1–8) (mm)
Gravel
(8–16) (mm)
Water ReducerAir Content
(%)
Compressive Strength
(MPa, 28 day)
w/c
No. 1450157.58398394.56.0700.35
No. 24201688738063.366.2580.40
No. 3240180101379606.1210.75
Table 2. Parameters of concrete for simulation of moisture transport.
No.k
(cm/s1/2)
× 10−3
D
(cm2/s)
× 10−6
cmax
(ci)
(g/cm3)
cs
(g/cm3)
εw/c
No. 12.5520.2280.1240.0500.6560.35
No. 23.1860.4740.1090.0430.6820.40
No. 37.6003.4300.1290.0320.9360.75
Disclaimer/Publisher’s Note: The statements, opinions and data contained in all publications are solely those of the individual author(s) and contributor(s) and not of MDPI and/or the editor(s). MDPI and/or the editor(s) disclaim responsibility for any injury to people or property resulting from any ideas, methods, instructions or products referred to in the content.