1. Introduction
Despite decades of public investment in housing programs, residents of high-altitude rural areas in Peru still face poor indoor thermal comfort and limited access to heating [
1]. Cold indoor temperatures in these homes have been linked to adverse health outcomes and social vulnerability [
2,
3,
4,
5]. This issue is particularly critical given that a large proportion of the rural population in the Peruvian Andes resides above 3500 m.a.s.l., where night-time temperatures during the coldest months commonly fall below 0–5 °C [
6,
7,
8]. At the same time, housing policies and design guidelines often replicate construction solutions that fail to address the specific climatic and socioeconomic context of the Andean region [
6,
9]. At the same time, housing policies and design guidelines often replicate construction solutions that do not respond to the climatic and socio-economic conditions of the Andean region [
9,
10,
11]. Current housing solutions also fail to incorporate cost-effective passive strategies suited to these constraints [
8,
12,
13].
In other contexts, building design research has explored optimization-based approaches to improve building thermal performance and indoor comfort [
5,
11,
14]. These approaches support informed decision-making through the systematic evaluation of alternative building configurations [
15,
16]. Multi-objective optimization models allow competing objectives, such as minimizing energy use and maximizing thermal comfort, to be evaluated simultaneously [
17,
18]. Among these techniques, genetic algorithms (GAs), particularly the Non-dominated Sorting Genetic Algorithm II (NSGA-II), are widely used for solving multi-objective problems in building energy performance [
14,
15,
19,
20,
21].
Passive design strategies are commonly considered a promising approach to improving thermal comfort in low-income settings, as they rely on the climatic adaptation of building geometry, materials, and envelope configurations [
14,
22,
23,
24,
25]. In high-altitude Andean contexts, vernacular techniques (e.g., adobe walls, thermal mass floors, compact layouts) reflect climate-responsive design [
25,
26,
27,
28,
29], and recent studies have explored combining these strategies with building performance simulation [
8,
9,
19,
30,
31,
32]. However, most studies focus on urban or temperate climates [
33,
34,
35] and do not reflect the environmental and socio-cultural conditions of the high-altitude rural Andes [
36,
37,
38]. The Andean climate is characterized by a high diurnal temperature range, low annual seasonality, and consistently high solar angles, distinguishing it from higher-latitude regions where diurnal variations are less dominant, annual seasonality is high, and solar angles fluctuate significantly throughout the year. Moreover, optimization-based solutions are often economically or technically unfeasible for low-income households [
38,
39]. Consequently, there remains a clear research gap in evaluating affordable, locally viable passive strategies through simulation-based optimization in the Andean context, particularly regarding their combined impact on thermal comfort and life cycle cost. In this study, we optimize the building envelope of the Sumaq Wasi modular house, a widely implemented public housing prototype in high-altitude Andean regions. We quantify the impact of feasible passive envelope modifications on indoor thermal discomfort, identify the most influential parameters using global sensitivity analysis, and determine cost-effective combinations that minimize thermal discomfort and life cycle cost. The methodology integrates calibrated EnergyPlus simulations with Morris and Sobol sensitivity analyses and NSGA-II multi-objective optimization to explicitly characterize Pareto trade-offs between total discomfort and life cycle cost, addressing the lack of integrated assessments in the Andean context. The analysis considers practical envelope measures (insulation, thermal mass, and solar absorptance) within the economic constraints of the standardized dwelling, and includes a benchmark with two 400 W electric heaters to contextualize performance. This approach enables the identification of cost-effective and cost-neutral passive strategies and demonstrates their performance relative to the heater benchmark, providing actionable guidance for improving indoor comfort in low-income Andean housing.
2. Materials and Methods
This study evaluates cost-effective passive strategies to improve thermal comfort in a government-built Sumaq Wasi modular house, representative of high-altitude rural housing in Peru. The methodology integrates field observations, empirical measurements, building energy simulation, sensitivity analysis, and multi-objective optimization. Field measurements were used to calibrate and validate the simulation model, while performance evaluations were conducted using simulation results. To evaluate the performance of the optimized solutions, three objective functions were defined, corresponding to the quantities minimized in the optimization: total discomfort, bedroom underheating, and life cycle cost. The evaluation compared the optimized passive designs against two benchmarks. The first benchmark was the base case, representing the existing Sumaq Wasi configuration without envelope modifications or space-heating systems. The second benchmark involved the use of 400 W electric heaters in the bedrooms, included as a practical reference option for alleviating cold discomfort.
2.1. Study Context and Case Description
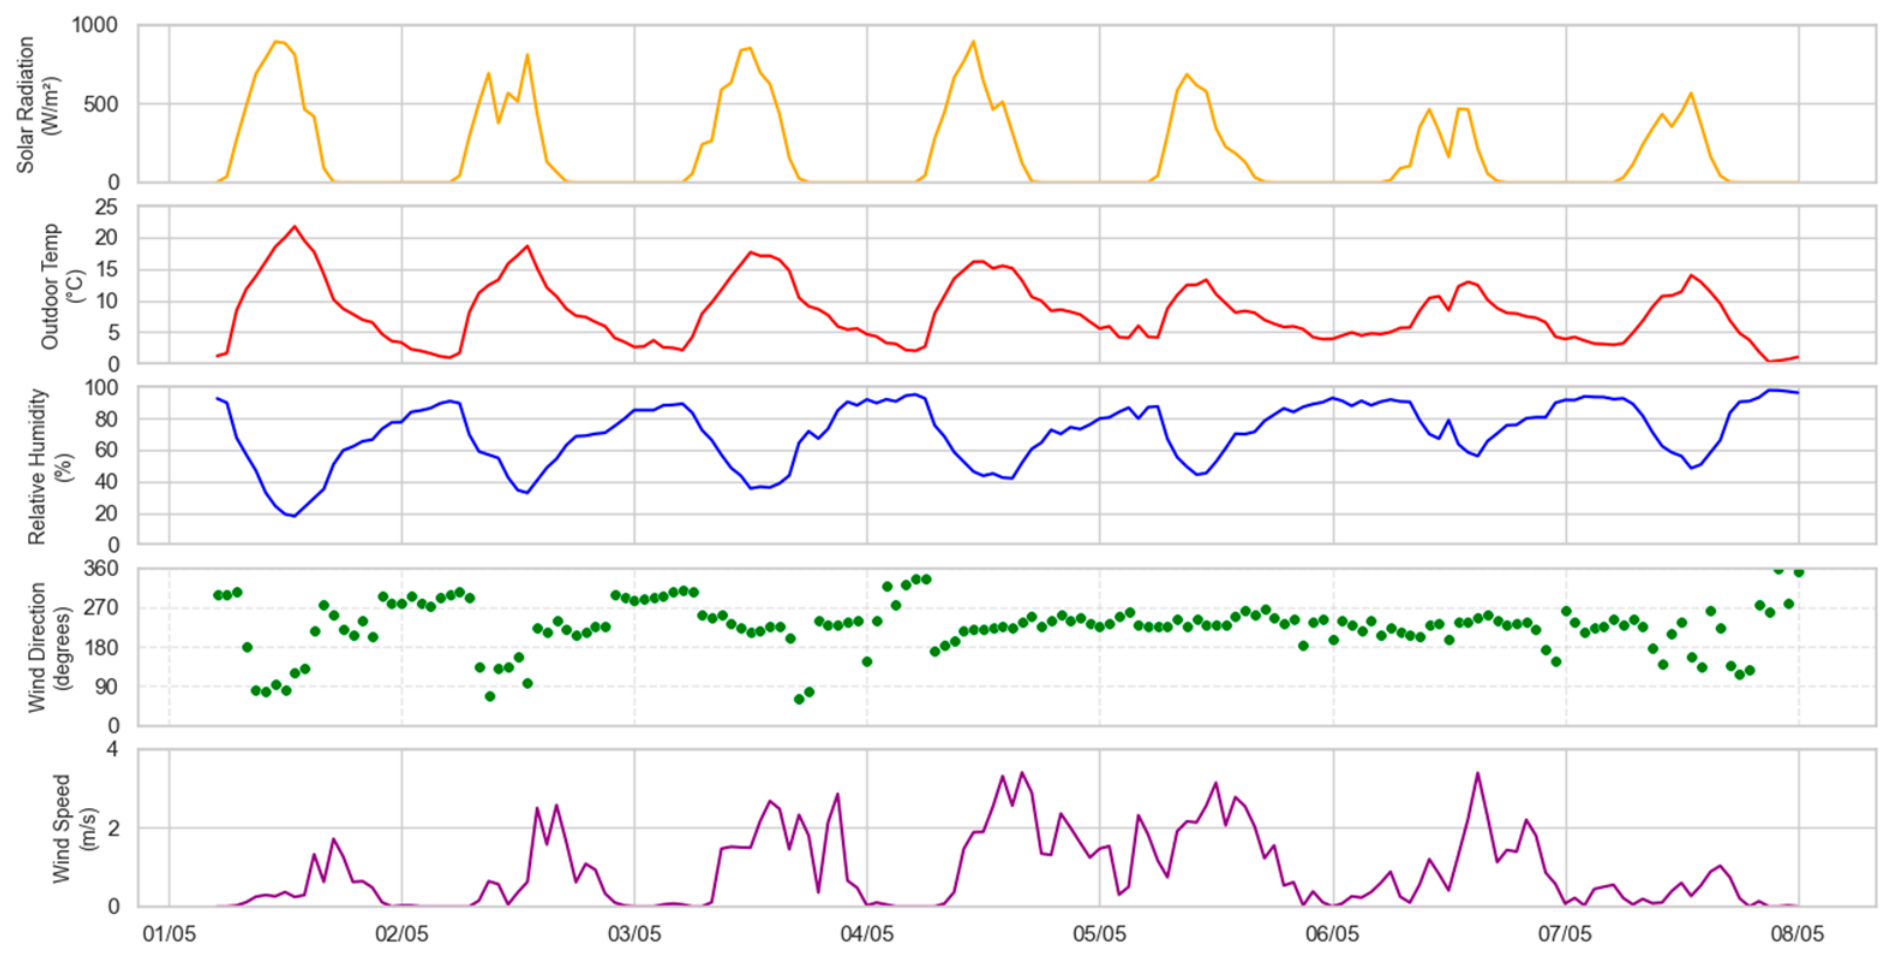
The study was conducted in Langui, a district in the Cusco region of Peru located at an elevation of 3969 m above sea level. Winter conditions are characterized by cold nights, intense solar radiation during the day, and significant daily temperature fluctuations (
Figure 1). Residents face multiple socio-economic challenges, including inadequate housing quality, which, when combined with low night-time outdoor temperatures and strong radiative cooling under clear-sky conditions, result in harsh and often uncomfortable living environments.
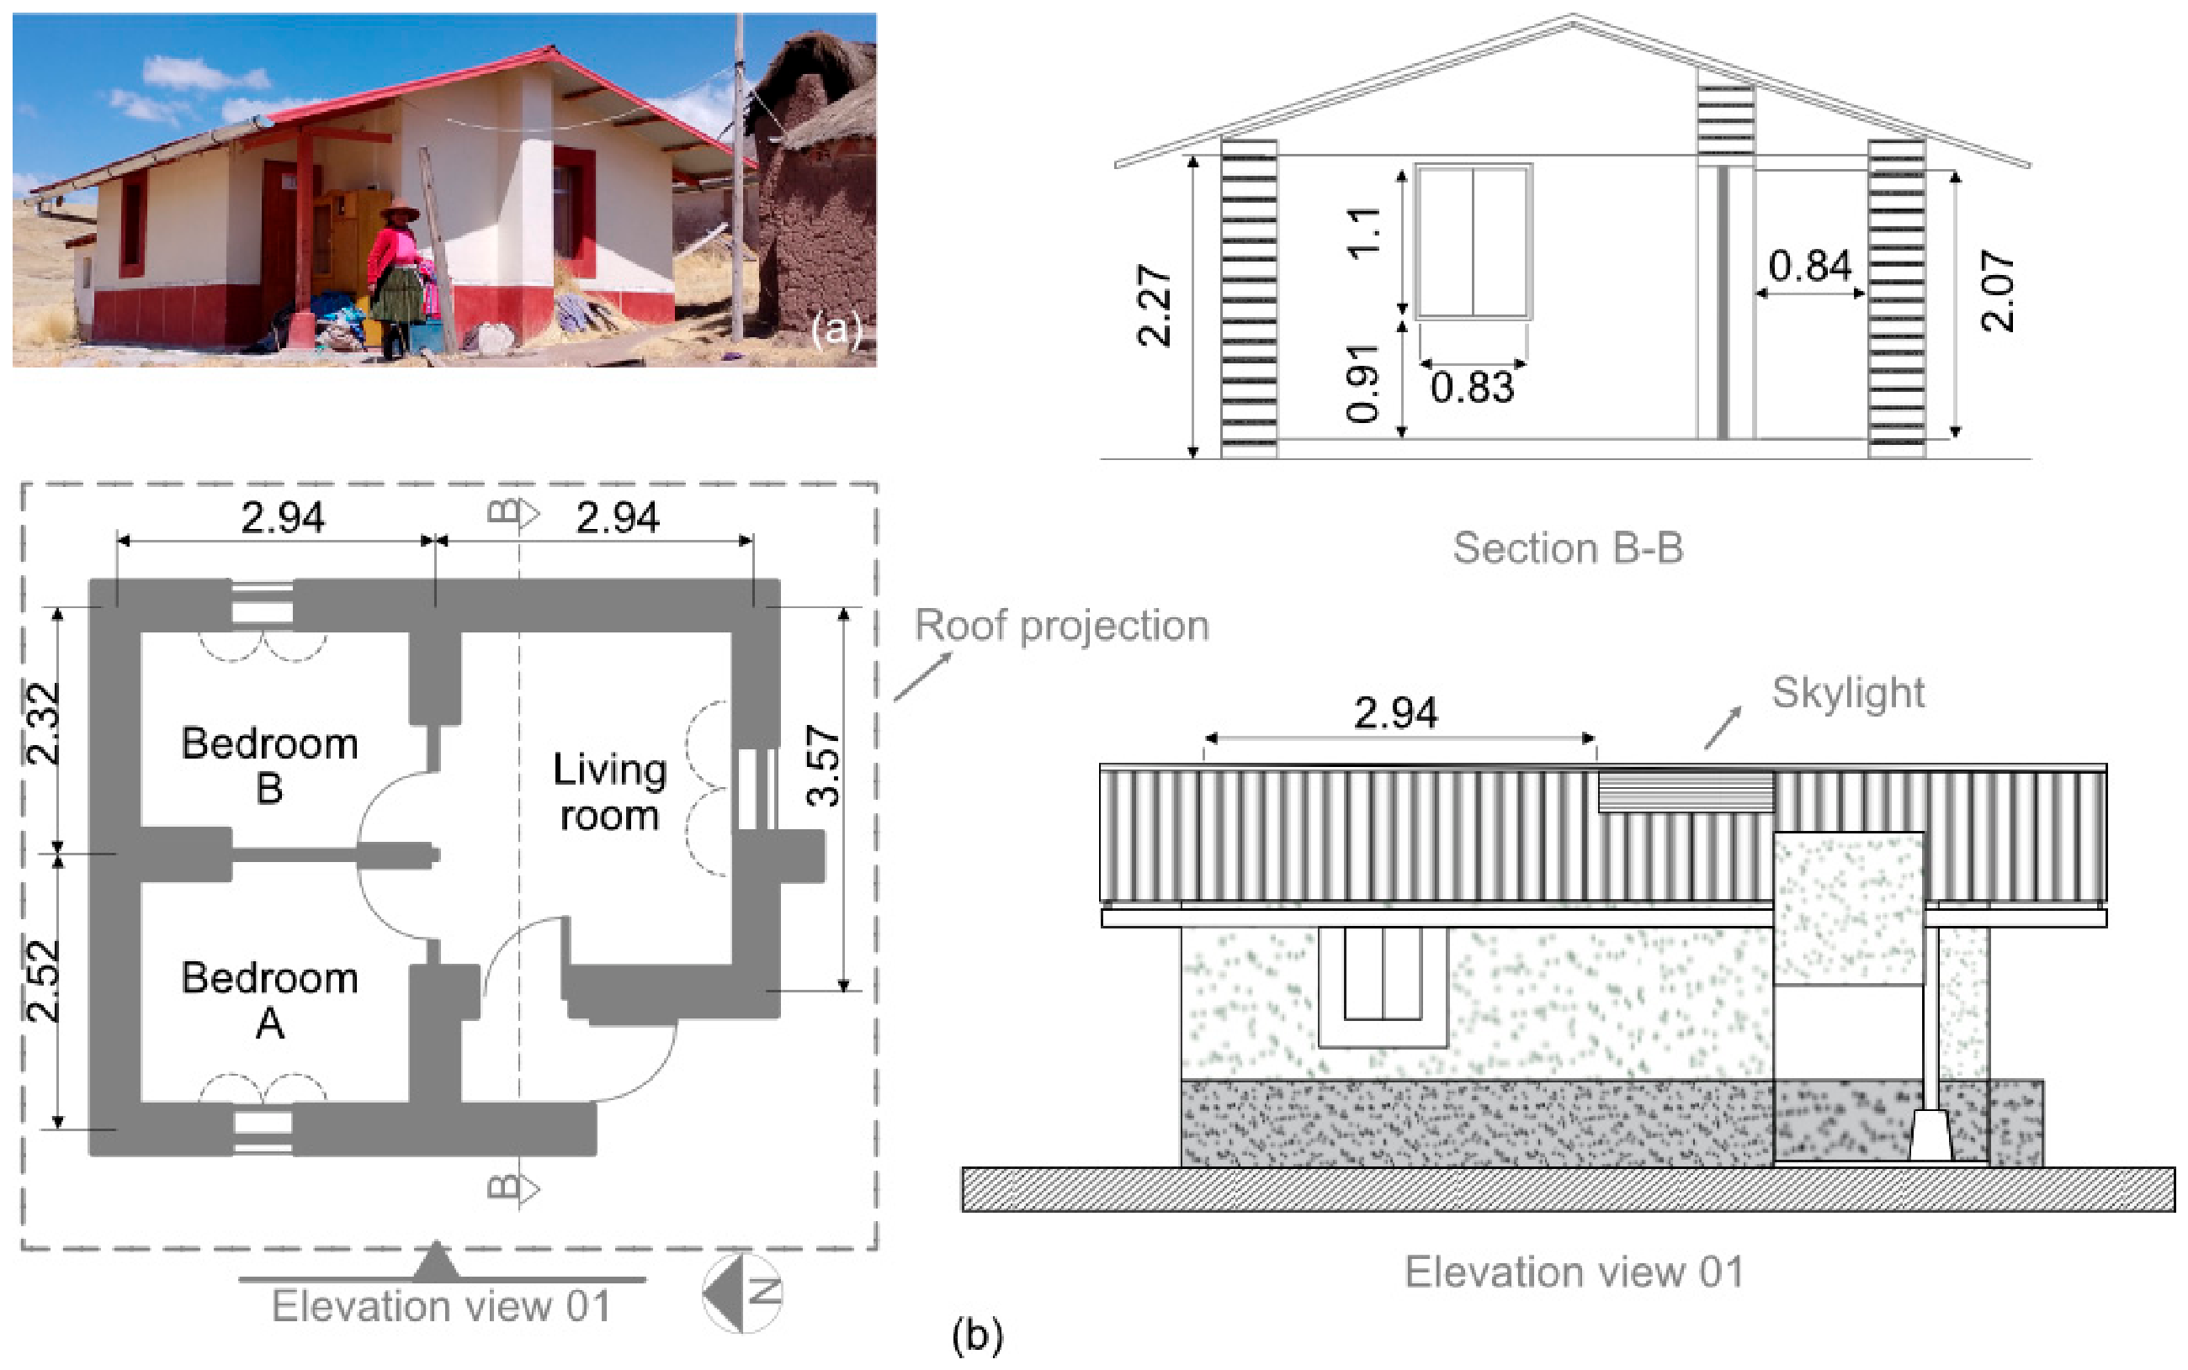
In response, the Peruvian government has implemented a rural housing program in the high Andes, introducing a modular house design known as Sumaq Wasi. These government-built dwellings in Langui have a typical floor area of 33 m
2 and feature adobe walls, an insulated metal roof, gypsum ceilings, and single-glazed windows (
Figure 2). The baseline construction systems and their thermal transmittance values are summarized in
Table 1, which presents two Sumaq Wasi variants based on adobe and fire clay brick exterior walls. The table includes all major envelope components, including a skylight located in the main living space. Several envelope components exhibit relatively high U-values, indicating limited thermal resistance. The Sumaq Wasi windows are single clear glass (6 mm; solar transmittance = 0.84), while the skylight is a polycarbonate layer (6 mm; solar transmittance = 0.80). Field observations and previous studies also indicate high infiltration rates and the absence of any active heating systems [
1]. These factors contribute to poor indoor thermal conditions. Consequently, residents often rely on adaptive behaviors, such as wearing multiple garments and using thick blankets, to cope with cold indoor conditions [
40].
Although
Table 1 presents two construction variants implemented with the Sumaq Wasi program, this study focuses exclusively on the adobe wall design. This choice reflects commonly recognized environmental considerations related to material availability, construction practices, and the use of locally sourced earth-based materials in rural Andean contexts [
41,
42]. Nevertheless, the fired clay brick wall configuration is retained as a benchmark case. It allows the performance of the optimized passive solutions to be evaluated against an alternative construction system that has also been implemented by the housing program.
2.2. Simulation Model and Calibration
A base case model was developed using EnergyPlus 24.2.0 (U.S. Department of Energy, Washington, DC, USA) to represent a typical Sumaq Wasi house. This dynamic building simulation software employs interconnected modules to calculate heating and cooling loads under specific environmental and operational conditions. Simulations are based on the heat balance method [
43] that assumes uniform air temperature within a thermal zone’s volume and homogeneous surface temperatures with one-dimensional heat conduction [
44]. Additional assumptions include diffuse surface radiation emission and uniform irradiation. The model solves four core processes using energy conservation equations: heat balance on the exterior wall surface, one-dimensional heat conduction through walls, heat balance on the interior wall surface, and indoor air heat balance. Since the thermal zones analyzed in this study lacked active heating and cooling and we assumed no air exchange with other zones, the indoor air heat balance simplifies accordingly [
44]:
where:
= area of the zone surface [m2]
= specific heat of the air [J/(kg·K)]
= air capacitance [J/K]
= convective heat transfer coefficient with surface [W/(m2·K)]
= air infiltration mass flow [kg/s]
= number of convective internal loads [-]
= number of surfaces in the thermal zone [-]
= heat from internal load [W]
= temperature of surface [K]
= indoor air temperature [K]
= outdoor air temperature [K]
The EnergyPlus model inputs were defined based on a combination of documented building specifications, field observations, and environmental data sources. Geometry, materials, and thermal properties were extracted from government reports, literature, and field studies [
44,
45] (
Figure 2 and
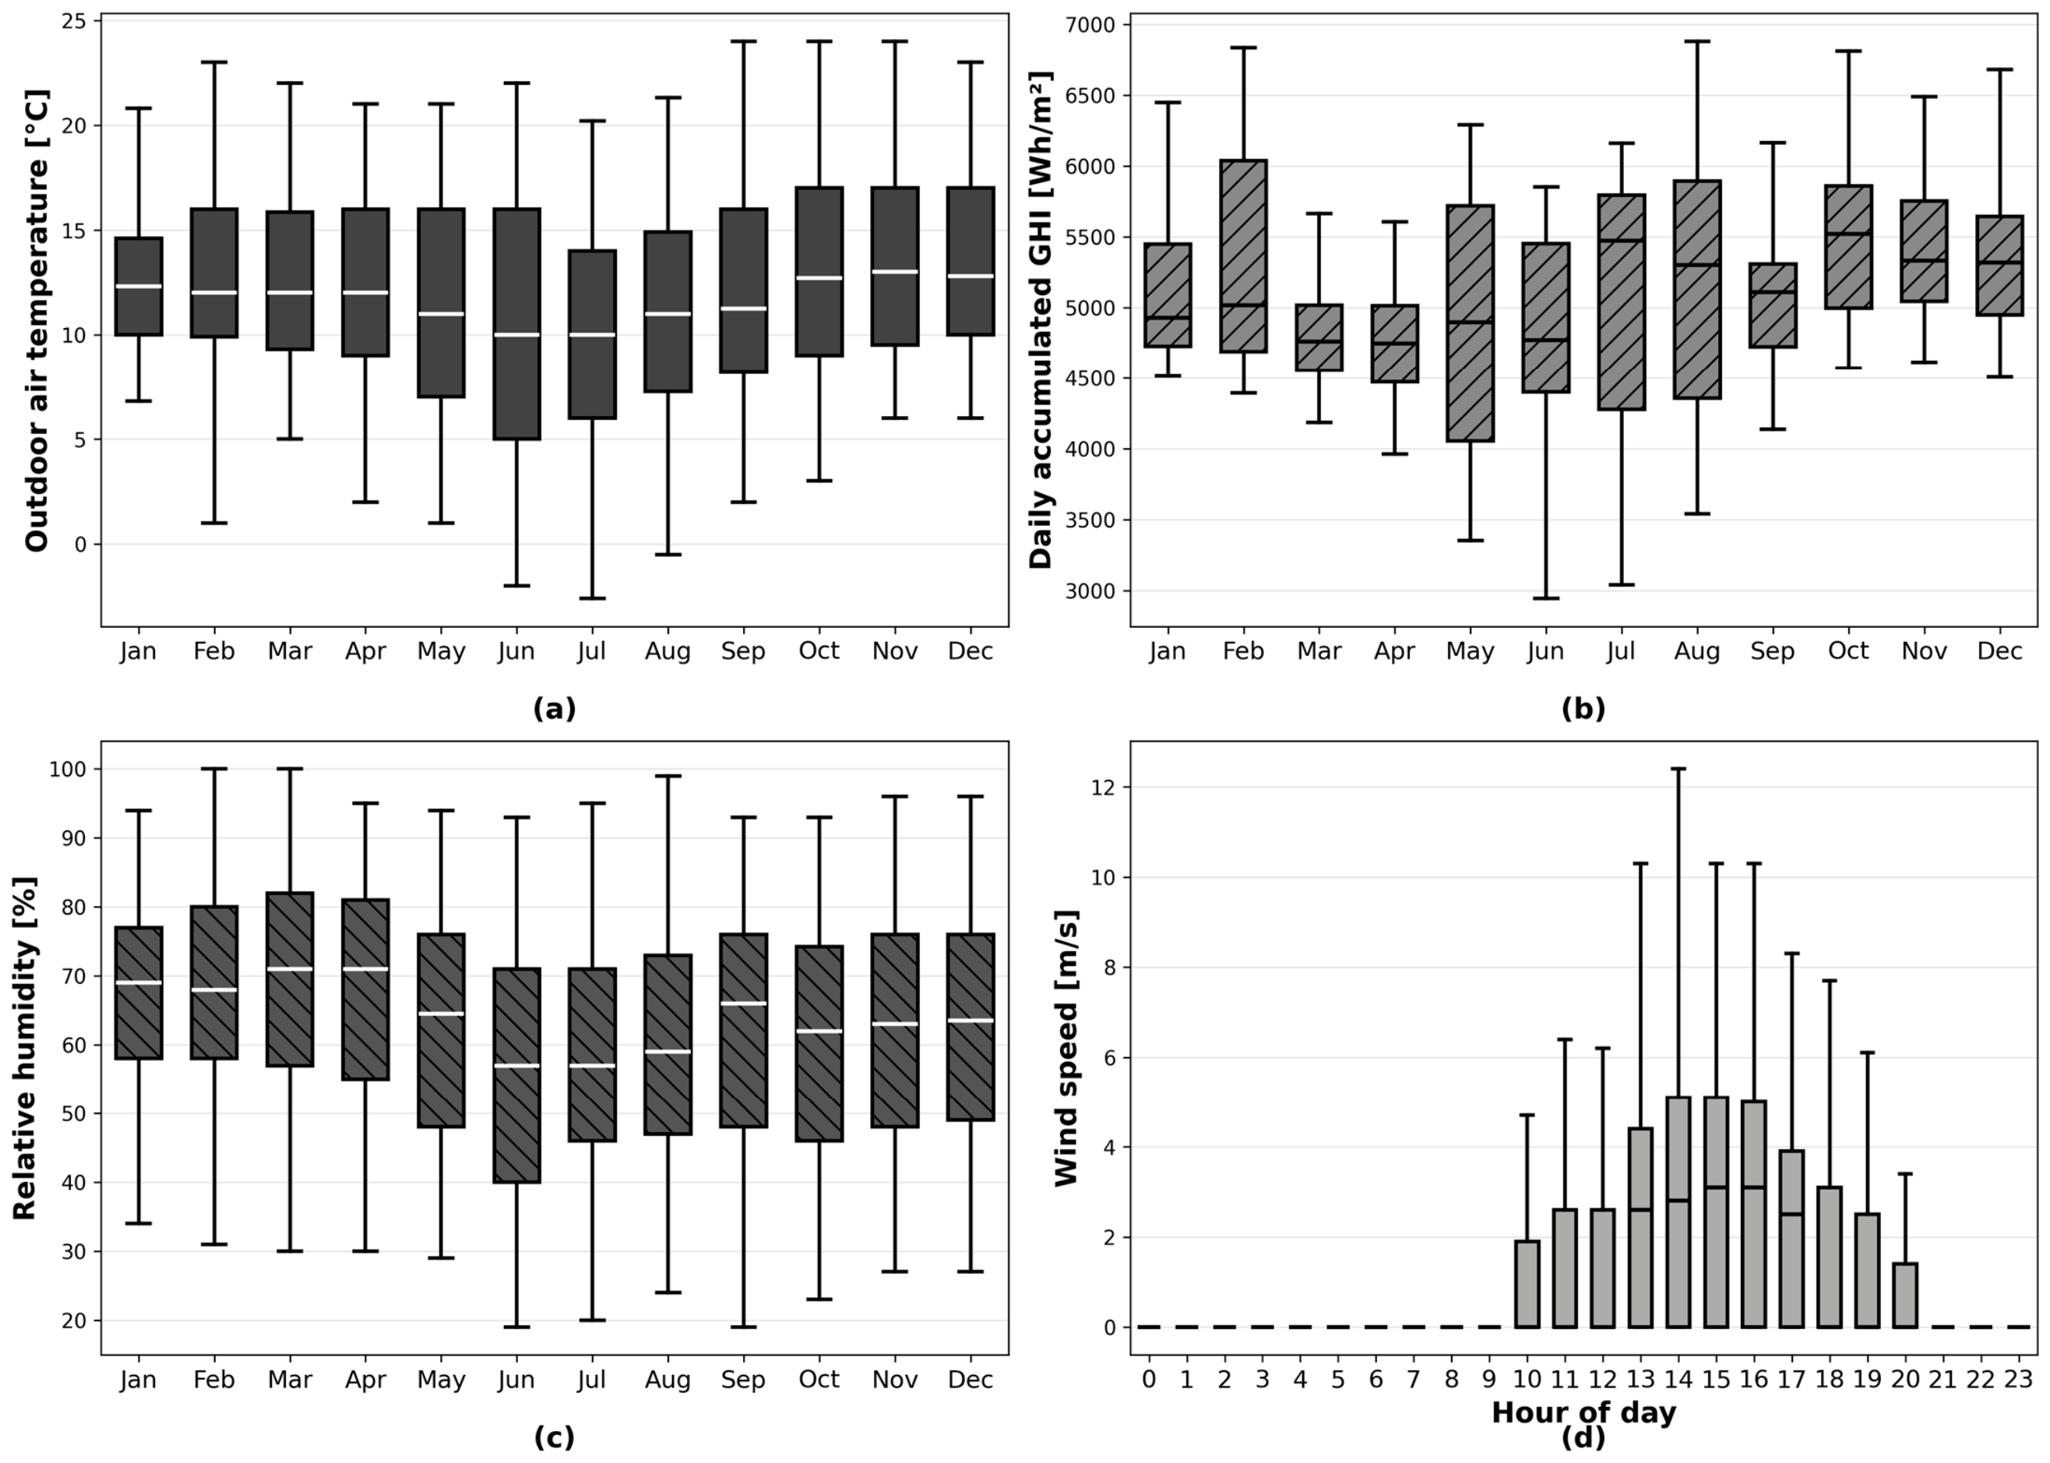
Table 1). Internal heat gains included one person per bedroom sleeping between 20:00 and 5:00 (70 W each); lighting loads of 100 W in the living room, and 50 W in each bedroom from 4:00–5:00, and 19:00–20:00. Window shutters were modeled as closed between 20:00 and 5:00. External meteorological inputs required by the simulation were provided through an EPW weather file; in this study, the Cusco EPW file was used. The outdoor conditions represented in this file are illustrated in
Figure 3, including the monthly distribution of hourly outdoor air temperature and relative humidity, the distribution of daily accumulated solar radiation, and the diurnal variation of wind speed based on hourly data.
Model calibration was required to ensure that the simulated indoor temperatures realistically represent the thermal behavior of Sumaq Wasi dwellings under real operating conditions. Among the processes influencing the indoor air heat balance, air infiltration plays a dominant role in lightweight rural dwellings operating without active heating [
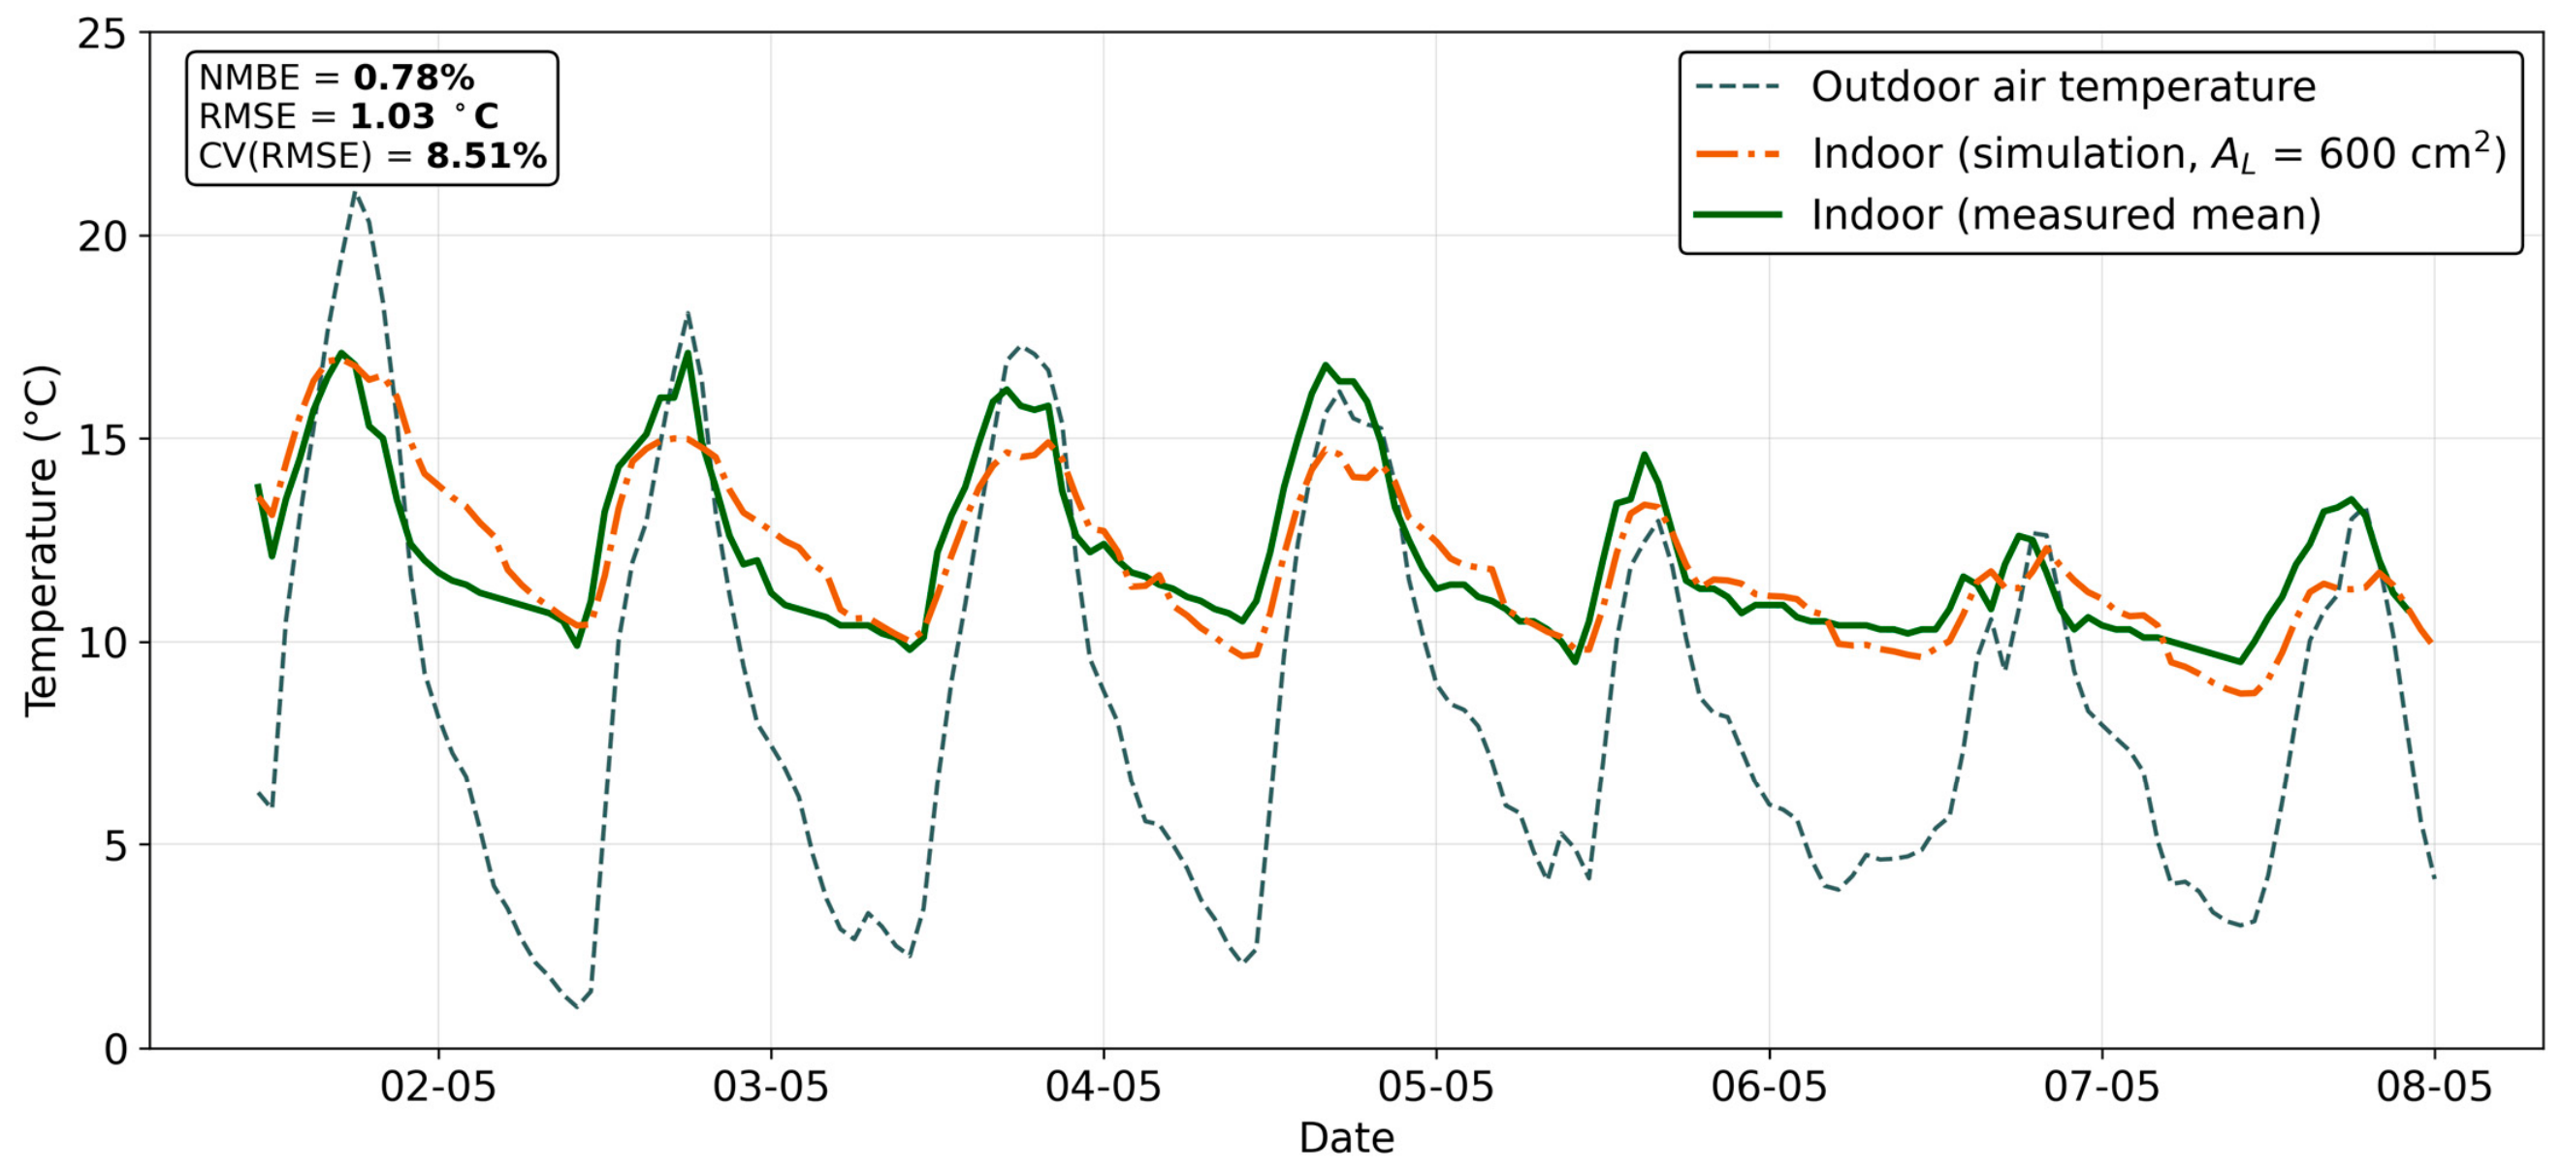
8]. However, reliable references for the infiltration characteristics of Sumaq Wasi houses are not available, which prevents direct specification of infiltration-related parameters. For this reason, calibration was carried out by comparing simulated and measured indoor air temperatures from 1–8 May 2023 (
Figure 4). Three temperature sensors were placed in one bedroom while outdoor conditions were monitored with a nearby meteorological station (
Table 2 and
Figure 1). This approach is consistent with recent calibration practices in building performance simulation based on measured indoor temperatures [
46,
47].
Air infiltration was modeled using the effective leakage area method implemented in EnergyPlus. In this formulation, infiltration is driven by buoyancy (stack) and wind effects, and it is expressed as:
where:
Vinf = air infiltration rate, m3/s
AL = effective air leakage area, cm2
Cs = stack coefficient, (L/s)
2/(cm
4·K), in our case equal to 0.0000145 according to [
44]
ΔT = , indoor-outdoor temperature difference, K
CW = wind coefficient, (L/s)
2/[cm
4(m/s)
2], in our case equal to 0.000319 according to [
44]
U = local wind speed, m/s
The effective leakage area
AL (cm
2) was treated as the calibration parameter and iteratively adjusted. The calibration identified
AL = 600 cm
2 as the values with the lowest error indicators (
Figure 4): Normalized Mean Bias Error (NMBE) = 0.78%; Root Mean Square Error (RMSE) = 1.03; and Coefficient of Variation of RMSE (CV(RMSE)) = 8.51. This value was subsequently used for all base case simulations.
In addition to the calibrated base infiltration, adaptive window opening during overheating was represented by temporarily increasing the of the corresponding zone. When the operative temperature exceeded an upper comfort threshold, the effective leakage area was increased to simulate enhanced air exchange due to window opening. This approach directly modifies the infiltration term in Equation (2), increasing the airflow driven by stack and wind effects. In the base case, the activation threshold was set to 25 °C and its influence was further examined in the sensitivity analysis.
2.3. Objective Functions
Three objective functions were defined to evaluate the performance of the base case scenario. The first objective function was the Total Thermal Discomfort Index (
) defined as the annual sum of hourly deviations of operative temperature outside an acceptable comfort range in the bedrooms and living room. Operative temperature was used as a practical indicator of indoor thermal conditions in these free-running buildings, consistent with adaptive comfort approaches and the empirical basis of the comfort thresholds adopted [
40,
48]. The comfort range was set between 14 °C and 25 °C based on field measurements and occupant surveys conducted in Langui, reflecting locally adapted thermal comfort conditions [
40]. Upper temperature limits were retained to ensure acceptable indoor conditions over the full diurnal cycle and to avoid optimization solutions that reduce cold discomfort at the expense of overheating. The
was calculated as:
where:
where
denotes the operative temperature at hour
of one room (°C) and 8760 is the number of hours during the simulated year.
The second objective function was the Thermal Discomfort Index due to Underheating in Bedrooms (
), which specifically targets cold-related discomfort during sleeping hours. Unlike
, which accounts for both cold and warm deviations across all occupied spaces, this index considers only temperature deviations below 14 °C and is evaluated exclusively in bedrooms. This objective reflects the most frequently reported thermal complaint in the community and prioritizes nighttime thermal conditions associated with health and well-being, and was defined as:
where
The third objective function was the Life Cycle Cost (
) of the building over a 10-year evaluation period. The
included both the initial investment cost for the envelope and heating systems and the discounted operational cost of electricity used for heating. The operational costs were calculated monthly and aggregated annually, using a fixed discount rate
r.
was calculated following standard life-cycle cost assessment procedures [
49,
50]:
: initial investment cost (USD)
: operating cost in year (USD/year)
: discount rate, set at 10% to reflect the high capital risk and local preference for minimizing upfront investments.
was assumed to include only electricity costs. In Langui, electricity tariffs follow a tiered block structure. For monthly consumption below 30 kWh, electricity is charged at 0.150 USD/kWh. For consumption between 31 and 140 kWh, the first 30 kWh are charged at a rate of 0.045 USD/kWh, while all additional consumption above 30 kWh is charged at 0.215 USD/kWh. For monthly consumption exceeding 140 kWh, a flat rate of 0.220 USD/kWh is applied to the entire consumption [
51].
2.4. Sensitivity Analysis
A two-stage Global Sensitivity Analysis (GSA) was conducted. We adopted a two-stage approach commonly used in building performance studies [
52,
53,
54]. First, we applied the Morris method (elementary effects) to screen and reduce the dimensionality of the input space by identifying the most impactful parameters [
55,
56]. Then, we performed a focused Sobol analysis on this reduced set to quantify the contribution of each input variable and its interactions to the variance of the model outputs [
55]. Both stages relied on Monte Carlo-based sampling strategies to systematically generate randomized combinations of input parameters, each of which was used to run an individual EnergyPlus simulation. This procedure enabled a comprehensive assessment of both main effects and higher-order interactions across the entire plausible range of each parameter.
The Morris method is a qualitative method that allows us to rank the variables according to their relative influence and allows us to screen the important variables. Here, the output of interest is a function
where
is a vector of
coordinates each representing an input variable, then
. Each coordinate is converted to a normalized value between 0 and 1 using
. The space between 0 and 1 is divided into
points that are decided by the user. After these definitions, the method starts by creating an initial point with random values of the variables, then it creates subsequent
points, changing one variable at a time by a step
. The selection of the modified variable is randomly chosen, and this group of
points is called a trajectory. To ensure equal probability for each value of each point, Morris suggested to make
even and the step
. The method chose the direction of the step analyzing if
is higher or lower than 0.5 to stay always inside the grid
[
54].
Then an indicator elementary effect (
) is defined to measure how much the output changes when only variable
is changed:
where
is a vector with 1 in the
-th position and 0 elsewhere. As for each trajectory the method only modified each
once in all of the steps, the respective steps are selected to calculate
. During the method
number of trajectories are created, then for each variable
the standard mean
, the mean of absolute values
, and standard deviation
of the elementary effects are calculated [
54]:
Based on these indicators, the
variables could be ranked according to their impact on the output
. The size of
gives information regarding the importance of the variable, but sometimes the mean values among trajectories could be positive or negative and cancel out, so
was defined. The size of
gives information about the linearity or non-linearity of the effect, and its interaction with other variables. Thus, a variable with low
and low
has a negligible effect; a variable with high
and low
has important linear effect; and a variable with high
and high
has important non-linear effects or interacting effects. In building simulation, non-linear and interacting effects are very common [
54].
In this case, the Morris method was applied to two objective functions : and . The Morris method is used here as a screening tool to identify the most influential physical drivers of indoor thermal behavior. For this reason, the objective was not included in the sensitivity analysis, as its response to design modifications is directly computed from assigned unit costs, without complex physical interactions.
A total of
= 20 input parameters were selected from the EnergyPlus model. These parameters represent envelope properties and key use-related inputs that can be modified and are relevant for indoor thermal performance (
Table 3). The definition and range of each parameter are presented in the following subsection.
The Morris analysis was conducted using
= 4, uniformly spaced across their respective ranges. A total of
= 50 trajectories was used to ensure robustness of the sensitivity indices [
57,
58], resulting in
= 1050 model evaluations.
Two variables, infiltration and people activity level, were included in the Morris screening stage to assess their relative influence, even though they are not controllable through design in the studied context. Infiltration is highly uncertain and largely dependent on construction quality, while activity level is governed by occupant behavior. Due to the lack of empirical evidence on how modifications to the building envelope could reduce infiltration, we did not explore design solutions targeting its mitigation. Furthermore, it is well established that infiltration is one of the dominant parameters influencing thermal behavior in these types of buildings [
8]. To prevent infiltration from overshadowing other parameters in the sensitivity analysis, its variation was restricted to a narrow range centered on the calibrated effective leakage area
, corresponding to 25–100% of this value (
Table 3). While people activity level is also beyond the control of envelope design, it remains a critical factor as it represents the primary source of internal heat gains.
The second step of the GSA involved applying the Sobol method, a variance-based approach well suited to complex, nonlinear models such as those used in building energy simulation [
55,
59,
60]. This method quantifies the extent to which output variance is attributable to individual input parameters or to their interactions. Due to its computational intensity, the Sobol method was applied only to a subset of the most influential variables identified during the Morris screening stage.
To determine which parameters to include in the Sobol analysis, we established thresholds based on the indicators
and
from the Morris method. These thresholds were
and
. This approach aligns with screening criteria proposed in previous studies [
56,
61]. Additionally, the parameters infiltration and people activity level were excluded from the Sobol stage, since they cannot be addressed through the envelope design strategies evaluated in the subsequent optimization. While both are influential, they fall outside the scope of design-controllable variables in this context.
The Sobol method decomposes the total variance of the model output
, denoting
, into additive terms that reflect the influence of individual input parameters and their interactions:
where
represents the first-order effect of parameter
, and
,
, … correspond to higher-order interaction effects. In this way, Sobol’s method allows one to quantify the share of output variance attributable to each input variable, whether due to its direct influence or interactions.
For each parameter, two sensitivity indices were computed. The first-order Sobol index
measures the effect of
alone on the variance of
:
The total-order Sobol index
accounts for both the individual contribution of
and all its interactions with other variables:
In these expressions, denotes the expectation operator, i.e., the average of the model output over repeated sampling, and denotes the variance, which measures the dispersion around the mean. These operators are applied conditionally to isolate the effects of one or more parameters on the output variance.
The Sobol indices were estimated using the Monte Carlo-based sampling scheme originally proposed by Sobol [
60] and later refined by Homma and Saltelli [
62]. This method constructs structured samples to efficiently approximate the sensitivity indices through model evaluations. Two
sampling matrices
and
are first generated, where
is the number of input parameters and
is the number of base samples. Then, hybrid matrices are built by swapping one column at a time between
and
, yielding a total of
simulations. In this study,
= 512 was chosen to ensure robust estimation of the sensitivity indices, in line with established recommendations for building energy modeling [
60].
Design variables for the GA optimization were selected using Sobol total-order indices. Parameters were ranked by their and retained until their cumulative exceeded 0.85, ensuring that the selected set captured the majority of output variance. Non-design factors (e.g., infiltration, occupant activity) were excluded from the optimization set.
2.5. Construction Alternatives
We focused on selecting a range of possible construction alternatives to establish wide parameter bounds for the Morris and Sobol sensitivity analyses. The cost of each alternative was estimated only after identifying the most influential parameters. Because the Sumaq Wasi housing program operates under tight budget constraints, with each module costing approximately USD 8100, our selection of construction modifications prioritized affordability, local material availability, and simplicity of implementation. For the sensitivity analysis, we sought to define broad variable ranges to ensure methodological robustness without prematurely restricting options based on practical feasibility.
To model improvements in the thermal resistance of roofs, walls, floors, ceilings, doors, and shutters, we drew on the work of Juanicó and Gonzáles [
63] and Juanicó [
64]. These authors developed low-cost multilayer insulation panels combining expanded polystyrene (EPS), air gaps, and low-emissivity layers such as aluminum foil. Their findings showed that, for a 21 °C temperature difference between indoor and outdoor environments, multilayer EPS-air panels outperformed solid EPS panels of equal thickness. Furthermore, lining the interior surface with aluminum foil significantly reduced radiative heat transfer, resulting in lower U-values at minimal additional cost.
Following this methodology, we calculated U-values for three multilayer configurations: solid EPS, EPS with air gaps, and EPS with both air gaps and aluminum foil. All insulation layers were assumed to be 0.01 m thick. For roof, floor, and ceiling assemblies, total insulation thicknesses up to 0.5 m were considered, producing U-values ranging from 3.5 to 0.068 W/m
2·K. For exterior and interior walls, U-values ranged from 3.5 to 0.179 W/m
2·K. A summary of the ranges produced by these construction alternatives is provided in
Table 3.
Modifications to solar heat gains were also incorporated by adjusting the size of windows and skylights, represented by the variables window-to-wall ratio (wwr) and skylight-to-roof ratio (ssr), respectively. Additionally, the orientation of the building with respect to true north was varied to evaluate the impact of solar exposure on thermal performance (
Table 3). Local terrain shading from surrounding mountains was not explicitly modeled; solar access was therefore assumed to be unobstructed to isolate the influence of orientation and envelope-related design parameters.
2.6. Optimization
The optimization aimed to identify modifications to the Sumaq Wasi building that would minimize the three objective functions:
,
, and
. Only the design parameters in which cumulative
accounted for 0.85 of the total variance in the Sobol sensitivity analysis were considered in the optimization process, and the associated costs of their construction alternatives were estimated in advance. The range of values explored for each variable matched those used in the GSA (
Table 3).
The optimization was performed using the Non-dominated Sorting Genetic Algorithm II (NSGA-II), implemented through multiple simulations using EnergyPlus and Python 3.13.2 (Python Software Foundation, Wilmington, DE, USA). This algorithm was configured with a population size of 50 and evolved for 100 generations. GAs are population-based, stochastic optimization techniques widely used in building performance optimization due to their ability to explore large, nonlinear, and multi-dimensional design spaces [
65,
66,
67,
68].
In this framework, each candidate solution represents a specific combination of design variable values. For implementation within the GA, each solution is encoded as a chromosome, where each gene corresponds to one design variable in the simulation model. The performance of each candidate solution is evaluated by running the EnergyPlus model and computing the corresponding values of , , and .
The optimization proceeded over successive generations through genetic operators: uniform crossover (global probability of 0.6, with an independent probability per attribute of 0.5) and uniform integer mutation (global probability of 0.3, with an independent probability per attribute of 0.2. NSGA-II extends conventional GAs by applying non-dominated sorting and elitism, enabling the identification of a Pareto-optimal front that represents trade-offs among the three objective functions [
67,
69].
2.7. Selection and Comparison of Optimized Solutions
After constructing the Pareto front, a subset of optimized solutions was selected for detailed analysis based on their performance with respect to the three objective functions. We prioritized the solutions that exhibited the lowest values of , , and . They were labeled optimized lowest , optimized lowest , and optimized lowest , respectively, and a number was added to distinguish cases sharing the lowest value of any objective function.
To contextualize the performance of the optimized passive strategies, four benchmark scenarios were defined. The first was the unmodified base case, representing the standard Sumaq Wasi construction. The second benchmark consisted of the Sumaq Wasi variant with fired clay brick walls instead of adobe. The third scenario simulated the use of 400 W electric heaters installed in the bedrooms and controlled by a thermostat with a heating setpoint of 14 °C. In this scenario, heaters operate only when bedroom operative temperature falls below 14 °C and are switched off otherwise. This solution was considered both feasible and practical given local practices and affordability. The fourth benchmark represented an idealized reference case, in which electric heaters were used to fully prevent bedroom underheating by always maintaining operative temperatures at or above 14 °C. This scenario was intended to estimate the minimum heating energy required to eliminate cold discomfort in bedrooms during sleeping hours. These benchmarks represent a spectrum of realistic and idealized adaptations that households may consider using to reduce nighttime cold discomfort.
All Pareto-optimal solutions identified through the optimization process were compared against these benchmarks using the three objective functions. This comparative evaluation provided valuable insights into the trade-offs and feasibility of passive design improvements versus conventional heating in high-altitude Andean housing.
3. Results
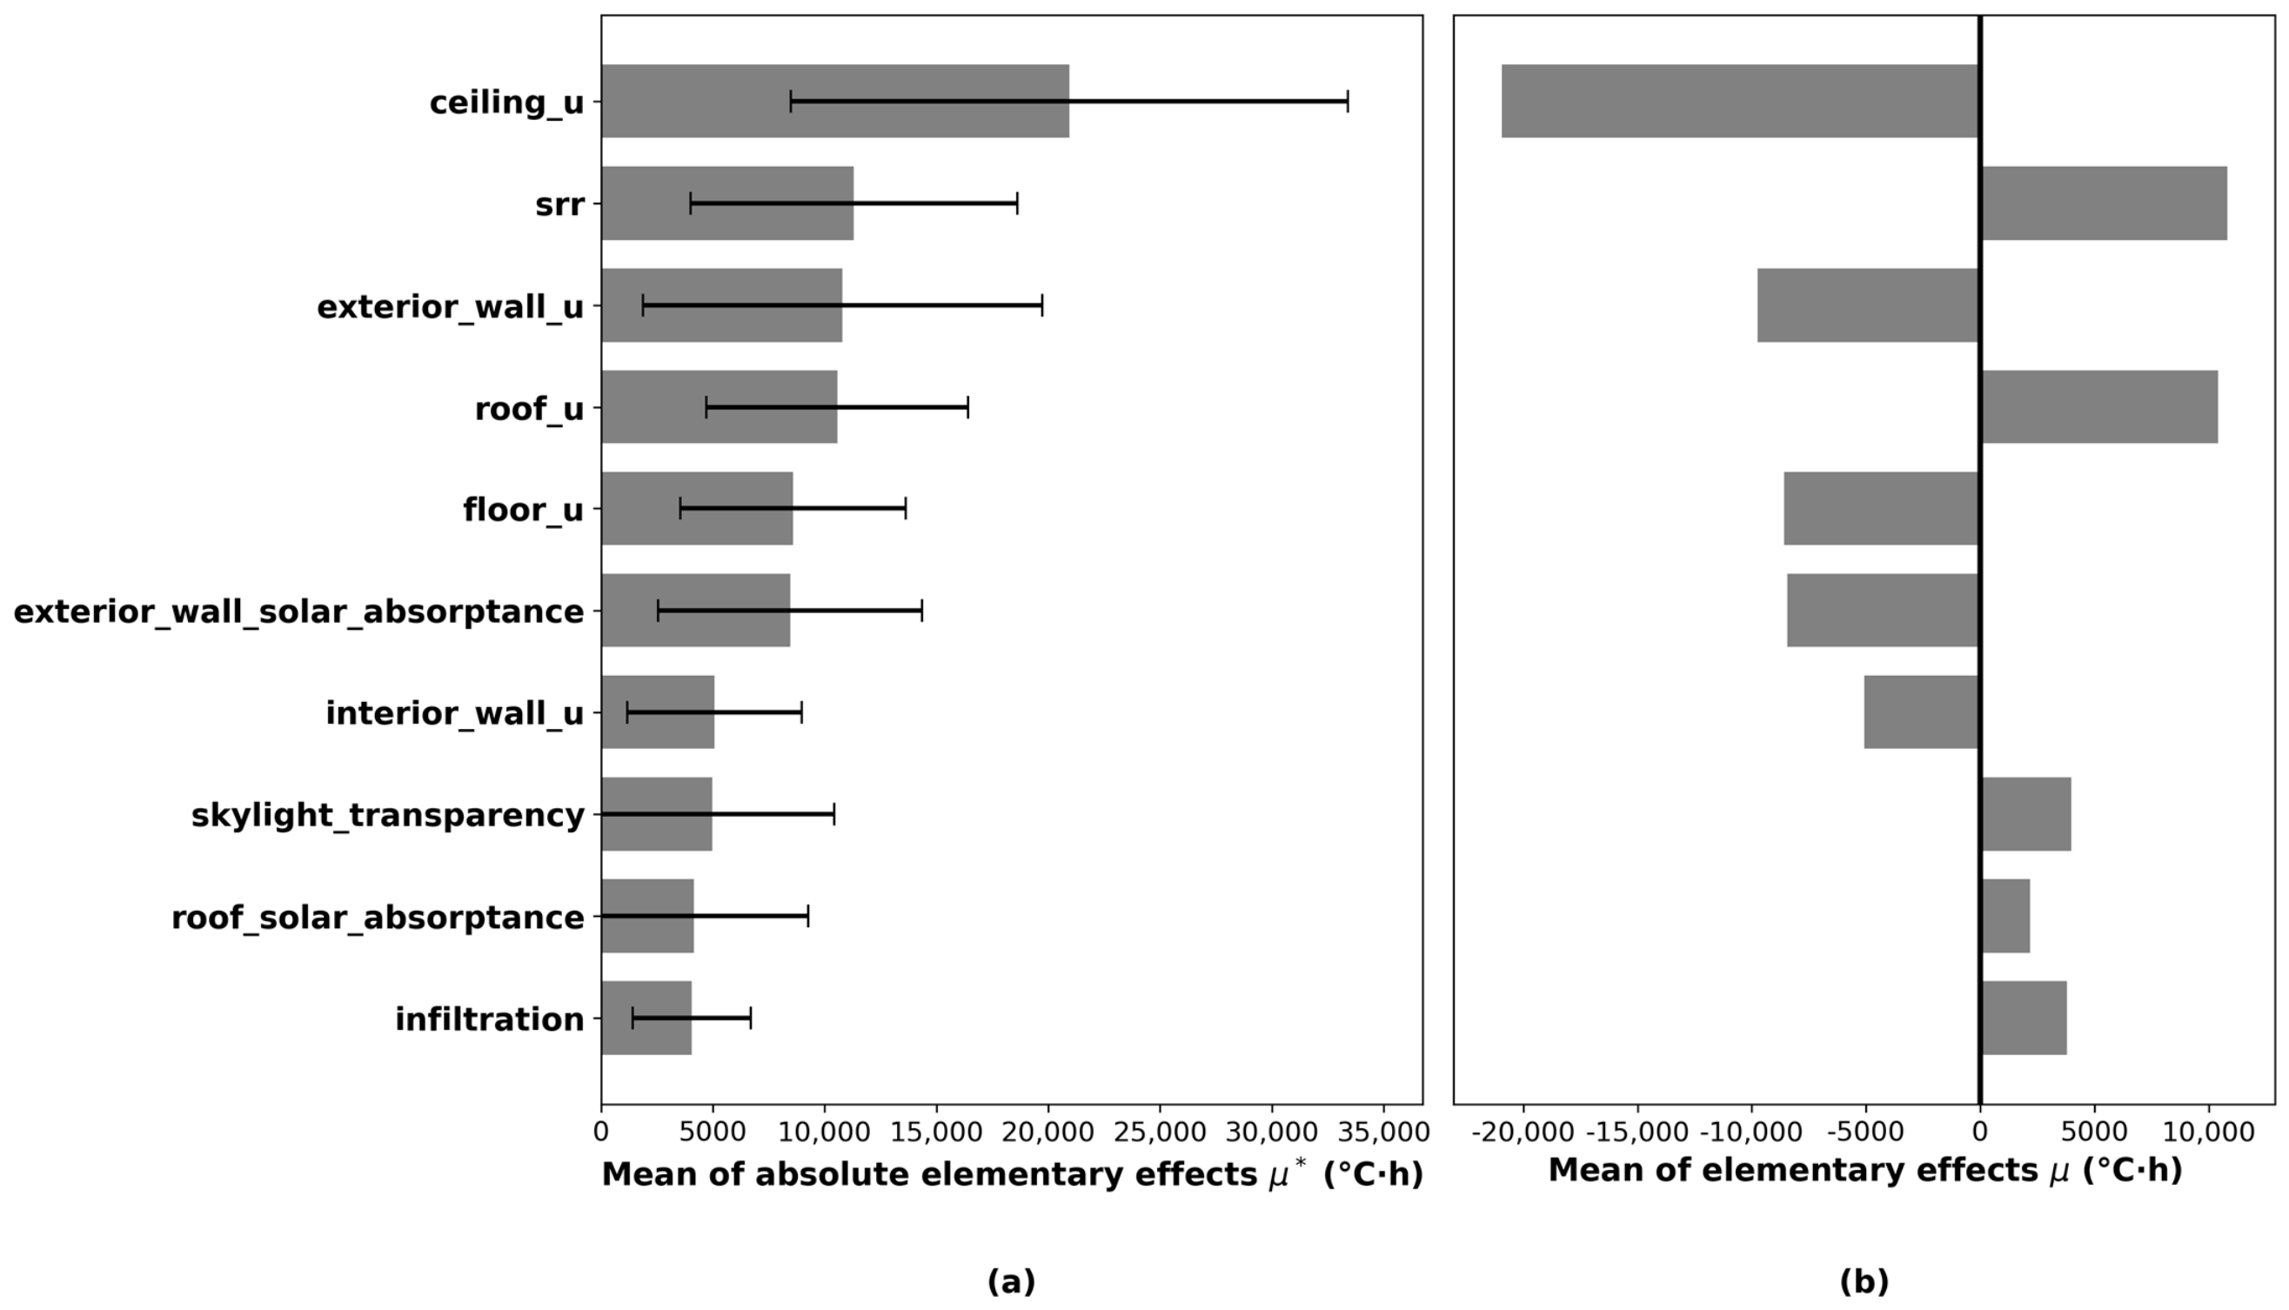
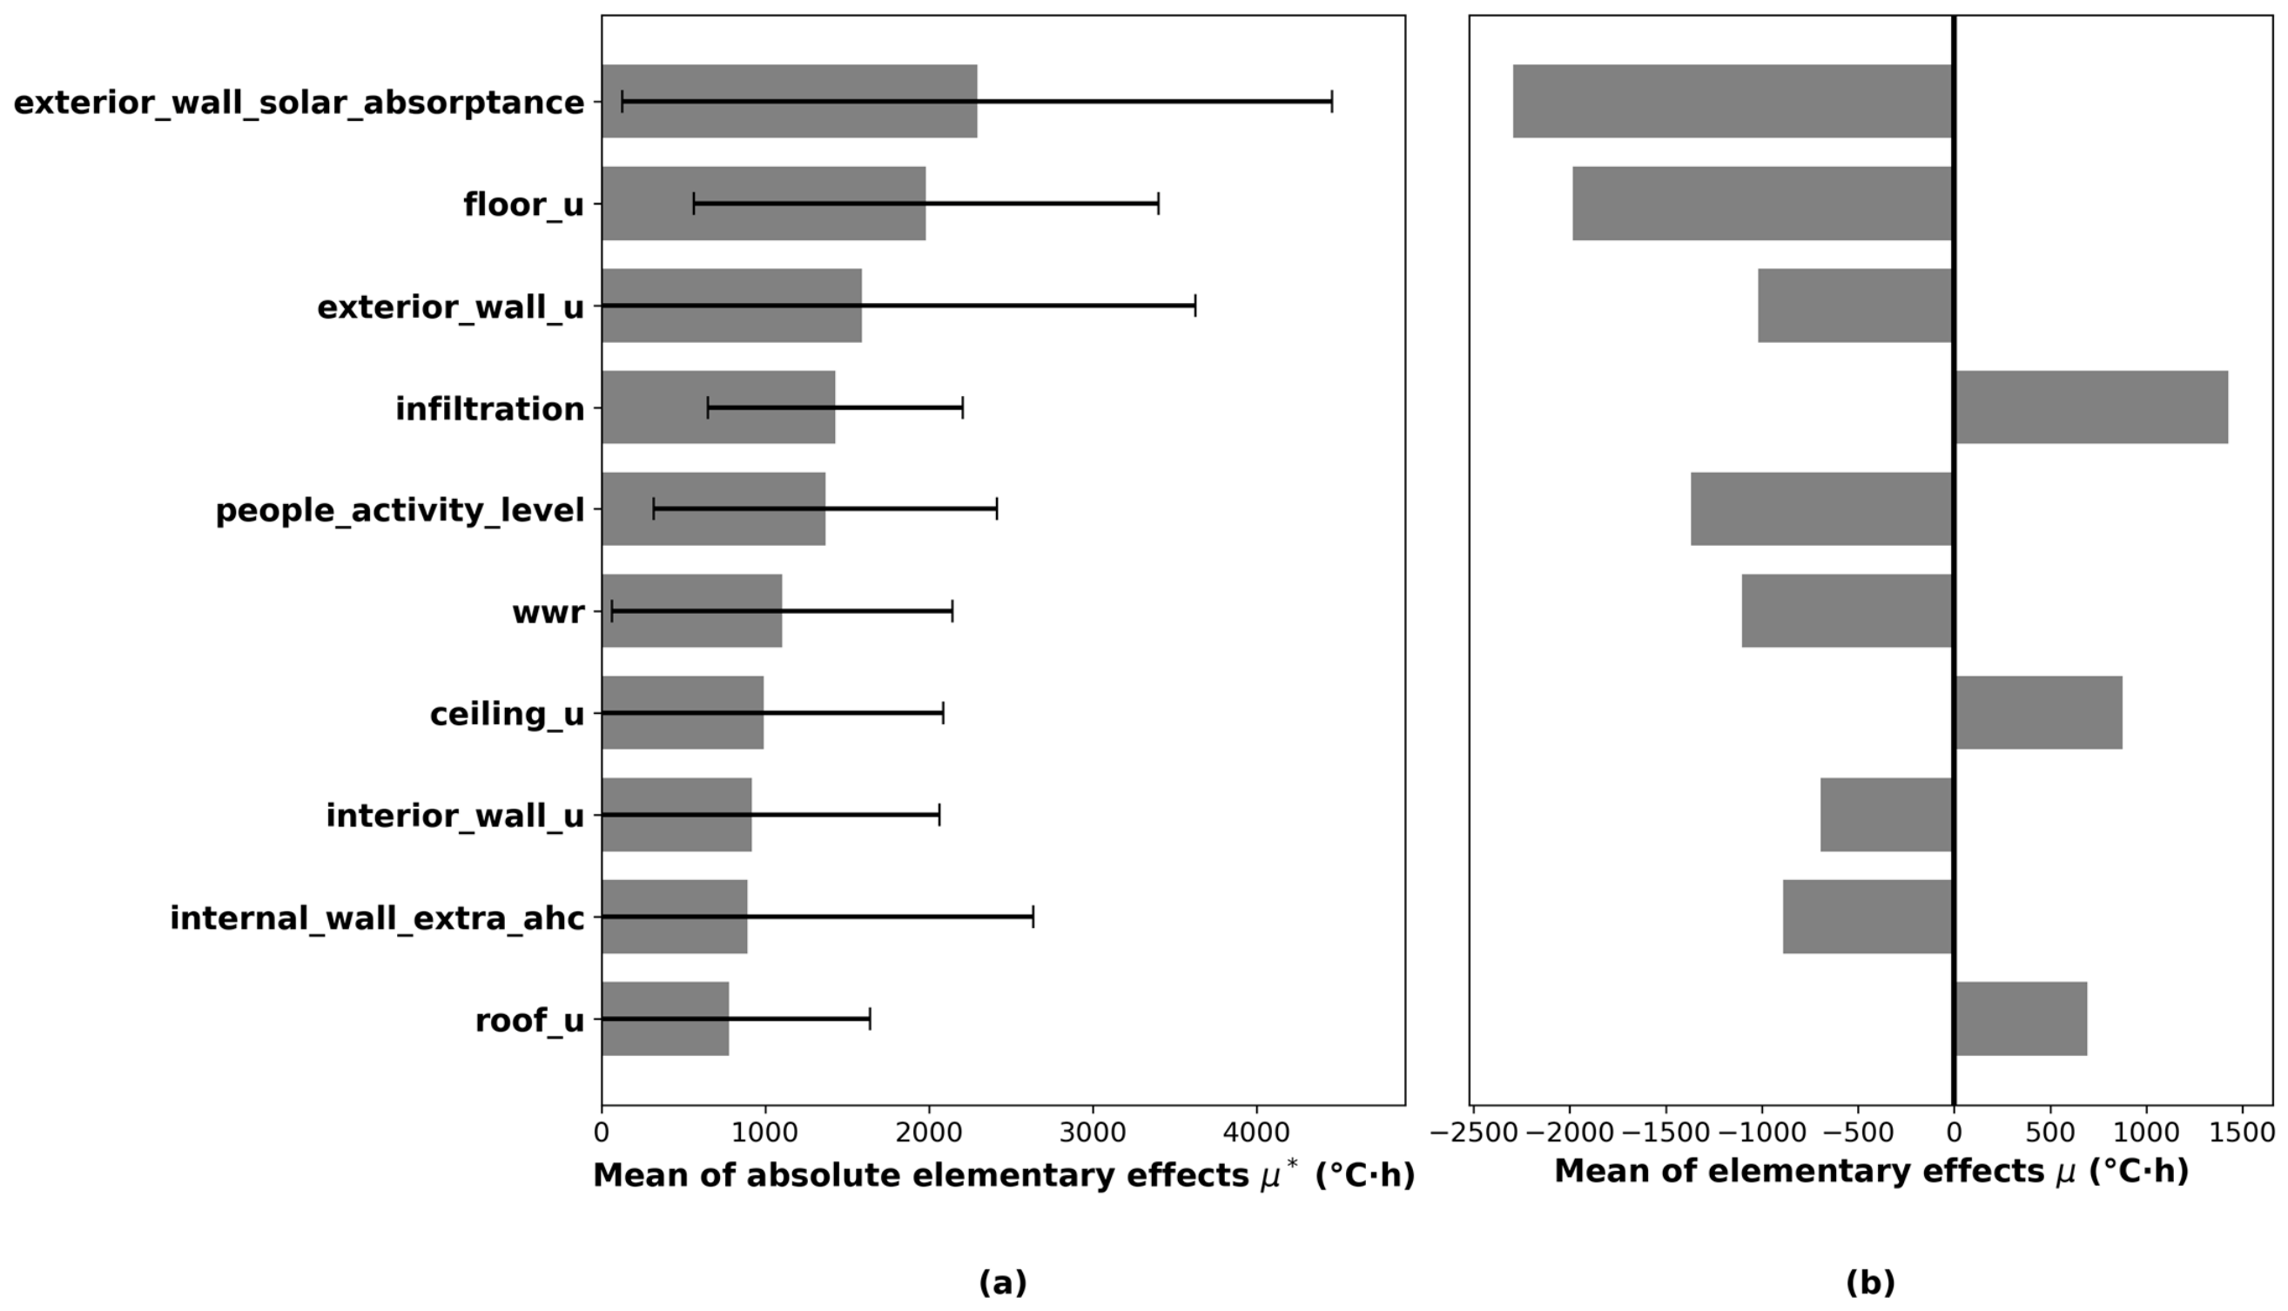
The Morris analysis identified the ceiling U-value as the most influential parameter for
(
Figure 5) and the exterior wall solar absorptance for
(
Figure 6). The exterior wall U-value was also ranked among the most impactful variables for both objective functions. An increase in ceiling U-value reduced
(negative
) but increased
(positive
), revealing a trade-off between daytime and nighttime performance: higher ceiling transmittance reduces overall annual discomfort while simultaneously worsening nighttime underheating in bedrooms. In contrast, increasing roof U-value increased both
and
, highlighting the sensitivity of the dwelling’s thermal behavior to roof heat transfer. Exterior wall solar absorptance showed a strong influence on
, where higher absorptance reduced underheating discomfort, reflecting the importance of solar gains. The exterior wall U-value also exhibited consistent influence across both objective functions, confirming its role in governing heat exchange through the envelope.
Regarding solar gains, the skylight-to-roof ratio (SRR) ranked 2nd in importance for
(
Figure 5), where increasing SRR led to higher overall discomfort. In contrast, SRR ranked only 14th for
, where increasing SRR reduced underheating. This behavior is consistent with increased solar irradiation through roof glazing. Additional solar gains help mitigate cold discomfort but intensify overheating during high-irradiation periods, leading to a net increase in annual total discomfort. Meanwhile, window-to-wall ratio (WWR) ranked 6th for
and 12th for
. Increasing WWR reduced both indicators. This suggests that vertical glazing provides beneficial solar gains during cold periods without substantially increasing overheating, indicating a different thermal role compared to skylights under the studied climate conditions.
In both objective functions, parameters such as the thermal mass of interior objects and exterior walls, as well as the transmittance of doors, shutters, and windows were consistently ranked as the least influential parameters. This does not imply that these parameters have no effect: Rather, within the tested parameter ranges, their contribution to the variance of the discomfort indices was small relative to dominant factors. Across most variables, the magnitude of was similar to , indicating limited sign changes in the elementary effects. This suggests that the direction of influence (positive or negative) remained consistent across the sampled trajectories, with minimal cancellation effects. In contrast, the relatively large values of for several parameters indicate non-linear behavior and interaction effects within the explored parameter space.
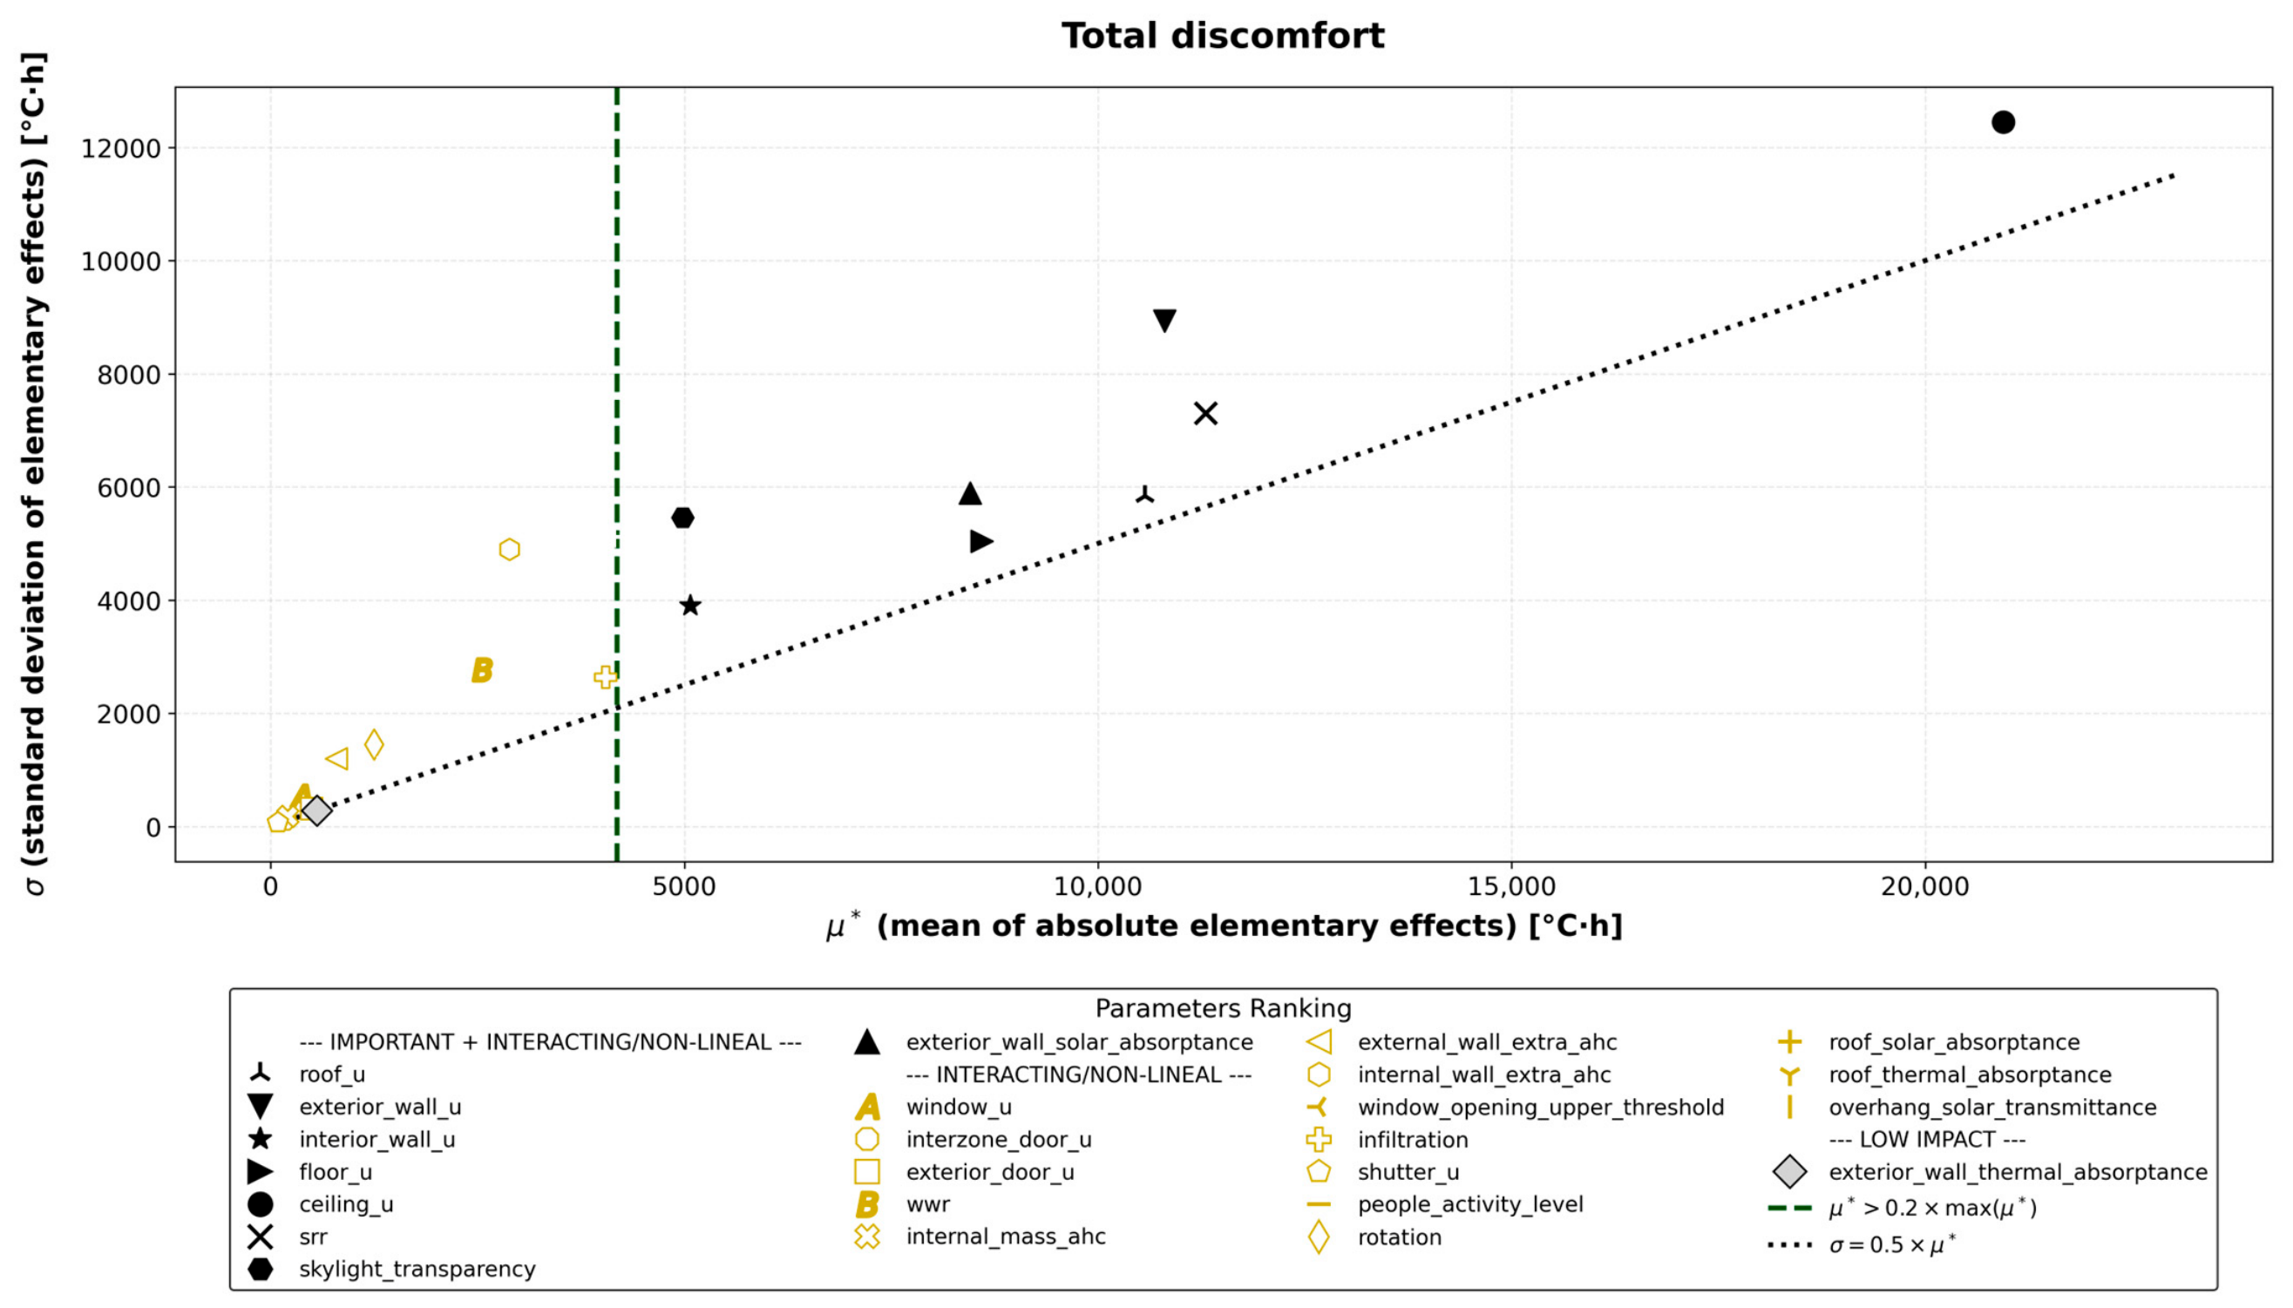
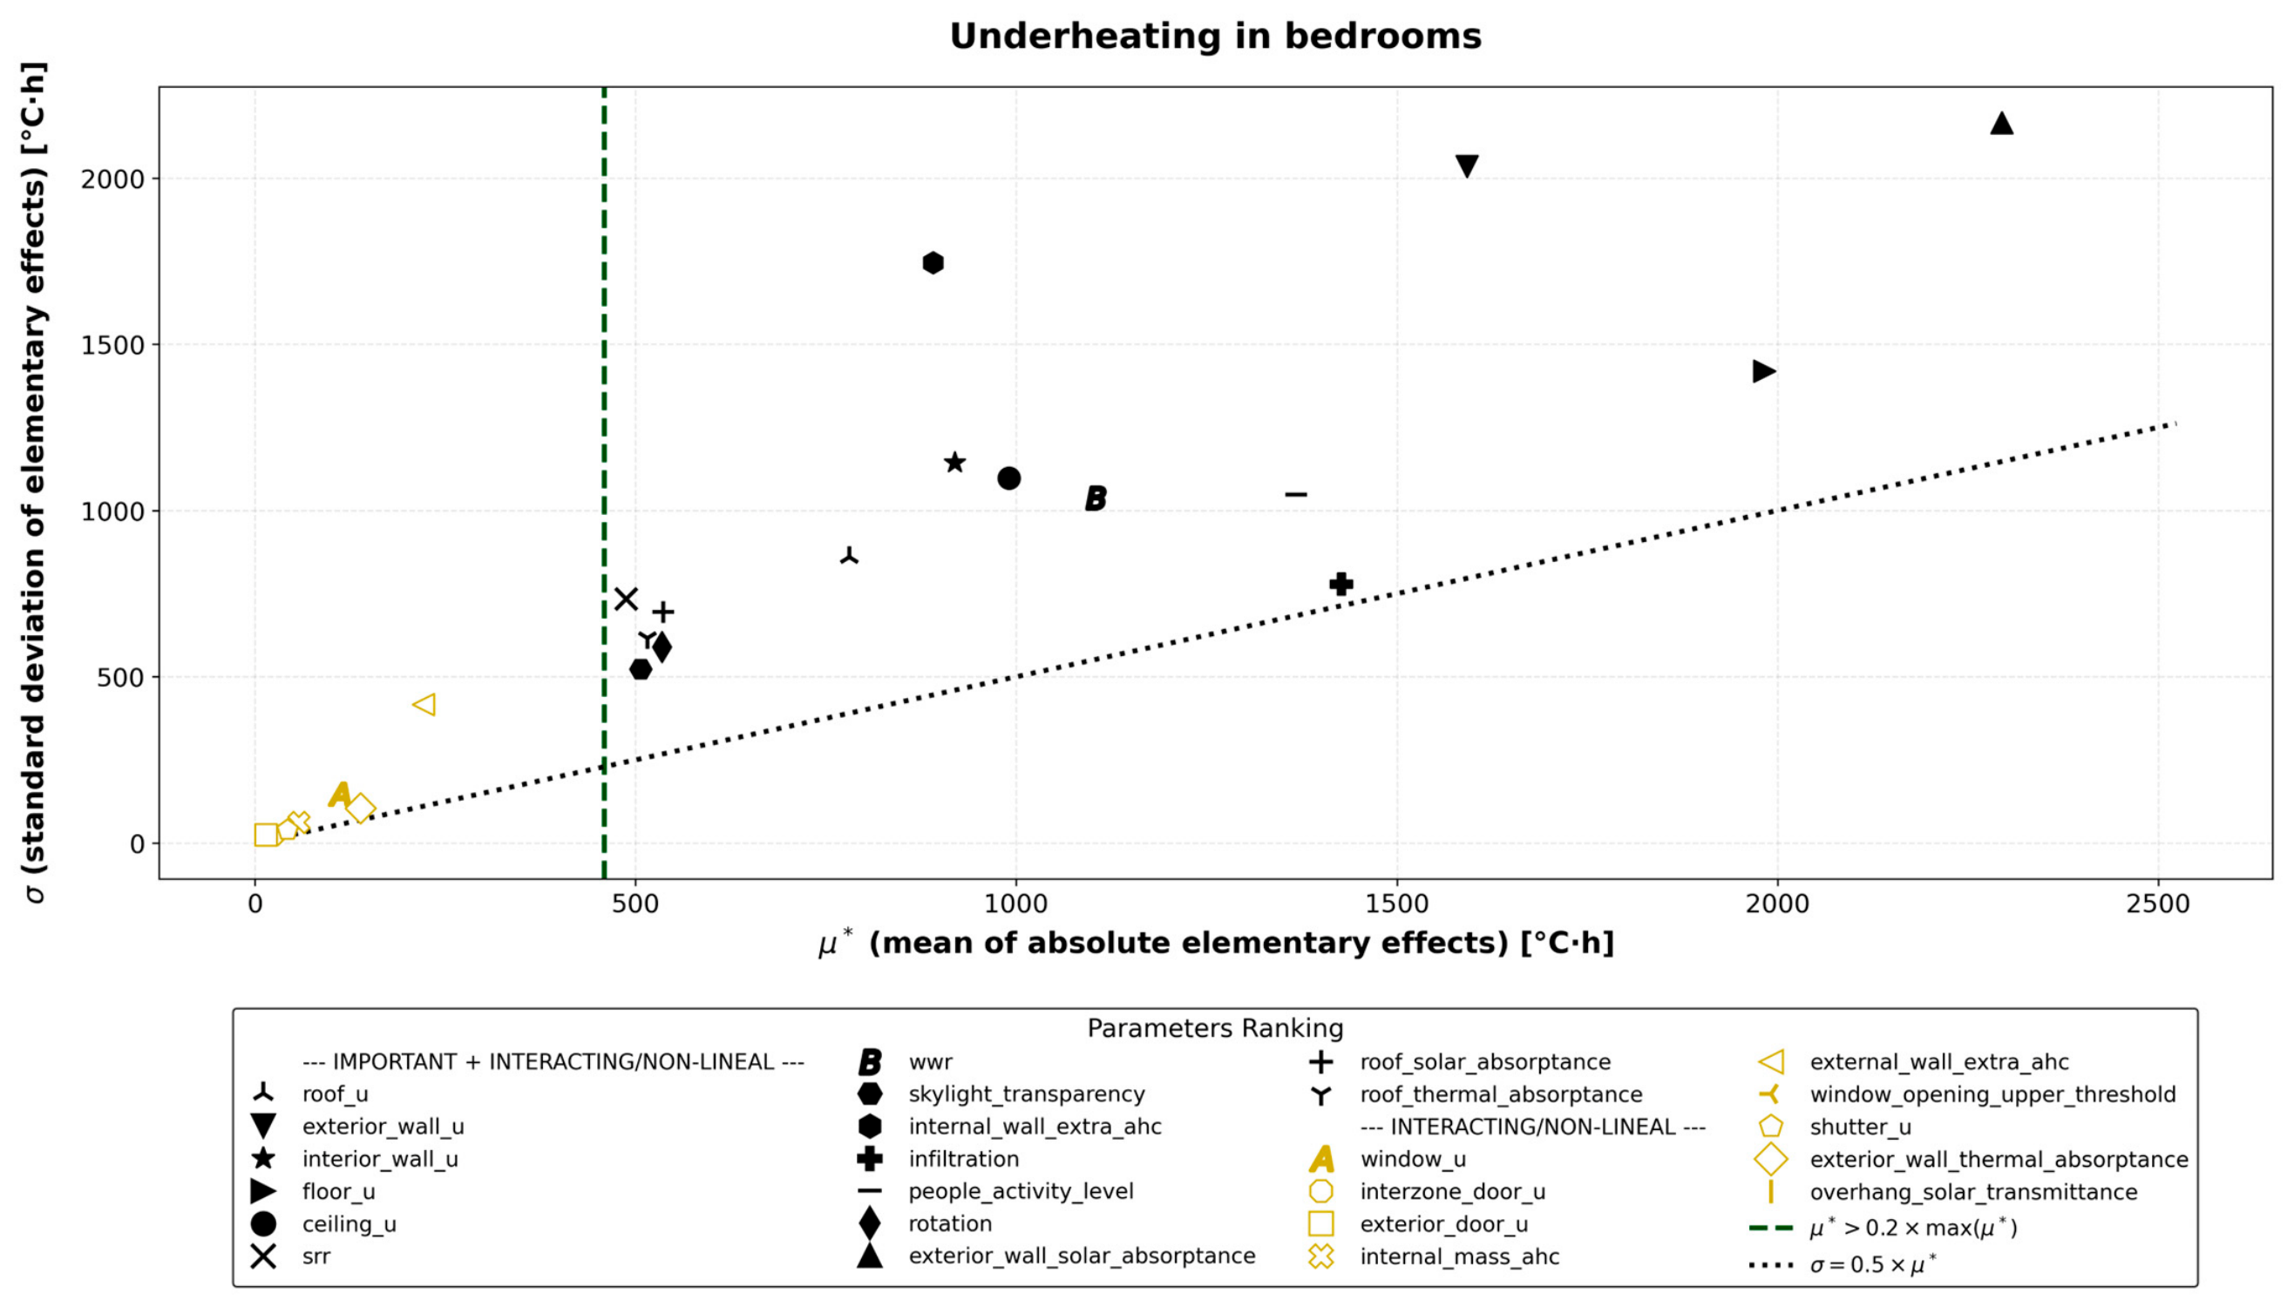
For the Sobol analysis, thirteen parameters were retained based on the Morris screening results. Using the established thresholds (
and
), two screening plots were generated (
Figure 7 and
Figure 8). For
, eight parameters exceeded both thresholds, indicating a limited subset of influential variables with notable interaction effects. In contrast, fifteen parameters exceeded the thresholds for
, suggesting a broader sensitivity structure and stronger non-linear or interaction effects in the underheating response. All eight parameters identified for
were also among those for
. From this set, infiltration and people activity level were excluded from the Sobol analysis due to their classification as non-design parameters, resulting in a final subset of thirteen design variables.
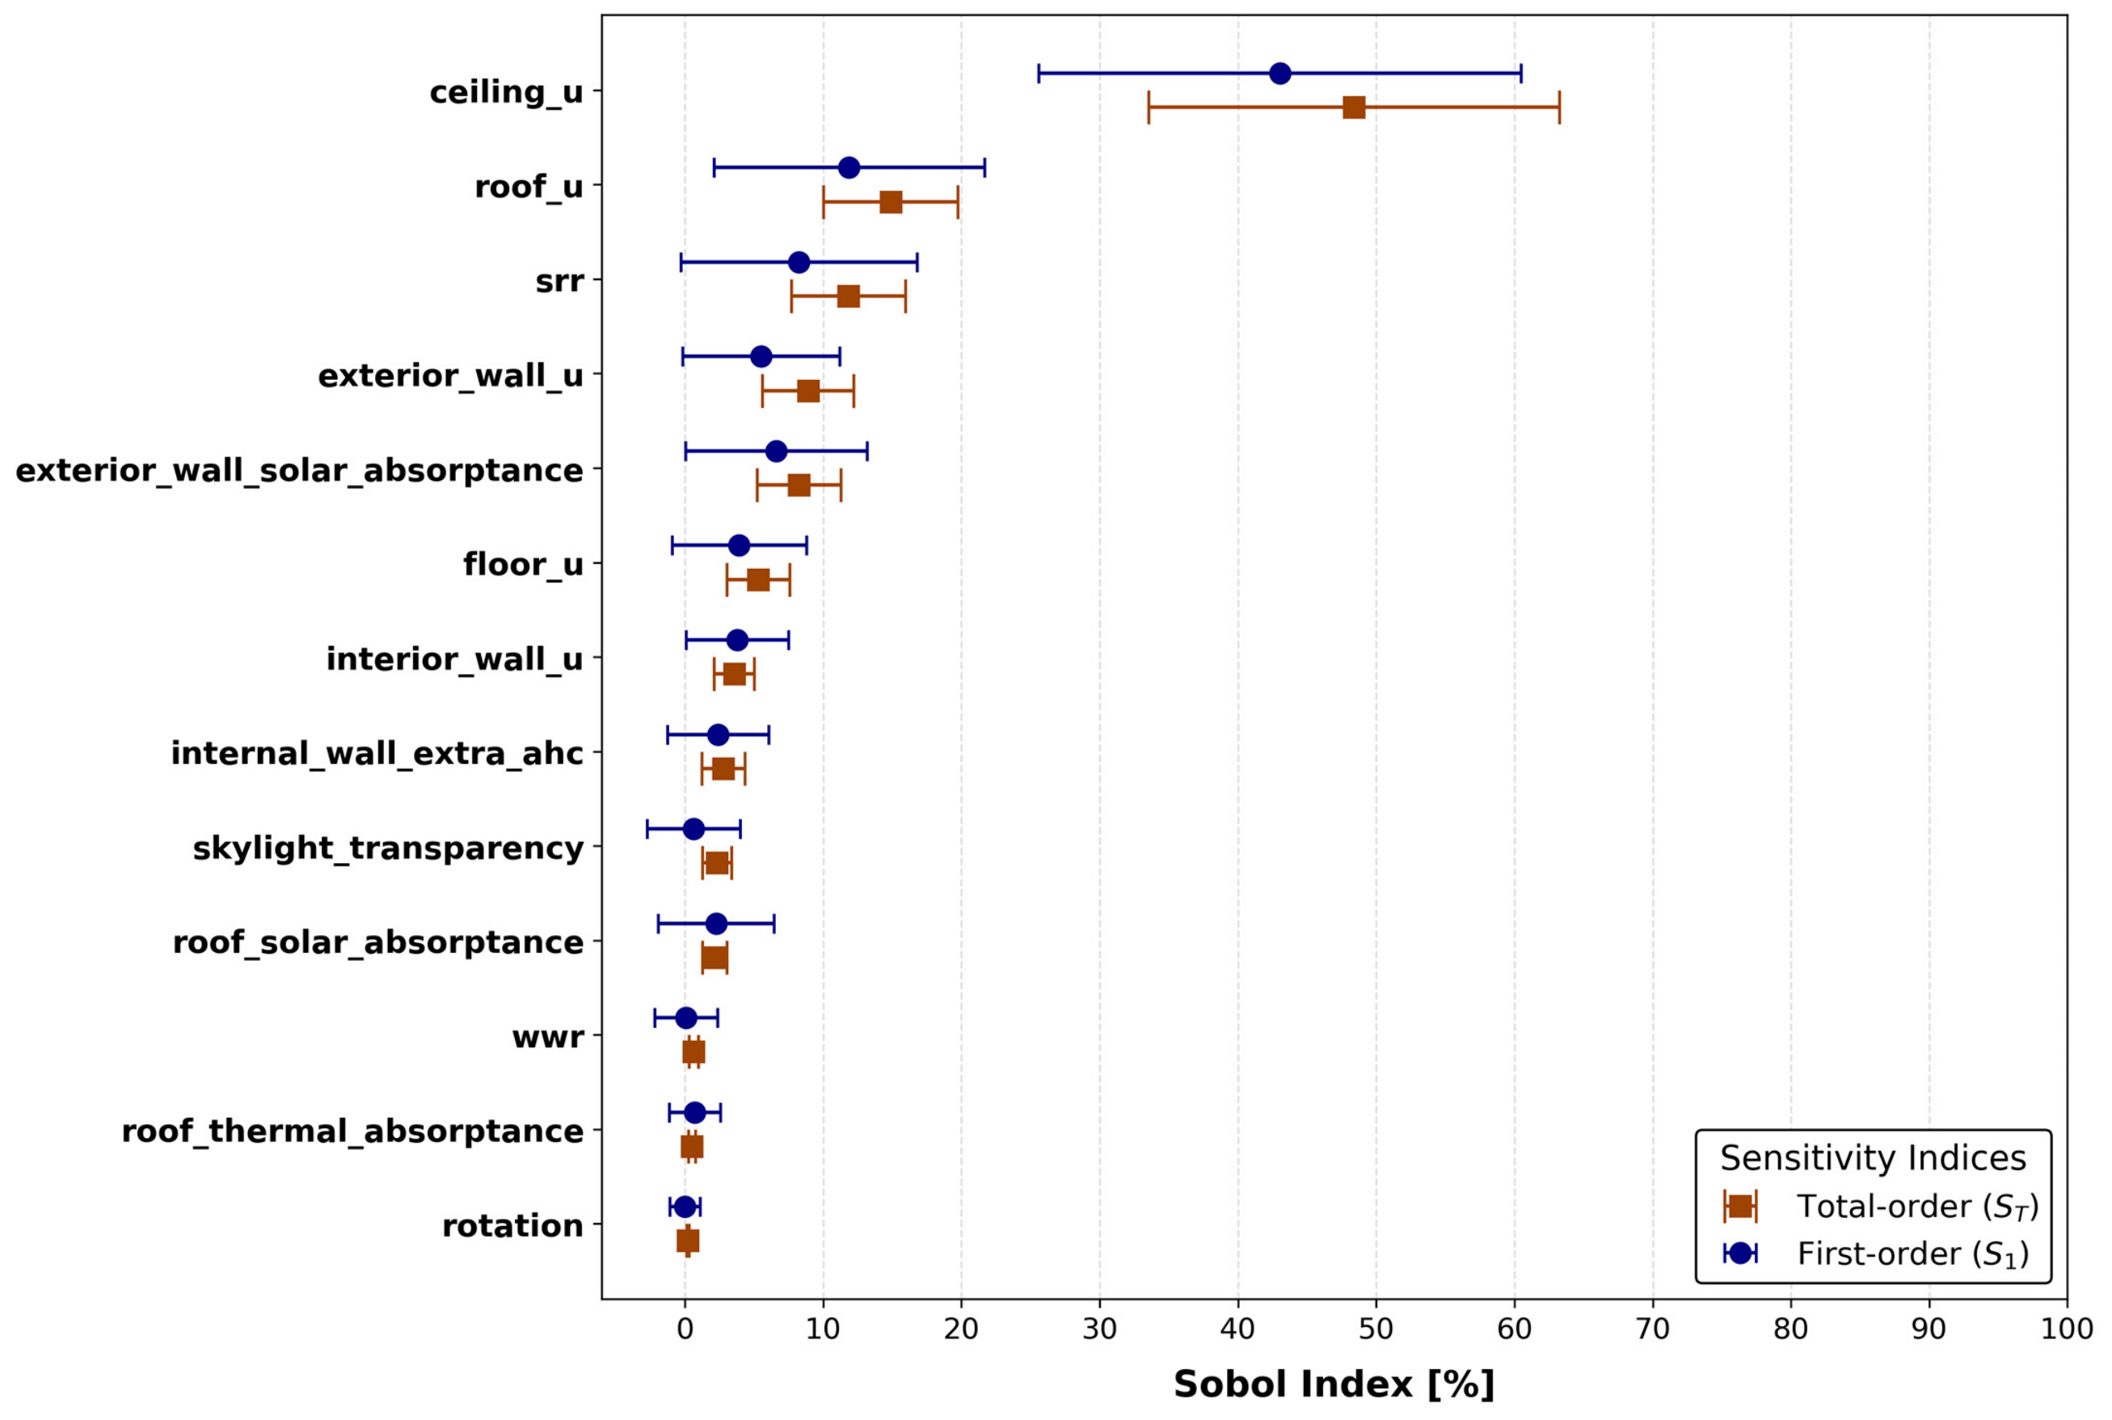
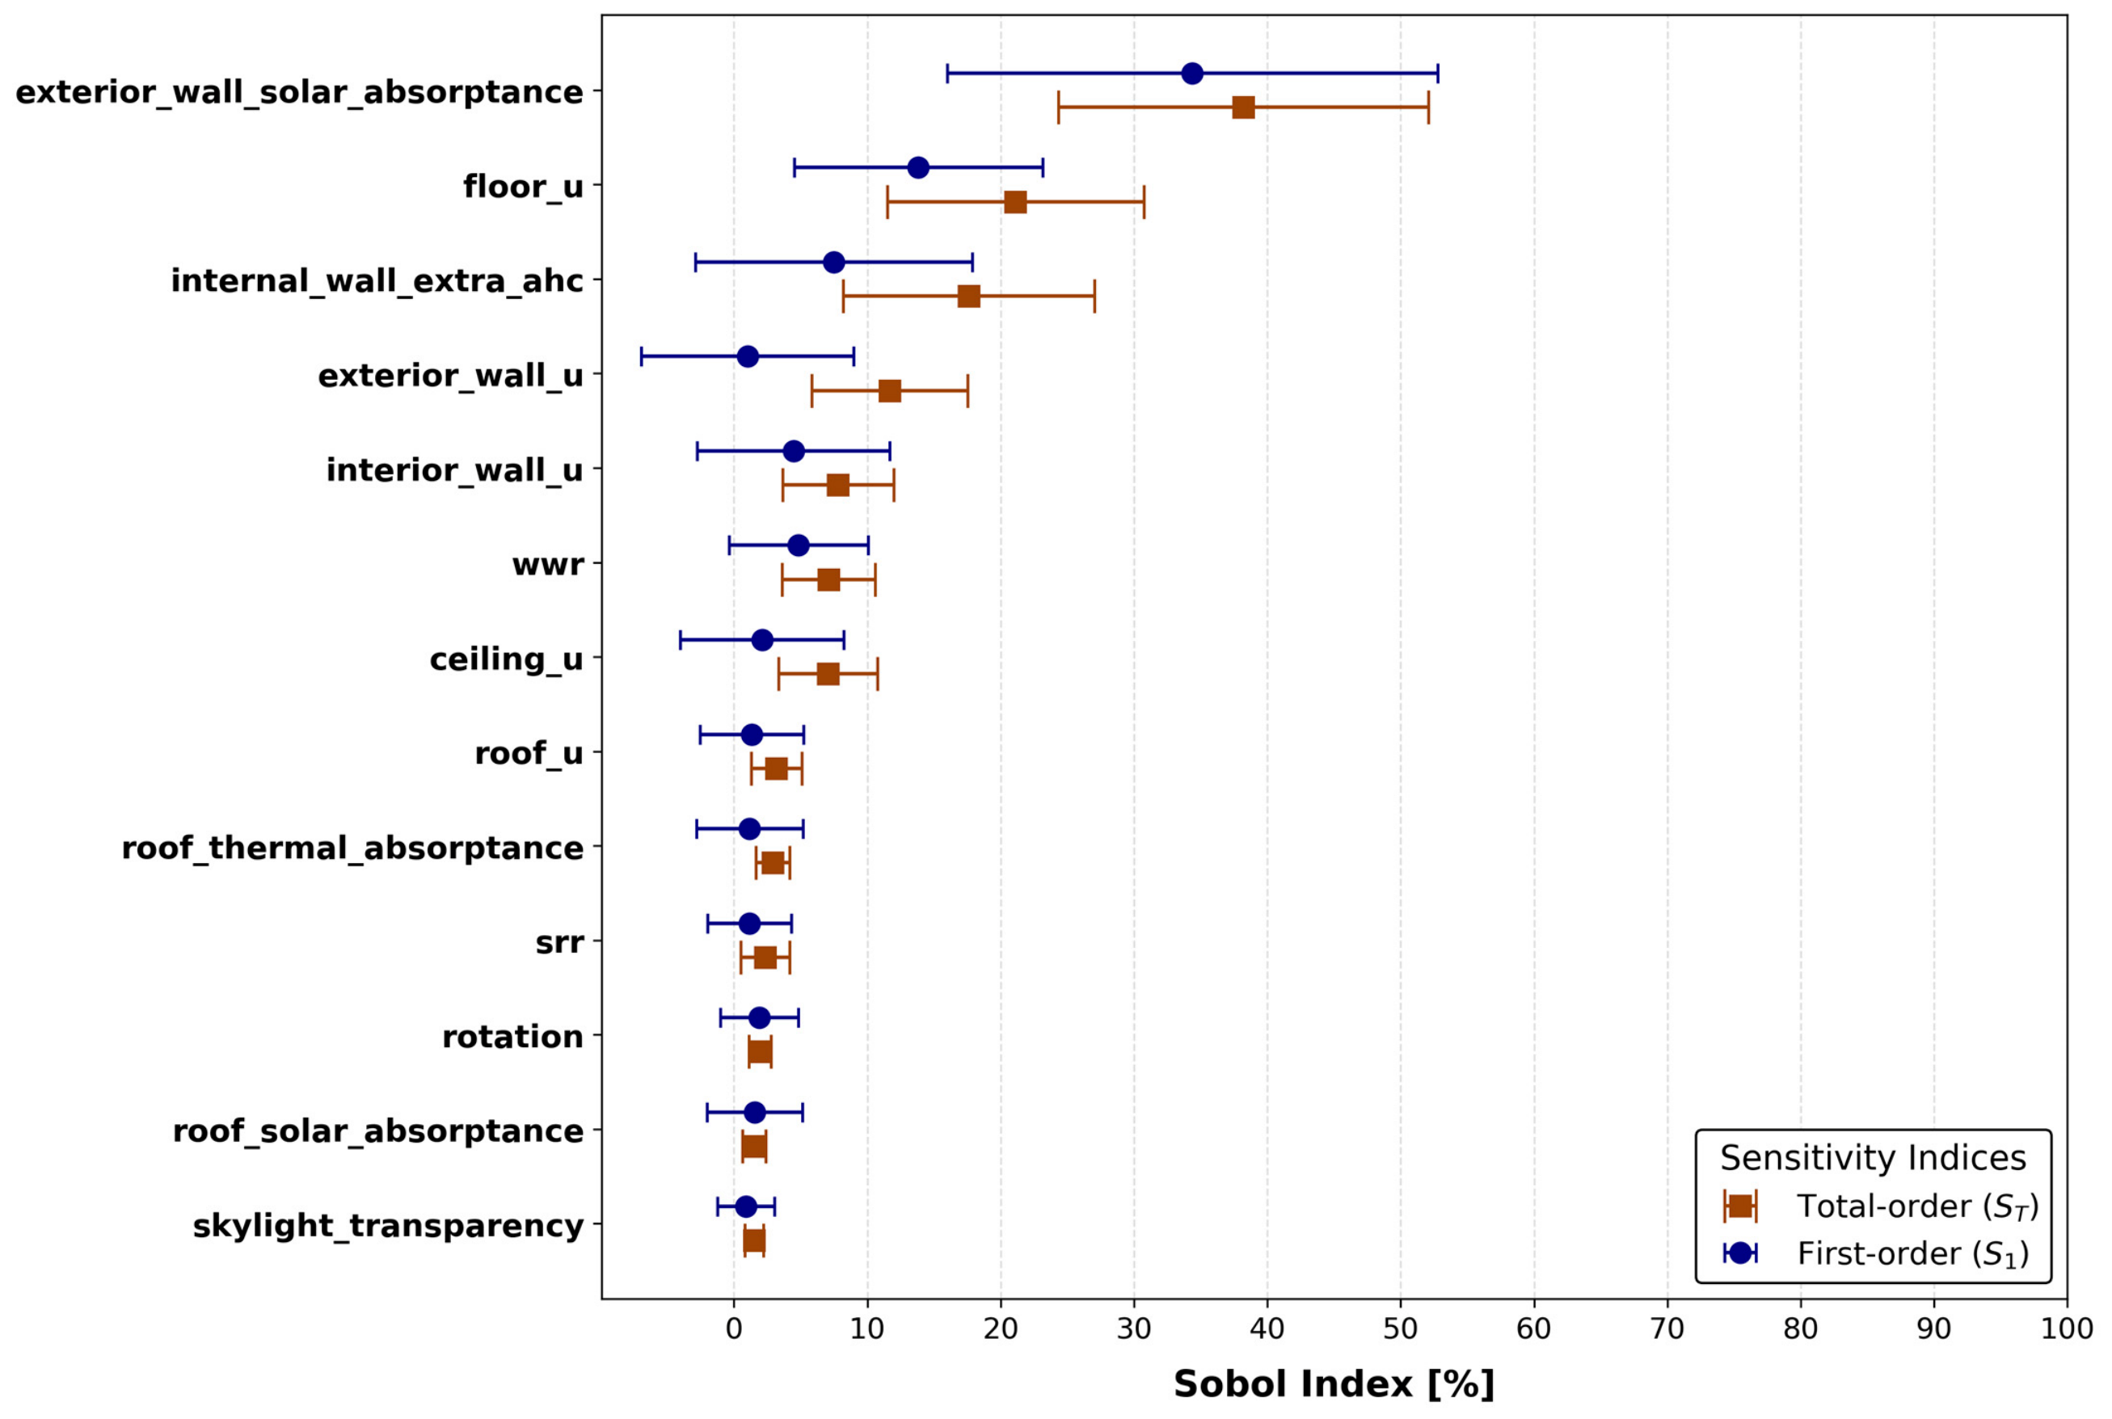
The Sobol method revealed that for
, the most influential parameters were the thermal transmittance of ceiling and roof, the SRR, the thermal transmittance of exterior walls, and the exterior wall solar absorptance (
Figure 9). For
, the key contributors were exterior wall solar absorptance, floor thermal transmittance, the thermal mass of the interior walls, and the thermal transmittance of both exterior and interior walls (
Figure 10). Collectively, these parameters accounted for more than 85% of the output variance. Several other parameters exhibited first-order (
) and total-order (
) Sobol indices with confidence intervals extending to or near zero, suggesting their individual contributions were negligible or indistinguishable from noise given the dominance of the primary factors. In the case of
,
indices were substantially higher than the corresponding
indices for parameters such as floor, exterior walls, interior walls, and ceiling thermal transmittance, as well as for the thermal mass of interior walls (
Figure 9 and
Figure 10). This suggests stronger interaction effects among input parameters for
compared to
, where the
and
values were generally more aligned across all parameters.
Only the parameters that collectively accounted for more than 85% of the variance of each objective function in the Sobol analysis were retained for the optimization (
Table 4). These included the thermal transmittance of ceiling, roof, exterior and interior walls, and floor, together with the SRR, exterior wall solar absorptance, and the thermal mass of interior walls. For each parameter, discrete design alternatives were defined based on realistic construction modifications within the ranges identified in the sensitivity analysis. Investment costs were estimated using local supplier price data collected in Cusco during the year 2023 and represent material-only costs for envelope modifications relative to the base case.
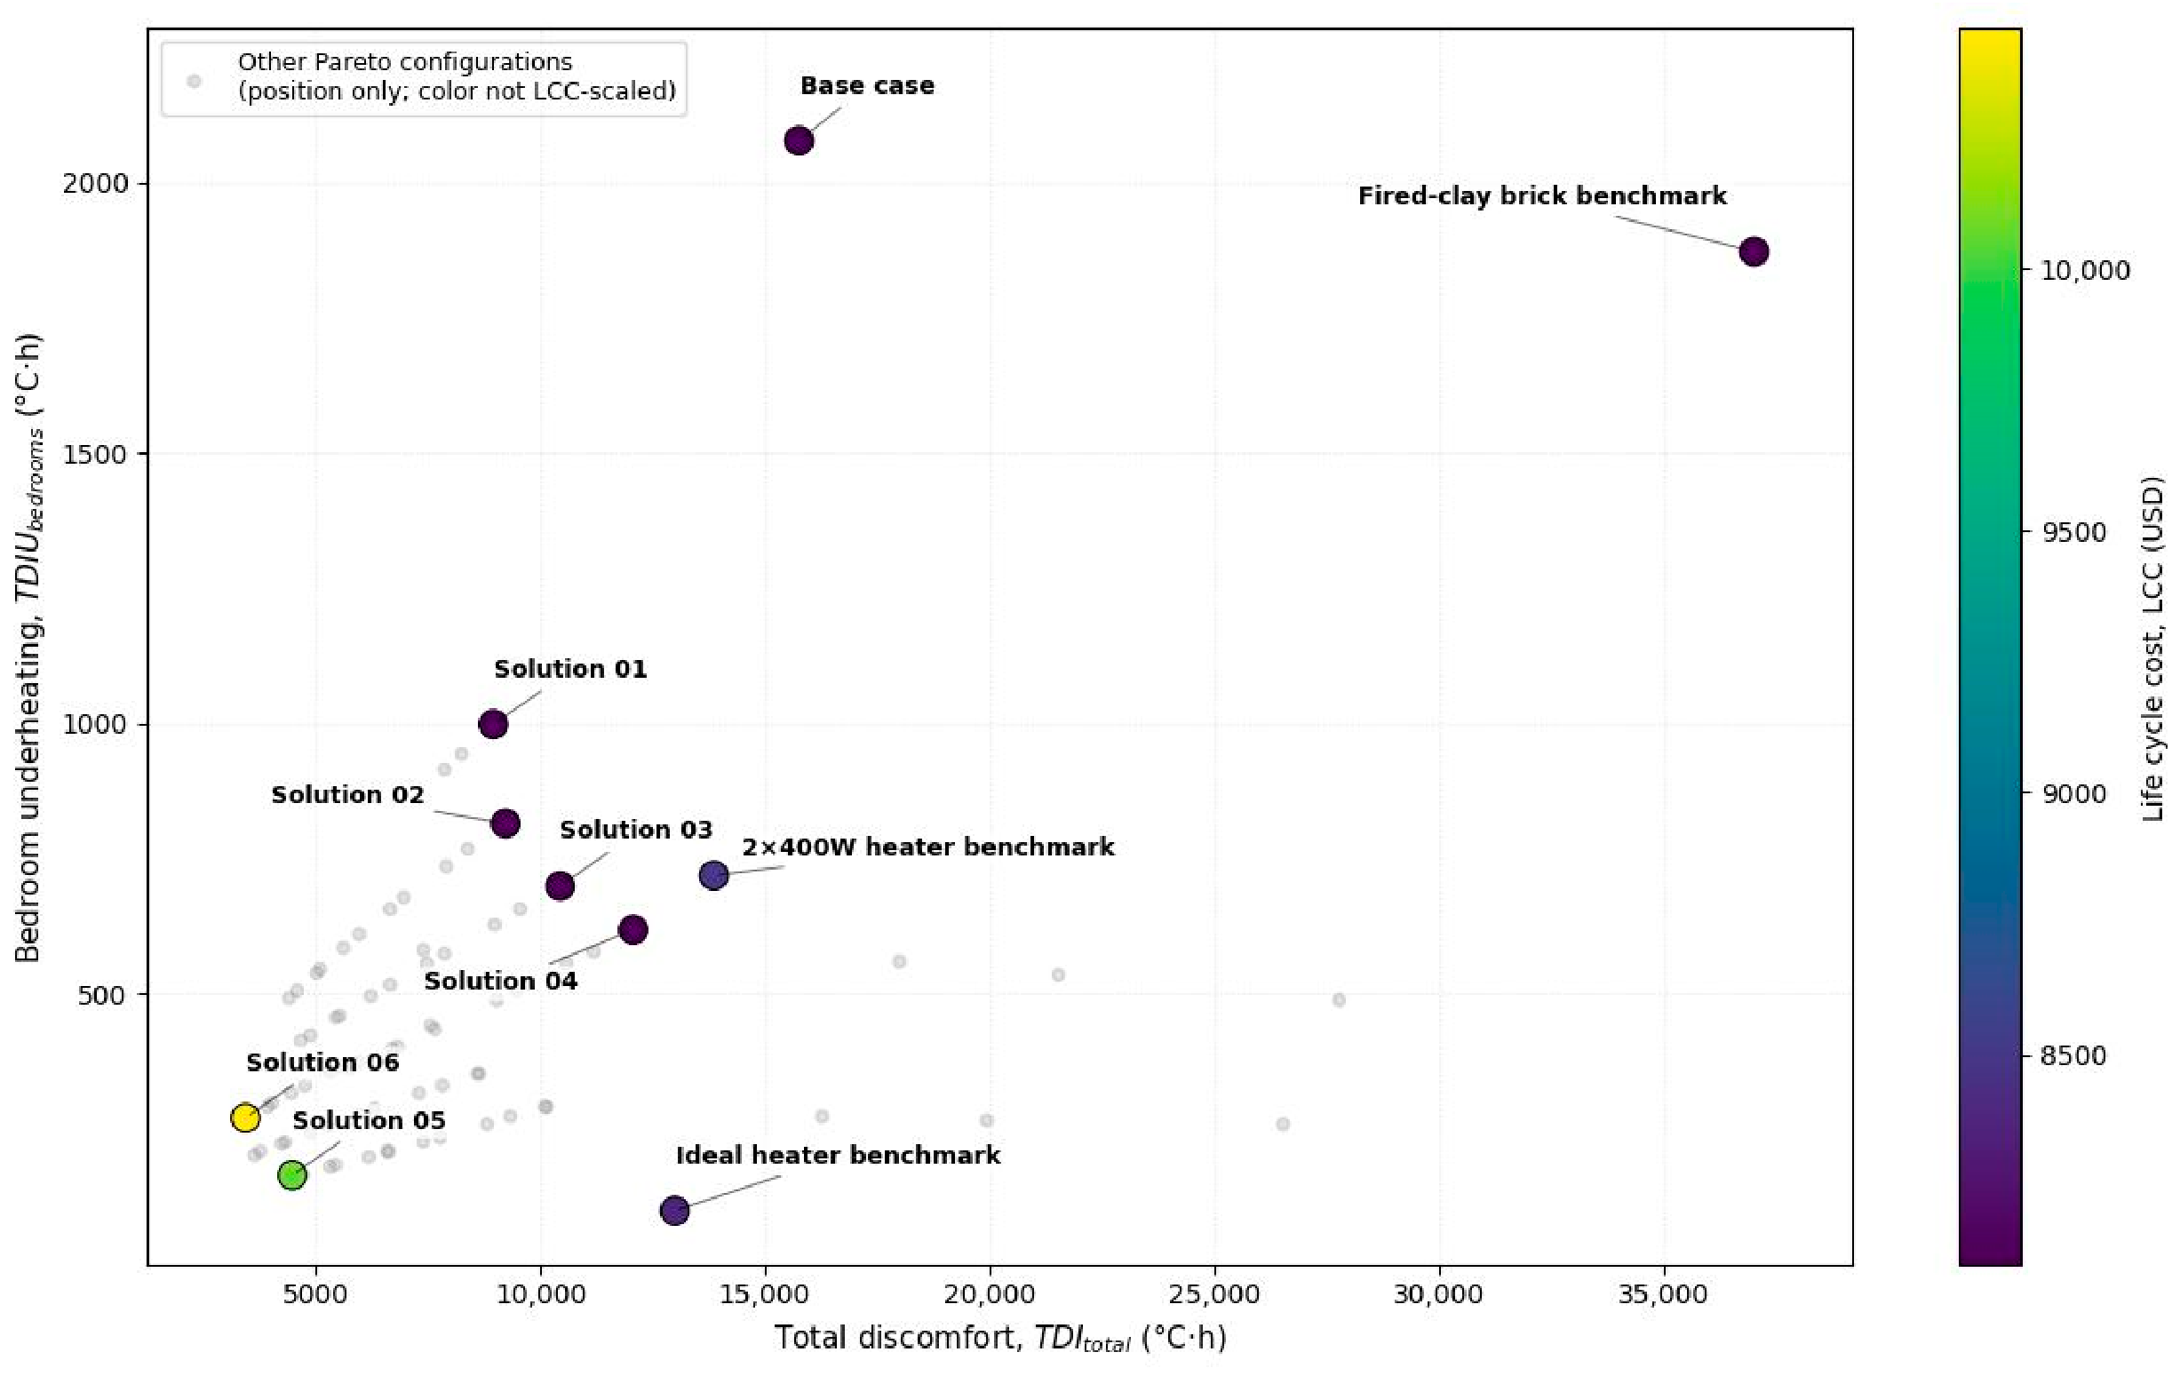
The NSGA-II algorithm produced a Pareto front of 50 optimal solutions. From this set, six representative configurations were selected (
Table 5 and
Table 6): Solutions 01 to 04 that are the four Pareto solutions with the lowest
, Solution 05, which had the lowest
, and Solution 06, whixh had the lowest
. The four lowest
Pareto solutions (solutions 01 to 04) maintained an
of 8100 USD with a
ranging from 8953 °C·h up to 12,067 °C·h and
ranging from 618 °C·h up to 998 °C·h. Solution 05 achieved a
equal to 164 °C·h with an
of 10,059 USD. Solution 06 achieved a
equal to 3437 °C·h at a
of 10,457 USD. These solutions represent distinct trade-offs along the Pareto front.
Across all selected configurations, exterior wall solar absorptance increased from 0.5 to 0.9 relative to the base case, highlighting the importance of solar gains. In Solution 06 (lowest ), the roof and floor U-values were reduced and SRR decreased, while interior walls thermal mass increased, which in practice meant replacing the air gap from the base case with adobe walls. In Solution 05 (lowest ), roof U-value decreased and both SRR and interior wall thermal mass increased. The four lowest Pareto solutions primarily differed in their SRR values: higher SRR increased but reduced . None of the selected modifications modified the U-values of the exterior walls, ceiling, or interior walls relative to the base case.
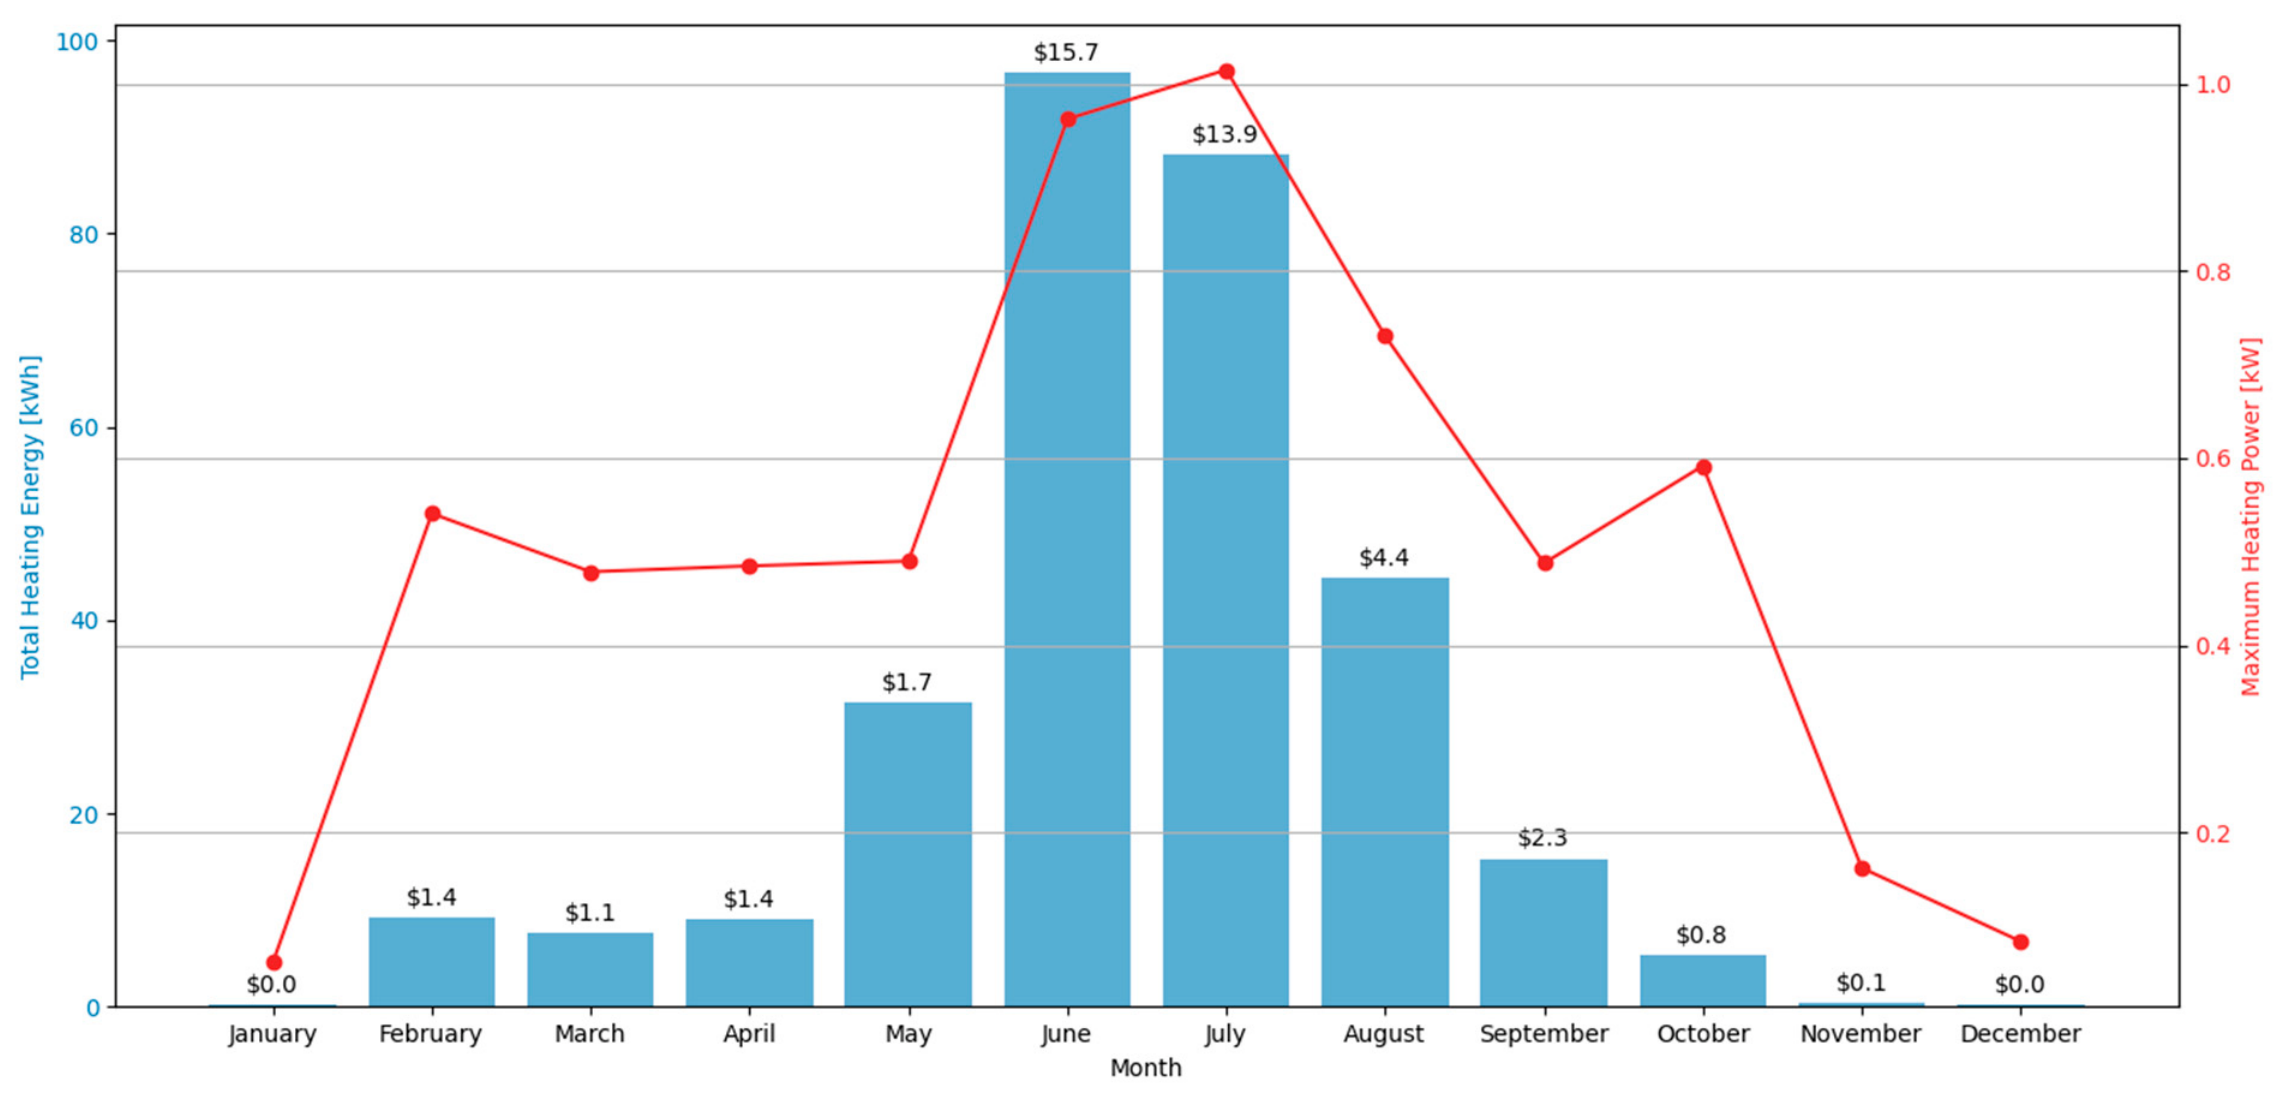
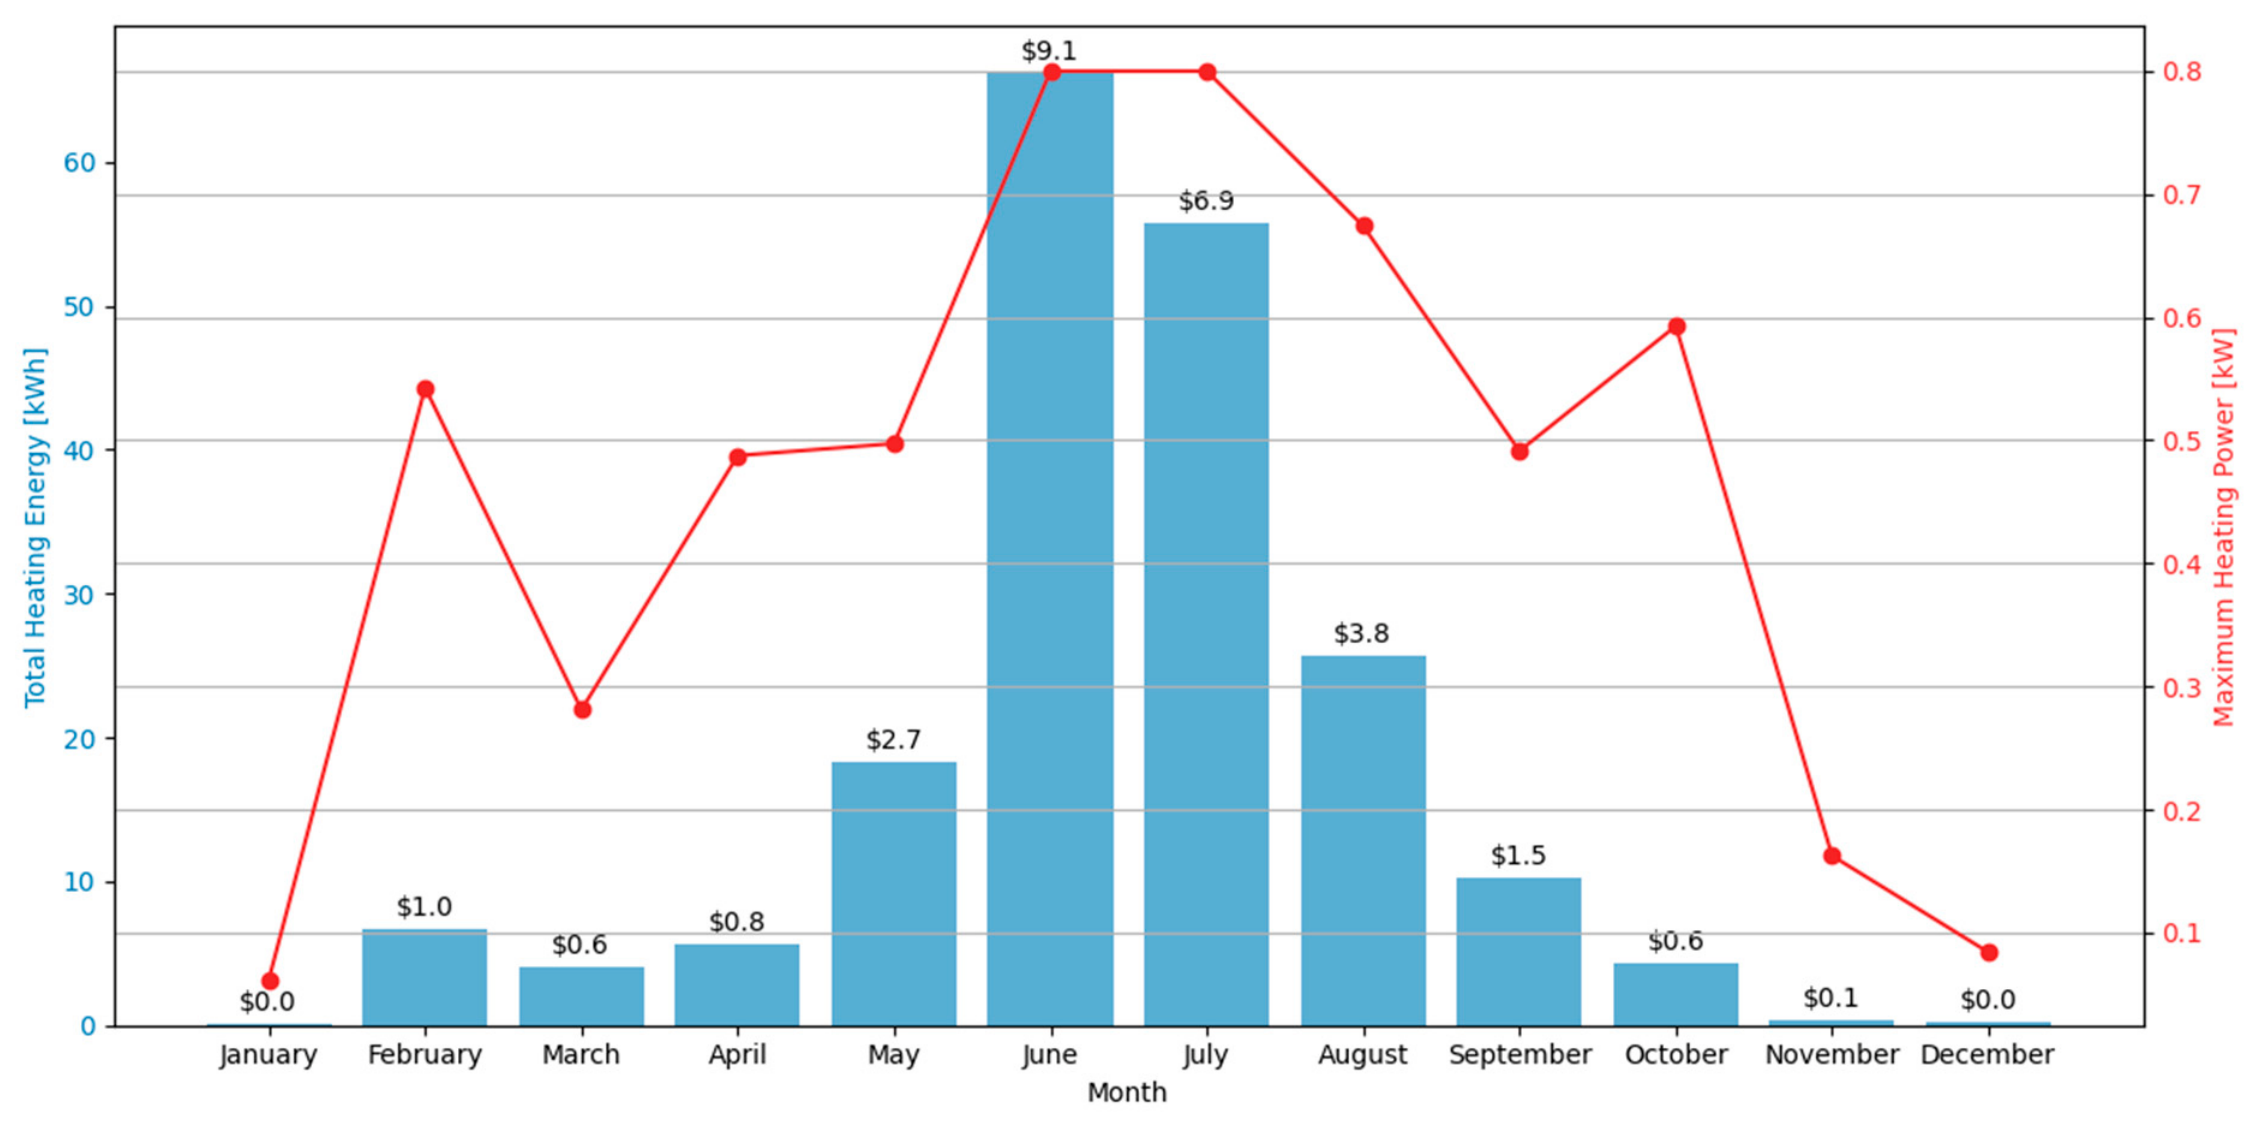
To benchmark the cost of avoiding bedroom underheating, we computed two heating cases. First, we estimated the ideal heating requirement, defined as the monthly heating energy and peak power that would be necessary to maintain bedroom operative temperatures at or above 14 °C at all times (unlimited heating capacity;
Figure 11). Second, we simulated a capacity-limited case with two fixed 400 W electric heaters (one per bedroom) controlled with a 14 °C on/off thermostat (
Figure 12). Heating demand occurred throughout most months of the year due to persistent nighttime operative temperatures below 14 °C, typical of these high-altitude locations. In the ideal case, June had the highest heating demand (97 kWh) and a peak power requirement of 0.96 kW, resulting in an electricity cost of 15.7 USD under the local tariff. In the 2 × 400 W case, June electricity use decreased to 66 kWh (9.1 USD). The maximum heating power demand peaks observed in February and October in both benchmarks reflected the presence of cold hours in the weather data, which required significant instantaneous capacity despite low cumulative monthly energy consumption. Despite the added electricity use, the 2 × 400 W case does not eliminate underheating during cold hours, which results in a higher annual
(718 °C·h) than the ideal requirement benchmark (99 °C·h).
Figure 13 compares the six solutions selected from the Pareto-front (
Table 5) against four benchmarks: the unmodified base case, the fired-clay variant, the 2 × 400 W heater case, and the ideal heating requirement case. The Pareto solutions clustered in the lower
relative to the base case, indicating that envelope modifications reduce annual total discomfort without introducing operational electricity use, occupy the low. The ideal heating requirement case yielded the lowest
by definition, but it was not considered a feasible option because it assumes unrestricted heating capacity with perfect control. Among the feasible alternatives, the solution minimizing
(Solution 05) achieved the lowest bedroom underheating within the Pareto set at moderate
. If cost is prioritized, Solution 04 provides the lowest
among the six Pareto solutions while reducing bedroom underheating relative to the base case through higher SRR and higher exterior wall solar absorptance. Notably, Solution 03 and Solution 04 also resulted in lower
than the 2 × 400 W heater case while avoiding additional electricity use.
4. Discussion
This study evaluated envelope modifications to a standardized public housing dwelling to improve indoor thermal comfort in high-altitude rural Peru. Solution 06 minimized total discomfort ( = 3437 °C·h; = 10,457 USD) while Solution 05 minimized bedroom underheating ( = 164 °C·h; = 10,059 USD). These correspond to reductions to 22% and 8% of the base case values for and , respectively, with associated increases of 2357 USD and 1959 USD. Notably, Solution 04, which was a low-cost envelope modification consisting of increasing exterior wall solar absorptance to 0.9, and the SRR to 13.1, reduced to 12,067 °C·h and a to 618 °C·h (77% and 30% of the base case, respectively) while maintaining the same , assuming that wall color selection and semi-transparent roofing did not alter investment costs. In addition, this solution achieved lower bedroom underheating than the 2 × 400 W electric heater case which yielded = 718 °C·h, and = 8275 USD.
4.1. Comparison with Existing Literature
When comparing these results with the existing literature, it is important to recognize that parameter significance is inherently dependent on the climatic context, building typology, and modelling assumptions. Research on rural buildings in the Andean region has primarily focused on mitigating low nighttime indoor temperatures, particularly during frost periods that pose health risks to children and the elderly [
8,
10,
12,
26,
27]. Our findings extend this perspective by evaluating thermal comfort throughout the entire day. Although rural lifestyles often involve outdoor daytime activities, occupants such as elderly or ill individuals may remain indoors for extended periods, making whole-day thermal performance relevant.
Previous studies in the Andes have examined passive strategies including skylights [
12,
24], attached greenhouses [
6,
7,
12,
22,
24], increased thermal mass from earth materials [
6,
12,
22,
24,
26,
27], exposing natural earth floors [
6,
8,
22], improved roof insulation [
6,
8,
12,
22,
27], increased airtightness [
6,
8,
9,
12,
22,
24], and the use of double-glazed windows with shutters [
8,
12]. Consistent with this literature, the present study identified skylight area, interior wall thermal mass, floor transmittance, and roof transmittance as influential design parameters within the evaluated configuration space. Our findings refine the observations made by Miño-Rodríguez et al. [
9] and Wieser et al. [
10] by quantifying that, for the Sumaq Wasi typology, ceiling transmittance and solar capture are more impactful catalysts for comfort than traditional wall insulation thickness, which is often prioritized in generic cold-climate policies.
The dominance of the ceiling U-value for
in our model aligns with recent research [
70,
71] that identified roof and ceiling insulation as the most critical drivers of thermal performance in cold-region rural dwellings. However, for
, exterior wall solar absorptance was the primary driver. This result contrasts with findings in lower-altitude tropical plateaus like Quito, where window-to-wall ratios (WWR) were identified as the most sensitive parameter [
31]. This difference underscores that at altitudes near 3800 m.a.s.l., capturing intense vertical solar radiation and managing envelope absorptance is more critical for passive comfort than vertical glazing alone.
To maintain indoor temperatures above 14 °C over a full year, the Sumaq Wasi dwelling required 308 kWh of heating (≈0.8 kWh/day; 9.3 kWh·m
−2·year
−1). Operating two 400 W electric heaters resulted in an annual demand of 197 kWh (≈0.5 kWh/day; 6.0 kWh·m
−2·year
−1). For comparable bioclimatic buildings, Molina et al. [
7] estimated daily energy needs of 4.2 kWh and 7.6 kWh for a minimum indoor temperature of 12.4 °C, and Iruri-Ramos et al. [
22] reported 55.38 kWh·m
−2·year
−1. In both cases, the Sumaq Wasi design used less energy than these passive alternatives, underscoring its effectiveness. Moreover, the two-heater scenario also remained below those reported figures, making it advantageous from an energy perspective. While we recognize that electricity bills may pose a burden for low-income households, these findings suggest under the studied conditions, electric heating may represent a lower cost intervention than some passive alternatives. This comparison provides a basis for future policy discussions, directly addressing the gap in local building norms identified by Palomino-Olivera et al. [
1] and offering a passive pathway to alleviate the thermal stress-related health vulnerabilities documented by Canales Gutiérrez et al. [
2] in the high-mountain rural population.
4.2. Key Design Insights
Notably, the Pareto-optimal solutions obtained through genetic algorithm optimization did not favor reducing exterior wall transmittance via added insulation. This result highlights the advantage of heat storage in wall surfaces through thermal mass rather than further increasing insulation, under the climatic conditions studied. This finding aligns with the results of Torres-Quezada & Lituma-Saetama [
27], who concluded that in Andean housing, excessive insulation can be secondary to direct solar gain and thermal mass, which are more effective at maintaining stable comfort levels passively. Additional insulation may reduce useful daytime solar heat gains without proportionally improving nighttime thermal conditions.
For the floor, the Pareto set revealed a trade-off between transmittance and the two discomfort metrics. The configuration minimizing
exhibited the lowest floor transmittance, whereas the configuration minimizing
exhibited the highest transmittance (i.e., exposed earth floors). This pattern aligns with reports that exposed earth floors can dampen daytime temperature peaks due to thermal mass [
6,
22], and with studies suggesting that omitting floor insulation may improve night-time thermal conditions [
22], although other studies report contrasting results [
9,
24]. The results also highlight the importance of thermal mass in interior walls, a parameter rarely examined in the literature, likely because traditional Andean rural dwellings are typically single-room structures [
8]. As suggested in [
8] and confirmed here, not all intuitive modifications, such as simply increasing insulation, lead to improved thermal performance; their effectiveness depends on the overall building configuration and climate context.
One parameter that has received comparatively little attention is the solar absorptance of exterior walls. In our study, all selected Pareto configurations adopted the maximum tested solar absorptance value (0.9), which reduced
and
without additional investment, assuming wall color change is cost-neutral. This finding is consistent with the recognized role of wall heat storage and supports the relevance of wall solar absorptance in high-altitude Andean dwellings. This is supported by Deng et al. [
52], who found that applying darker coatings to building facades in cold climates significantly reduces total energy demand by maximizing winter solar absorption. Although darker wall colors would offer the greatest benefit, cultural acceptability should be considered. Earth-toned dark colors could offer a middle ground and merit further investigation. Finally, although roof solar reflectance has been widely examined (e.g., [
30]), in our analysis, roof solar absorptance was not among the most impactful parameters.
An important trade-off arises when modifying the skylight-to-roof ratio (SRR). Although skylights are often recommended for these houses, our results indicate that increasing SRR tended to reduce
while increasing
. This suggests that greater solar gains may alleviate cold nighttime conditions but can increase daytime discomfort under certain conditions. While severe overheating is unlikely in this climate, elevated daytime operative temperatures may reduce comfort during occupied hours. A comprehensive design strategy should therefore consider comfort across the full 24-h cycle. This trade-off confirms observations by Molina et al. [
24] who noted that while skylights provide the highest energy contribution (up to 21.8%), they can lead to instability and significant nighttime heat loss if they lack interior shutters or hatches to control the gain-to-loss cycle. Future work should quantify this trade-off and evaluate measures (e.g., selective glazing, internal blinds, or adjustable shutters) to capture solar gains while moderating daytime temperature peaks.
The sustainability of the proposed envelope modifications is benefited by providing long-term thermal comfort without a corresponding increase in the economic burden of electricity bills. However, the cultural appropriateness and other sustainability aspects of these solutions should be further explored.
4.3. Limitations and Future Work
A key limitation of this study relates to the modeling of infiltration. Infiltration strongly influences indoor temperatures in high-altitude dwellings due to large diurnal temperature differences. Although the GSA indicated moderate sensitivity within the selected parameter range, this was primarily a consequence of constraining the infiltration range. Large variations in infiltration rates would substantially alter thermal performance outcomes. However, this range was intentionally constrained to prevent infiltration, a non-design parameter, from overshadowing the impact of controllable envelope modifications, which are the primary focus for standardized public housing policy. Infiltration has opposing seasonal effects: it increases heat losses during cold periods but may reduce overheating during warm hours. Therefore, its net influence on annual discomfort reflects a trade-off between underheating and overheating. The selected Effective Leakage Area (AL) value was determined through calibration against field measurements. While this approach improved model reliability, it does not capture short-term variability such as intermittent door openings. However, this level of precision is deemed acceptable, as the primary objective of this research is to rank the relative influence of design variables through sensitivity analysis rather than to quantify objectives highly sensitive to occupancy fluctuations, such as annual energy billing for active systems. Consequently, the results should be interpreted assuming similar infiltration conditions. Given that public housing programs replicate the same construction typology and usage patterns, this assumption is considered reasonable. Expanding monitoring campaigns would further strengthen future analyses.
Furthermore, while the specific optimal solutions are tailored for the climatic and economic conditions of the highlands of Cusco, Peru, the proposed optimization framework remains a generalizable tool for identifying context-specific improvements in other high-mountain regions of Peru and other countries. Finally, while the comfort index is based on operative temperature, empirical data from the same Langui community justifies this simplification due to the observed correlation between temperature and humidity and narrow air speed variations. Given the identical community context, consistent usage patterns are expected, allowing clothing and metabolic variations to be adequately captured by the broad thermal comfort range and the assumption of a resting state.
Future research should address the uncertainties associated with modeling infiltration and evaluating the effectiveness of measures intended to reduce it. As shown in this study and others in the literature, indoor comfort in this type of building is highly sensitive to infiltration rates. In our case, the model was calibrated using field measurements; however, to enhance the robustness of the model and its outputs, additional data should be collected, and more Sumaq Wasi dwellings should be calibrated to assess this parameter more thoroughly. Further studies should aim to quantify the airtightness of these buildings using conventional methods such as blower door tests. Although such field studies require additional resources, they would provide valuable insights into the potential impact of simple measures, such as improving door and window frame sealing, on reducing infiltration. While this study did not include infiltration-reduction measures due to the lack of data on the effectiveness of such interventions, it is widely accepted that decreasing infiltration can significantly enhance indoor comfort.
5. Conclusions
This study aimed to optimize the envelope design of a standardized dwelling from the Sumaq Wasi housing program using passive strategies and evaluated performance in terms of thermal comfort and life cycle cost. The solution with the lowest thermal discomfort index reduced to 22% of the base case value, while the solution with the lowest brought the discomfort level due to underheating in bedrooms to 8% of the base case. These improvements required additional investments of USD 2347 and 1959 USD, respectively, relative to the base case cost (USD 8100).
One of the solutions with the lowest , which had the same as the base case and consisted on increased exterior wall solar absorptance (0.9) and higher skylight-to-roof ratio (SRR = 13.1) reduced total discomfort and bedroom underheating to 77% and 30% of the base-case values, respectively. Under the evaluated parameters, this passive configuration outperformed the installation of two 400 W electric heaters in terms of bedroom underheating while avoiding additional operational electricity costs. In comparison with this last alternative, the mentioned solution had a net present value of savings of 175 USD and an immediate payback recovery period, as the strategy requires no additional costs beyond the base case construction budget.
Methodologically, this study demonstrates the value of combining global sensitivity analysis (Morris and Sobol) with multi-objective genetic algorithm optimization to identify context-appropriate passive design strategies under conditions of financial constraints and climatic severity. The comparison with electric heating provides a transparent benchmark for evaluating the economic efficiency of passive envelope upgrades in high-altitude rural housing.
From a practical perspective, the results suggest several design priorities for improving thermal conditions in Sumaq Wasi dwellings located in cold high-altitude environments. In terms of total thermal discomfort, the most effective configuration involved a combination of decreasing roof thermal transmittance, reducing floor thermal transmittance, lowering the SRR, and increasing exterior wall solar absorptance. In contrast, bedroom underheating was more effectively mitigated through a combination of decreasing roof thermal transmittance and increasing both the SRR and exterior wall solar absorptance. These strategies imply additional construction costs compared with the base Sumaq Wasi design. However, when cost neutrality is required, increasing exterior wall solar absorptance alone can still reduce both types of discomfort. Under this constraint, reducing SRR further decreases total discomfort, whereas increasing SRR improves nighttime thermal conditions in bedrooms. These parameters can therefore serve as priority design variables when adapting standardized rural housing prototypes for cold high-altitude regions.
These findings offer evidence to support more targeted investments in public housing programs serving vulnerable populations in the rural Andes. By prioritizing interventions with the highest impact per unit cost, housing initiatives can improve indoor thermal comfort while using limited resources more effectively. However, it is important to recognize that these conclusions are dependent on the specific modeling assumptions employed.