Article

Study on Dynamic Response of Rockfall-Impacted Pile-Column Bridge Piers Based on Scaled Model Tests


1
School of Urban Construction Engineering, Chongqing Technology and Business Institute, Chongqing 400052, China
2
School of Civil and Hydraulic Engineering, Chongqing University of Science and Technology, Chongqing 401331, China
*
Authors to whom correspondence should be addressed.
Buildings 2026, 16(11), 2152; https://doi.org/10.3390/buildings16112152
Submission received: 10 May 2026 / Revised: 26 May 2026 / Accepted: 27 May 2026 / Published: 27 May 2026
(This article belongs to the Section Building Structures)

Abstract

To investigate the structural dynamic response of pile-column bridge piers in mountainous regions under rockfall impact, this study takes the No. 4 double-column pier of Changba Bridge in Nanchuan, Chongqing, as a prototype. Based on similarity theory and differential equation analysis, a scaled model test was designed and conducted. By considering different rockfall impact angles (30°, 45°, 60°) and different impact positions on the pier (top, middle, bottom), the strain response characteristics of the pier concrete and reinforcing steel were systematically analyzed. The results indicate that the peak strain at the impacted location increases significantly with the increase in the rockfall impact angle; when the impact angle increases from 30° to 60°, the peak strain increases by approximately 22.8%. The peak strain decreases as the impact position approaches the bottom of the pier, with the most pronounced strain response observed at the middle position. The strain response of the reinforcing steel follows the same pattern as that of the concrete, albeit with a brief delay. Furthermore, the stirrups exhibit predominantly transverse orthogonal strain, while the longitudinal reinforcing bars exhibit predominantly longitudinal orthogonal strain. It is concluded that the impact angle is a key parameter affecting local damage to the pier, and the middle section of the pier should be regarded as a priority protection zone. This study provides a theoretical basis for the design of bridge piers in mountainous regions against rockfall impact.

1. Introduction

In recent years, with the continuous increase in national infrastructure investment, China’s transportation infrastructure has entered a phase of rapid development. In extensive mountainous areas characterized by complex terrain, a large number of highways, railways, and bridge projects have been successively initiated. Among these, bridges, serving as critical structures spanning natural obstacles such as gorges, have become an indispensable component of mountain transportation networks. However, southwestern China is located in a region of high seismic activity, with active geological structures, steep mountainous terrain, and fragmented rock masses, which easily induce rockfall hazards. Once a rockfall becomes destabilized and rolls down, it directly threatens the safety of major transportation routes in mountainous regions. Among various transportation facilities, bridges, particularly their key load-bearing components—the piers—are most frequently subjected to impact due to being directly exposed to the paths of rockfall movement, and consequently suffer the most severe damage. Although the total energy released by rockfall impact is relatively small compared with ship impact, the instantaneous impact force remains substantial, sufficient to cause significant damage to bridge piers and even lead to the loss of overall bridge functionality or sudden collapse [1,2,3,4]. Therefore, the issue of rockfall impact on bridge piers poses a clear practical hazard and has become an important topic that urgently needs to be addressed in the field of mountain transportation engineering safety [5,6,7].
Extensive research has been conducted by scholars worldwide regarding the collision mechanism between rolling stones and bridge piers, driven by a growing recognition of the severe threats to structural safety. Wang [8] developed an Abaqus-based finite element model of a prestressed concrete box-girder bridge to investigate its dynamic response under both single and multiple rockfall impacts. The findings revealed that bending moments and shear forces peak at the impact location, with the initial impact in multiple sequences exerting the most significant influence; specifically, a 0.5 m rockfall traveling at 40 m/s was found to induce severe pier damage. Similarly, Zhang [9] utilized LS-DYNA to model a double-span simply supported bridge, analyzing the sensitivity of pier dynamics to rockfall parameters. The results demonstrated that impact velocity and mass critically exacerbate structural damage, necessitating active protective measures when the mass exceeds 3.8 × 10³ kg and velocity surpasses 20 m/s. Notably, the implementation of steel-shell rubber composite devices was shown to effectively enhance impact resistance. Focusing on post-impact integrity, Zhong [10] et al. established a full-scale numerical model of RC piers and employed the dynain file transfer method to assess residual axial compressive capacity following rockfall events. Their study highlighted pier diameter as a crucial determinant of both impact force and residual capacity, leading to a proposed formula for calculating residual strength; furthermore, steel-sand composite structures were validated for their efficacy in improving anti-collision performance. Departing from single-body impacts, Fan [11] et al. adopted a coupled Discrete Element Method-Finite Element Method (DEM-FEM) approach to examine the response of double-column RC piers subjected to continuous debris flow. Their analysis elucidated distinct impact phases characterized by climbing and bypassing diffusion. Failure modes were categorized into local damage and global overturning, with quantified thresholds of approximately 29.22 × 10² kN for inner pier damage and 39.59 × 10² kN for overturning. A key insight was the identification of a “stress reversal effect” under medium-intensity impacts, evolving into a chained failure sequence of “tensile cracking, compression-shear failure, and longitudinal reinforcement yielding” under high-intensity conditions.
Addressing debris flow impacts on protective structures, Liu [12] et al. developed a coupled DEM-FEM model for shed tunnel collisions to identify key factors governing the maximum impact force. Their analysis delineated the impact process into three distinct phases—initiation acceleration, impact, and accumulation—dominated by frictional energy dissipation. Quantitative relationships revealed a linear positive correlation with density and power-law correlations with impact height and slope gradient; notably, the slope gradient exhibited the highest sensitivity and was identified as a priority parameter in design optimization. Similarly, Chen [13] employed a DEM-FEM coupling approach to simulate debris flow acting on bridge piers, determining that maximum impact force follows power-law relationships with slope and distance and a linear relationship with density, with a sensitivity coefficient of 3.012 for the slope. Extending this to topographic variations, Cheng [14] simulated debris flow impacts on piers situated on convex, straight, and concave slopes, elucidating distinct damage evolution patterns. The convex slope configuration induced the highest impact force and most significant pier-top displacement (5.0 mm), resulting in severe damage, whereas the concave slope yielded the smallest impact force and a minimal damage range (0.06–0.31 m). Shifting focus to vehicular impacts, Zhao [15] constructed a finite element model to analyze the transient response of piers to heavy vehicle collisions. The study found that high-speed impacts trigger shear-dominated failure modes, with the dynamic shear strength peaking at approximately four times the static design value; among various parameters, the cross-sectional dimension proved to be the most critical factor affecting crashworthiness. In the context of geological hazards, Li [16] established a discrete element model for rockfall impact on pile-column piers, successfully reproducing the progressive failure process characterized by significant dynamic responses. This numerical framework was validated as an effective tool for assessing the interaction mechanisms between geological disasters and bridge structures. Finally, Mai [17] utilized DEM to investigate the effects of cross-sectional shape, impact distance, and slope on debris flow impact. The findings indicated that while rectangular piers offer high blocking efficiency, they sustain the largest forces; conversely, arched piers experience high instantaneous peaks. The study also quantified that increasing the impact distance significantly mitigates force, identifying a 45° slope angle as the critical threshold for impact force variation.
The main limitations of existing studies are as follows: first, reduced-scale tests have not strictly satisfied the similitude laws for impact, leading to distortions in strain rate effects and gravity; second, there is a lack of systematic experimental validation of damage similarity between the scaled model and the prototype; third, insufficient attention has been paid to the differential response patterns of bridge piers under oblique impact angles and at different locations along the pier height. To address the above issues, this paper designs a 1/10 reduced-scale model test based on similitude theory. By considering different impact angles (30°, 45°, 60°) and different impact locations (top, middle, bottom), the test quantitatively reveals the influence of impact angle on the peak strain of bridge piers (with an increase of approximately 22.8%) and clarifies the cooperative strain characteristics between stirrups and longitudinal reinforcement. These findings aim to provide experimental evidence for the impact-resistant design of bridge piers in mountainous areas. Adopting the analytical framework of impact dynamics and drawing on the experimental and numerical simulation methods of Jiang et al. [18] for the deformation response of submarine pipelines subjected to transverse impact by dropped objects, this study aims to enhance the analysis of the transient impact, peak response, and vibration attenuation characteristics during the process of rockfall impact on bridge piers.

2. Dynamic Response Test Analysis

2.1. Differential Equation Analysis

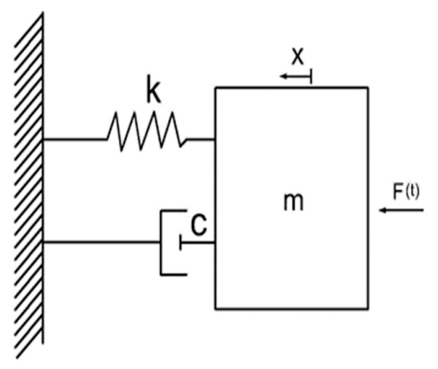
Based primarily on the second theorem of the three similarity theorems, the similarity coefficients for this experiment were derived using the differential equation analysis method [19]. Figure 1 shows a single-degree-of-freedom system with damping, as expressed in Equations (1)–(5).
Differential equation of dynamic equilibrium:
m d 2 x d 2 t + c d x d t + k x = F ( t )
where m—mass;
c—damping constant;
k—spring constant;
F(t)—disturbing force.
m m d 2 x m d 2 t m + c m d x m d t m + k m x m = F m ( t m )
The similarity constants are defined as follows:
C m = m m m C C = C m C C k = k m k C p = p m p C x = x m x C t = t m t
Substituting the model parameters in Equation (2) with the product of prototype parameters and corresponding similarity constants yields
C m C x C t C p m d 2 x d 2 t + C C C x C t C p c d x d t + C k C x C p k x = F ( t )
Comparing Equations (2) and (4), the following relationship is deduced:
C m C x C C C p = 1 ,   C C C x C t C p = 1 ,   C k C x C p = 1

2.2. Similarity Theory Analysis

To ensure the validity of the model tests, three fundamental requirements of similarity theory were satisfied. First, geometric similarity was maintained, ensuring that all corresponding dimensions between the prototype and the model were proportionally scaled. Second, for any pair of similar phenomena, the ratios of corresponding physical quantities at homologous points and homologous times remained invariant. Finally, in addition to geometric and physical similarity, the conditions that uniquely determine the phenomenon—specifically the kinematic, boundary, and initial conditions—were ensured to be similar. In this study, the dynamic response of bridge piers subjected to rockfall impacts with varying impact angles and positions was investigated. To replicate the real-world scenario of rockfall–pier collisions as closely as possible and capture the resulting damage effects, instantaneous impact loads generated by sphere–cylinder contact were adopted. Given that the tests were conducted under low-velocity impact conditions, the two phenomena were considered to satisfy kinematic similarity.
The prototype for this experiment is the No. 4 double-column pier of the Changba Bridge in Nanchuan District, Chongqing City. The reinforcement ratio and strength of the experimental pier are consistent with those of the prototype pier. The scale ratio is determined as Cl = model size/prototype size = 1/10 based on the differential equation analysis method, where it is given that C m = m m m = l 3 L 3 = 1 1000 .
To ensure that the scaled model pier and the prototype pier exhibit the same damage characteristics in the scaled experiment, their strains must be identical, denoted as C ε = 1 . Subsequently, based on the geometric equation represented by C ε C l C x = 1 , it is possible to derive C x = 1 10 .
Treating the lateral stiffness of the pier as the spring stiffness, we then have
k = 3 E I l 3 = 3 E π d 4 l 2 l 3 = 3 π E d 4 l 5
where d—represents the diameter of the pier cross-section and l—denotes the height of the pier.
Since the prototype pier is made of C30 concrete with a corresponding elastic modulus of 3 × 10⁴ MPa, and the scaled model is constructed using M10 mortar with an elastic modulus of 7500 MPa as measured by Liu [20], the elastic moduli of the reinforced concrete structure and the reinforced mortar structure are calculated according to the formula presented in [21].
E A = E 1 A 1 + E 2 A 2
Given the relatively low steel reinforcement ratio, the cross-sectional area of the concrete is herein taken as the total cross-sectional area of the structural member. Consequently, the following holds:
E m E = E s t e e l r e i n f o r c e d   m o r t a r E r e i n f o r c e d   c o n c r e t e 1 4
Combining Equations (6) and (8), we can derive
C k = k m k = 1 4 × 1 10 = 1 40
From C k C x C p = 1 , we obtain
C p = C k C x = 1 40 × 1 10 = 1 400
From C m C x C C C p = 1 , we find
C C = C m C x C p = 1 1000 × 1 10 1 400 = 1 5
From C C C x C t C p = 1 , we obtain
C t = C C C x C p = 1 5 × 1 10 1 400 = 8
Based on this, it can be concluded that after scaling down the test model dimensions by 1/10 using the prototype material, similar strain values can be measured when the impact force on the scaled model is approximately 1/400 of that on the full-scale structure. Under this condition, the impact duration measured in the test is about 8 times that of the full-scale structure. The effectiveness of the scaled model test can be analyzed by comparing the impact duration of the scaled model with that of the full-scale structure.
It should be noted that the similar derivation mentioned above is based on the assumption of linear elasticity, whereas rockfall impact involves complex factors such as concrete cracking, strain rate effects, and material nonlinearity. The impact velocity in the scaled-down model tests of this study is lower than the actual velocity of a prototype, which may lead to an underestimation of the strain rate effect. The reinforcement diameter is reduced from 28 mm to 6 mm, resulting in certain deviations in the hardening modulus and bond-slip behavior. Additionally, the ratio of aggregate particle size to cross-sectional dimension (approximately 1:5) may induce size effects. Therefore, the experimental results of this study primarily reflect qualitative trends and relative ratios, and it is recommended that the absolute values be calibrated through full-scale numerical simulations when applied to engineering practice.

3. Test Overview

3.1. Model Design

The prototype in this study is based on Pier No. 4 of the Changba Bridge in Nanchuan District, Chongqing. The pier is a double-column pier with a height of 14 m, and each column has a circular cross-section with a radius of 1 m. The concrete strength grade of the pier is C30, and the thickness of the concrete cover is 25 mm. The reinforcement strength grade is HRB335. The pier is longitudinally reinforced with 42 load-bearing steel bars, each having a diameter of 28 mm. The stirrups have a diameter of 10 mm and are spaced at 200 mm. A stirrup densification zone is provided at the bottom with a spacing of 100 mm, as shown in Figure 2.
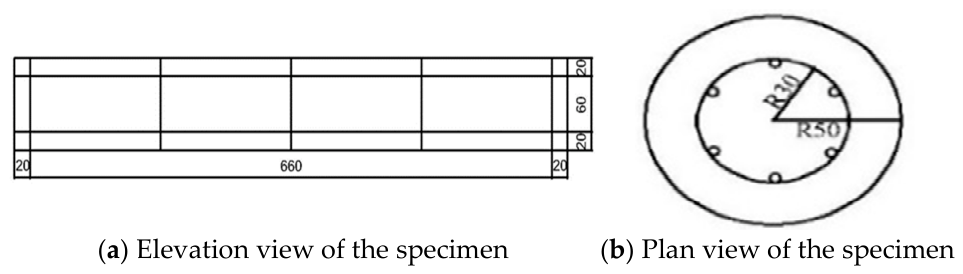
One reinforced concrete pier column was designed for the impact test, and the pier column specimen is shown in Figure 2. The pier column has a circular cross-section with a diameter of 10 cm and a height of 70 cm. The pier column is fixed in a reinforced concrete base, which has a cross-sectional dimension of 50 × 50 × 20 cm. The concrete strength grade of the base and that of the model pier column are both C30, the same as that of the prototype pier, in order to more accurately capture the concrete damage condition. The mix proportion (mass fractions of cement, sand, gravel, and water) is 461:512:1252:175. HPB235 steel is used for the reinforcement of the model pier column. Both the longitudinal reinforcement and the stirrups have a diameter of 6 mm. The pier is longitudinally reinforced with six load-bearing steel bars. The stirrup spacing is 16 cm, which satisfies the construction requirements [22,23].

3.2. Model Fabrication

The pier, base, and cap beam are all made of C30 concrete, with a mix ratio of water: cement: sand: coarse aggregate = 0.38:1:1.11:2.72. The detailed material mix proportions are shown in Table 1. The formula for the water-to-binder ratio is given in Equation (13):
W / B = a a f b f c u , 0 + a a a b f b
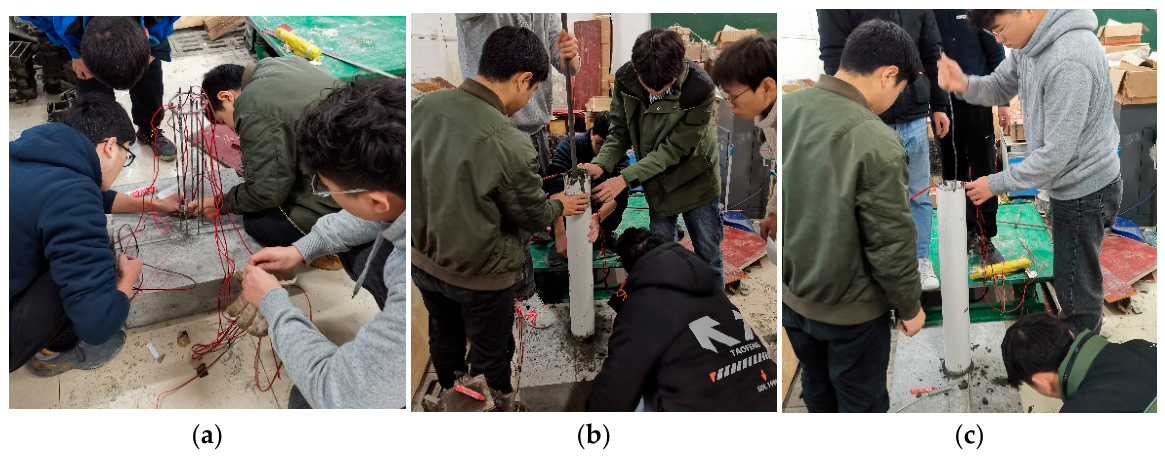
The test model was fabricated on-site in the laboratory. The fabrication process was as follows: binding the reinforcement cage of the base—binding the longitudinal reinforcement of the column—binding the stirrups of the column—attaching strain gauges to the reinforcement—pouring the concrete for the base—vibrating—placing and fixing the PVC pipe—pouring the concrete for the model column after initial setting of the base concrete—vibrating—removing the formwork—curing by sprinkling water—binding the reinforcement of the cap beam—pouring the cap beam—vibrating—removing the formwork. The fabrication process is shown in Figure 3.
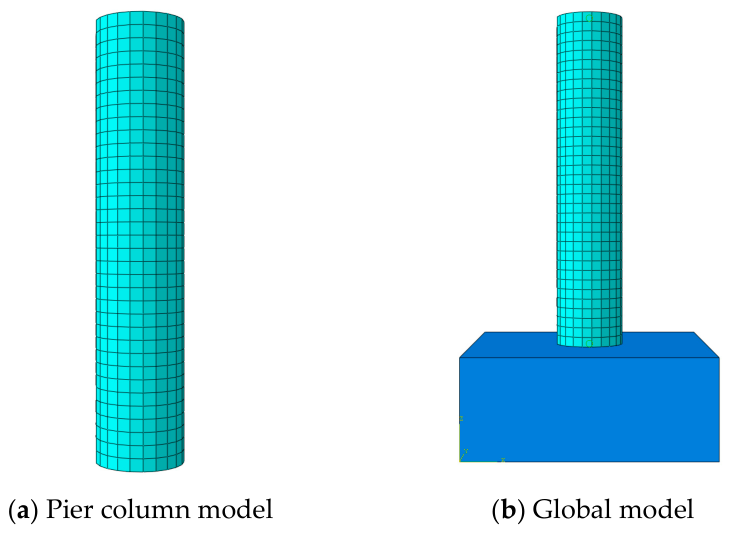
To clearly observe the damage condition of the concrete pier column after rockfall impact, a grid was drawn on the pier surface using a marker pen. For comparison with the numerical simulation results, this grid division is essentially the same as that used in the numerical simulation, with a grid size of 20 mm (axial direction) × 20 mm (circumferential direction). The detailed illustration is shown in Figure 4. (ABAQUS 2022 version).

3.3. Test Setup and Loading

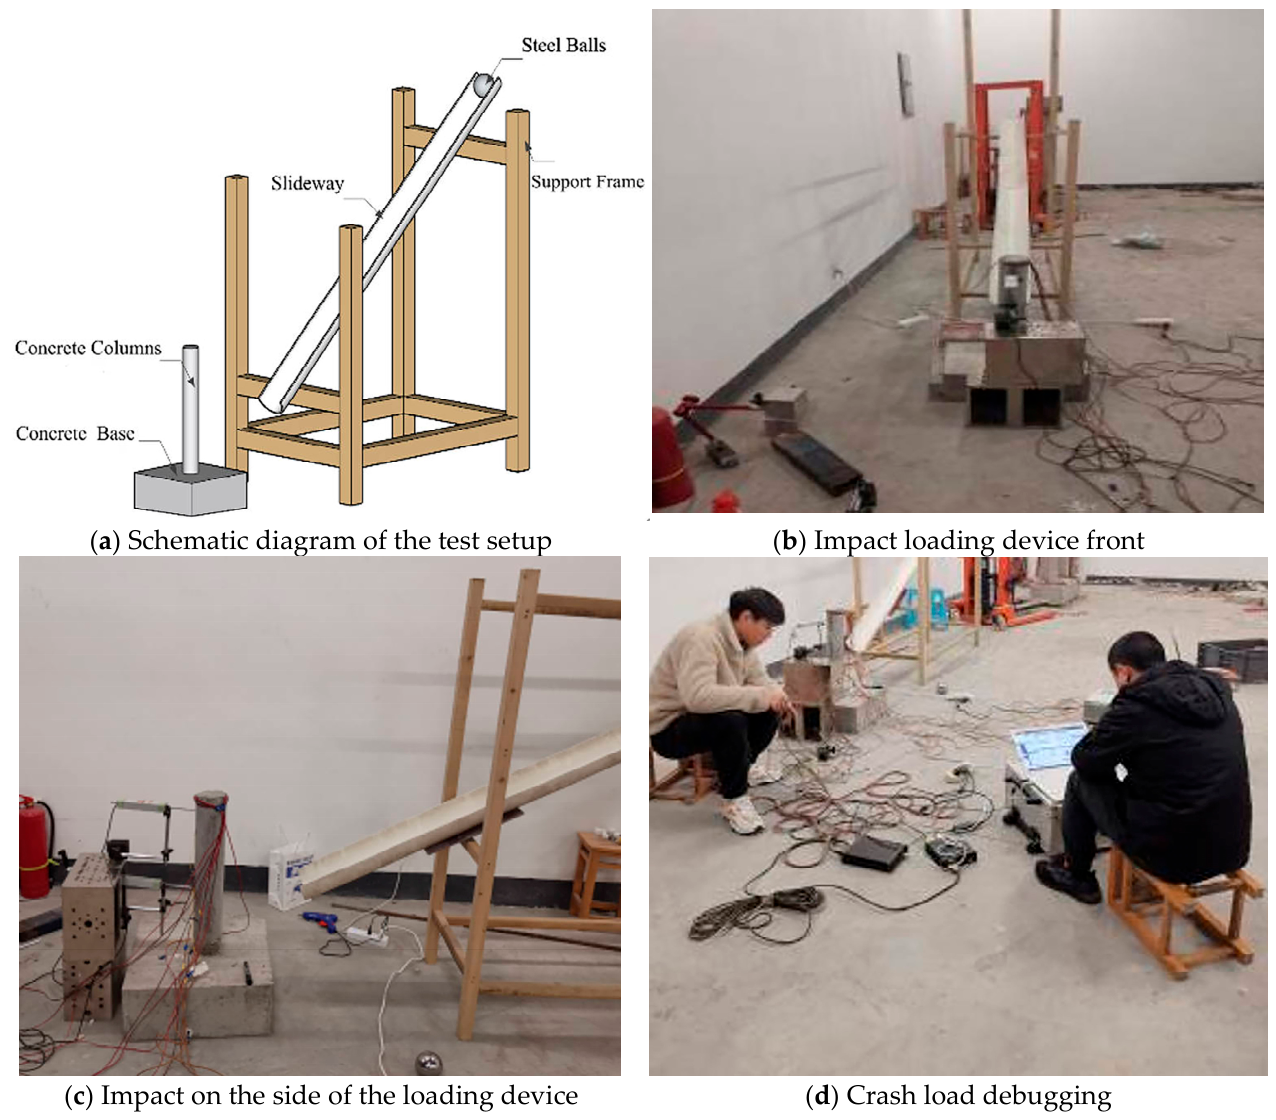
To obtain the structural dynamic response data of a rolling stone impacting a bridge pier, this study designed a rolling stone slide impact loading device based on a double-column pier prototype commonly used in mountainous areas, as illustrated in Figure 5. The device mainly consists of a stone release mechanism, a pier structure model, and a data acquisition system, used to collect strain values on the pier when a rolling stone strikes the pier. By adjusting the height of the slide, stones were released from different impact angles (30°, 45°, and 60°) to hit different positions on the pier (bottom, middle, and top), thereby achieving varying impact velocities and corresponding kinetic energies. The distance between the slide and the pier was adjusted to ensure that the stone hit the designated location on the pier. The stones were steel balls with a mass of 3 kg [24].
To facilitate the study, the rolling stone was simplified as a homogeneous sphere of radius R, impacting the reinforced concrete pier at a velocity V, with the impact position located at an unfavorable location of the pier. In this experiment, three impact positions on the pier and three different impact angles were set as the impact scenarios, as listed in Table 2.
Based on the free-fall motion formula v = 2 g h , the impact velocities of the rockfall at different drop heights were calculated, with the corresponding kinetic energies as follows:
At h = 1.0   m v 3.07   m / s , the kinetic energy is approximately 70.7 J;
At h = 1.5   m v 3.76   m / s , it is approximately 106.0 J;
At h = 2.0   m v 4.25   m / s , it is approximately 135.5 J.
Friction between the chute and the rockfall may cause the actual impact velocity to be slightly lower than the theoretical value. However, to ensure that the test results are on the safe side, the theoretical values are adopted as input parameters in this paper.

3.4. Test Instruments and Methods

Structural dynamic response tests were conducted using the Donghua DHDAS dynamic signal acquisition and analysis system. The strains measured in this experiment were obtained using strain gauges attached to the reinforcing steel bars and the concrete, with the channels connected in a quarter-bridge configuration. The impact load of the rockfall was measured using a strain-type impact force sensor, with the channels connected in a half-bridge configuration. The quantities and parameters of the instruments are presented in Table 3.
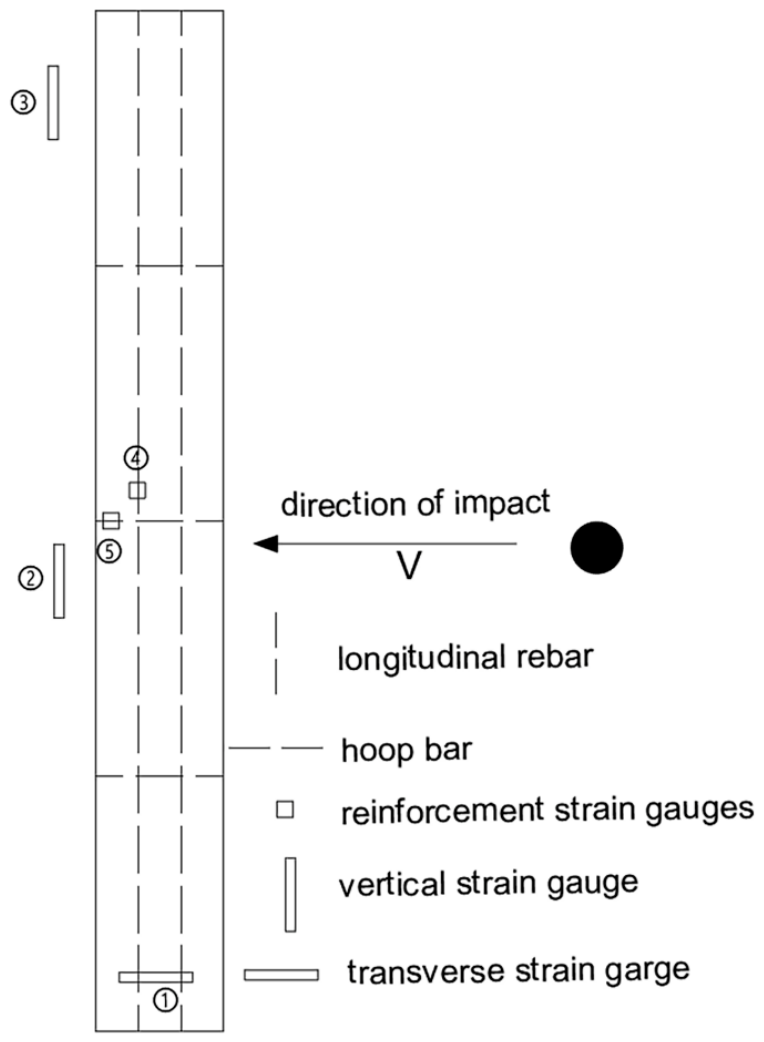
Figure 6 illustrates the detailed layout of the sensors on the pier. To comprehensively acquire experimental data under various working conditions, strain sensors were precisely placed at the required measurement locations. Specifically, a total of eight vertical concrete strain gauges were attached near the front and back sides of the four impact positions to measure the concrete strain. Eight steel reinforcement strain gauges were arranged on the longitudinal reinforcements and stirrups near the impact points inside the pier to monitor the steel reinforcement strain. In addition, a displacement sensor was installed on the back side of the pier top, and an impact force sensor was placed at the impact position [25].
The experimental procedure was as follows:
(1)
The strain gauges, displacement sensor, and impact force sensor were connected to the DHDAS dynamic testing system. The system was then debugged until the indicator lights of all channels of the DHDAS dynamic testing system functioned properly, and the initial state was balanced and reset to zero.
(2)
The steel ball was released from an arbitrary position to slide down and impact an arbitrary position on the pier to check whether data acquisition from each channel was normal.
(3)
The position between the slide and the pier was adjusted, and the formal impact tests were carried out. The time-history curves of impact force, strain, and pier-top displacement under each working condition were acquired and saved in the DHDAS dynamic testing system. At the same time, the maximum impact force for each working condition was recorded, and the damage condition of the pier was observed.
The reliability of structural dynamic response experiments depends on the accuracy of the testing method and the completeness of the validation system. In this paper, local strains in concrete and steel reinforcement were directly measured using strain gauges, and a multi-physical experimental validation framework was established by incorporating impact force sensors and displacement sensors. A similar experimental validation approach has been applied in previous studies [26].

4. Structural Dynamic Response Analysis

4.1. Analysis of Impact Force Time-History Curves

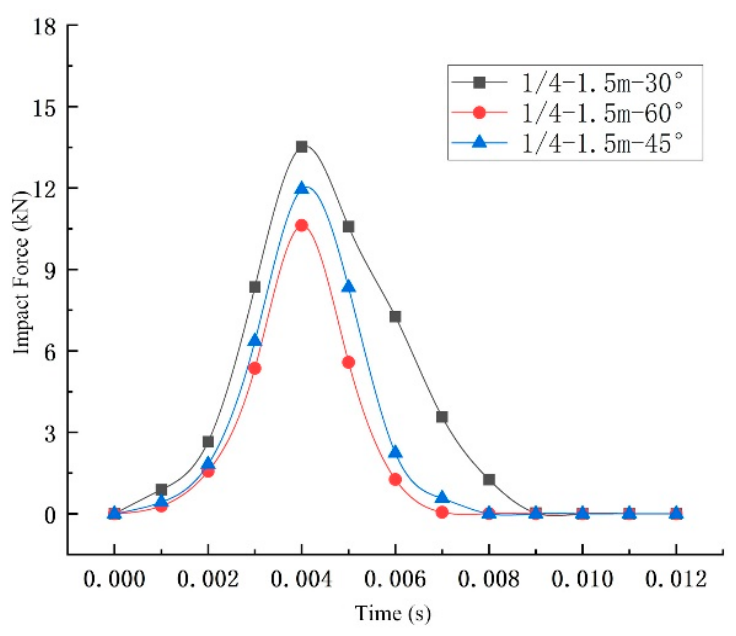
Figure 7 presents the time-history curves of concrete strain in the pier after being impacted by the rolling stone. The maximum impact forces corresponding to the three working conditions with different impact angles were 13.30 kN, 11.75 kN, and 10.12 kN, respectively. In the range of impact angles from 30° to 60°, the maximum impact force decreased with increasing impact angle. A comprehensive comparison of the variation patterns of the impact force under the influence of these three factors leads to the conclusion that the drop height (i.e., impact velocity) has the most significant effect on the impact force.

4.2. Concrete Strain Analysis

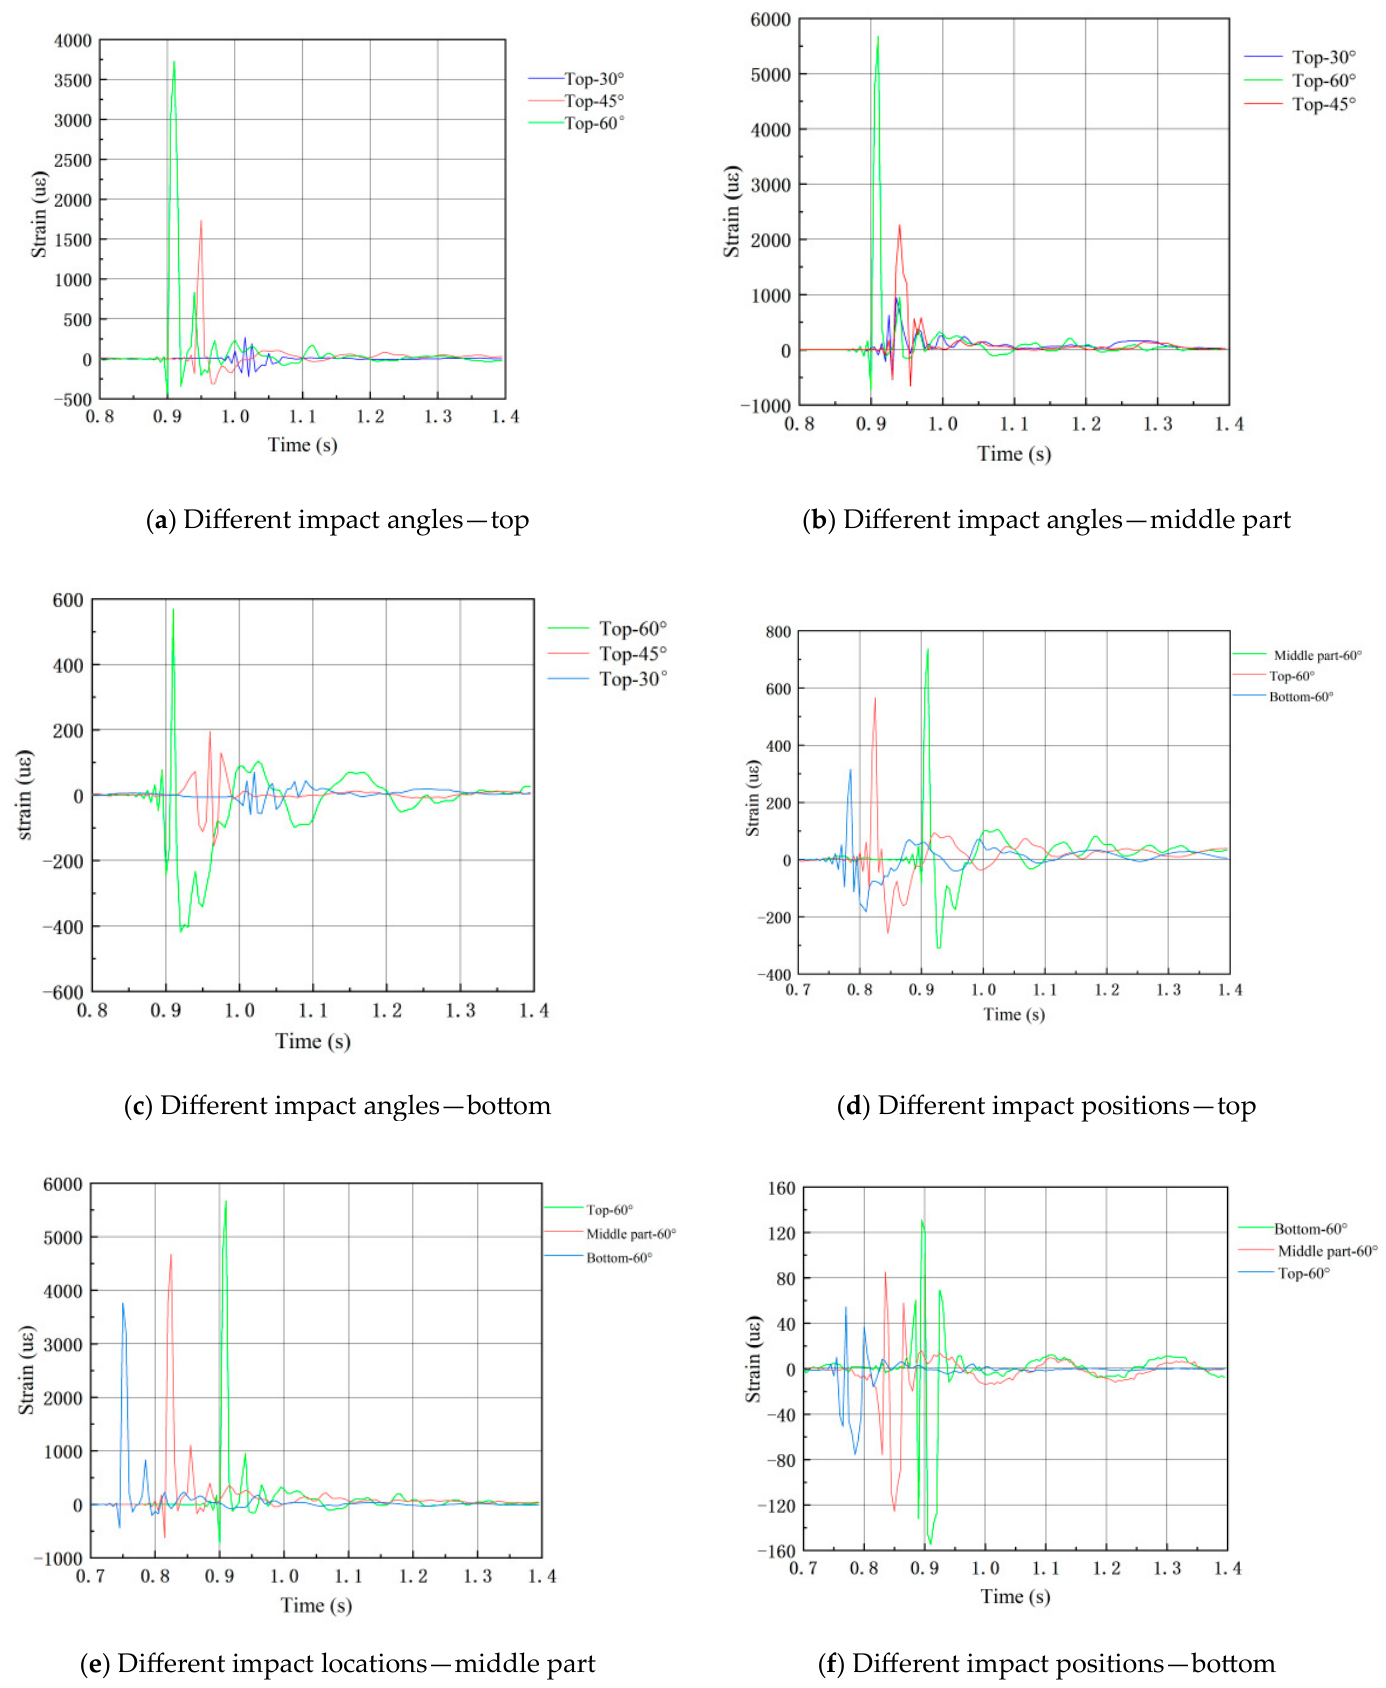
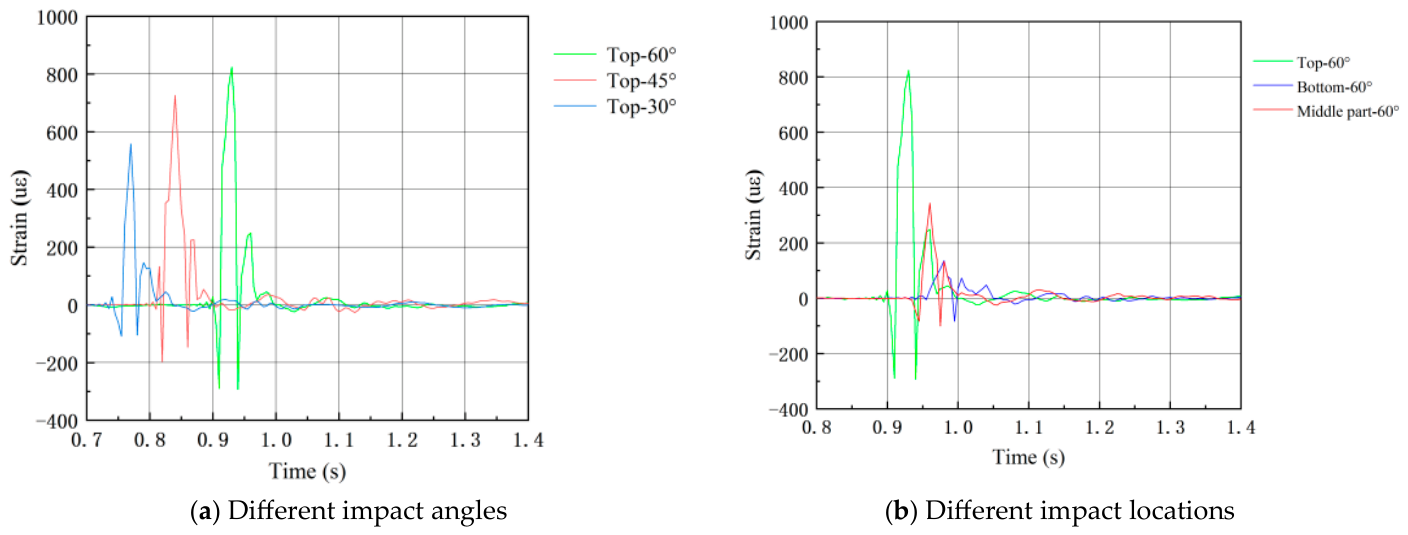
According to the time-history curves of concrete strain in the pier, panels (a), (b), and (c) show the strain time-history curves of concrete strain gauges at the top, middle, and bottom of the pier, respectively, when the rolling stone slid down and impacted the same pier location (top) at different impact angles (60°, 45°, and 30°). Panels (d), (e), and (f) show the strain time-history curves of concrete strain gauges at the top, middle, and bottom of the pier, respectively, when the rolling stone slid down and impacted different pier locations (top, middle, and bottom) at the same impact angle (60°).
As can be seen from Figure 8, under the six working conditions, immediately after the pier is impacted by the rolling stone, a strain peak appears at the impacted position of the pier, which then rapidly decreases to another strain peak. All subsequent strain peaks are smaller than the first peak. Afterwards, the concrete strain curve fluctuates around zero and gradually decays to zero. Among all cases, when the rolling stone slides down at an impact angle of 60° and strikes the top of the pier, the peak strain at the top reaches the maximum value of 5675 με. In contrast, when the rolling stone slides down at an impact angle of 60° and strikes the bottom of the pier, the peak strain at the top reaches the minimum value of 158 με. To compare the strain variations of the bridge pier under different working conditions, rolling stones were slid down at different impact angles to strike the same location on the pier shaft. The strain increased with the increase in the impact angle. When the impact angle increased from 30° to 60° (with a drop height of 1.5 m, impact velocity of 3.76 m/s, and kinetic energy of 106.0 J), the peak concrete strain at the mid-height of the pier increased from approximately 4620 με to about 5675 με, representing an increase of approximately 22.8%. At an impact angle of 45°, the peak strain was approximately 5150 με. When rolling stones struck different locations on the pier at the same impact angle, the strain variation was the smallest at the bottom of the pier and the largest at the mid-height.
Based on the above analysis, during the scaling test, the strain variation pattern of the bridge pier under different impact angles and impact positions of the rolling stone is as follows: the pier reaches its peak strain at the instant of impact; the maximum strain variation of the pier is related to the impact angle of the rolling stone, with a larger impact angle leading to a larger maximum strain variation; the maximum strain variation is also related to the impact position of the rolling stone. Because the bottom of the pier column is fixed by a base and has a stirrup reinforcement zone, the closer the impact position of the rolling stone is to the bottom of the pier, the smaller the maximum strain variation of the pier becomes.
From the perspective of wave propagation analysis, the strain time-history curves in Figure 8 exhibit typical characteristics of “peak → attenuation → fluctuation → zeroing”, which reflect the propagation and reflection process of stress waves within the pier: the compressive wave generated at the moment of impact propagates along the pier, and upon reaching the fixed end at the base, it is reflected as a tensile wave, leading to secondary fluctuations in the strain curve. The larger the impact angle, the greater the normal impact component and the higher the amplitude of the incident wave; consequently, the peak strain increases with increasing impact angle. Moreover, the smallest peak strain is observed at the base, which is attributed to the enhanced wave transmission and dissipation caused by the base restraint, rather than merely differences in structural stiffness. Similarly, previous studies have noted that the dynamic response distribution on structural surfaces is closely related to boundary constraints and impact pulse duration [27].

4.3. Steel Reinforcement Strain Analysis

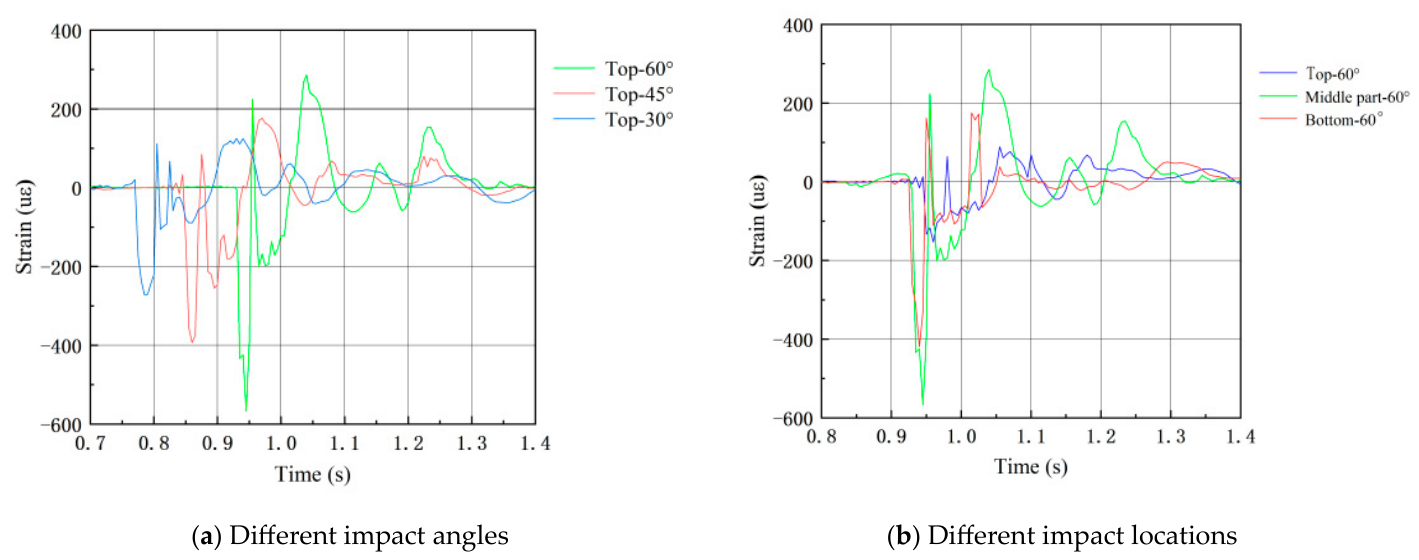
Figure 9 and Figure 10 present the time-history curves of stirrup strain and longitudinal reinforcement strain in the pier after being impacted by the rolling stone. Panels (a) and (b) show the stirrup strain time-history curves and the longitudinal reinforcement strain time-history curves, respectively, when the rolling stone slid down and impacted the same pier location (top) at different impact angles (60°, 45°, and 30°). Panels (c) and (d) show the stirrup strain time-history curves and the longitudinal reinforcement strain time-history curves, respectively, when the rolling stone slid down and impacted different pier locations (top, middle, and bottom) at the same impact angle (60°).
From the results, it can be observed that after the pier is impacted by the rolling stone, because the steel reinforcement is embedded inside the pier, the strain values of the stirrups and longitudinal reinforcement do not reach their maximum at the exact moment of impact. Instead, a maximum peak appears after a short delay, followed by another strain peak in the opposite direction, and then gradually decreases to zero. Comparing the strain time-history curves of the stirrups and longitudinal reinforcement, it can be seen that the maximum strain of the stirrups occurs in the negative direction, representing transverse orthogonal strain, whereas the maximum strain of the longitudinal reinforcement occurs in the positive direction, representing longitudinal orthogonal strain. Comparing the strain time-history curves of stirrups and longitudinal reinforcement under different impact angles, when the impact position is unchanged, the peak strain of the steel reinforcement increases with increasing impact angle of the rolling stone. When the impact angle is unchanged, the peak strain of the steel reinforcement decreases as the impact position on the pier moves closer to the bottom.

5. Conclusions

In this study, reduced-scale model tests were conducted to investigate the structural dynamic response of double-column bridge piers subjected to rockfall impacts, with the impact angle of the rockfall and the impact location on the pier shaft selected as two key influencing factors. The quantitative influence patterns of these factors were revealed. Based on the above findings and oriented toward the engineering practice of mountain bridges, the following main conclusions are drawn:
(1)
As the impact angle of a rolling stone increases, the peak strains in the concrete and steel reinforcement at the impact location on the pier become higher. When the impact angle increases from 30° to 60°, the peak strain increases by approximately 22.8%. Unlike previous studies that have primarily focused on impact velocity and mass, this study quantitatively reveals the independent influence of the impact angle, providing an engineering correction reference value of 22.8%. This indicates that the impact angle is a key parameter governing the local damage degree of bridge piers, and impact risks at high angles should be prioritized in the design of impact-resistant protection.
(2)
The closer the impact position on the pier is to the bottom, the smaller the peak strain; the most significant strain response occurs at the middle position, followed by the top. This is because the bottom is constrained by the base and reinforced by the stirrup densification zone, which suppresses deformation development. Therefore, the middle part of the pier should be regarded as the key protection zone.
(3)
The peak strain of the steel reinforcement occurs within a very short delay after impact, and the stirrups exhibit mainly transverse orthogonal strain, while the longitudinal reinforcement exhibits mainly longitudinal orthogonal strain. The peak strain of the steel reinforcement also increases with increasing impact angle and decreases as the impact position moves downward, further validating the strain response pattern of the concrete.
(4)
Comparing the two types of influencing factors, the impact angle has a more significant effect on increasing the peak strain, indicating that controlling the angle between the trajectory of the rolling stone and the pier is more effective than adjusting the impact position. Existing research on the dynamic response of bridge piers under rolling stone impact remains limited. By revealing the strain patterns of steel reinforcement, this study provides a theoretical basis for the anti-impact design and stiffness enhancement of bridge piers. However, parameters such as the spacing and number of longitudinal reinforcements and stirrups still require further experimental data for validation.
(5)
Engineering application recommendations: Based on the quantitative findings regarding the critical impact angle (≥45°) and the priority protection zone (mid-height of the pier shaft), the following measures are recommended for the design of bridges in mountainous areas: ① In canyons and steep slope sections, the dominant incidence direction of rockfalls should be predicted, and the pier orientation or the layout of piers and abutments should be adjusted to reduce the probability of oblique impacts. ② Local reinforcement (e.g., stirrup densification, addition of an anti-impact layer) should be applied to the mid-height region of the pier shaft (approximately between 1/3 and 2/3 of the pier height). ③ Graded protection should be implemented according to impact angle zones (≥45°: high risk; 30–45°: moderate risk; ≤30°: low risk), thereby forming an integrated, impact-resistant design system that combines slope management with pier reinforcement. Numerical simulation cross-validation was not conducted in this study; a finite element model will be established in future work to complement and validate the experimental results.

Author Contributions

The authors confirm contribution to the paper as follows: Conceptualization, L.-M.W. and Y.J.; methodology, L.-M.W.; software, Y.J. and J.J.; validation, Z.-J.W., J.J. and L.-M.W.; formal analysis, H.-X.-T.H. and Z.-J.W.; investigation, Y.-S.C.; resources, Z.-J.W.; data curation, H.-X.-T.H.; writing—original draft preparation, L.-M.W.; writing—review and editing, Z.-J.W.; visualization, H.-X.-T.H. and Y.-S.C.; supervision, Y.J. and J.J.; project administration, L.-M.W.; funding acquisition, L.-M.W. All authors have read and agreed to the published version of the manuscript.

Funding

This work was sponsored by the Natural Science Foundation of Chongqing, China (Grant Nos. CSTB2022NSCQ-MSX0975).

Data Availability Statement

All data involved in this study are included in this paper.

Conflicts of Interest

The author declares that this study was conducted in the absence of any commercial or financial relationships that could be perceived as a potential conflict of interest.

References

  1. Wang, C. Study on Damage and Protection of Double-Column Pier Bridge in Western Mountainous Area Impacted by Rockfall. Master’s Thesis, Sichuan Normal University, Chengdu, China, 2021. [Google Scholar] [CrossRef]
  2. Wang, H. Research on Dynamic Response and Damage Collapse Mechanism of Beam Bridge Under Impact of Rockfall. Master’s Thesis, Guizhou Minzu University, Guiyang, China, 2024. [Google Scholar] [CrossRef]
  3. Lin, H. Study on the Failure Process and Damage Assessment of Reinforced Soil Retaining Wall Under Rockfall Impact. Master’s Thesis, Chongqing University, Chongqing, China, 2022. [Google Scholar] [CrossRef]
  4. Zhang, H. Dynamic Response and Protection of Lattice Pier Under Rockfall Impact. Master’s Thesis, Southwest University of Science and Technology, Mianyang, China, 2024. [Google Scholar] [CrossRef]
  5. TB 10003-2016; Railway Tunnel Design Code. Industrial Standard of the People’s Republic of China: Beijing, China, 2016.
  6. JTG 3370.1-2018; Highway Tunnel Design Code. Industrial Standard of the People’s Republic of China: Beijing, China, 2018.
  7. The Second Railway Survey and Design Institute. Railway Engineering Design Technical Manual; China Railway Publishing House: Beijing, China, 1999; pp. 141–191. [Google Scholar]
  8. Wang, H.; Lu, W.; Zhan, W. Dynamic response and damage mechanism of reinforced concrete beam bridges under rockfall impacts. Sci. Rep. 2025, 15, 5090. [Google Scholar] [CrossRef] [PubMed]
  9. Zhang, G.; Zhang, J.; He, C. Damage and protection of simply supported girder bridge pier: Rockfall impact. Structures 2025, 82, 110461. [Google Scholar] [CrossRef]
  10. Zhong, H.; Hao, C.; Yu, Z.; Lyu, L.; Wu, A. Damage assessment of RC bridge piers under rockfall impact and evaluation of a steel-sand protective structure. Structures 2023, 47, 607–624. [Google Scholar] [CrossRef]
  11. Fan, X.; He, A.; Liu, H.; Xia, G.; Zhou, Y.; Chen, J. Dynamic response of bridge damage by debris flow impact in mountainous area. J. Vib. Shock 2026, 45, 129–140. [Google Scholar] [CrossRef]
  12. Liu, C.; Yu, Z.; Liu, Y.; Huang, J.; Zhao, S. Influential factors of the maximum impact force of rock avalanche flow on a shed tunnel. J. Vib. Shock 2020, 39, 195–203+222. [Google Scholar] [CrossRef]
  13. Chen, Y.; Yao, C.; Zhou, X.; Zhao, S.; Chen, T.; Qiang, B. Influential factors of the maximum impact force of rock avalanche flow on bridge piers using DEM-FEM coupled method. J. Nat. Disasters 2024, 33, 65–74. [Google Scholar] [CrossRef]
  14. Cheng, M.; Guo, S.; Ta, P.; Cheng, J. Study on Damage Mechanisms of Concrete Piers Impacted by Debris Flow in Complex Terrain. J. Disaster Prev. Mitig. Eng. 2026, 46, 400–408. [Google Scholar] [CrossRef]
  15. Zhao, W.; Qian, J. Failure Mode and Impact Performance of Bridge Piers Subjected to Heavy Vehicle Collision. J. Disaster Prev. Mitig. Eng. 2019, 39, 67–74+88. [Google Scholar] [CrossRef]
  16. Li, B.; Gong, W.; Tang, H.; Wang, L. DEM Simulation of the Bridge Collapse under the Impact of Rock Avalanche: A Case Study of the 2020 Yaoheba Rock Avalanche in Southwest China. Bull. Eng. Geol. Environ. 2024, 83, 24. [Google Scholar] [CrossRef]
  17. Cheng, L. Numerical Analysis of the Dynamic Response of Concrete Bridge Piers under the Impact of Rock Debris Flow. Buildings 2024, 14, 1504. [Google Scholar] [CrossRef]
  18. Kafshgarkolaei, H.J.; Lotfollahi-Yaghin, M.A.; Mojtahedi, A. A modified orthonormal polynomial series expansion tailored to thin beams undergoing slamming loads. Ocean Eng. 2019, 182, 38–47. [Google Scholar] [CrossRef]
  19. Gu, Z. Study on the Dynamic Response and Experimental Research of Bridge Pier Under Rolling Stone-Collision. Master’s Thesis, Chongqing Jiaotong University, Chongqing, China, 2015. [Google Scholar]
  20. Liu, G.; Shi, C. Stress Analysis and Detennination of Strength for Compressed Masonry. Build. Struct. 2000, 3–7. [Google Scholar] [CrossRef]
  21. Ye, J. Principles of Structural Design; China Communications Press: Beijing, China, 2004. [Google Scholar]
  22. GB/T 50010-2010; Code for Design of Concrete Structures. China Architecture & Building Press: Beijing, China, 2024.
  23. Wang, Z.-J.; Liu, Q.; Jiang, Y.; Wu, L.-M.; Wang, H.; Wang, Y.; Wang, J.-W. Impact Force Algorithm and Parameters of Rolling Stone Impact Pier in Mountain Area. Adv. Civ. Eng. 2024, 2024, 5542305. [Google Scholar] [CrossRef]
  24. Gu, X.; Yu, Z.; Zhao, L.; Xu, H. Influence of Rockfall Impact Energy on Mountain Bridge Damage. J. Southwest Jiaotong Univ. 2016, 51, 1131–1137. [Google Scholar] [CrossRef]
  25. Wang, Z.; Li, J.; Ling, L.; Luo, H.; Wu, L.; Zhou, X.; Wang, Y. Strengthening Width on Local Damage to Circular Piers Caused by Rolling Boulder Impacts. Buildings 2025, 15, 4347. [Google Scholar] [CrossRef]
  26. Kopras, M.; Buczkowski, W.; Szymczak-Graczyk, A.; Walczak, Z.; Gogolik, S. Experimental validation of deflections of temporary excavation support plates with the use of 3D modelling. Materials 2022, 15, 4856. [Google Scholar] [CrossRef] [PubMed]
  27. Gogolik, S.; Kopras, M.; Szymczak-Graczyk, A.; Tschuschke, W. Experimental evaluation of the size and distribution of lateral pressure on the walls of the excavation support. J. Build. Eng. 2023, 15, 106831. [Google Scholar] [CrossRef]
Figure 1. Schematic diagram of damped system with single degree of freedom.
Buildings 16 02152 g001
Figure 2. Schematic diagram of a scaled model.
Buildings 16 02152 g002
Figure 3. Experimental model preparation process. (a) Placement and tying of steel reinforcement bars. (b) Concrete placement. (c) Concrete vibration.
Buildings 16 02152 g003
Figure 4. Mesh generation for the experimental model.
Buildings 16 02152 g004
Figure 5. Loading device.
Buildings 16 02152 g005
Figure 6. Sensor layout of pier body.
Buildings 16 02152 g006
Figure 7. Time-history curves of impact force on the pier under different impact angles.
Buildings 16 02152 g007
Figure 8. Time-history curve of concrete strain.
Buildings 16 02152 g008
Figure 9. Time-history curve of stirrup strain.
Buildings 16 02152 g009
Figure 10. Time-history curve of longitudinal reinforcement strain.
Buildings 16 02152 g010
Table 1. Material quantities for the mix proportion.
Water (kg/m3)Cement (kg/m3)Sand (kg/m3)Coarse Aggregate (kg/m3)
1754615121252
Table 2. Impact conditions.
Condition NumberImpact PositionFall Height (m)
Z1Z1-1/middle part/1.51.251.0
Z1-2/middle part/1.51.251.0
Z1-3/middle part/1.51.251.0
Z1-4/middle part/1.51.251.0
Z1-5/middle part/1.51.251.0
Z2Z2-1bottommiddle parttop1.5/
Z2-2bottommiddle parttop1.5/
Z2-3bottommiddle parttop1.5//
Z2-4bottommiddle parttop1.5//
Z2-5bottommiddle parttop1.5//
Table 3. Test instrument.
Instrument NameModelRangeAccuracyQuantity
Impact force sensor-0–100 kN1 N1
Steel reinforcement strain gauge120-3AA20,000 με-8
Concrete strain gauge120-80AA20,000 με-10
Dynamic testing systemDH8352-1 MHz1
Disclaimer/Publisher’s Note: The statements, opinions and data contained in all publications are solely those of the individual author(s) and contributor(s) and not of MDPI and/or the editor(s). MDPI and/or the editor(s) disclaim responsibility for any injury to people or property resulting from any ideas, methods, instructions or products referred to in the content.