Article

Static and Fatigue Performance of UHPC-Strengthened Steel–Concrete Transition Segment

1
Chongqing Construction Science Research Institute Co., Ltd., Chongqing 400016, China
2
State Key Laboratory of Mountain Bridge and Tunnel Engineering, Chongqing Jiaotong University, Chongqing 400074, China
3
School of Civil Engineering, Chongqing Jiaotong University, Chongqing 400074, China
4
Municipal Design Research Institute, Chongqing Design Group Co., Ltd., Chongqing 400020, China
*
Author to whom correspondence should be addressed.
Buildings 2026, 16(10), 2031; https://doi.org/10.3390/buildings16102031
Submission received: 8 April 2026 / Revised: 5 May 2026 / Accepted: 13 May 2026 / Published: 21 May 2026
(This article belongs to the Section Building Materials, and Repair & Renovation)

Abstract

This study conducted a 1:3 scale model test to investigate the improvement mechanism of damaged steel–concrete transition segments strengthened by UHPC. Meanwhile, a void region was introduced at the bottom of the transition segment to simulate the grouting defect in practical engineering. Then, static and fatigue tests on these transition segments were carried out on different parameters, including non-strengthening, UHPC strengthening and UHPC strengthening combined with void repair. Digital image correlation (DIC) was employed to characterize the global strain field of the transition segment. The experimental results show that UHPC strengthening reduced the relative displacement by 0.06 mm (46.2%), while UHPC strengthening combined with void repair achieved a reduction of 0.13 mm (96%). The average strain at critical points of the transition segment decreased by 76.2% after UHPC strengthening, while a greater reduction of 86.5% was achieved when UHPC strengthening was combined with void repair. In addition, crack propagation was effectively inhibited following UHPC strengthening. The refined finite element analysis results indicated that the predicted damage state at 1.0 P was in good agreement with the experimental observations, and under the 1.3 P overload condition, the difference between calculated and measured loads at the same displacement level was only 2.5%, and most of the stresses remained below the tensile and compressive strengths of UHPC. Finally, the proposed predictive method for the circumferential tensile stress of the transition segment exhibited a prediction error of 5%, indicating satisfactory accuracy.

1. Introduction

In recent years, driven by the low-carbon goals and the demand for high-performance infrastructure, modern civil engineering structures have been developing in the directions of large span, heavy load, and tall structures [1]. Steel–concrete composites are widely used in large-span bridges, super-tall buildings, and wind turbine tower structures due to their complementary advantages, including the high tensile strength and low weight of steel, and the excellent compressive strength, stiffness, and cost-effectiveness of concrete [2,3,4,5]. The steel–concrete transition segment, as a critical region connecting steel and concrete structures, is subjected to complex stress conditions and plays a decisive role in the overall safety and durability of the structure [6]. Jiang et al. [7] conducted field measurements and numerical simulations on large-scale steel–concrete connecting segments and found that the peak temperature reached about 90 °C, resulting in a high cracking risk at the concrete surface. Jin et al. [8] proposed a hexagonal double-skin concrete-filled steel tube transition segment for hexagonal steel–concrete hybrid towers and tested three short columns. The results showed that steel buckling and concrete crushing were the typical failure modes. Stiffening measures such as ribs and shear studs could effectively enhance the ultimate axial load-carrying capacity. Dong et al. [9] established a numerical model of the segmental steel–concrete wind turbine tower to analyze deformation, stress distribution, and joint separation under different conditions. The results showed that, since steel strands may be damaged after sliding at the steel–concrete interface, shear connectors such as anchor bolts or studs should be provided.
However, under long-term exposure to complex environmental conditions and sustained loading, steel–concrete transition segments are prone to concrete surface cracking and interfacial damage, thereby weakening their composite action [5,10,11]. With the development of data-driven approaches, machine learning (ML) techniques have been increasingly applied to structural performance assessment and damage prediction. Cosgun et al. [12] employed machine learning methods to predict the seismic performance of existing reinforced concrete buildings, and the results indicated that parameters such as concrete compressive strength and steel yield strength have a significant influence on structural performance evaluation. Lazaridi et al. [13] systematically evaluated the capability of ten machine learning algorithms in predicting the damage of an eight-story reinforced concrete frame structure under single and successive ground motions, and identified the most effective damage assessment indicators. In practical engineering, to enhance the structural performance of damaged transition segments and reduce the time and cost associated with replacement, reliable strengthening measures should be adopted. At present, commonly used strengthening methods mainly include externally bonded FRP sheets and section enlargement [14,15,16]. However, due to the relatively low modulus-to-strength ratio of FRP, its tensile strength cannot be fully utilized [15,17,18]. The section enlargement method is one of the most widely used strengthening techniques, offering advantages such as good cost-effectiveness and significant performance improvement [19]. However, strengthening with conventional concrete results in a substantial increase in structural self-weight and insufficient long-term durability, making it difficult to meet the low-maintenance requirements of structures in complex environments [20].
Ultra-high performance concrete (UHPC), characterized by its ultra-high compressive strength exceeding 120 MPa, excellent ductility and toughness, reduced self-weight, and dense microstructure, has significantly enhanced the mechanical performance and durability of engineering structures [21,22,23,24,25]. Lin et al. [26] investigated the mechanical behavior of a reinforced concrete transition segment and a plain-reinforcement-free UHPC transition segment using a three-dimensional finite element model. The results show that UHPC could significantly reduce plastic damage, improve overall mechanical performance, and increase the ultimate load-carrying capacity to 2.1 times that of the reinforced concrete segment. Ji et al. [27] studied the effects of the thickness of prefabricated UHPFRC panels and the reinforcement ratio of longitudinal bars on the bending behavior of reinforced concrete (RC) beams. The results showed that increasing the UHPFRC panel thickness and the longitudinal reinforcement ratio both enhanced the flexural bearing capacity, ductility, and crack resistance of concrete beams. Laurencius et al. [28] studied the effect of the UHPC layer in strengthening the bending capacity of reinforced concrete T-beams in the negative moment region. The study showed that UHPC strengthening could significantly enhance the flexural bearing capacity, crack control, and overall toughness of the reinforced concrete T-beams. The strengthening effect was significantly influenced by the reinforcement ratio, UHPC layer thickness, and concrete compressive strength. Therefore, the use of UHPC for strengthening damaged structures has become an effective approach to enhance load-carrying capacity, ductility, and crack resistance, providing a feasible solution for the performance restoration and durability improvement of steel–concrete transition segments.
In addition, in practical engineering, steel–concrete transition segments are subjected to complex loading conditions, including sustained loads, wind loads, and cyclic loads. Their service performance is characterized not only by the gradual degradation of static behavior, but also by significant fatigue damage accumulation and crack propagation. However, the static and fatigue damage mechanisms of steel–concrete transition segments remain insufficiently understood, and the effectiveness of strengthening measures on improving the mechanical performance of damaged transition segments is still unclear. To clarify the strengthening effectiveness of UHPC on damaged transition segments, this study takes a full-scale steel–concrete transition segment as the prototype and conducts static and fatigue tests on 1:3 scaled models strengthened with UHPC. In particular, artificial damage scenarios, including void defects and pre-damage states, are introduced to simulate realistic deterioration conditions. Based on the experimental data obtained from the Digital Image Correlation (DIC) technique, full-field strain evolution is quantitatively characterized, and the effects of different parameters on the mechanical behavior of damaged transition segments are analyzed. A refined finite element model of the concrete transition segment is then established using ABAQUS. Finally, a calculation method for the circumferential tensile stress of UHPC-strengthened transition segments is proposed, enabling direct application in the preliminary design and evaluation of such strengthening systems.

2. Experimental Program

2.1. Specimen Design

In the design of the experimental model, the principles of similitude should be followed [29]. Similitude theory provides a systematic framework for designing scaled models to simulate prototype structures, enabling the prediction and analysis of prototype behavior. This approach is based on several fundamental criteria: geometric similarity, whereby all geometric dimensions of the model (e.g., length, width, and height) are scaled according to a constant ratio relative to the prototype; stiffness similarity, requiring that the corresponding sectional stiffness of the model and prototype remain proportional; and force and load similarity, meaning that the mechanisms of force transfer and loading conditions between the model and prototype must be consistent, including load magnitude, distribution, and application method. These similitude requirements ensure that the scaled model can accurately reproduce the structural response of the prototype under actual loading conditions.
Geometric similarity: The experimental model and the prototype structure satisfy geometric similarity, meaning that all corresponding dimensions between the model and the prototype are scaled by a constant length similarity ratio S1. Accordingly, the similarity ratios for length, area, volume, section modulus, and moment of inertia are expressed as Equations (1)–(5):
h m h p = b m b p = l m l p = S l
A m A p = S l 2
V m V p = S l 3
W m W p = S l 3
I m I p = S l 4
where hm and bm denote the sectional height and width of the experimental model, respectively; lm, Am, Vm, Wm and Im denote the length, cross-sectional area, volume, section modulus, and moment of inertia of the experimental model, respectively; hp and bp denote the sectional height and width of the prototype structure, respectively; lP, AP, VP, WP and IP denote the length, cross-sectional area, volume, section modulus, and moment of inertia of the prototype structure, respectively.
The similarity constants relating to displacement, length, and strain in the model structural system are given in Equation (6):
h m h p = b m b p = l m l p = S l
Load similarity: After scaling according to the principle of geometric similarity, concentrated loads, surface loads, and line loads should satisfy the corresponding similarity relationships, which are mainly expressed in Equations (7)–(10).
S p = m m g m p g = S m
S w = m m g / l m m p g / l p = S m / S l
S q = m m g / l 2 m m p g / l 2 p = S m / S l 2
S M = m m g / l m m p g / l 3 p = S m S l 3
where Sp, Sw, Sq, and SM denote the concentrated load, line load, surface load, and bending moment, respectively.
Physical similarity: By applying physical similarity, the mechanical behavior of the prototype structure—such as stress, deformation, stiffness, and other responses—can be analyzed and predicted. This involves establishing similarity ratios between the scaled model and the prototype in terms of normal stress, elastic modulus, normal strain, shear stress, and flexural deformation, thereby enabling the estimation of the prototype’s deformation, internal forces, stresses, and strains from the model test results.
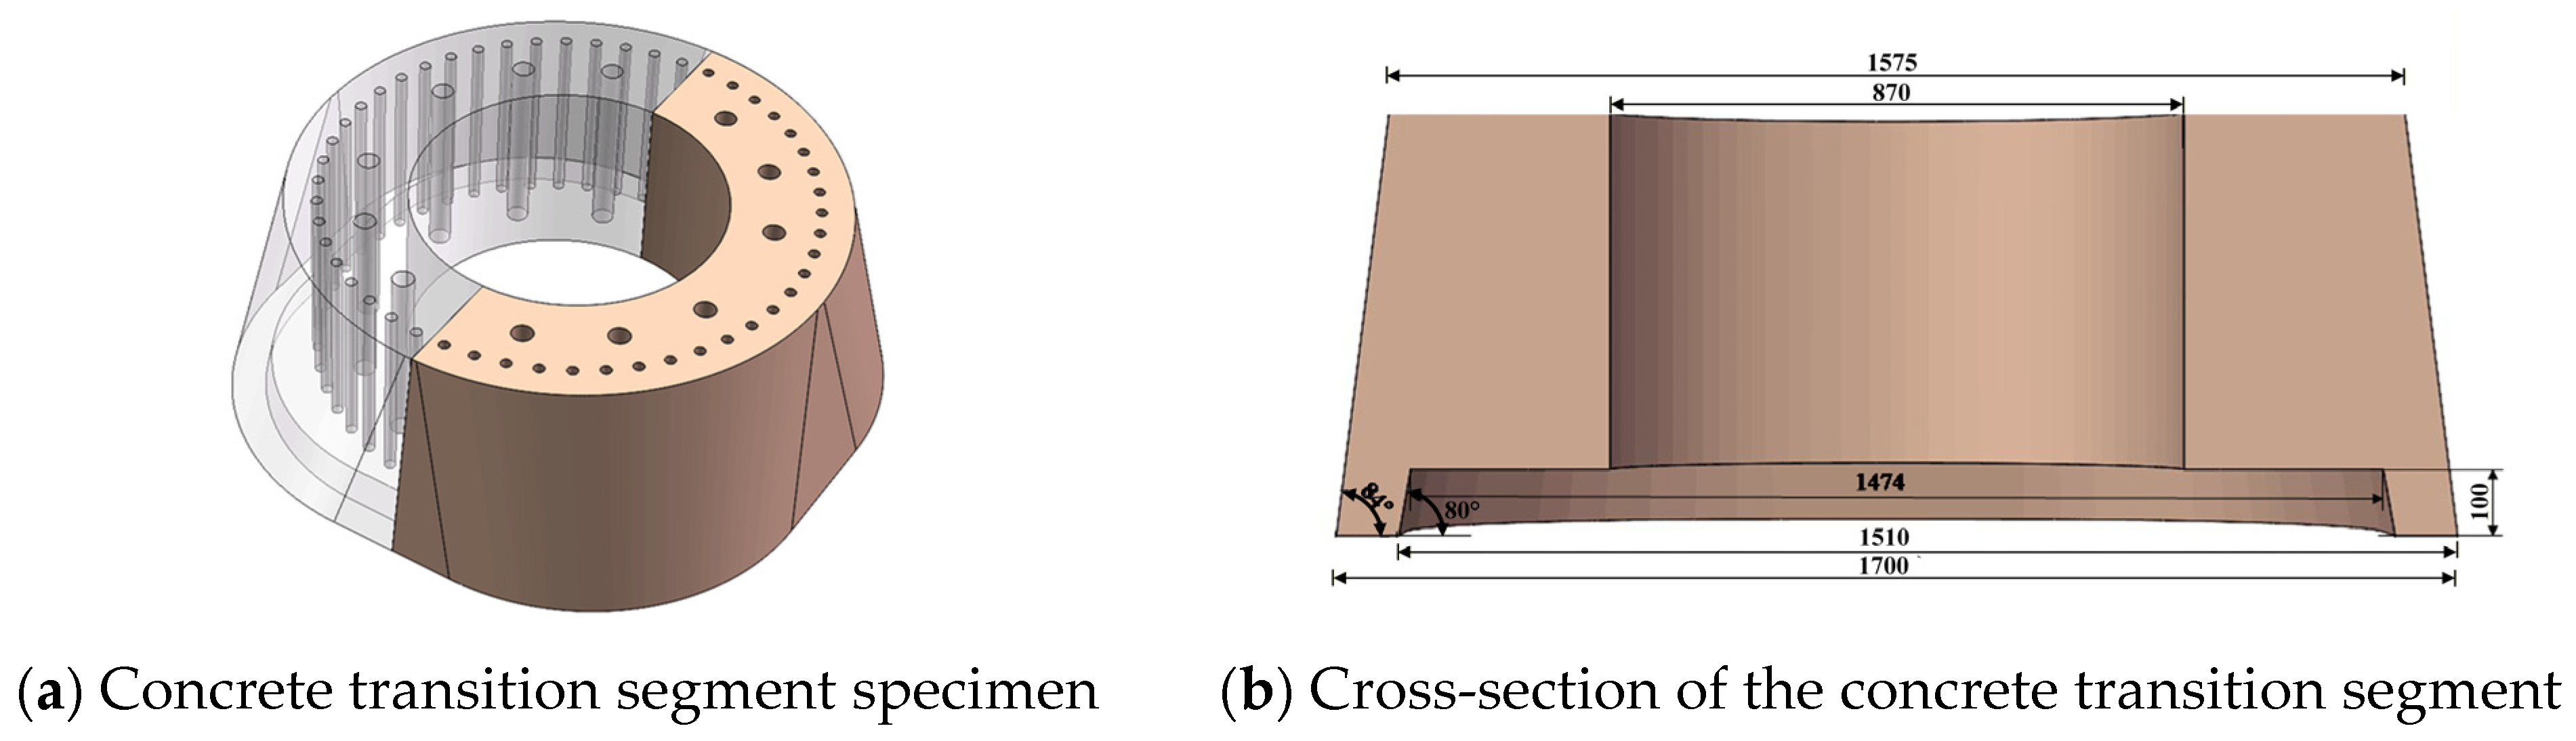
Based on the aforementioned principles of similitude, the specimen was designed as a 1:3 scaled model of the concrete transition segment in actual engineering. As shown in Figure 1a, the internal cross-section of the transition segment was a circle with a radius of 435 mm. The external upper cross-section of the transition segment had an overall length of 1575 mm, consisting of four straight edges of 35 mm each and four rounded corners with a radius of 770 mm. The bottom cross-section of the transition segment was a polygonal ring with a width of 95 mm and an overall length of 1700 mm, comprising four straight edges of 370 mm each and four rounded corners with a radius of 665 mm. Figure 1b illustrates the cross-sectional view of the transition segment. Two steel flange rings were installed at the upper and lower cross-sections of the transition segment. Pre-drilled holes were provided in the flange rings, in which bolts were installed to connect to the upper steel structure. A total of 50 holes with a diameter of 40 mm were pre-drilled in the flange rings. In addition, 12 holes with a diameter of 55 mm were pre-drilled in the concrete within the flange rings, and bolts were installed in these holes to connect to the lower fixture platform. This study was conducted on only one scaled model to investigate the full process of performance evolution. Therefore, limitations exist in terms of statistical repeatability, and the results mainly reflect trend-based behaviors and failure mechanisms. However, the reliability of the conclusions is enhanced through multi-source data validation, including full-field strain evolution obtained from DIC, displacement measurements from multiple sensors, and verification using a refined finite element model under various loading levels. Together, these approaches form a mutually corroborative data framework. The test specimens are shown in Table 1.

2.2. Specimen Preparation

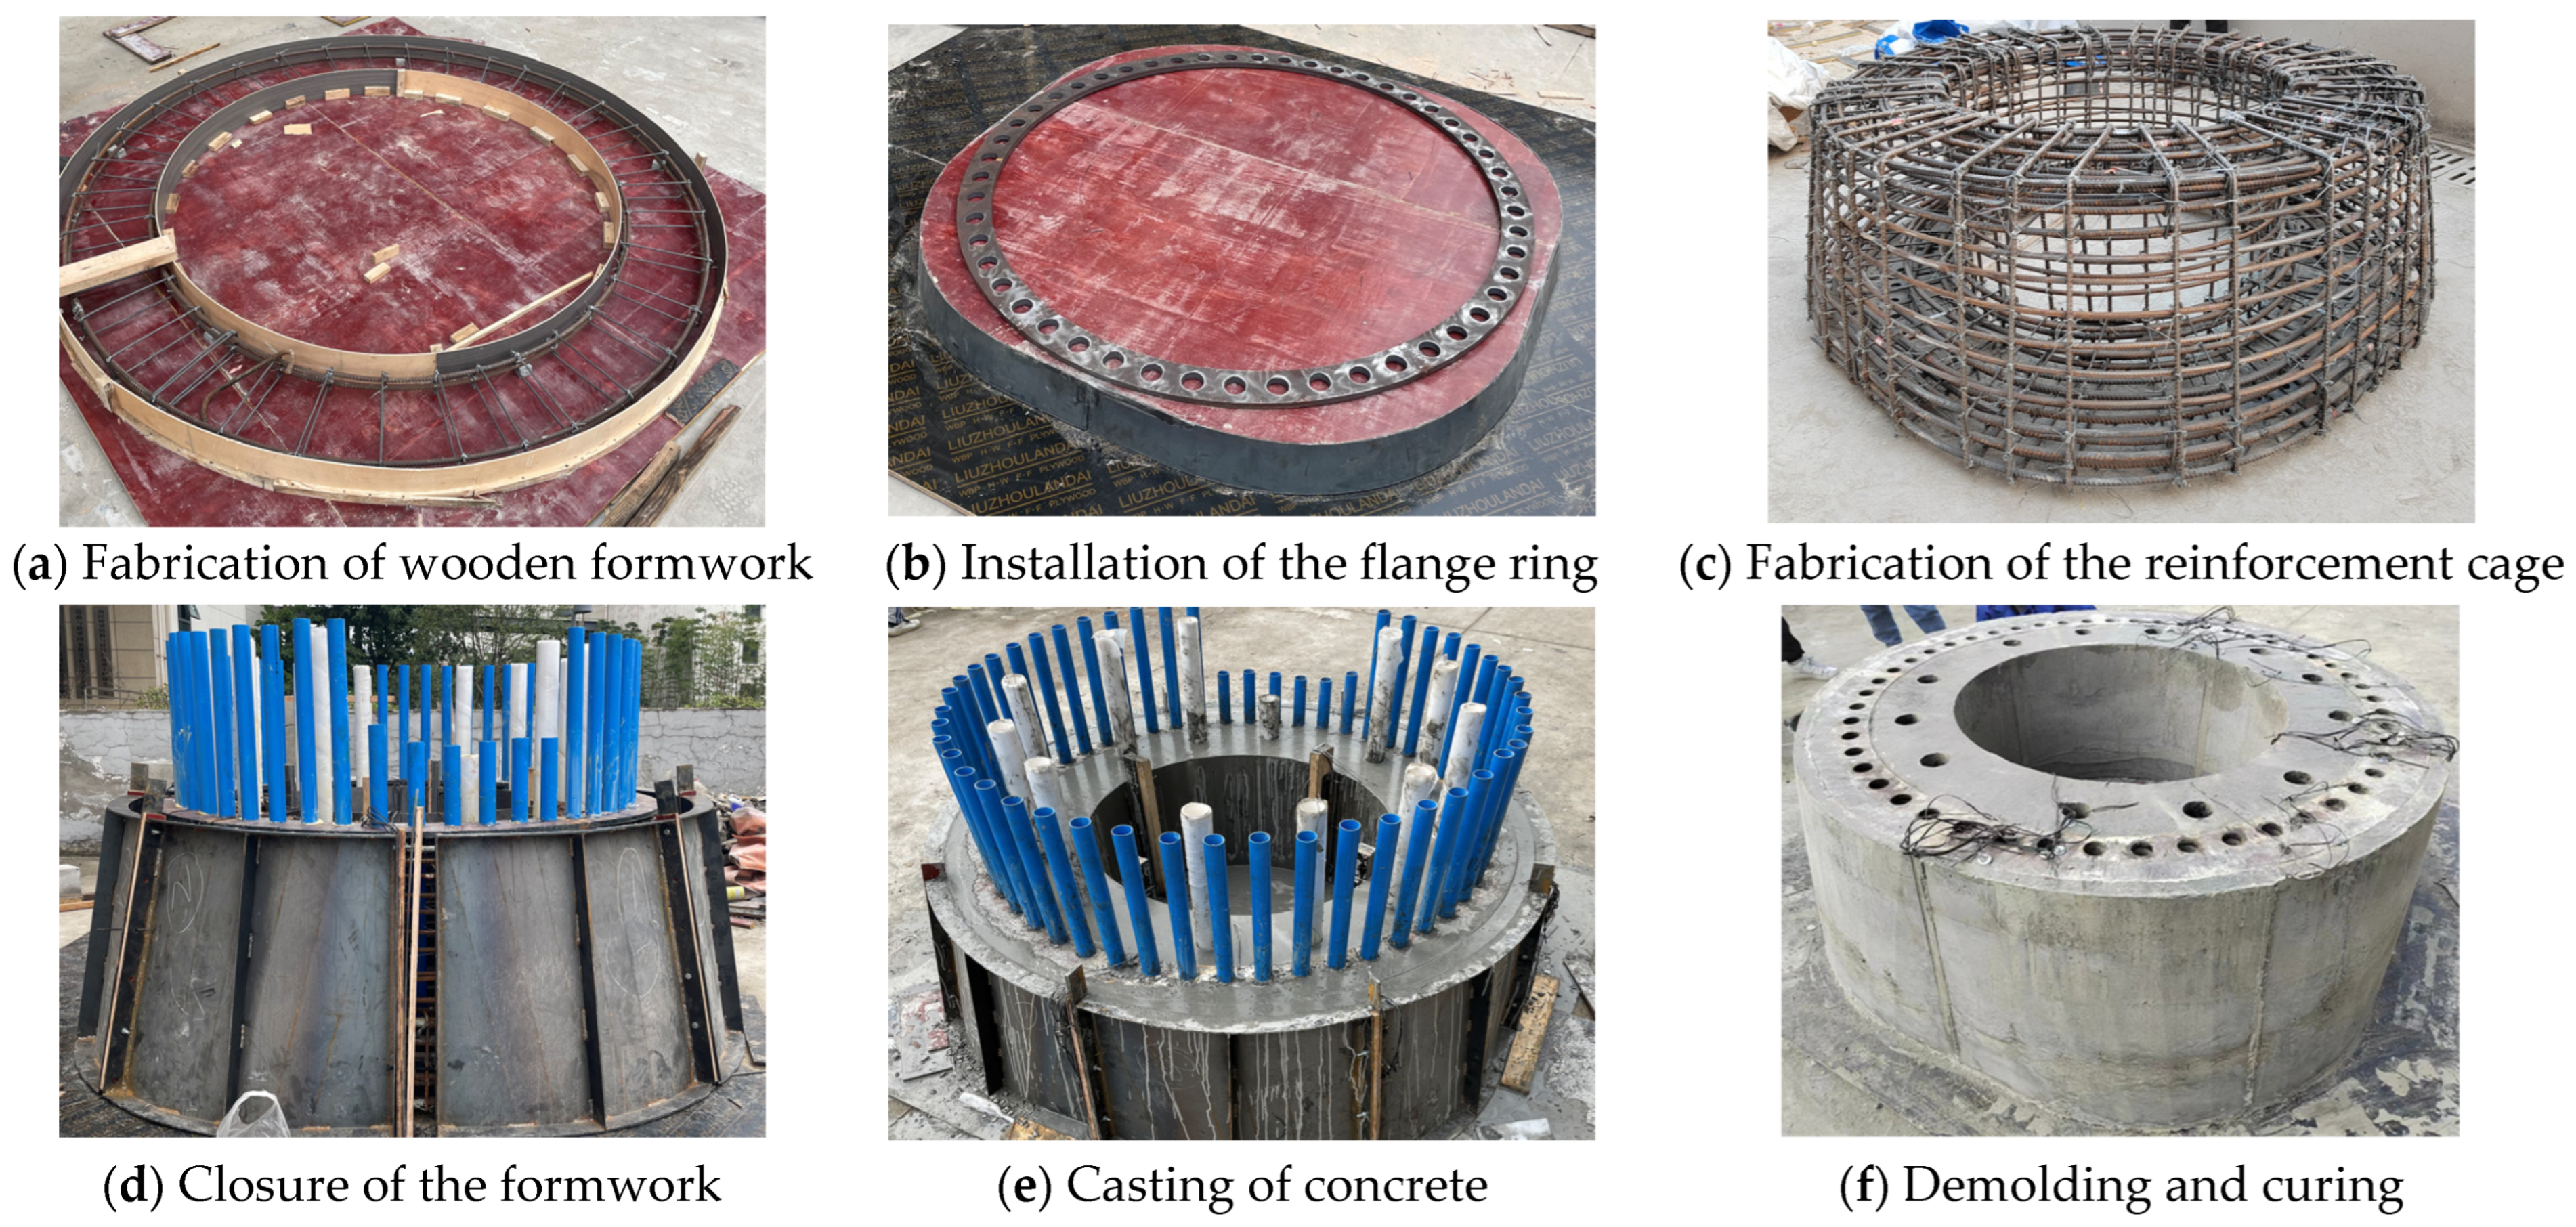
The specimen fabrication process is shown in Figure 2. (a) Wooden formwork was fabricated. (b) The flange ring was placed on the prefabricated formwork. (c) A reinforcement cage for the transition segment was fabricated using HRB400 steel bars (Chongqing Kungang Industrial Co., Ltd., Chongqing, China). The reinforcement cage was then installed on the flange ring to determine the locations of the reserved bolt holes. (d) According to the positions of the flange ring, two types of PVC pipes (12 M60 and 50 M50) were inserted into the reserved holes and fixed to the reinforcement cage. After the installation of the PVC pipes, the formwork was closed. (e) C70 concrete was then cast. (f) After demolding, the specimen was cured.
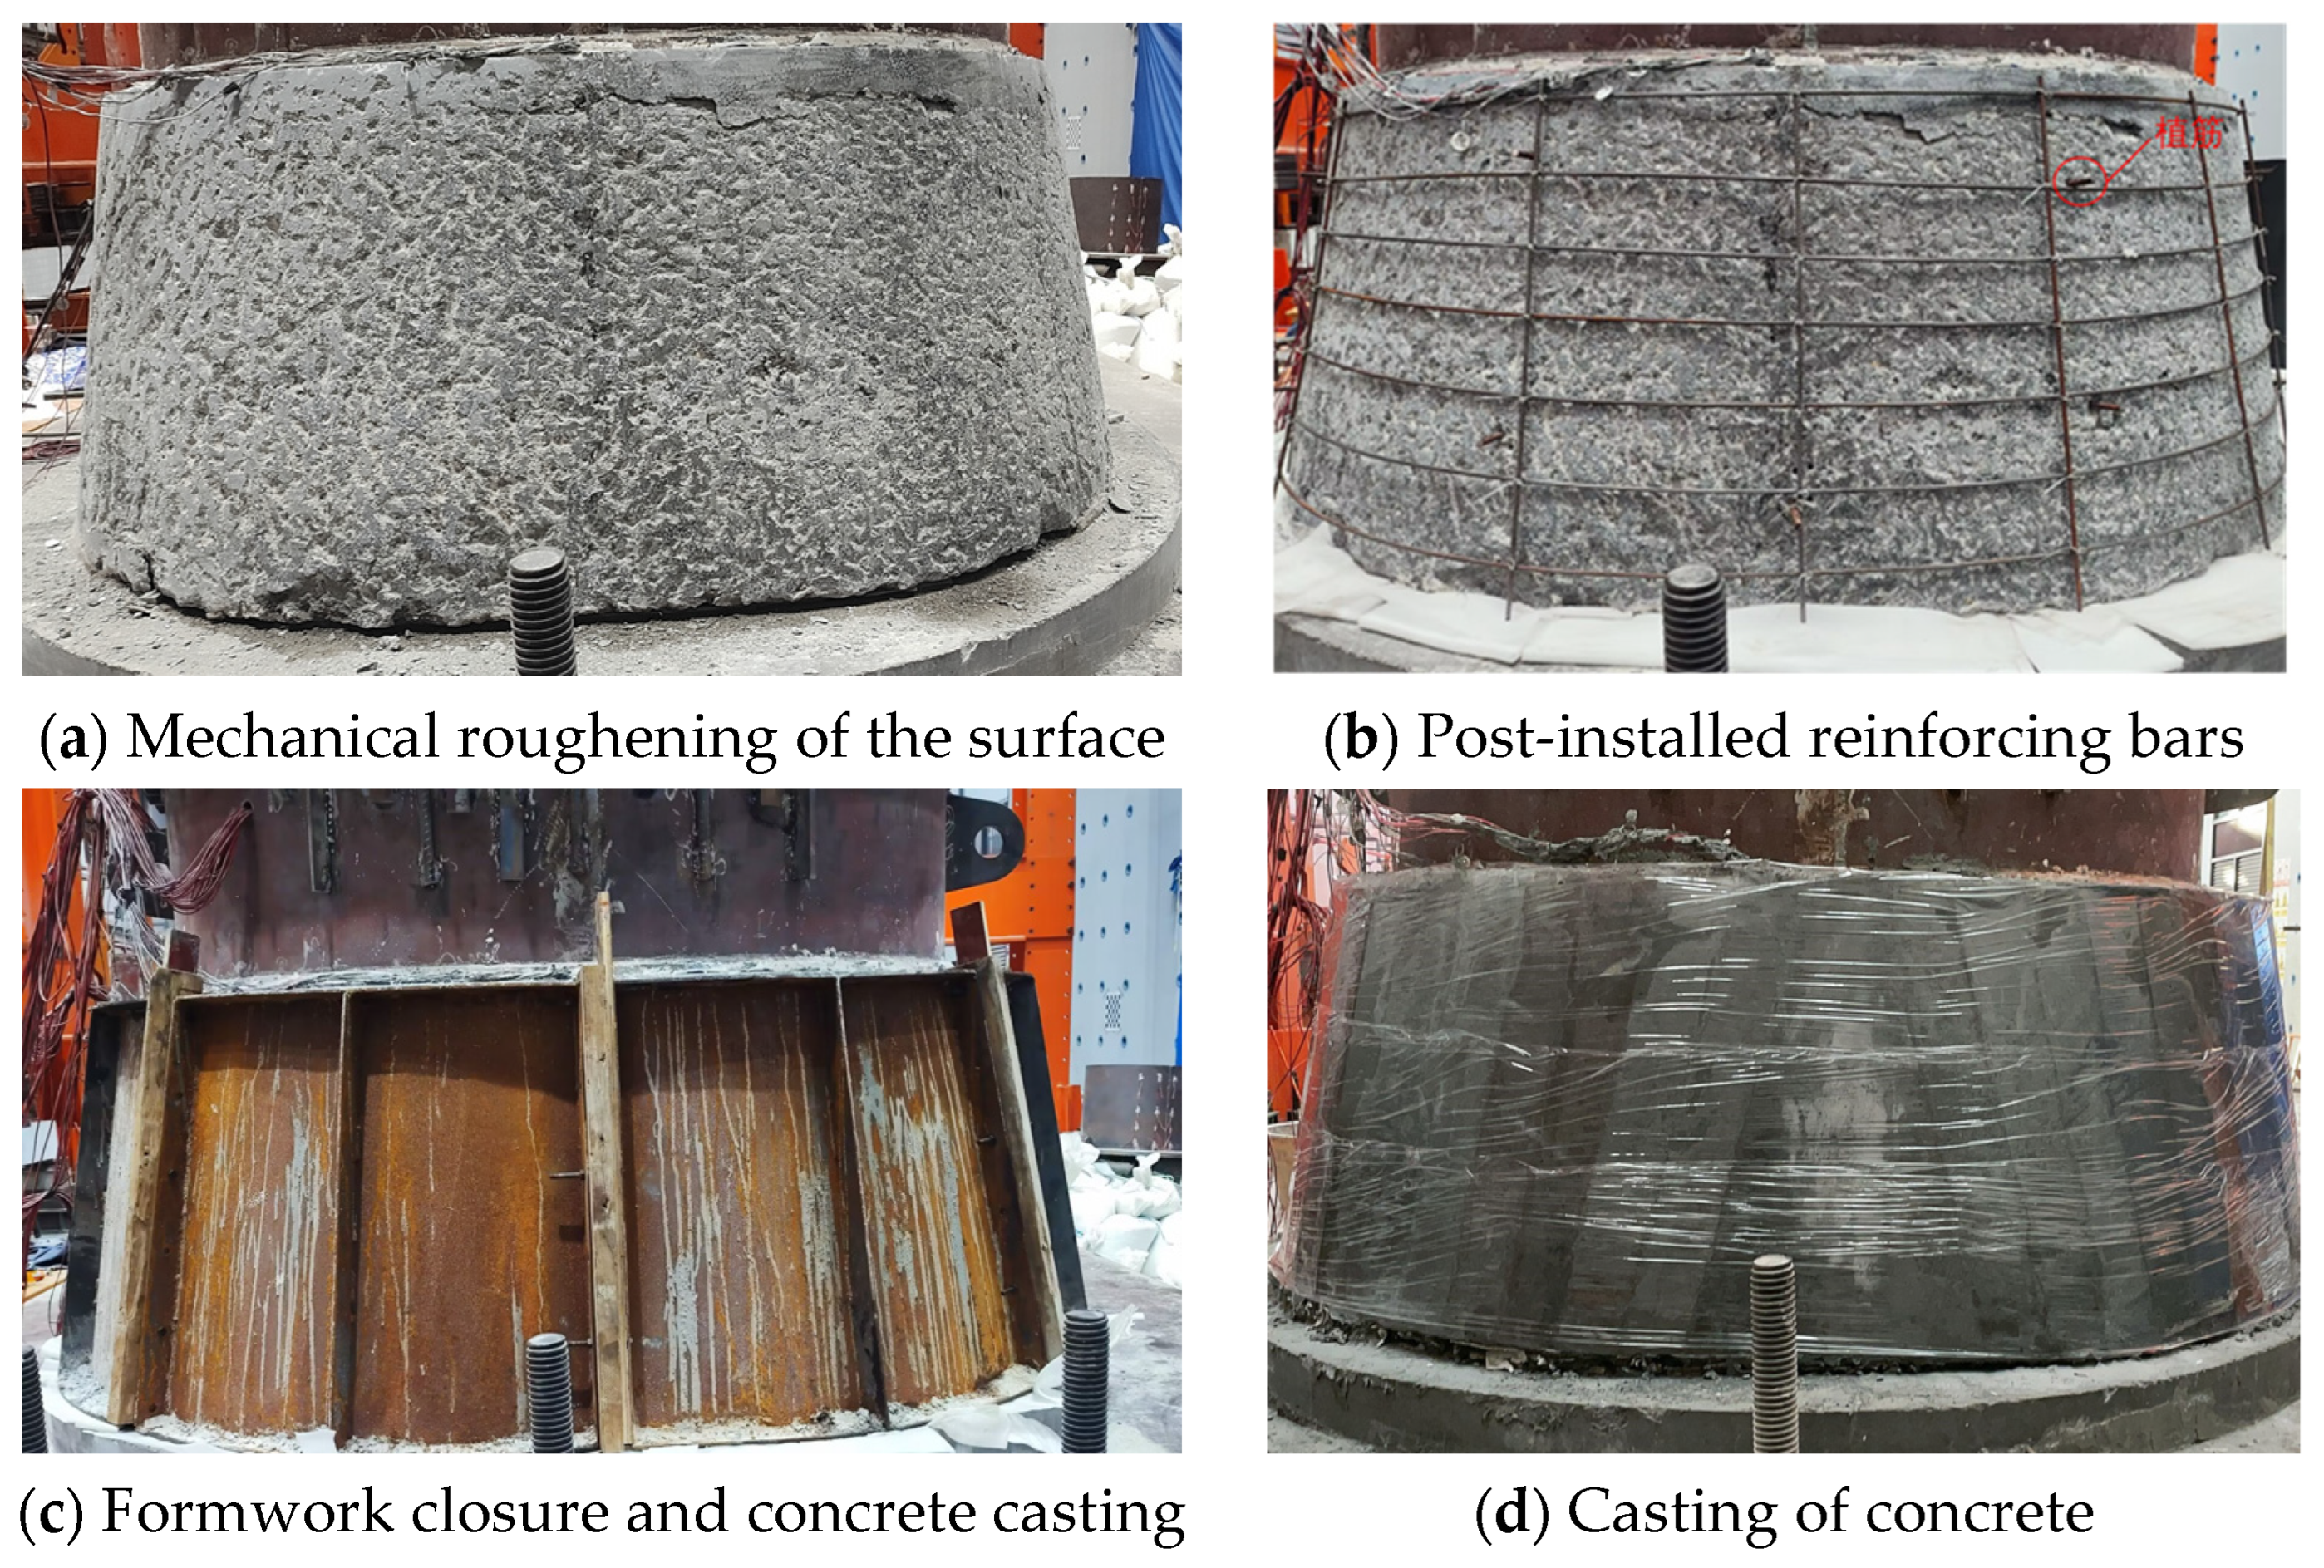
The external UHPC strengthening procedure is illustrated in Figure 3. (a) The surface of the damaged transition segment was roughened to enhance the interfacial bonding performance; (b) the strengthening reinforcement was tied, and post-installed rebars were anchored. The longitudinal reinforcement consisted of 16 bars with a diameter of 6 mm and a length of 640 mm, which were vertically arranged along the surface of the transition segment. The stirrups consisted of 7 bars with a diameter of 6 mm and a length of 5.5 m. The post-installed rebars had a diameter of 6 mm and an anchorage length of 40 mm; (c) the strengthening layer and the void region were arranged. The thickness of the strengthening layer was 40 mm, and foam pads were used on the void side to prevent unintended voids in the dense UHPC region; (d) the UHPC was cast and cured.
In this study, a predefined void was introduced at the bottom of the concrete transition segment. The primary purpose was to simulate a potential connection defect between the transition segment and the underlying concrete tower caused by insufficient grouting during the construction of wind turbine structures. This is a known construction quality issue in wind engineering that may affect the structural load-bearing performance. The objective of this study is not to reproduce a specific irregular defect configuration, but to create a controllable and repeatable “worst-case scenario” to quantitatively investigate the effects of such defects on the static and fatigue performance of the transition segment, as well as to evaluate the effectiveness of UHPC strengthening.
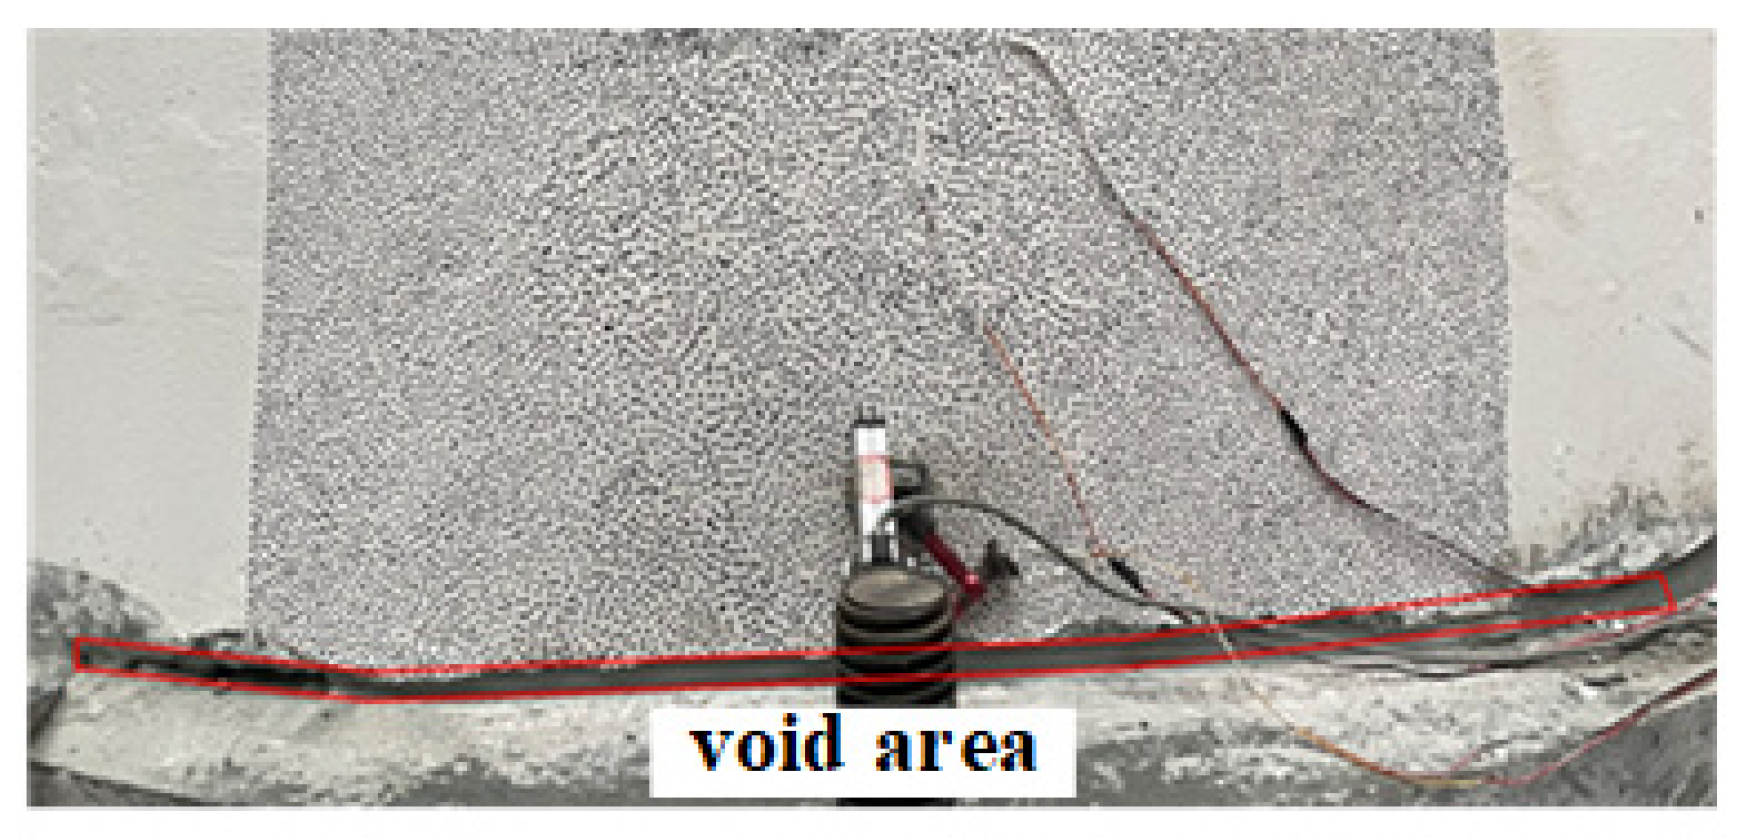
The size of the void was determined based on the finite element model, with a transverse length of 1000 mm and a height of 20 mm. First, the void dimensions were defined according to the results of a sensitivity analysis. Then, the location was marked on the surface of the transition segment, and the designated area was created using an impact drill (Jiangsu Dongcheng Power Tools Co., Ltd., Nantong, China). Foam pads were subsequently placed within the void region. A schematic of the void location is shown in Figure 4.

2.3. Material Properties

The mechanical properties of the concrete materials, including UHPC and C70 concrete, were tested. The mechanical parameters of the concrete were determined in accordance with GB/T 50081-2002 [30], while the mechanical properties of UHPC were evaluated following T/CECS 864-2021 [31]. The mix proportions of UHPC are presented in Table 2. The test results of UHPC and C70 concrete are summarized in Table 3.
The reinforcement cage of the transition segment was assembled using HRB400-grade steel bars (Chongqing Kungang Industrial Co., Ltd., Chongqing, China). The steel structure above the concrete transition segment, as well as the loading fixtures, were fabricated from Q345 steel. Tensile tests on the steel plates and steel bars were conducted using a universal testing machine (MTS Systems (China) Co., Ltd., Shanghai, China), in accordance with GB/T 228.1-2010 [32]. The yield strength, ultimate tensile strength, and Young’s modulus were measured, and the corresponding parameters are listed in Table 4.

2.4. Loading and Measuring Methods

2.4.1. Loading Procedure

In this experiment, a bolt tensioning device was used to apply pre-stress to the bolts, simulating the vertical load exerted on the transition segment by the upper structure in actual engineering. The required prestressing force was 435 kN for each of the 12 M52 bolts and 258 kN for each of the 50 M36 bolts.
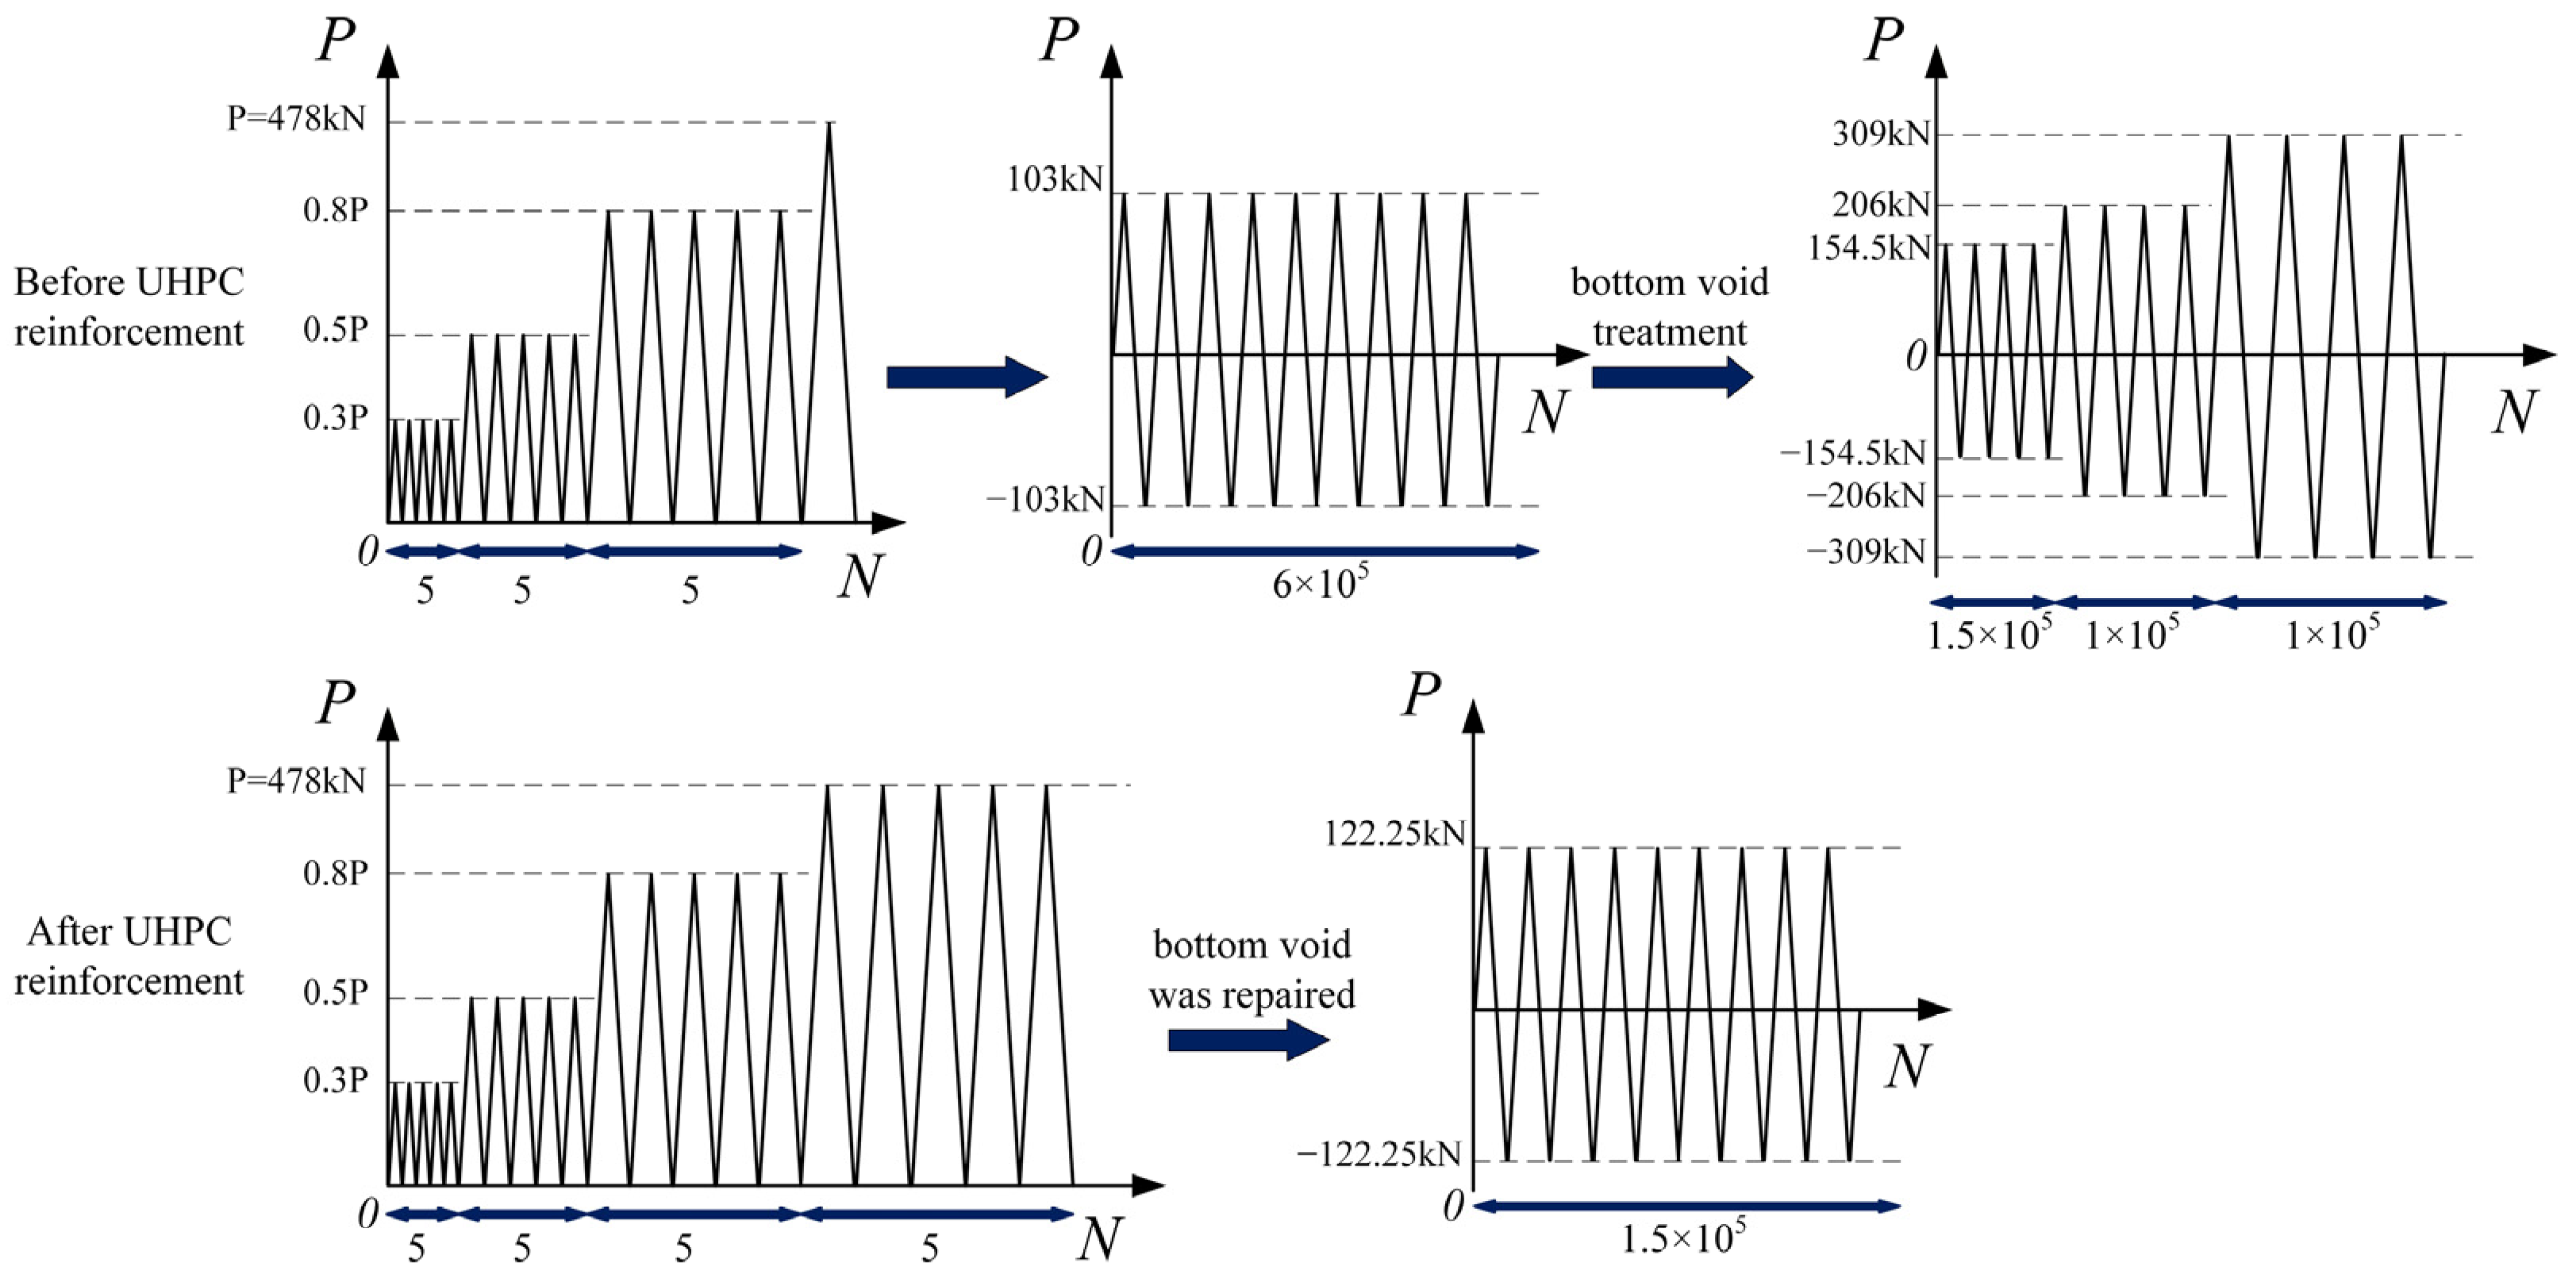
The tests were conducted using a UK SERVOTEST 41,000 kN fatigue actuator (Servotest Testing Systems Ltd., Surrey, UK), in accordance with the German GL-2010 standard [33]. The loading protocol consisted of two stages. First, static cyclic loading was applied with a design ultimate load (P) of 478 kN using load levels of 0.3 P, 0.5 P, and 0.8 P (five cycles each) at a rate of 2 kN/s. This was followed by fatigue loading with an amplitude of 326 kN at 1 Hz. Due to the need to apply overload levels of 2 and 3 times the load amplitude during the fatigue test, and considering the limitations of laboratory loading equipment and safety concerns, the original design load amplitude of 326 kN was converted into an equivalent test load amplitude of 206 kN. A total of 600,000 cycles were initially applied, followed by bottom void treatment, and then an additional 450,000 cycles, resulting in 1.05 million cycles. The loading procedure of the fatigue test is shown in Table 5.
After fatigue damage, the specimen was strengthened with UHPC. Static cyclic loading at 0.3 P, 0.5 P, 0.8 P, and 1.0 P (five cycles each) was then conducted under bottom void conditions. Subsequently, the void was repaired, and 150,000 additional fatigue cycles were applied. Based on equivalent load theory, 163 kN was defined as the reference amplitude, while 244.5 kN (1.5 times) was considered equivalent to 500,000 cycles at the reference level, representing one fatigue life cycle. During post-strengthening fatigue loading, data were recorded every 50,000 cycles. The experimental loading procedure is shown in Figure 5.

2.4.2. Measuring Procedure

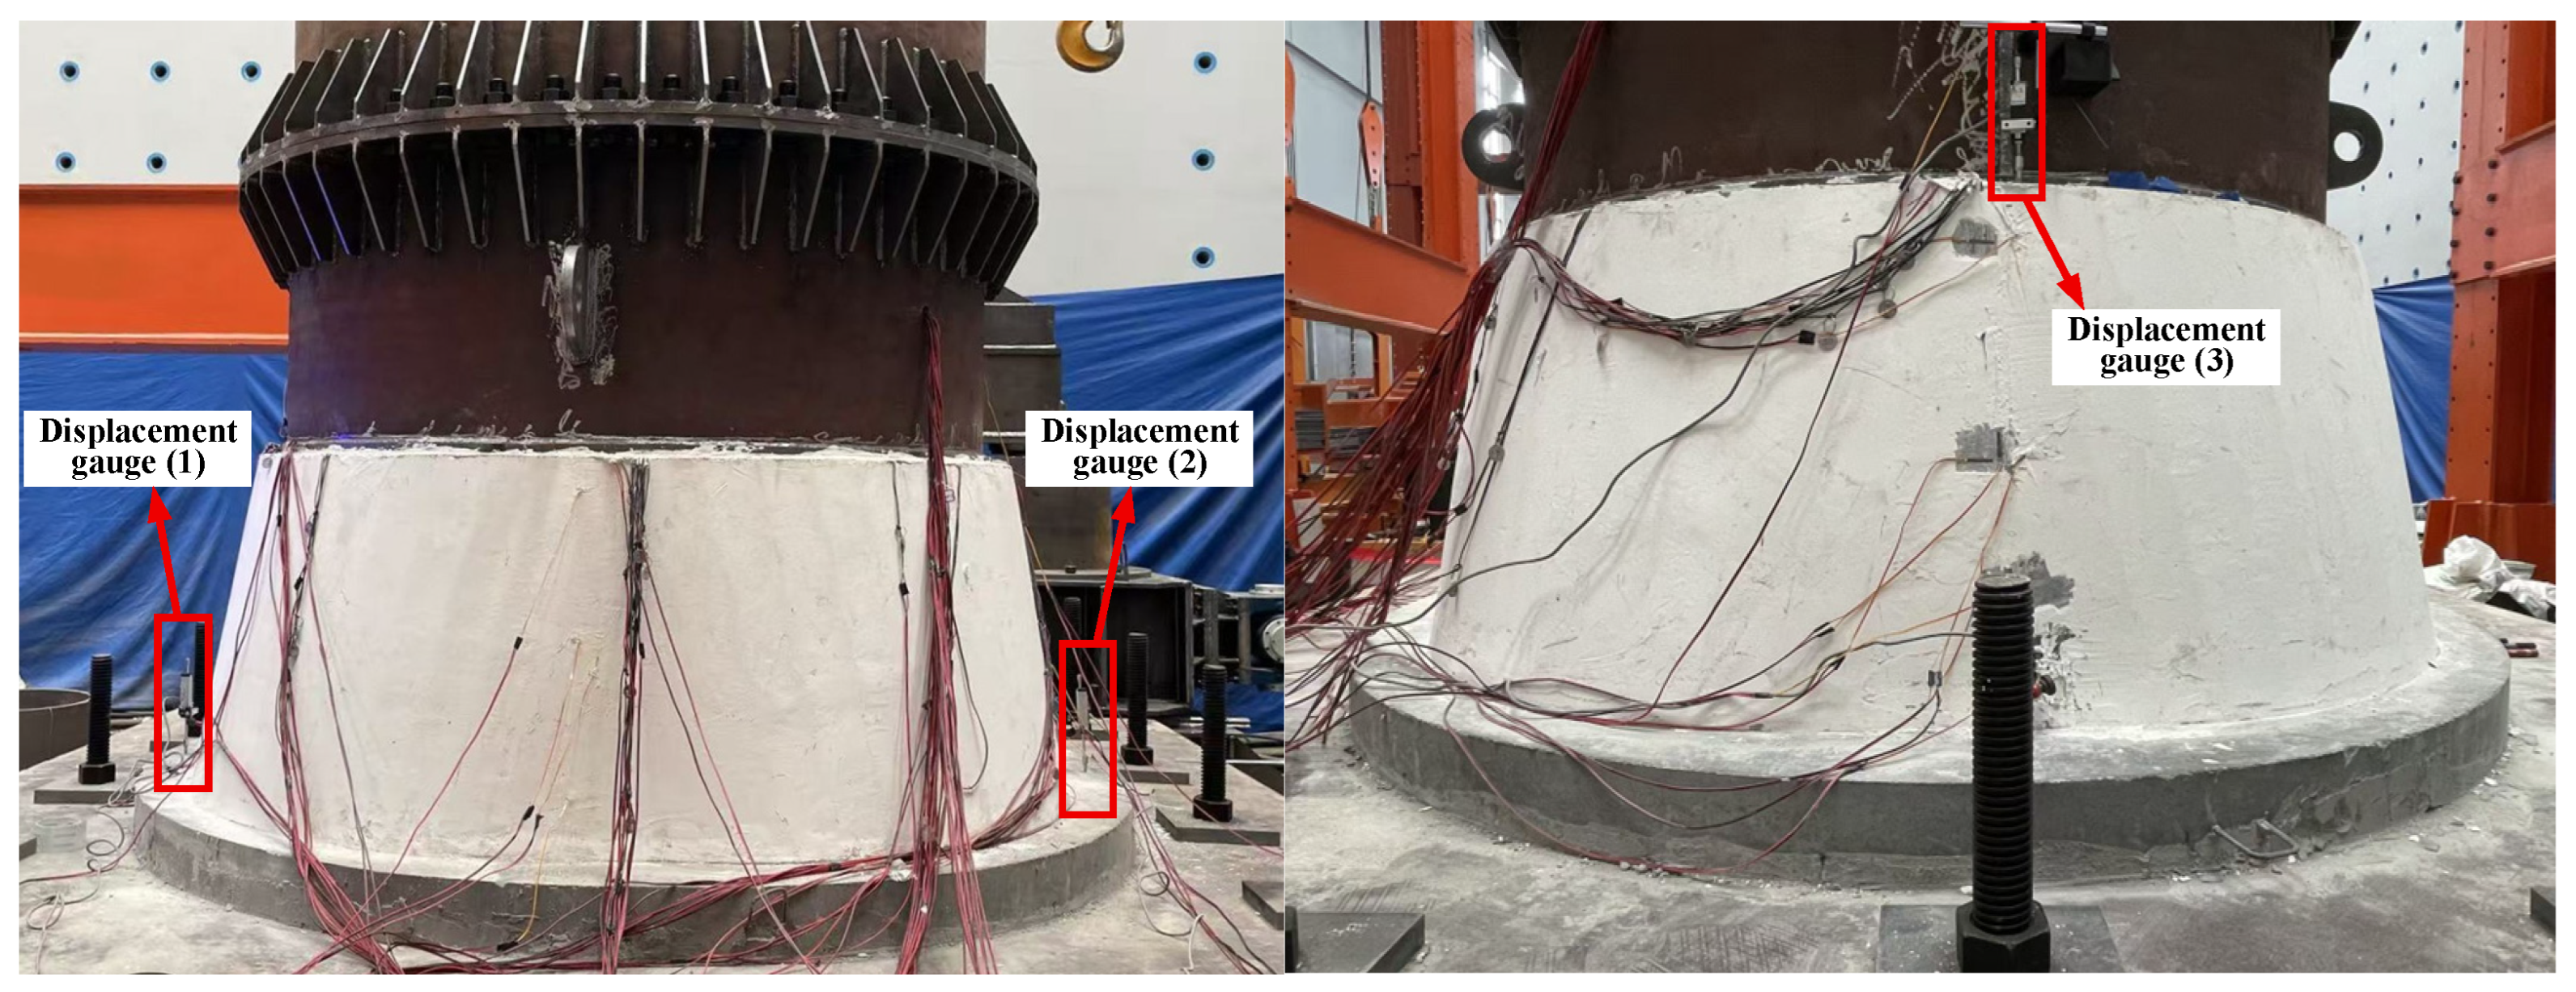
A total of three displacement gauges were arranged to measure the separation between the interfaces. The specific placement of the displacement gauges is shown in Figure 6.

2.4.3. Digital Image Correlation Method

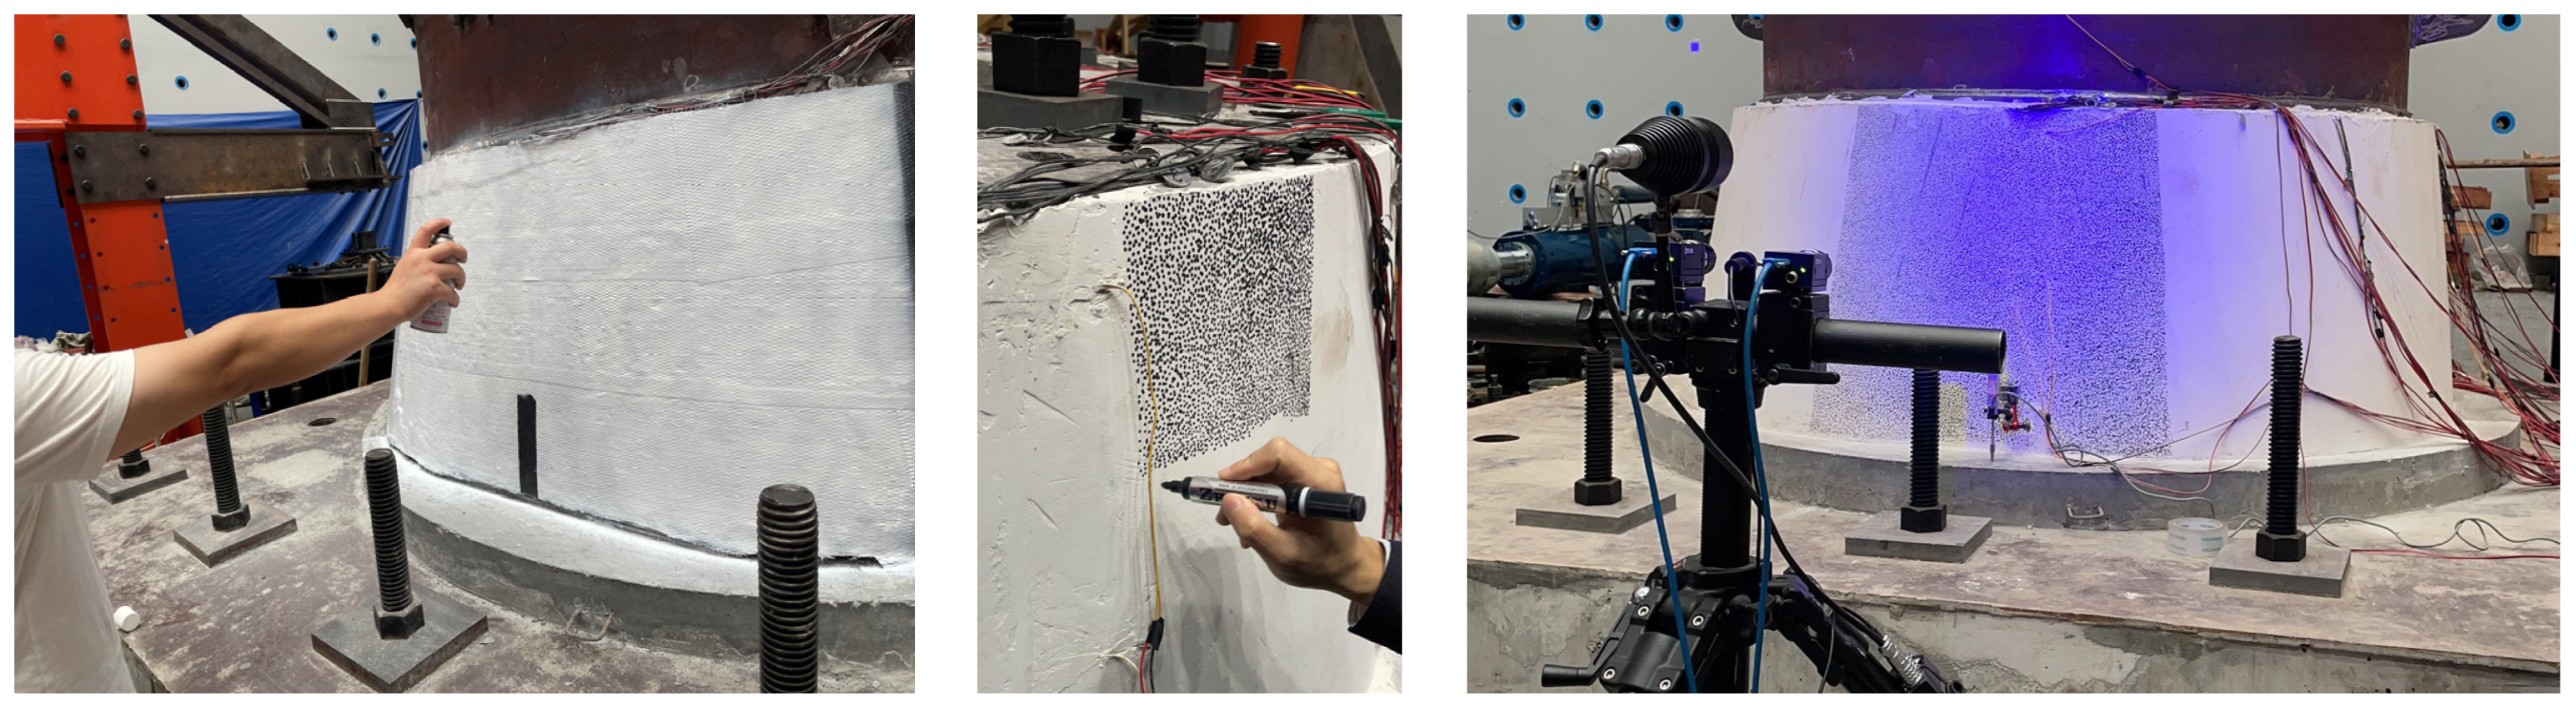
The digital image correlation (DIC) was used to monitor the deformation and the strain fields. The full field interfacial slip and strain fields can be obtained by comparing the local speckle image before and after loading [34,35]. The DIC hardware system was composed of a data acquisition unit, a high-resolution camera, and two blue LED lights. The surface was prepared with a randomly sprayed black-and-white speckle pattern, as shown in Figure 7.

3. Experimental Results

3.1. Failure Modes

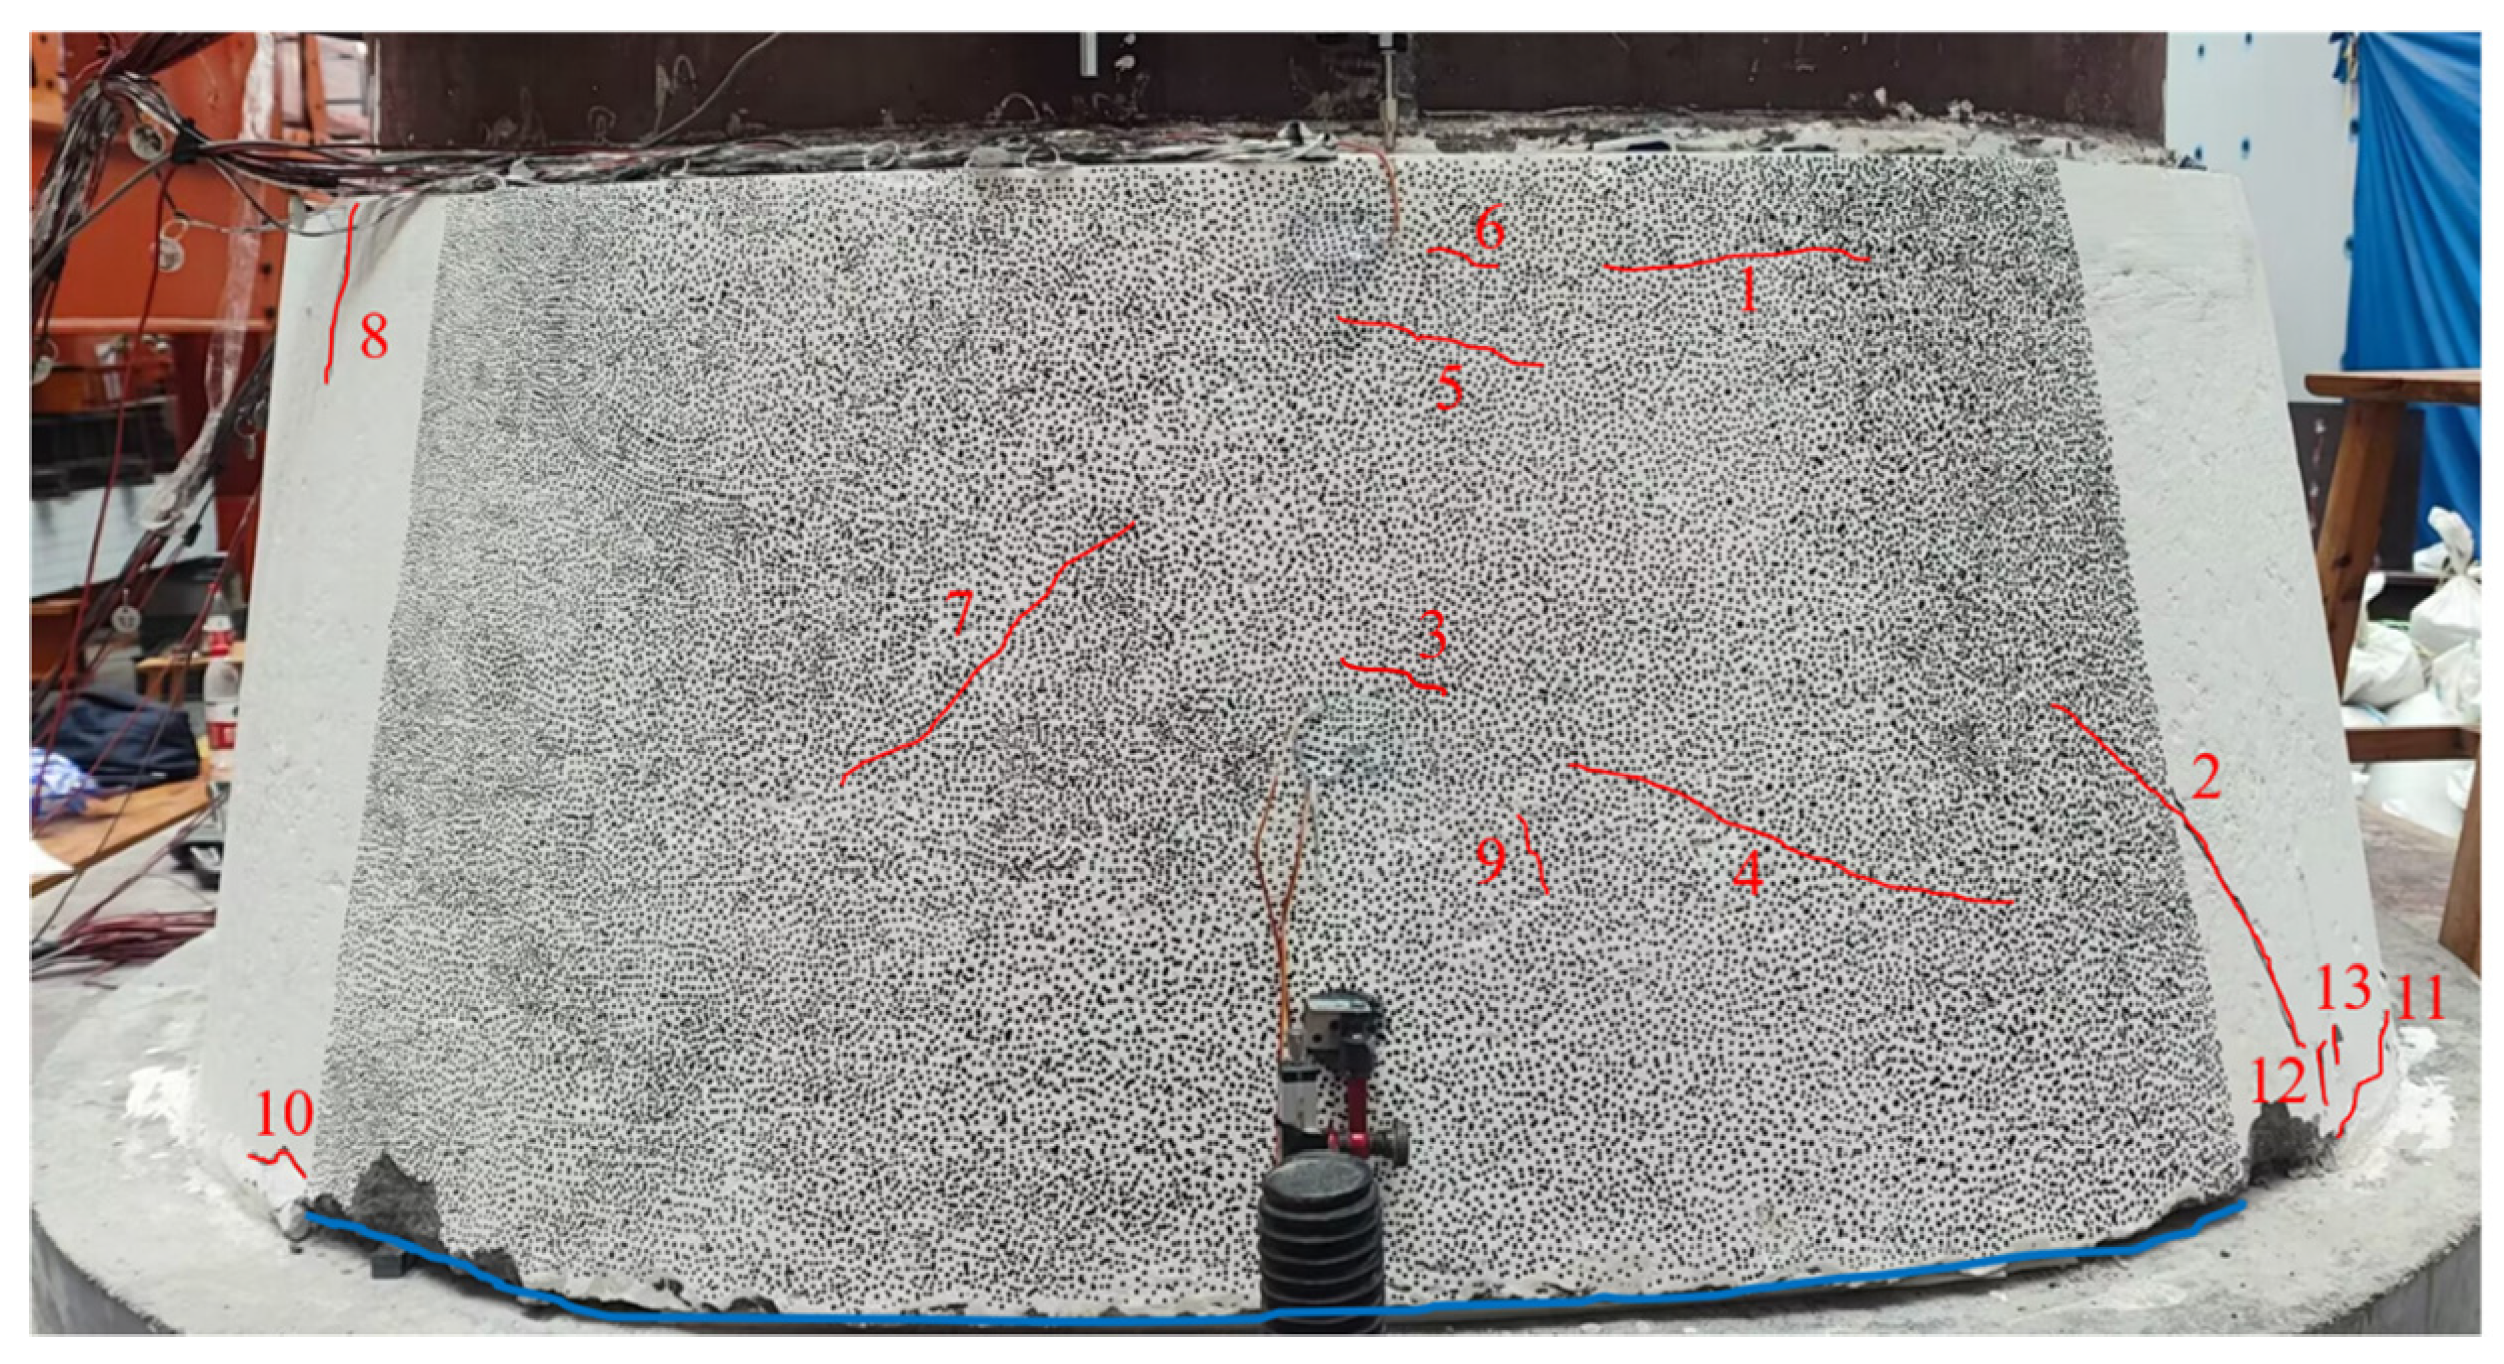
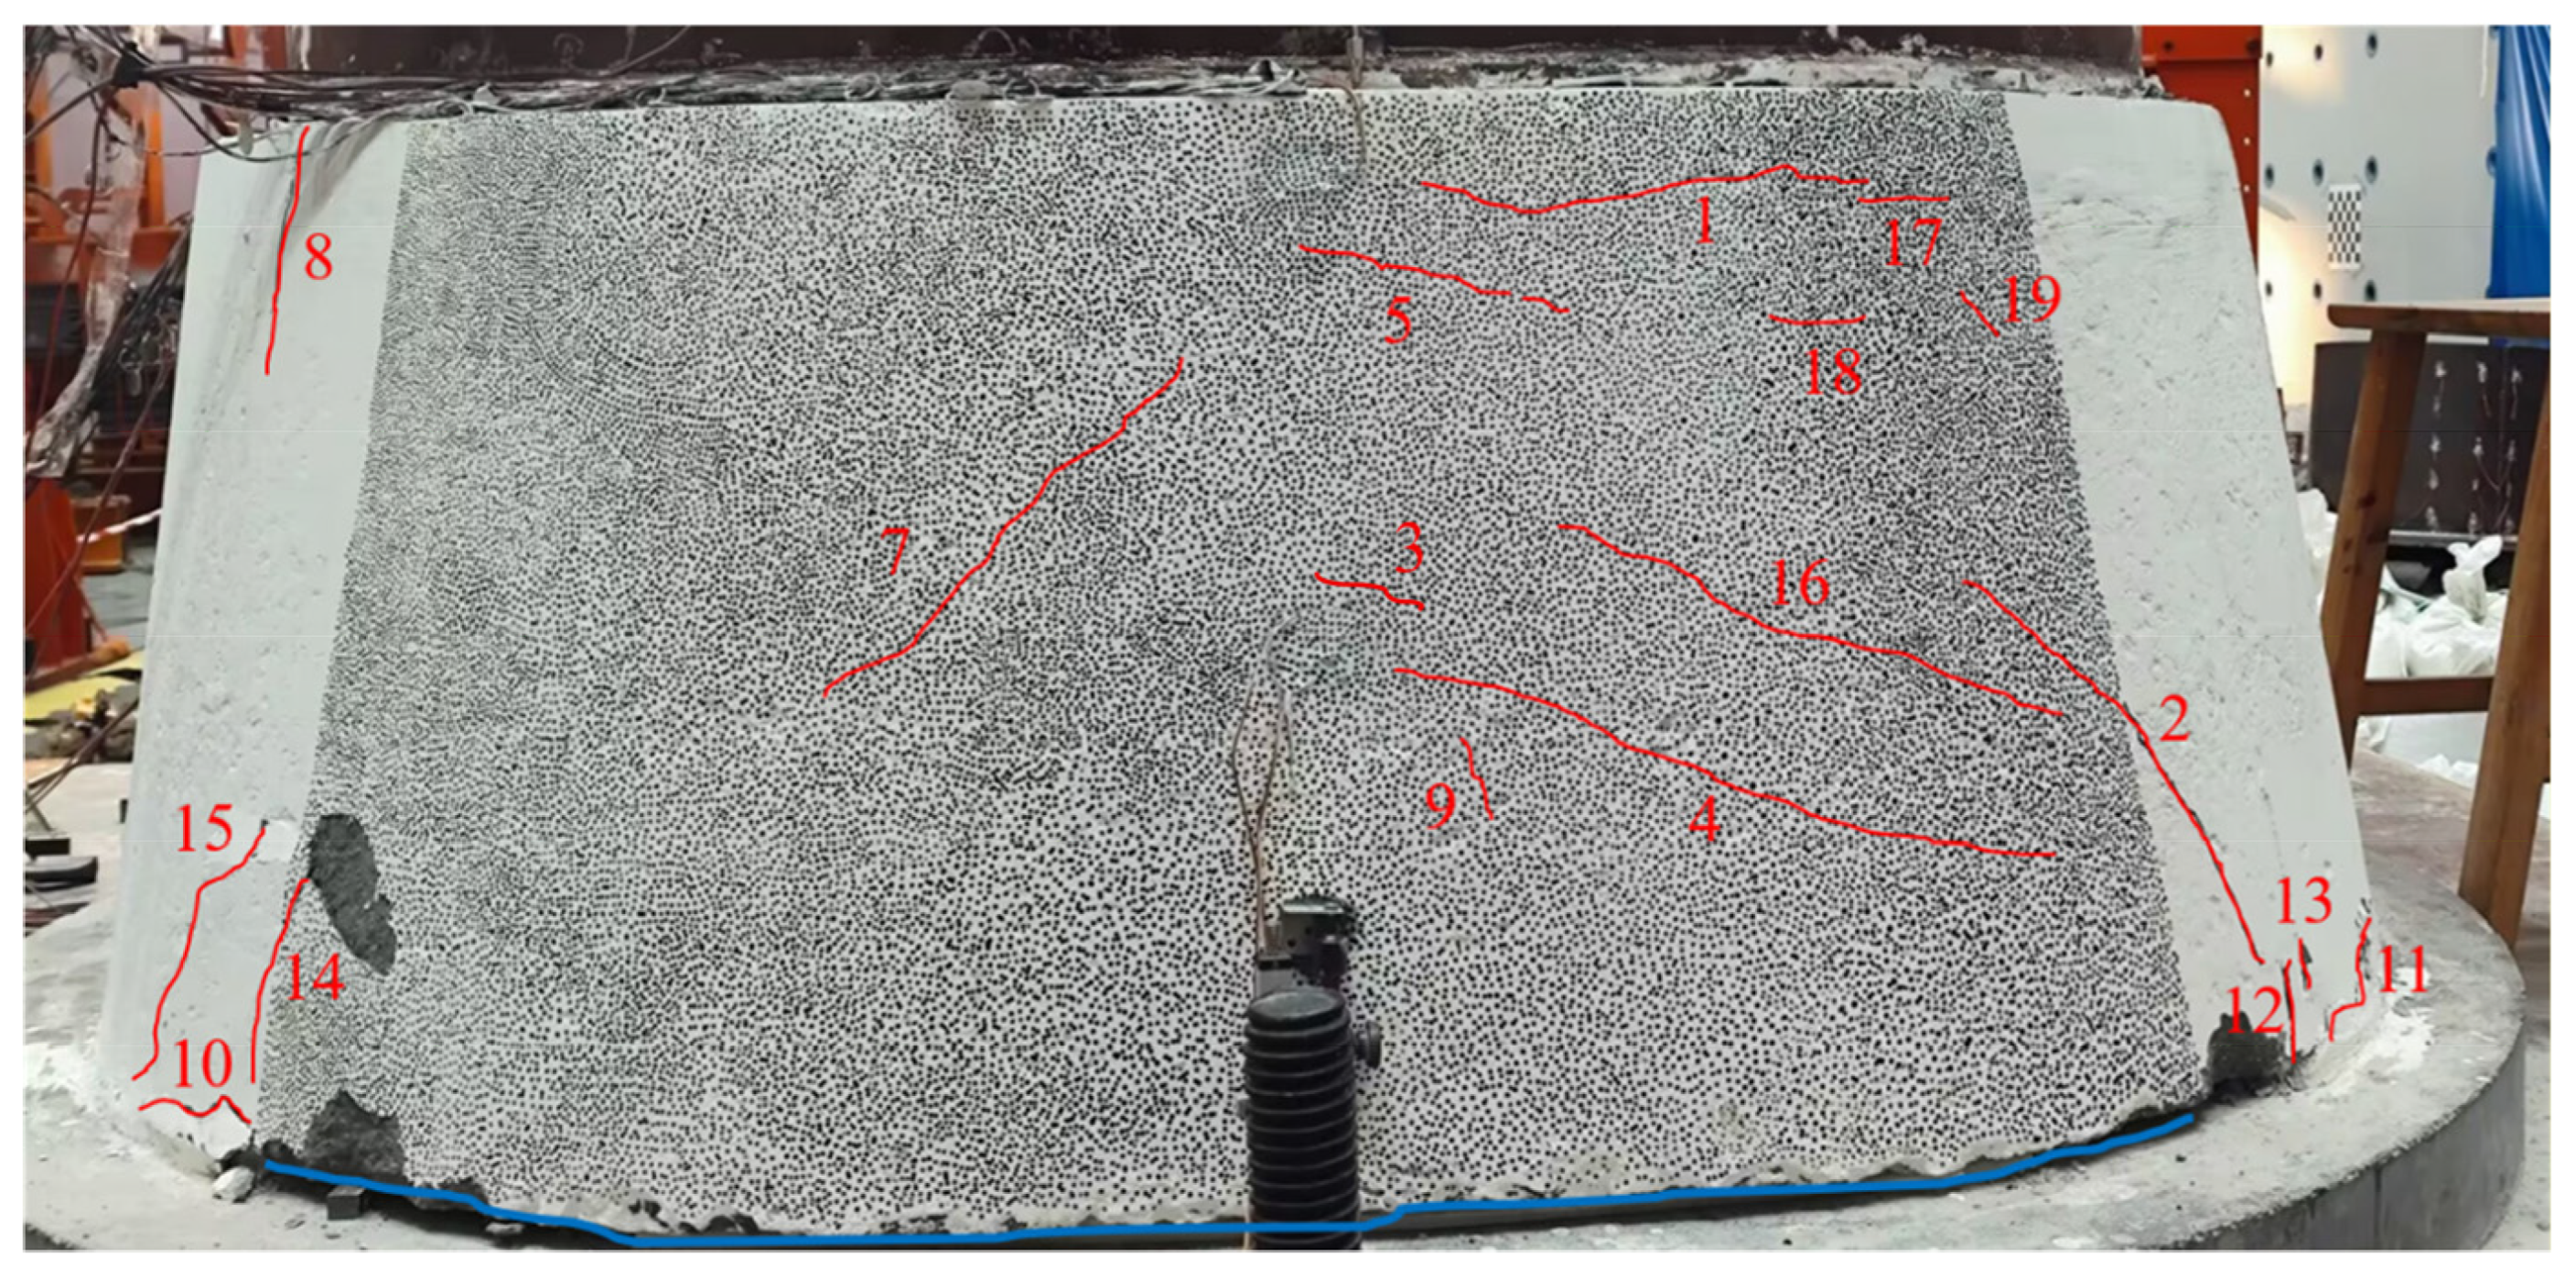
During the tendon prestressing stage, tensile cracks numbered 1 to 13 appeared, with Crack 1 having a width of 0.9 mm. This indicated that the insufficient grouting at the bottom, when prestressing was applied to the transition segment, caused damage to the surface concrete, with the initial cracks occurring in the transverse position above the concrete transition segment. The specific locations of the cracks are shown in Figure 8.
Prior to the application of external UHPC, static and fatigue loading tests were conducted on the concrete transition segment. During the static loading phase, when the load reached the operational load of 270 kN, crack propagation was not significant, with only slight changes observed, and the overall condition remained stable. In the fatigue loading phase, as the fatigue load amplitude increased and the number of cycles accumulated, surface damage on the concrete transition segment gradually expanded. After 50,000 fatigue cycles, cracks further propagated, with some cracks becoming through-cracks, and the maximum crack width reached 0.09 mm. At the same time, new cracks appeared on the right side of the transition segment and extended horizontally, with a crack width of approximately 0.02 mm. Overall, the cracks began to exhibit a pattern of localized concentration from a dispersed state. After 100,000 fatigue cycles, slight concrete spalling occurred in localized crack areas, and some cracks continued to expand transversely. After 150,000 fatigue cycles, the cracks continued to spall, and several new cracks appeared on the right side of the transition segment, with the maximum crack width reaching 0.04 mm, while the others were around 0.02 mm, as shown in Figure 9.

3.2. Load–Displacement Curve

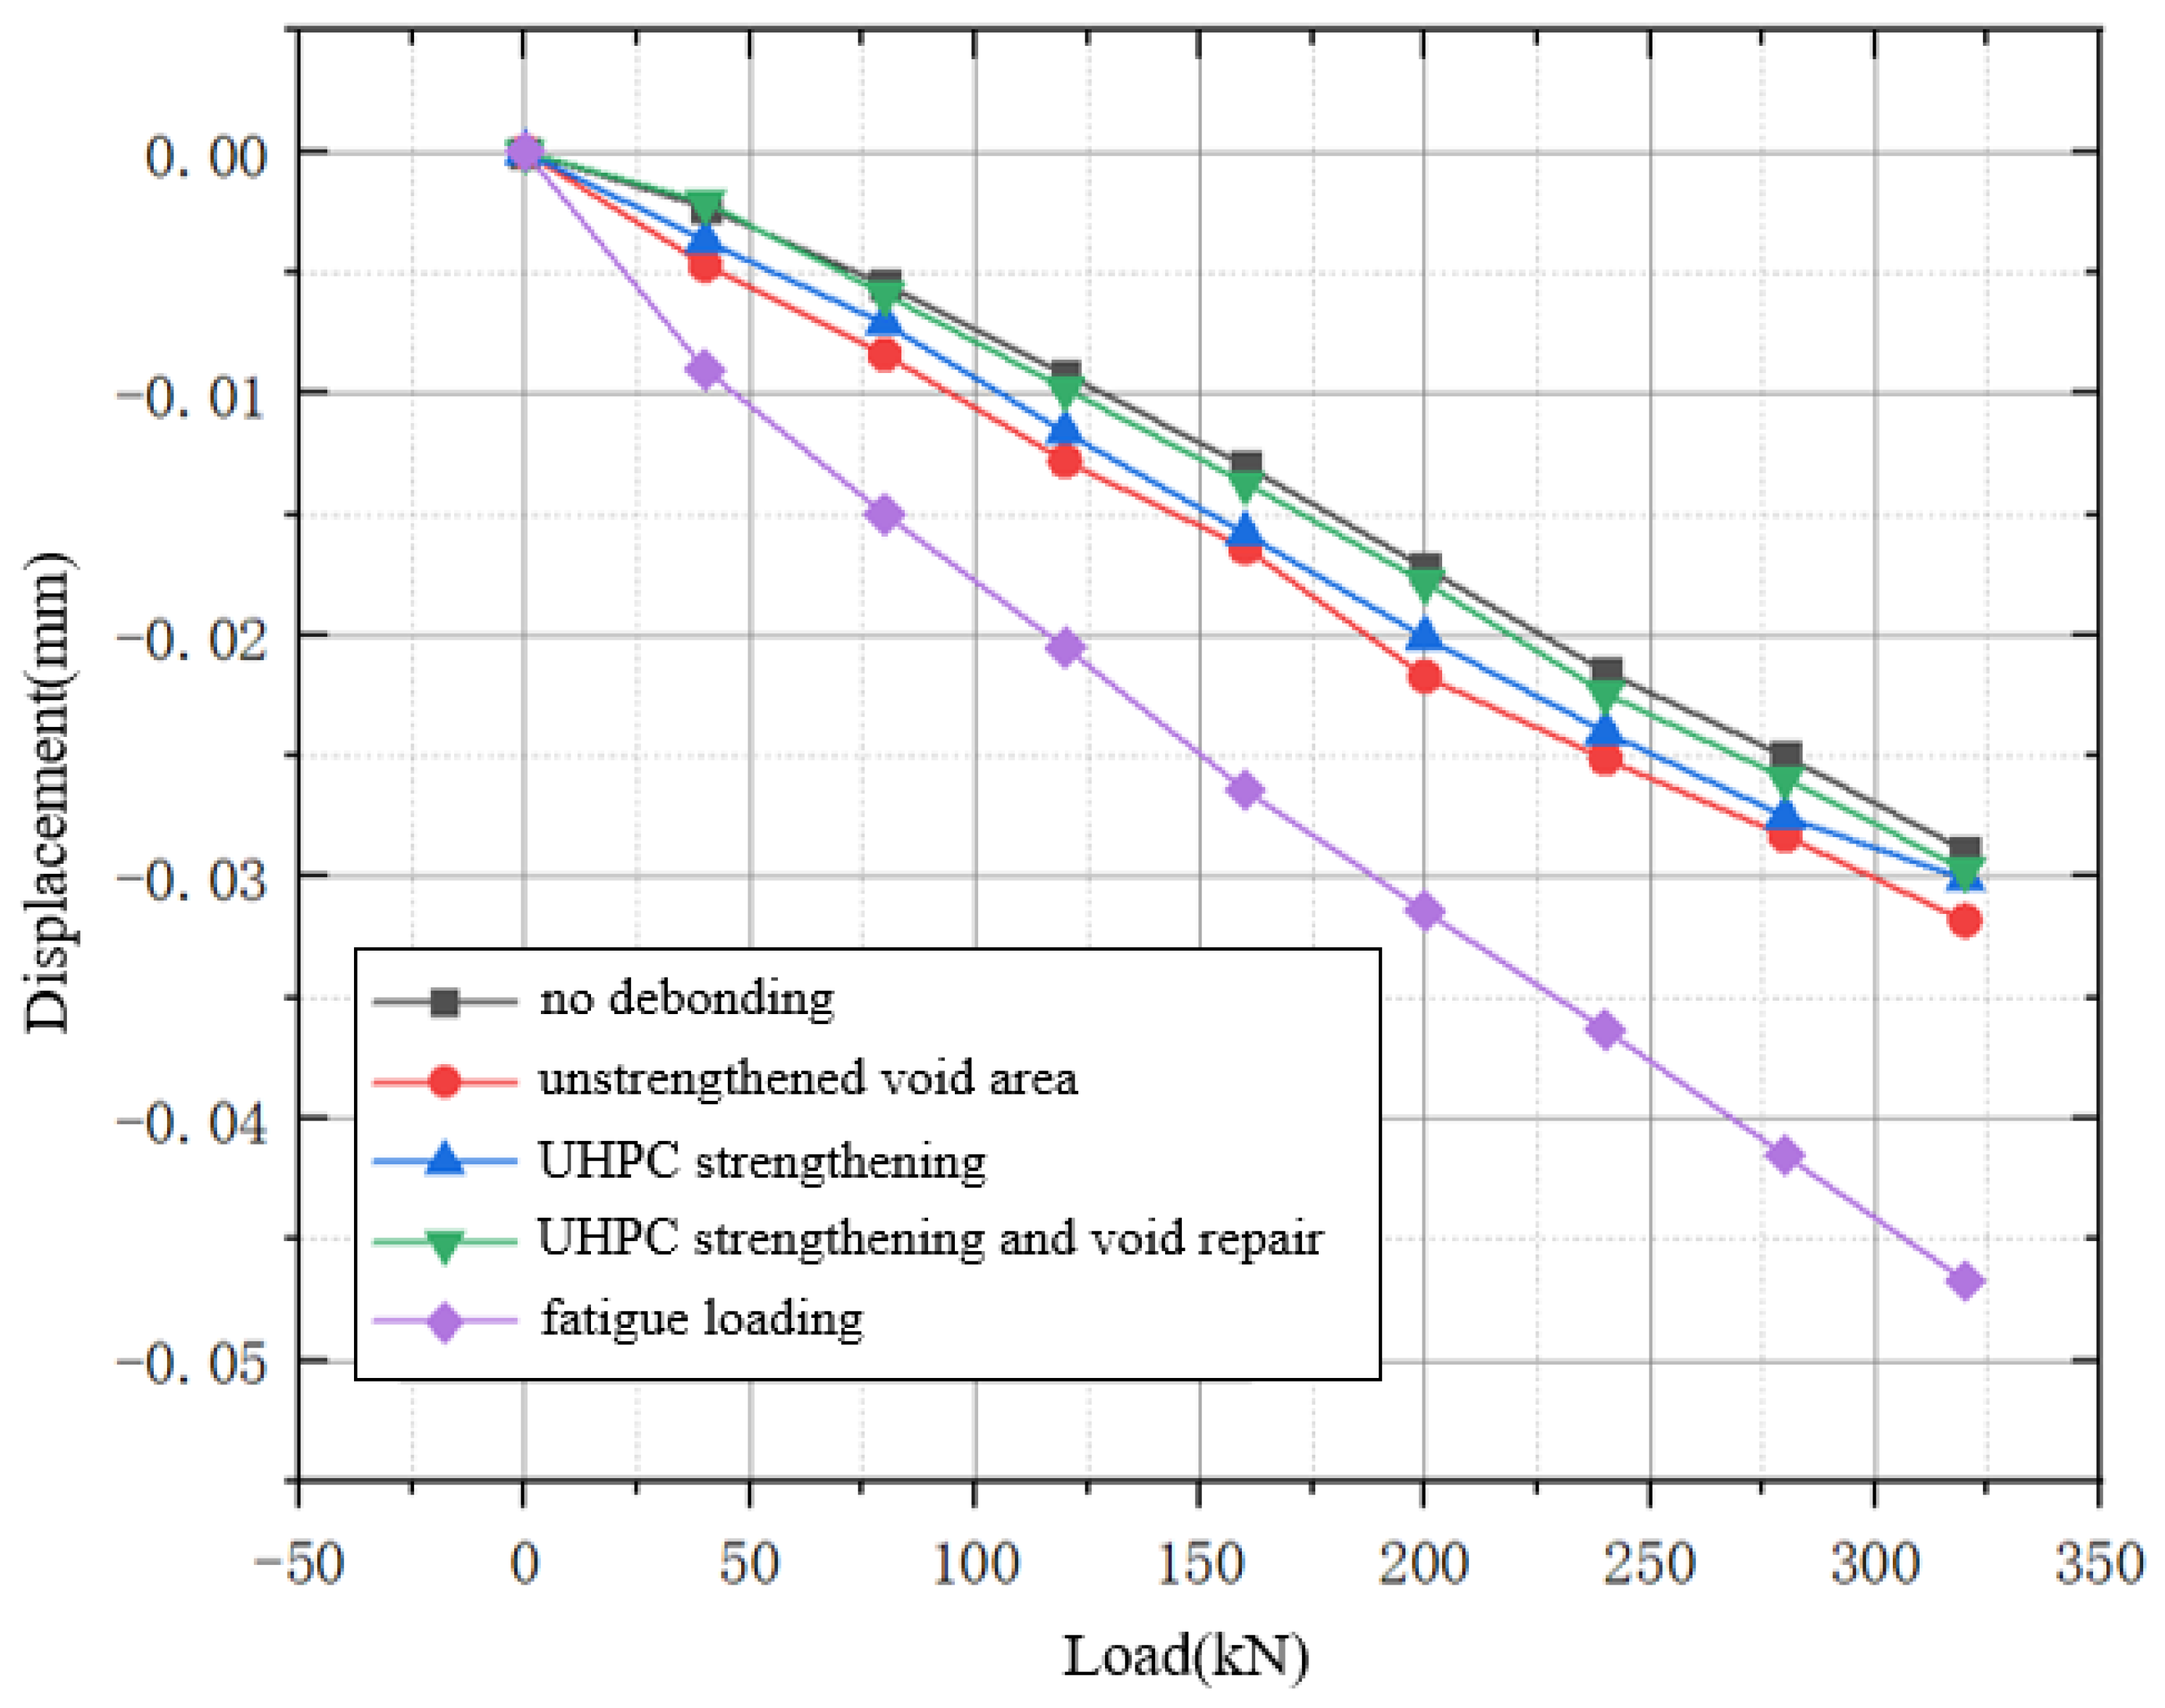
The displacement variations between the concrete transition segment and the steel structure under the conditions of no reinforcement, UHPC strengthening, and UHPC strengthening + void repair are shown in Figure 10. It can be observed that the displacement after UHPC void repair was the smallest, followed by the displacement after UHPC strengthening. This suggests that the void repair had a significant effect on the interface bonding performance between the concrete and the steel. As the load increased, the displacement between the concrete and the steel remained in the elastic stage, with a linear increase. Under a static load of 320 kN, the relative displacement change was kept within 0.01 mm.
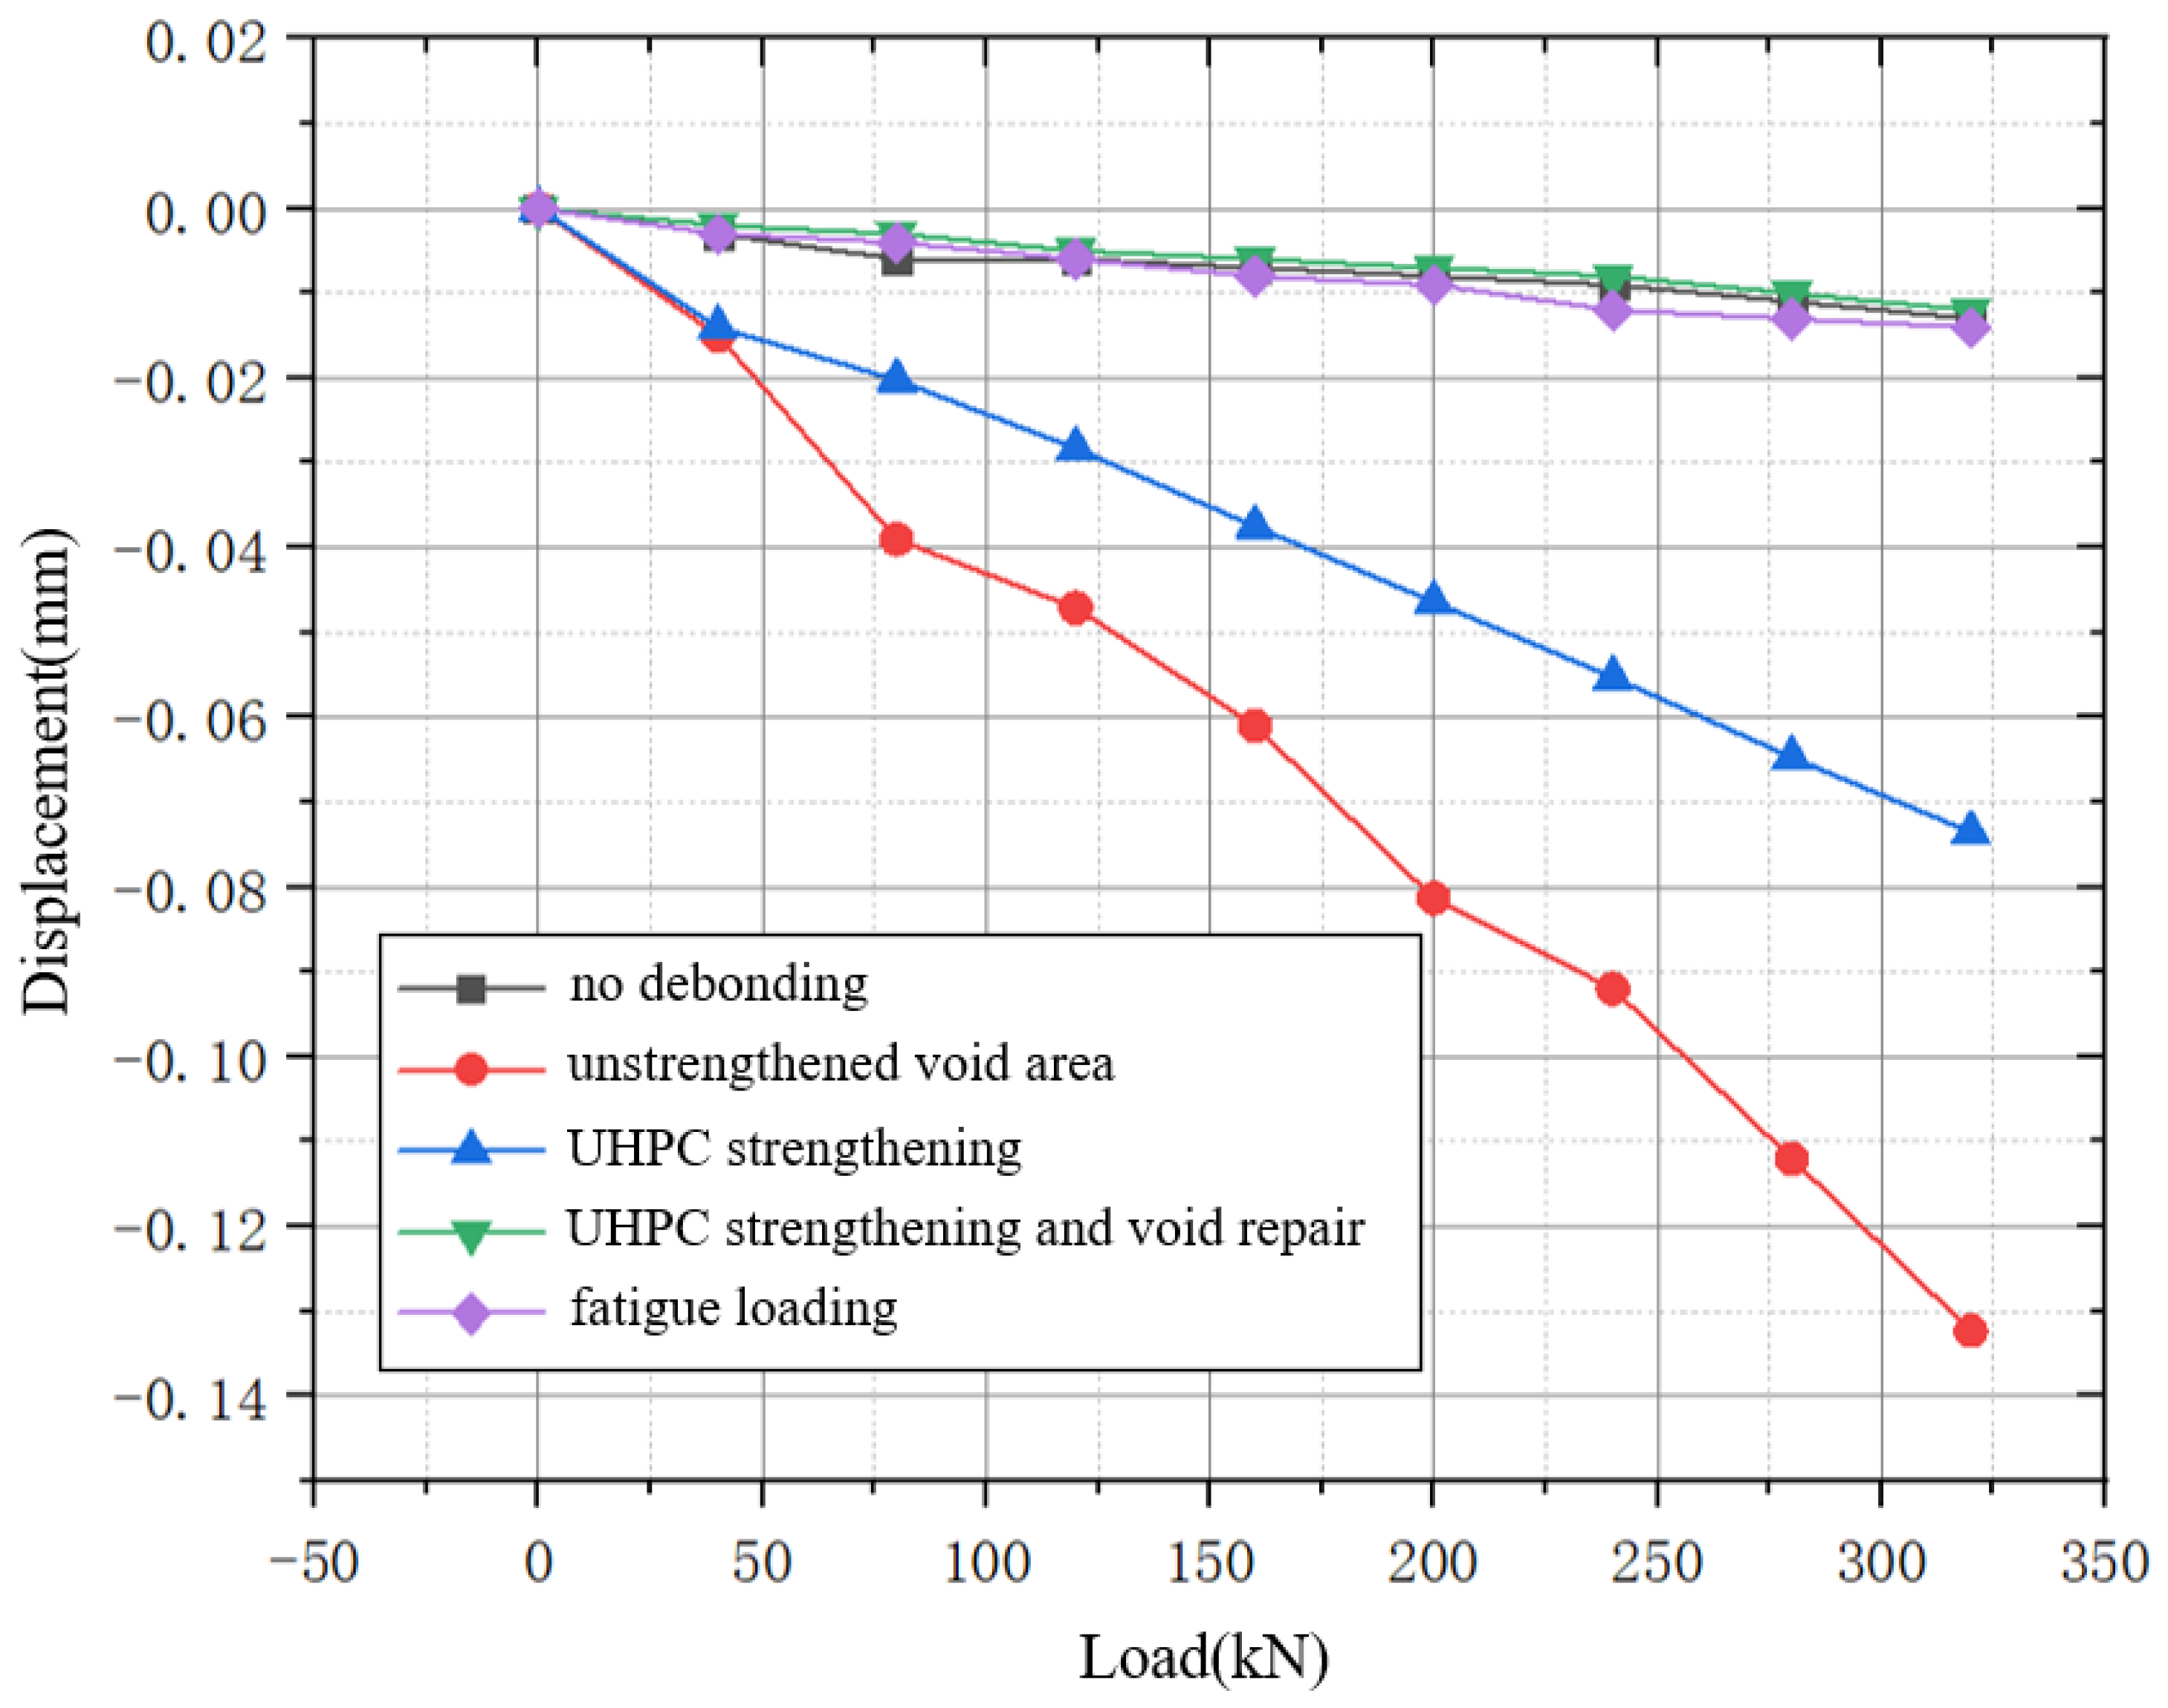
The displacement variations between the concrete transition segment and the bottom concrete ring under the conditions of no reinforcement, UHPC strengthening, and UHPC strengthening + void repair are shown in Figure 11. It can be observed that external UHPC strengthening played a role in suppressing the separation displacement of the structure. As the static cyclic number and load gradually increased, the separation displacement between the concrete transition segment and the bottom concrete ring increased. Compared to the unreinforced group, the relative displacement between the transition segment and the bottom ring after UHPC strengthening decreased by 0.06 mm (46.2%), while the relative displacement after UHPC strengthening + void repair decreased by 0.13 mm (96%). The results indicate that UHPC strengthening can suppress the relative displacement between the transition segment and the bottom ring, and that improved bottom compaction could more effectively reduce this relative displacement.

3.3. Results of DIC Strain Field

3.3.1. The Static Strain Field Before UHPC Strengthening

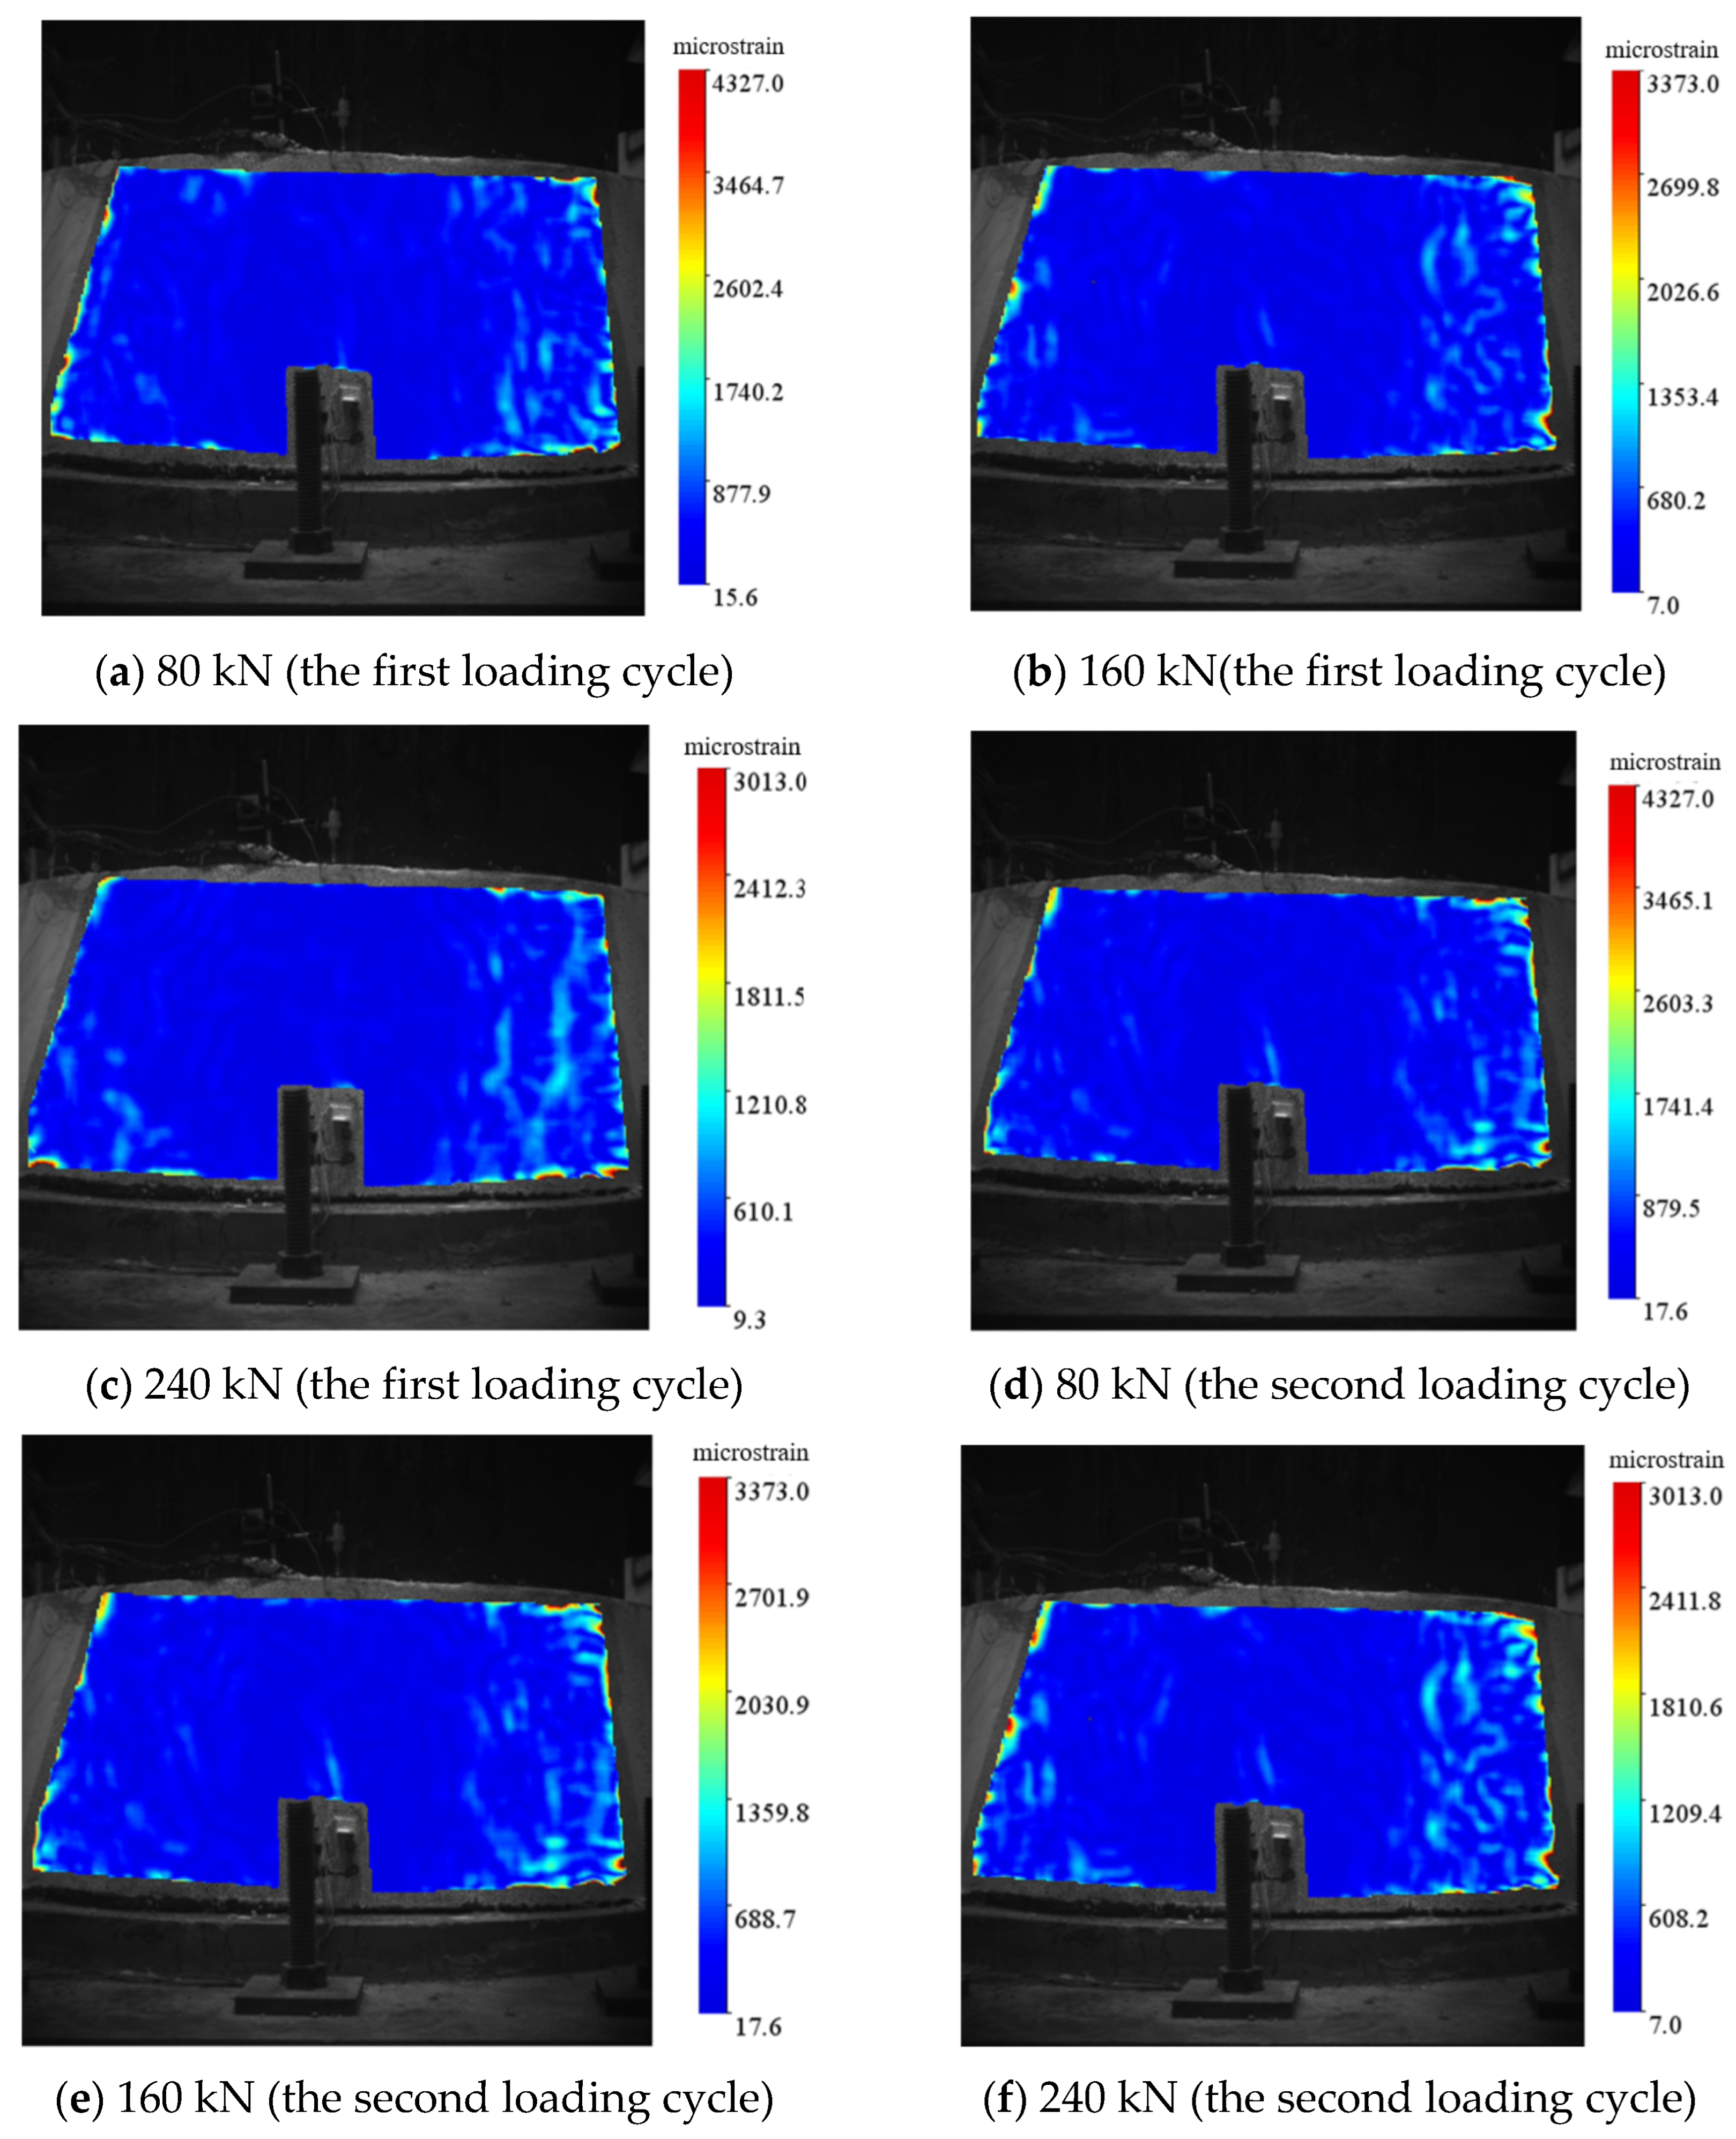
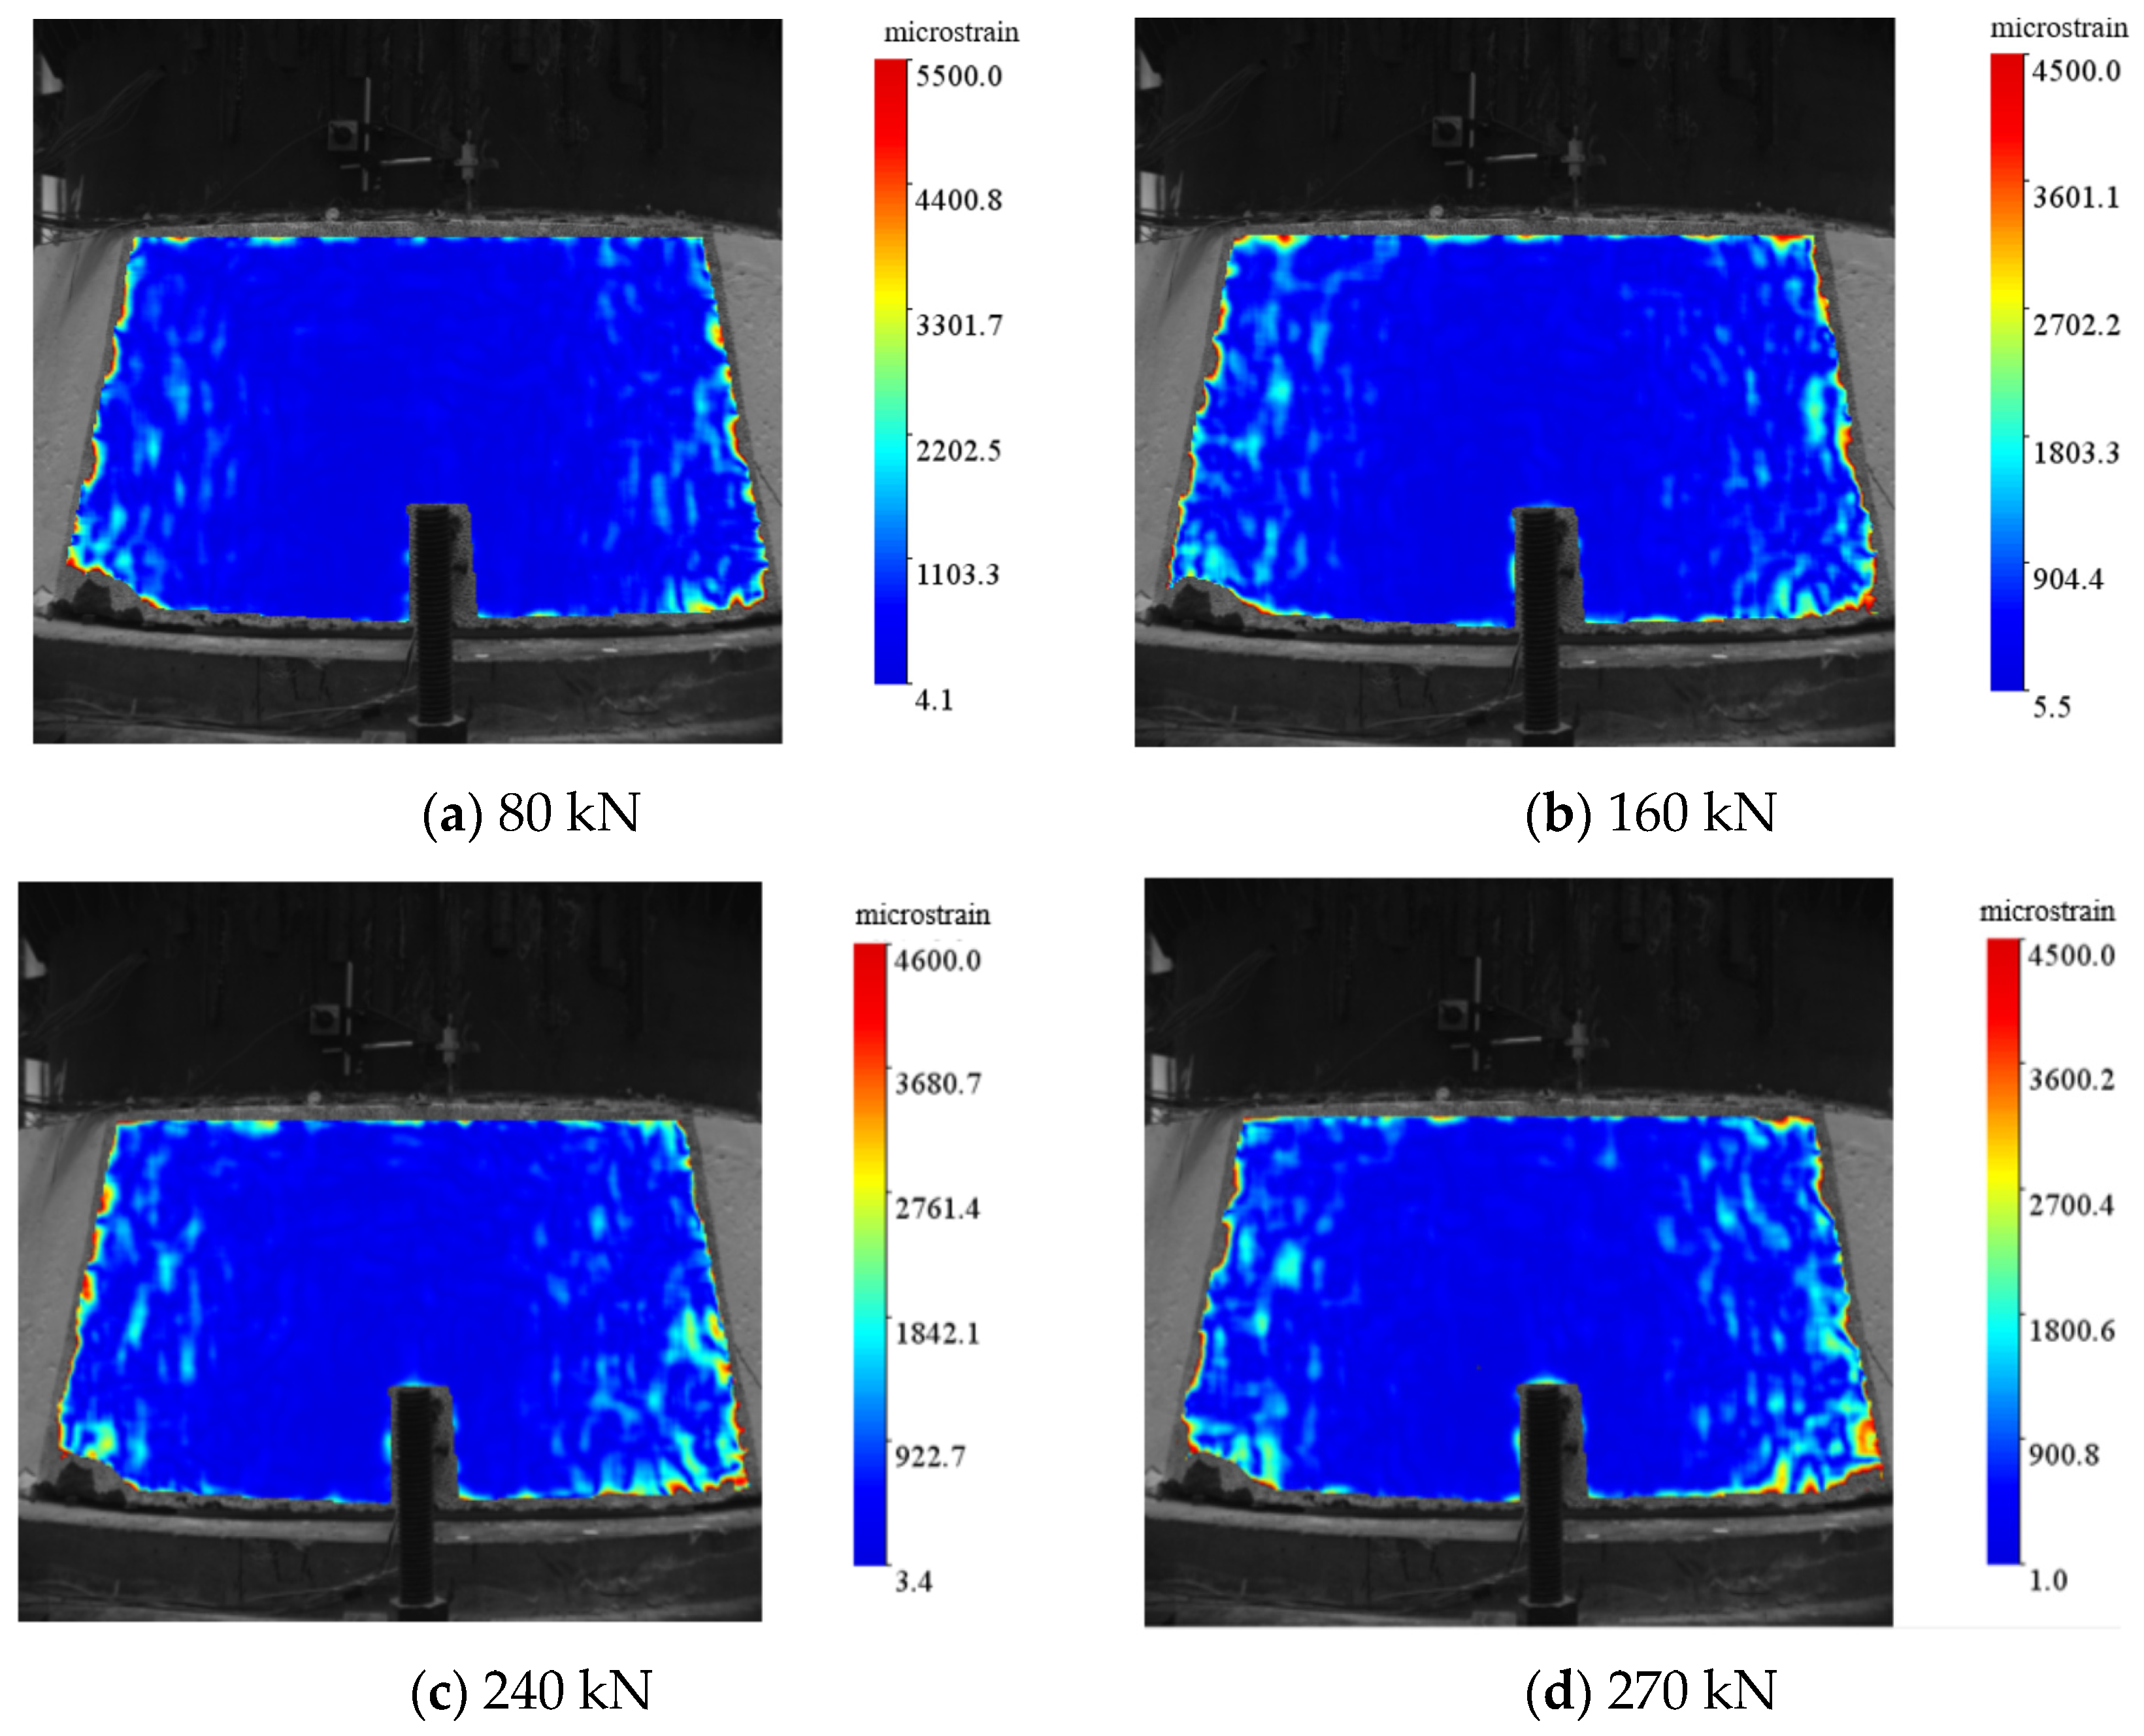
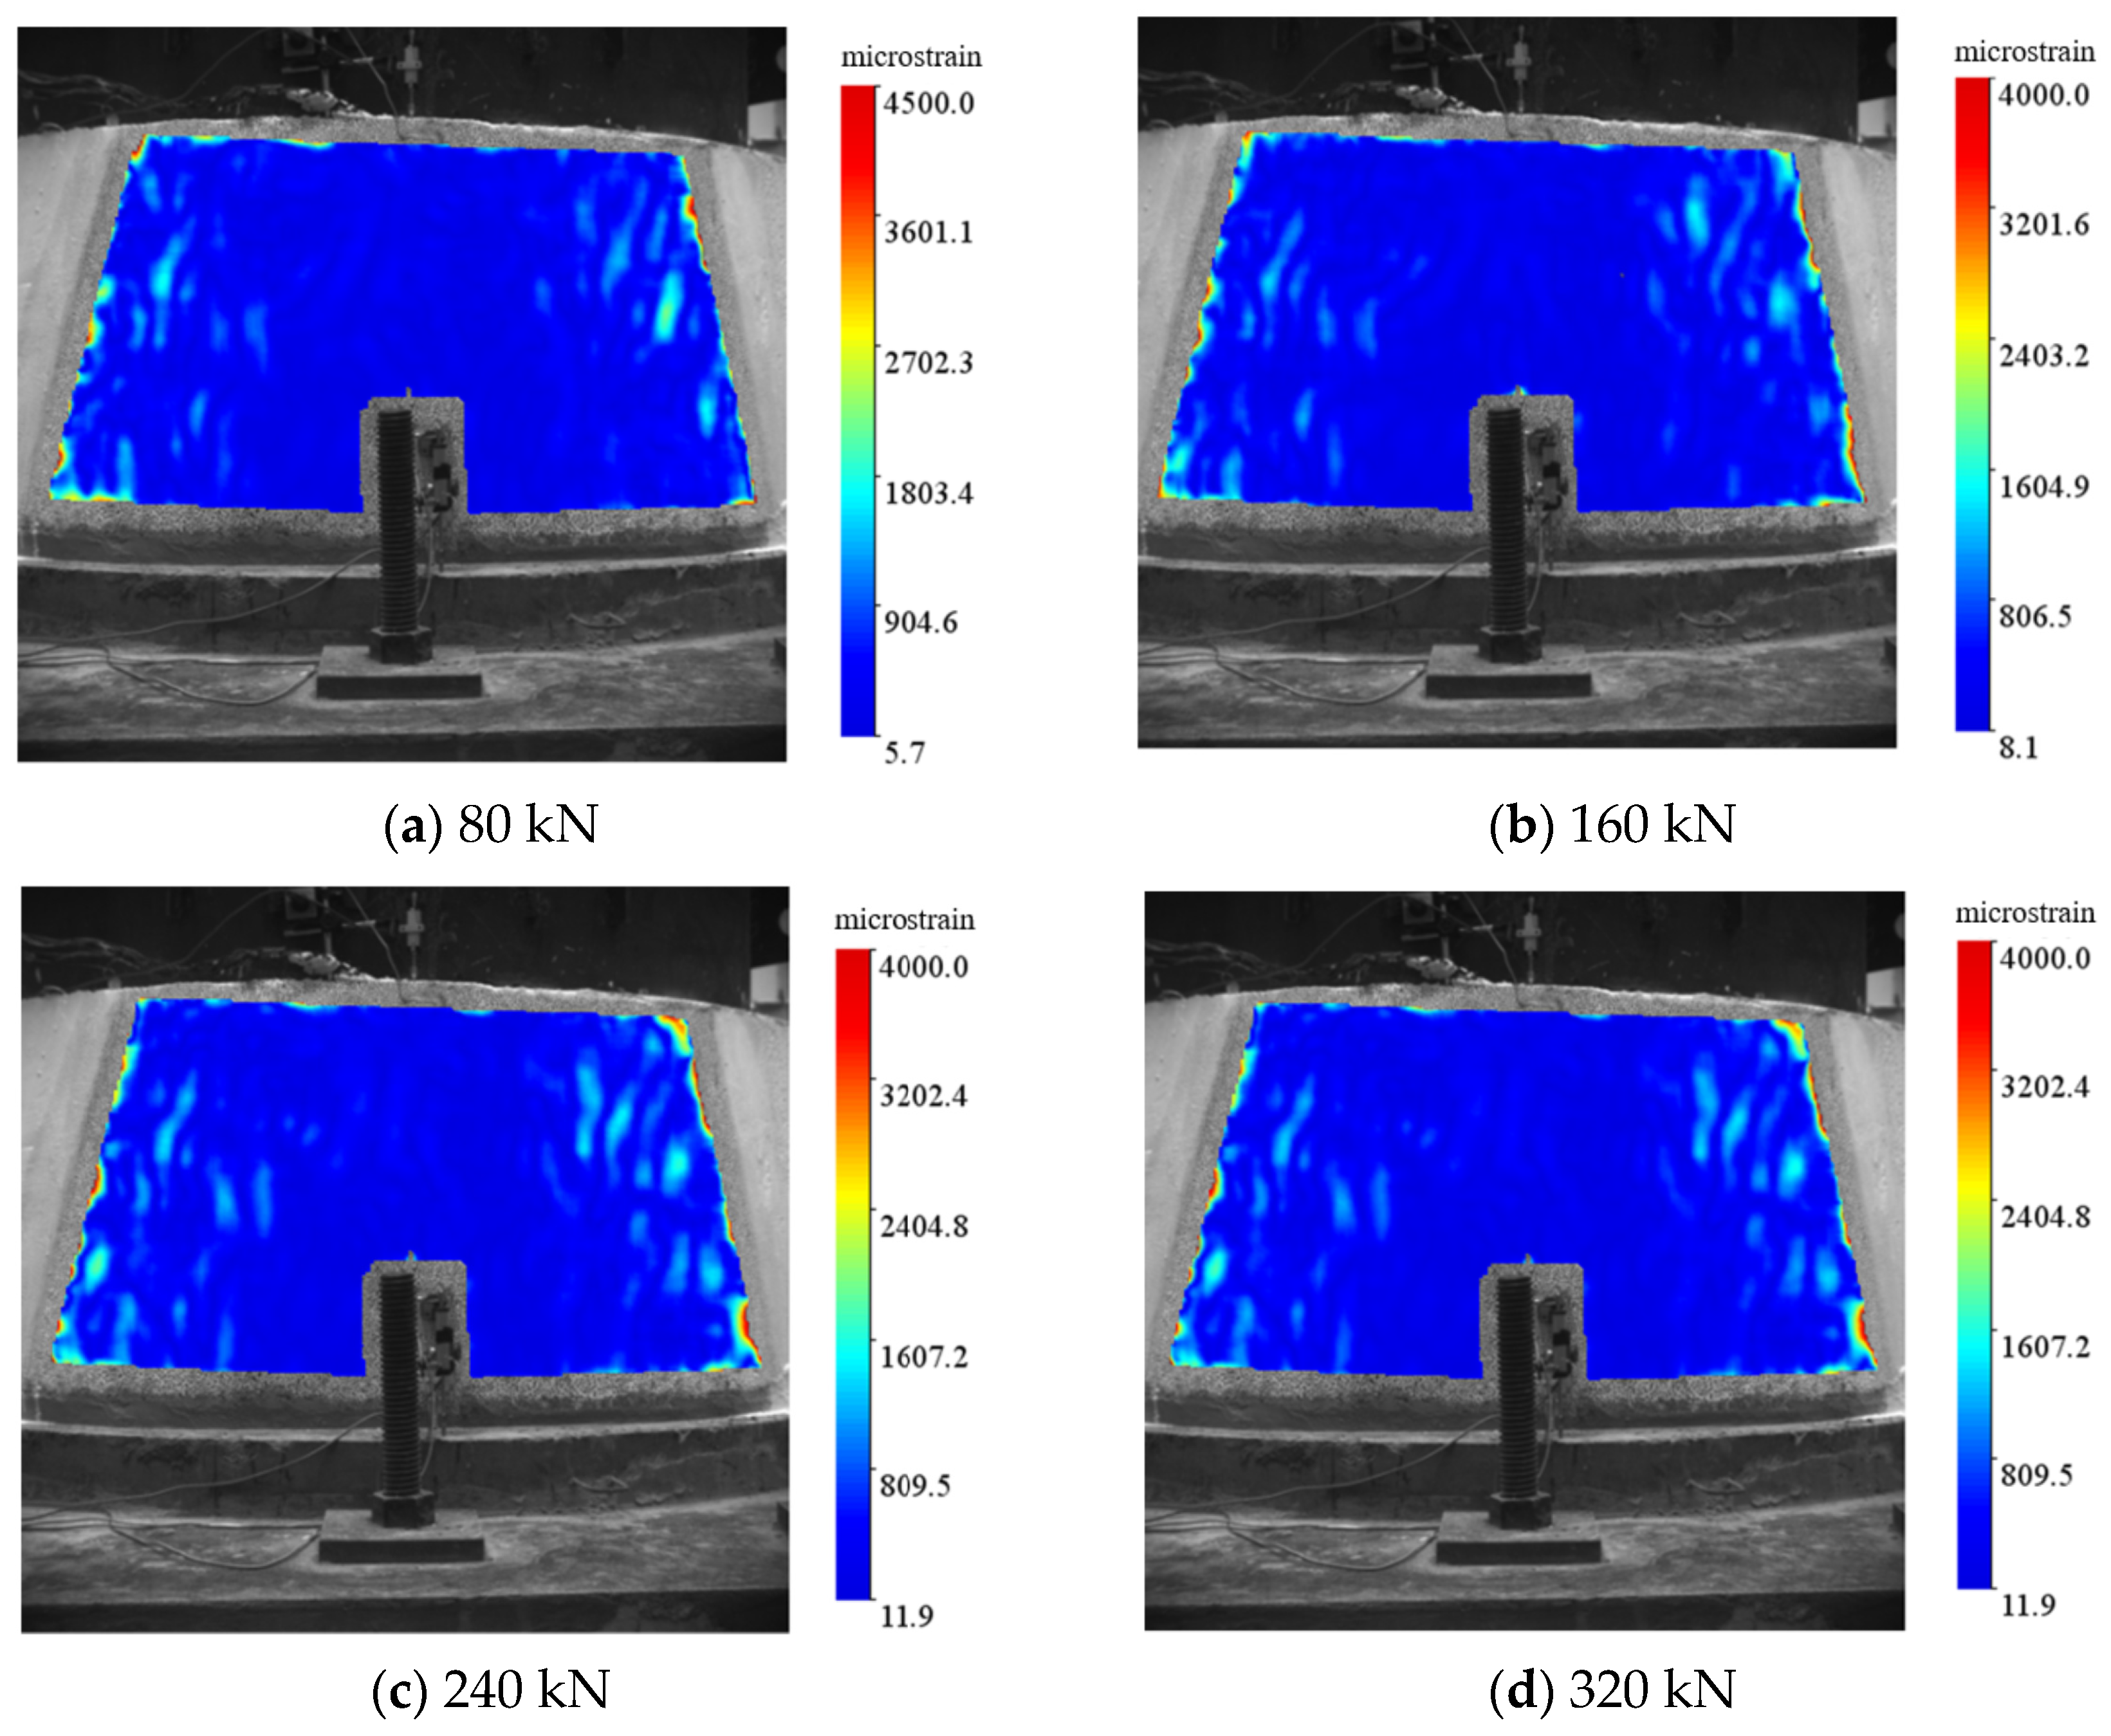
The strain contours on the surface of the concrete transition segment in the voided area under static load conditions of 80 kN, 160 kN, 240 kN, and 270 kN before the external UHPC reinforcement are shown in Figure 12. As seen in the figure, under static loading, the strain distribution on the surface of the transition segment was relatively uniform. As the load increased from 0 kN to 270 kN, the compressive strain in the left area increased by 149, and it continued to increase with the load, showing a positive correlation between load and strain. This indicates that the stress distribution on the entire transition segment was relatively uniform under static loading. The strain at the upper edge of the voided area was larger, which might be due to slight spalling occurring at the upper edge of the voided area during the loading process.

3.3.2. Strain Field of UHPC-Strengthened Damaged Transition Segment Under 0.3 P Static Cyclic Loading

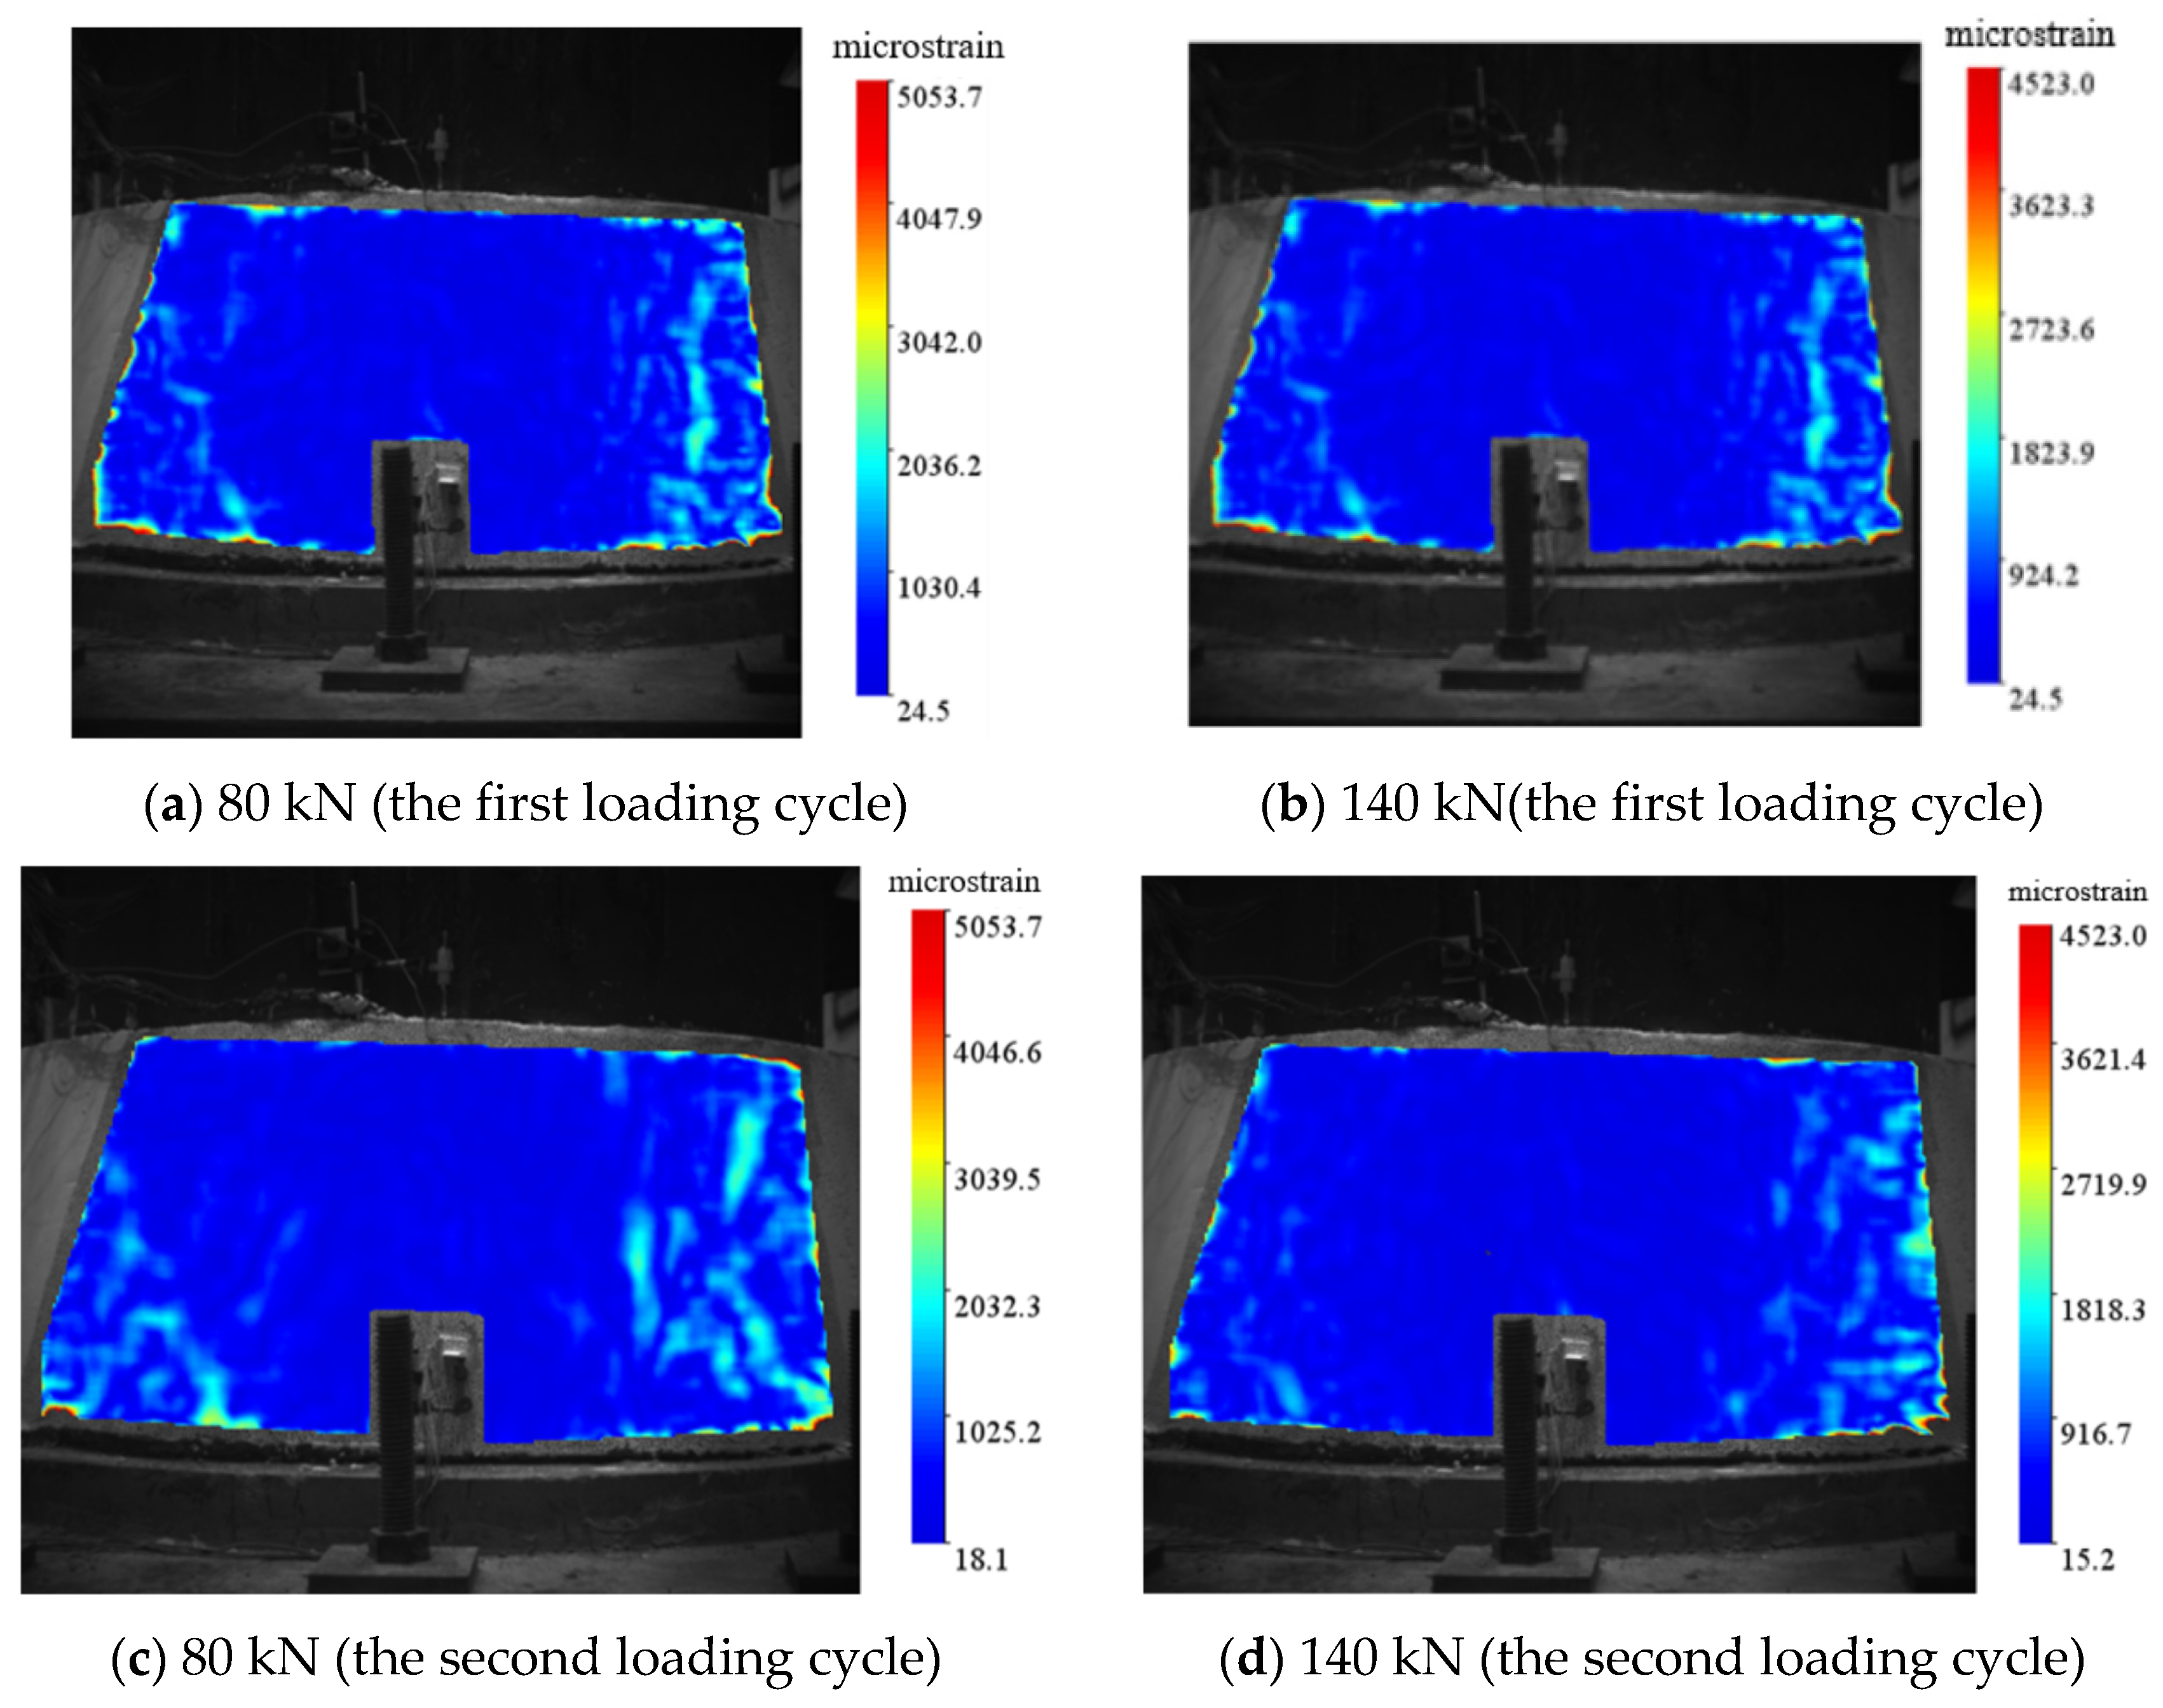
After the application of external UHPC reinforcement, the strain contour maps of the surface on the void side of the concrete transition segment under static loads of 80 kN and 140 kN are shown in Figure 13. During the first cycle of 80 kN and 140 kN loading, the strain significantly decreased compared to before reinforcement. This can be attributed to the overall improvement in the performance of the transition segment after UHPC reinforcement, with cracks in the damaged concrete segment being suppressed. In other words, due to the external UHPC reinforcement, the overall crack resistance of the transition segment is enhanced, thereby increasing its strength and reducing strain. Additionally, the strain distribution area after reinforcement is noticeably smaller, primarily concentrated on both sides of the void area. When the first round of static loading increases from 40 kN to 320 kN, compressive strains of 152, 149, and 173 are observed at the top transverse crack, left-side diagonal crack, and right-side diagonal crack, respectively. Compared to the pre-UHPC reinforcement, the increase in strain is significantly reduced, and the strain distribution in the middle area is notably smaller. This indicates that the external UHPC reinforcement can significantly enhance the overall performance of the transition segment. The strain increases with the number of static cycles, suggesting that the concrete transition segment with external UHPC reinforcement remains in the elastic stage.

3.3.3. Strain Field of UHPC-Strengthened Damaged Transition Segment Under 0.5 P Static Cyclic Loading

After external UHPC reinforcement, under the 0.5 P static cycle, as shown in Figure 14, the strain increases with the number of static cycles. There is a noticeable concentration of strain at the edges, primarily concentrated on both sides. This may be a result of the void at the bottom of the concrete transition segment, leading to a sudden change in stiffness at the void endpoint side of the transition segment, which causes stress concentration. After external UHPC reinforcement, the high-strain areas are mainly concentrated on both sides of the void, and the high-strain region has been partially suppressed. The compressive strain increases by no more than 50 microstrain in each static loading cycle. For other load conditions, a similar trend to the 0.3 P static cycle can be observed, with the load and strain being roughly positively correlated.

3.3.4. Strain Field of UHPC-Strengthened Damaged Transition Segment Under 0.8 P Static Cyclic Loading

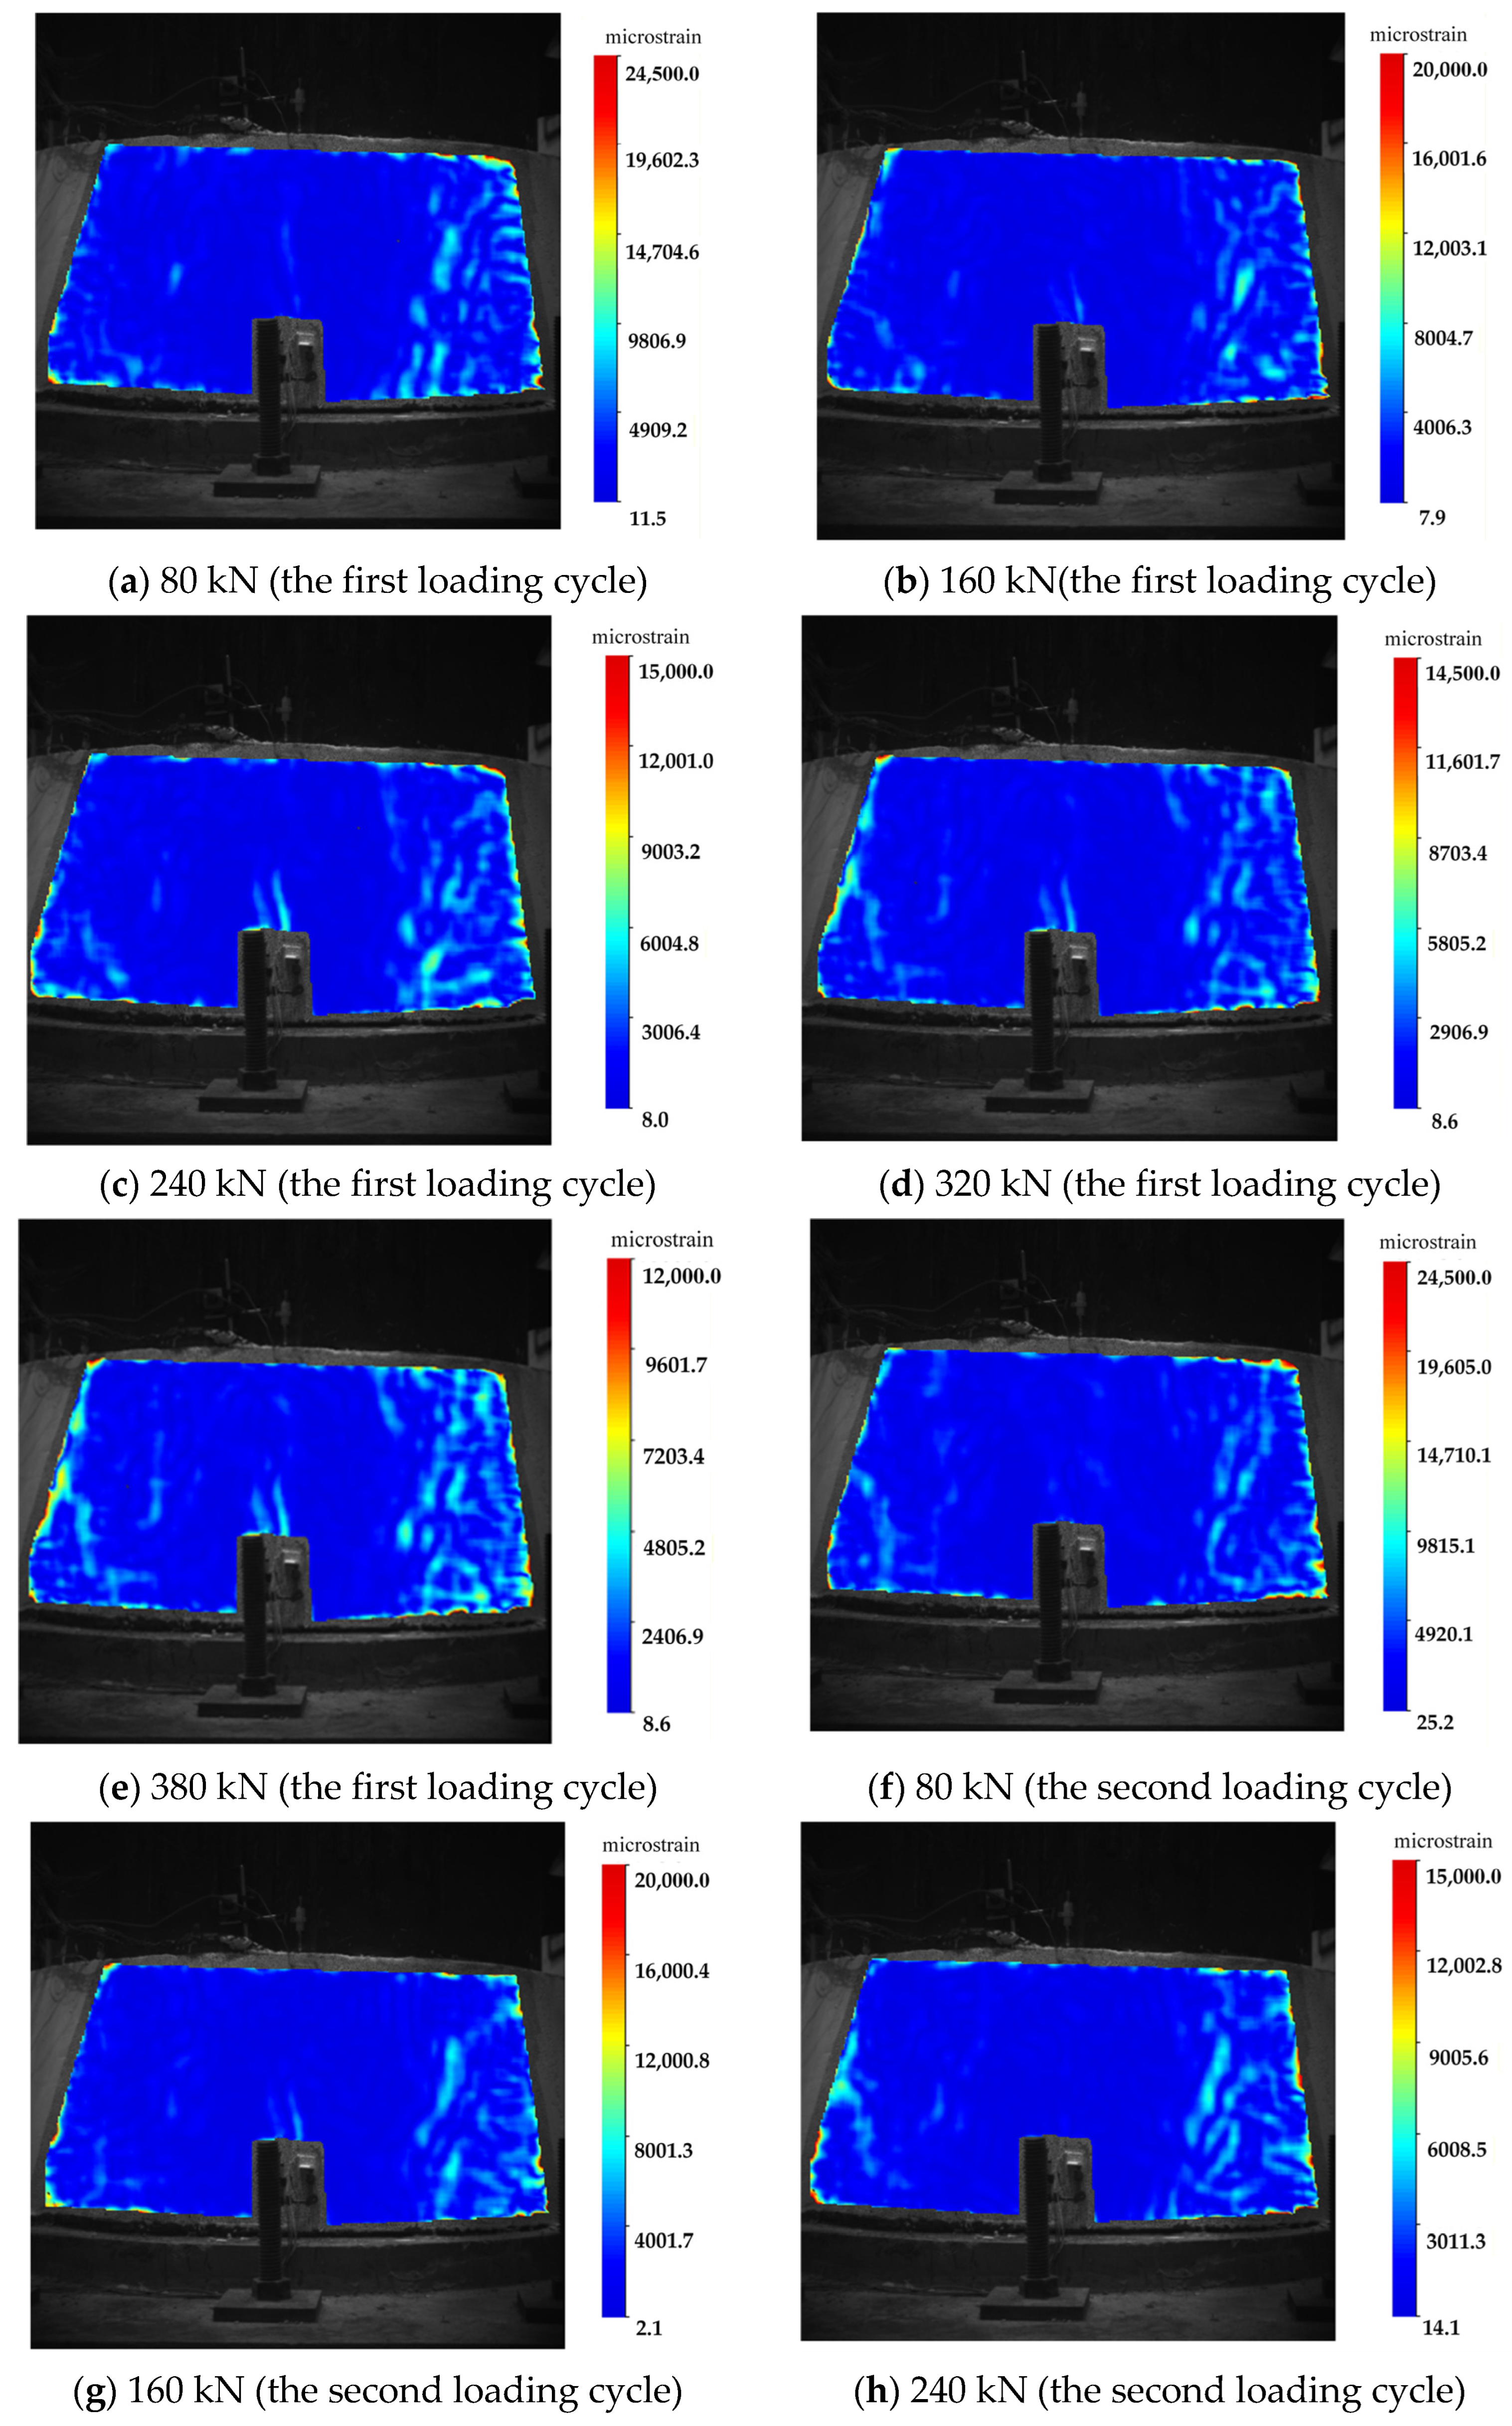
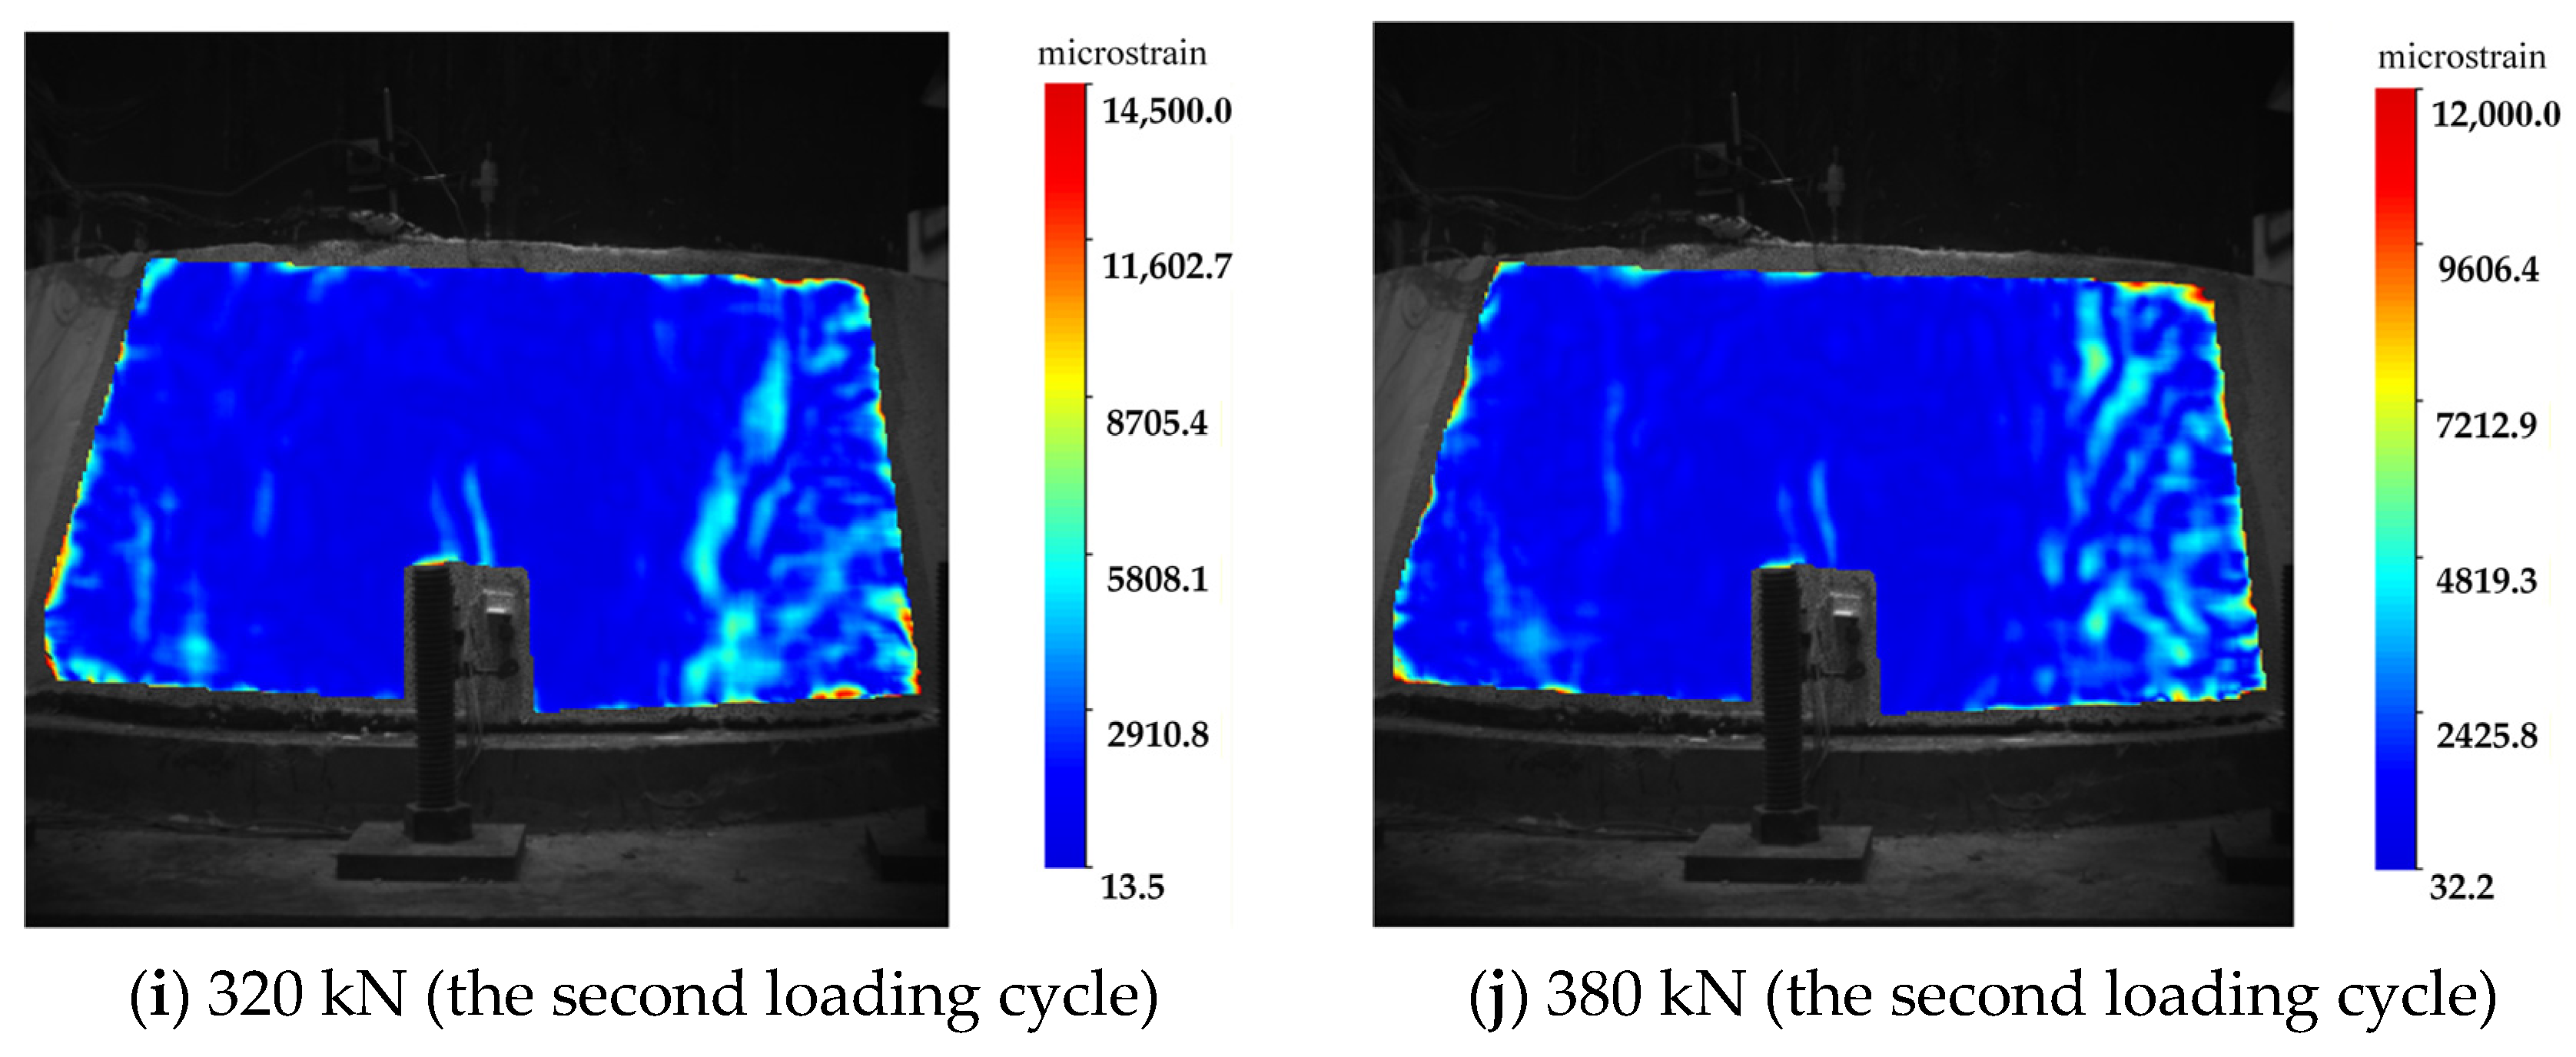
After external UHPC reinforcement, under the 0.8 P static cycle, as shown in Figure 15, the strain significantly decreased compared to before the UHPC reinforcement. In the first round of loading, the left-side high-strain area experienced a compressive strain of 363, and the right-side high-strain area had a compressive strain of 349. By comparing the strain contour maps of the first and second rounds at 320 kN and 380 kN static loading, it can be observed that when the load reaches 380 kN, the areas of strain concentration increase and begin to spread toward the center of the measurement points. This may be due to the increase in load, which causes the surface area of the transition segment used to disperse stress to gradually expand, thereby reducing local stress concentration.

3.3.5. Analysis of DIC Results for Void Repair

After void repair in the UHPC-strengthened transition segment, as shown in Figure 16, the strain was observed to increase with load, while its magnitude and concentration zones were significantly reduced compared with the pre-repair condition. The strain was mainly concentrated at the outer edges of the monitored region and became more uniformly distributed. As the load increased from 0 to 320 kN, compressive strains of 63 με, 76 με, and 85 με were recorded at the top transverse, left inclined, and right inclined locations, respectively, and the concentration region remained mainly near both sides of the former void. Compared with the void condition, the compressive strain after repair was markedly reduced, indicating that bottom compaction had a significant strengthening effect and confirming the effectiveness of the proposed method.

3.3.6. Analysis of DIC Results Under Different Operating Conditions

As shown in Table 6, the average strains at key points under a static load of 320 kN were compared among three cases: un-strengthened specimens, UHPC-strengthened specimens, and UHPC-strengthened specimens with void repair. Compared with the un-strengthened case, the average strain decreased from 312 to 74 after external UHPC strengthening, representing a reduction of 76.2%. When UHPC strengthening was combined with bottom void repair, the average strain further decreased to 42, corresponding to an overall reduction of 86.5%, while the strain distribution became significantly more uniform. In addition, after fatigue loading exceeding an equivalent of 1.15 million design load cycles, the cumulative increase in strain amplitude at key points of the UHPC-strengthened and void-repaired specimens was only about 8%, and the interface displacement change was less than 0.02 mm, indicating excellent fatigue resistance and stiffness retention capacity.

4. Finite Element Analysis

4.1. Model Construction

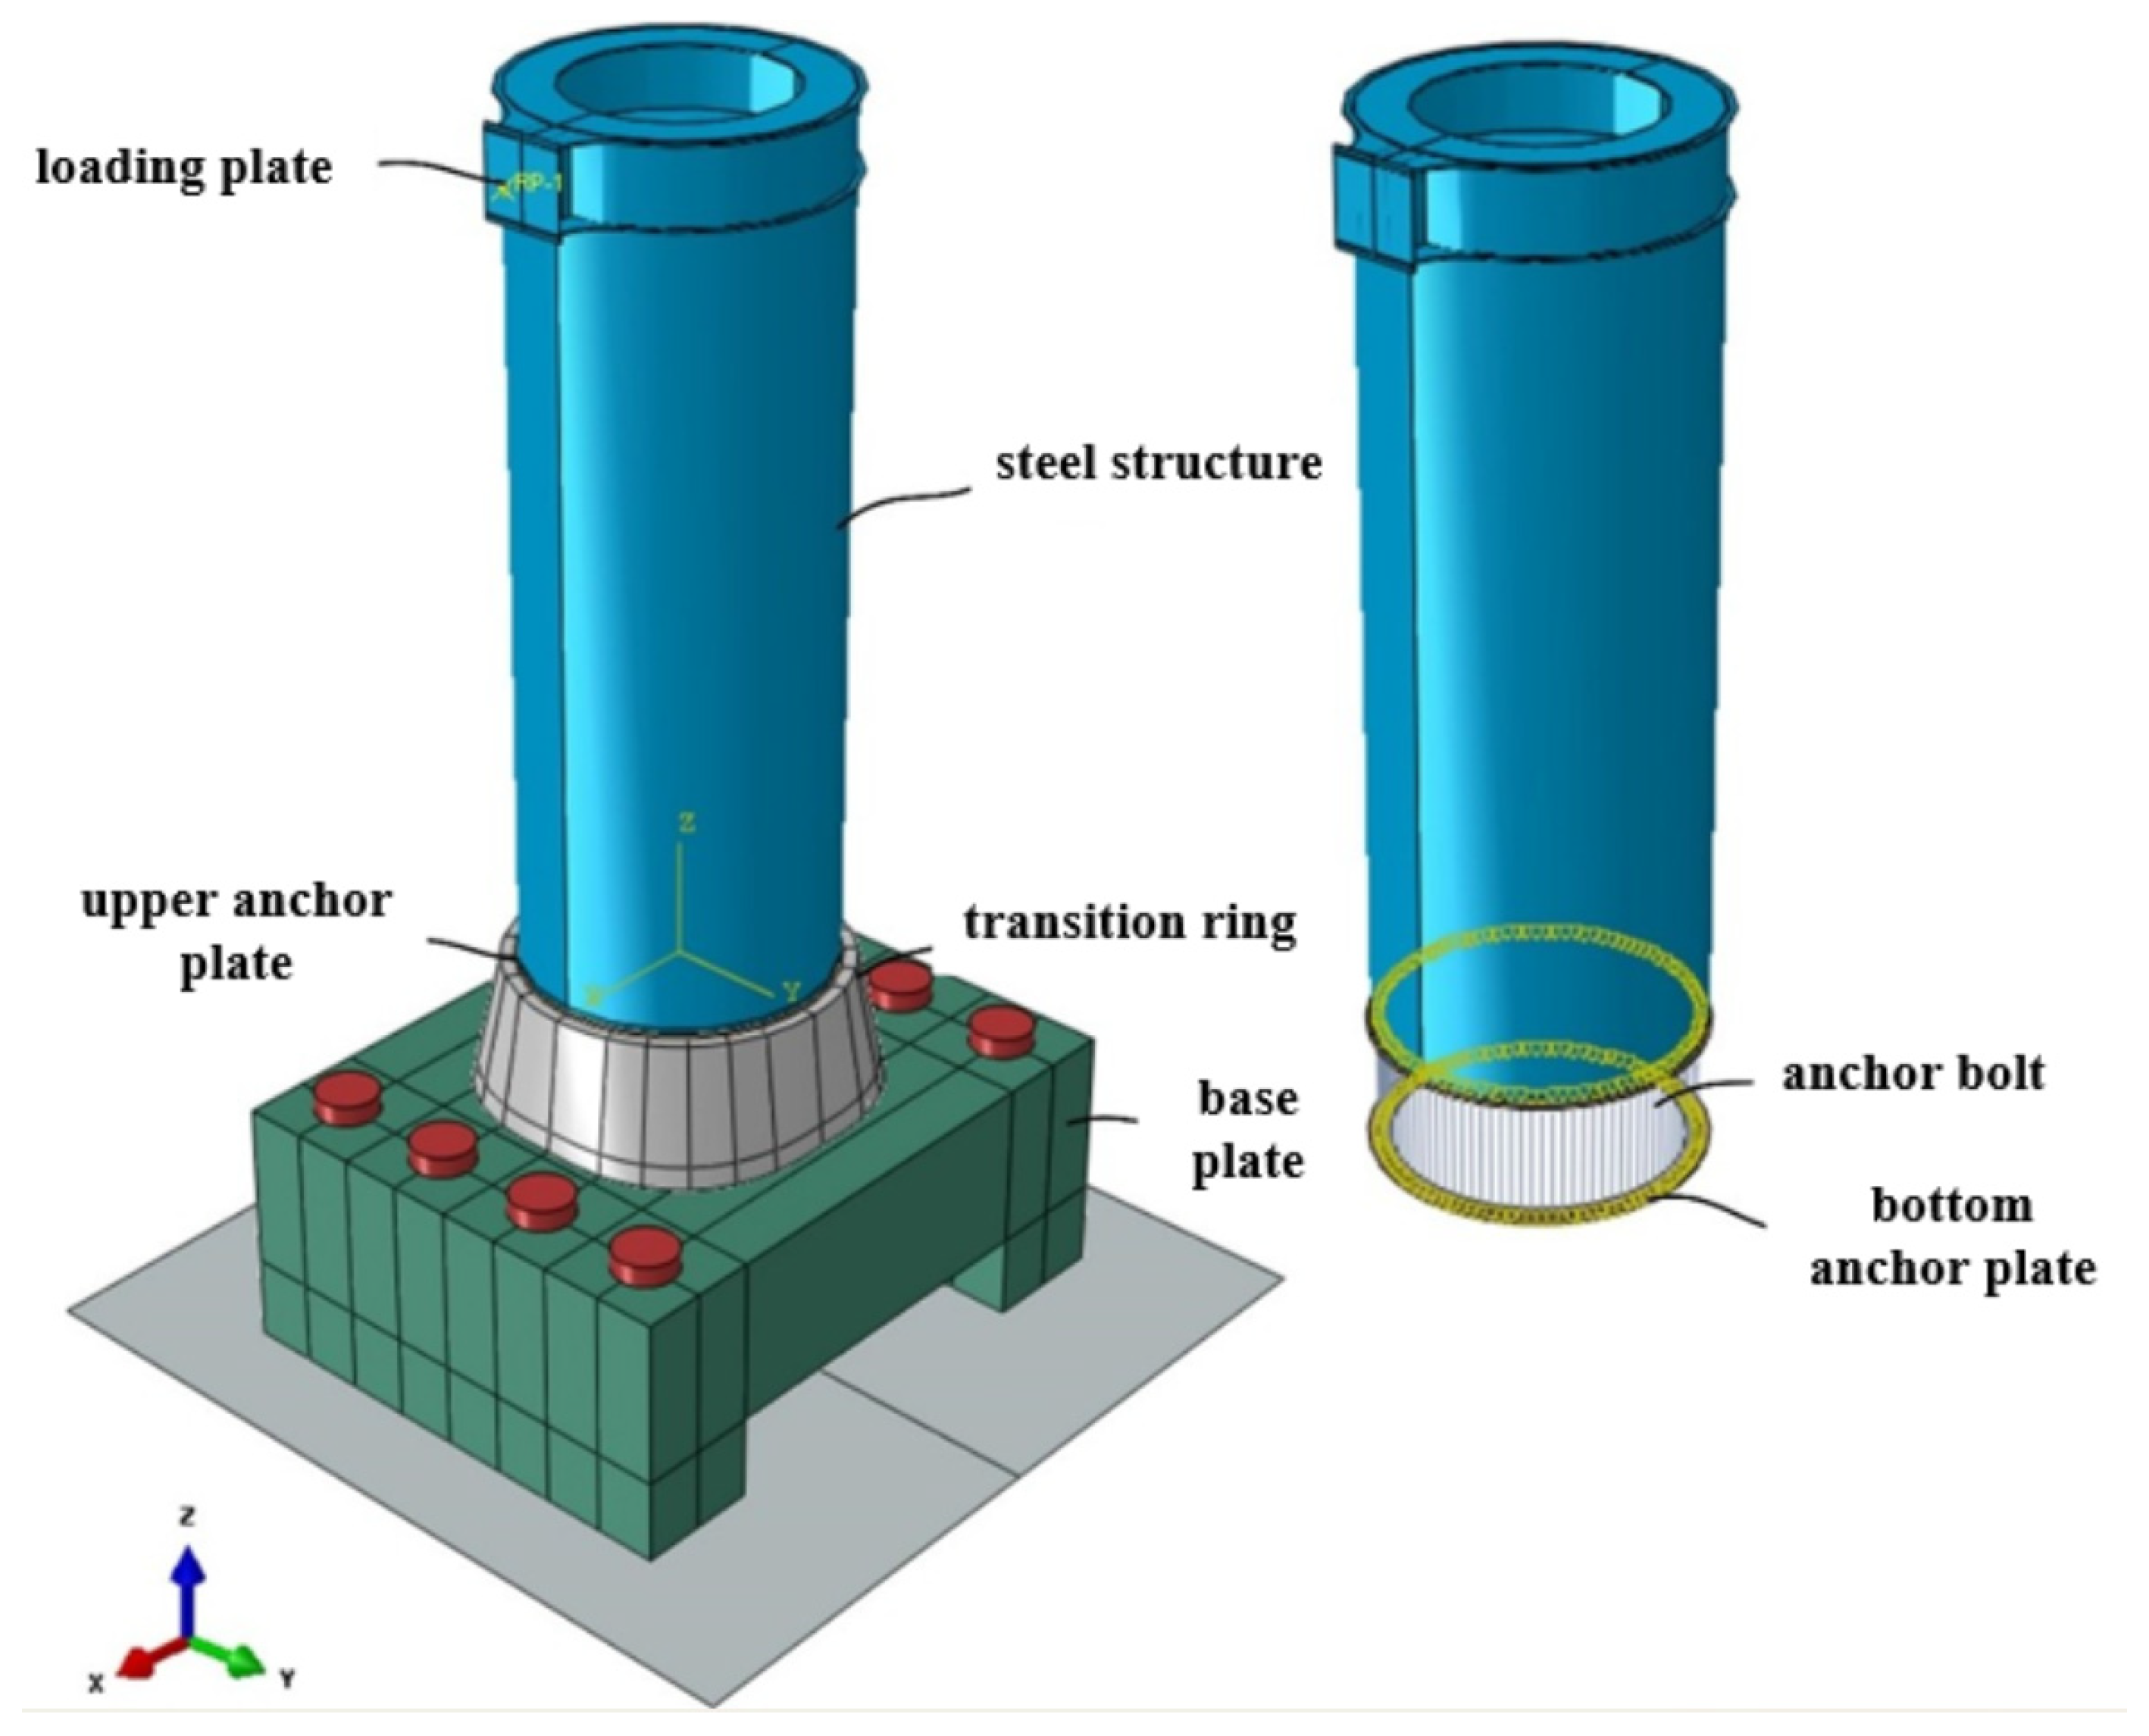
To verify the feasibility of the experimental design, a finite element model was established using ABAQUS to assist in the experimental design. In this model, concrete and steel components were simulated using C3D8R elements, while reinforcement and anchor bolts were simulated using B31 beam elements. The mesh size was 40 mm. The composition of the model is shown in Figure 17.
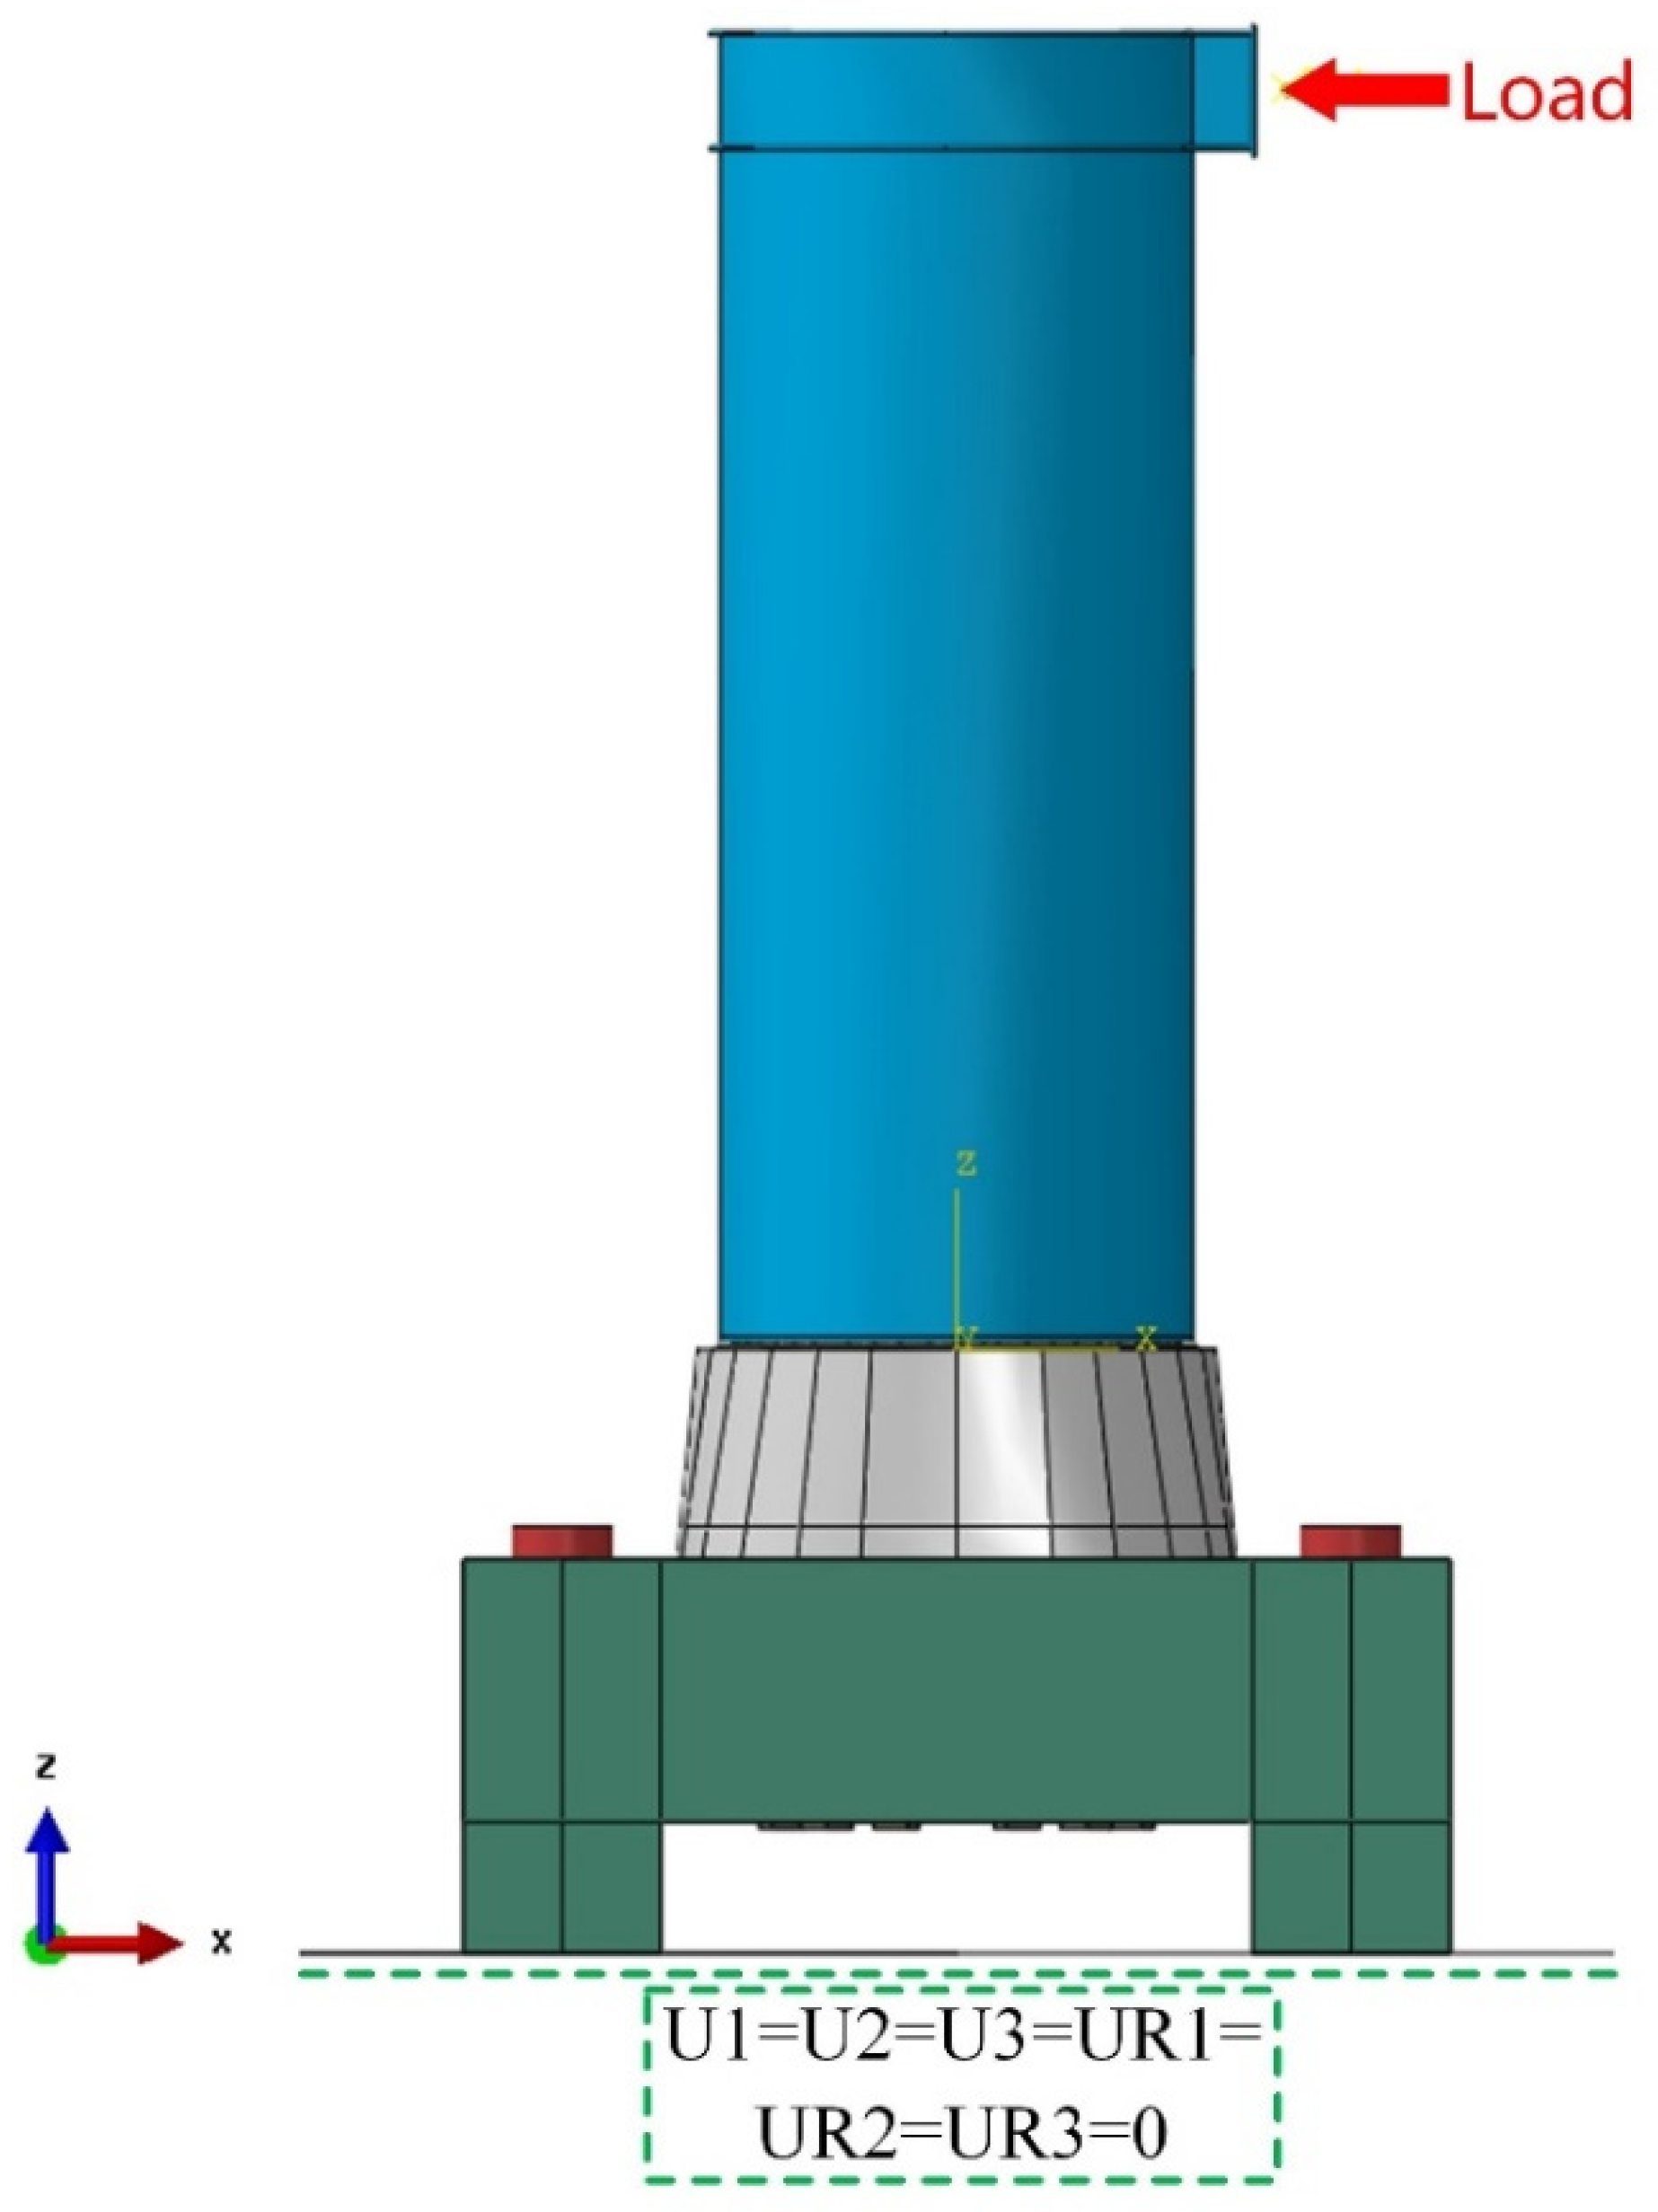
For the contact between the components of the transition segment, the actual contact behavior between components in the real engineering structure was referenced. Normal “hard contact” and tangential “penalty” functions were used between the steel structure, anchor plate, transition segment, and base. All adopt a contact relationship of normal hard contact and a tangential friction coefficient of 0.4 [36]. A tie constraint was applied between the anchor plate and anchor bolts. In addition, embedded constraints were used to embed the reinforcement into the transition segment. The load amplitude was applied using a smooth step curve. The boundary conditions of the finite element model are shown in Figure 18.
To accurately simulate the impact of the construction stage of the transition segment on the structural mechanical behavior, the structure loading was divided into three analysis steps. In the first analysis step, the prestress of the steel strands was applied. The prestress was simulated by applying a pressure load on the spacer, with a magnitude of 435.19 kN per strand. In the second analysis step, the prestress of the anchor bolts was applied. The bolt prestress was simulated using the temperature function in the predefined fields, with a magnitude of 258.67 kN per bolt. Finally, in the third analysis step, the external load was applied. The external load was applied by coupling a loading point on the loading platen and applying a concentrated force of 478 kN.

4.2. Constitutive Model

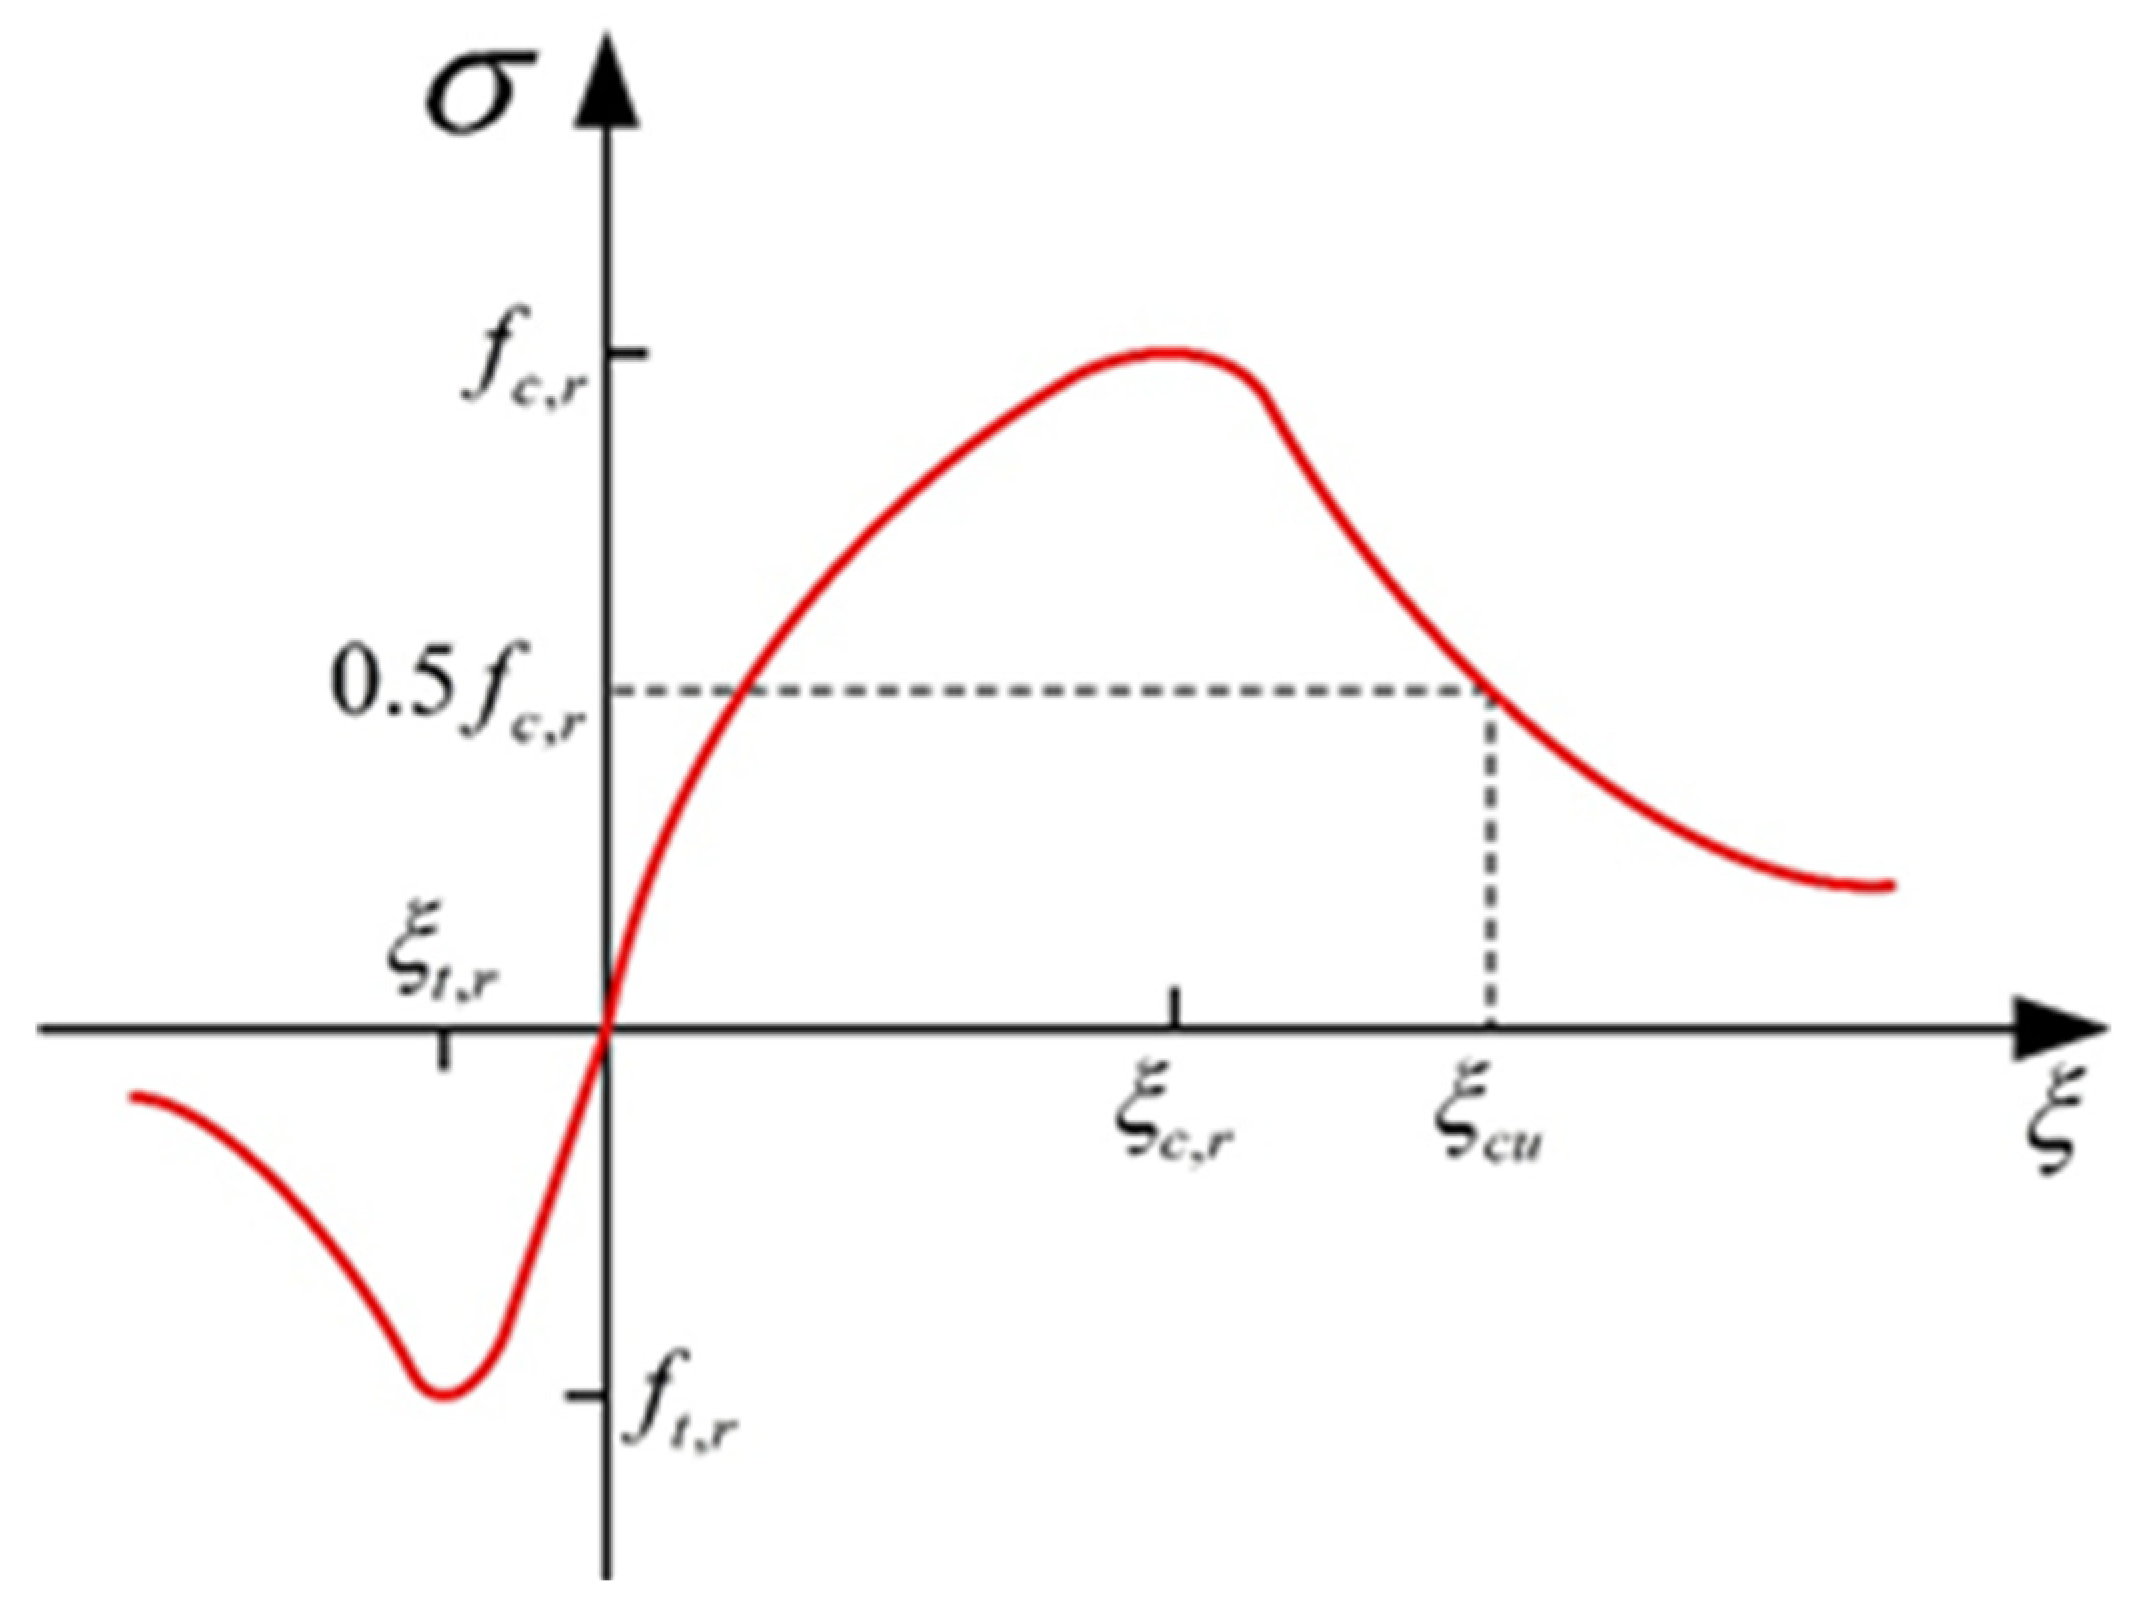
Since the focus of the analysis was on the transition segment and the stress on the steel components under operational loads did not exceed the yield strength, a verification model for the base concrete under the ultimate load was established before modeling. The model’s calculation results showed that the base had a high safety margin. Therefore, for computational efficiency, both the steel components and the base concrete were modeled using elastic models. The transition segment concrete damage model was simulated using a damage model, and the concrete constitutive model was based on the uniaxial tension and compression constitutive model for concrete in the GB 50010-2010 [37]. The concrete damage plasticity model CDPM [38] was used to model concrete elements to simulate the plastic damage of concrete during continuous loading accurately. Table 7 illustrates the concrete plastic model parameters recommended by Abed et al. [39]. The model curve is shown in Figure 19.

4.3. Damage Results of the Transition Segment Model

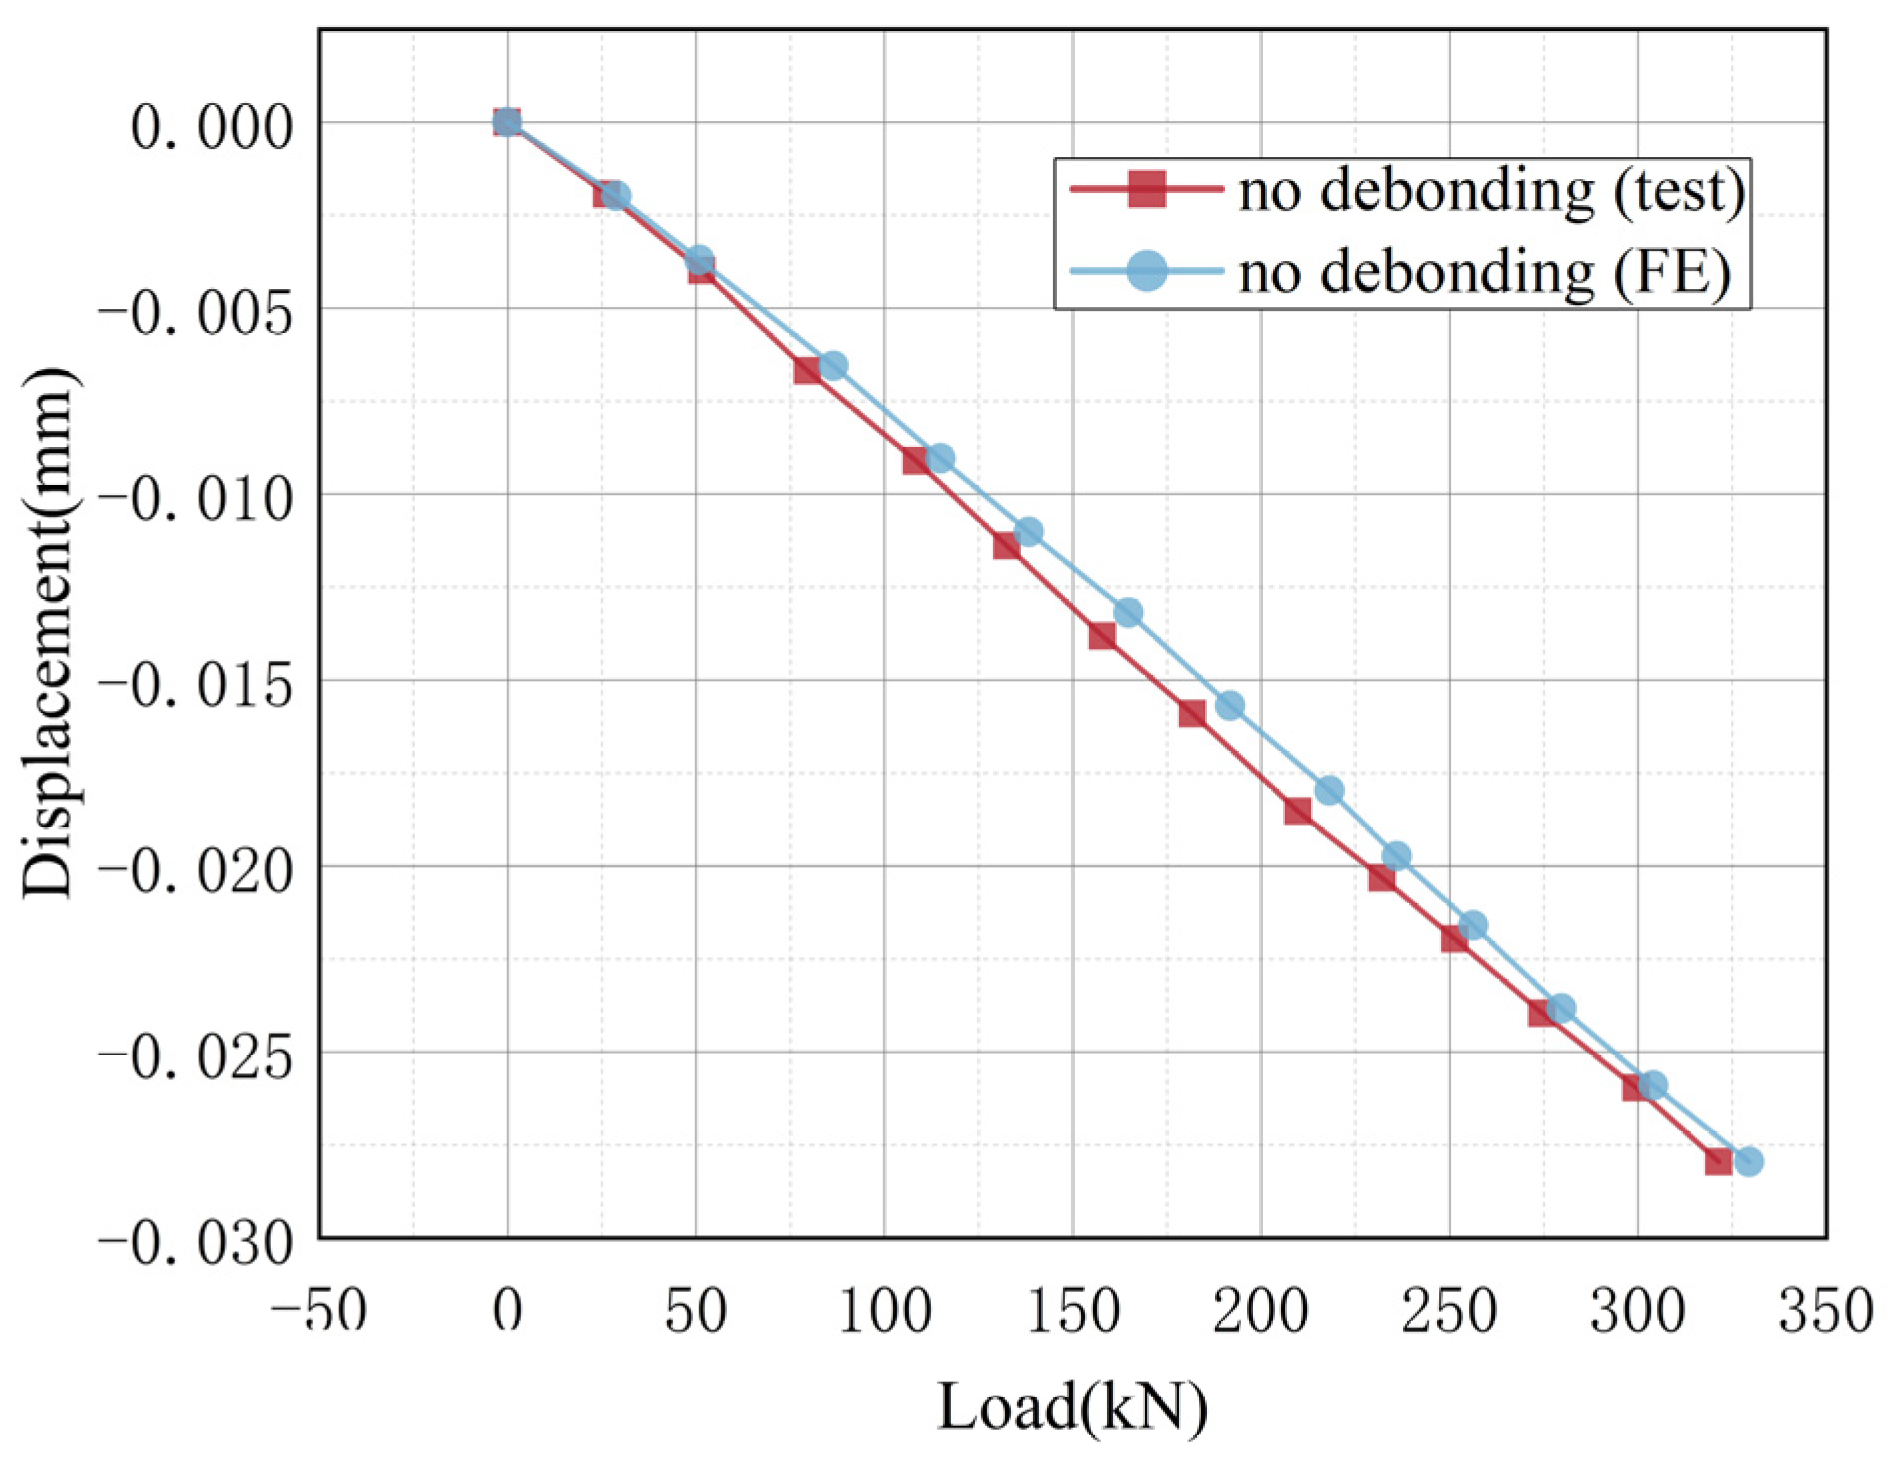
To verify the validity and accuracy of the finite element model, Figure 20 presents a comparison between the numerical and experimental results. The experimentally measured load–deflection curves agree well with those predicted by the finite element model. At the same displacement level, the difference between the calculated and measured loads was only 2.5%.
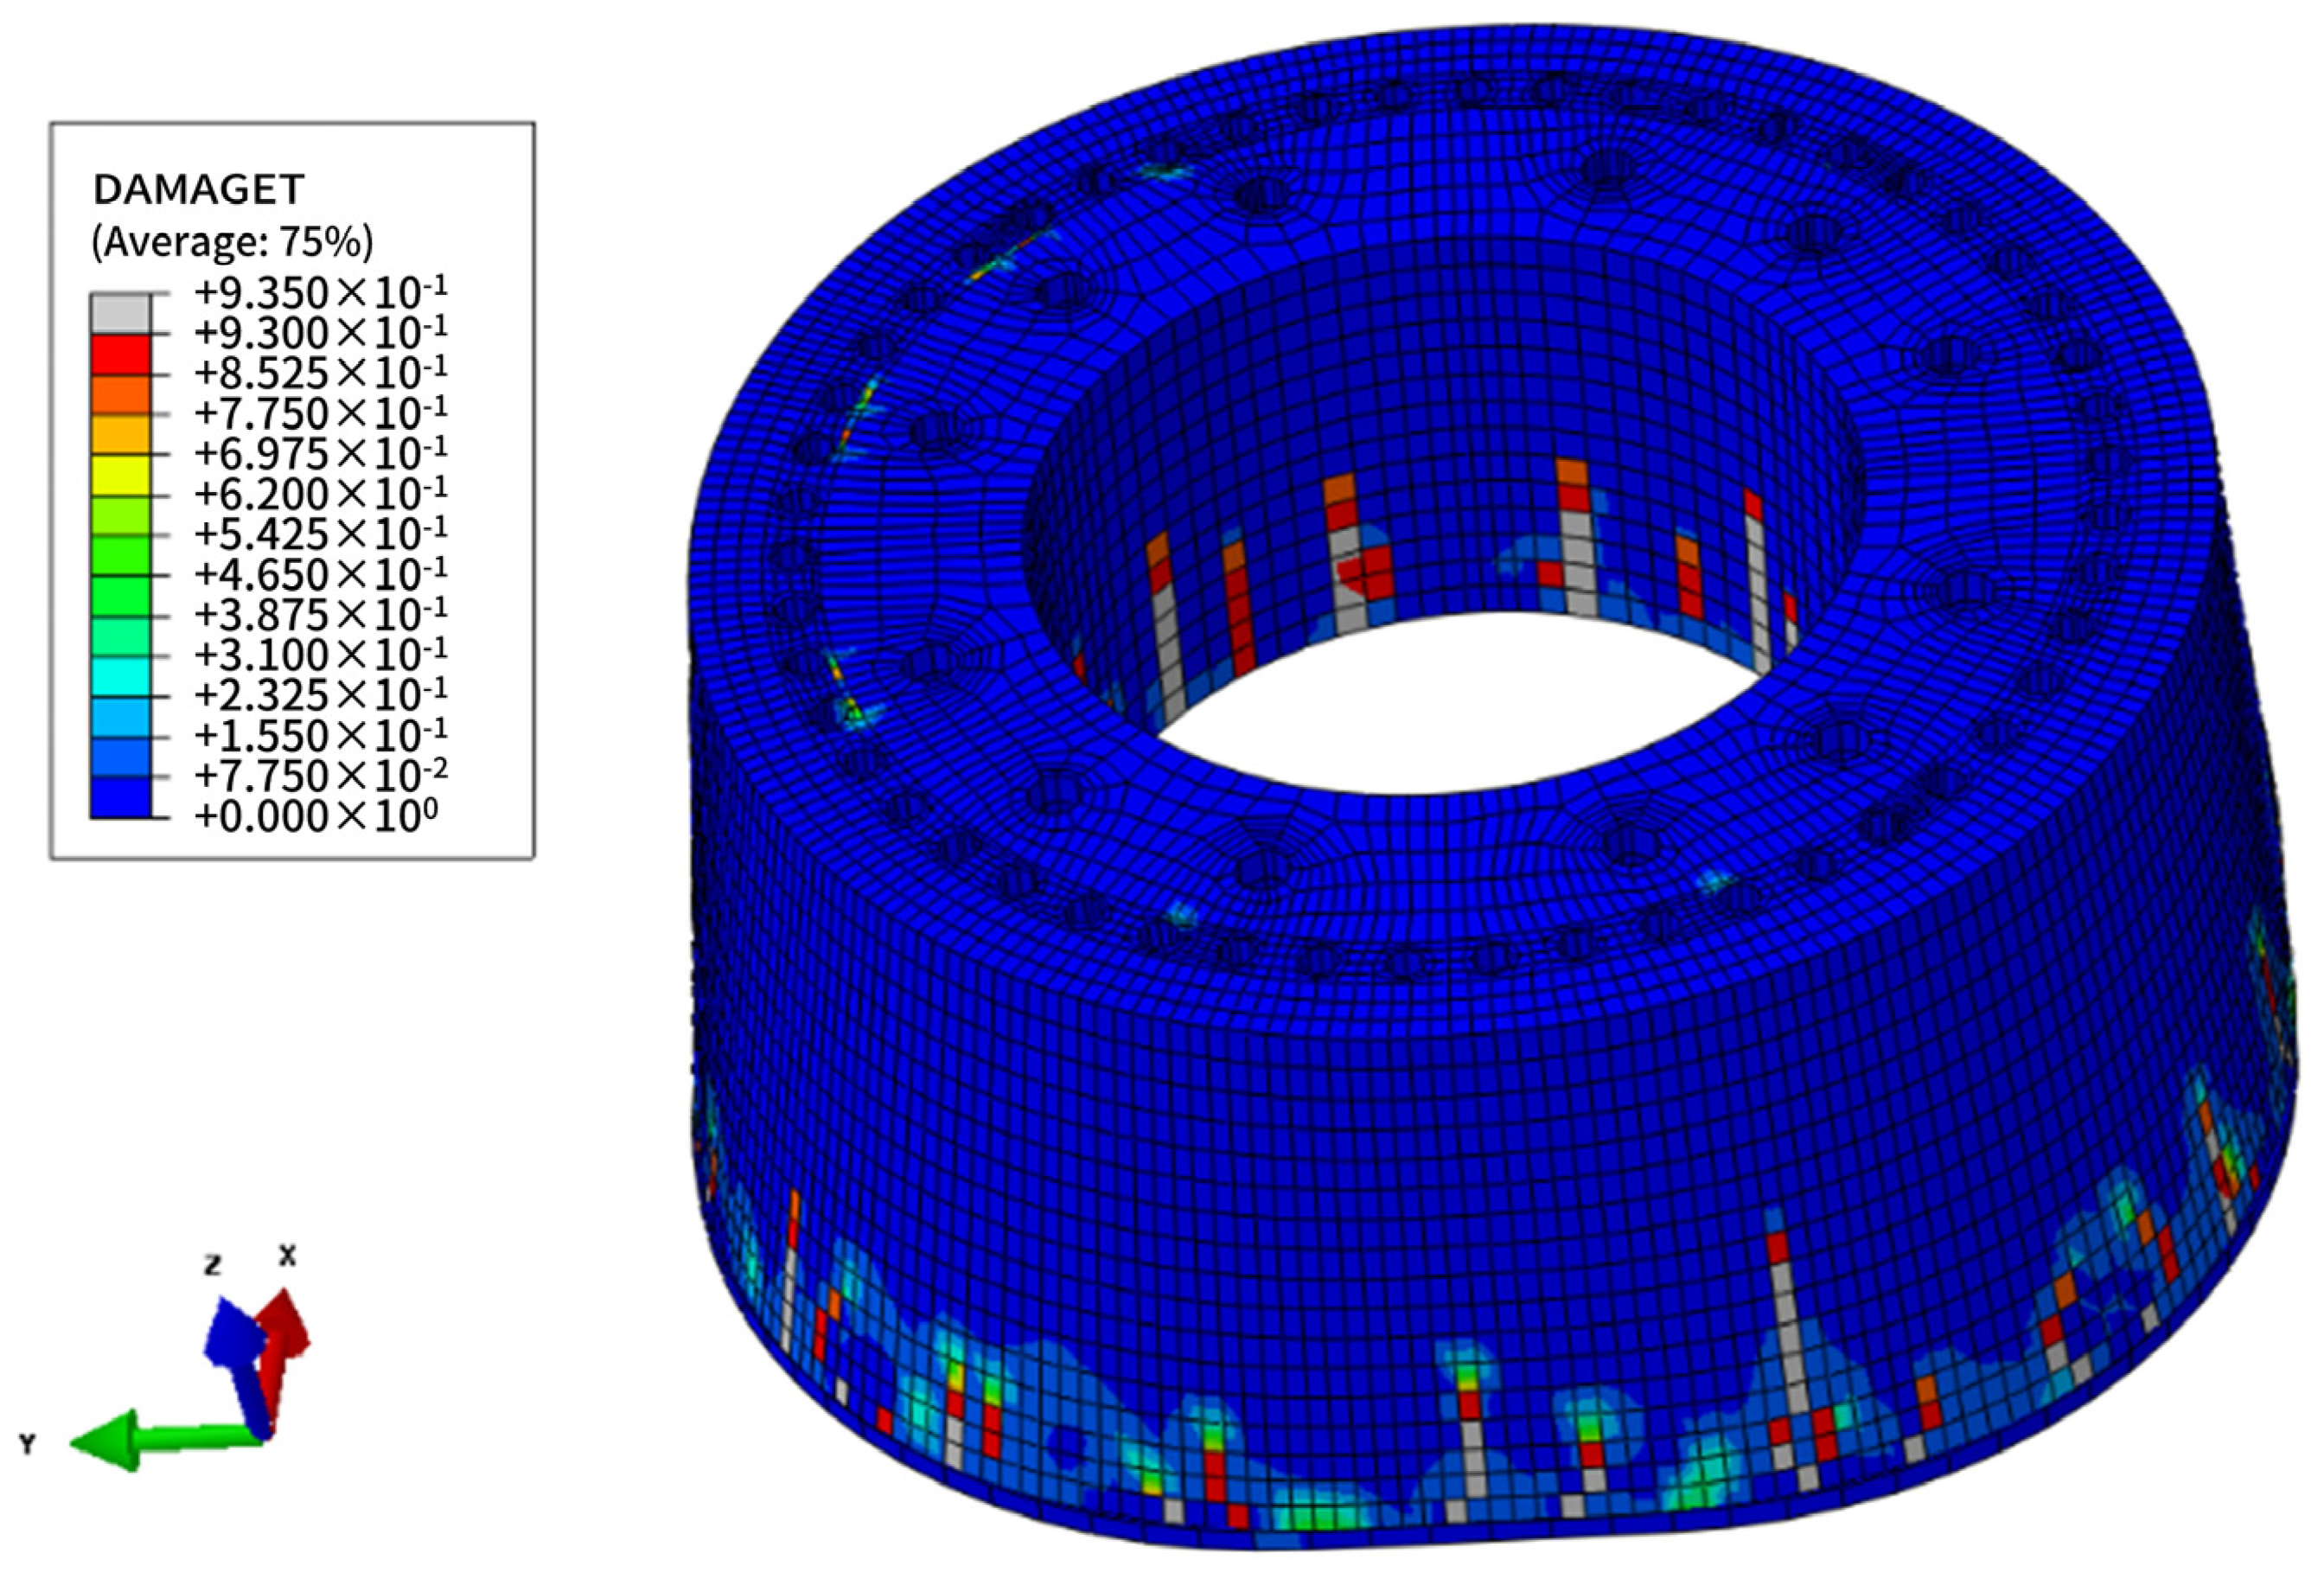
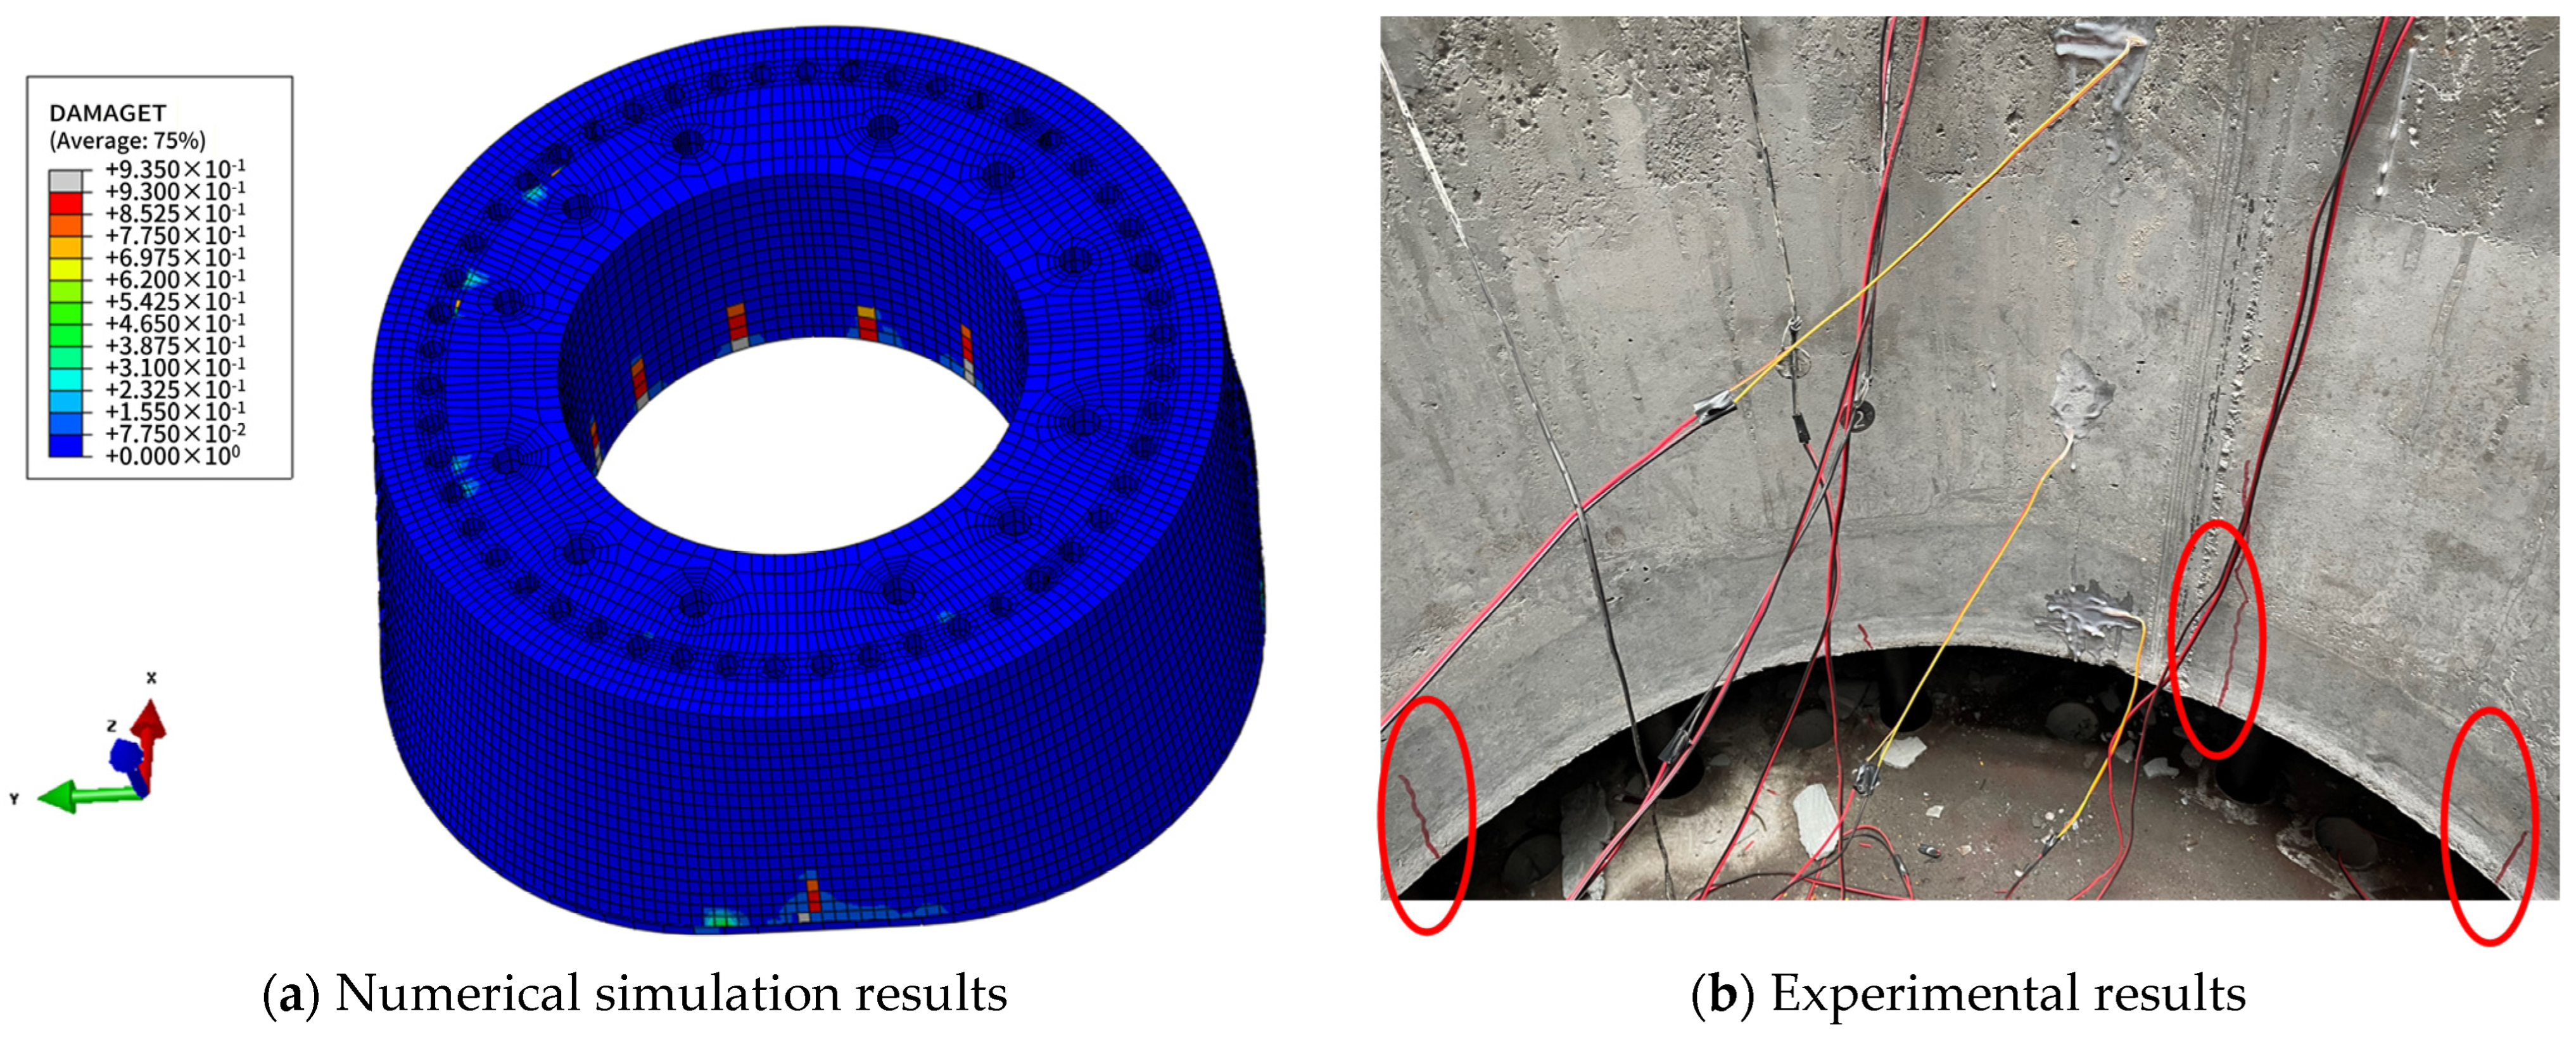
After applying the ultimate load to the steel–concrete transition segment, the tensile damage in the concrete of the transition segment is shown in Figure 21. In the ABAQUS v6.14, the transition segment concrete was simulated using the Concrete Damaged Plasticity (CDP) Model. The tensile damage of the concrete was evaluated using the DAMAGET indicator. Comparing the finite element model results with the experimental results, it was found that the model’s concrete damage behavior matches well with the experimental results, indicating that the model could effectively simulate the crack propagation in the transition segment.
In the experiment, since surface cracks in the transition segment barely propagated under 1 times the ultimate load, an overload of 1.3 times the ultimate load was applied, considering the maximum loading capacity of the loading equipment and the maximum bearing capacity of the loading accessories. After the overload loading, the tensile damage to the concrete was more severe compared to 1 times the ultimate load condition. Specifically, the internal cracks of the transition segment continued to extend, and more vertical cracks appeared on the exterior, as shown in Figure 22.

5. Strengthening Mechanism of UHPC-Strengthened Transition Segments and Hoop Tensile Stress Calculation Method

5.1. Mechanism Analysis of UHPC-Strengthened Transition Segments

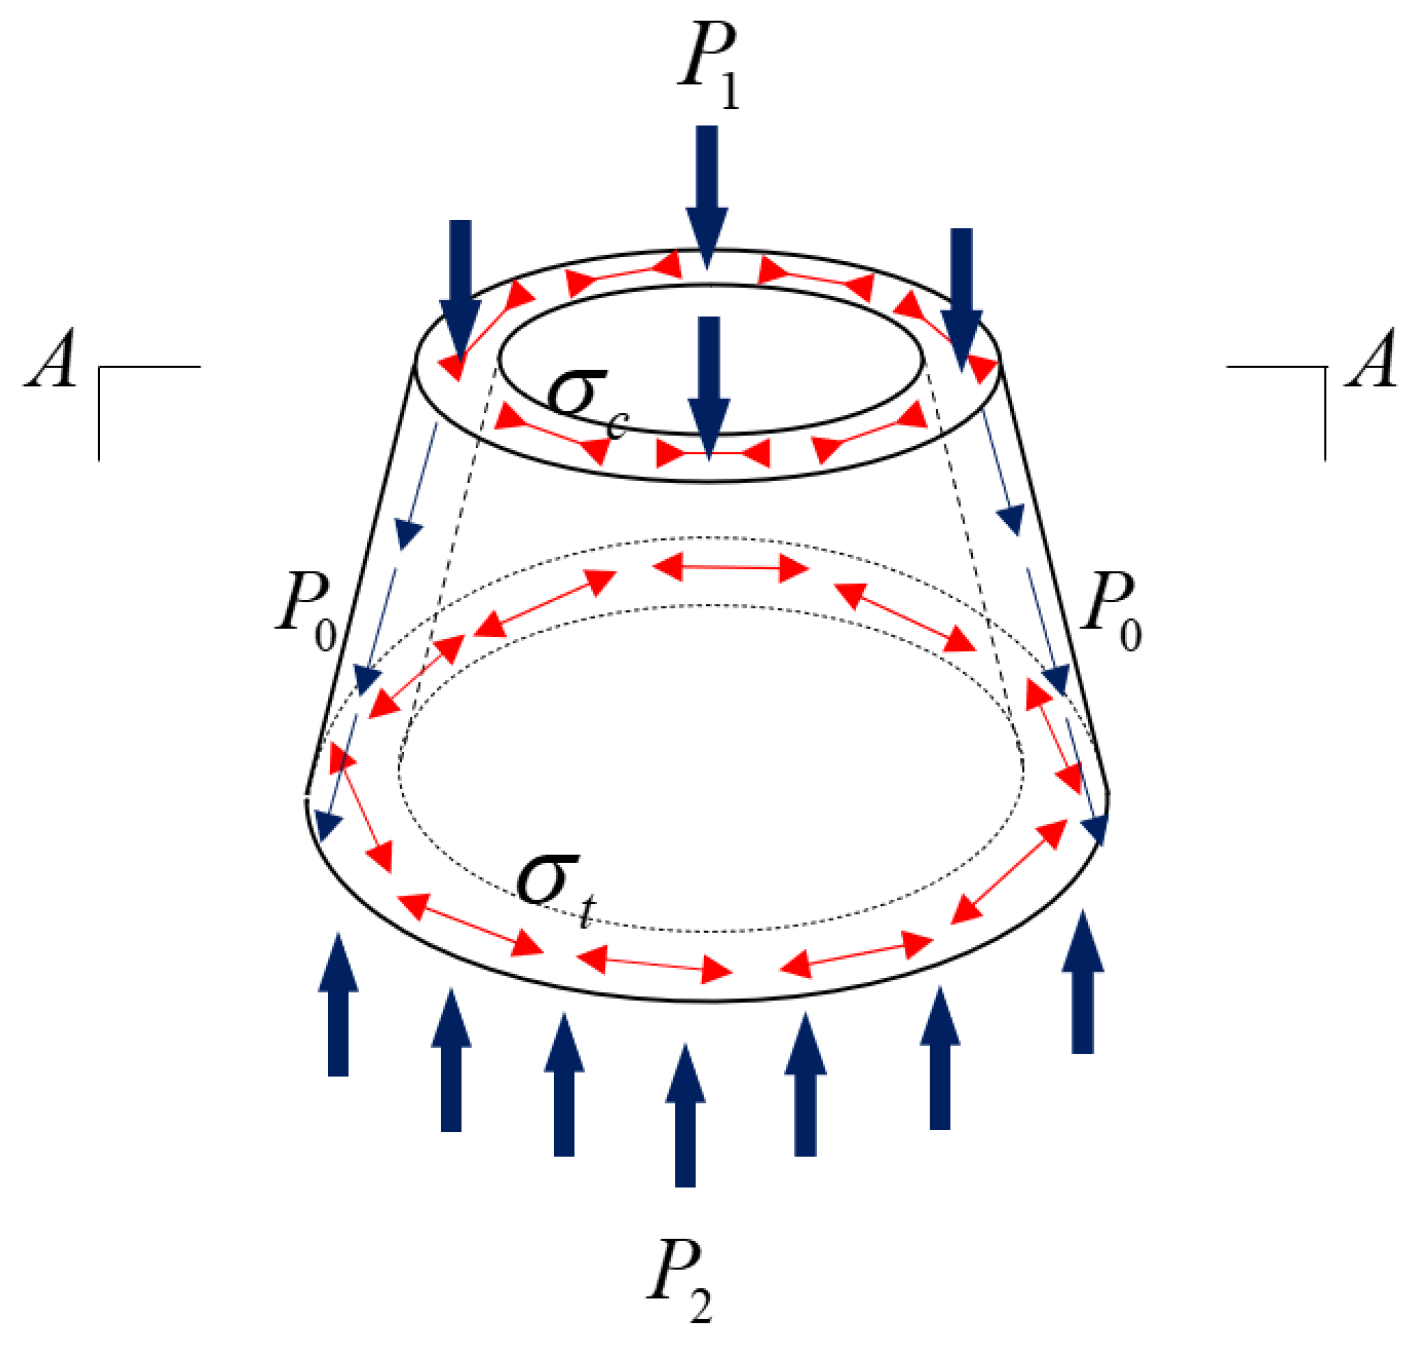
A schematic of the force transfer path for the transition segment is shown in Figure 23. During the prestressing phase of the tensioned bolts, the transition segment was subjected to a vertically downward load P1, which generates a circumferential compressive stress σc at the top section of the transition segment. This vertical load was transmitted downward along the sloped surface of the transition segment, with the load component being P0. When P0 reaches the bottom of the transition segment, it decomposes into a circumferential stress τ2 and an upward reactive force P2. The circumferential tensile stress σt experienced by the transition segment causes tensile damage to the concrete surface, leading to cracking.
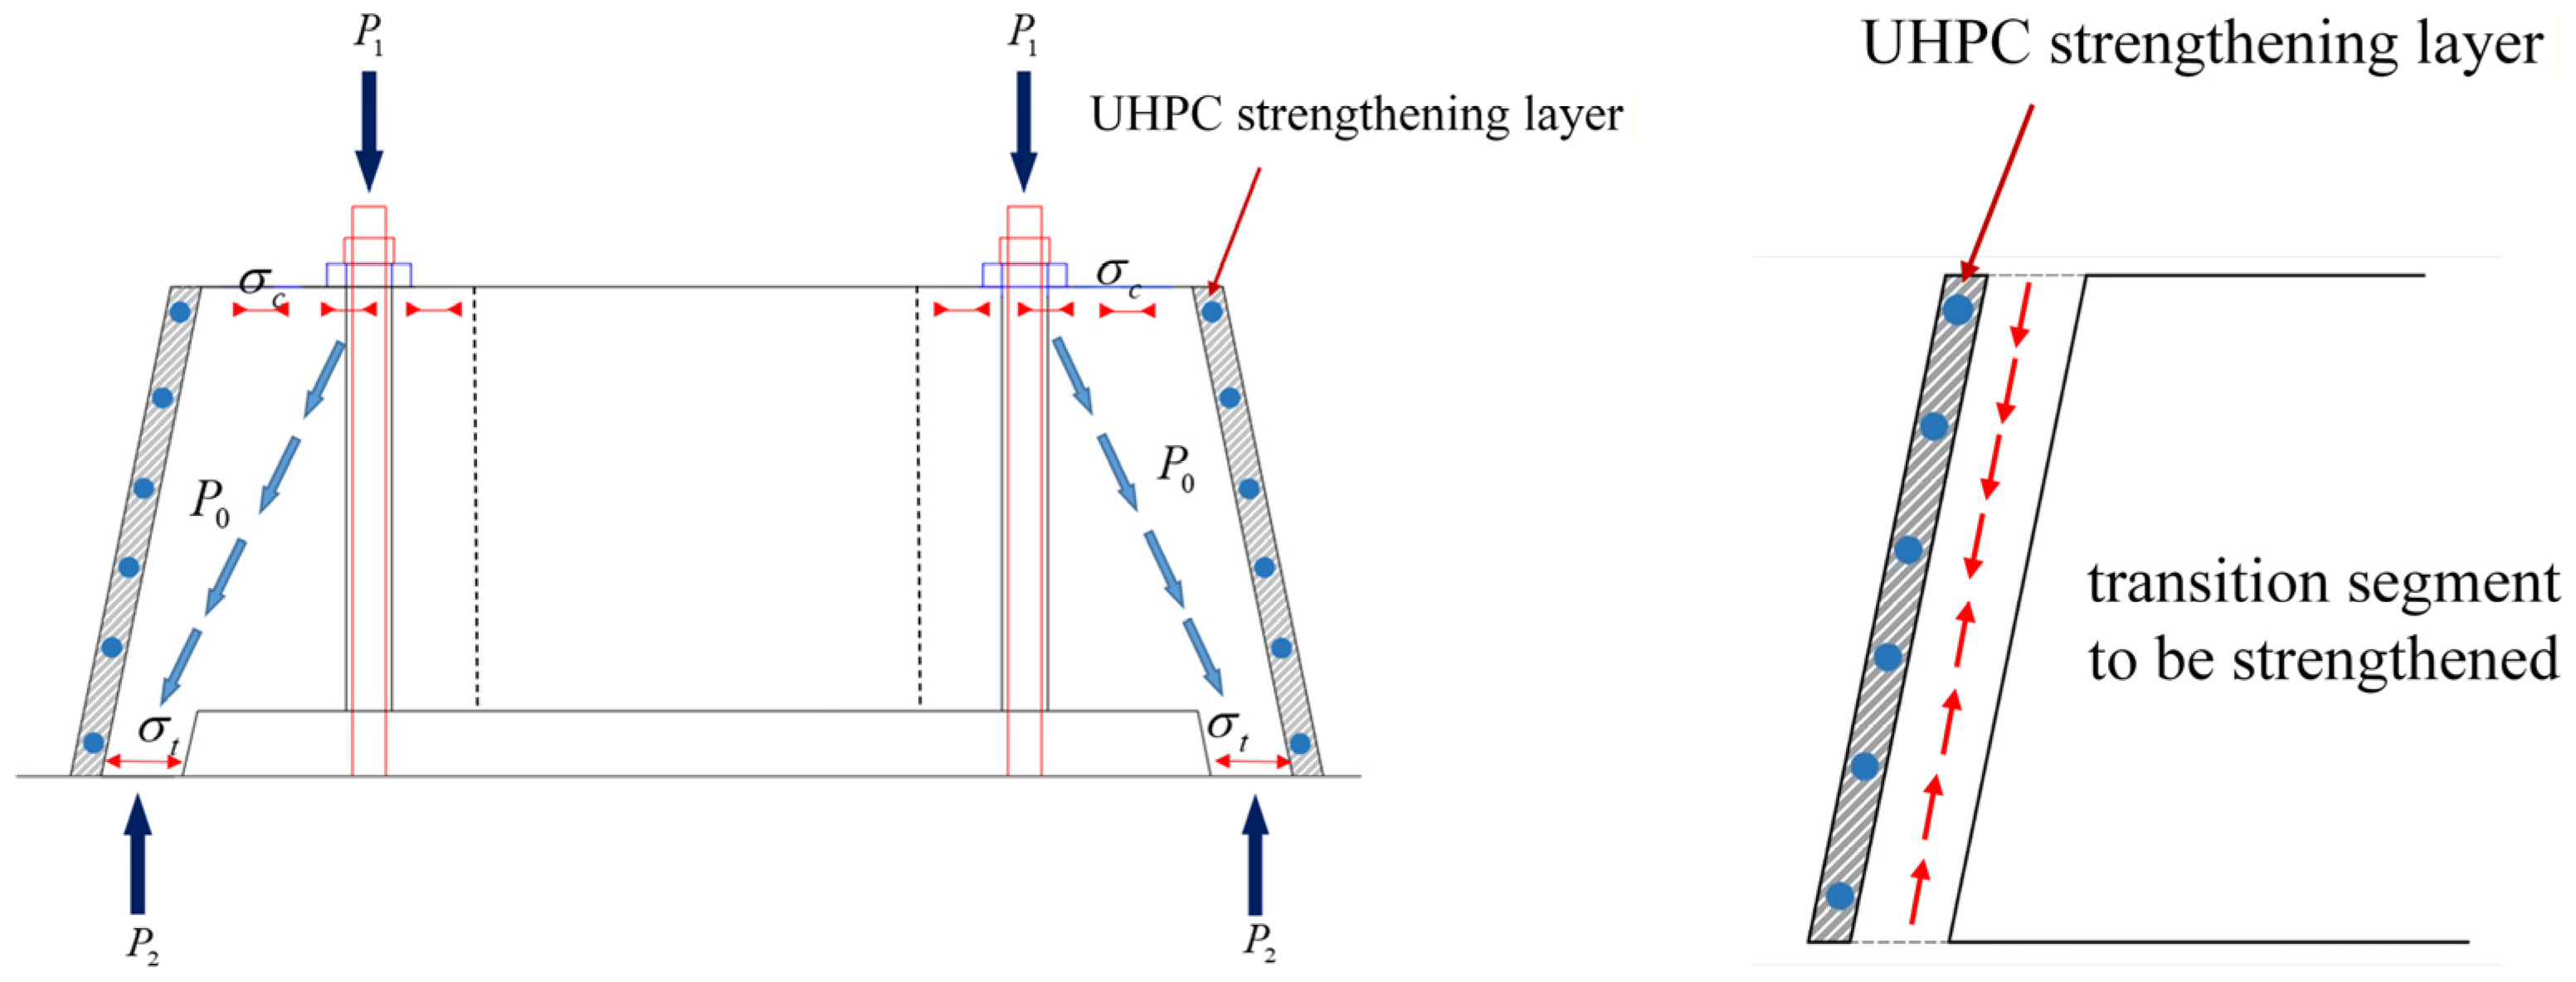
The principle of reinforcing the damaged transition segment with external UHPC was to enhance the overall tensile strength of the surface stress concentration areas of the transition segment after UHPC strengthening, by utilizing the high tensile strength of UHPC in order to resist the circumferential tensile stress σt at the bottom and prevent structural damage. The reinforced transition segment structure worked in collaboration through the interface bonding strength between the UHPC and the original concrete of the transition segment, jointly resisting structural deformation. The load transfer path of the strengthened transition segment is illustrated in Figure 24.
The interface bonding strength between UHPC and the original concrete of the transition segment was primarily provided by mechanical interlocking forces. The reinforced transition segment with UHPC was often subjected to cyclic loading. Xia [40] analyzed the failure modes of the UHPC-NC interface under cyclic loading and the factors influencing its shear bearing capacity, introducing the interface damage factor d to represent the effect of cyclic damage. When the UHPC-NC interface was subjected to shear forces, at low reinforcement ratios, the shear bearing capacity of the reinforced interface was mainly provided by the interlocking effect of the aggregates. As the reinforcement ratio increased, the role of the reinforcement pinning effect became more significant. The bearing capacity of the UHPC-NC interface with damaged roughness and reinforcement could be calculated using Equation (11). If the interface was a keyed or reinforced interface, the UHPC-NC interface bearing capacity could be calculated using Equation (12). The values of the coefficients are given in Table 8.
V 1 = d τ a + u ρ k 1 f y + k 2 ρ f y f c c A b
V 2 = d A k C 1 f c + μ v A v f f y
where V1 is the UHPC-NC reinforcement interface shear bearing capacity. V2 is the UHPC-NC keyed interface shear bearing capacity. τa is the new concrete interface bond strength, which is determined based on the roughness of the interface. u is the interface friction factor, determined according to European concrete standards. ρ is the interface reinforcement ratio. k1 is the adhesion factor, determined according to European concrete standards. k2 is the interaction factor between the steel bar and concrete, determined according to European concrete standards. fy is the interface shear strength. fcc is the concrete core compressive strength. Ab is the UHPC-NC interface area.

5.2. Basic Assumptions

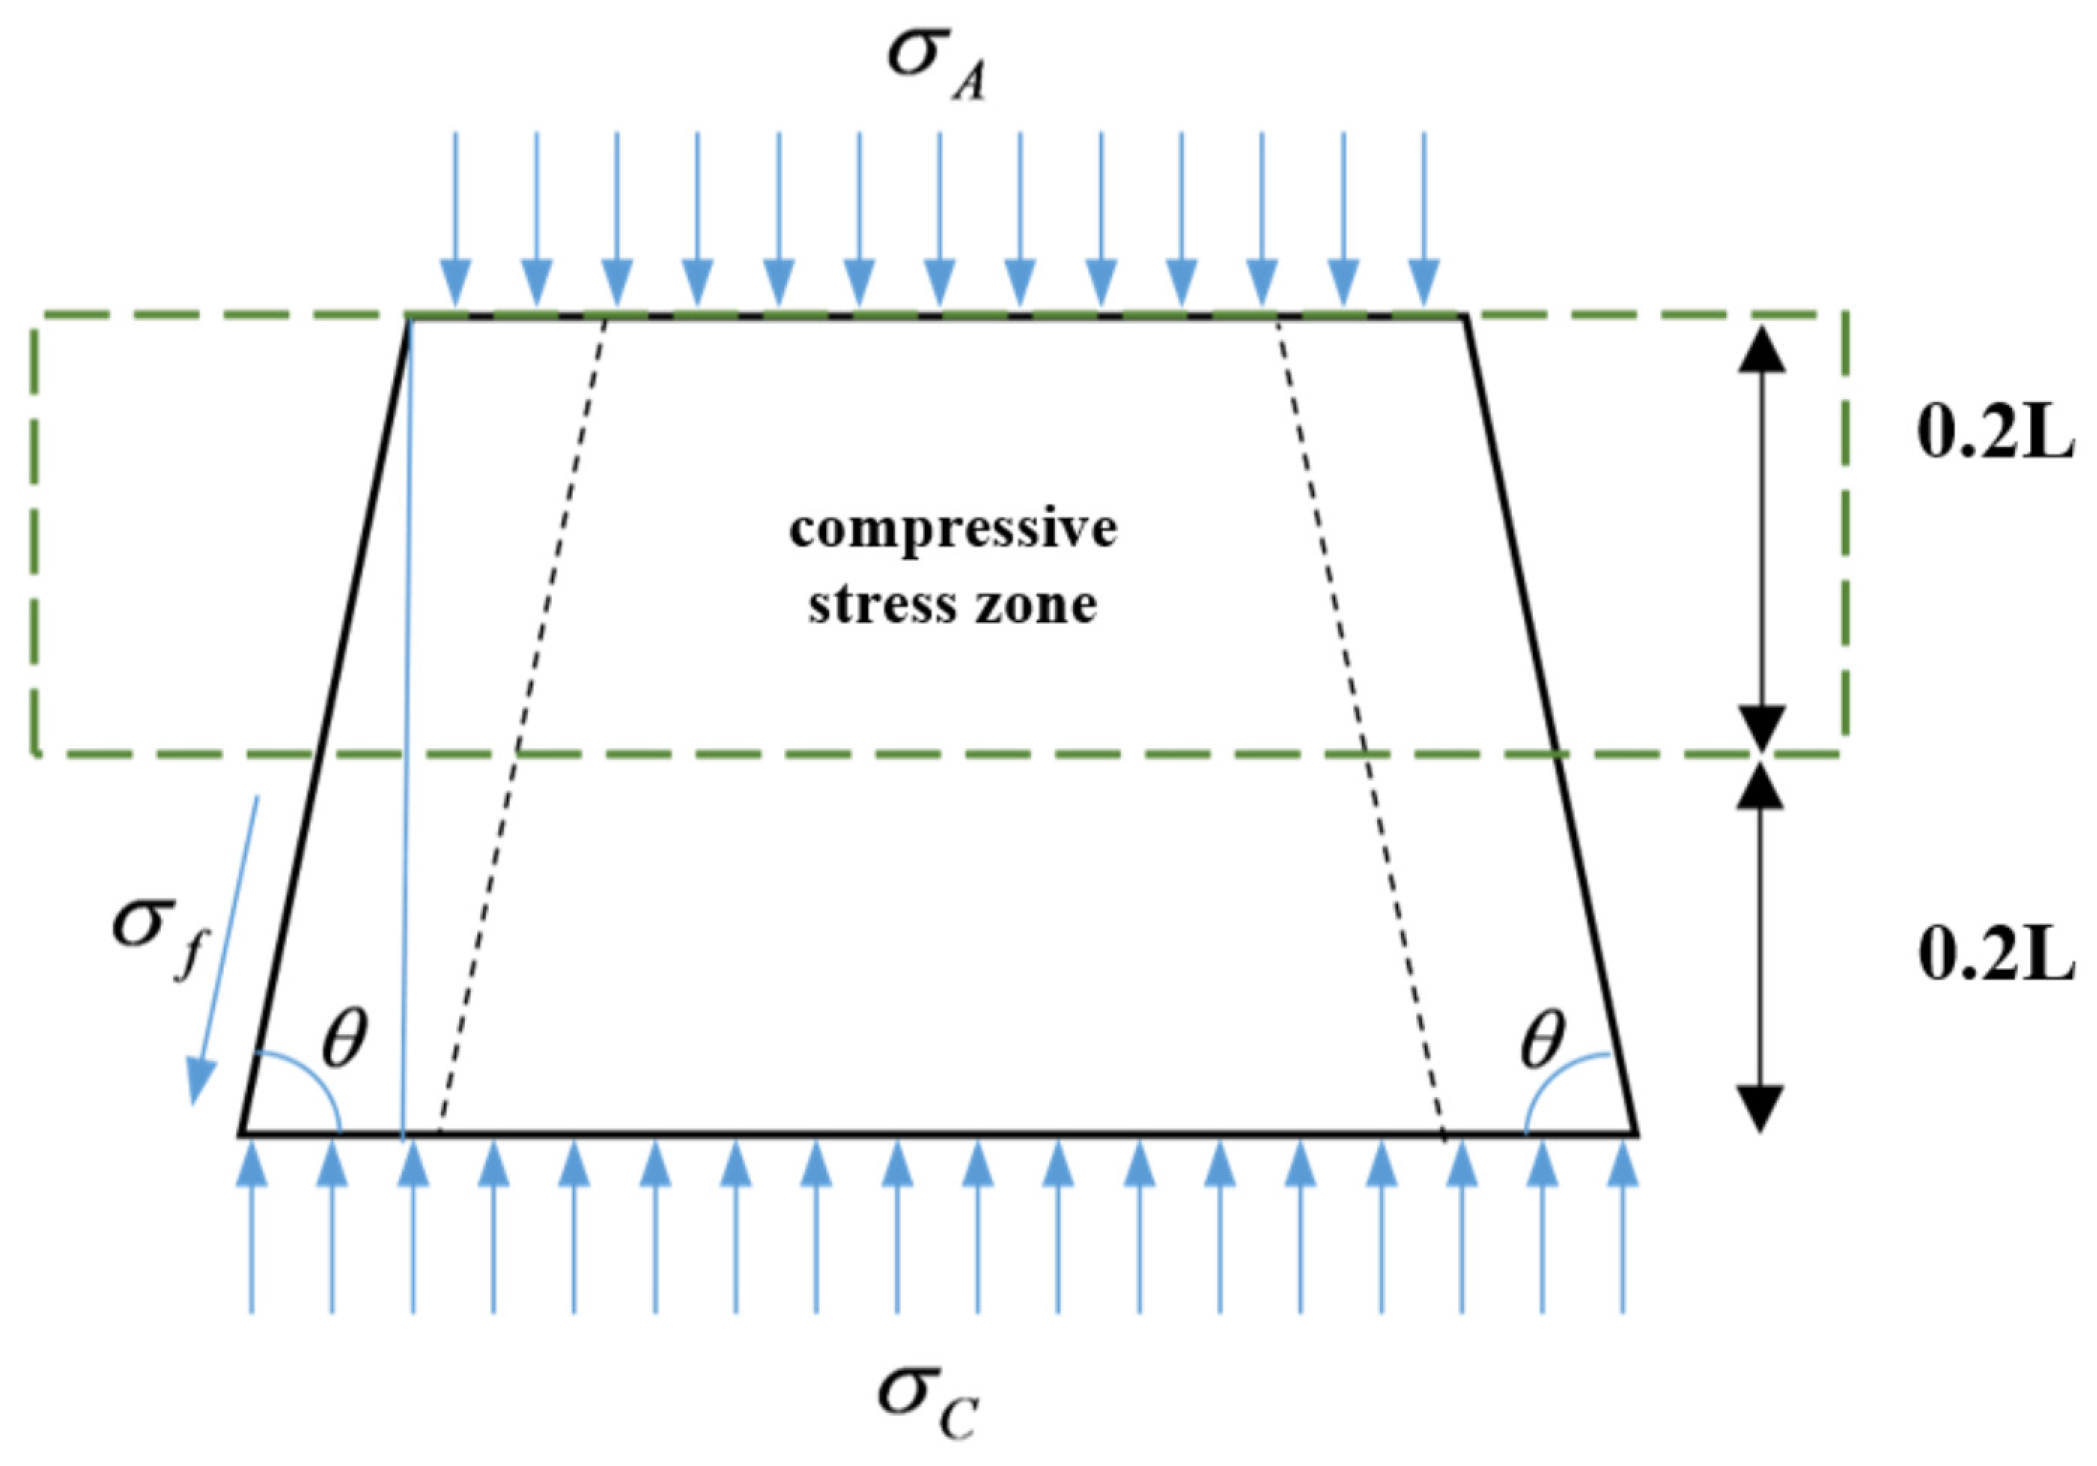
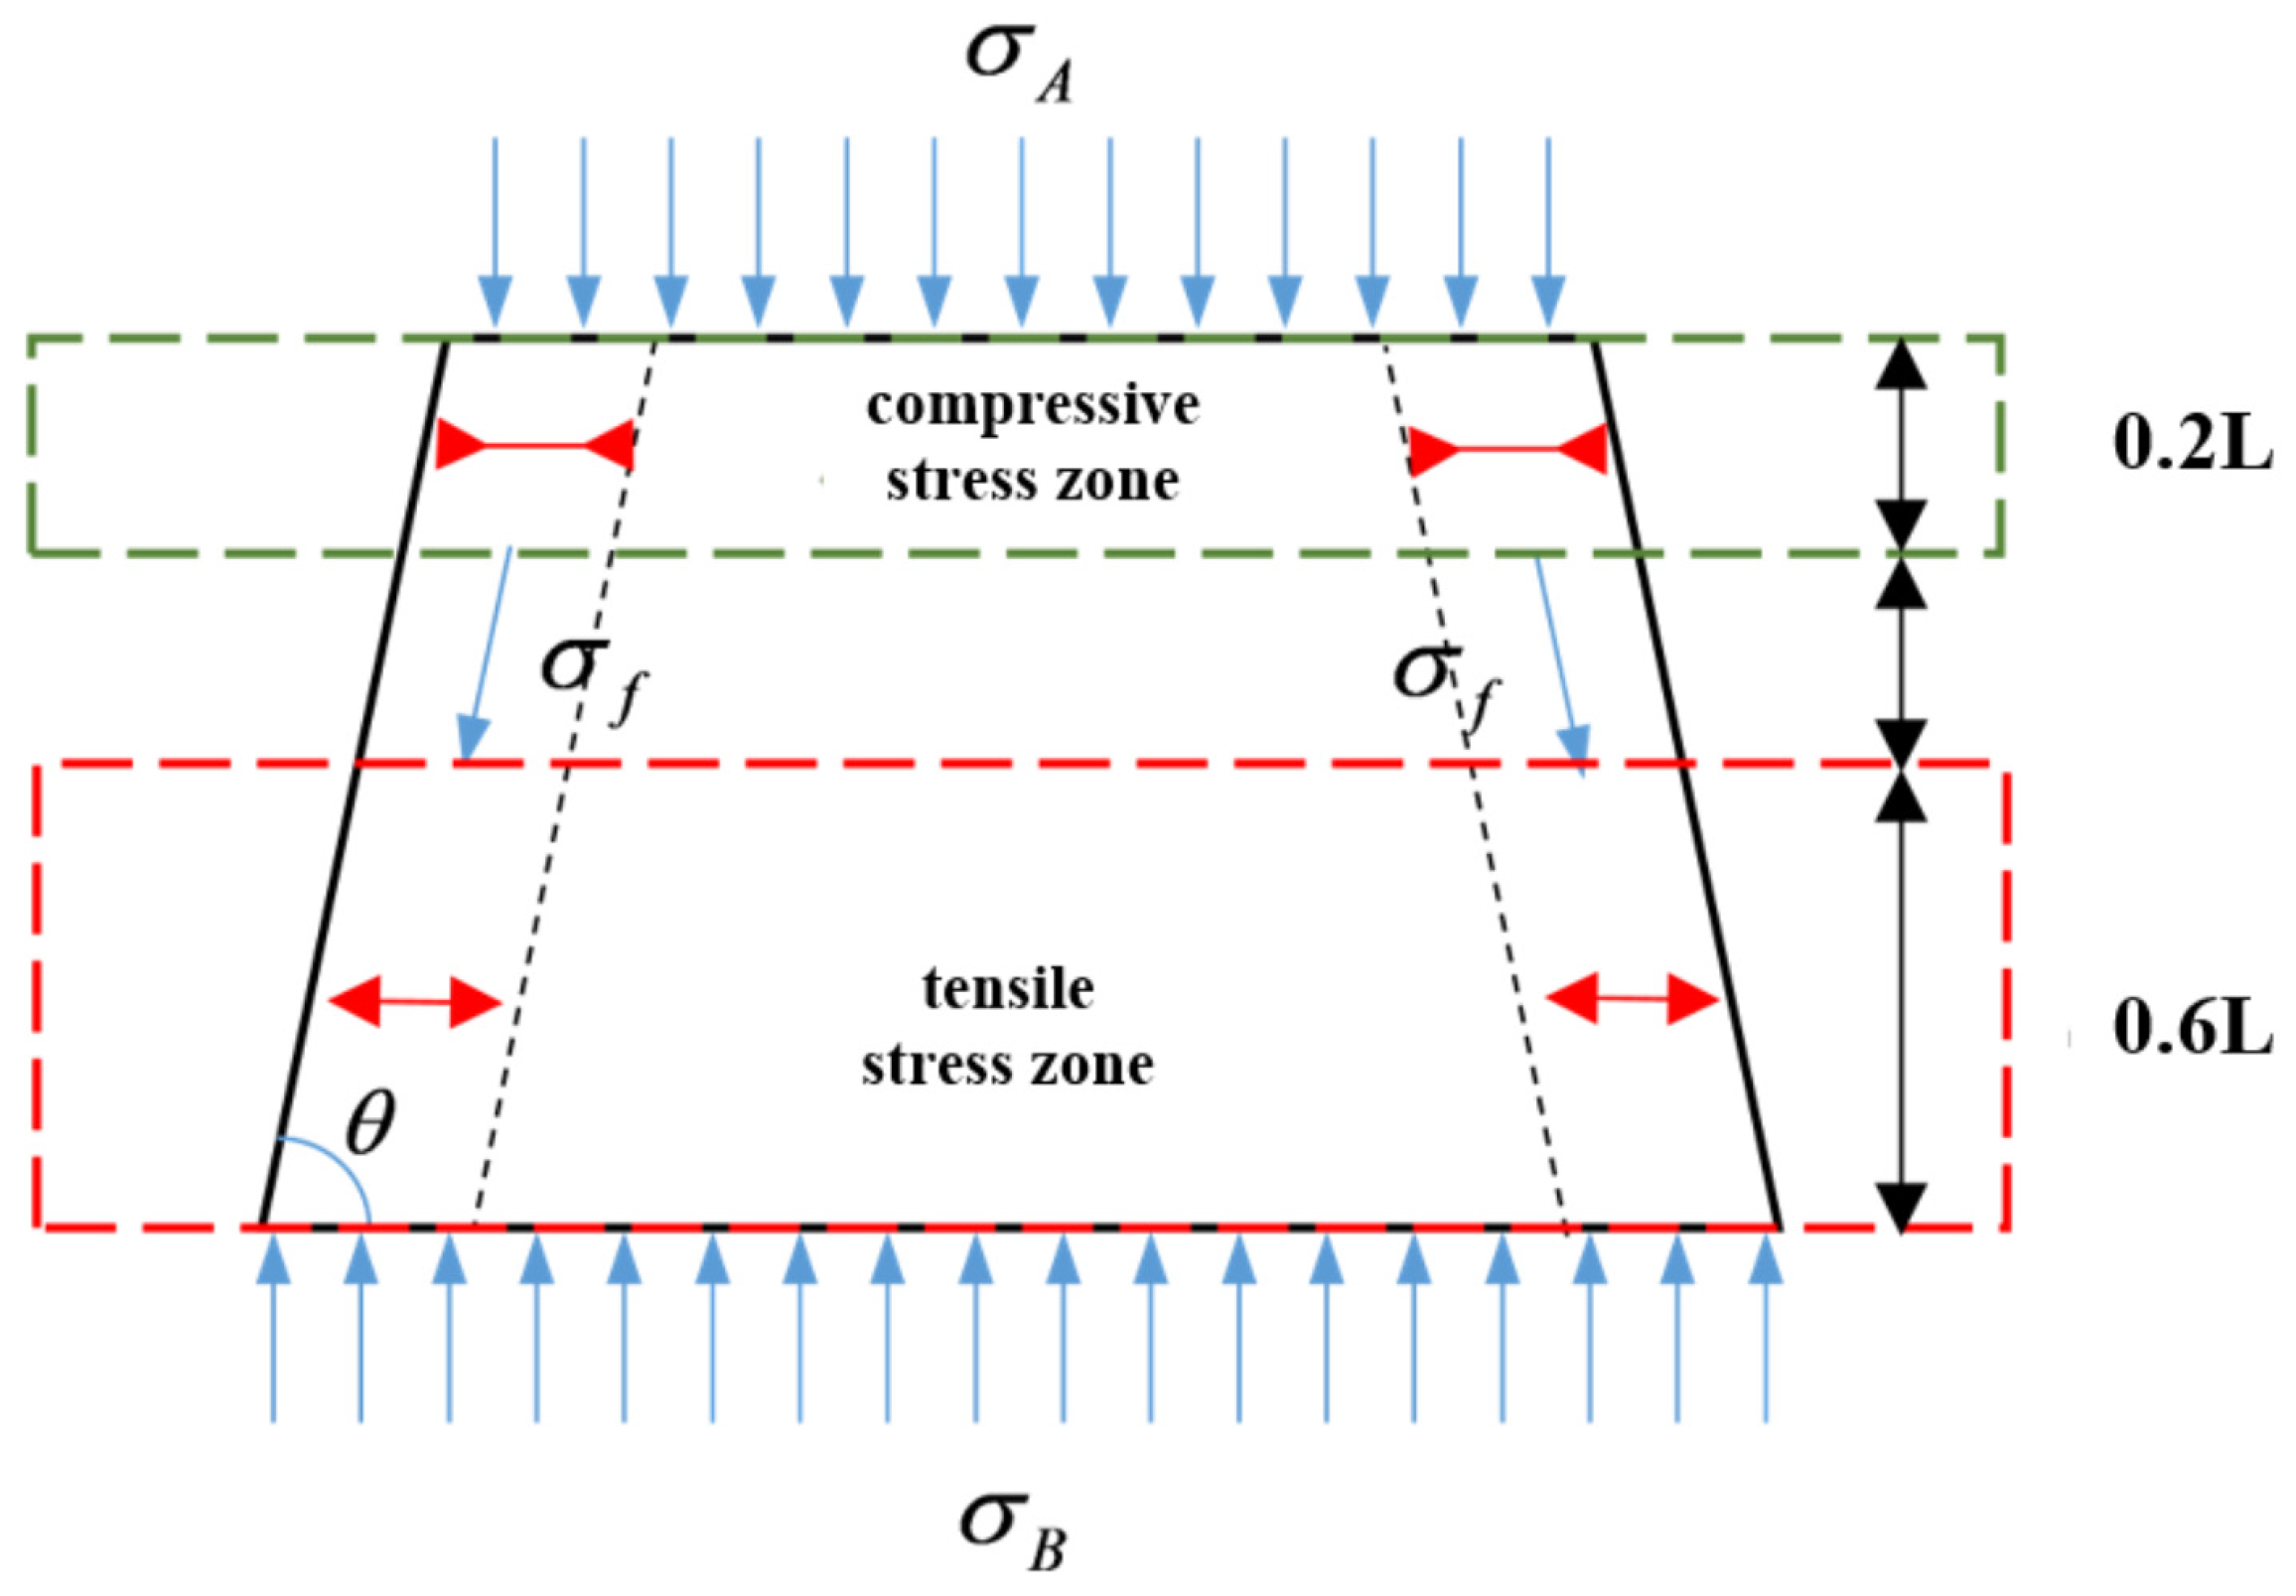
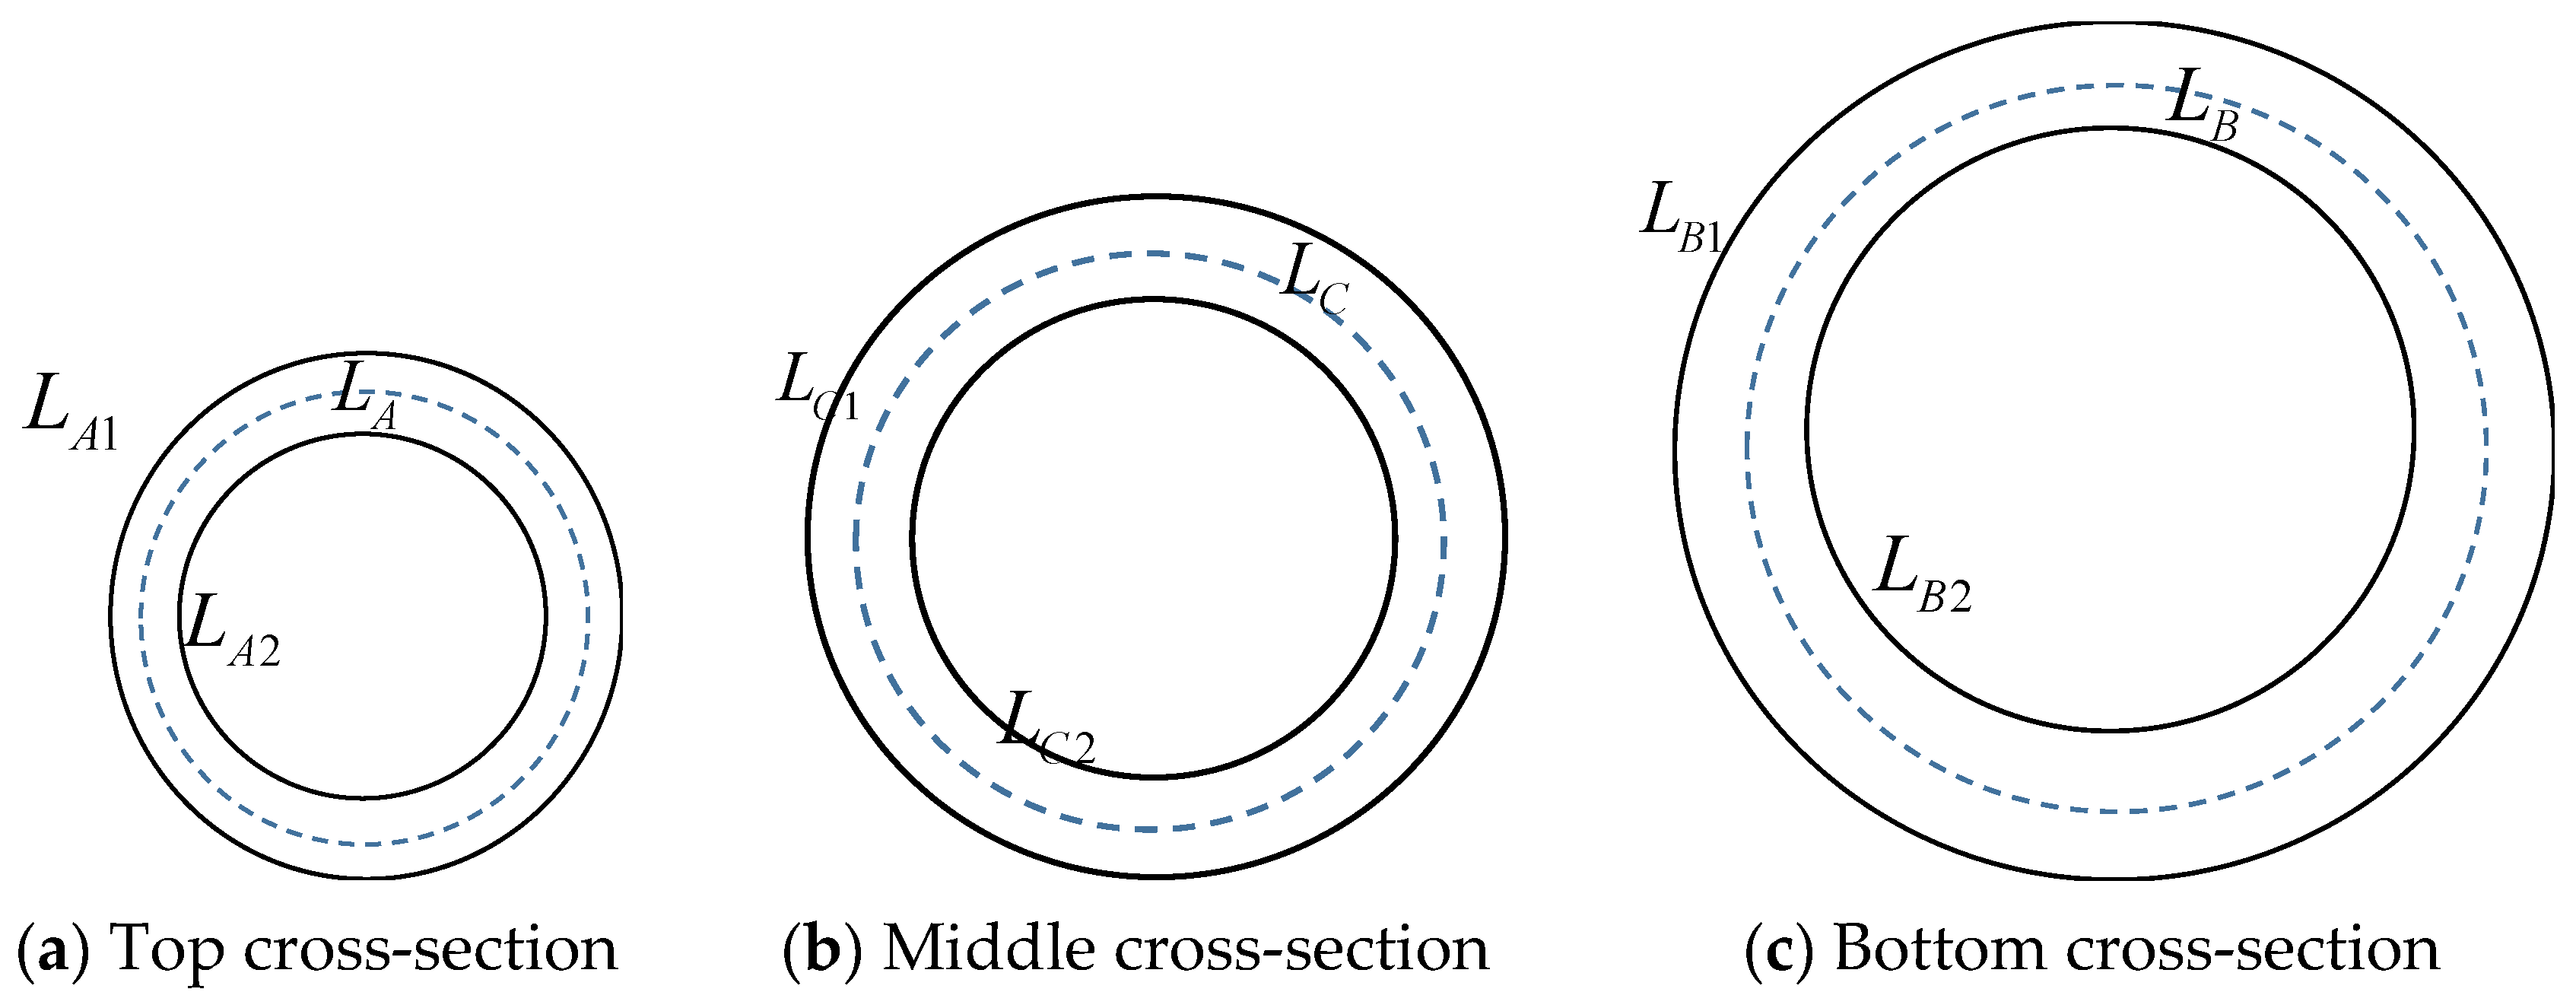
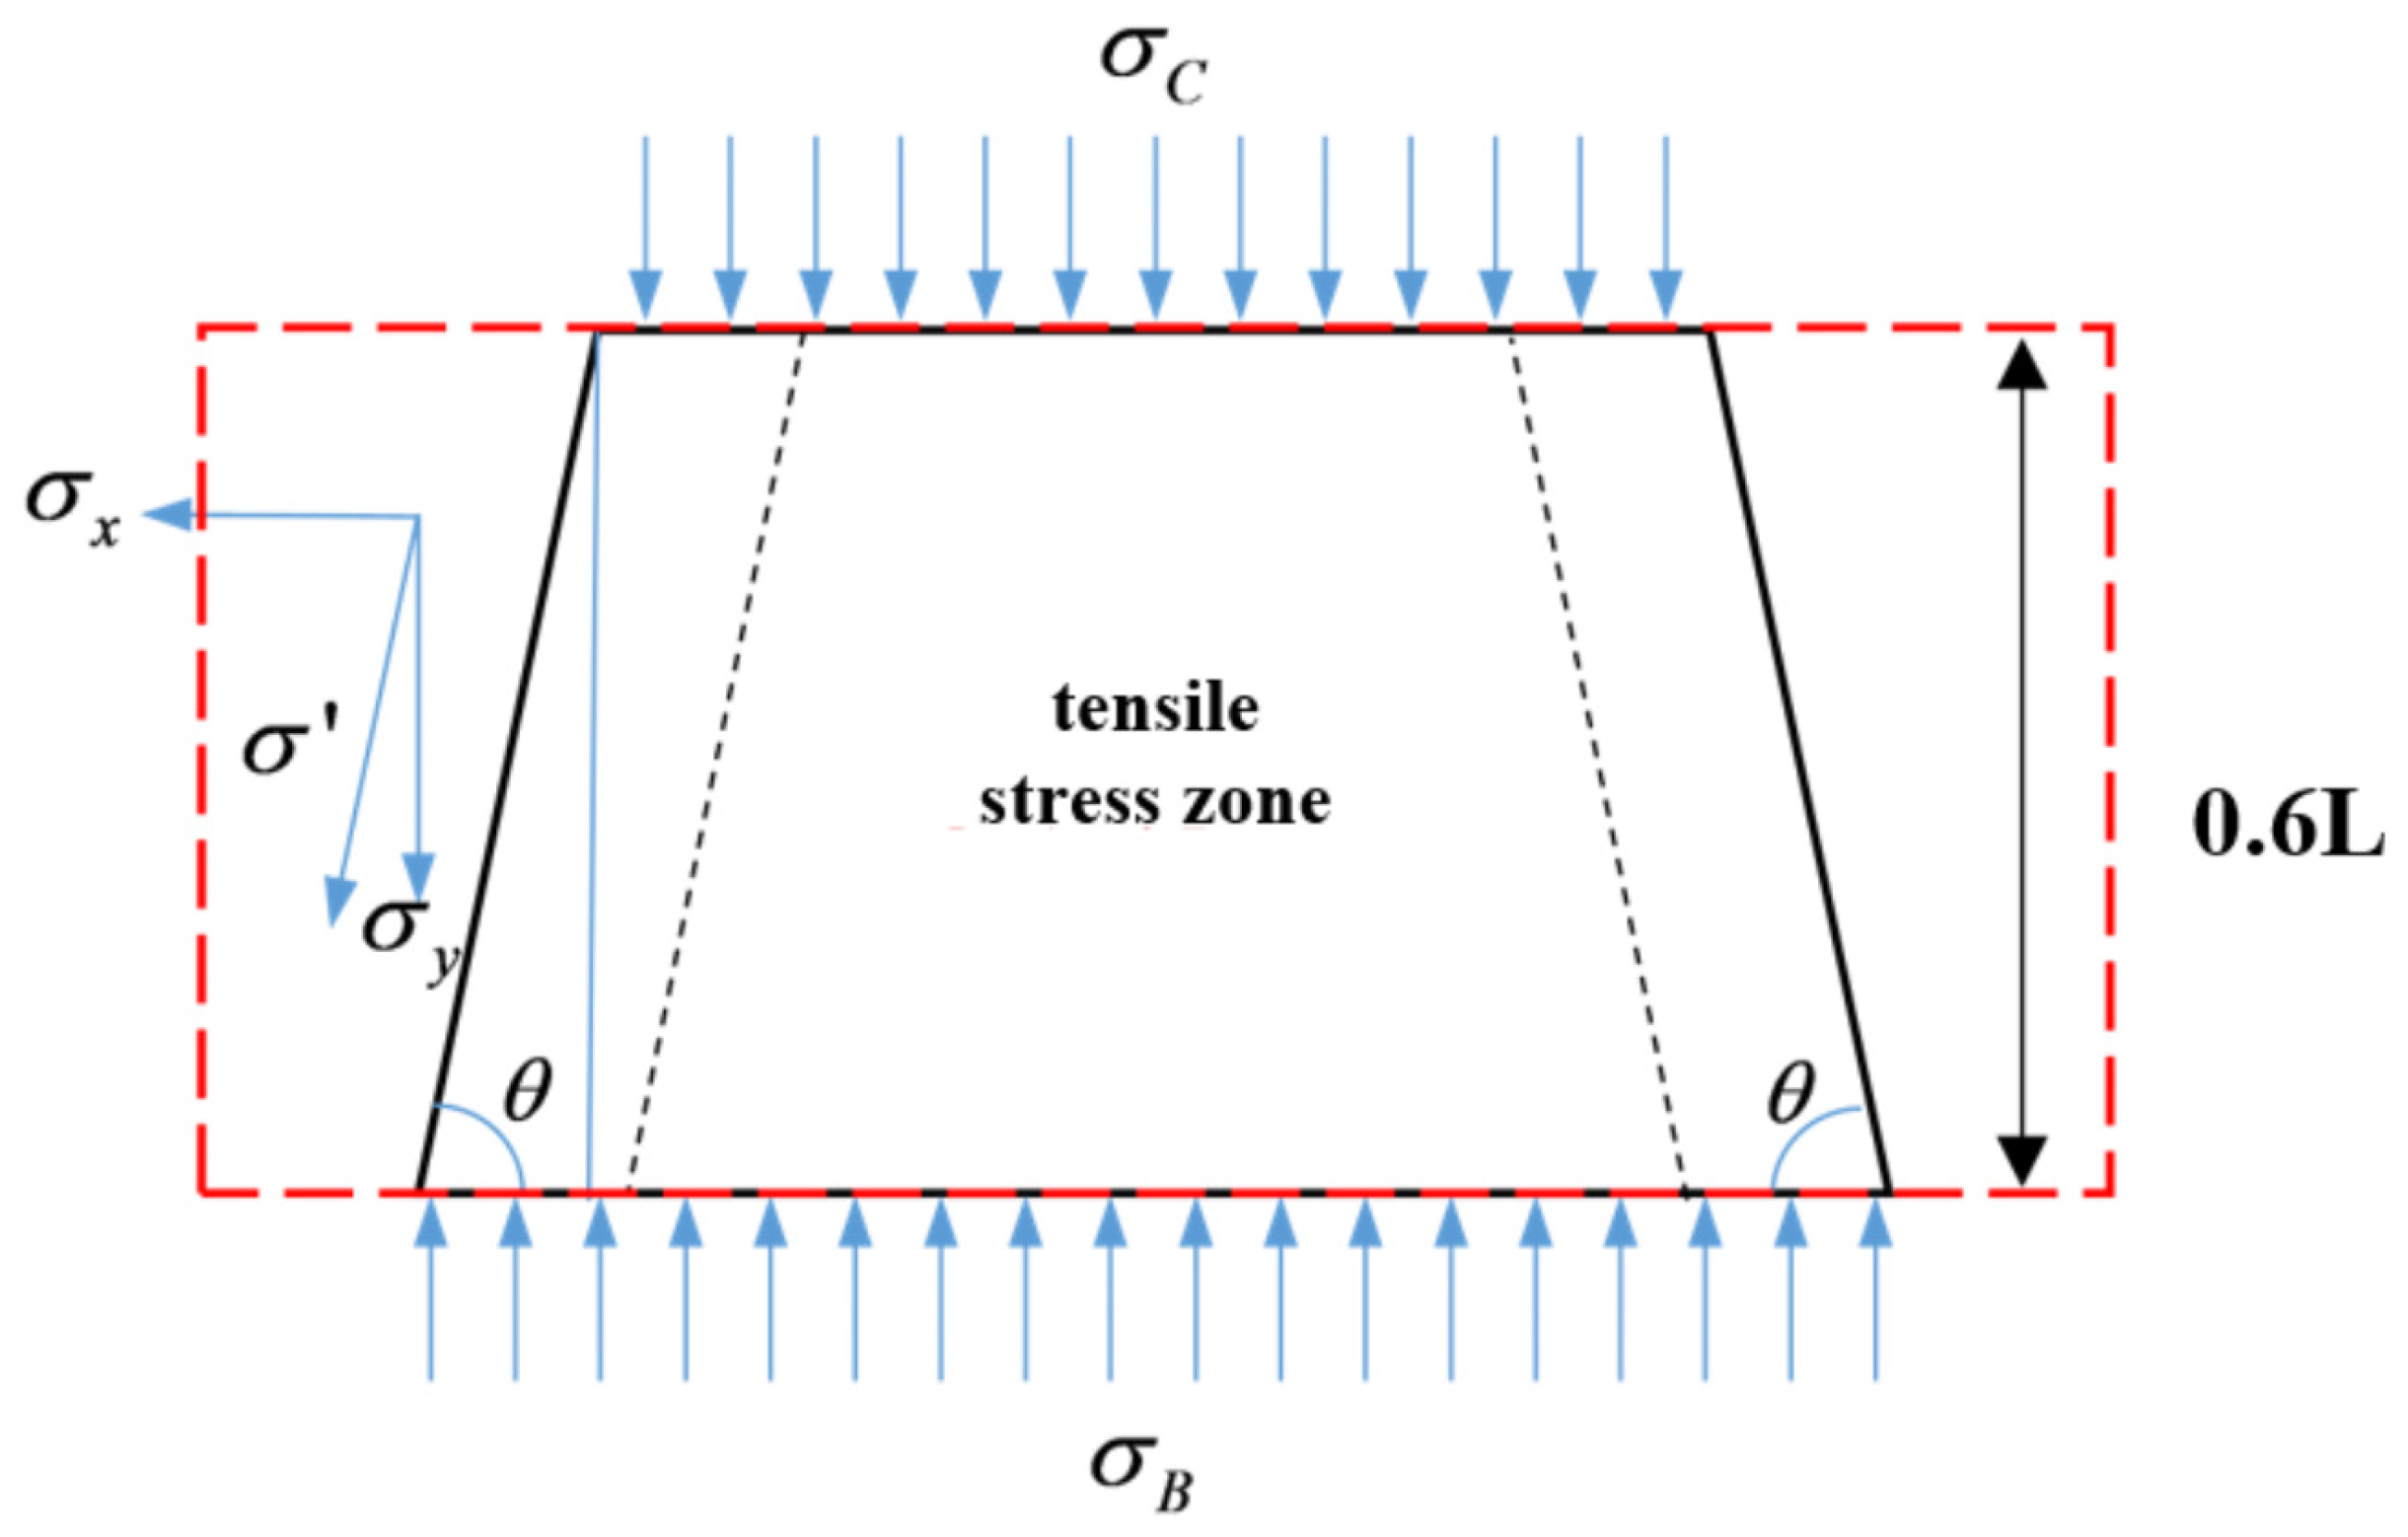
The simplified calculation model is shown in Figure 25, where L is the height of the transition segment. The top 0.2L area is the compression region, the bottom 0.6L area is the tension region, and the middle 0.2L area is the force transmission region, simplified as a compression member model for force transfer. Specifically, this assumption is primarily based on the load transfer path analysis of the transition segment. The vertical load P1 generates circumferential compressive stresses at the top region, which are mainly transferred to the bottom through the inclined surface. Finite element analysis results indicate that, under vertical loading, the upper region of the transition segment is predominantly subjected to circumferential compressive stress, while the lower region develops circumferential tensile stress due to the “hoop effect,” with the middle region acting as a stress transition zone. For the sake of analytical simplicity, the top 20% of the height is approximated as the compression zone, the bottom 60% as the tension zone, and the intermediate 20% as the force-transfer transition zone. In Figure 26, RA1 is the outer radius of the top section of the transition segment, and LA1 is the outer circumference of the top section, given by 2πRA1. RA2 is the inner radius of the top section, and LA2 is the inner circumference of the top section, given by 2πRA2. LA is the circumference of the centerline of the top section. The descriptions of sections B and C are similar. LB is the circumference of the centerline at the bottom of the transition segment. The calculation methods for LA, LB and LC are given by Equations (13)–(15).
L A = 1 2 ( L A 1 + L A 2 ) = π ( R A 1 + R A 2 )
L B = 1 2 ( L B 1 + L B 2 ) = π ( R B 1 + R B 2 )
L C = 0.4 ( L A + L B ) = 0.4 π ( R A 1 + R A 2 + R B 1 + R B 2 )
According to the force equilibrium model shown in Figure 27, the equilibrium equations for each component are listed as Equations (16)–(18).
P 1 = P 3
σ A = P 1 L A = 2 P 1 L A 1 + L A 2 = P 1 π R A 1 + R A 2
σ C = P 3 L C = P 1 0.4 π ( R A 1 + R A 2 + R B 1 + R B 2 )

5.3. Calculation Formula

To obtain the circumferential tensile stress σt, in the transition segment, the force distribution of the transition segment was analyzed in this section. To simplify the calculation process, a simplified model of the transition segment was used, considering only the tensile region of the transition segment, the range of 0.6 times the height of the transition segment. First, the circumferences of the top and bottom centerlines of the tensile region of the transition segment were determined, which were used to calculate the centerline stress σC at the top and the centerline stress σB at the bottom of the tensile region. The calculation diagram is shown in Figure 28.
According to the force equilibrium model shown in the figure, the equilibrium equations for each component are listed as Equations (19)–(22). Based on the equilibrium relationships, the tangential stress σ′ along the slope of the transition segment was calculated.
P 1 = P 2 = P 3
σ B = P 2 L B = 2 P 2 L B 1 + L B 2 = P 1 π R B 1 + R B 2
σ C = P 3 L C = P 1 0.4 π ( R A 1 + R A 2 + R B 1 + R B 2 )
σ = σ B σ C sin θ
where P1 is the external vertical pressure on the transition segment. P2 is the reactive force on the transition segment. LA1 is the outer circumference of the top cross-section of the transition segment. LA2 is the inner circumference of the top cross-section. LA is the circumference of the centerline at the top of the transition segment. LB1 is the outer circumference of the bottom cross-section. LB2 is the inner circumference of the bottom cross-section. LB is the circumference of the centerline at the bottom of the transition segment. σA is the centerline stress at the top. σB is the centerline stress at the bottom. σ’ is the tangential stress along the slope of the transition segment. Ɵ is the slope angle of the transition segment.
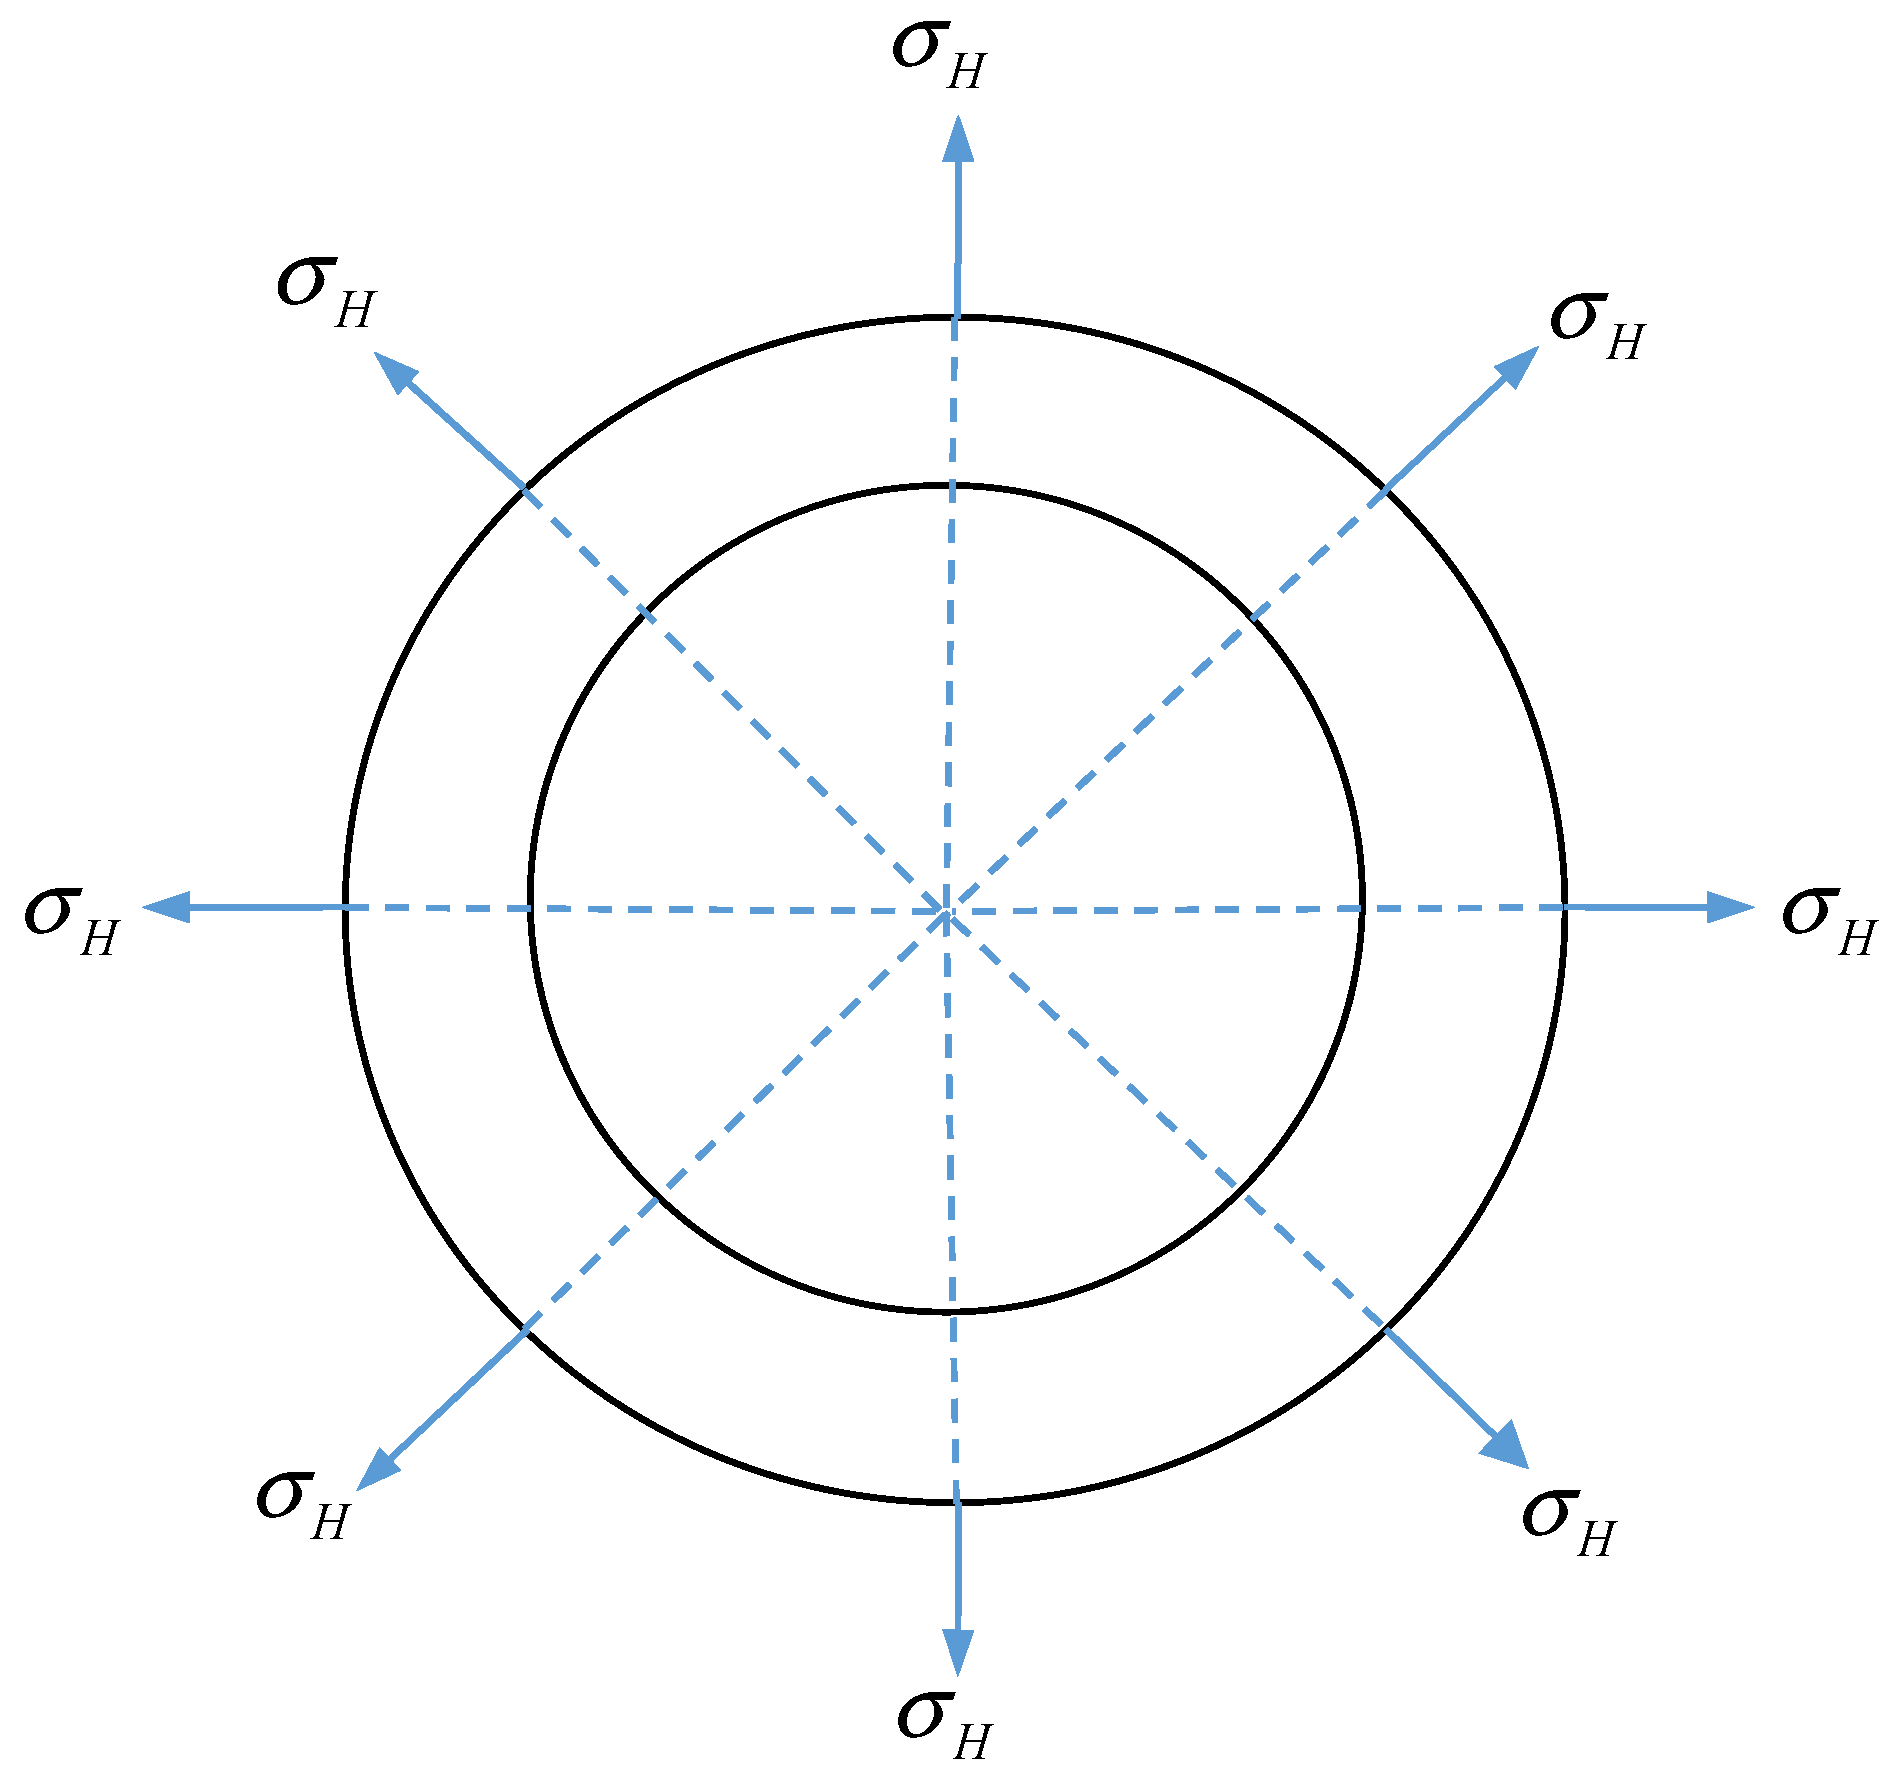
After calculating the tangential stress σ’ along the slope of the transition segment, the force distribution at the bottom cross-section of the transition segment was analyzed. The cross-section analysis diagram is shown in Figure 29. The height of the transition segment was defined as H, and the calculation height was 0.6H. The length of the slant was calculated as L = 0.6H/sinƟ. With the slant length L determined, the bottom cross-section of the transition segment, subjected to the centerline stress σB, caused circumferential tensile stress σx in the transition segment, as shown in the cross-section in Figure 25. In the cross-section shown in Figure 26, it caused tensile stress σH at the bottom of the transition segment. The equilibrium relationships for the section and the force distribution on the surface of the transition segment are given by equilibrium Equations (23) and (24).
σ x = σ cos θ
σ H = σ x L = P 1 L 0.4 R A 1 + 0.4 R A 2 0.6 R B 1 + R B 2 0.4 π tan θ ( R A 1 + R A 2 + R B 1 + R B 2 ) R B 1 + R B 2
where σx is the tensile stress at the bottom cross-section of the transition segment. σH is the tensile stress on the surface of the transition segment. Since the bottom cross-section is symmetric, the analysis was performed on half of the cross-section. The half cross-section of the bottom of the transition segment is shown in Figure 30.
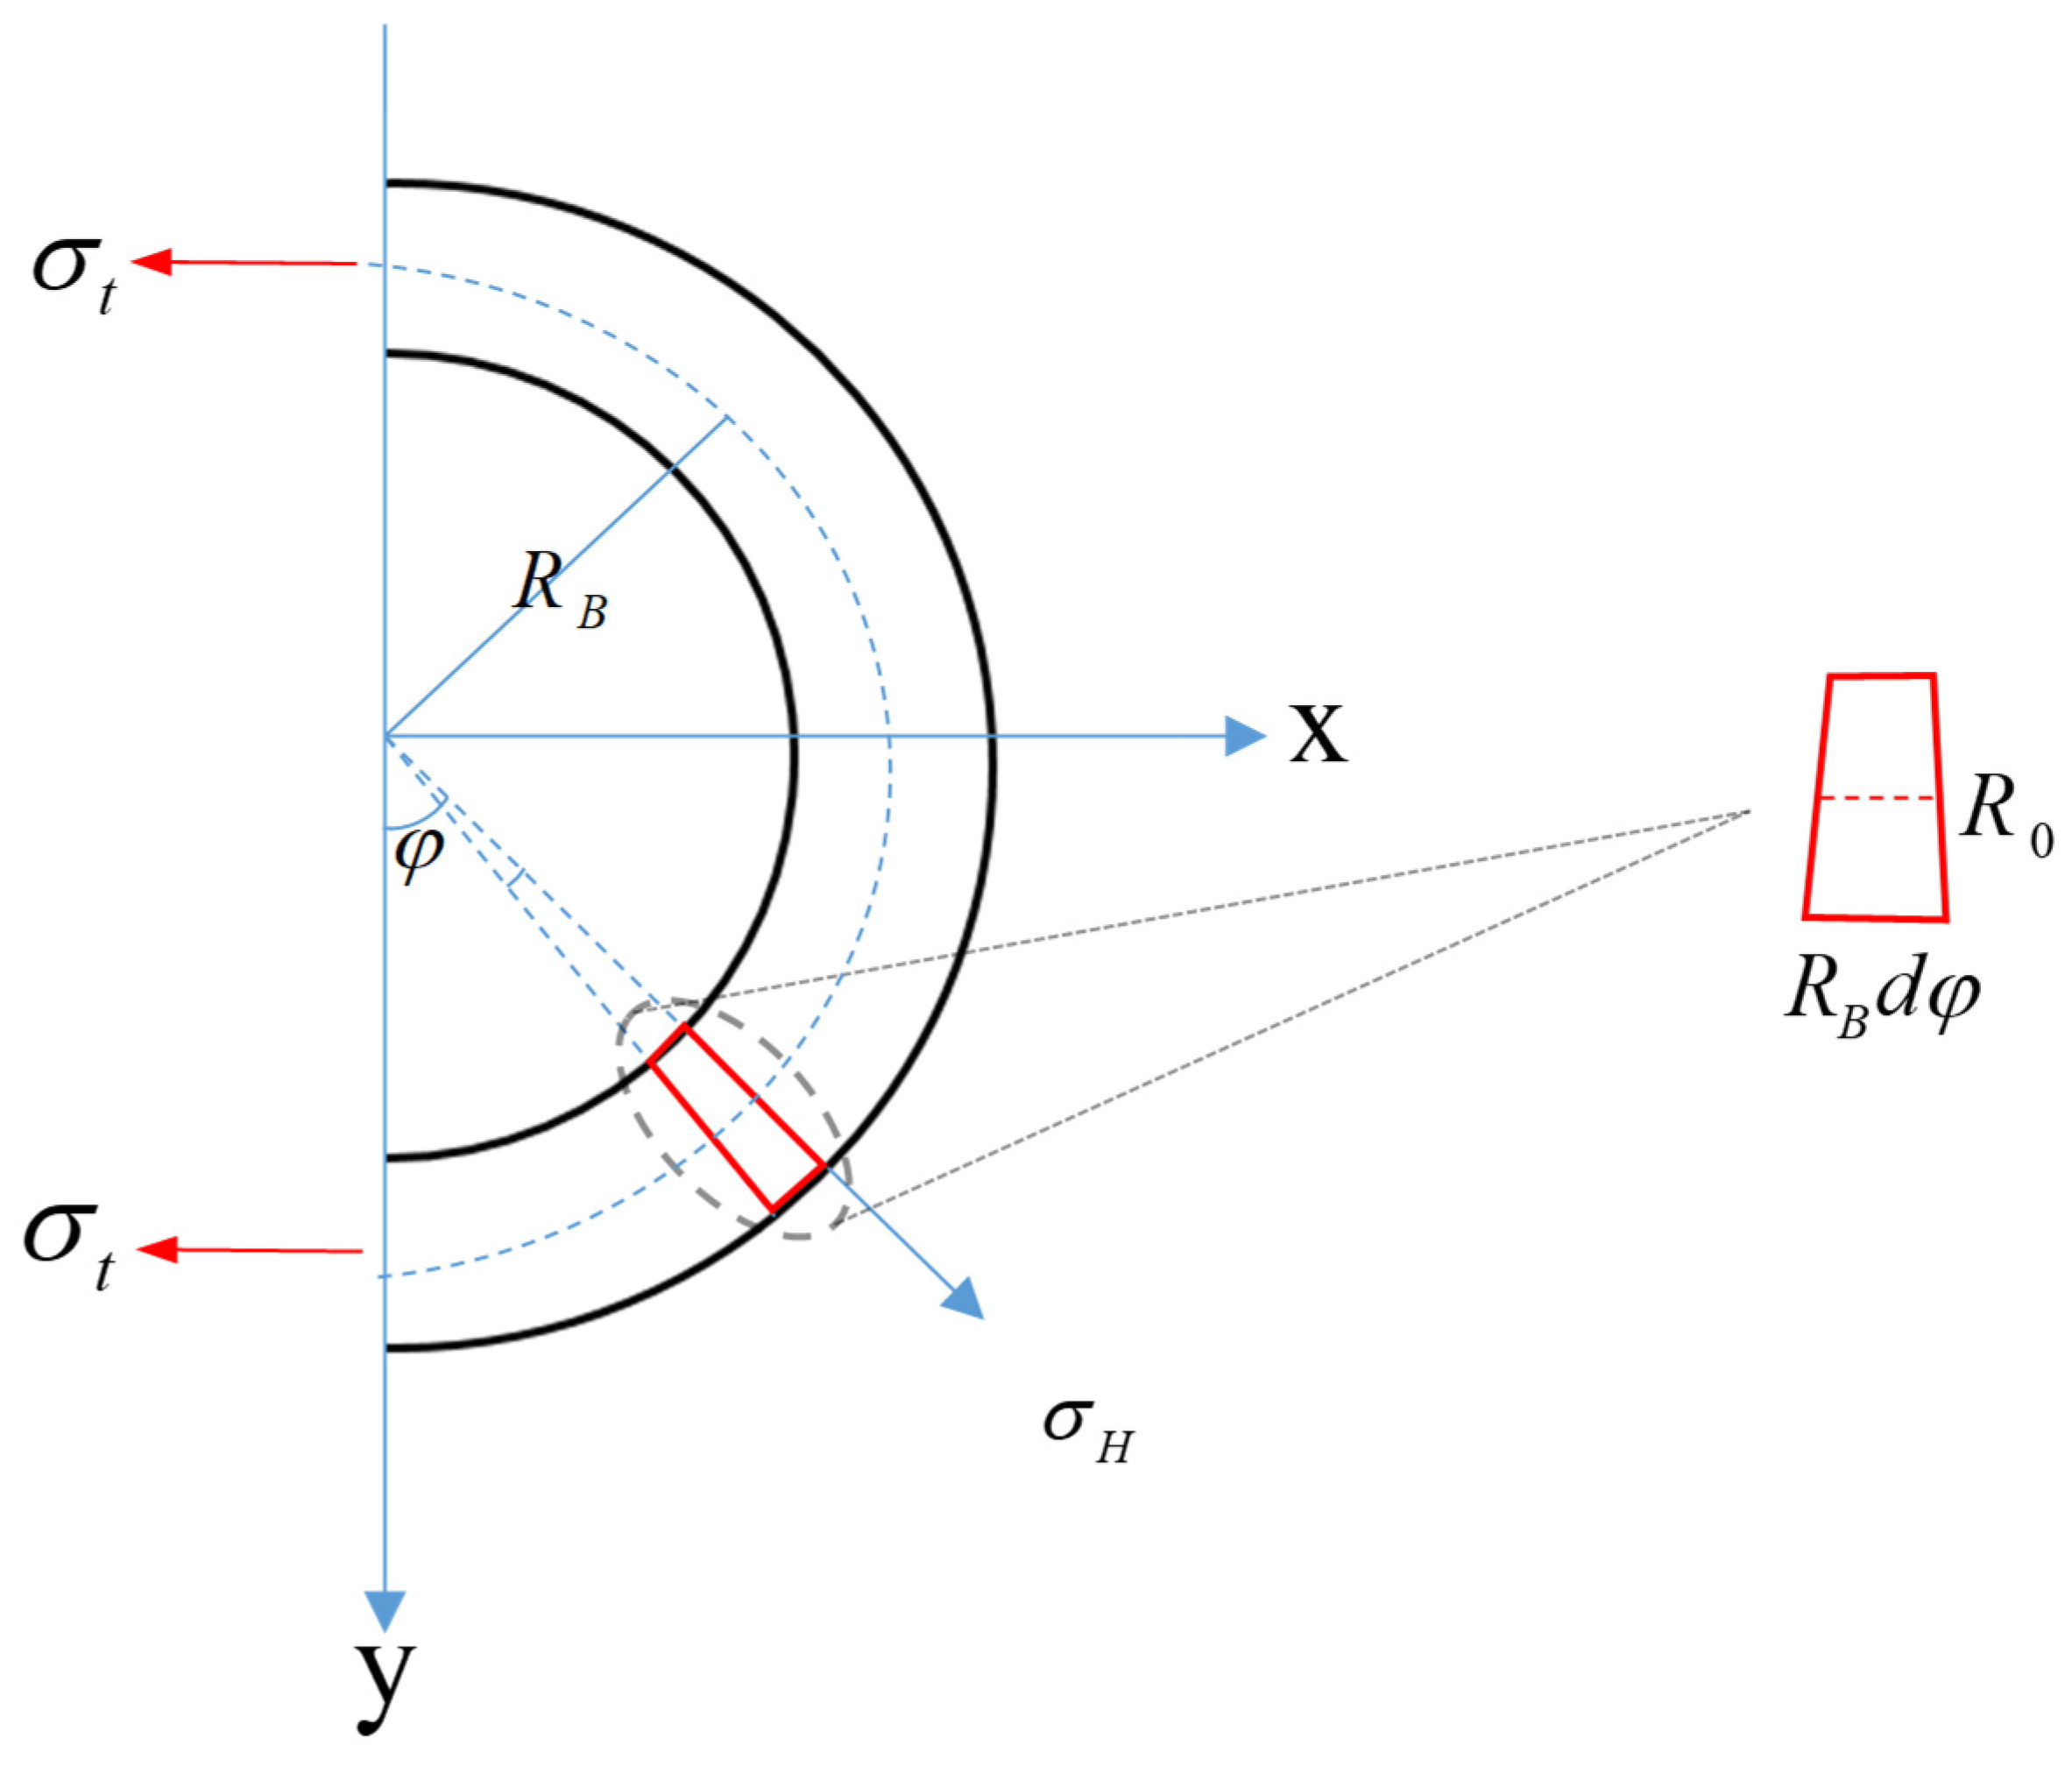
In this half cross-section diagram, a force analysis of the half-section area gave the equilibrium equation used to calculate the circumferential tensile stress. As shown, an infinitesimal element was taken for analysis. The width was the radius R0of the bottom cross-section, and since the top and bottom lengths in the infinitesimal element were not the same, both were approximated by the length of the centerline of the bottom cross-section RBdφ. The equation is shown in Equations (25)–(27), from which the circumferential tensile stress σT was back-calculated. Then, the axial tensile stress at the centerline of the bottom cross-section was converted to the equivalent tensile stress on the surface of the transition segment, which was calculated as σt. The formula is shown in Equation (28).
R 0 = R B 1 R B 2
R B = 1 2 R B 1 + R B 2
2 σ t R 0 1 2 L B = 0 π σ H R 0 R B d φ
σ T = π R B σ H L B = 3 H R B P 1 0.4 R A 1 + 0.4 R A 2 0.6 R B 1 + R B 2 2 π sin θ tan θ ( R A 1 + R A 2 + R B 1 + R B 2 ) R B 1 + R B 2 2
σ t = σ T L B = 3 H R B P 1 0.4 R A 1 + 0.4 R A 2 0.6 R B 1 + R B 2 2 π 2 sin θ tan θ ( R A 1 + R A 2 + R B 1 + R B 2 ) R B 1 + R B 2 3
where R0 is the annular width of the bottom cross-section of the transition segment. RB is the radius of the centerline of the bottom cross-section of the transition segment. RB1 is the outer radius of the bottom cross-section. RB2 is the inner radius of the bottom cross-section.
Equation (29) was the calculation formula for the circumferential tensile stress at the bottom of the transition segment. From this formula, it could be seen that the circumferential tensile stress at the bottom of the transition segment was only related to the vertical external force P1 applied to the transition segment, the slant length of the transition segment, and the shape of the transition segment cross-section. Therefore, to calculate the external UHPC reinforcement for a damaged transition segment, the calculation formula only required the substitution of the section dimensions. The calculation formula for the circumferential tensile stress of the UHPC-reinforced transition segment is shown in Equation (30).
σ t = 3 H R B P 1 0.4 R A 3 + 0.4 R A 2 0.6 R B 1 + R B 2 2 π 2 sin θ tan θ ( R A 3 + R A 2 + R B 1 + R B 2 ) R B 1 + R B 2 3
where H is the height of the reinforced transition segment. Ɵ is the slope angle of the reinforced transition segment. RA3 is the outer radius of the top cross-section of the reinforced transition segment. RB3 is the outer radius of the bottom cross-section of the reinforced transition segment.

5.4. Validation of the Calculation Results

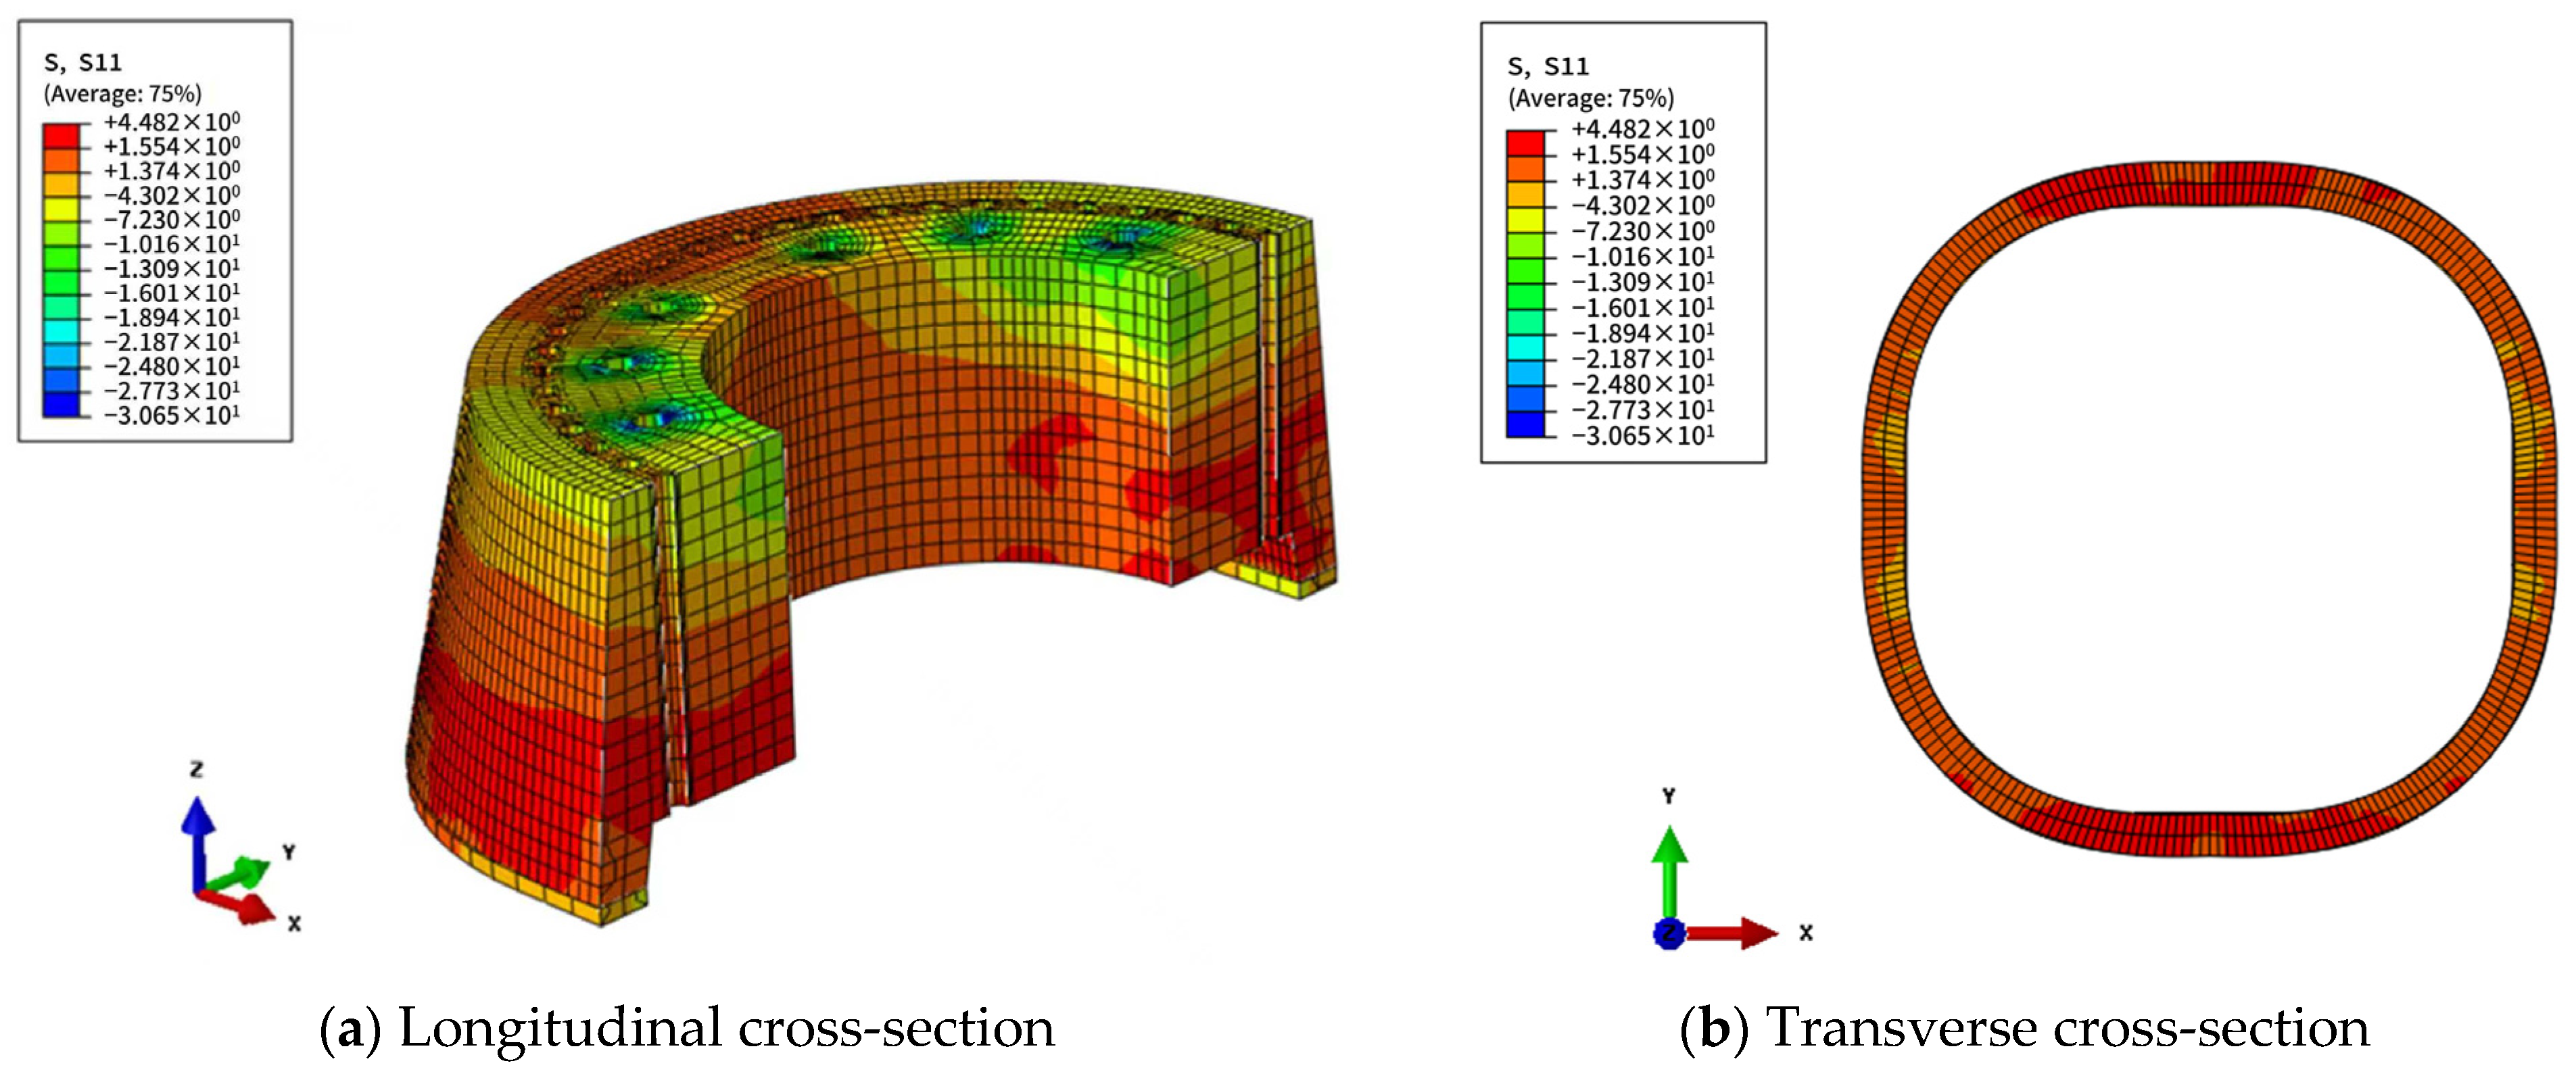
This section compares the results of the formula calculations with the results from the finite element model to verify the accuracy of the calculation formulas. Figure 31 showed the stress contour plot of the transition segment after the top pressure was applied. The stress direction in the figure was circumferential, and the comparison between the calculated tensile stress formula on the surface of the transition segment and the results from numerical simulation is shown in Table 9.
As shown in Table 5, the tensile stress results in the numerical model were obtained by taking the average value over the bottom half-section area of the transition segment. The calculated circumferential tensile stress of the transition segment was 2.14 MPa. Compared with the local tensile stress in the numerical model, the error of the calculated circumferential tensile stress was 5%. Using the circumferential tensile stress calculation formula for the UHPC-strengthened transition segment, the local tensile stress at the bottom surface was calculated to be 1.87 MPa. The local circumferential tensile stress of the damaged transition segment reinforced with UHPC materials was reduced by 12.5%, which verified the effectiveness of using external UHPC reinforcement for the damaged transition segment.

6. Conclusions

This study employed a 1:3 scaled model to conduct static and fatigue tests to address damage-induced cracking in the transition segment and the issue of insufficient grouting at the base. The crack development patterns and stiffness degradation mechanisms were investigated, and numerical simulations were performed under overload conditions. In addition, UHPC was used to strengthen the damaged transition segment to clarify the strengthening mechanism and establish a load-bearing capacity calculation formula. The main conclusions are as follows:
(1)
In the 0.8 P static cycle, no crack propagation was observed in the transition segment during the 0.8 P static cyclic loading test, demonstrating satisfactory static performance. After 1.0 P loading, only a few internal cracks appeared, with no cracks on the external surface. During the fatigue loading stage, cracks further propagated, and the maximum crack width increased to 0.09 mm.
(2)
Compared to the unreinforced group, the relative displacement after UHPC reinforcement decreased by 0.06 mm (46.2%), and after UHPC reinforcement with void repair, the relative displacement decreased by 0.13 mm (96%). UHPC reinforcement can suppress the relative displacement between the transition segment and the bottom ring, but bottom compaction is more effective in reducing the relative displacement between the transition segment and the bottom ring.
(3)
Finite element analyses were conducted for the structure under 1.0 P and 1.3 P load levels. The numerical results show that the predicted load–deflection curves and damage patterns are in good agreement with the experimental observations. At the same displacement level, the difference between the calculated and measured loads is only 2.5%. Under the 1.3 P overload condition, the simulation indicates that although localized stresses slightly exceed the allowable limits, the majority of stresses remain below tensile and compressive strengths.
(4)
After externally reinforcing the damaged transition segment with UHPC, the DIC key data results for the transition segment under various conditions show that, compared to the unreinforced segment, the average strain at key points decreased by 76.2% after UHPC reinforcement, and by 86.5% after UHPC reinforcement with void repair. This indicates that cracks were effectively suppressed after UHPC reinforcement. Strain reduction at key points after void repair increased by 15.9% compared to UHPC reinforcement alone, demonstrating that adding void repair further improves the crack suppression effect.
(5)
The load transfer mechanism of the transition segment was analyzed, and a calculation method for the circumferential tensile stress of the transition segment with external UHPC strengthening was proposed. The calculated results showed that external UHPC strengthening of the damaged transition segment reduced the local circumferential tensile stress by 12.5%. The formula results were compared with the numerical model, and the results showed that the error of the proposed formula was 5%, which indicated that the formula could reasonably predict the circumferential tensile stress.
(6)
Future research can further focus on the influence of mechanisms and optimization design of different UHPC-strengthening parameters. Key aspects include the effects of parameters such as UHPC strengthening layer thickness, compressive strength of UHPC, reinforcement ratio, and strengthening extent on the static and fatigue performance of structures, thereby providing a theoretical basis for engineering applications.

Author Contributions

Conceptualization, X.W.; Methodology, Z.L.; Software, R.L.; Validation, R.L.; Formal analysis, R.L. and Z.Z.; Investigation, Z.L., W.L. and X.Z.; Resources, R.Z.; Data curation, Z.L., W.L. and Z.Z.; Writing—original draft, X.W. and Z.Z.; Visualization, X.W.; Supervision, R.Z., W.L. and X.Z.; Project administration, R.Z.; Funding acquisition, X.W. All authors have read and agreed to the published version of the manuscript.

Funding

This research was funded by the Chongqing Municipal Construction Science and Technology Plan Project, grant number KZ 2024-8-17, the Research Project of Chongqing Design Group, grant number 2023-C5, and the Research and Innovation Program for Graduate Students in Chongqing Jiaotong University, grant number 2025B0013.

Data Availability Statement

The original contributions presented in this study are included in the article. Further inquiries can be directed to the corresponding author.

Conflicts of Interest

Authors Xifeng Wang, Ruifeng Liu, Wei Liu and Xuan Zhou were employed by the company Chongqing Construction Science Research Institute Co., Ltd. Author Ruxuan Zou was employed by the company Municipal Design Research Institute, Chongqing Design Group Co., Ltd. The remaining authors declare that the research was conducted in the absence of any commercial or financial relationships that could be construed as a potential conflict of interest.

References

  1. Wang, D.; Zhang, F.; Xu, J.; He, G.; Wu, Q.; Wang, M. Nonlinear fatigue analysis of onshore wind turbines with steel–concrete hybrid tower using a co-simulation method and enhanced kernel density estimation. Mech. Syst. Signal Process. 2025, 239, 113243. [Google Scholar] [CrossRef]
  2. Wang, D.; Xu, J.; He, Z.; Yu, Q.; Tang, W.; He, G.; Wu, Q. High-fidelity integrated co-simulation model for dynamic analysis of onshore wind turbines with steel–concrete hybrid tower. Mech. Syst. Signal Process. 2025, 230, 112583. [Google Scholar] [CrossRef]
  3. Liew, J.Y.R.; Chua, Y.S.; Dai, Z. Steel concrete composite systems for modular construction of high-rise buildings. Structures 2019, 21, 135–149. [Google Scholar] [CrossRef]
  4. Qiao, W.T.; Li, W.; Yan, B.; Zhang, S.; Zhang, J. Experimental study on compression performance of I-shaped column of modular wall light steel concrete composite frame structure. J. Build. Eng. 2025, 104, 112310. [Google Scholar] [CrossRef]
  5. Du, Y.; Yu, Z.; Chen, Y.; Ma, N.; Wang, R. Experimental study on the force mechanism of internal composite connectors in steel–concrete composite sections of bridge towers. Buildings 2025, 15, 2284. [Google Scholar] [CrossRef]
  6. Xu, J.; He, Z.; Wang, D.; He, G.; Wu, Q.; Zhang, Z. Nonlinear dynamic response analyses of Onshore Wind Turbines with Steel–Concrete Hybrid Tower using a co-simulation approach. Renew. Energy 2025, 243, 122475. [Google Scholar] [CrossRef]
  7. Liu, J.; Liu, Y.; Zhang, Z. Numerical simulation on thermomechanical coupling behavior of early-age concrete in the large-scale steel–concrete connecting segment of a hybrid-girder cable-stayed bridge. J. Bridge Eng. 2020, 25, 05020009. [Google Scholar] [CrossRef]
  8. Jin, K.Y.; Zhou, X.H.; Ren, W.; Wang, Y.-H.; Luo, W. Research on hexagonal concrete-filled steel tubular transition pieces for wind turbine hybrid towers under axial compression. Thin-Walled Struct. 2024, 200, 111956. [Google Scholar] [CrossRef]
  9. Dong, Y.; He, M.; Zeng, K.; Fu, H.; Tu, Z.; Peng, W.; Wang, Z. Structural Analysis Methods and Key Influencing Factors on the Performance of Segmented Steel–Concrete Hybrid Wind Turbine Towers. Buildings 2025, 15, 3786. [Google Scholar] [CrossRef]
  10. Qiu, M.; Sun, Y.; Qian, Y. Impact of groove-and-tongue parameters on the bonding behavior between 3d-printed UHP-SHCC and cast normal concrete. J. Sustain. Cem.-Based Mater. 2025, 14, 496–505. [Google Scholar] [CrossRef]
  11. Zhang, B.; Yu, J.; Chen, W.; Chen, J.; Li, H.; Niu, J. Interface shear failure behavior between normal concrete (NC) and ultra-high performance concrete (UHPC). Int. J. Concr. Struct. Mater. 2024, 18, 18. [Google Scholar] [CrossRef]
  12. Cosgun, C. Machine learning for the prediction of evaluation of existing reinforced concrete structures performance against earthquakes. Structures 2023, 50, 1994–2003. [Google Scholar] [CrossRef]
  13. Lazaridis, P.C.; Kavvadias, I.E.; Demertzis, K.; Iliadis, L.; Vasiliadis, L.K. Structural damage prediction of a reinforced concrete frame under single and multiple seismic events using machine learning algorithms. Appl. Sci. 2022, 12, 3845. [Google Scholar] [CrossRef]
  14. Gonzalez-Libreros, J.H.; Sneed, L.H.; D’Antino, T.; Pellegrino, C. Behavior of RC beams strengthened in shear with FRP and FRCM composites. Eng. Struct. 2017, 150, 830–842. [Google Scholar] [CrossRef]
  15. Zhu, J.; Wen, Z.; Li, Y.; Hou, X.; Lu, Y. Experimental and Numerical Study on Reinforced Concrete Columns Strengthened with Lightweight Alkali-Activated Slag Concrete and X-Type Encased Steel. Buildings 2025, 15, 1692. [Google Scholar] [CrossRef]
  16. Aslam, M.; Shafigh, P.; Jumaat, M.Z.; Shah, S.N.R. Strengthening of RC beams using prestressed fiber reinforced polymers—A review. Constr. Build. Mater. 2015, 82, 235–256. [Google Scholar] [CrossRef]
  17. Tanarslan, H.M. The effects of NSM CFRP reinforcements for improving the shear capacity of RC beams. Constr. Build. Mater. 2011, 25, 2663–2673. [Google Scholar] [CrossRef]
  18. Faria, D.M.V.; Einpaul, J.; Ramos, A.M.P.; Ruiz, M.F.; Muttoni, A. On the efficiency of flat slabs strengthening against punching using externally bonded fibre reinforced polymers. Constr. Build. Mater. 2014, 73, 366–377. [Google Scholar] [CrossRef]
  19. Yoo, D.Y.; Chun, B.; Choi, J.; Min, K.-H.; Shin, H.-O. Enhancing the flexural capacity of RC beams under various loading rates through strengthening with ultra-high-performance fiber-reinforced concrete. Dev. Built Environ. 2024, 20, 100581. [Google Scholar] [CrossRef]
  20. Liu, Y.; Hao, Y.; Hao, H.; Zhou, Y. Fragility assessment of FRP-strengthened RC beams with chloride-induced corrosion damage under impact loads. Reliab. Eng. Syst. Saf. 2025, 266, 111728. [Google Scholar] [CrossRef]
  21. Birchall, J.D.; Howard, A.J.; Kendall, K. Flexural strength and porosity of cements. Nature 1981, 289, 388–390. [Google Scholar] [CrossRef]
  22. Yu, X.; Yang, J.; Zhang, Z.; Leng, J.; Chen, R.; Zhou, J.; Zou, Y. Shear performance and degradation mechanism of UHPC-NC interface under composite salts freeze-thaw cycles. Case Stud. Constr. Mater. 2025, 22, e04408. [Google Scholar] [CrossRef]
  23. Amran, M.; Huang, S.S.; Onaizi, A.M.; Makul, N.; Abdelgader, H.S.; Ozbakkaloglu, T. Recent trends in ultra-high performance concrete (UHPC): Current status, challenges, and future prospects. Constr. Build. Mater. 2022, 352, 129029. [Google Scholar] [CrossRef]
  24. Yang, J.; Chen, R.; Zhang, Z.; Zou, Y.; Zhou, J.; Xia, J. Experimental study on the ultimate bearing capacity of damaged RC arches strengthened with ultra-high performance concrete. Eng. Struct. 2023, 279, 115611. [Google Scholar] [CrossRef]
  25. Zou, Y.; Zheng, K.; Zhou, Z.; Zhang, Z.; Guo, J.; Jiang, J. Experimental study on flexural behavior of hollow steel-UHPC composite bridge deck. Eng. Struct. 2023, 274, 115087. [Google Scholar] [CrossRef]
  26. Lin, L.; Zhang, X.; Zhang, D.; Wu, X.; Liu, Y.; Wang, X.; Wang, H.; Wang, F.; Yang, T. Damage evolution and failure analysis of the advanced transition segment behavior of wind turbine tower. Eng. Fail. Anal. 2023, 152, 107527. [Google Scholar] [CrossRef]
  27. Ji, H.; Liu, C. Ultimate shear resistance of ultra-high performance fiber reinforced concrete-normal strength concrete beam. Eng. Struct. 2020, 203, 109825. [Google Scholar] [CrossRef]
  28. Nugroho, L.; Haryanto, Y.; Hsiao, F.P.; Hu, H.-T.; Weng, P.-W.; Lin, C.-C.; Kristiawan, S.A.; Sangadji, S. Effectiveness of UHPC reinforced with steel rebars for flexural strengthening of RC T-beams in an idealized negative moment region. Structures 2025, 80, 109728. [Google Scholar] [CrossRef]
  29. Lu, Y.; Li, G.; Di, J. Experimental scheme for a model test on the connection segment of steel–concrete composite beams. J. Highw. Transp. Res. Dev. (Appl. Technol. Ed.) 2012, 8, 196–203. [Google Scholar]
  30. GB/T 50081-2002; Standard for Test Method of Mechanical Properties on Ordinary Concrete. China Architecture & Building Press: Beijing, China, 2002.
  31. T/CECS 864-2021; Standard Test Method for Ultra-High Performance Concrete. China Planning Press: Beijing, China, 2021.
  32. GB/T 228.1-2010; Metallic Materials—Tensile Testing—Part 1: Method of Test at Room Temperature. China Standards Press: Beijing, China, 2010.
  33. GL-2010; Rules for Classification and Construction—Ship Technology—Hull Structures. Germanischer Lloyd SE: Hamburg, Germany, 2010.
  34. Niu, Y.; Fan, J.; Shi, X.; Wei, J.; Jiao, C.; Hu, J. Application of the J-Integral and Digital Image Correlation (DIC) to Determination of Multiple Crack Propagation Law of UHPC under Flexural Cyclic Loading. Materials 2022, 16, 296. [Google Scholar] [CrossRef]
  35. Xu, J.; Wang, T.; Du, D.; Su, C.; Shi, X. Damage model of NC-UHPC interface zone in UHPC wet joint based on DIC. J. Build. Eng. 2024, 98, 111045. [Google Scholar] [CrossRef]
  36. Cao, J.; Shao, X. Finite element analysis of headed studs embedded in thin UHPC. J. Constr. Steel Res. 2019, 161, 355–368. [Google Scholar] [CrossRef]
  37. GB 50010-2010; Code for Design of Concrete Structures. China Architecture & Building Press: Beijing, China, 2010.
  38. Li, B.; Jiang, J.; Xiong, H.; Zhan, Y.; Wu, Z.; Cunningham, L.S. Improved concrete plastic-damage model for FRP-confined concrete based on true tri-axial experiment. Compos. Struct. 2021, 269, 114051. [Google Scholar] [CrossRef]
  39. Abed, F.; Oucif, C.; Awera, Y.; Mhanna, H.H.; Alkhraisha, H. FE modeling of concrete beams and columns reinforced with FRP composites. Def. Technol. 2021, 17, 1–14. [Google Scholar] [CrossRef]
  40. Xia, J.; Zhou, J.; Yang, J.; Zhang, Z.; Zou, Y. Damage evolution and residual shear resistance of toughness-improved UHPC-NSC interface under high-stress level of fatigue shear loading. Constr. Build. Mater. 2024, 430, 136403. [Google Scholar] [CrossRef]
Figure 1. Details of specimens (unit: mm).
Buildings 16 02031 g001
Figure 2. Fabrication process of the concrete transition segment.
Buildings 16 02031 g002
Figure 3. Procedure of UHPC strengthening.
Buildings 16 02031 g003
Figure 4. Void area.
Buildings 16 02031 g004
Figure 5. Loading procedure.
Buildings 16 02031 g005
Figure 6. Layout of strain gauges and displacement transducers.
Buildings 16 02031 g006
Figure 7. Schematic of the DIC test.
Buildings 16 02031 g007
Figure 8. Crack pattern of the concrete transition segment after completion of bolt tensioning.
Buildings 16 02031 g008
Figure 9. Cracks in the concrete transition segment.
Buildings 16 02031 g009
Figure 10. Load–displacement response of the concrete transition segment–steel structure.
Buildings 16 02031 g010
Figure 11. Load–displacement response between the concrete transition segment and the bottom concrete ring.
Buildings 16 02031 g011
Figure 12. Strain field of the void-side surface of the concrete transition segment.
Buildings 16 02031 g012
Figure 13. Strain field under 0.3 P static cyclic loading.
Buildings 16 02031 g013
Figure 14. Strain field under 0.5 P static cyclic loading.
Buildings 16 02031 g014
Figure 15. Strain field under 0.8 P static cyclic loading.
Buildings 16 02031 g015aBuildings 16 02031 g015b
Figure 16. DIC strain field under static loading after void repair.
Buildings 16 02031 g016
Figure 17. Model components.
Buildings 16 02031 g017
Figure 18. Boundary conditions.
Buildings 16 02031 g018
Figure 19. Concrete constitutive model.
Buildings 16 02031 g019
Figure 20. Comparison of load–displacement response.
Buildings 16 02031 g020
Figure 21. Concrete tensile damage.
Buildings 16 02031 g021
Figure 22. Concrete tensile damage (1.3 P).
Buildings 16 02031 g022
Figure 23. Load transfer path in the transition segment.
Buildings 16 02031 g023
Figure 24. Load transfer path of the UHPC-strengthened transition segment.
Buildings 16 02031 g024
Figure 25. Simplified analytical model of the transition segment.
Buildings 16 02031 g025
Figure 26. Cross section of the transition segment.
Buildings 16 02031 g026
Figure 27. Compressive stress in the transition segment.
Buildings 16 02031 g027
Figure 28. Calculated cross-section of the transition segment A–A.
Buildings 16 02031 g028
Figure 29. Calculated transverse cross-section of the transition segment.
Buildings 16 02031 g029
Figure 30. Calculated half-structure cross-section of the transition segment.
Buildings 16 02031 g030
Figure 31. Tensile stress contour of the transition segment.
Buildings 16 02031 g031
Table 1. Test specimens.
Research PhaseCondition of the SpecimenBottom Void TreatmentResearch Content
Static propertiesIntact, unreinforcedNStatic cycle + Static loading
Fatigue propertiesDamaged, unreinforcedN6 × 105 cycles
Damaged, unreinforcedY4.5 × 105 cycles
Damaged, reinforced with UHPCYStatic cycle
Damaged, reinforced with UHPC, void was repairedVoid was repaired1.5 × 105 cycles
FEA--Mechanism Analysis
Table 2. Mix proportions of UHPC.
ComponentUHPC Dry PremixAdmixtureSteel FiberWater Reducing Agent
Cementitious material content (kg/m3)211413185188
The volume content//2%/
Table 3. Material properties.
Materialsfc (MPa)fct (MPa)ft (MPa)Ec (MPa)
UHPC116.820.212.742,100
C7072.3/3.3637,100
Note: fc denotes the compressive strength; fct denotes the flexural strength; ft denotes the tensile strength; Ec denotes the modulus of elasticity.
Table 4. Material properties of steel.
Materialsfy (MPa)fu (MPa)Es (GPa)
Q345359.5494.0210.0
HRB400439.3577.1210.0
Note: fy denotes the yield strength; fu denotes the ultimate tensile strength; Es denotes the modulus of elasticity.
Table 5. Fatigue test loading procedure.
Loading PhaseLoad AmplitudeLoad RangeNumber of Cycles
Fatigue validation1.0−103 kN~103 kN60
Fatigue overload1.5−154.5 kN~154.5 kN85
Fatigue overload2.0−206 kN~206 kN95
Fatigue overload3.0−309 kN~309 kN105
Table 6. The average strains.
Performance MetricsUn-Strengthened (Void)UHPC Strengthened (Void)UHPC Strengthened (Void Repaired)
Average strain3127442
Average strain reduction rate-down 76%down 86.5%
Table 7. Plasticity parameters of concrete.
Dilation Angle ψEccentricity λYield Stress Ratio σb0/σc0Constant Stress Ratio KcViscosity Coefficient
30°0.11.160.66670.0005
Table 8. Code-specified parameter value [40].
Interfacial RoughnessRtk1k2u
fck ≥ 20fck ≥ 35
High roughness≥3 mm0.50.90.81.0
Relatively rough≥1.5 mm0.50.90.7
Smooth≤1.5 mm0.51.10.6
Very smoothunable to measure01.50.5
Note: The value Rt represents the average interface roughness height measured by the sand replacement method.
Table 9. Comparison of calculated tensile stress results on the transition segment surface.
Calculated ResultsTensile Stress (MPa)Difference (%)
Numerical model2.25/
Circumferential tensile Stress2.145
UHPC-reinforced transition segment circumferential Tensile Stress1.87/
Disclaimer/Publisher’s Note: The statements, opinions and data contained in all publications are solely those of the individual author(s) and contributor(s) and not of MDPI and/or the editor(s). MDPI and/or the editor(s) disclaim responsibility for any injury to people or property resulting from any ideas, methods, instructions or products referred to in the content.